
Submitted:
29 October 2025
Posted:
30 October 2025
You are already at the latest version
Abstract
Background
The relative merits of the Henderson–Hasselbalch (HH) versus Stewart frameworks for interpreting dialysis-associated acid–base shifts remain debated. Dialysis alters systemic pH through exogenous bicarbonate delivery, chloride displacement, and removal of organic anions. We compared these approaches across hemodialysis (HD) and peritoneal dialysis (PD).
Methods
We studied 53 HD patients with paired pre/post HD blood gas and chemistry (106 observations) and 41 PD patients cross-sectionally, totaling 147 datasets. Derived variables followed the Figge/Stewart implementation [apparent SID (SIDa), effective SID (SIDe), strong ion gap (SIG), albumin-corrected anion gap (AGc)]. For HD, changes in pH (ΔpH) were modeled using HH predictors (ΔHCO₃⁻, ΔPCO₂) and Stewart predictors (ΔSIDa, ΔATOT, ΔPCO₂). For cross-sectional data (HD-pre, HD-post, and PD), HH- and Stewart-based level-models were fitted. Stewart-predicted pH was also computed using the Figge and the simplified Constable electroneutrality equation.
Results
HD increased pH by 0.11, driven by ΔHCO₃⁻ = +5.7 mΕq/L, ΔCl⁻ = −2.3 mEq/L, and declines in unmeasured anions (ΔSIG = −3.9; ΔAGc = −3.3). SIDa increased only marginally (+1.3 mEq/L), whereas SIDe rose by +5.3 mEq/L and fully tracked the alkalinization. In Δ-models, HH explained 90% of variance in ΔpH (R² = 0.903) compared with 51% for Stewart (R² = 0.514). In level-models, HH explained 96% of pH variance versus 36% for Stewart. Bland–Altman analysis showed systematic overestimation of pH by the Figge and Constable approach (bias +0.111), most pronounced pre-HD. PD patients had consistently higher AGc and SIG values than HD patients, indicating a greater burden of unmeasured anions.
Conclusions
Alkalinization during HD is primarily attributable to bicarbonate gain, chloride displacement, and organic-anion clearance. The HH framework provides superior predictive performance for ΔpH, while closed-system Stewart formulations based on SIDa underestimate alkalinization. However, a broader physicochemical interpretation using SIDe and SIG, which incorporate bicarbonate and unmeasured anions, coherently describes the observed physiology. Future applications of the Stewart approach in dialysis should emphasize SIDe and SIG to better reflect the open-system physiology of both HD and PD.
Keywords:
hemodialysis
; peritoneal dialysis
; acid–base
; Henderson–Hasselbalch
; Stewart approach
; strong ion difference
; anion gap
; bicarbonate
; SIG
1. Introduction
Acid–base changes during dialysis can be interpreted through two complementary frameworks. The traditional Henderson–Hasselbalch (HH) model relates pH to the ratio of bicarbonate (HCO₃⁻) and carbon dioxide tension (PCO₂) and has long underpinned clinical reasoning, treatment of acid base disorders, and dialysate prescriptions. In contrast, Stewart’s physicochemical approach [1] treats HCO₃⁻ as a dependent variable and posits three independent determinants of pH: the strong ion difference (SID), PCO₂, and the total concentration of non-volatile weak acids (ATOT). Abnormality of one or more of the independent variables underlies all acid–base disturbances [2]. Adjustment of the independent variables is the essence of all therapeutic interventions, because none of the “dependent variables” [e.g., pH, Base Excess (BE), HCO₃⁻] can be changed primarily or individually. Instead, the dependent variables change, all of them simultaneously if, and only if, one or more of the independent variables change [3]. In this view, pH changes arise from shifts in strong ions and weak acids rather than from “adding bicarbonate” per se.
Several studies have applied the Stewart framework in dialysis and critical illness. Libório et al. showed that in maintenance HD, acidosis was mainly attributable to unmeasured anions, hyperchloremia, and hyperphosphatemia, with chloride and unidentified anions accounting for nearly 90% of the metabolic component [4]. Prior comparative work has reported ~28% disagreement between Stewart-based and traditional classifications when the anion gap is left uncorrected for albumin. Lee et al. observed that in HD patients with metabolic acidosis, the strong ion gap (SIG) was consistently elevated and better captured unmeasured anions than conventional AG [5] . However, correcting the anion gap for albumin (AGc) materially improves its performance, and some studies show comparable discrimination between AGc and SIG. Moreover, there is no consistent evidence that Stewart-derived indices outperform traditional metrics in predicting clinical outcomes (e.g., mortality) [6].
In critically ill dialysis patients, chloride balance was highlighted as a key determinant of acidosis correction, with the relationship between plasma and dialysate chloride influencing the degree of improvement [7]. Constable and Kurtz et al. emphasized that while the Stewart approach is chemically rigorous, it does not surpass the Henderson–Hasselbalch framework in predictive accuracy—particularly in open systems like hemodialysis, where bicarbonate flux is the dominant driver [8,9].
Stewart theory predicts that the alkalinizing effect is mediated primarily by the sodium cation, which raises SID, while the administered HCO₃⁻ equilibrates with CO₂ and water, with excess CO₂ subsequently eliminated. Thus, the rise in pH reflects a change in strong-ion composition, not an independent action of bicarbonate. This distinction is directly relevant to dialysis, where patients are exposed to large bicarbonate fluxes and dialysate chloride is simultaneously lower; both processes can shift SID and ATOT, while PCO₂ often changes little across a session.
Accordingly, we designed two complementary analyses. First, a paired Δ-analysis in hemodialysis (HD) examined whether ΔpH was explained more accurately by the Henderson–Hasselbalch (HH) framework (ΔHCO₃⁻, ΔPCO₂) or by a Stewart model (ΔSIDa, ΔATOT, ΔPCO₂).
Second, a cross-sectional level-analysis pooled HD-pre, HD-post, and peritoneal dialysis (PD) observations to compare HH-based models against a Stewart model for predicting absolute pH.
In parallel, we decomposed the biochemical drivers of alkalinization, quantifying the specific contributions of chloride shifts (reflected in SIDa), changes in weak acids (ATOT; albumin and phosphate), and the burden of unmeasured anions (AGc/SIG), on the background of relatively stable PCO₂ during dialysis.
2. Results
The study cohort comprised 94 patients, including 54 males (mean age 66.6 ± 12.2 years) and 40 females (mean age 68.6 ± 10.5 years), with an overall mean age of 67.5 ± 11.5 years. ANOVA showed no significant difference in age between males and females (F = 0.704, p = 0.404). Patients on PD (n=41, mean age 67.8 ± 12.5 years) and HD (n=53, mean age 67.2 ± 10.8 years) also had comparable ages, with no significant difference by dialysis modality (F = 0.062, p = 0.804). The distribution of dialysis modality was balanced across gender groups (42.6% of males and 45.0% of females on PD), and Chi-Square analysis confirmed the absence of association between sex and dialysis modality (χ2 = 0.054, p = 0.816). No significant differences were observed between males and females in biochemical or acid–base parameters, indicating that sex did not influence systemic electrolyte balance or acid–base homeostasis in this cohort (supplementary table S1).
2.1. Analysis of the Whole Study Group
Across the three groups (PD, HD-pre, HD-post), acid–base parameters and several electrolytes differed significantly (Table 1). The lowest pH was observed in HD-pre (7.31), accompanied by reduced bicarbonate (~19 mmol/L), whereas HD-post showed clear alkalinization (pH 7.42, HCO₃⁻ ~25 mmol/L; both ANOVA p<0.001). PD patients exhibited intermediate values (pH 7.39, HCO₃⁻ 23 mmol/L). PCO₂ remained unchanged across groups (~40 mmHg, p=0.94).
During HD, SIDa rose slightly (+1.39 mmol/L, p=0.025) and ATOT remained stable (–0.40 mmol/L, p=0.44), changes insufficient to explain the pH shift. As expected, potassium was higher pre-dialysis and decreased significantly after HD (p<0.01). Chloride was lower in PD than in HD-pre and declined modestly post-HD, while phosphate decreased sharply after HD. Albumin increased after HD, consistent with hemoconcentration.
Post hoc (Tukey) testing showed that HD-pre differed significantly from both PD and HD-post for most parameters (pH, HCO₃⁻, SIDe, SIG, AGc). HD-post values converged toward PD for pH and bicarbonate but remained distinct in terms of lower SIG/AGc, indicating a greater burden of unmeasured anions in PD (supplementary Tables S2 and S3).
2.1.1. Regression Analysis of Absolute Measured Ph Values Across Modalities
In the cross-sectional level-analysis (all observations pooled, n = 147), the Stewart model using SIDa, ATOT, and PCO₂ explained only 36% of the variance in measured pH (R2 = 0.362, adjusted R2 = 0.349; SEE = 0.061). In contrast, the Henderson–Hasselbalch framework, incorporating HCO₃⁻ and PCO₂, accounted for 96% of the variance (R2 = 0.961, adjusted R2 = 0.960; SEE = 0.015).
2.1.2. Bland–Altman Analysis of Stewart-predicted pH
We applied the Figge electroneutrality equation [5] to predict pH from SIDa, ATOT and PCO2 in the whole group and the subgroups.
We found that it systematically overestimated the measured pH across all modalities, as is shown with the Bland–Altman analysis below. In the overall cohort (N=147), the mean bias was +0.111 pH units. In PD patients the bias was +0.137, in HD-PRE the bias was +0.141 and in HD-POST the bias was +0.06 (Figure 1).
Thus, the Figge approach consistently predicted higher pH values than measured, with the largest overestimation observed before HD, slightly less in PD, and the lowest in post-dialysis samples. Importantly, in all subgroups the 95% limits of agreement remained entirely positive, indicating a systematic upward bias. By using the simplified Constable equation [6] the systematic bias was even higher (data not shown).
2.1.3. Strong Ion Gap or Corrected Anion Gap?
In the regression analysis we observed a strong linear relationship between AGc and SIG: AGc = 7.94 + 0.97·SIG (R2 = 0.86, p < 0.0001, N = 147) (Figure 2). The slope was close to 1.0, indicating parallel changes of the two variables across the cohort. The intercept was approximately 8 mEq/L.
2.2. Analysis of Changes in the HD Group (Pre/Post)
Beyond cross-sectional comparisons, we analyzed paired pre–post changes within the hemodialysis (HD) cohort to identify which modeling framework best describes ΔpH. Post-HD, pH increased by 0.11, base excess rose by 7.04, and bicarbonate increased by 5.67, consistent with effective alkali delivery (Table 2). In contrast, SIDa changed only marginally (by +1.39) because opposing shifts largely canceled each other out: chloride declined (which tends to raise SIDa) while potassium also declined substantially (which tends to lower SIDa). ATOT remained relatively stable, reflecting a compensatory pattern of increased albumin (hemoconcentration) and decreased phosphate (dialytic clearance). As expected, PCO₂ showed no significant net change during HD, consistent with steady CO₂ content in the dialysate. Ordinary least-squares regression on paired ΔpH (Table 3) favored the Henderson framework (ΔHCO₃ + ΔPCO₂, R2=0.903, adj. R2=0.899), while the Stewart model (ΔSIDa, ΔATOT, ΔPCO₂) explained about half of the variance (R2=0.514, adj. R2=0.485).
Regarding the three linear models for ΔpH, the analysis clearly favors the Henderson model (ΔHCO₃⁻ + ΔPCO₂), which demonstrated the highest R2/adjusted R2, the lowest SEE, and the most favorable AIC/BIC values, indicating superior fit and efficiency. The ΔHCO₃-only model underfits (low R2, higher SEE, worse AIC/BIC), confirming that bicarbonate alone does not capture inter-patient variability in ΔpH. The Stewart-only model performs moderately (R2 =0.485) but is decisively outperformed by Henderson on all criteria.
Coefficient patterns are physiologically coherent. In the Henderson model, ΔHCO₃ is strongly positive and ΔPCO₂ strongly negative—both highly significant—consistent with the Henderson–Hasselbalch framework. In the Stewart model, ΔSIDa is a positive predictor (significant), ΔPCO₂ remains negative (significant), and ΔATOT is non-significant—compatible with the small, opposing albumin/phosphate changes within a single HD session.
In this cohort, mean ΔSIDa was +1.39 mmol/L, whereas ΔHCO₃ averaged +5.67 mmol/L with ΔPCO₂ +0.38 mmHg. Using the fitted coefficients, the Stewart slope for ΔSIDa (0.009 pH units per mmol/L) implies an expected ΔpH of only ~0.012 -far below the observed effect. By contrast, the Henderson model coefficients (0.0233 for ΔHCO₃ and −0.011 for ΔPCO₂) yield a predicted ΔpH ≈ 0.126 for ΔHCO₃ = +5.6 mmol/L and ΔPCO₂ = +0.38 mmHg, closely matching the observed mean ΔpH of +0.116.
3. Discussion
In this cohort of 41 PD patients and 53 HD patients, we analyzed 147 blood gas samples to compare the explanatory performance of the "Boston" and the Stewart frameworks across modalities and within paired HD sessions. Hemodialysis produced a characteristic alkalinization with substantial increase of HCO₃⁻ accompanied by a fall in chloride and a reduction in unmeasured anions, yielding a mean ∆pH of ~0.11.
Importantly, ATOT remained essentially unchanged across dialysis because hemoconcentration-related increases in albumin were offset by dialytic phosphate removal. Consequently, changes in weak-acid charge cannot account for the rise in pH.
The mean SIDa increased modestly by +1.39 mmol/L —far too little to explain the magnitude of the pH or bicarbonate change. Mechanistically, sodium remained relatively stable during HD (+0.43), while the decrease in chloride (ΔCl⁻=-2.34) was partially neutralized in the SIDa equation by a concomitant fall in potassium (-1.53); these opposing charge shifts blunted the net change in SIDa. The fall in chloride and potassium is consistent with the dialysate composition with higher HCO₃⁻ and lower Cl⁻ and K+ than plasma.
Moreover, PCO₂ in blood mirrored the near-constant CO₂ content maintained in the dialysate, so neither ATOT nor PCO₂ shifted in a way that could drive the observed alkalinization within a strictly Stewart formulation.
To probe the unmeasured-anion component, we examined SIG and AGc in the whole group. According to our data the relationship between the two of them was AGc = 8 + 0.97·SIG (Figure 2). In his paper in 1999 Constant supports that SIG is more specific in detecting the presence of unmeasured strong ions in plasma than is the anion gap [8]. Similar results were reported by Lee et al. [5] In our analysis AGc and SIG track the same physiology—unmeasured anions—but on slightly different zero points. The perfect slope (~1) indicates they move together almost identically, while the ~8 mEq/L intercept reflects definitional choices (albumin/ phosphate/ organic anions for AGc vs organic anions in SIG). Practically, AGc and SIG are interchangeable proxies for the unmeasured anions burden. While SIDa rose only slightly, both SIG and AGc declined substantially, indicating clearance of unmeasured anions. This is consistent with removal of uremic organic acids —e.g., indoxyl sulfate, hippurate, p-cresyl sulfate, urate, ketoacids.
From a Stewart perspective, the pH rise is captured by a pronounced increase in SIDe and a fall in SIG; critically, the SIDe increase is driven almost entirely by the bicarbonate gain. In parallel, the relatively low chloride in the dialysate (due to displacement by the bicarbonate load) corrects the hyperchloremic fraction of acidosis, further contributing to the net alkalinization.
From the Henderson–Hasselbalch viewpoint, the interpretation is straightforward: exogenous bicarbonate enters from the dialysate and pH increases with PaCO₂ essentially unchanged. Our paired analysis showed that the observed rise in pH was almost completely explained by the increase in plasma bicarbonate.
Both frameworks therefore describe the same physical process from different angles: the dialysate is relatively rich in HCO₃⁻, poor in Cl⁻, and effectively devoid of organic anions. The small acetate/citrate load is titrated by bicarbonate to yield a stable CO₂ concentration in the effluent, while the corresponding anions are cleared. Thus, HCO₃⁻ accumulation, Cl⁻ displacement, and organic-anion removal occur simultaneously. This explains why SIDa—which excludes HCO₃⁻—underestimates the alkalinizing effect, whereas SIDe and SIG, which include HCO₃⁻, track the process more faithfully.
A conceptual paradox emerges here. In Stewart’s approach, bicarbonate is a dependent variable; yet in practice the model requires HCO₃⁻ (via SIDe) to reveal the fall in SIG. Without the bicarbonate term, the physicochemical model would miss the contribution of organic-anion removal—an effect that, conversely, is readily detected by the cAG. Thus, while Stewart’s approach elegantly emphasizes independent strong ions and weak acids, its practical application in HD paradoxically leans on bicarbonate to uncover the very changes in SIG.
In its conventional closed-system form (using only SIDa, ATOT, and PCO₂ as independent variables), the Stewart model underestimated the alkalinization observed during HD, because these variables changed very little. In contrast, when the analysis was extended to an open-system context that also considers the exogenous bicarbonate load (through SIDe), the rise in pH was fully captured. At the same time, the fall in SIG/AGc reflected removal of unmeasured organic anions. Thus, using SIDe and SIG rather than SIDa alone allows the Stewart framework to describe the alkalinizing effect of dialysis, showing that the apparent mismatch comes from the restricted closed-system implementation, which cannot account for bicarbonate infusion.
With our analysis we also found that the Figge–Constable equations systematically overestimated measured pH in the overall cohort, most notably pre-HD, with smaller bias post-HD. If the problem were primarily due to differences in ion measurement techniques that have changed since the time of Figge and Constable, the bias would have been consistent pre- and post-dialysis, since sodium and chloride were measured using the same contemporary methods on the same analyzer. The reduction in bias after dialysis, when mean pH increased from 7.31 to 7.42, suggests that methodological factors cannot explain the mismatch. Rather, the shift toward alkalemia likely altered the effective dissociation behavior of albumin and phosphate, bringing their apparent Ka values closer to those assumed by the Figge–Constable model. In addition, dialysis reduces the burden of organic anions, thereby decreasing the requirement for counterbalancing strong cations and simplifying the ionic milieu in a way that further enhances model performance. Taken together, these findings suggest that the choice of dissociation constants may contribute substantially to prediction error, and that reevaluating the Ka values under the dynamic pH and organic anion conditions encountered during hemodialysis may improve the accuracy of the Stewart approach.
Our findings are consistent with those of Hernández et al., who, in a cohort of 35 HD patients, found that the Henderson-based framework provided a closer fit to measured pH [10]. Consistent results were also observed in the intensive care setting: in a study of 172 patients, the standard base excess (SBE) model was a superior predictor of acidemia and alkalemia compared with the apparent SID-based model [11], while in another ICU cohort the bicarbonate–cAG approach showed diagnostic performance comparable to that of the Stewart framework [12].
Although our study focuses on chronic dialysis, broader evidence suggests that SIG may have clinical relevance beyond dialysis. In patients with AKI and metabolic acidosis, SIG has been independently associated with both short- and long-term mortality [13], underscoring its prognostic value and supporting its use in general nephrology practice.
With regard to the PD group, patients exhibited higher AGc and SIG values than HD patients, indicating a greater burden of unmeasured anions in PD. This observation aligns with the findings of Klabosh et al., who demonstrated that metabolic acidosis in PD is characterized by an increased SIG compared with healthy controls [14].
This study has several strengths. First, it uniquely combines paired pre/post hemodialysis data with a peritoneal dialysis cohort, allowing direct comparison of acid–base responses across modalities. Second, it applies both Henderson–Hasselbalch and Stewart–Figge frameworks in parallel, not only at absolute levels but also in Δ-models, providing a rigorous head-to-head assessment of predictive performance. Finally, the dataset is clinically relevant, reflecting routine dialysis practice with contemporary bicarbonate-based solutions, and the results directly inform the ongoing debate over the utility of physicochemical versus traditional models in real-world dialysis physiology.
Limitations include the single-cohort design and modest sample size. Dialysate composition (HCO₃⁻/Cl⁻) was uniform rather than randomized, and we did not directly quantify the full panel of organic anions; consequently, mechanistic inferences about specific solutes are indirect.
4. Materials and Methods
4.1. Study Population, Dialysis Solutions and Sampling
We enrolled 53 chronic hemodialysis (HD) patients with paired arterial blood gases and blood chemistry immediately before and after routine sessions (106 observations total) and 41 stable peritoneal dialysis (PD) patients sampled cross-sectionally (41 observations). Accordingly, cross-sectional (“level”) analyses comprised 147 observations (HD-pre, HD-post, PD).
Dialysis treatments were performed with a Fresenius 4008S machine (Fresenius Medical Care, Bad Homburg, Germany). The standard dialysate composition was sodium 138 mEq/L, potassium 2.0 mEq/L, calcium 3.0 mEq/L, magnesium 1.0 mEq/L, chloride 108 mEq/L, acetate 2.7 mEq/L, and bicarbonate 32 mEq/L, with minor adjustments according to individual clinical requirements.
Peritoneal dialysis was performed with bicarbonate-buffered bicaVera solutions (Fresenius Medical Care, Bad Homburg, Germany) and, when indicated, with icodextrin (Extraneal, Baxter Healthcare, Deerfield, IL, USA) for long dwell exchanges. After mixing of the dual chambers, the final composition of bicaVera was sodium 134 mEq/L, calcium 1.75 mmol/L, magnesium 0.5 mmol/L, chloride 101 mEq/L, bicarbonate 34 mEq/L, and glucose at 1.5%, 2.3%, or 4.25% (corresponding to 83, 126, or 236 mmol/L). Icodextrin solution contained sodium 133 mEq/L, calcium 1.75 mmol/L, magnesium 0.25 mmol/L, chloride 96 mEq/L, lactate 40 mEq/L, and 7.5% icodextrin as the osmotic agent.
Patients continued on their individualized PD and HD prescriptions without modification on the day of measurement. The study was conducted in accordance with the principles of the Declaration of Helsinki. All participants provided written informed consent prior to enrollment. As all laboratory tests were part of routine clinical care and no additional interventions were performed, the requirement for formal ethics committee approval was waived by the local institutional review board.
4.2. Measurements and Derived Variables
Measured variables included pH, PCO₂ (mmHg), HCO₃⁻ (mEq/L), Na⁺, K⁺, ionized Ca2⁺ (iCa), ionized Mg2⁺ (iMg), Cl⁻ (all in mEq/L), lactate (mmol/L), albumin (g/L), and phosphate (P) (mmol/L).
(1) Weak acid anions, ATOT= [A−] =[Alb−]+[Pi−] where [Alb−] is albumin charges and [Pi−] is phosphate charges; [Alb⁻] = [Alb]·(0.123·pH − 0.631) and [P⁻] = [P]·(0.309·pH − 0.469); with [Alb] in g/L and [P] in mmol/L.
(2) Apparent strong-ion difference: SIDa = ([Na⁺] + [K⁺] + [iCa2⁺] + [iMg2⁺]) − ([Cl⁻] + [lactate]);
(3) Effective strong-ion difference: SIDe = [HCO₃⁻] + ATOT
(4) Strong-ion gap: SIG = SIDa − SIDe;
(5) Stewart-predicted pH (Figge electroneutrality equation): SIDa = S·PCO₂·10^(pH − pKₐ) + [Alb]·(0.123·pH − 0.631) + [P]·(0.309·pH − 0.469), S = 0.0301 mmol/L/mmHg and pKₐ = 6.10
(6) The Constable simplified equation (Figure 3) which is derived from equation (5), was solved numerically for each sample to obtain the Constable -predicted pH.
(7) Anion gap was calculated as AG = [Na+] - ([Cl-]+[HCO3-]), and corrected for the effect of abnormal albumin concentration with the formula: AGc = AGobserved + 0.25 X ([normal Alb] - [observed Alb]).
Where Kl' is the apparent equilibrium constant for the Henderson-Hasselbalch equation, S is the solubility of CO₂ in plasma, PCO₂ is arterial carbon dioxide tension, Ka is the dissociation constant for weak acids, [ATOT] is the total concentration of weak acids and [SID+] is the strong ion difference SIDa.
4.3. Statistical Analysis
For paired HD Δ-models, the outcome was ΔpH (post − pre). We fitted a Henderson–Hasselbalch model (ΔpH defined by ΔHCO₃⁻ and ΔPCO₂) and a Stewart model (ΔpH defined by ΔSIDa, ΔATOT and ΔPCO₂).
For cross-sectional level-models (all observations; n=147), the outcome was pH, modeled as HH model (pH defined by HCO₃⁻ and PCO₂) and Stewart model (pH defined by SIDa, ATOT and PCO₂). All models used ordinary least squares and prespecified performance metrics were R2/adjusted R2.
All statistical analyses were performed using IBM SPSS Statistics, version 26. As SPSS does not provide a built-in function for Bland–Altman analysis, we generated the corresponding plots using R code obtained with the assistance of ChatGPT (OpenAI, San Francisco, CA, USA). ChatGPT was also used to assist with English language editing and refinement of syntax. All outputs were subsequently reviewed and verified by the authors.
5. Conclusion
The Stewart model struggles to account for HD-induced alkalinization when applied in its closed-system form, as it does not natively accommodate exogenous bicarbonate delivery; thus, despite sizeable increases in pH and HCO₃⁻, its independent variables (SIDa, ATOT, PCO₂) changed little. By contrast, the “Boston” framework accurately predicted the observed ∆pH from ∆HCO₃⁻ and ∆PCO₂, reflecting the clinical reality that bicarbonate flux from dialysate is the dominant driver. Nevertheless, a broader physicochemical interpretation using SIDe and SIG—which incorporate bicarbonate and capture clearance of unmeasured anions—coherently described the alkalinizing effect. The apparent discrepancy therefore lies not in the Stewart framework itself but in its restricted implementation. In the context of both hemodialysis and peritoneal dialysis, future applications of the Stewart framework should rely on SIDe and SIG, which incorporate bicarbonate and unmeasured anion clearance, to more faithfully represent the open-system physiology of dialysis
Supplementary Materials
The following supporting information can be downloaded at the website of this paper posted on Preprints.org, Table S1: Comparison of Biochemical and Acid–Base Parameters by Gender (ANOVA); Table S2: Changes in Hemodialysis Patients; Table S3: Post hoc (Tukey HSD) comparisons among PD, HD-pre, and HD-post.
Author Contributions
Conceptualization, EK, DG, KS; Data curation, NK, ArA, ED, KD, CP, DL; Formal analysis, NK, KS; Investigation, NK, EM, IP, KD, CP, AA, DL, KS; Methodology, NK, IP, EK, KS; Resources, NK, EM, ED; Software, AA; Supervision, EK, DG, KS; Writing – original draft, NK; Writing – review & editing, NK, EM, ArA, IP, CP, AA, DL, KS.
Funding
This research received no external funding. The article processing charge (APC) was covered by the Medical Scientific Society EMEKNNOK (VAT 996845022), Kalessa, Heraklion 71500, Greece (decision 20/2025).
Institutional Review Board Statement
The study was conducted in accordance with the Declaration of Helsinki. As all laboratory tests were part of routine clinical care and no additional interventions were performed, the requirement for formal ethics committee approval was waived by the Institutional Review Board of the University Hospital of Heraklion.
Informed Consent Statement
Written informed consent was obtained from all participants prior to enrolment.
Data Availability Statement
Data are available from the corresponding author upon reasonable request.
Conflicts of Interest
The authors declare no conflict of interest.
References
- Stewart, PA. Modern quantitative acid-base chemistry. Can J Physiol Pharmacol. 1983, 61, 1444–1461. [Google Scholar] [CrossRef] [PubMed]
- Fencl V, Leith DE. Stewart's quantitative acid-base chemistry: applications in biology and medicine. Respir Physiol. 1993, 91, 1–16. [Google Scholar] [CrossRef] [PubMed]
- Fencl V, Jabor A, Kazda A, Figge J. Diagnosis of metabolic acid-base disturbances in critically ill patients. Am J Respir Crit Care Med. 2000, 162, 2246–2251. [Google Scholar] [CrossRef] [PubMed]
- Libório AB, Daher EF, de Castro MC. Characterization of acid-base status in maintenance hemodialysis: physicochemical approach. J Artif Organs. [CrossRef]
- Lee, YS. Clinical Significance of Strong Ion Gap: between ICU and Hemodialysis Patients with Metabolic Acidosis. Electrolyte Blood Press. 2007, 5, 1–8. [Google Scholar] [CrossRef] [PubMed]
- Rastegar, A. Clinical utility of Stewart's method in diagnosis and management of acid-base disorders. Clin J Am Soc Nephrol. 2009, 4, 1267–1274. [Google Scholar] [CrossRef] [PubMed]
- Libório AB, da Silva Alexandre C, Noritomi DT, Andrade L, Seguro AC. Impact of chloride balance in acidosis control: the Stewart approach in hemodialysis critically ill patients. J Crit Care. 2006, 21, 333–338. [Google Scholar] [CrossRef] [PubMed]
- Constable, PD. Clinical assessment of acid-base status: comparison of the Henderson-Hasselbalch and strong ion approaches. Vet Clin Pathol. 2000, 29, 115–128. [Google Scholar] [CrossRef] [PubMed]
- Kurtz I, Kraut J, Ornekian V, Nguyen MK. Acid-base analysis: a critique of the Stewart and bicarbonate-centered approaches. Am J Physiol Renal Physiol. 2008, 294, F1009–F1031. [Google Scholar] [CrossRef] [PubMed]
- Hernández Jaras J, Rico Salvador I, Torregrosa de Juan E, et al. [Does Stewart-Fencl improve the evaluation of acid-base status in stable patients on hemodiafiltration?]. Nefrologia. 2010, 30, 214–219. [Google Scholar] [CrossRef]
- Ciabattoni A, Chiumello D, Mancusi S, et al. Acid-Base Status in Critically Ill Patients: Physicochemical vs. Traditional Approach. J Clin Med, 06 May. [CrossRef]
- Paliwal R, Pakavakis A, Divatia JV, Kulkarni AP. Utility of Stewart's Approach to Diagnose Missed Complex Acid-Base Disorders as Compared to Bicarbonate-anion Gap-based Methodology in Critically Ill Patients: An Observational Study. Indian J Crit Care Med. 2022, 26, 23–32. [Google Scholar] [CrossRef] [PubMed]
- Zheng CM, Liu WC, Zheng JQ, et al. Metabolic acidosis and strong ion gap in critically ill patients with acute kidney injury. Biomed Res Int, 2014. [CrossRef]
- Klaboch J, Opatrná S, Matousovic K, Sefrna F, Havlín J, Schück O. Acid-base balance in peritoneal dialysis patients: a Stewart-Fencl analysis. Ren Fail. 2009, 31, 625–632. [Google Scholar] [CrossRef] [PubMed]
- Figge J, Jabor A, Kazda A, Fencl V. Anion gap and hypoalbuminemia. Crit Care Med. 1998, 26, 1807–1810. [Google Scholar] [CrossRef] [PubMed]
Figure 1.
Bland–Altman plots comparing measured pH with Figge-predicted pH (using measured PCO₂) in the overall cohort and stratified by modality (PD, HD-PRE, HD-POST). Red dashed lines represent the mean bias (positive in all groups, indicating systematic overestimation of pH by the Figge method), while grey dotted lines mark the 95% limits of agreement. The bias was most pronounced in HD-PRE, intermediate in PD, and smallest in HD-POST.
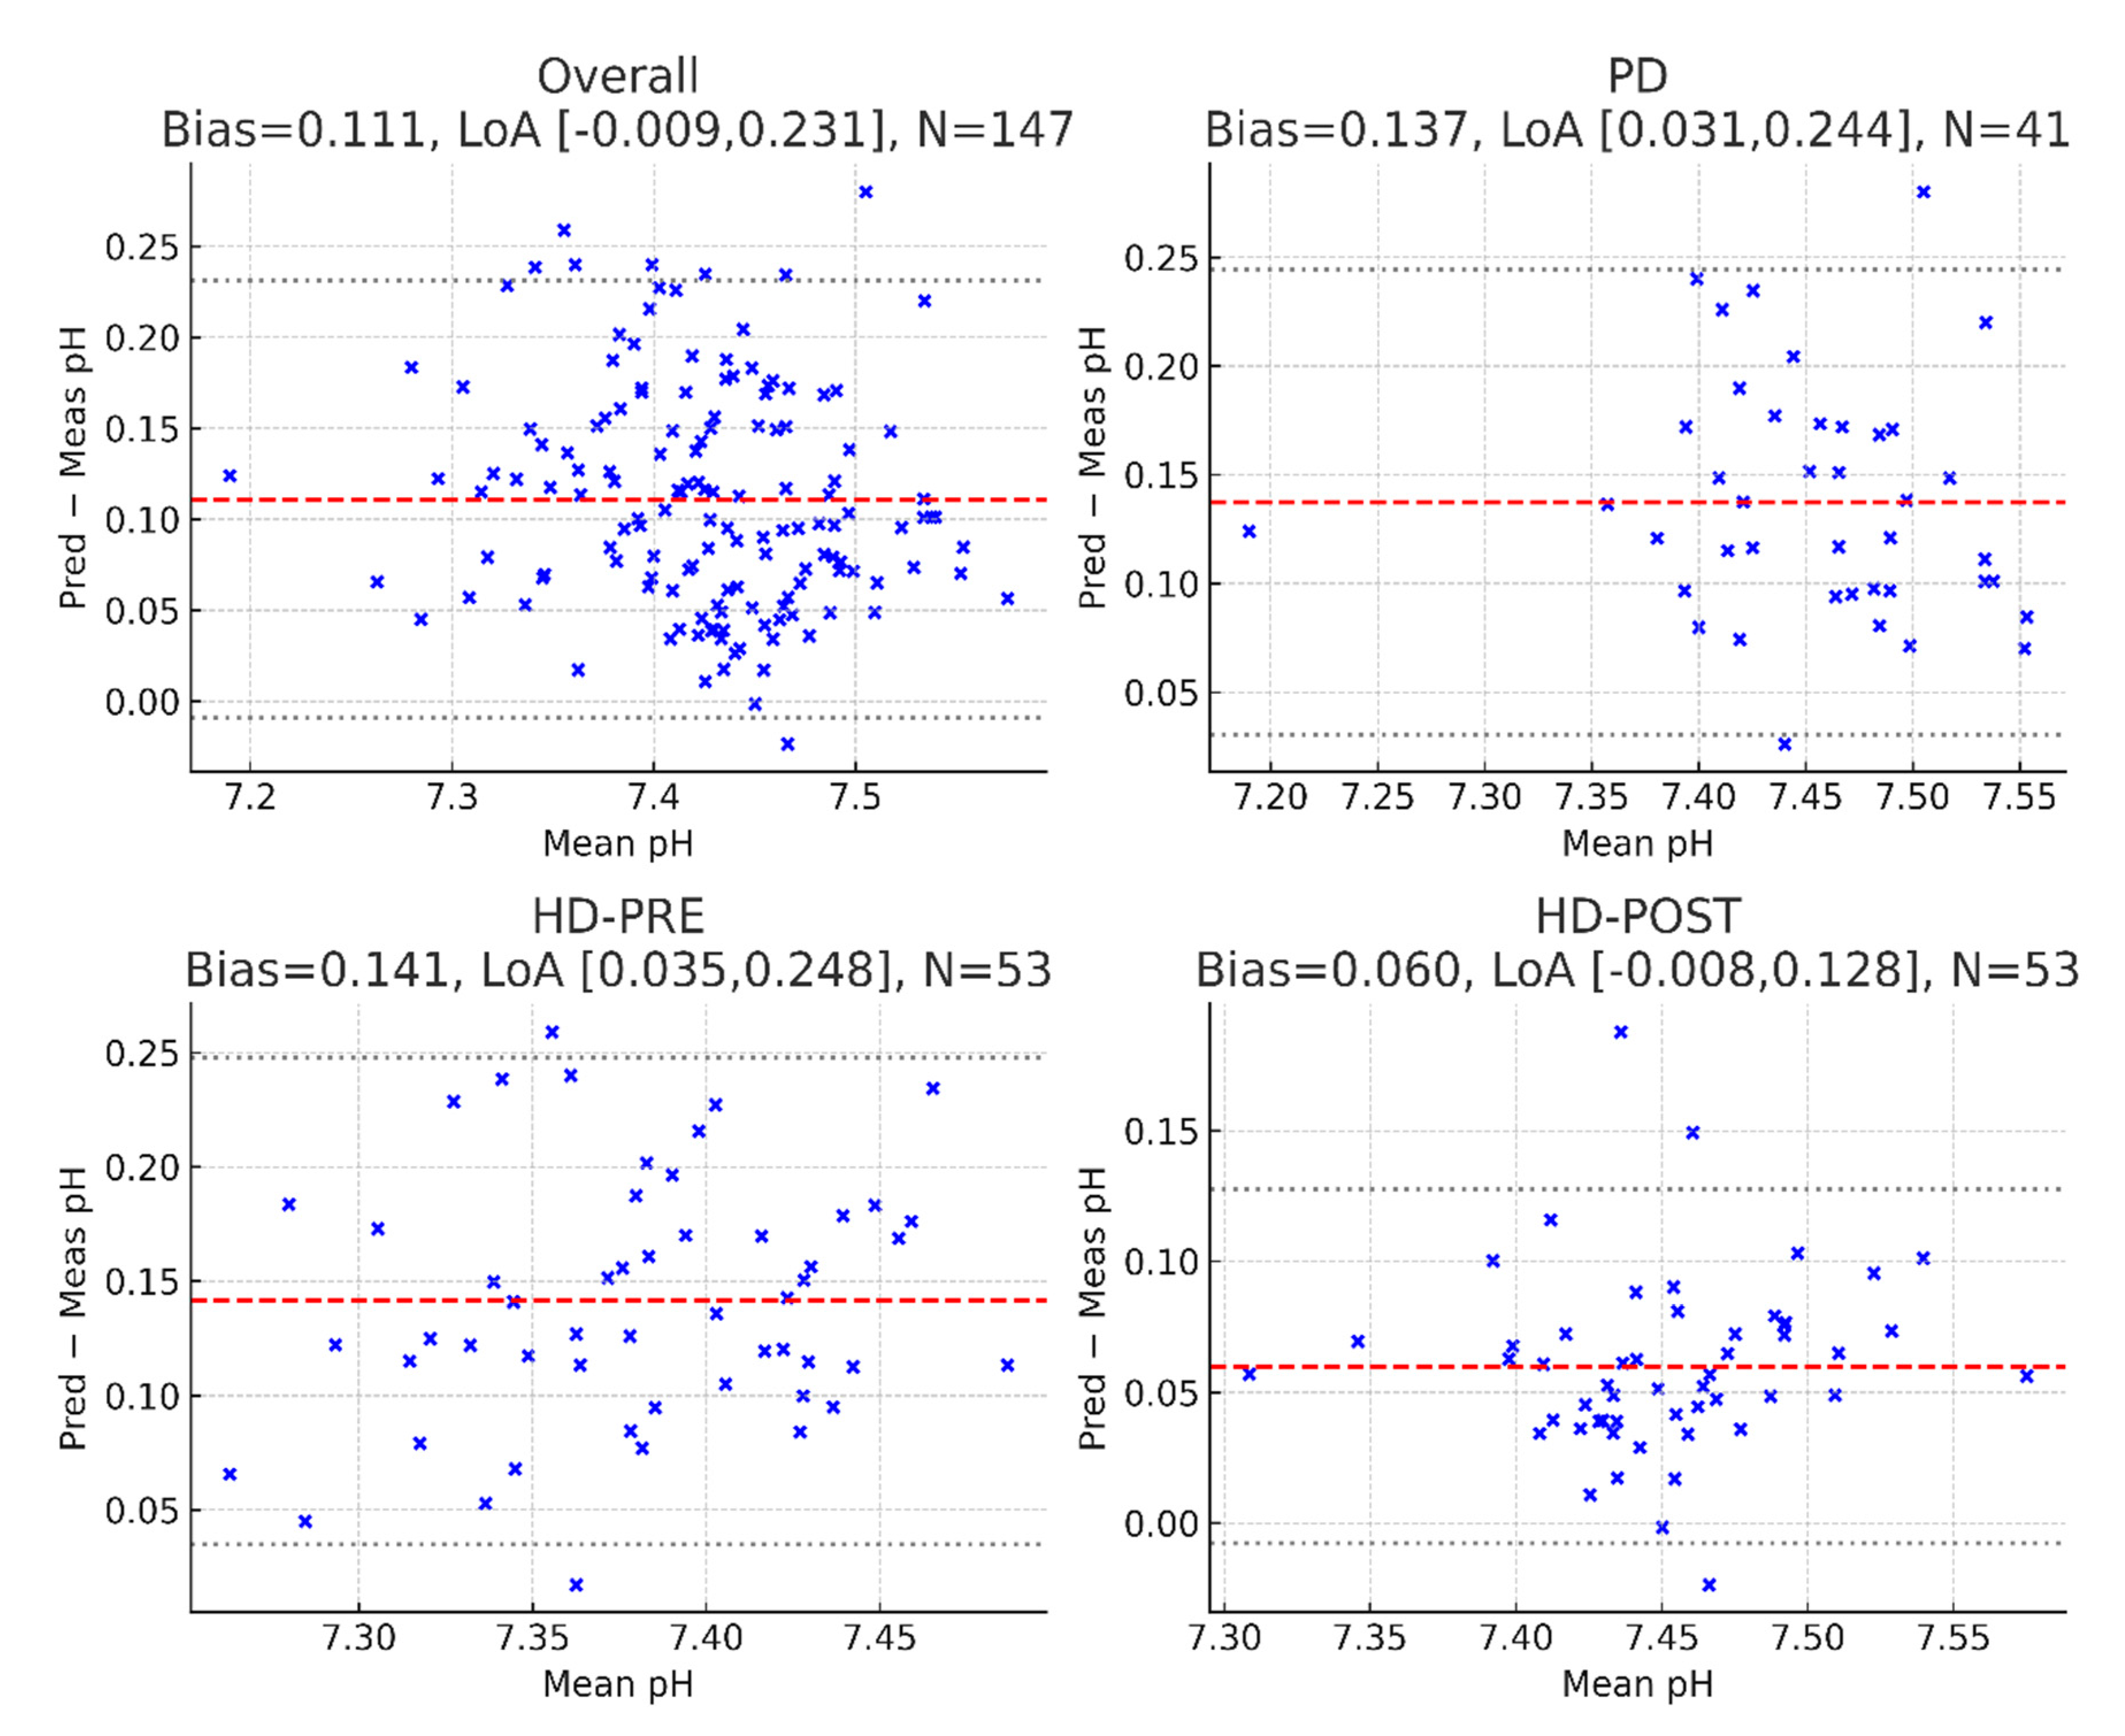
Figure 2.
Relationship between corrected anion gap (AGc) and strong ion gap (SIG); AGc = 7.94 + 0.966* SIG; R2 = 0.86, p <0.0001.
Figure 2.
Relationship between corrected anion gap (AGc) and strong ion gap (SIG); AGc = 7.94 + 0.966* SIG; R2 = 0.86, p <0.0001.
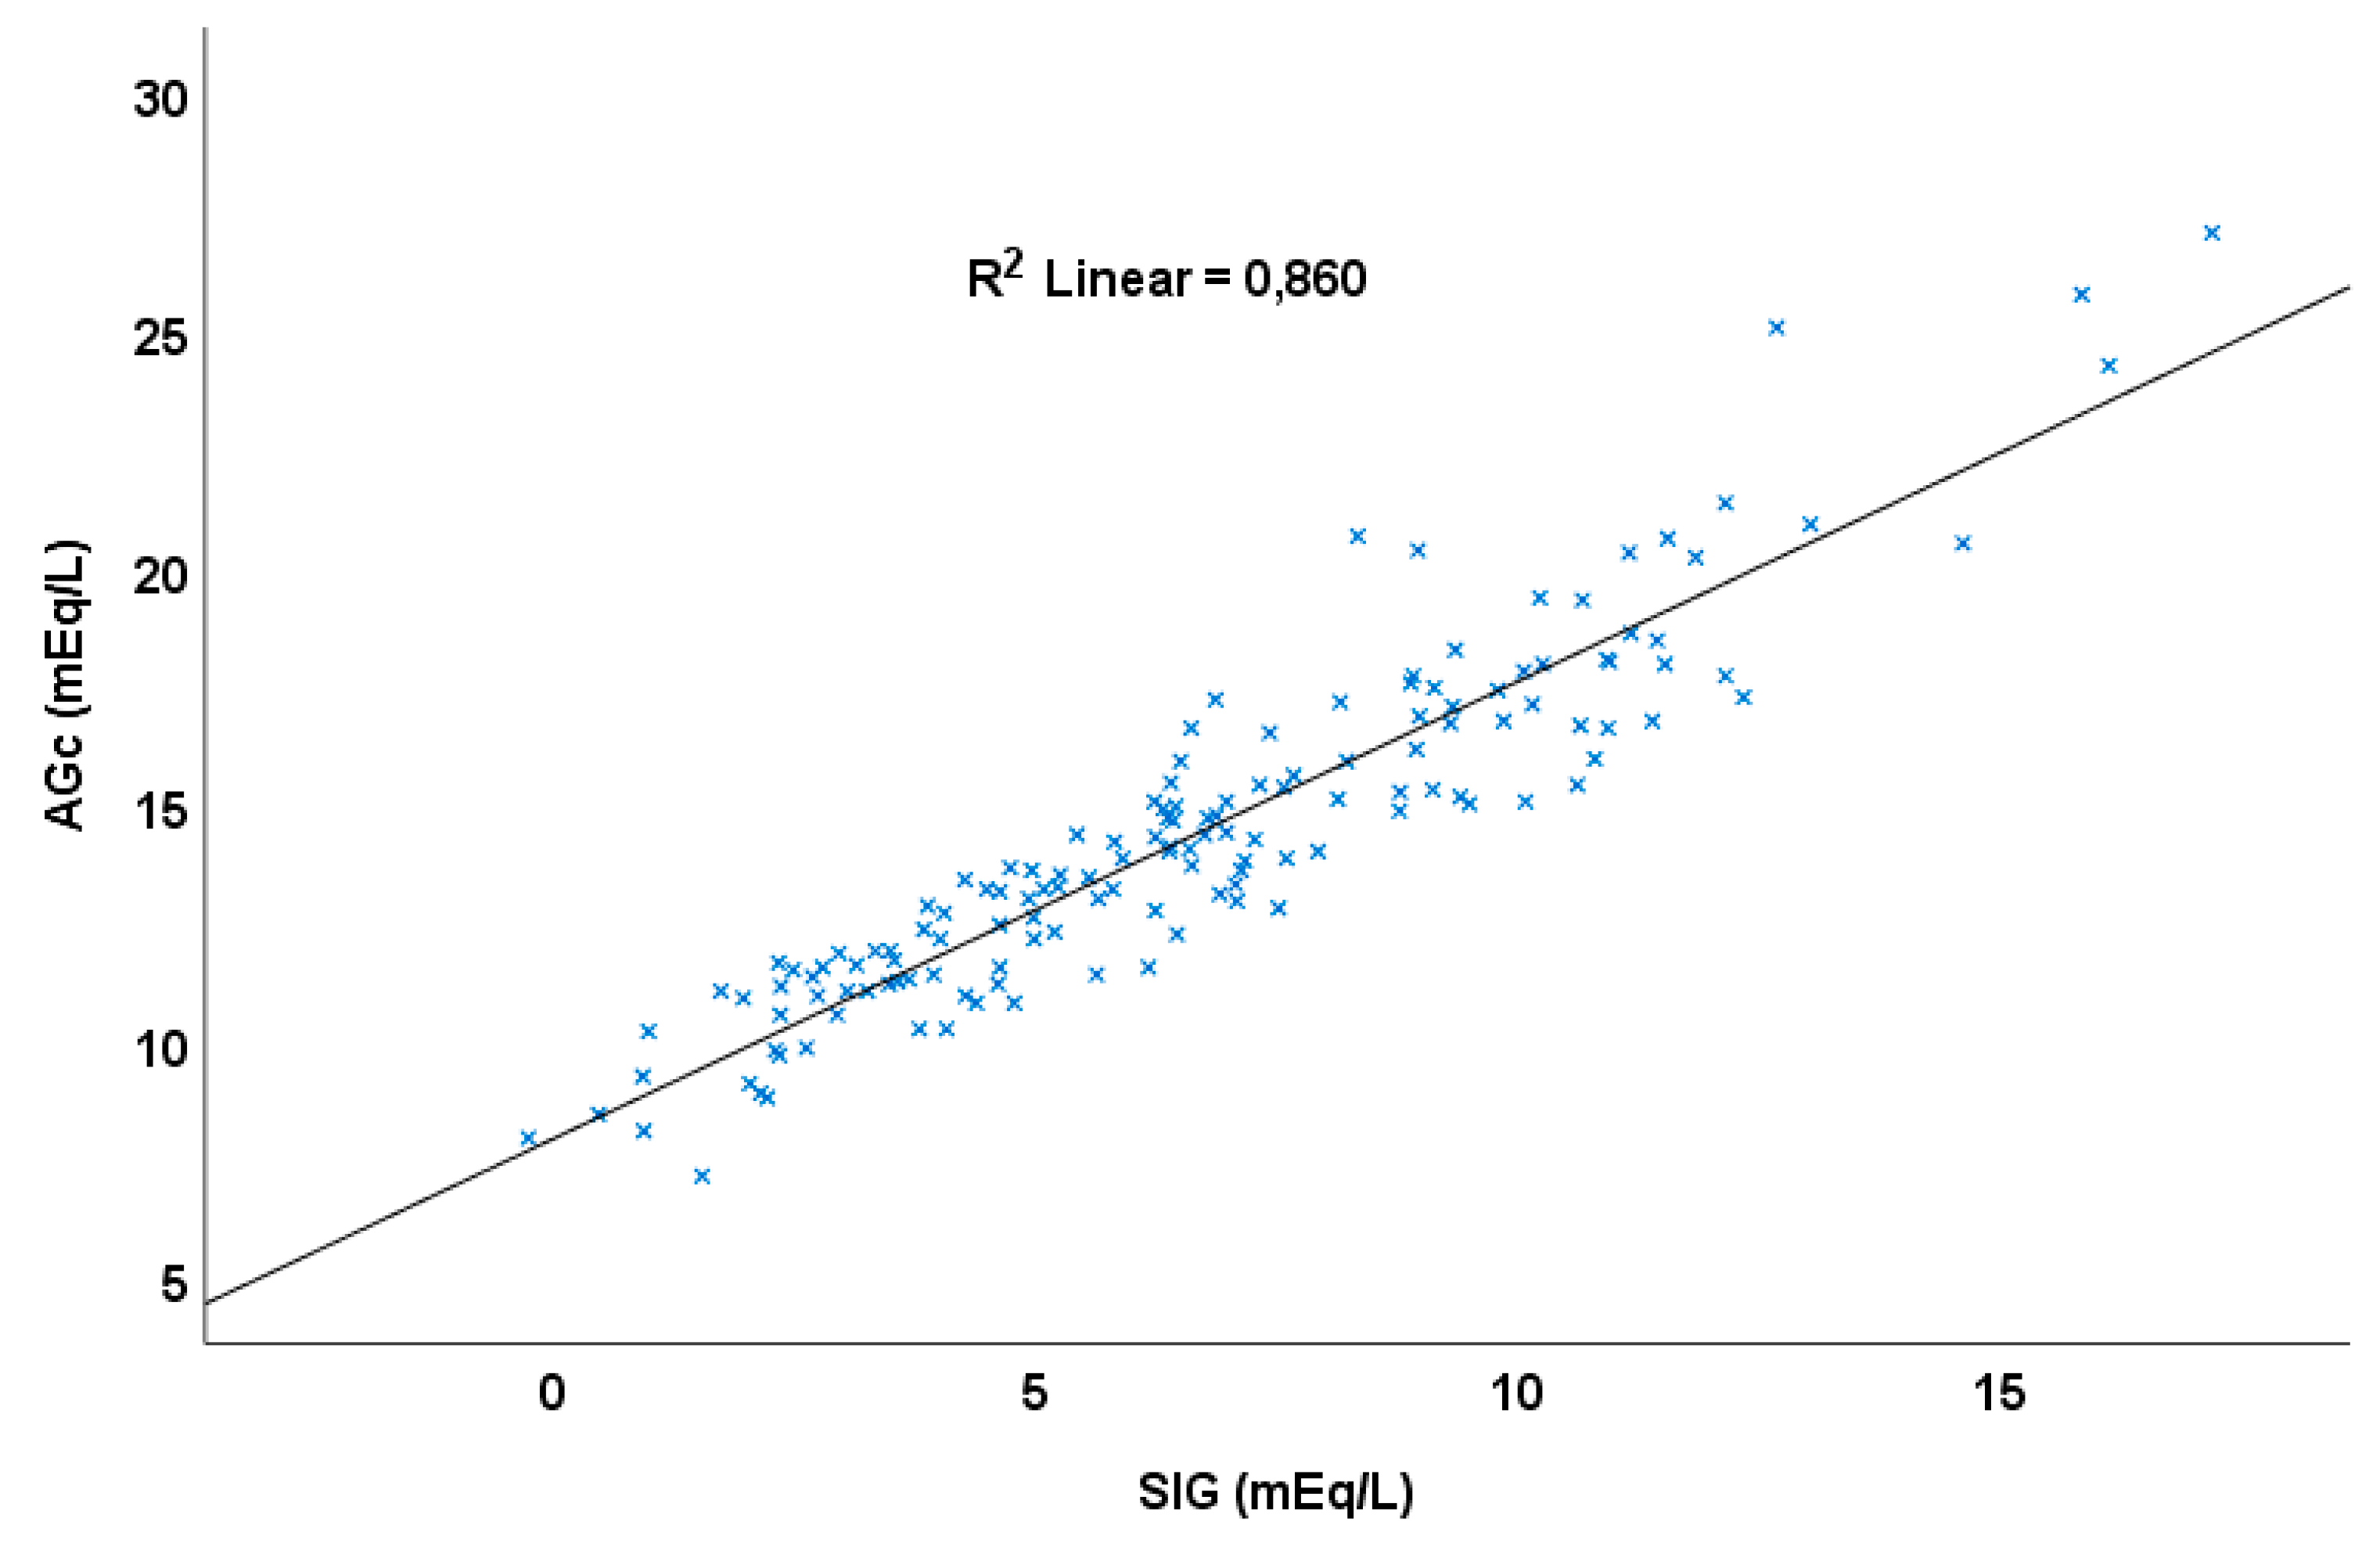
Figure 3.
Constable’s Equation.
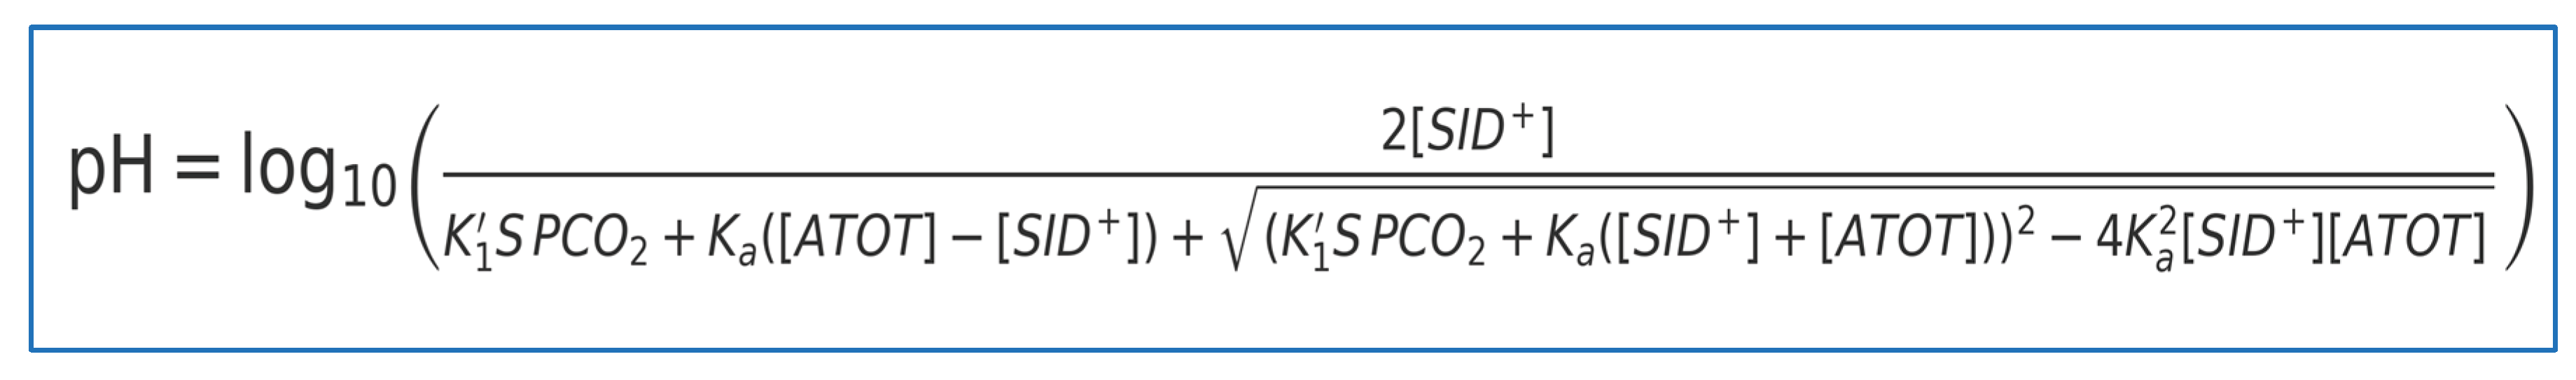

Table 1.
Descriptive analysis of the whole group. Values are mean ± SD. Group sample sizes are shown in column headers. ANOVA p-value refers to the overall test across PD, HD-pre, and HD-post.
Table 1.
Descriptive analysis of the whole group. Values are mean ± SD. Group sample sizes are shown in column headers. ANOVA p-value refers to the overall test across PD, HD-pre, and HD-post.
| Parameter | PD (n=41) | HD-pre (n=53) | HD-post (n=53) | ANOVA p |
|---|---|---|---|---|
| Na | 136.83 ± 4.61 | 137.06 ± 2.55 | 137.49 ± 1.79 | 0.5640 |
| K | 4.57 ± 0.99 | 5.20 ± 0.75 | 3.67 ± 0.41 | <0.0001 |
| iCa | 2.17 ± 0.30 | 2.38 ± 0.42 | 2.59 ± 0.30 | <0.0001 |
| iMg | 1.33 ± 0.32 | 1.33 ± 0.23 | 1.14 ± 0.10 | <0.0001 |
| Cl | 98.80 ± 6.57 | 102.57 ± 3.19 | 100.23 ± 2.04 | <0.0001 |
| Lactate | 1.77 ± 0.77 | 2.38 ± 0.80 | 2.26 ± 0.77 | 0.0007 |
| Alb | 33.10 ± 5.97 | 39.51 ± 3.59 | 41.25 ± 4.67 | <0.0001 |
| P | 1.84 ± 0.81 | 1.78 ± 0.50 | 0.96 ± 0.28 | <0.0001 |
| pH | 7.38 ± 0.07 | 7.31 ± 0.05 | 7.42 ± 0.05 | <0.0001 |
| HCO₃⁻ | 23.13 ± 4.12 | 19.44 ± 2.59 | 25.11 ± 1.40 | <0.0001 |
| SIDa | 44.34 ± 3.64 | 41.03 ± 2.54 | 42.41 ± 1.96 | <0.0001 |
| ATOT | 12.50 ± 2.12 | 13.77 ± 1.42 | 13.37 ± 1.56 | 0.0018 |
| SIDe | 35.63 ± 3.44 | 33.21 ± 2.72 | 38.48 ± 1.64 | <0.0001 |
| SIG | 8.70 ± 3.10 | 7.82 ± 2.88 | 3.94 ± 2.27 | <0.0001 |
| PCO₂ | 39.48 ± 7.82 | 39.45 ± 5.72 | 39.83 ± 4.80 | 0.9416 |
| AG | 14.90 ± 4.11 | 15.05 ± 2.74 | 12.16 ± 2.31 | <0.0001 |
| AGc | 16.62 ± 4.01 | 15.18 ± 2.78 | 11.85 ± 2.14 | <0.0001 |
| BE | -1.91 ± 4.34 | -6.33 ± 2.78 | 0.71 ± 1.56 | <0.0001 |
Note: PCO2 mmHg, Alb g/L, all other units are mEq/L.
Table 2.
Descriptive statistics for the HD group and mean change (pre → post). Values are mean ± SD; p-values are for paired pre–post differences.
Table 2.
Descriptive statistics for the HD group and mean change (pre → post). Values are mean ± SD; p-values are for paired pre–post differences.
| Parameter | HD pre (n=53) (Mean±SD) | HD post (n=53) (Mean±SD) | Change Δ (Mean±SD) | p-value |
|---|---|---|---|---|
| Na | 137.06 ± 2.55 | 137.49 ± 1.79 | 0.43 ± 2.26 | 0.1676 |
| K | 5.20 ± 0.75 | 3.67 ± 0.41 | -1.53 ± 0.61 | <0.0001 |
| iCa | 2.38 ± 0.42 | 2.59 ± 0.30 | 0.21 ± 0.45 | 0.0015 |
| iMg | 1.33 ± 0.23 | 1.14 ± 0.10 | -0.19 ± 0.17 | <0.0001 |
| Cl | 102.57 ± 3.19 | 100.23 ± 2.04 | -2.34 ± 2.84 | <0.0001 |
| LA | 2.38 ± 0.80 | 2.26 ± 0.77 | -0.13 ± 1.00 | 0.3627 |
| Alb | 39.51 ± 3.59 | 41.25 ± 4.67 | 1.74 ± 3.06 | 0.0001 |
| P | 1.78 ± 0.50 | 0.96 ± 0.28 | -0.82 ± 0.38 | <0.0001 |
| pH | 7.31 ± 0.05 | 7.42 ± 0.05 | 0.11 ± 0.06 | <0.0001 |
| HCO3 | 19.44 ± 2.59 | 25.11 ± 1.40 | 5.67 ± 2.20 | <0.0001 |
| SIDa | 41.03 ± 2.54 | 42.41 ± 1.96 | 1.39 ± 2.14 | <0.0001 |
| ATOT | 13.77 ± 1.42 | 13.37 ± 1.56 | -0.40 ± 1.04 | 0.0076 |
| SIDe | 33.21 ± 2.72 | 38.48 ± 1.64 | 5.27 ± 2.72 | <0.0001 |
| SIG | 7.82 ± 2.88 | 3.94 ± 2.27 | -3.88 ± 2.53 | <0.0001 |
| PCO2 | 39.45 ± 5.72 | 39.83 ± 4.80 | 0.38 ± 5.54 | 0.6236 |
| AG | 15.05 ± 2.74 | 12.16 ± 2.31 | -2.89 ± 2.17 | <0.0001 |
| AGc | 15.18 ± 2.78 | 11.85 ± 2.14 | -3.33 ± 2.25 | <0.0001 |
| BE | -6.33 ± 2.78 | 0.71 ± 1.56 | 7.04 ± 2.65 | <0.0001 |
Table 3.
Ordinary Least Squares models on paired ΔpH (n=53). Entries show B (SE); standardized β; p-value. AIC = Akaike Information Criterion; BIC = Bayesian Information Criterion; SEE = Standard Error of the Estimate; (N=53).
Table 3.
Ordinary Least Squares models on paired ΔpH (n=53). Entries show B (SE); standardized β; p-value. AIC = Akaike Information Criterion; BIC = Bayesian Information Criterion; SEE = Standard Error of the Estimate; (N=53).
| Variable / Metric | Stewart (ΔSIDa, ΔATOT, ΔPCO2) | Henderson (ΔHCO3 + ΔPCO2) | ΔHCO3-only |
|---|---|---|---|
| ΔSIDa | 0.009 (0.003); β=0.324; p<0.01 |
||
| ΔATOT | 0.008 (0.006); β=0.140; p=0.214 |
||
| ΔPCO2 | -0.006 (0.001); β=-0.580; p<0.001 |
-0.011 (0.001); β=-1.005; p<0.001 |
|
| ΔHCO3 | 0.023 (0.001); β=0.851; p<0.001 |
0.010 (0.004); β=0.362; p<0.01 | |
| R2 / adj.R2 | 0.514 / 0.485 | 0.903 / 0.899 | 0.131 / 0.114 |
| SEE | 0.0432 | 0.0191 | 0.0566 |
| F (p) | 17.29 (p<0.001) | 231.87 (p<0.001) | 7.69 (p<0.01) |
| AIC / BIC | -178.9 / -171.0 | -266.1 / -260.2 | -152.1 / -148.1 |
Disclaimer/Publisher’s Note: The statements, opinions and data contained in all publications are solely those of the individual author(s) and contributor(s) and not of MDPI and/or the editor(s). MDPI and/or the editor(s) disclaim responsibility for any injury to people or property resulting from any ideas, methods, instructions or products referred to in the content. |
© 2025 by the authors. Licensee MDPI, Basel, Switzerland. This article is an open access article distributed under the terms and conditions of the Creative Commons Attribution (CC BY) license (http://creativecommons.org/licenses/by/4.0/).
Copyright: This open access article is published under a Creative Commons CC BY 4.0 license, which permit the free download, distribution, and reuse, provided that the author and preprint are cited in any reuse.


