
Submitted:
28 October 2025
Posted:
29 October 2025
You are already at the latest version
Abstract
The 35-day X-ray lightcurve of Hercules X-1 consists of a Main High state, a Short High state and two Low states.
These are caused by a precessing tilted and twisted accretion disk.
The best available 35-day average lightcurves are from Swift/BAT observations in the 15-50 keV band and from MAXI observations in the 2-20 keV band.
The current work fits the 35-day X-ray lightcurve from Swift/BAT and fits the MAXI 35-day X-ray lightcurve using a disk plus corona model.
The parameters of the disk and its corona from the two data sets are consistent with eachother.
The fit of two different data sets with the same model verifies the reliabilty of the disk plus corona model and its parameter values.
We find the inner corona radius is significantly smaller than the inner disk radius, consistent with the conclusions of pulse shape studies.
The system inclination of $85.12\pm0.24^{\circ}$ is consistent with the recent value derived from MAXI observations alone, and much improved compared to earlier estimates ($\sim$82 to 88$^\circ$).
This results is significantly improved binary system parameters, including neutron star mass, companion mass and companion radius.
Keywords:
long-term cycles
; radiation transfer
; X-ray observations
; accretion disks
1. Introduction
The X-ray binary system Hercules X-1 (or Her X-1) consists of an accreting neutron star with a a ∼2.3 companion, HZ Her [1,2]. It has a 1.7-day orbit [3] and a 35-day cycle [4,5].
The 35-day cycle is composed of a bright Main High state, an intermediate brightness Short High state (∼20% as bright) and faint Low states (a few % as bright as Main High) separating the two high states. A detailed breakdown of the state changes for the 35-day lightcurve is given by [6] in their Table 2. The variation in X-ray flux is mainly caused by the blockage of the line-of-sight to the neutron star by the disk, e.g., [5,7,8]. However there is a significant to the cycle by X-rays scattered from near the inner part of the accretion disk [7,9,10].
The overall need for a warped accretion disk in Her X-1 was established by [8] which analyzed optical variability, and a satisfactory mechanism for warping was given by [11]. The warped disk’s link with the observed pulse shape systematic variation with 35-day phase was shown by [7]. The measurement of the twist and tilt from models fit to the X-ray lightcurve (in particular, the RXTE/ASM one) was first carried by [9]. Somewhat later, an ultraviolet light-curve was measured and then modelled with the warped disk model [12]. Thus in multiple aspects (X-ray, UV and optical light-curves, and 35-day evolution of the pulse-shape) a warped accretion disk is required to be present in Her X-1.
Here we are concerned with construction of a 3 dimensional model which can reproduce the 35-day observed X-ray lightcurve. We use ray-tracing simulations to calculate the lightcurve from the model using the Shape software package [13]. The goal is to constrain the properties of the disk by constructing a radiation transfer model which reproduces the 35-day X-ray light-curve of Her X-1. Ref. [9] used analytical models for the optical depth through the disk to the neutron star. Ref. [14] applied the precessing outer disk ring model of [15]. In that, a ring at the outer edge of the disk precesses via tidal forces from the companion star, when there is enough thermal energy in the ring.
Most recently, the ray-tracing software Shape [13] was applied by Leahy and Mendelsohn [16] to model the average 35-day lightcurve compiled from MAXI [17] observations by [18]. An accretion disk corona was found to be necessary to fit the lightcurve and a tight constraint on the inclination of the Her X-1 binary was obtained. The current work is an extension of the work of [16] by applying the model to Swift/BAT observations [19] (hereafter referred to as BAT) in addition to the MAXI observations. The combination of modelling data from two different instruments and two different energy bands significantly improves the reliability of the modelling. Section 2 describes the data used, Section 3 discusses the analysis applied to the data and Section 4 gives the model description. The results are presented in Section 5, with discussion of implications of the model in Section 6, ending with a summary section.
2. 35-Day X-Ray Lightcurves of Her X-1 from BAT and MAXI
For the 35-day light-curve we use the BAT data (energy band 15-50 keV [19]) and the MAXI data (2-20 keV [17]). BAT and MAXI regularly monitor Her X-1 and both have been doing this for more than 10 years, thus they both have complete coverage of the 35-day cycle over a large number of cycles and ideal for constructing an average 35-day lightcurve, unlike higher sensitivity pointed instruments. 35-day average light-curves were constructed from BAT and MAXI data by [6] and [18], which used a cross-correlation analysis to phase align the 35-day cycles. Those lightcurves had X-ray eclipses removed prior to analysis. That was necessary because the 1.7 day periodic Her X-1 X-ray eclipses of the neutron star do not align with the 35-day cycle. A 2% systematic error was included in addition to the statistical errors on the count rates. The 35-day lightcurves from BAT and MAXI are given in Figure 1.
For the current work, a quantitative method to identify phases where dips significantly affect the lightcurve is followed, which is significanty improved from the method of dip removal in [16]. This change in choice of removed data affected phases of the 100, and had a noticable effect on the modelling results carried out below. Here we use significant changes in softness ratio as a reliable indicator of dips, which are caused by cold matter absorption and are accompanied by decreases of softness ratio [20]. Figure 2 show the MAXI to BAT count rate ratio and its errors, calculated including error propagation, vs. 35-day phase. For comparison the BAT count rate (scale to fit the plot) is shown. The points that deviate more than 2 below the softness ratio at peak of Main High (6.7) are flagged and removed from both MAXI and BAT lightcurves. The exception is that no points are removed from Main High Turn-on (35-day phases 0.86 to 0.95) where the outer edge of the disk is known to cause cold matter absorption and low softness ratio. We note than none of the points are more than 2 above the softness ratio at peak of Main High. Some of the points at low count rate are not more than 2 from this value but the error bars are larger than the full scale of 0 to 10, so they are not plotted. The total number of removed points is 10.
3. Analysis Method
The Shape software allows one to specify an emitter as a point source of radiation and a surrounding matter distribution through which the radiation propagates to the observer. The point source emitter is given an emission spectrum specified by the user. The matter distribution is specified by objects with geometircal boundaries (e.g., a sphere or cylindrical ring) and formulae for the density dependence within each object are specified by the user. Absorption or scattering cross-sections for each object are also specified by the user. Ray tracing using the standard radiation transfer equations is carried out to produce a sky-plane image in the direction of the observer from the radiation after transmitting through the matter distribution. Lightcurves are obtained by integrating spatially over the simulated sky plane image. More details are given in the documentation for Shape [13].
For Her X-1, the 35-day lightcurve is caused by radiation from the neutron star propagating through a tilted and twisted accretion disk, with its corona, which rotates with a 35-day period. The disk rotation axis is the binary orbital axis and the observer is located at inclination 85 degrees [16], i.e., 5 degrees from the orbital plane. The measured spectrum of Her X-1 during peak of Main High [21] is used to specify the spectrum of the emitter at the origin of the Shape coordinates, which represents the neutron star. We use Shape to contruct a geometrical model for the accretion disk and its corona around the emitter (the neutron star). The disk is rotated to different angles in steps from 0 to 360 degrees and ray-tracing carried out at each angle to produce a simulated 35-day lightcurve.
A separate calculation is carried out in Shape for the radiation transfer for absorption and that for scattering. The results from these two calculations are called the direct radiation and the scattered radiation, respectively. The first calculation includes absorption cross-sections and scattering cross-sections but only keeps track of rays that are not scattered on their way to the observer. The second (scattered) calculation also includes absorption and scattering cross sections, but tracks only scattered radiation. To fit the result of a Shape model calculation to the observed we apply an overall scale factor and a phase shift. The phase shift is needed to shift the initial rotation angle of the accretion disk to match the start of the observed lightcurve. As noted previously [6] the definition of start phase for the 35-day cycle has been different in different analyses: some use start of Main High (with different definitions of start, e.g.,: first detection, 20% of peak- some of which depend on the sensitivity of the instrument). Here we use 35-day cycle phase 0 to be peak of Main High.
The scaled and phase shifted model light-curve is:
where and are the direct and scattered radiation calculations, respectively, and is the disk rotation at 35-day phase . The fitting is carried out using minimization. The disk model is then adjusted, by changes to one or more model parameters and Shape is run again to produce new and lightcurves, which are fit to the observed lightcurves to yield a new value. New parameters are chosen with the goal of improving the model fit to the data. This is repeated hundreds of times as necessary. Typically each Shape run ( or ) takes minutes to run. The final result is a model where adjustment of the parametes no longer improves the fit to the data.
To obtain model parameter uncertainty estimates we follow the procedure in Chapter 15 of [22]. One parameter is varied around its value for the bestfit model, with three or more values, then a quadratic equation is fit to the dependence on that parameter. The maximum and minimum values of that parameter are found by the values where the quadratic intercepts , with is the minimum of the quadratic and is chosen to yield the ±1- confidence range.
4. Model Description
4.1. Simulation Implementation
The Shape software has the matter distribution: a) bounded by any number of 3-dimensional (3D) basic shapes, such as spheres, cylinders and cones, positioned and oriented inside a 3D rectangular grid which specifies the outer boundaries of the computation; and b) further given by density functions inside each basic shape. Here, the orbital plane is the plane and the emitter (neutron star) is at so that the disk rotates around the z-axis as 35-day phase progresses . We approximate the emitter spectrum as a blackbody over the energy range of each of the observations (2-20 keV for MAXI and 15-50 keV for BAT).
The accretion disk has low ionization state so we take the absorption cross-section to be a sum of the photoelectric and Thompson cross-sections (the latter accounts for X-rays that are scattered once then absorbed). The matter in the corona is highly ionized so the cross-section is that for Thompson scattering. In Shape one can split the spectrum into several several energy bands, so that each energy band has a separate ray-tracing calculation, after which the energy bands are summed. We compared using 7 energy bands (each for 15-50 keV for BAT, and 2-20 keV for MAXI) and using 3 energy bands and did not find any difference in the resulting lightcurves. Thereafter 3 energy bands were used. The Shape calculations were repeated for 41 different consecutive rotation phases of the accretion disk to create a model light-curve over the full range of 35-day phase. The model was then interpolated to the observed phases for fitting. Different interpolation methods were compared and cubic spline with linear endpoints was found to be the most accurate, thus was adopted.
The dimension of the Shape grid was cells, or km across per dimension, in order to fit the disk (which has diameter km). Each grid cell is thus km on a side. and for the disk were fixed at km and km. The inner radius was taken larger than the one for the physical disk so that we could resolve the inner disk in the model disk.
4.2. Disk Properties
The disk geometry was specified using a series of rings, each with height z from to and radius r from to , with r, z and standard cylindrical coordinates of a ring. The warped disk is formed by an adjacent series of rings, with each ring having its own tilt angle from the orbital plane and twist angle (angle between the grid x-axis and the line of nodes for that ring). These angles for the inner and outer rings are parameters of the model, with those for intermediate rings specified by linear functions. During the 35-day cycle, the blockage of line-of-sight to the X-ray source is done by the outer and inner edges of the disk [7], which is ensured by the linear functions. An disk rotation phase (, Eqn(1)) is added as part of fitting process, thus a fixed inner twist involves no loss of generality.
The geometry of the disk is shown in Figure 3. Within the disk the density distribution is taken to be Gaussian with scale-length centred at for each ring: where is taken to be several scaleheights (). The previous work of [16] details the different tests that showed the disk vertical density funtion is best represented by a Gaussian. Thus the density is concentrated toward the (tilted and twisted) center plane of the disk. The disk is required to have to an atmosphere (vertical gradient) in order produce the gradual rise to and fall from the Main High state whis is observed.
4.3. Corona Properties
The corona consists of ionised gas (free electrons) above and below the disk which make a contribution to the 35-day lightcurve. A spherical corona with powerlaw density profile is adopted, motivated by the form of the corona used by [10]: with and the inner and outer radii, the powerlaw index and the density at . was set to 1. was fixed at km, because the fitting was not sensitive to .
4.4. Radial Scaling Factor
The Shape model consists of a disk with a z dependence but no r dependence. However the equivalent physical disk it represents does have a dependence, where is the radial coordinate for the physical disk. This is because the inner radius is scaled up by a factor 1250 for the Shape model: from a physical disk inner radius of 400 km to the model disk inner radius of km, but the outer radius is not scaled up. Column densities (integral of density along the line of sight) determine the resulting radiation transfer, and the real disk has smaller line-of-sight for the inner rings, proportional to the scaling factor for each ring, which varies from 1/1250 for the inner ring to 1 for the outer ring. Assuming a linear variation, follows the relation:
For , a formula for has to be specified: one suitable choice is for . Thus the densities for the physical disk and physical corona increases by a factor of =1250 for , and by factor for . One can assume more complex forms for the scaling factor. E.g. to get a standard disk model [23], the Case b disk has a midplane density and the Case c disk has a midplane density . For these two cases one would replace the factor in the formula for by the factors or , respectively.
As done for the disk model, the corona model inner radius is scaled up by a factor of 1250 to obtain the same disk line-of-sight blockage as the physical case. This implies the density of the physical disk is scaled up by this same factor to obtain the same scattering column density. The outer corona physical radius is scaled down by the factor from the model radius . The inner and outer boundaries of the corona are illustrated in Figure 3.
5. Results
As described above the initial disk plus corona model was adopted from the work of [16]. The two data sets that were modeled were the BAT 35-day lightcurve and the MAXI 35-day lightcurve from [18]. The removal of lightcurve phases where the count rates are affected by dips was carried out as described in Section 2 above.
The inner radius of the corona, , strongly affects the strength of scattered radiation over the 35-day cycle: due to the blockage of the inner part of the corona by the disk. We specify by its ratio to the inner radius of the disk () . The outer corona is visible for most of disk rotation phase and less modulated.
Figure 4 shows simulated images of the scattered radiation from the corona at 35-day phase 0.0, when the line-of-sight from neutron star to observer gives maximum visibility at peak of Main High; at 35-day phase 0.35, in the middle of the first Low State, when the disk maximally blocks the line-of-sight from neutron star to observer; and 0.52, when the line-of-sight from neutron star to observer gives the maximum visibility at peak of Short High (but less than that for Main High). For phase 0.0 the part of the corona above the disk is visible, whereas for phase 0.52 the corona below the disk is visible and during the two low states both sides of the corona are visible, but the central part of the corona is blocked by the disk.
The disk outer radius was set to km. The inner radius was set to km, to include enough computational cells ( km across) to obtain a resolved ring. The inner twist angle of the disk was set to 75.5 degree, but this is not a restriction for the fits because it is degenerate with the parameter in Equation (1). The set of fixed parameters is shown in the top part of Table 1.
We initially fit the BAT lightcurve to obtain best fit parameters for the BAT data, then fit the MAXI lightcurve to obtain best fit parameters for the MAXI data. The best fit model parameters and their errors for BAT and for MAXI are given in Table 1 and the best fit light-curves are shown in Figure 5. The 1 (68.27%) parameter errors were obtained the standard method for non-linear model fitting [22].
6. Discussion
6.1. Model Fitting Process
The fit residuals for both BAT and MAXI best fit models are shown in Figure 6. Their are some 35-day phases of higher residuals: Turn-on to Main High (phase ≃0.87) and Decline (≃0.18)2. This indicates some systematic errors in the data or the model at these 35-day phases. A likely explanation is that the effects of dips has not fully removed in our choice of omitted 35-day phases (see Section 2). Dips occur over a wide range of 35-day phase [20] and neither BAT nor MAXI are sensitive to detect most dips: only the strongest dips affect the MAXI to BAT softness ration. Thus we cannot fully remove dips, which limits the accuracy of the modelling. The effect of systematic effects in the data is partially mitigated by modelling data sets from 2 different instruments (BAT and MAXI).
To estimate errors in the model, we used the standard process for determination of parameter errors for minimization of a nonlinear model. The model fit to the BAT data agrees with the model fit to the MAXI data within 1 of the combined BAT and MAXI errors for all the variable parameters. This 1 combined error is given by
where and are the parameter errors from the BAT fit and from the MAXI fit, respectively. is also the error in the mean of the BAT and MAXI parameters. Because the two models give consistent parameters, the best fit disk plus corona model can be taken to have parameters equal to the mean of the BAT and MAXI values, with parameter errors given by the combined error above.
6.2. Interpretation in Terms of a Physical Model
This work uses Shape which carries out a radiation transfer for direct/absorbed X-rays and separately for scattered X-rays. For direct X-rays, the key physical quantity at any 35-day phase (i.e., at a particular observer direction) is the column density for absorption measured on the line-of-sight. For scattered X-rays (the single scattering case considered here), the key physical quantities are the column densities for scattering along all lines of sight from the central X-ray source at the origin. Both of these are invariant to a change in radial scaling of the disk if one conserves the column densities: where is the direction of the single line-of-sight from neutron star to observer for the absorbed X-rays calculation and refers to all lines-of-sight surrounding the neutron star for the scattered X-rays calculation. As discussed in Section 4.4 the physical disk has local densities scaled up by the inverse of the local scaling factor that is the ratio of physical radius to model radius. We note that angular quantities are not affected by the radius scaling.
6.3. The Disk and Comparison with Previous Work
A precessing and tilted disk is required to explain the 35-day cycle. Ref. [24] demonstrated that the pulse shape cycle and 35-day flux cycle were in phase, and separately suggested that neutron star precession takes place. Some support for this is given by X-ray polarization analyses ([25,26] and [27]) but those studies did not consider the effect of disk precession or of corona scattering on the polarization changes. The smooth pulse profile changes from precession were argued to be in disagreement with observed sharp pulse shpae changes by [7]. BAT and MAXI observations which were analyzed here have low time resolution () [18] thus cannot measure nor are affected by pulse profile varations. Thus pulse profile changes should not have a strong effect on the disk modelling carried out here.
Ref. [16] modeled Her X-1’s corona and disk similarly to the work here, using the MAXI lightcurve with 35-day phases removed from the analysis, to compensate for dips, based on manual inspection for decreases in count rate. The current work improves on this by using both MAXI (2-20 keV) and BAT (15-50 keV) lightcurves and removing phases based on changes in softness ratio, which is a direct indication of absorption by dips. The model parameters obtained by [16] are listed in their Table 2. The parameters of [16] that agree with our parameters within 1 are (where we use the average of BAT and MAXI parameters from Table 1 and error given by Equation (3)) : inclination, disk density, inner tilt, inner scale height, outer tilt, outer twist, ratio of corona inner radius to disk inner radius and corona powerlaw index. The outer scale height (our value is 0.094±0.029 radians) agrees within 2. We refit the model to the MAXI lightcurve with the same points removed as [16] and verify their results, thus the difference must be caused by the different selection of data points removed. The current work uses a quantitative test to remove dip-affected data thus is more reliable than the results of [16].
The results of the RXTE/ASM 35-day lightcurve analysis were given by [9] with [28] presenting them in a more useful form (their Table 2). The accretion disk parameters of those two studies agree within uncertainties. The outer disk scale height here has a value between the layer 1 and layer 2 scale heights of [28]. However we obtain a better fit to data using a single outer atmospheric scale height, and the newer data has significantly smaller errors bars. This is due to our inclusion of the corona, not included in [9] or [28], which better fits the 35-day lightcurve than inclusion of a second layer on the disk.
Ref. [12] constructed a disk model as a model for far ultraviolet observed light-curve of Her X-1. The observation was short (0.93 days or 0.55 binary orbit) and the model simulated the changing disk shadow on the front surface of the star in its orbits with the neutron star and its disk. The resulting disk model, with inclination assumed, had inner tilt of and disk twist of , compared to the current work with inner tilt of and disk twist (difference between inner and outer twists) of . However that disk was optically thick and had no atmosphere, which explains both the smaller inner tilt and larger twist than the current work. In general, the difference in disk parameters of the current study from previous studies can be explained by the use of simpler (less physical) disk models in the previous studies.
6.4. Disk Corona
A density power law was adopted for the disk corona, as indicated by previous studies of the corona. Ref. [10] found a powerlaw index of -1.25 for the corona by fitting scattered X-rays during neutron star eclipse. Our corona powerlaw index (≃-1) is consistent with this. We find the inner corona extends in to ∼0.26 times the inner disk radius of km, i.e., km. This is consistent the conclusion of [7] from pulse shape analysis that scattering must occur close (∼100 km) to the neutron star.
6.5. System Inclination
A comprehensive discussion of the effect of the constraint on Her X-1 binary inclination is given by [16]. A general discussion of the system parameters of Her X-1 is given by [1]. A recalculation of the system parameters based on the constraint from the current work () instead of the constraint of () from [16] yields no significant differences, but we summarize updated values here.
The main implication of the inclination constraint is that the binary system parameters are better constrained. The projected distance from neutron star to center of mas of [3] yields the neutron star semi-major axis . The radius of HZ Her, [1], is better determined: 2.64 to 2.84 cm. is measured by eclipse duration corrected by orbital inclination with correction assuming a spherical star. The Roche Lobe calculator [29], which implements an accurate calculation of Roche lobe properties, allows one to find companion star radii in units of a. Assuming HZ Her is Roche lobe filling one finds: front or L1 radius- ; side or y radius- ; top or z radius- ; and backside radius . The Roche Lobe calculator is used to determine that the uncertainties in the different radii (in units of a) are ∼0.6%.
is from the surface element causing the eclipse to the companion’s mass center. The element has polar angles and , where is in the orbital plane and the z-axis normal to the orbit. The Roche Lobe calculator [29] gives the mass ratio q. Using (see below) and the updated already given, an updated semi-major axis is found: cm. The uncertainty in q of ±3% is the main contributor to the uncertainty in a.
A smaller radius error yields a smaller error in luminosity of 11% and reduces the size of the allowed band in Figure4 of [1] to about 55% as wide. The new allowed mass of HZ Her from the evolutionary tracks is 2.34 - 2.45 for the case of increasing radius, which is required for mass accretion. Table 3 of [1] is recalculated with the new inclination and mass range to give new limits on the companion velocity amplitude, and neutron star mass, . The new limits are: 110 km/s116 km/s and 1.52 1.69 . This results in a limit on the mass ratio of .
7. Summary
In this study we constructed a 3D disk plus corona model and applied ray tracing software to create model 35-day X-ray lightcurves which were fit to BAT and MAXI observations of Her X-1. The disk and corona properties and system inclination and their uncertainties were determined. The results of [16] are confirmed with better data than used in that study. I.e. the disk has different atmospheric scaleheights for the inner and outer region, and the scattering corona extends significantly closer to the neutron star than the inner disk boundary.
The inclination improves constraints on the radius (2.64 cm 2.84 cm) and mass (2.34 2.45 ) of the companion HZ Her. The new allowed ranges for are 110 km/s116 km/s; for neutron star mass are 1.52 1.69 and for mass ratio q are . The neutron star mass is within the range of masses for neutron stars (see the review by [31]3) but more accurate than most other determinations.
Studies to be carried out in future that would improve knowledge on the disk plus corona include the following. More observations in ultraviolet and optical wavelengths which are sensitive to the heated surface of the companion, followed by modelling of the observations. The disk shadow on the companion changes with both orbital phase (due to change in observer viewpoint) and 35-day phase (due to changes in disk rotation). Thus the modeling is more complex than that for the 35-day X-ray cycle (with no significant companion emission) but would provide an independent test of the disk plus corona model.
Author Contributions
DL: Concept, organization, data, software, model construction, writing; SF: simulations, error analysis.
Funding
Natural Sciences and Engineering Research Council of Canada.
Institutional Review Board Statement
Not applicable.
Informed Consent Statement
The authors consent to publish this work.
Data Availability Statement
Not applicable.
Acknowledgments
This work was carried out with financial support from the Natural Sciences and Engineering Research Council of Canada.
Conflicts of Interest
Not applicable.
References
- Leahy, D.A.; Abdallah, M.H. HZ Her: Stellar Radius from X-Ray Eclipse Observations, Evolutionary State, and a New Distance. The Astrophysical Journal 2014, 793, 79, [arXiv:astro-ph.SR/1406.6138]. [CrossRef]
- Reynolds, A.P.; Quaintrell, H.; Still, M.D.; Roche, P.; Chakrabarty, D.; Levine, S.E. A new mass estimate for Hercules X-1. Monthly Notices of the Royal Astronomical Society 1997, 288, 43–52. [CrossRef]
- Staubert, R.; Klochkov, D.; Wilms, J. Updating the orbital ephemeris of Hercules X-1; rate of decay and eccentricity of the orbit. Astronomy and Astrophysics 2009, 500, 883–889, [arXiv:astro-ph.HE/0904.2307]. [CrossRef]
- Wang, Y.; Leahy, D. The Evolution of the Orbital Lightcurve of Hercules X-1 with 35 Day Phase. The Astrophysical Journal 2022, 927, 143, [arXiv:astro-ph.HE/2201.04074]. [CrossRef]
- Petterson, J.A. The 35 day cycle of the X-ray binary Hercules X-1. The Astrophysical Journal 1977, 218, 783–791. [CrossRef]
- Leahy, D.; Wang, Y. Swift/BAT and RXTE/ASM Observations of the 35 day X-Ray Cycle of Hercules X-1. The Astrophysical Journal 2020, 902, 146, [arXiv:astro-ph.HE/2009.07246]. [CrossRef]
- Scott, D.M.; Leahy, D.A.; Wilson, R.B. The 35 Day Evolution of the Hercules X-1 Pulse Profile: Evidence for a Resolved Inner Disk Occultation of the Neutron Star. The Astrophysical Journal 2000, 539, 392–412, [arXiv:astro-ph/astro-ph/0002327]. [CrossRef]
- Gerend, D.; Boynton, P.E. Optical clues to the nature of Hercules X-1 / HZ Herculis. The Astrophysical Journal 1976, 209, 562–573. [CrossRef]
- Leahy, D.A. Modelling RXTE/ASM observations of the 35-d cycle in Her X-1. Monthly Notices of the Royal Astronomical Society 2002, 334, 847–854. [CrossRef]
- Leahy, D.A. Hercules X-1: Using Eclipse to Measure the X-Ray Corona. The Astrophysical Journal 2015, 800, 32. [CrossRef]
- Wijers, R.A.M.J.; Pringle, J.E. Warped accretion discs and the long periods in X-ray binaries. Monthly Notices of the Royal Astronomical Society 1999, 308, 207–220, [arXiv:astro-ph/astro-ph/9811056]. [CrossRef]
- Leahy, D.A.; Postma, J.; Chen, Y. AstroSat UVIT Observations of Her X-1. The Astrophysical Journal 2020, 889, 131. [CrossRef]
- Steffen, W.; Koning, N.; Wenger, S.; Morisset, C.; Magnor, M. Shape: A 3D Modeling Tool for Astrophysics. IEEE Transactions on Visualization and Computer Graphics 2011, 17, 454–465, [arXiv:astro-ph.IM/1003.2012]. [CrossRef]
- Inoue, H. Reproductions of super-orbital X-ray light-curves with the precessing accretion ring model and implications on accretion flows through accretion rings. Publications of the Astronomical Society of Japan 2019, 71, 36, [arXiv:astro-ph.HE/1902.08917]. [CrossRef]
- Inoue, H. Tidal-Force-Induced Precessions of Accretion Disks. Publications of the Astronomical Society of Japan 2012, 64, 40. [CrossRef]
- Leahy, D.; Mendelsohn, J. The geometry of the Hercules X-1 accretion disk from X-rays. Discover Space 2025, 129, 5. [CrossRef]
- Matsuoka, M.; Kawasaki, K.; Ueno, S.; Tomida, H.; Kohama, M.; Suzuki, M.; Adachi, Y.; Ishikawa, M.; Mihara, T.; Sugizaki, M.; et al. The MAXI Mission on the ISS: Science and Instruments for Monitoring All-Sky X-Ray Images. Publications of the Astronomical Society of Japan 2009, 61, 999, [arXiv:astro-ph.IM/0906.0631]. [CrossRef]
- Leahy, D.; Wang, Y. The 35-Day Cycle of Hercules X-1 in Multiple Energy Bands from MAXI and Swift/BAT Monitoring. Universe 2021, 7, 160. [CrossRef]
- Krimm, H.A.; Holland, S.T.; Corbet, R.H.D.; Pearlman, A.B.; Romano, P.; Kennea, J.A.; Bloom, J.S.; Barthelmy, S.D.; Baumgartner, W.H.; Cummings, J.R.; et al. The Swift/BAT Hard X-Ray Transient Monitor. The Astrophysical Journal Supplement 2013, 209, 14, [arXiv:astro-ph.HE/1309.0755]. [CrossRef]
- Leahy, D.A.; Igna, C. The Light Curve of Hercules X-1 as Observed by the Rossi X-Ray Timing Explorer. The Astrophysical Journal 2011, 736, 74. [CrossRef]
- dal Fiume, D.; Orlandini, M.; Cusumano, G.; del Sordo, S.; Feroci, M.; Frontera, F.; Oosterbroek, T.; Palazzi, E.; Parmar, A.N.; Santangelo, A.; et al. The broad-band (0.1-200 keV) spectrum of HER X-1 observed with BeppoSAX. Astronomy and Astrophysics 1998, 329, L41–L44, [arXiv:astro-ph/astro-ph/9711295]. [CrossRef]
- Press, W.H.; Teukolsky, S.A.; Vetterling, W.T.; Flannery, B.P. Numerical recipes in C++ : The art of scientific computing; 2002.
- Shakura, N.I.; Sunyaev, R.A. Black holes in binary systems. Observational appearance. Astronomy and Astrophysics 1973, 24, 337–355.
- Staubert, R.; Klochkov, D.; Postnov, K.; Shakura, N.; Wilms, J.; Rothschild, R.E. Two ~35 day clocks in Hercules X-1: evidence for neutron star free precession. Astronomy and Astrophysics 2009, 494, 1025–1030, [arXiv:astro-ph/0811.4045]. [CrossRef]
- Zhao, Q.C.; Li, H.C.; Tao, L.; Feng, H.; Zhang, S.N.; Walter, R.; Ge, M.Y.; Tong, H.; Ji, L.; Zhang, L.; et al. Polarization perspectives on Hercules X-1: Further constraining the geometry. Monthly Notices of the Royal Astronomical Society 2024, 531, 3935–3949, [arXiv:astro-ph.HE/2405.00509]. [CrossRef]
- Doroshenko, V.; Poutanen, J.; Tsygankov, S.S.; Suleimanov, V.F.; Bachetti, M.; Caiazzo, I.; Costa, E.; Di Marco, A.; Heyl, J.; La Monaca, F.; et al. Determination of X-ray pulsar geometry with IXPE polarimetry. Nature Astronomy 2022, 6, 1433–1443, [arXiv:astro-ph.HE/2206.07138]. [CrossRef]
- Heyl, J.; Doroshenko, V.; González-Caniulef, D.; Caiazzo, I.; Poutanen, J.; Mushtukov, A.; Tsygankov, S.S.; Kirmizibayrak, D.; Bachetti, M.; Pavlov, G.G.; et al. Complex rotational dynamics of the neutron star in Hercules X-1 revealed by X-ray polarization. Nature Astronomy 2024, 8, 1047–1053. [CrossRef]
- Leahy, D.A. Mapping the shape of the accretion disk of Hercules X-1. Astronomische Nachrichten 2004, 325, 205–208. [CrossRef]
- Leahy, D.A.; Leahy, J.C. A calculator for Roche lobe properties. Computational Astrophysics and Cosmology 2015, 2, 4. [CrossRef]
- Still, M.D.; Quaintrell, H.; Roche, P.D.; Reynolds, A.P. Spectral signatures of reprocessing on the companion and accretion disc of Hercules X-1. Monthly Notices of the Royal Astronomical Society 1997, 292, 52–62. [CrossRef]
- Özel, F.; Freire, P. Masses, Radii, and the Equation of State of Neutron Stars. Annual Reviews of Astronomy and Astrophysics 2016, 54, 401–440, [arXiv:astro-ph.HE/1603.02698]. [CrossRef]
| 1 | However this is degenerate with the constant B in Equation (1). Shape does not track multiple scattering, so that the density constant is not accurate. |
| 2 | See Table 2 of [18] for phases of the different states of Her X-1. |
| 3 | A few of the values in [31] need to be updated. |
Figure 1.
Swift/BAT and MAXI count rates and errors (from [18]) for the Her X-1 35-day cycle, with 35-day phase 0 set at peak of Main High state. Eclipse data were excluded prior to analysis.
Figure 1.
Swift/BAT and MAXI count rates and errors (from [18]) for the Her X-1 35-day cycle, with 35-day phase 0 set at peak of Main High state. Eclipse data were excluded prior to analysis.
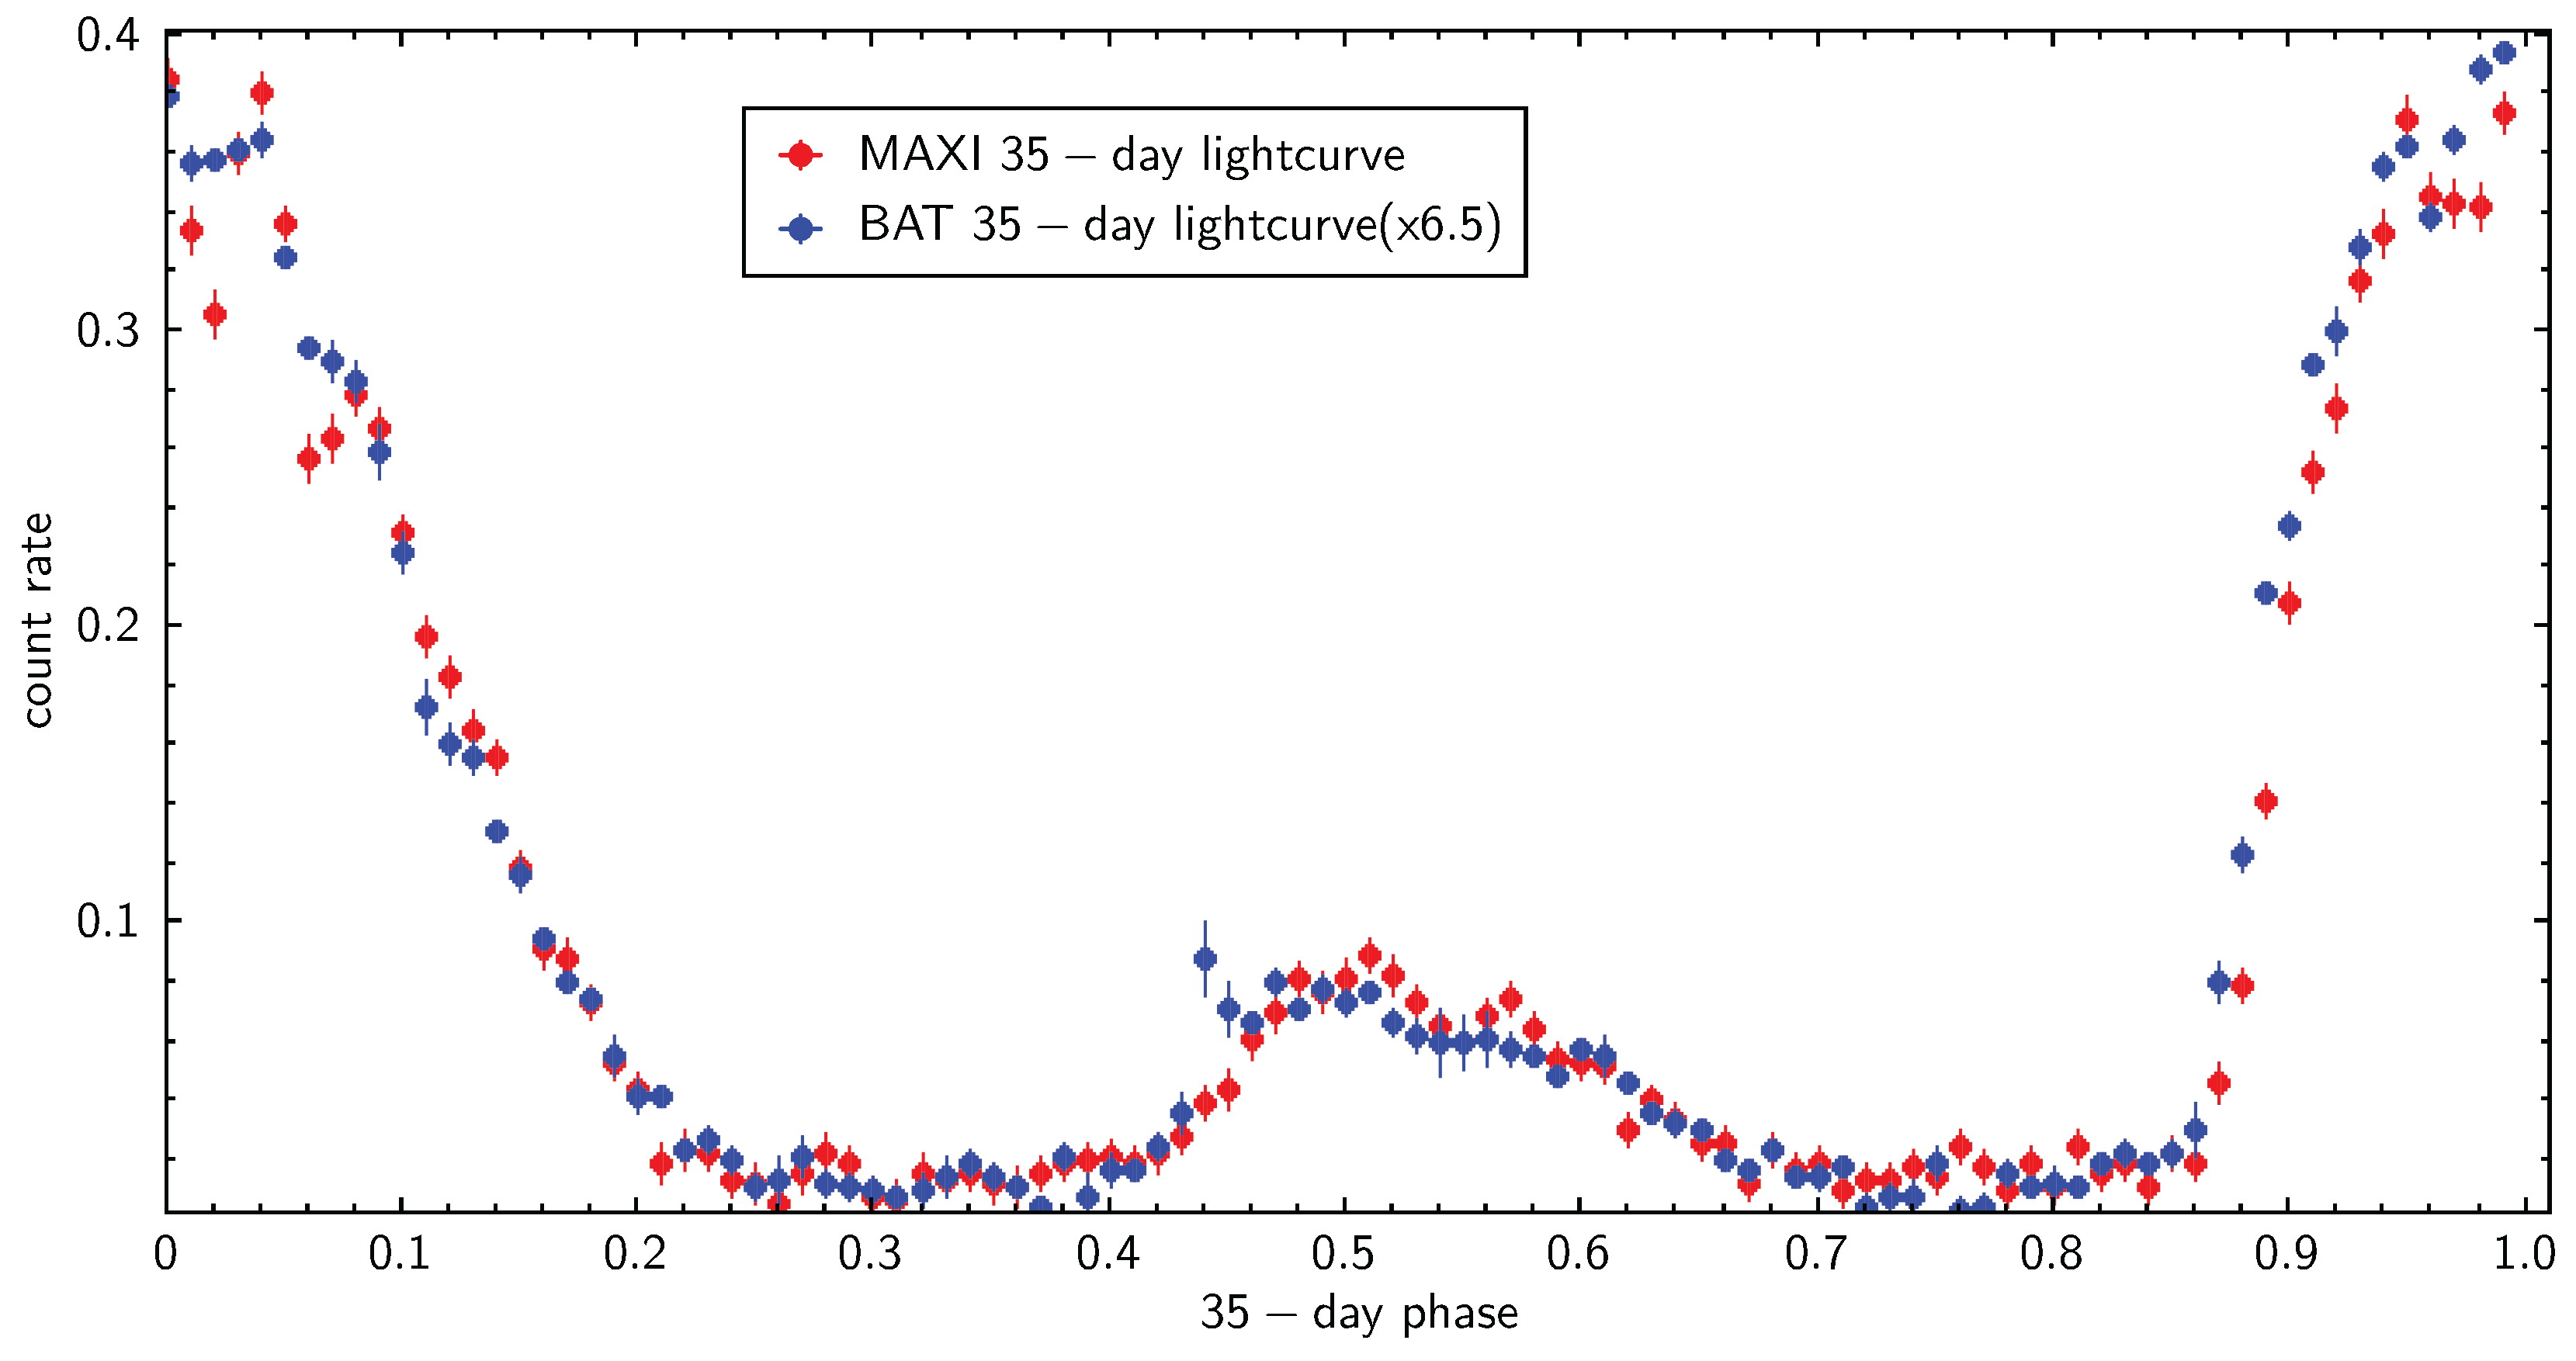
Figure 2.
MAXI (2-20 keV) to BAT (15-50 keV) softness ratio and its error vs. 35-day phase. The BAT lightcurve (scaled vertically for comparison with the softness ratio) is shown by the red points. The red horizontal line is the softness ratio at peak of Main High State.
Figure 2.
MAXI (2-20 keV) to BAT (15-50 keV) softness ratio and its error vs. 35-day phase. The BAT lightcurve (scaled vertically for comparison with the softness ratio) is shown by the red points. The red horizontal line is the softness ratio at peak of Main High State.
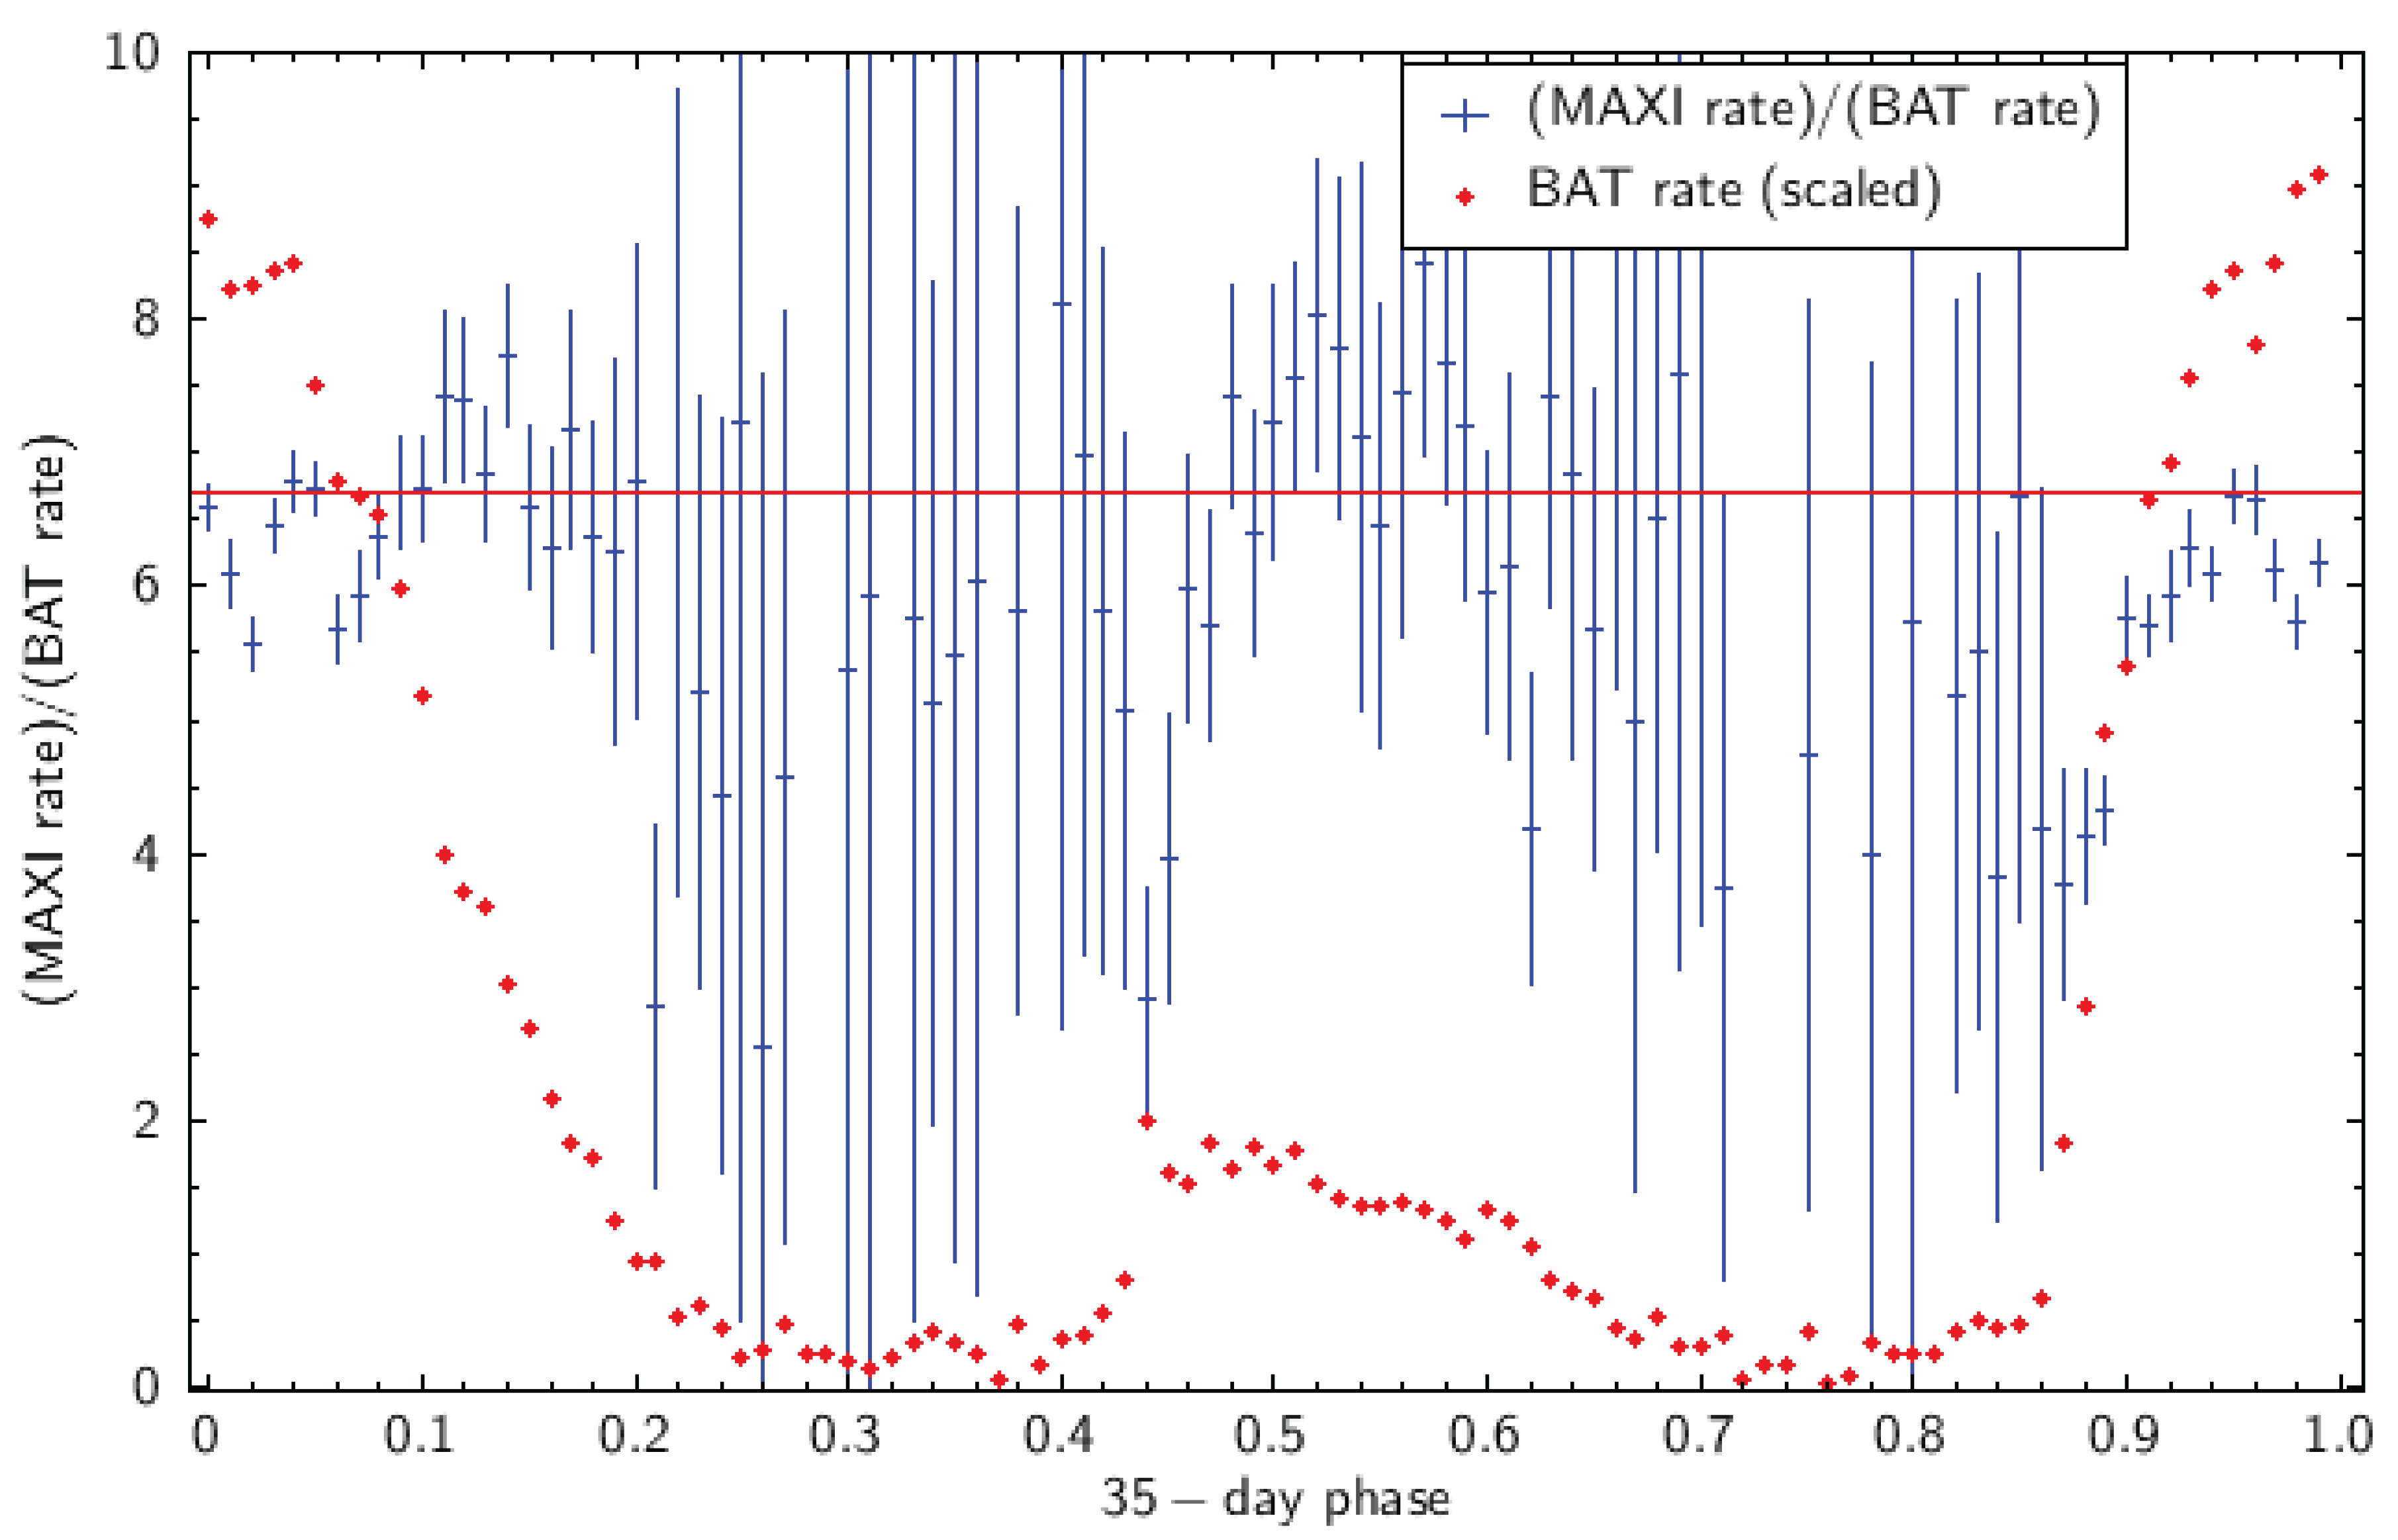
Figure 3.
The inner and boundaries of the disk and corona. The top panel shows the observer view at 35-day phase 0; the observer is situated at 5 degrees above the orbital plane. The bottom panel shows the top view from perpendicular to the orbital plane. The inner and outer boundaries of the corona are the small and large blue spheres; the inner disk boundary is the white cylinder, the top and outer disk boundaries are shown by the pink to brown to yellow colored rings. The corona has a powerlaw density distribution; each disk ring has a Gaussian density distribution.
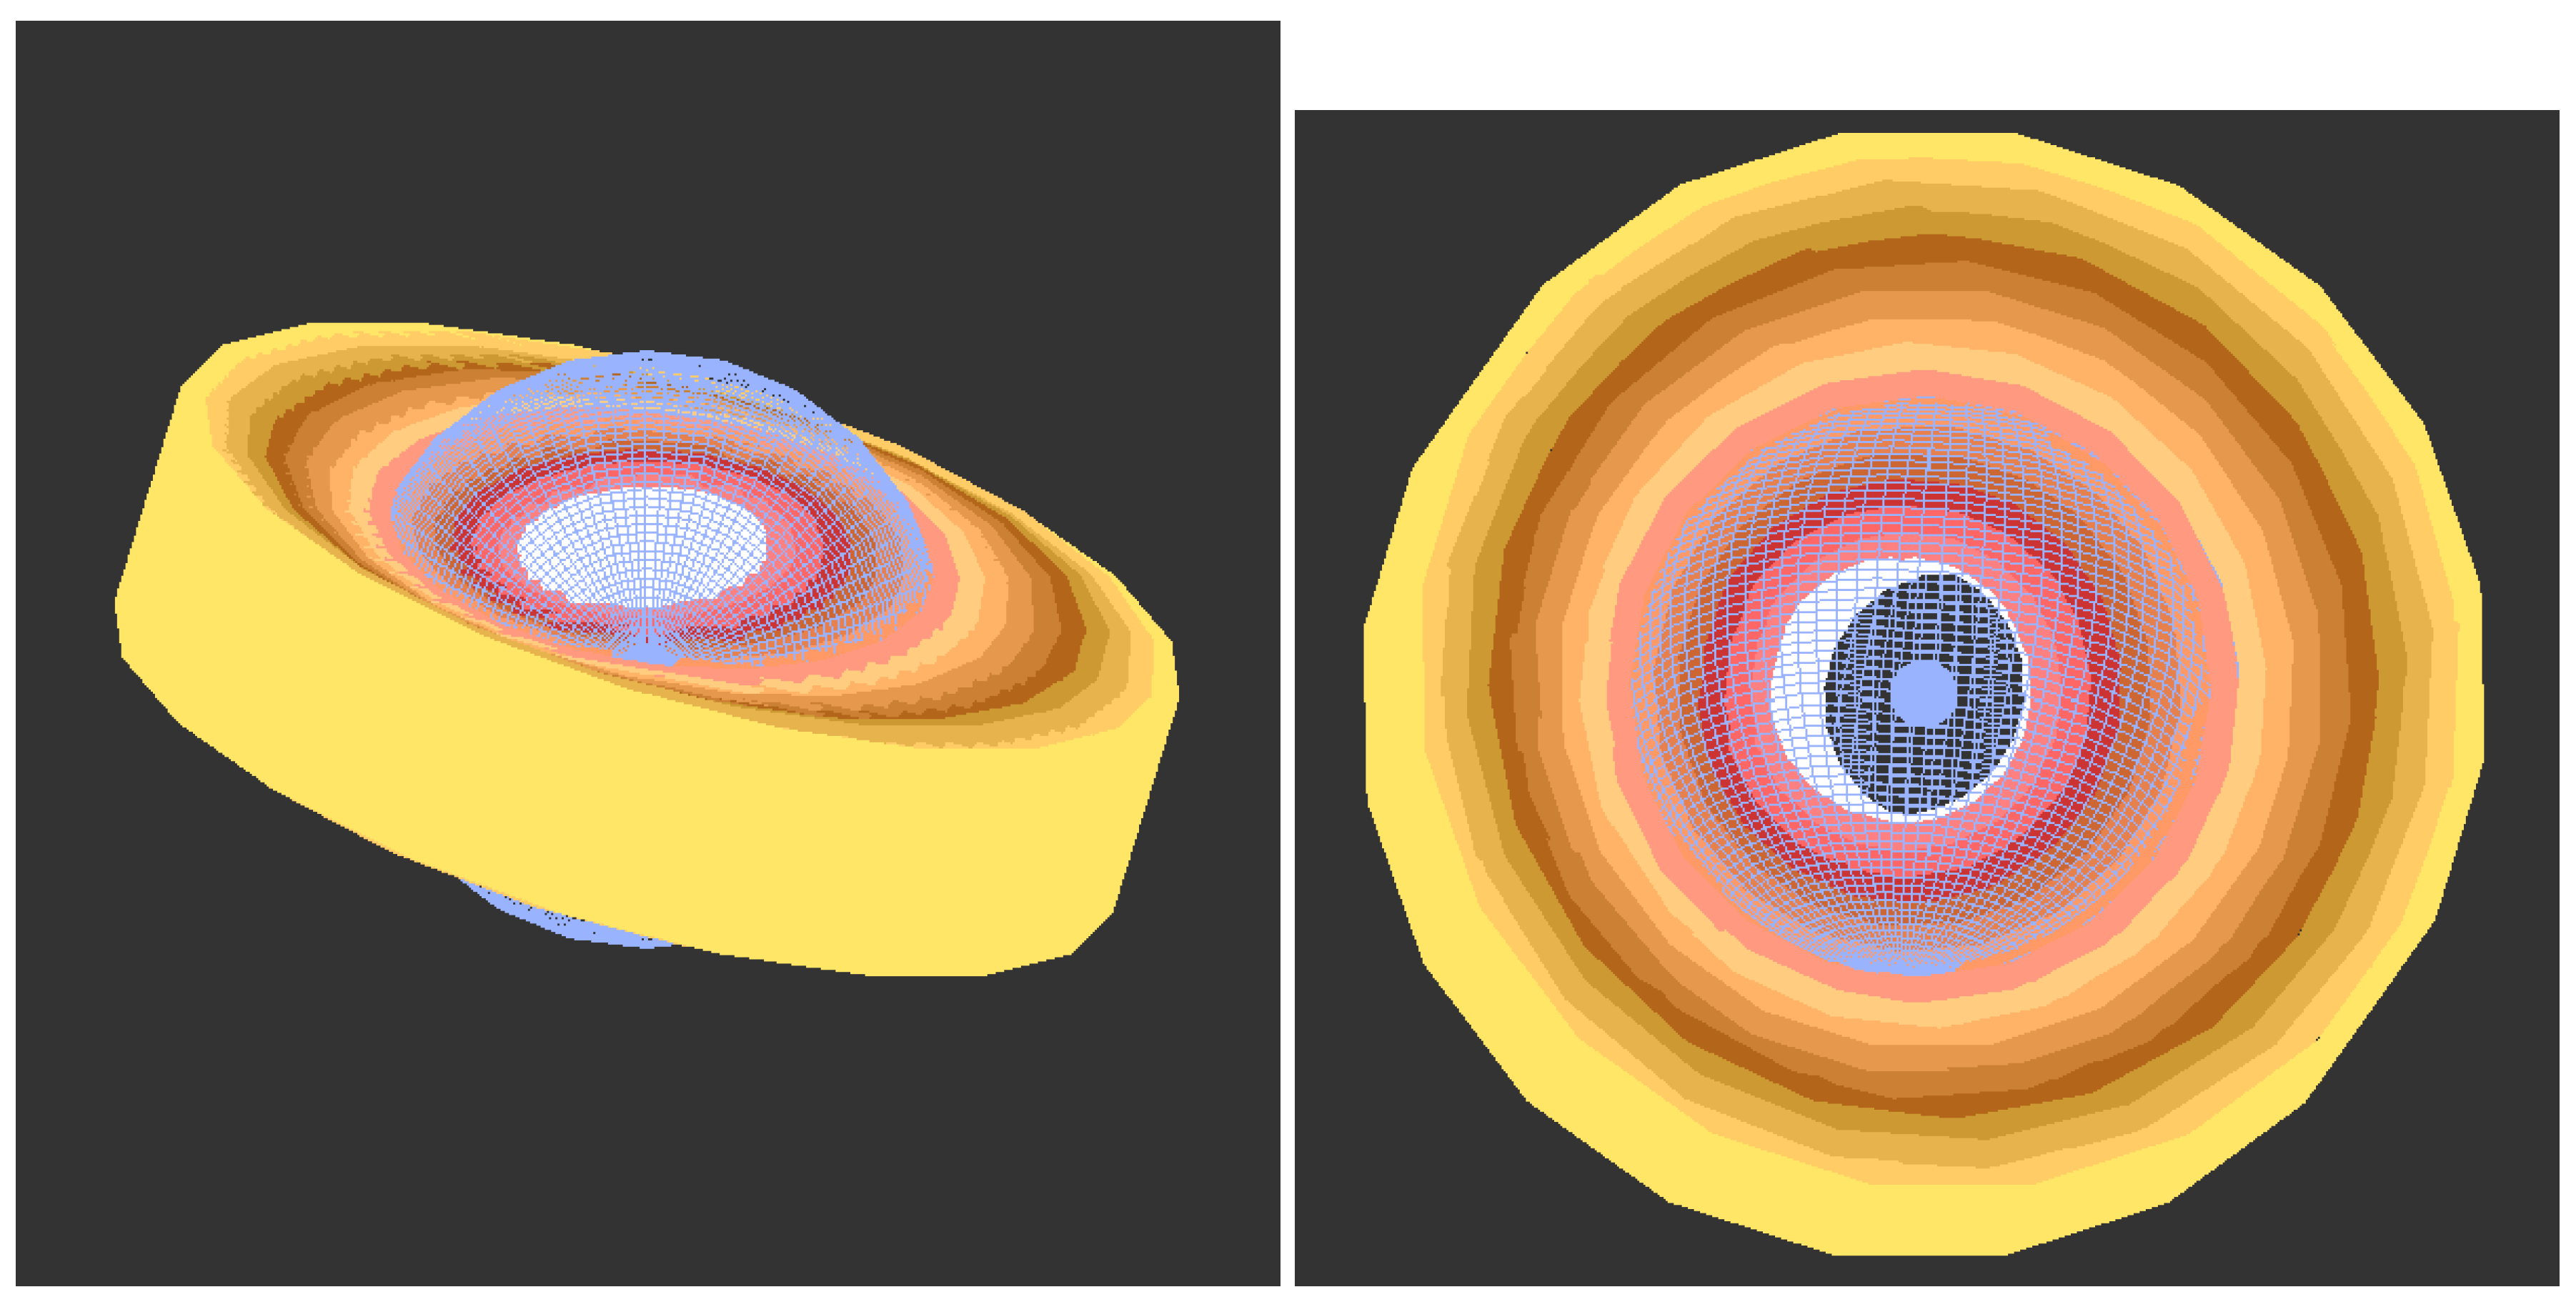
Figure 4.
Images of the scattered radiation from the corona at three 35-day phases: 0.0 (peak of main high), 0.35 (middle of first low state) and 0.52 (peak of short high). The sizes of the images are the same- just larger than the outer boundary of the corona. Each image is scaled logarithmically in brightness with maximum at the brightest pixel, so that the outer corona is seen more clearly during the low states when the bright region of the corona is blocked most by the disk.

Figure 5.
The best-fit model light-curves compared to the 35-day observed lightcurves. The blue line is the total model and the magenta and cyan lines are the absorbed and scattered components. The top panel shows the model and the BAT data; the bottom panel shows the model and the MAXI data.
Figure 5.
The best-fit model light-curves compared to the 35-day observed lightcurves. The blue line is the total model and the magenta and cyan lines are the absorbed and scattered components. The top panel shows the model and the BAT data; the bottom panel shows the model and the MAXI data.
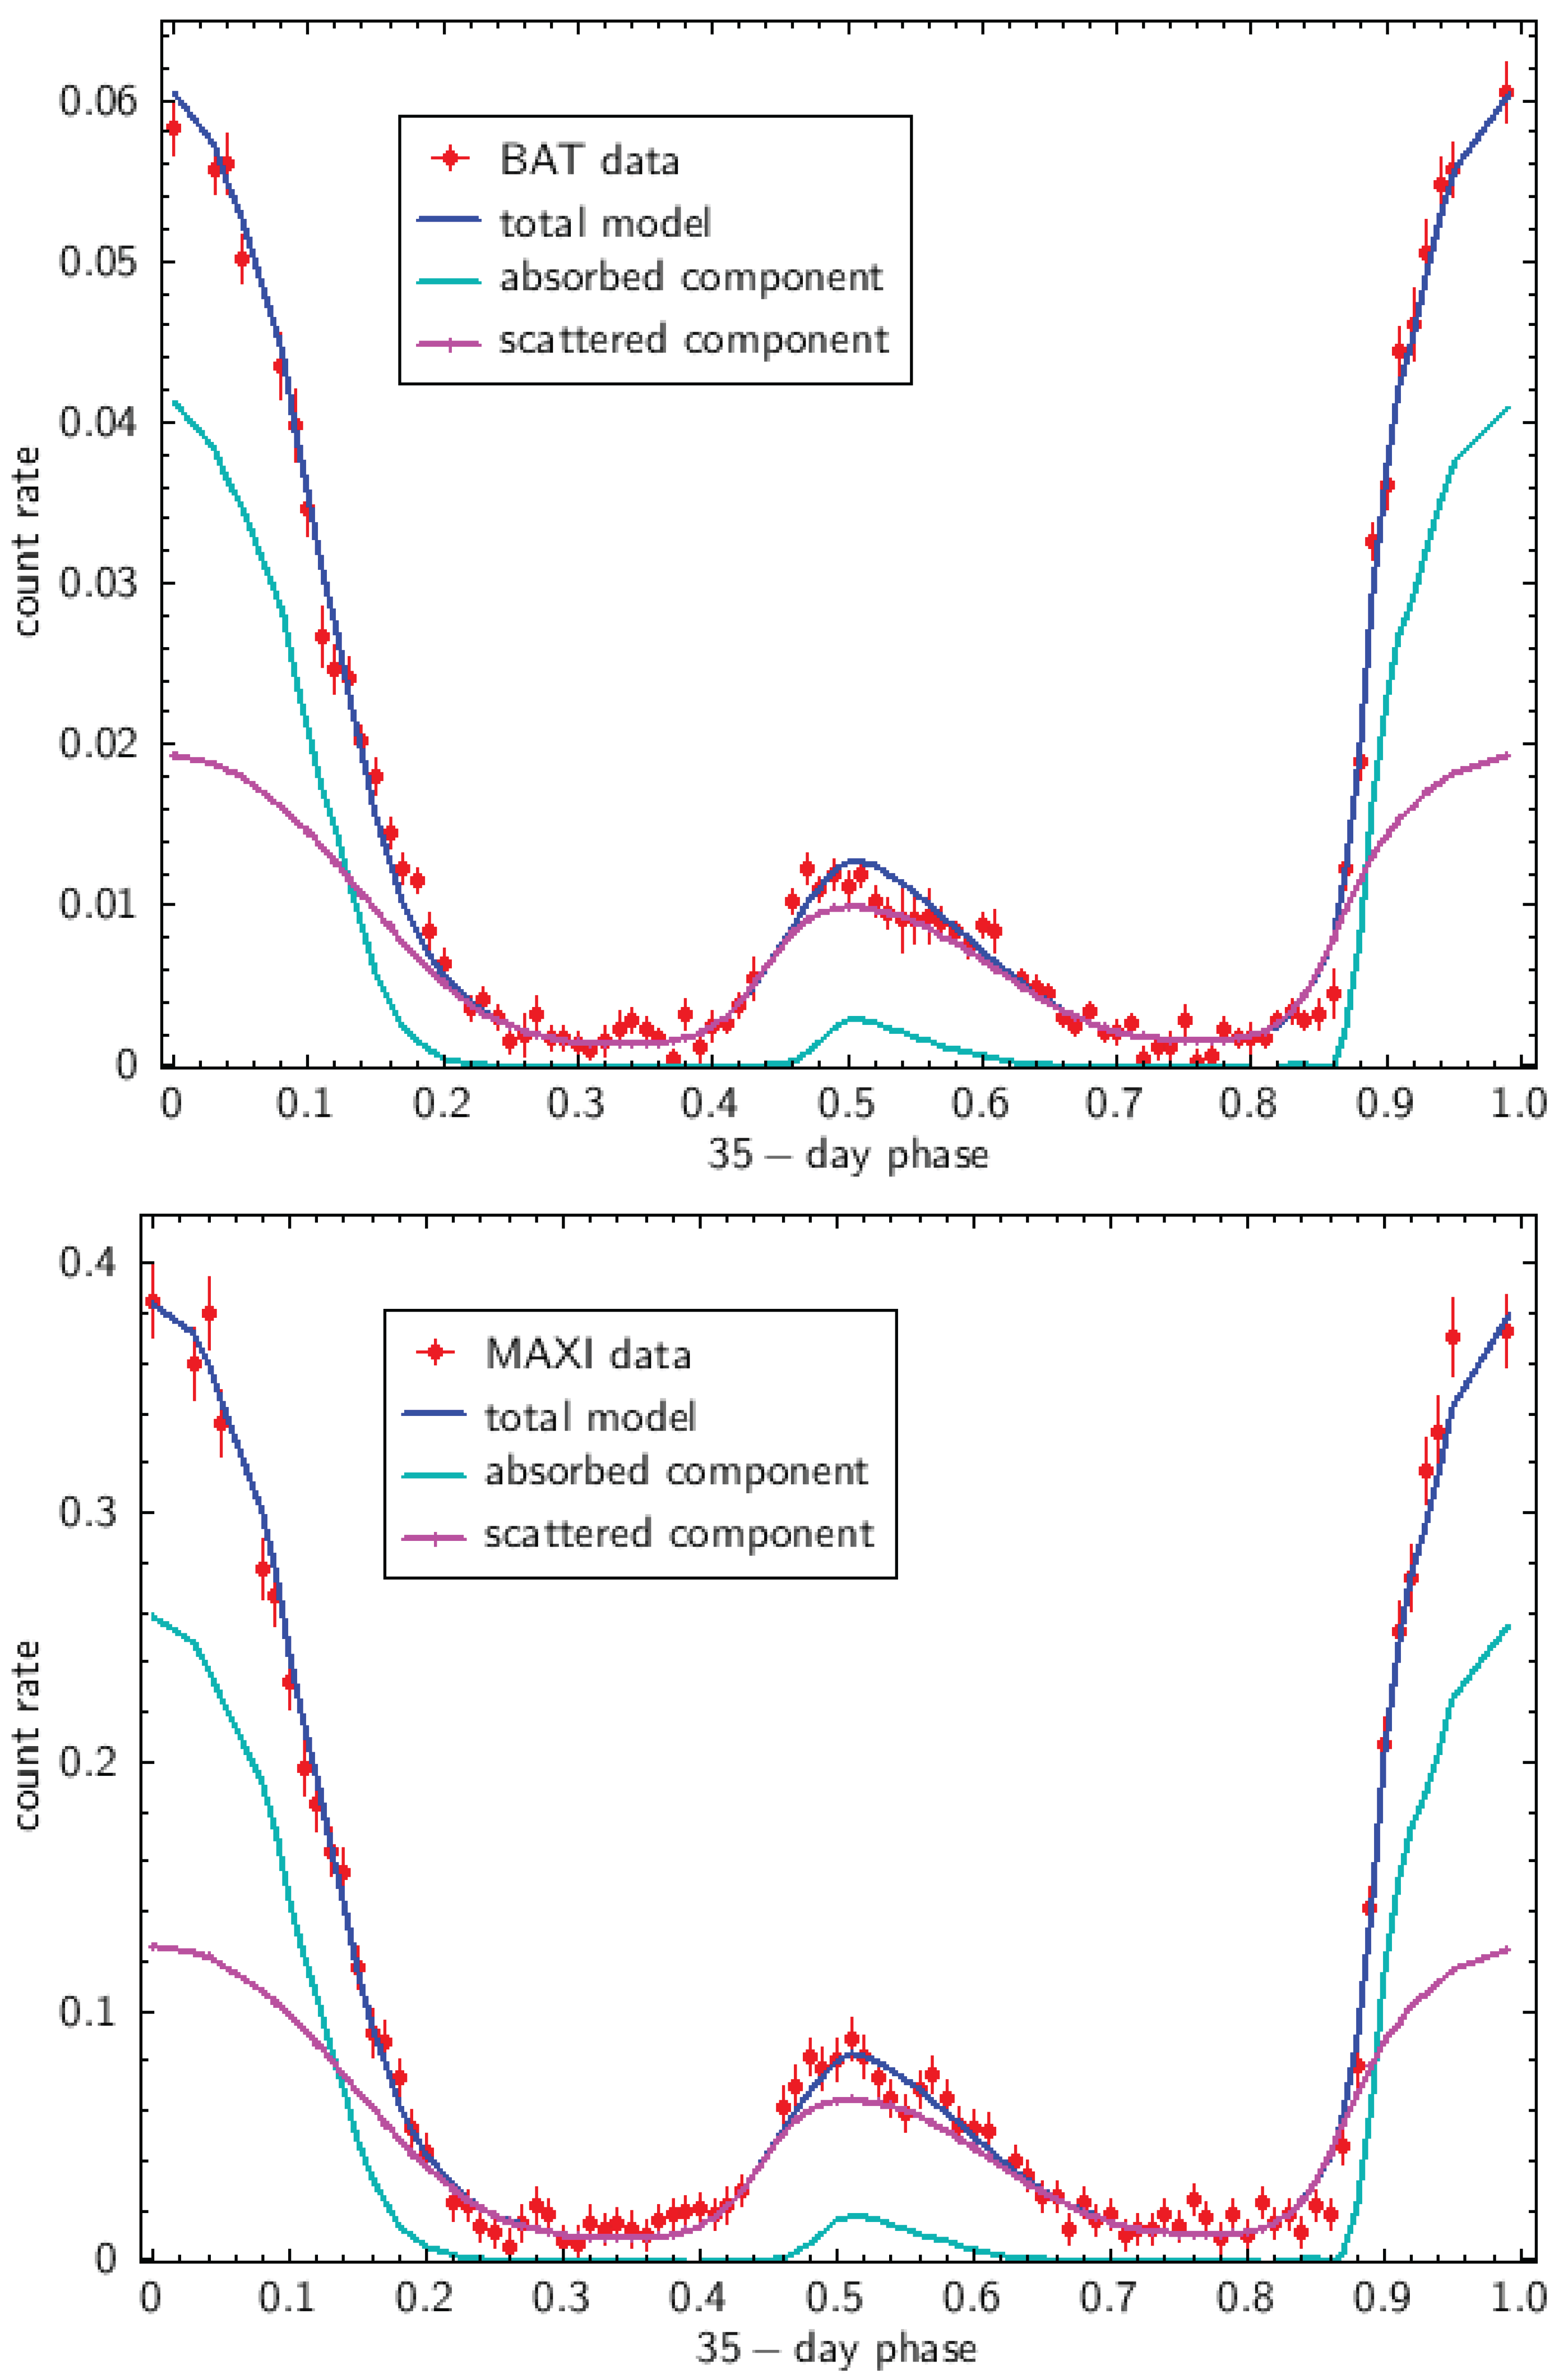
Figure 6.
The residuals between the BAT data and MAXI best-fit model (blue points) and the residuals between the MAXI data and best-fit MAXI model (blue points).
Figure 6.
The residuals between the BAT data and MAXI best-fit model (blue points) and the residuals between the MAXI data and best-fit MAXI model (blue points).
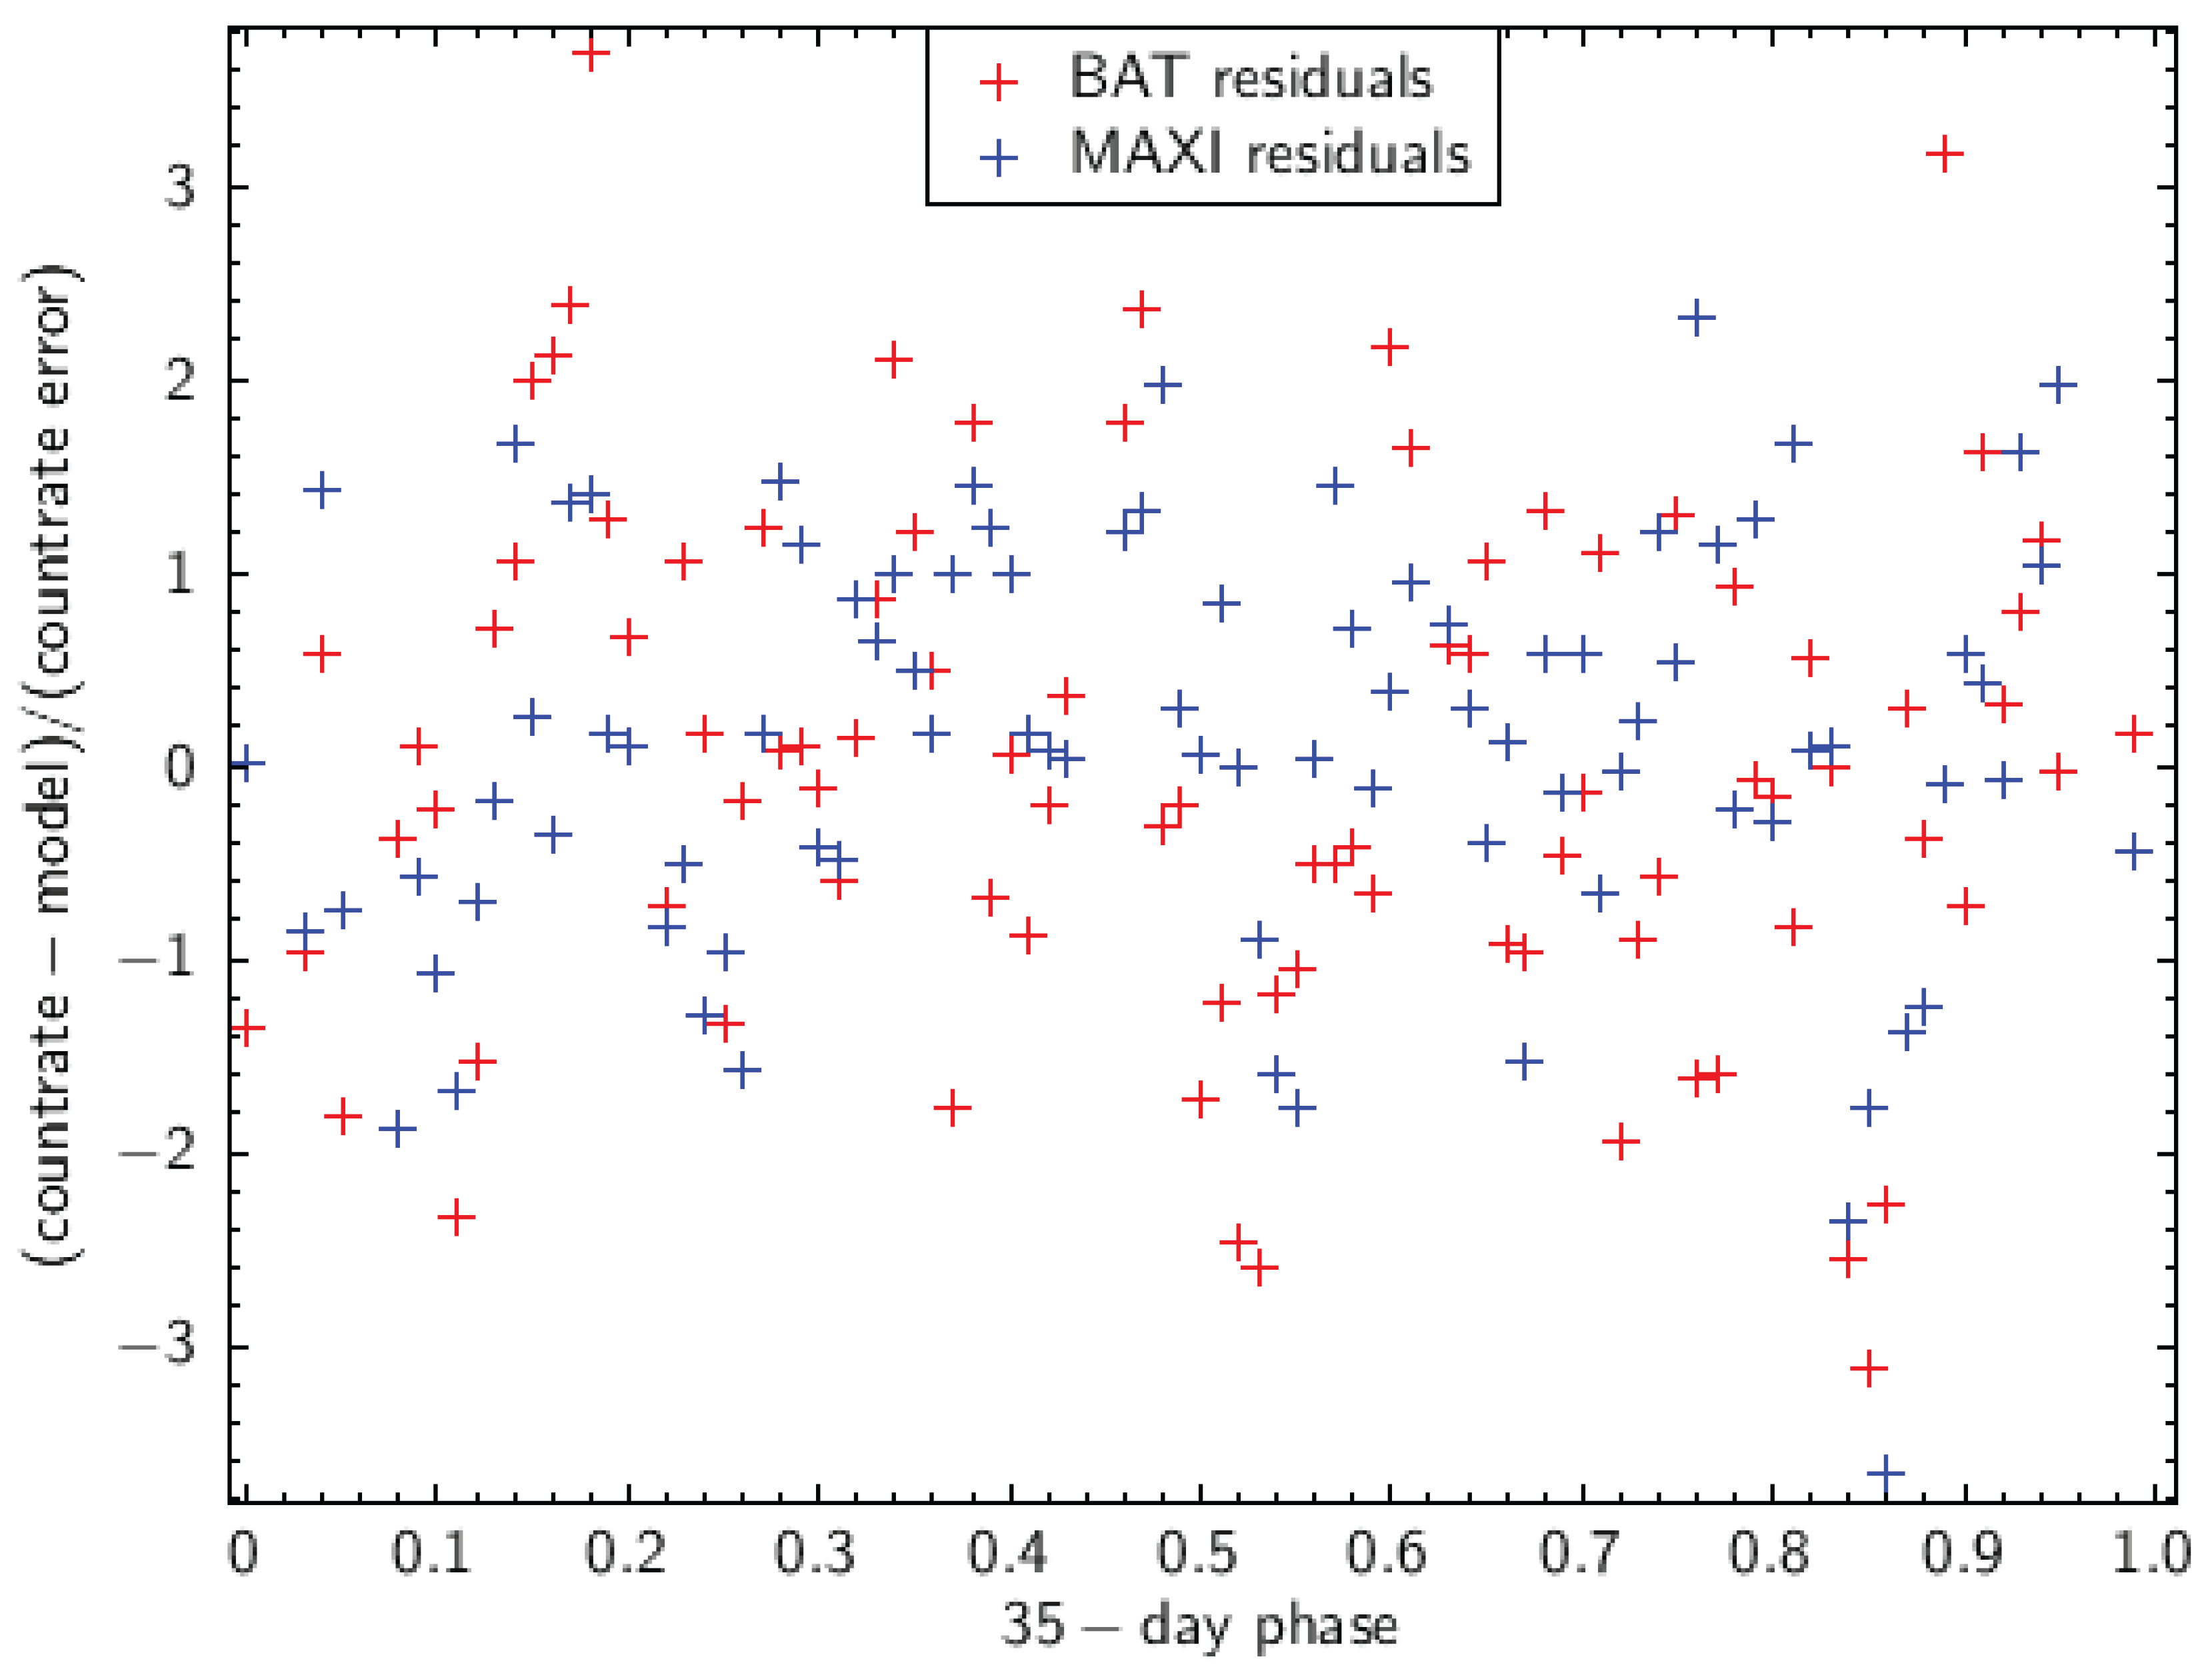

Table 1.
Disk with Corona Model: Best Fit Parameters and Uncertainties.
| Fixed parameters | Value | |
|---|---|---|
| Disk Inner Radius (km) | ||
| Disk Outer Radius (km) | ||
| Inner Twist (degrees) | 75.5 | |
| Corona Outer Radius (km) | ||
| Variable parameters (geometry) | Value | 1-error |
| BAT Inclination (Degrees) | 85.17 | 0.15 |
| MAXI Inclination (Degrees) | 85.07 | 0.19 |
| BAT Inner Tilt (degrees) | 22.5 | 0.7 |
| MAXI Inner Tilt (degrees) | 24.0 | 1.0 |
| BAT Outer Tilt (degrees) | 17 | 3 |
| MAXI Outer Tilt (degrees) | 24 | 4 |
| BAT Outer Twist (degrees) | 22 | 4 |
| MAXI Outer Twist (degrees) | 22 | 4 |
| BAT | 0.26 | 0.05 |
| MAXI | 0.23 | 0.06 |
| Variable parameters (other) | ||
| BAT Disk Density () | ||
| MAXI Disk Density () | ||
| BAT Inner Scale Height (rad) | 0.06 | |
| MAXI Inner Scale Height (rad) | 0.08 | |
| BAT Outer Scale Height (rad) | 0.018 | |
| MAXI Outer Scale Height (rad) | 0.100 | 0.023 |
| BAT Corona Powerlaw Index | -0.6 | 0.5 |
| MAXI Corona Powerlaw Index | -1.3 | 0.6 |
| BAT Disk Phase Shift (35-day phase) | 0.211 | 0.006 |
| MAXI Disk Phase Shift (35-day phase) | 0.205 | 0.007 |
| Goodness of fit | ||
| BAT | 160 | |
| MAXI | 105 |
Disclaimer/Publisher’s Note: The statements, opinions and data contained in all publications are solely those of the individual author(s) and contributor(s) and not of MDPI and/or the editor(s). MDPI and/or the editor(s) disclaim responsibility for any injury to people or property resulting from any ideas, methods, instructions or products referred to in the content. |
© 2025 by the authors. Licensee MDPI, Basel, Switzerland. This article is an open access article distributed under the terms and conditions of the Creative Commons Attribution (CC BY) license (http://creativecommons.org/licenses/by/4.0/).
Copyright: This open access article is published under a Creative Commons CC BY 4.0 license, which permit the free download, distribution, and reuse, provided that the author and preprint are cited in any reuse.


