
Submitted:
28 October 2025
Posted:
30 October 2025
You are already at the latest version
Abstract
This study is primarily devoted to investigating the effect of aerosols on solar UV radiation. In the ultraviolet range, scattering processes are dominant and lead to a substantial contribution of diffuse UV radiation to the global UV irradiance. The paper introduces a method for estimating solar UV radiation through the UV Index. The proposed technique is first compared with other UV Index estimation methods and subsequently applied to examine the influence of aerosols and ozone on solar UV radiation and on its diffuse component. The exposure of human skin also to diffuse solar UV radiation can be potentially harmful for health.
Keywords:
ultraviolet radiation
; global UV Index
; diffuse UV Index
; aerosols
; spectral model
; erythemal action spectrum function
1. Introduction
Ultraviolet (UV) radiation from the Sun accounts for less than 9% of the total solar energy outside Earth’s atmosphere, and most of it is absorbed before reaching the surface [1]. Nevertheless, the small fraction of UV radiation that does reach the ground has significant effects on human health and biological systems. Solar UV radiation is classified into three sub-bands: UV-C (100–280 nm), UV-B (280–315 nm) and UV-A (315–400 nm). The UV-C sub-band, which contains the most energetic and potentially harmful UV radiation, is entirely absorbed by the atmosphere, primarily by ozone [2]. Most of the UV-B radiation is also absorbed by the atmosphere; however, a small and variable fraction still reaches the Earth’s surface. This component poses potential risks to human health, contributing to premature skin aging and substantially increasing the likelihood of skin cancer [3]. Moreover, prolonged cumulative exposure to environmental UV-B radiation accelerates the breakdown of eye proteins and can ultimately lead to the development of cataracts [4]. UV-A is the least energetic UV sub-band, comprising roughly 95% of the UV radiation reaching the Earth’s surface, as it is only weakly absorbed by a clear atmosphere. It penetrates the skin, contributing to tanning and the aging of the skin.
The impact of UV radiation on human skin is most accurately assessed by considering the erythemal action function, which essentially specifies the fraction of incident UV spectral irradiance absorbed by the skin at each wavelength. The UV Index is the UV irradiance weighted by the erythemal action spectrum and multiplied by 40 m²/W. It is the most widely used measure for informing the public about the potential risks of exposure to solar radiation [5]. Although monitoring the UV Index is important, direct measurements remain limited. Commercial instruments exist but require frequent calibration, and most meteorological stations do not routinely record this parameter [6]. Consequently, real-time UV Index data are typically obtained from satellite-based estimates, providing global coverage but only approximate local conditions. For example, [7] compare ground-based UV Index measurements at solar noon from three different locations in France with corresponding values derived from OMI/Aura. Given the lack of direct UV radiation measurements, there is a growing interest in developing UV irradiance models that use global horizontal irradiance, optical atmospheric mass, and ozone concentration as parameters input [8].
This study addresses the topic of diffuse UV radiation. Solar UV radiation is strongly affected by scattering processes in the atmosphere. As a result, its diffuse component—radiation originating from directions outside the solar disk—often plays a dominant role at the surface compared to the direct component, which comes directly from the solar disk [9]. In the visible spectrum, under clear-sky conditions, solar radiation is often dominated by its direct component, with the diffuse component having much lower intensity. In the UV band, however, the situation is often reversed: diffuse UV irradiance can account for at least 50% of the total UV irradiance on a horizontal surface [10]. This means that a high UV Index can be reached even in shaded areas. The health risks associated with diffuse solar UV radiation (for example, in the shade under a beach umbrella) are often underestimated, as this radiation is invisible to the human eye.
The attenuation of solar radiation in the atmosphere is governed primarily by absorption and scattering. Scattering occurs on air molecules (Rayleigh scattering) and on aerosol particles. With over two-thirds of Earth’s surface covered by oceans, marine aerosols—primarily sea salt solution particles generated by oceanic phytoplankton—constitute the dominant aerosol type globally. Windblown dust from desert regions is the principal source of continental aerosols [11]. In recent decades, the relative contribution of urban aerosols has been steadily increasing, driven by industrial processes, transportation, and other anthropogenic activities.
The objectives of this study are to (i) theoretically assess the contribution of diffuse UV radiation to global UV levels, (ii) develop a method for evaluating the UV Index, (iii) investigate how aerosol type and concentration influence the UV Index, with particular emphasis on diffuse components, and (iv) validate the theoretical findings against measurements from six different locations around the world.
2. Diffuse UV Radiation in the Solar Spectrum
In this paragraph, the components of the solar spectral irradiance at ground level will be calculated using a spectral model, and then the UV-domain irradiance components will be quantified through the UV Index components.
The UV index is a basic indicator of the risk of exposure to solar radiation. It is defined as the solar erythemal irradiance (which considers the erythemal action spectrum as a weighted function of the solar UV irradiance) multiplied by 40 m2/W, in order to have values from 0 to 20.
is the erythemal action spectrum [5], a function of wavelength defined by:
The solar spectral irradiance will be calculated using a spectral model.
The model used is the Leckner spectral model [12], which estimates the three components of solar spectral irradiance at ground level under clear-sky conditions: direct, diffuse, and global. The Leckner model accounts for five attenuation factors affecting solar radiation as it passes through the Earth’s atmosphere: ozone absorption, water vapor absorption, absorption by the mixed gases, Rayleigh scattering, and aerosol scattering. Corresponding to each attenuation factor, a specific atmospheric transmittance is defined.
The transmittance due to ozone absorption is defined by
where λ the wavelength, the ozone absorption coefficients [12], l the total column ozone content and m the optical atmospheric mass.
The transmittance associated with water vapor absorption is given by
where denotes the water vapor absorption coefficients [12] and w is the total column water vapor content.
The transmittance associated with mixed gases absorption is given by
where is the absorption coefficients associated with mixed gases [12].
The transmittance associated with Rayleigh scattering is given by
where p is the atmospheric pressure and the normal atmospheric pressure. is a continuous function of wavelength.
The transmittance associated with aerosols attenuation is given by
Here, α is the Ångström exponent, and β is the turbidity coefficient; together, they define the properties of aerosols content in the atmosphere. The Ångström exponent is a measure of aerosol particle size [13] and the turbidity coefficient is proportional to the aerosol’s concentration. The function is also continuous function of wavelength.
The Leckner model calculates the direct normal solar spectral irradiance at ground level by applying the product of the transmittances to the solar spectral irradiance at the top of the atmosphere :
The diffuse irradiance is evaluated as:
In this equation γ is the downward fraction of the scattered radiation and is the zenith angle.
Finally, the global solar spectral irradiance on a horizontal surface is obtained by summing the horizontal projection of the direct normal component and the diffuse component:
The spectral model described allows the calculation of any UV solar spectral irradiance necessary for the assessment of the UV Index. The spectral irradiance in Equation (1) may represent any of the UV components—direct, diffuse, or global—and, correspondingly, the direct UV Index, diffuse UV Index, or global UV Index will be evaluated.
The diffuse component of solar radiation in the ultraviolet range is considerably more important than in the visible and infrared domains. This is due to the dominance of scattering processes in the ultraviolet range. It is well known that Rayleigh scattering is more pronounced at shorter wavelengths, and therefore in the ultraviolet range [14]. Moreover, the scattering of solar radiation by aerosol particles is enhanced in the ultraviolet, as illustrated in Figure 1. This figure is dedicated to the function that defines the attenuation of solar radiation due to scattering by aerosols. The spectral transmittance due to aerosol scattering defined by Equation (7), is represented for various parameter combinations (the Ångström turbidity coefficient (β), Ångström exponent (α)) describing the properties of atmospheric aerosols. The two groups of three curves correspond to distinct turbidity conditions: a low turbidity value (), characteristic of a clean atmosphere, and a high turbidity value (), associated with an enhanced aerosol load in the atmospheric column. In both groups, lower transmittance is observed in the left side of the figure, indicative of enhanced scattering in the ultraviolet range. Each group consists of three curves: one for coarse aerosols (α = 0.3), one for mixed aerosols (α = 0.9), and one for fine aerosols (α = 1.5). In both groups the scattering is particularly pronounced for fine aerosols (), such as those of urban-industrial origin. The wavelength of represents a turning point, with fine aerosols contributing predominantly to scattering at shorter wavelengths, while coarse aerosols dominate scattering at longer wavelengths. Both Rayleigh scattering and aerosol scattering are significant in the ultraviolet range, resulting in a substantial contribution of diffuse spectral irradiance to the global irradiance in this domain. Therefore, it is essential to characterize the global UV Index, and especially the diffuse component, in relation to atmospheric aerosol content.
3. Data and Methods
The UV Index can be calculated using Equation (1) with the Leckner spectral model, where atmospheric parameters may be obtained, for example, from the AERONET network [15]. Prior to applying this UV Index calculation method, the results of the method will be compared with established estimates from TEMIS and OMI.
The Tropospheric Emission Monitoring Internet Service (TEMIS), developed by KNMI within an ESA project, has provided ultraviolet (UV) radiation products since 2003 through its web portal [16]. The data are generated in near-real time on a 0.5° × 0.5° grid from satellite observations of global ozone, supplemented over Europe with cloud information. The erythemal UV Index (UVI) is derived following the International Commission on Illumination (CIE) action spectrum for erythema [5] and represents clear-sky conditions at local solar noon. One UVI unit corresponds to 25 mW m⁻². In addition, TEMIS provides daily forecasts of ozone and UVI up to eight days in advance.
The Ozone Monitoring Instrument (OMI) is a nadir-viewing UV–VIS imaging spectrograph aboard NASA’s Aura satellite, launched in July 2004 as part of the Earth Observing System. Operating in the 264–504 nm spectral range with a resolution of 0.42–0.63 nm, OMI provides daily global coverage through a 2600 km swath and a nominal ground footprint of 13 × 24 km² at nadir. Among its Level 3 products, the erythemal UV Index (UVI) at local solar noon [17] is available as the OMUVBd dataset, distributed via NASA GES DISC [18].
Using the proposed UV Index calculation method, the noon UV index in July 2023 was computed for two locations: Boulder (United States) and Hohenpeissenberg (Germany). For the same locations and period, UV Index data were also extracted from the TEMIS and OMI databases. The three datasets for both locations are presented in Figure 2.
A visual comparison of the two figures indicates that the three calculation methods produce reasonably consistent UV Index values, supporting the validity of the proposed approach. Moreover, the results obtained with the proposed method appear to be more closely aligned with those derived from TEMIS.
4. Results and Discussion
The UV Index calculation method, based on the Leckner spectral model, will be applied on two levels: (1) a theoretical study addressing the contribution of diffuse UV radiation to global UV radiation as influenced by atmospheric aerosol content, and (2) an applied study using real atmospheric data from locations characterized by significant or distinctive aerosol loads.
The global UV Index is calculated using Equation (1), which incorporates the spectral global irradiance from the Leckner model. This represents the UV Index communicated to the public as a means of warning about potential health risks. If, instead, the diffuse irradiance from the Leckner model is used in Equation (1), the diffuse UV Index can be derived.
Under clear-sky conditions, global UV radiation and diffuse UV radiation are strongly affected by variations in atmospheric composition, primarily driven by changes in ozone concentration and in the amount and type of aerosols. To investigate the influence of ozone and aerosols on ultraviolet radiation, a reference atmosphere was prescribed by constraining specific parameters. The optical atmospheric mass was fixed at , corresponding to a moderate solar zenith angle, while the columnar water vapor content was set to . For the present analysis, Julian day J = 172 was selected as a representative summer day. These fixed values provide a controlled framework that isolates the effects of ozone and aerosols, minimizing the variability introduced by other atmospheric constituents. The variation range for the total column ozone was set to 0.2–0.5 cm·atm. In Figure 3a, a low turbidity value was chosen (), representative of a relatively clean atmospheric state. Calculations of the global and diffuse UV Index were performed for two distinct atmospheric scenarios: one characterized by coarse aerosols () and the other by fine aerosols (). Compared to coarse aerosols, the presence of fine aerosols in the atmosphere reduces the global UV Index while increasing the relative contribution of the diffuse component. In Figure 3b, with higher atmospheric turbidity (), the diffuse component dominates, especially in the case fine aerosols. With respect to atmospheric ozone content, an increase in ozone concentration leads to a reduction in both global and diffuse components of UV Index.
A study on the effect of ozone layer thickness and aerosols on the global and diffuse UV Index was reported for Livorno, Italy, on June 21, 2015 [9]. The aerosols in this location are predominantly marine. Although the optical atmospheric masses considered in the study are different (namely 1 and 2), the results obtained are not in contradiction with those described in this paragraph.
The theoretical curves in Figure 3 show that high concentrations of fine aerosols can reduce the global UV Index while substantially increasing the relative contribution of the diffuse UV Index component. A look at Figure 1 recalls that fine aerosols enhance scattering in the UV range, which leads to a high proportion of diffuse radiation within the global radiation in this domain.
To validate these conclusions, measurements obtained in July 2023 from six geographically diverse locations worldwide were analyzed. The sites and their geographical coordinates are presented in Table 1, which also includes statistical information on atmospheric parameters characterizing aerosol type and concentration. All data were retrieved from the AERONET network [15]. In addition to the aerosol parameters, the remaining atmospheric inputs required for the computation of spectral irradiances using the Leckner model were retrieved from AERONET, namely the total ozone content (l), the total water vapor (w), and the optical atmospheric mass, derived from the solar zenith angle.
Here, we summarize the characteristics of pollution levels and specific features of atmospheric aerosols in the six locations under consideration. In Bandung, Indonesia, air pollution primarily stems from vehicular emissions, releasing CO, NO₂, and fine particulates (PM₂.₅, PM₁₀), as well as industrial activities emitting SO₂ and other aerosols. The city’s basin-like topography and limited green spaces hinder pollutant dispersion, leading to pollutant accumulation [19]. In Chicago, USA, Ref. [20] report a notable increase in pollution: the number of days with PM₂.₅ levels exceeding 35 µg/m³—considered unhealthy—rose from 0 to 11 per year, while days with detectable smoke increased by 81% between 2019 and 2023. In Lecce, Italy, variations in PM₁₀ concentrations reflect the combined effects of urban morphology and atmospheric circulation [21]. In New York State, USA, Ref. [22] investigated the short-term effects of PM₂.₅ on hospitalizations for cardiovascular diseases, considering seasonal and temperature-related modifications and potential heterogeneity across regions. In Seoul, South Korea, transboundary air pollutants originating from China contribute approximately 19% to the weekly average PM₁₀ concentrations, with seasonal variations ranging from 12% to 30% [23] (Kim, 2019). Finally, in Timișoara, Romania, Ref. [24] monitored air quality over four days in August 2024, both outdoors and within a central park. Fine (PM₂.₅) and coarse (PM₁₀) particulate matter were among the parameters measured, with PM₂.₅ concentrations exceeding the allowable limit of 15 µg/m³ on certain days, even within the park interior.
Figure 4 illustrates the global UV Index, diffuse UV Index, and their difference, as estimated by the proposed method using atmospheric parameters from AERONET for the stations listed in Table 1. The variables are arranged in columns, with each row representing a different location. The contour plots of the UV Index components prove the variations in relation to the aerosol parameters, specifically the Ångström exponent (α) and the turbidity coefficient (β).
It can be observed that fine aerosols with an Ångström exponent greater than 1.2 are present at all six locations. In Chicago and New York, coarse aerosols with an Ångström exponent below 0.6 are not present. Notably, in the first two columns showing global and diffuse UV Index, the right-hand side of the plots displays similar colors, indicating that the diffuse component contributes significantly to the global UV Index. This pattern is also reflected in the third column, where the differences between the two UV Index components are minimal, particularly on the right-hand side of the plots.
The high contribution of diffuse UV Index to the global UV Index, particularly in the presence of fine aerosols, appears to be confirmed in the presented case studies. To highlight this aspect, Figure 5 shows contour plots of the diffuse UV Index expressed as a percentage of the global UV Index for the same six locations.
In Figure 5a,b, corresponding to Bandung and Chicago, intense yellow (100%) appears predominantly in regions associated with fine aerosols, where turbidity is also relatively high. In these two locations, the percentage of the diffuse UV Index within the global UV Index ranges from 57% to 100%. In Figure 5c,e, corresponding to Lecce and Seoul, intense yellow appears in regions of fine and mixed aerosols only where turbidity is high, while areas with fine aerosols but low turbidity are orange (~80%). This indicates that fine aerosols require high turbidity to effectively suppress the direct UV Index component. In the Asian city of Seoul, the percentage of the diffuse UV Index within the global UV Index is the highest among the six locations analyzed; the minimum value is 58.3%, the maximum 99.9%, and, more importantly, the mean value is 87.7%. In New York, the lowest mean percentage of the diffuse UV Index is recorded, the only one below 80%, namely 78.2%. In Figure 5f, the yellow color appears in regions with a very high Ångström exponent, corresponding to fine aerosols, or in regions with high turbidity and a medium Ångström exponent. The yellow patches present in areas other than those corresponding to high Ångström exponent values and/or high turbidity may result from the contributions of other atmospheric parameters. For example, a high water vapor content affects the asymmetry factor, which in turn influences the fraction of scattered radiation reaching the surface [25]. Across all studied locations, even the lowest values of the diffuse UV Index percentage remain above 53%, highlighting the consistently significant role of diffuse radiation.
5. Conclusions
This study focuses on the impact of aerosols on the contribution of the diffuse UV component to the global UV radiation. The UV Index, a quantity familiar to the general public, is used to quantify the UV radiation components. The approach proposed in this study for computing the global and diffuse UV Index is founded on the Leckner spectral model. This model provides the theoretical framework for estimating global and diffuse solar spectral irradiance. For model implementation, the required atmospheric parameters (the optical atmospheric mass, the total column ozone content, the total column water vapor content, the Ångström exponent, and the turbidity coefficient) were derived from the AERONET (Aerosol Robotic Network).
The Leckner spectral model characterizes the two fundamental atmospheric scattering processes of solar radiation—Rayleigh scattering and aerosol (Mie) scattering—by means of two continuous functions that depend on the wavelength of the incident solar radiation. An analysis of these functions indicates that the scattering processes of solar radiation are most pronounced within the ultraviolet region of the spectrum. In particular, the extent of aerosol scattering is highly sensitive to both the aerosol type and their atmospheric concentration. The central thesis of this study is that diffuse UV radiation constitutes the dominant component of global UV radiation (a minimum of 53% in all six locations analyzed), a dominance that is further enhanced by the type and concentration of aerosols present in the atmosphere. This thesis is theoretically supported through the estimation of global and diffuse UV Index values in prescribed atmospheric conditions, defined by fixed optical atmospheric mass and water vapor content. The proportion of diffuse UV Index within the global UV Index becomes more pronounced with increasing ozone content, decreasing aerosol particle size (indicated by a higher Ångström exponent), and elevated atmospheric turbidity.
The theoretical findings of this study were validated using measured data obtained from the AERONET network for six locations: Bandung, Chicago, Lecce, New York, Seoul, and Timișoara. All graphs derived from measured data at the aforementioned locations, illustrating the diffuse and global components of the UV Index and the relative contribution of diffuse UV to the global UV Index, corroborate the theoretical thesis proposed in this study.
Author Contributions
Conceptualization, Eugenia Paulescu; Data curation, George Știrban; Investigation, George Știrban and Eugenia Paulescu; Methodology, George Știrban and Eugenia Paulescu; Software, George Știrban; Validation, Eugenia Paulescu; Writing – original draft, Eugenia Paulescu.
Funding Information: This research received no external funding.
Data Availability Statement
The datasets supporting the results of this article will be made available by the authors on request.
Conflicts of Interest
The author declares no conflict of interest.
References
- Iqbal, M. An Introduction to Solar Radiation; Academic Press, 1983. [Google Scholar]
- Laguarda, A.; Abal, G. UV Index from Global Solar Irradiance: Performance according to cloudiness and air mass. Air Qual Atmos Health 2025. [Google Scholar] [CrossRef]
- Tang, X.; Yang, T.; Yu, D.; Xiong, H.; Zhang, S. Current insights and future perspectives of ultraviolet radiation (UV) exposure: Friends and foes to the skin and beyond the skin. Environ. Int 2024, 185, 108535. [Google Scholar] [CrossRef] [PubMed]
- Guo, C.; Guo, Y.; Zhang, J.; Wang, J.; Su, L.; Ning, X.; Chen, X.; Yan, H. Grx2 maintains GSH/GSSG homeostasis to enhance GPX4-mediated ferroptosis defense in UVB irradiation induced cataract. Exp. Eye Res. 2025, 257, 110421. [Google Scholar] [CrossRef] [PubMed]
- McKinlay, A.F.; Diffey, B.L. A reference action spectrum for ultraviolet induced erythema in human skin. CIE Journal. 1987, 6(1), 6(1),17–22. [Google Scholar]
- World Meteorological Organization (WMO). Guide to instruments and methods of observation (WMO-no. 8), Volume I. Geneva, 2024. [CrossRef]
- Brogniez, C.; Auriol, F.; Deroo, C.; Arola, A.; Kujanpää, J.; Sauvage, B.; Kalakoski, N.; Pitkänen, M.R.A.; Catalfamo, M.; Metzger, J.M.; Tournois, G.; Da Conceicao, P. Validation of satellite based noontime UVI with NDACC ground-based instruments: influence of topography, environment and satellite overpass time. Atmos Chem Phys 2016, 16, 15049–15074. [Google Scholar] [CrossRef]
- Laguarda, A.; Abal, G.; Russo, P.; Habte, A. Estimating UV-B, UV-Erithemic, and UV-A Irradiances From Global Horizontal Irradiance and MERRA-2 Ozone Column Information. J. Sol. Energy Eng 2024, 147, 021001. [Google Scholar] [CrossRef]
- Scaglione, D.; Giulietti, D.; Morelli, M. Evaluation of the impact of atmospheric ozone and aerosols on the horizontal global/diffuse UV Index at Livorno (Italy). J. Atmos. Sol.-Terr. Phys 2016, 146, 194–204. [Google Scholar] [CrossRef]
- Marin, M.; Estelles, V.; Gomez-Amo, J.L.; Utrillas, M.P. Diffuse and Direct UV Index Experimental Values. Atmosphere. 2023, 2023 14, 1221. [Google Scholar] [CrossRef]
- Shettle, E. Models of aerosols, clouds, and precipitation for atmospheric propagation studies. In: Proceedings of the AGARD Conference, Copenhagen, Denmark 9-13 October, 1989, n. 454.
- Leckner, B. The spectral distribution of solar radiation at the earth’s surface – elements of a model. Sol Energy 1978, 20, 143–150. [Google Scholar] [CrossRef]
- Logothetis, S.A.; Salamalikis, V. , Kazantzidis, A. The impact of different aerosol properties and types on direct aerosol radiative forcing and efficiency using AERONET version 3. Atmos. Res. 2021, 250, 105343. [Google Scholar] [CrossRef]
- Rayleigh, L. On the Transmission of Light through an Atmosphere Containing Small Particles in Suspension and on the Origin of the Blue of the Sky. Philosophical Magazine 1899, 47, 375–384. [Google Scholar] [CrossRef]
- Giles, D.M.; Sinyuk, A.; Sorokin, M.G.; Schafer, J.S.; Smirnov, A.; Slutsker, I.; Eck, T.F.; Holben, B.N.; Lewis, J.R.; Campbell, J.R.; Welton, E.J.; Korkin, S.V.; Lyapustin, A.I.; et al. Advancements in the Aerosol Robotic Network (AERONET) Version 3 database–automated near-real-time quality control algorithm with improved cloud screening for Sun photometer aerosol optical depth (AOD) measurements. Atmos. Meas. Tech. 2019, 12, 169–209. [Google Scholar] [CrossRef]
- TEMIS. Available online: https://www.temis.nl/uvradiation.
- Tanskanen, A.; Krotkov, N.A.; Herman, J.R.; Arola, A. (2006) Surface Ultraviolet Irradiance From OMI. IEEE Trans. Geosci. Remote Sens 2006, 44, 5. [Google Scholar] [CrossRef]
- GES DISC. Available online: https://disc.gsfc.nasa.gov/datasets/OMUVBd_V003/summary.
- Pontoh, R.S.; Saliaputri, L.; Nashwa, A.N.; Khairina, N.; Tantular, B.; Toharudin, T.; Gumelar, F. Air Quality Mapping in Bandung City. Atmosphere 2023, 14, 1444. [Google Scholar] [CrossRef]
- Hartnett, N.; Jing, P.; Zhang, B.; Stuart, M.; Wang, J. Wildfire smoke and PM2.5 pollution in Chicago: Evidence from 2019 to 2023. Urban Climate 2025, 61, 102472. [Google Scholar] [CrossRef]
- Metrangolo, C.; Dinoi, A.; Esposito, A.; Pappaccogli, G.; Donateo, A.; Santiago, J.L.; Buccolieri, R. Assessing urban air pollution dynamics: the impact of traffic emissions and urban morphology in Lecce and Bari, Italy. Bull. of Atmos. Sci.& Technol. 2024, 5, 13. [Google Scholar] [CrossRef]
- Hsu, W.H.; Hwang, S.A.; Kinney, P.L.; Lin, S. Seasonal and temperature modifications of the association between fine particulate air pollution and cardiovascular hospitalization in New York state. Sci. Total Environ 2017, 578, 626–632. [Google Scholar] [CrossRef] [PubMed]
- Kim, M.J. The effects of transboundary air pollution from China on ambient air quality in South Korea. Heliyon 2019, 12, 5. [Google Scholar] [CrossRef]
- Wokan, A.; Iordache, M. Ecosystem Services Provided by an Urban Green Space in Timișoara (Romania): Linking Urban Vegetation with Air Quality and Cooling Effects. Sustainability 2025, 17, 5564. [Google Scholar] [CrossRef]
- Gueymard, C.A. SMARTS2 A Simple Model of the Atmospheric Radiative Transfer of Sunshine: algorithms and performance assessment. In: Florida Solar Energy Center Rep. FSEC-PF-270-95. 1995. Available online: https://www.nrel.gov/grid/solar-resource/smarts.html.
Figure 1.
Spectral aerosol transmittance for two values of Ångström turbidity coefficient (0.1 for clean conditions, and 0.5 for turbid conditions), as well as three values of Ångström exponent (0.3 for coarse aerosol, 0.9 for mixed aerosol and 1.5 for fine aerosol). All cases assume .
Figure 1.
Spectral aerosol transmittance for two values of Ångström turbidity coefficient (0.1 for clean conditions, and 0.5 for turbid conditions), as well as three values of Ångström exponent (0.3 for coarse aerosol, 0.9 for mixed aerosol and 1.5 for fine aerosol). All cases assume .
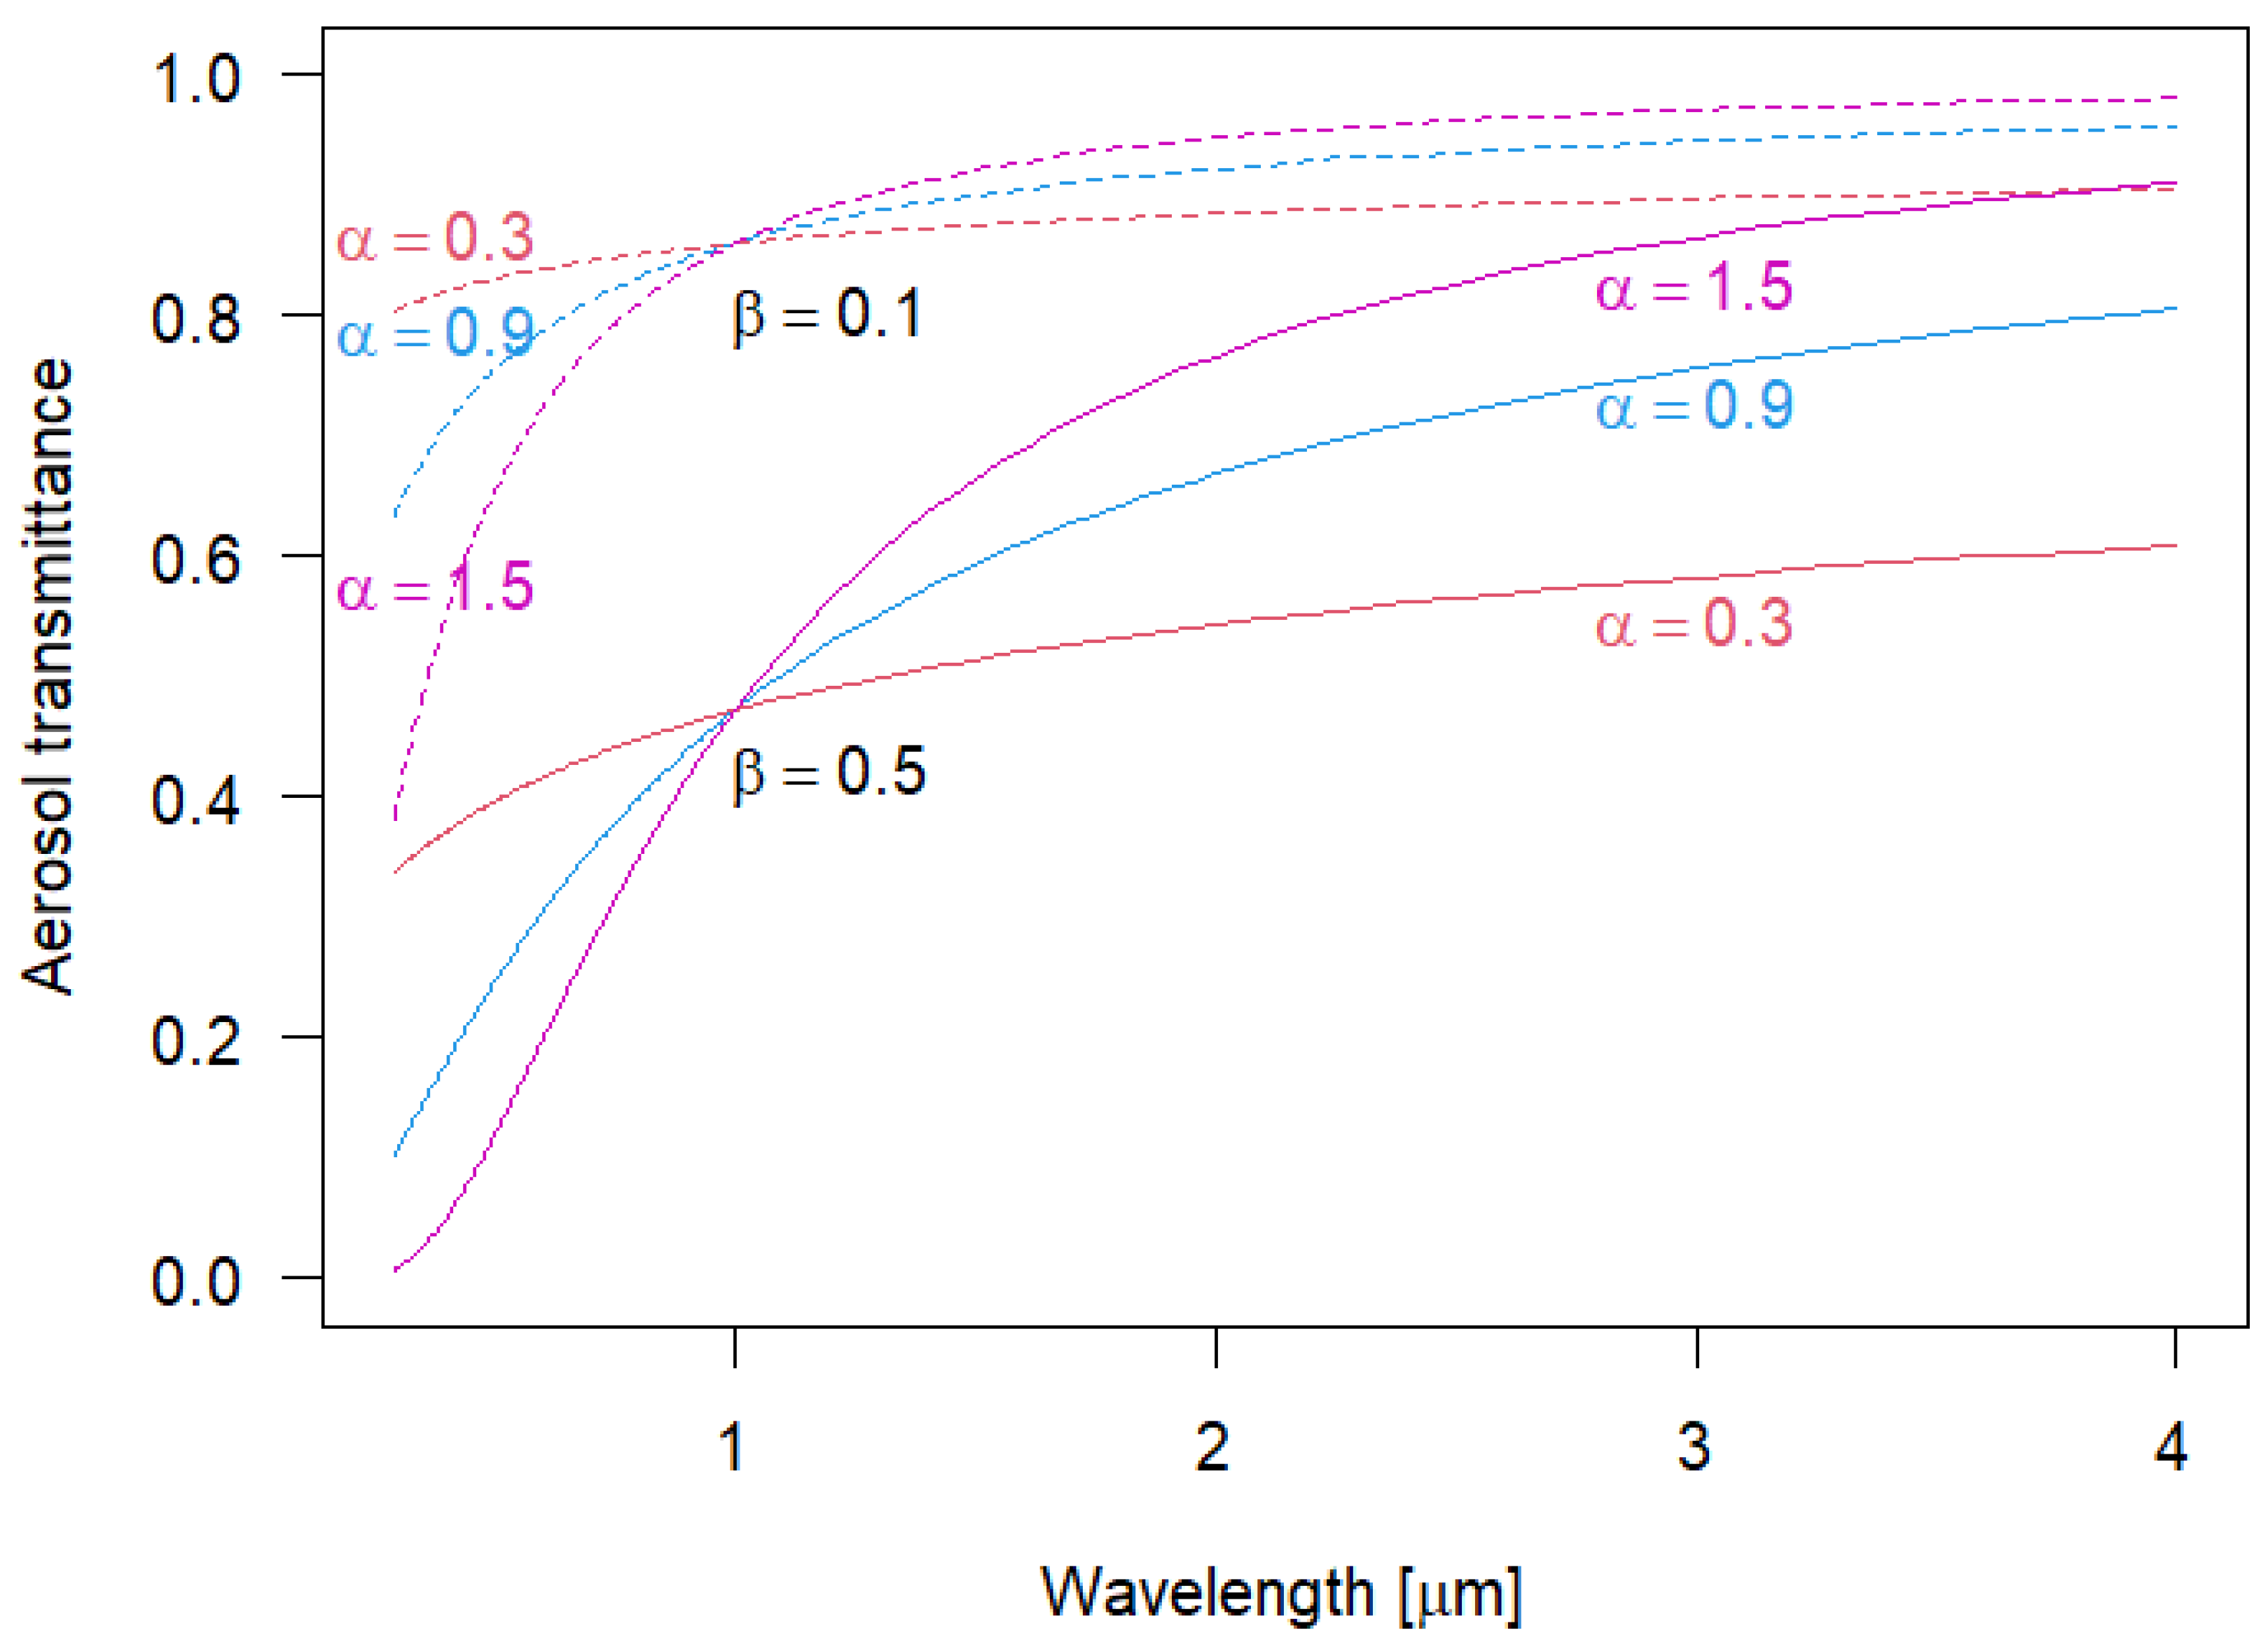
Figure 2.
UV Index evaluated using the proposed calculation method based on the Leckner model, and UV Index extracted from the TEMIS and OMI datasets for July 2023, at (a) Boulder, USA, and (b) Hohenpeissenberg, Germany.
Figure 2.
UV Index evaluated using the proposed calculation method based on the Leckner model, and UV Index extracted from the TEMIS and OMI datasets for July 2023, at (a) Boulder, USA, and (b) Hohenpeissenberg, Germany.
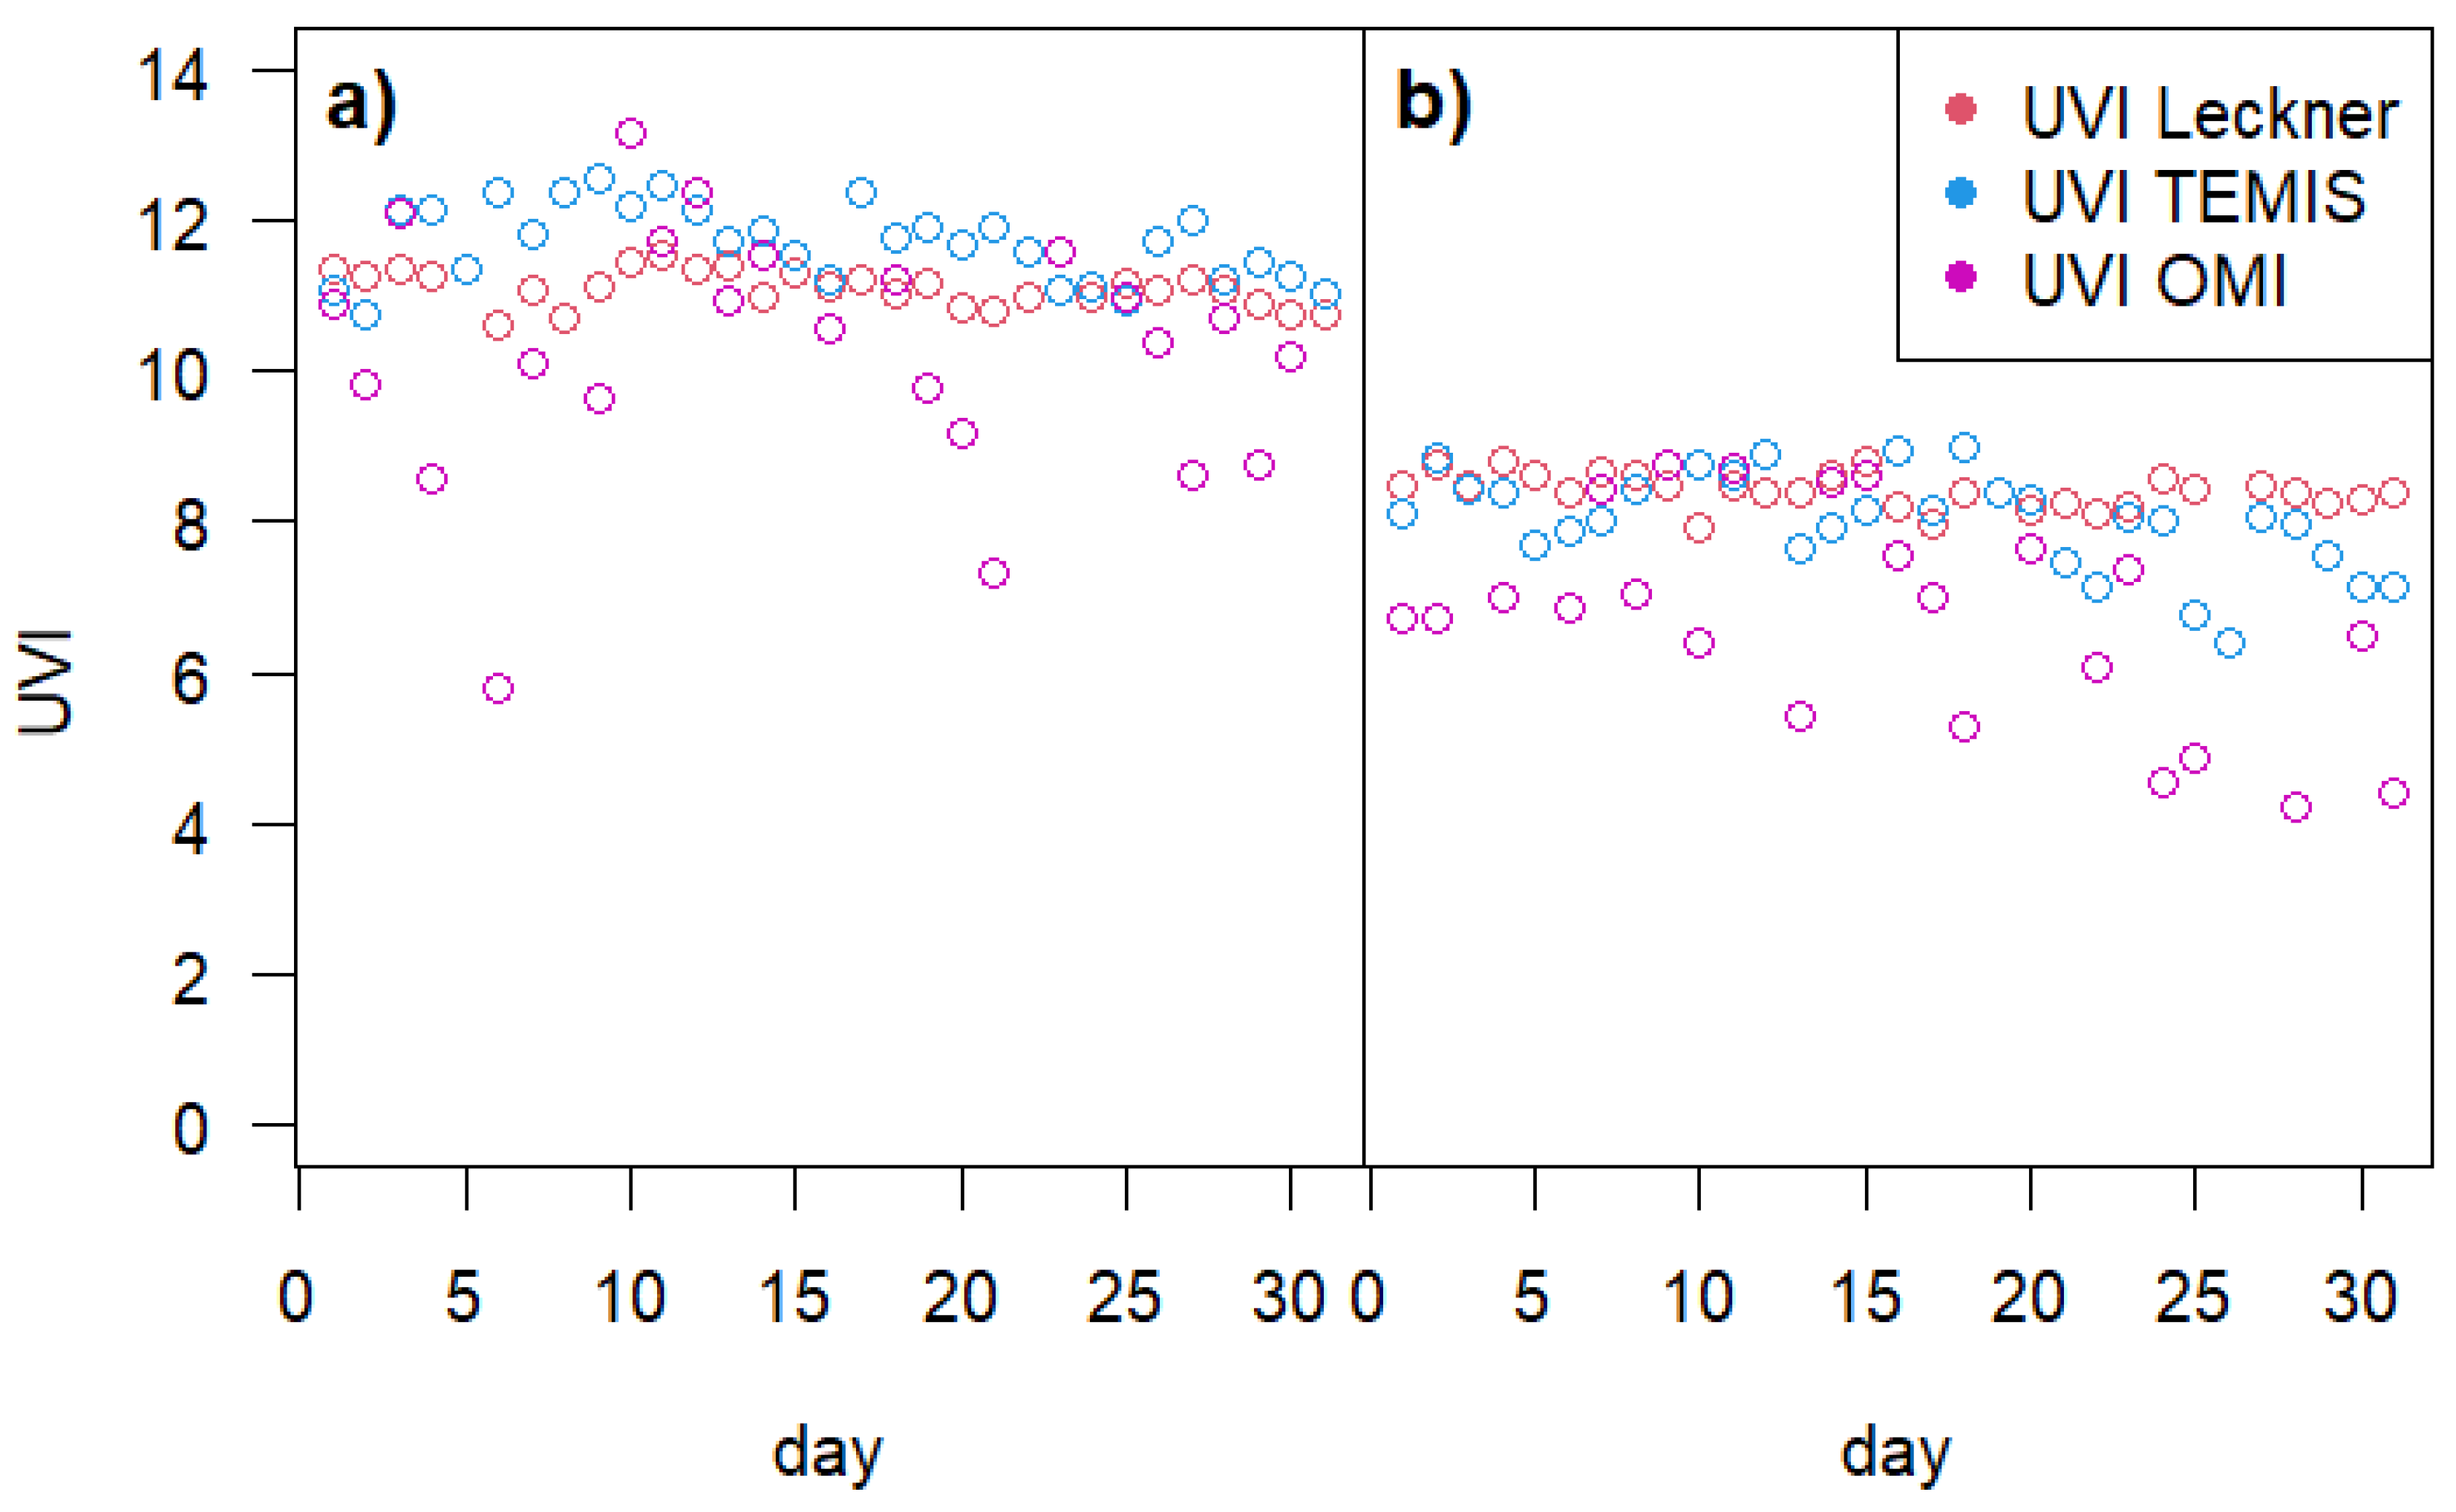
Figure 3.
Global UV Index (red) and diffuse UV Index (blue) evaluated using the proposed calculation method. Atmospheric turbidity is 0.1 in Figure 3a and 0.5 in Figure 3b. Both figures consider two aerosol types: coarse (α = 0.3, solid line) and fine (α = 1.5, dashed line).
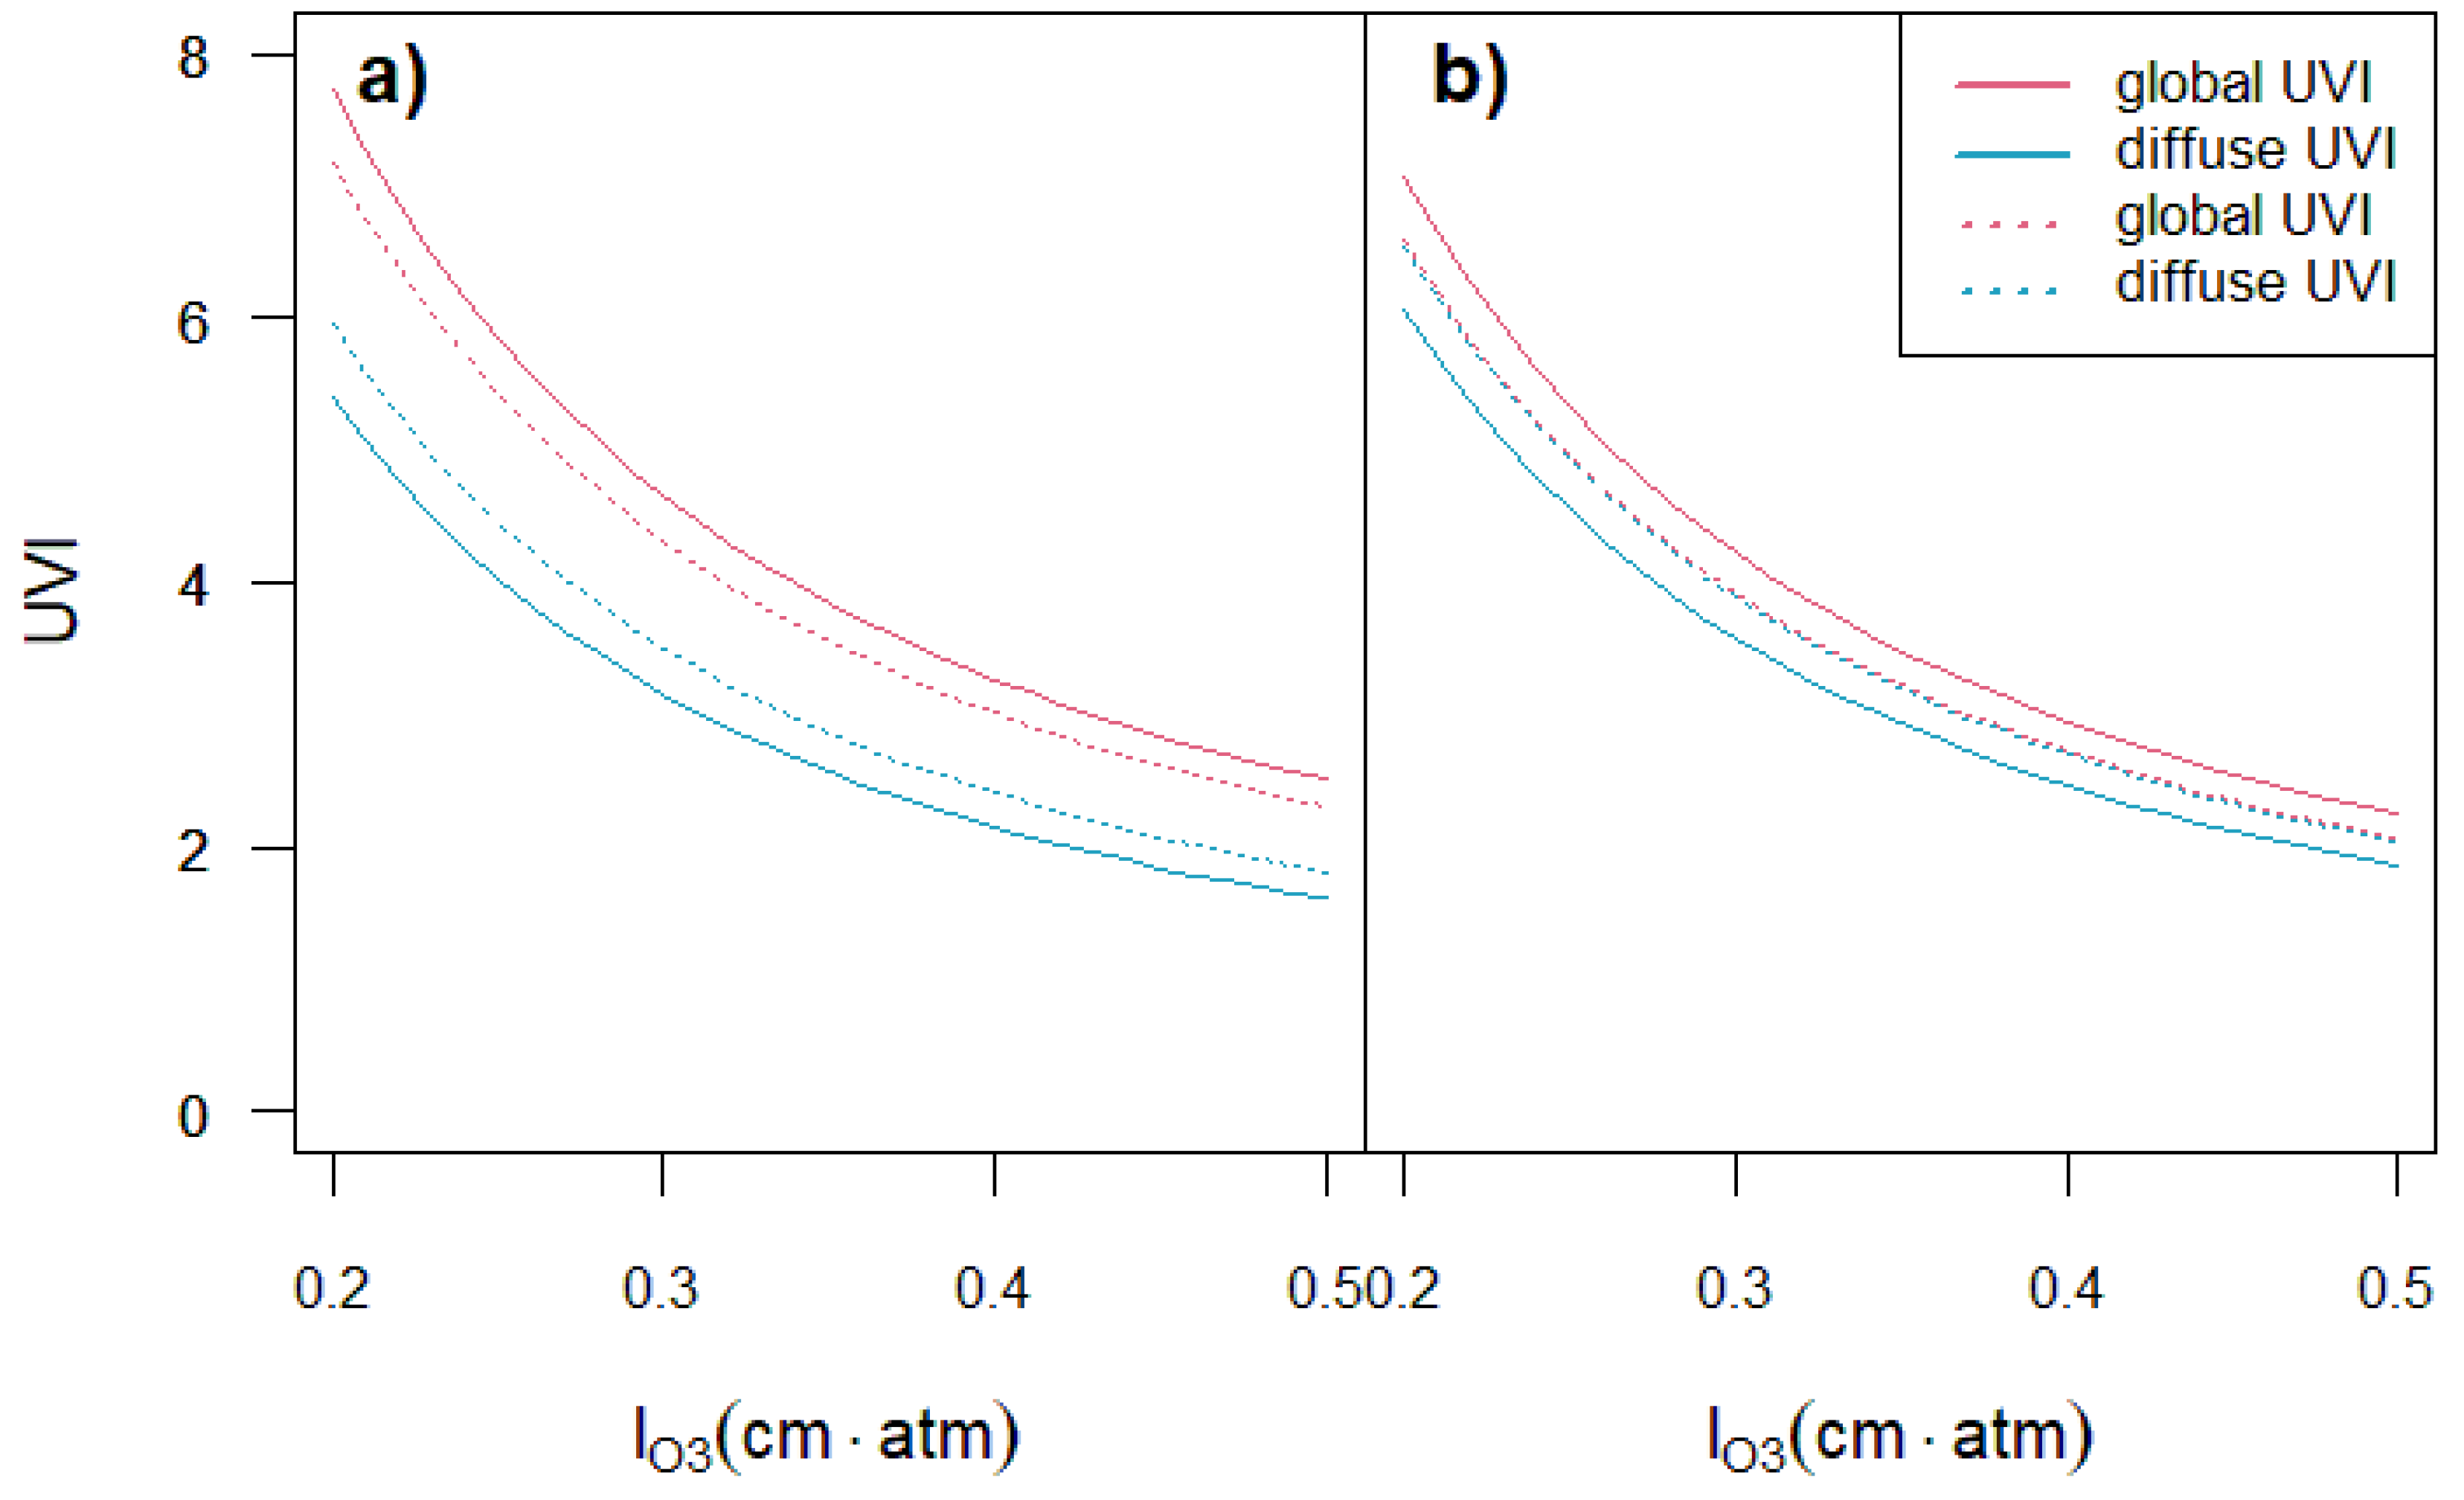
Figure 4.
Contour plot of the global UV Index, diffuse UV Index, and their difference as a function of the aerosol parameters α and β, based on measurements from the six locations listed in Table 1 for July 2023.
Figure 4.
Contour plot of the global UV Index, diffuse UV Index, and their difference as a function of the aerosol parameters α and β, based on measurements from the six locations listed in Table 1 for July 2023.
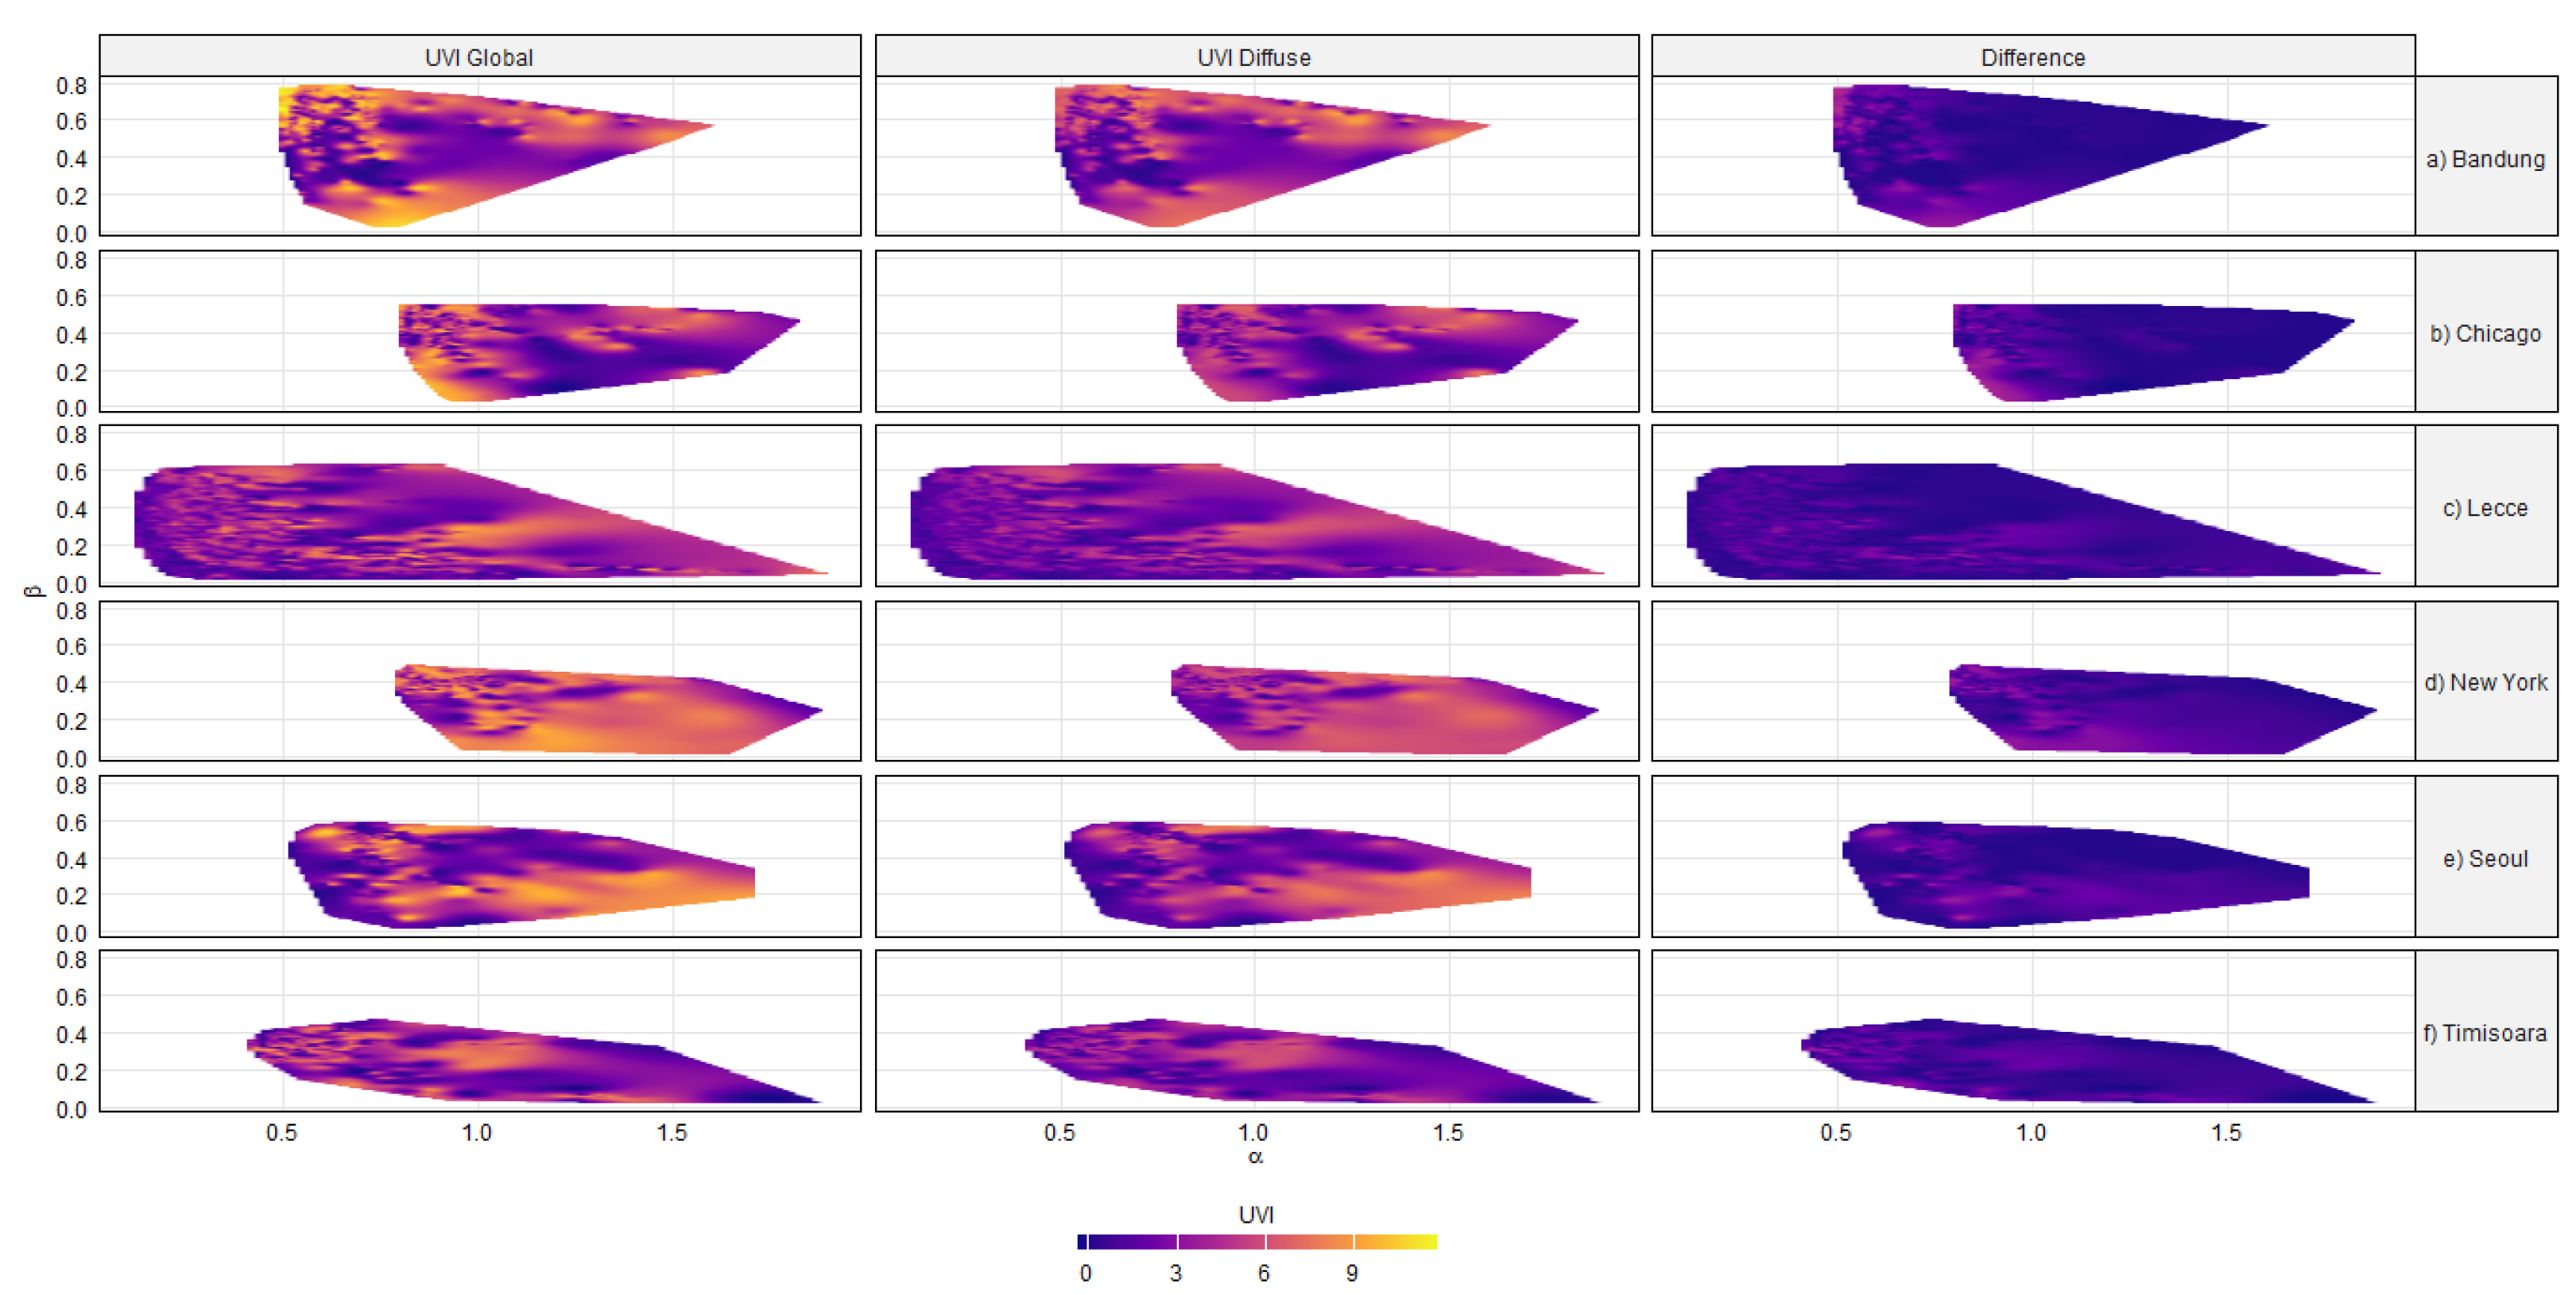
Figure 5.
Contour plot of the percentual contribution of diffuse UV Index in global UV Index as a function of aerosol parameters α and β, based on measurements from the six locations listed in Table 1 for July 2023.
Figure 5.
Contour plot of the percentual contribution of diffuse UV Index in global UV Index as a function of aerosol parameters α and β, based on measurements from the six locations listed in Table 1 for July 2023.
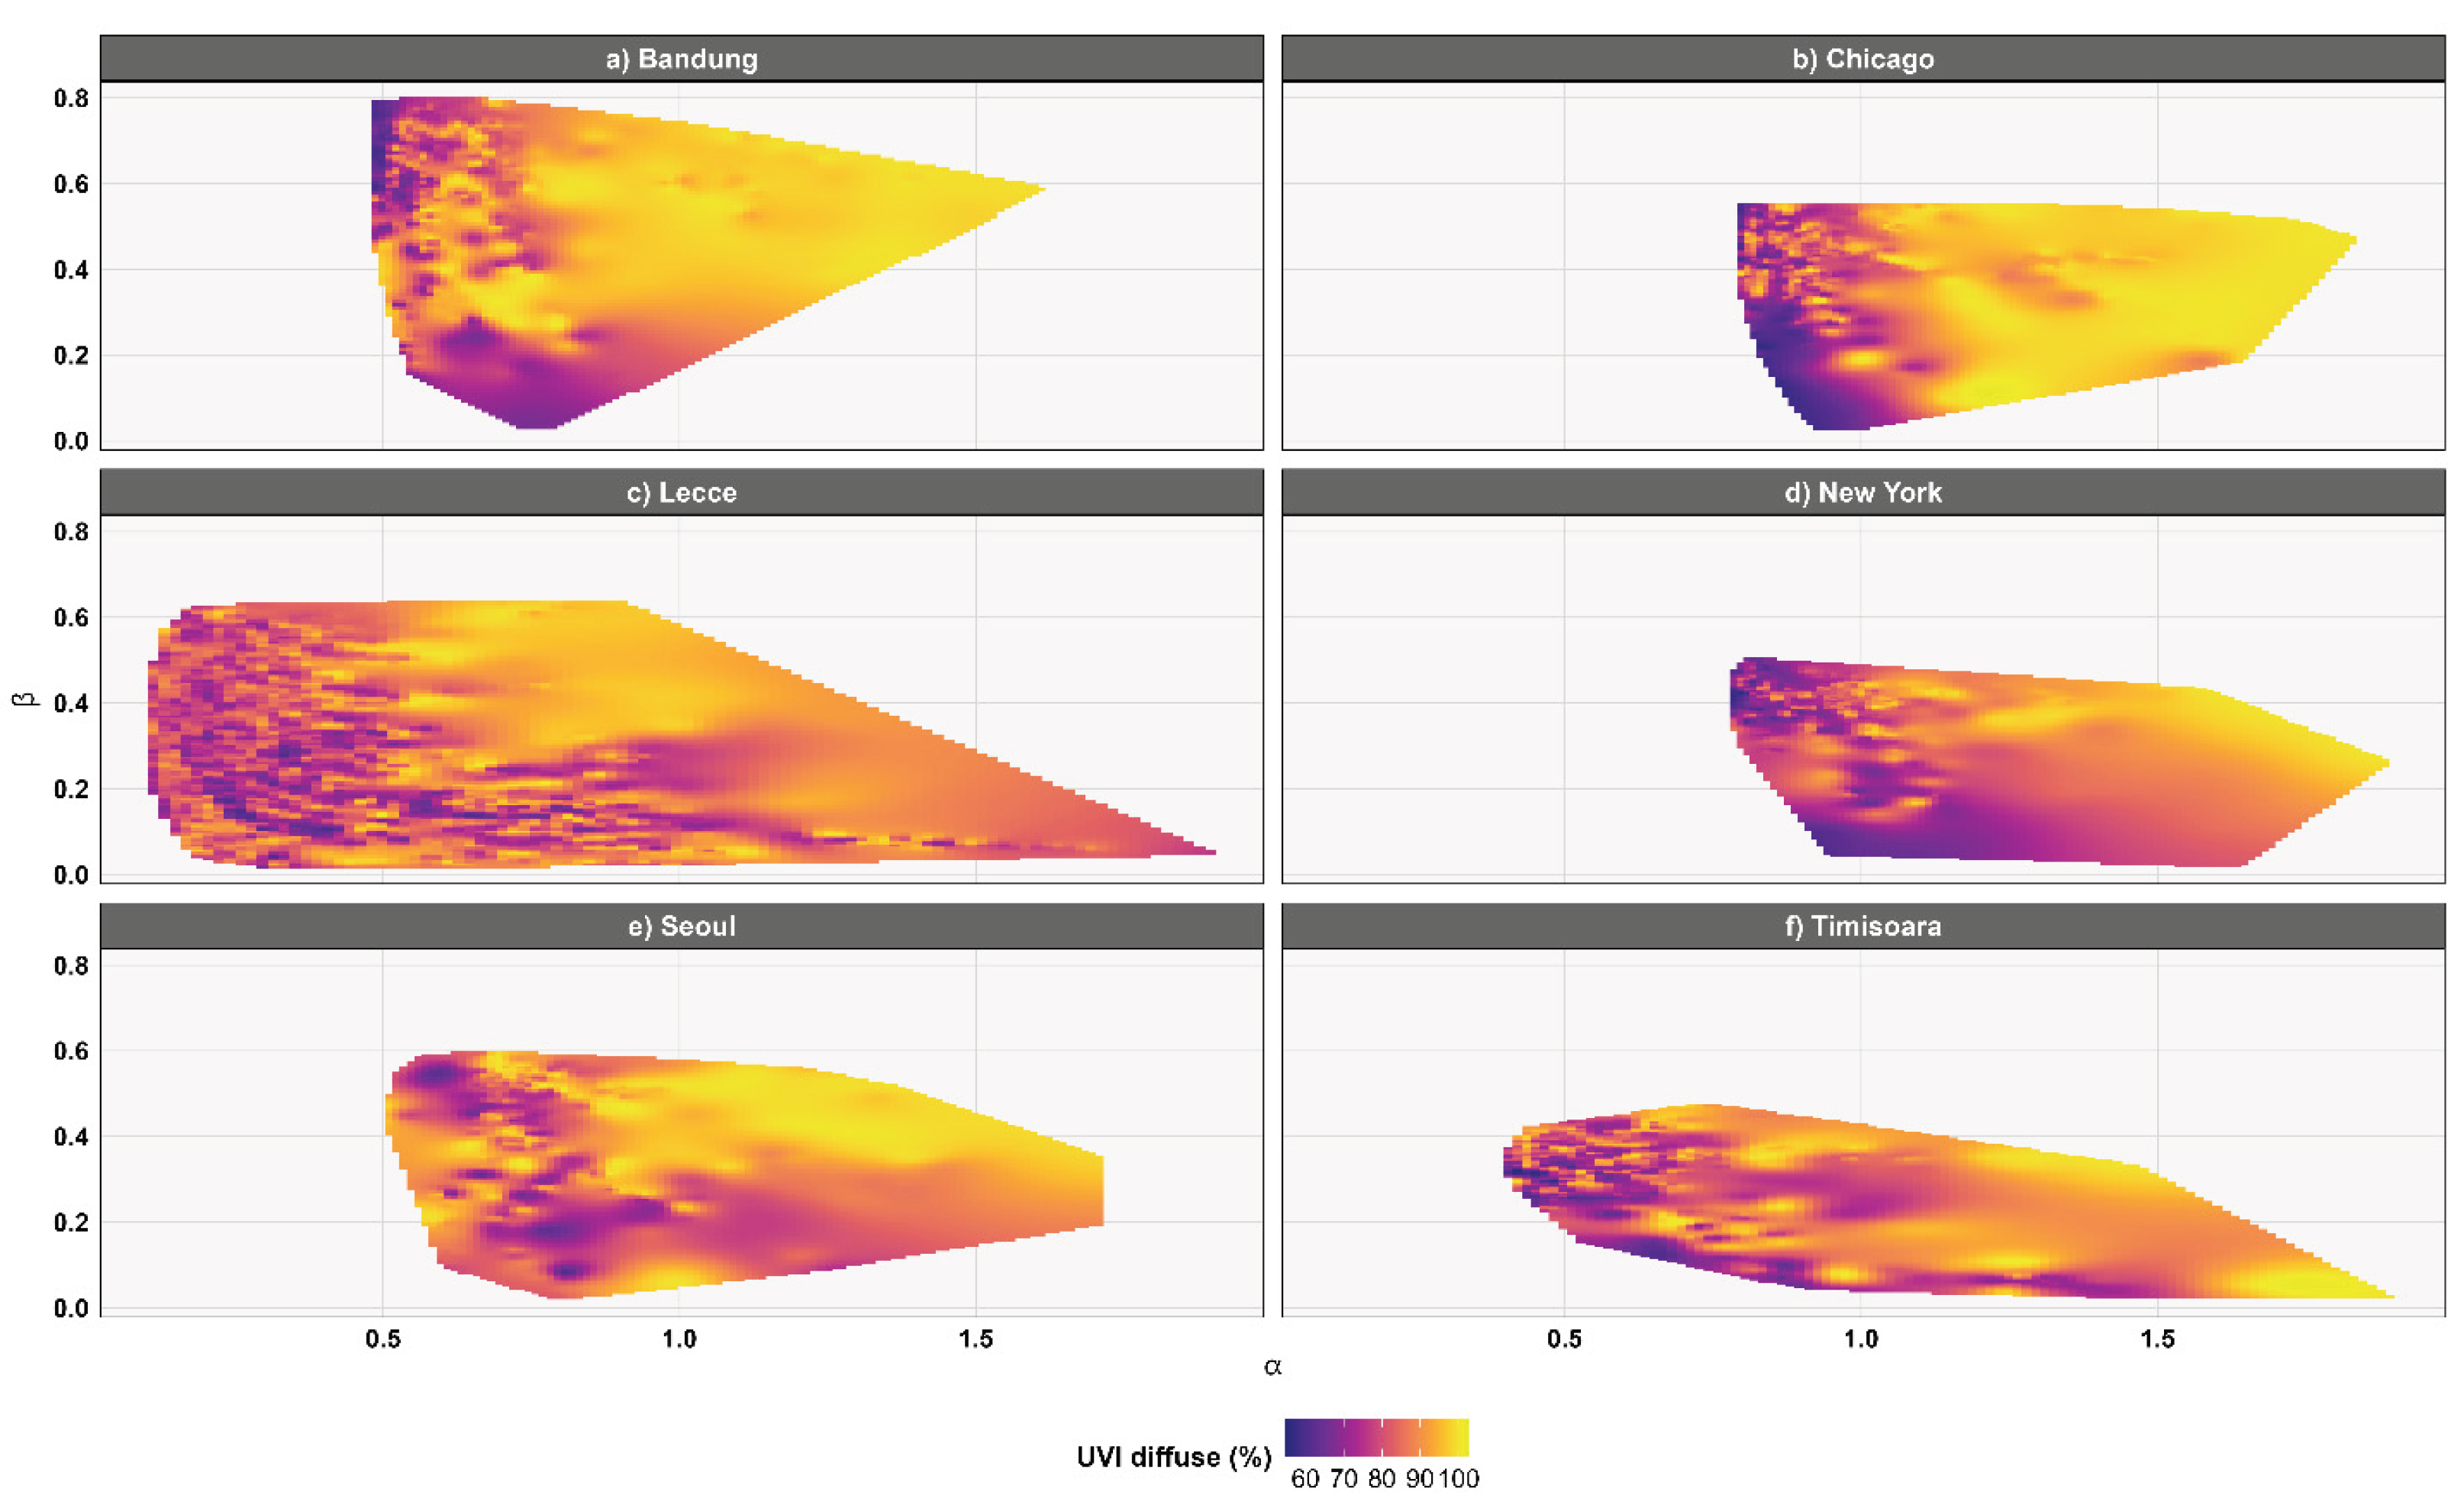

Table 1.
List of the six AERONET sites analyzed in this study, including their geographical coordinates and the statistical values (minimum, maximum, mean, and standard deviation) of atmospheric parameters — Ångström exponent and turbidity coefficient — representative of aerosol type and concentration, for July 2023.
| Location | Latitude | Longitude | Counts | Aerosol parameters | |||||||
| Ångström exponent (α) | Ångström turbidity (β) | ||||||||||
| min | max | mean | SD | min | max | mean | SD | ||||
| Bandung | 6.88° S | 107.61° E | 1078 | 0.474 | 1.622 | 1.362 | 0.206 | 0.022 | 0.807 | 0.125 | 0.110 |
| Chicago | 41.97° N | 87.71° W | 2028 | 0.786 | 1.841 | 1.6 | 0.115 | 0.022 | 0.556 | 0.1 | 0.089 |
| Lecce | 40.33° N | 18.11° E | 10366 | 0.094 | 1.914 | 1.101 | 0.433 | 0.0098 | 0.642 | 0.088 | 0.075 |
| New York | 40.82° N | 73.94° W | 1081 | 0.772 | 1.896 | 1.678 | 0.133 | 0.014 | 0.507 | 0.088 | 0.068 |
| Seoul | 37.56° N | 126.93° E | 515 | 0.496 | 1.721 | 1.336 | 0.270 | 0.016 | 0.602 | 0.152 | 0.059 |
| Timisoara | 45.74° N | 21.22° E | 1110 | 0.389 | 1.907 | 1.395 | 0.271 | 0.019 | 0.478 | 0.080 | 0.059 |
Disclaimer/Publisher’s Note: The statements, opinions and data contained in all publications are solely those of the individual author(s) and contributor(s) and not of MDPI and/or the editor(s). MDPI and/or the editor(s) disclaim responsibility for any injury to people or property resulting from any ideas, methods, instructions or products referred to in the content. |
© 2025 by the authors. Licensee MDPI, Basel, Switzerland. This article is an open access article distributed under the terms and conditions of the Creative Commons Attribution (CC BY) license (http://creativecommons.org/licenses/by/4.0/).
Copyright: This open access article is published under a Creative Commons CC BY 4.0 license, which permit the free download, distribution, and reuse, provided that the author and preprint are cited in any reuse.


