
Submitted:
28 October 2025
Posted:
29 October 2025
You are already at the latest version
Abstract
Background: Anti-tuberculosis (anti-TB) antibiotics alter the gut microbiome, potentially affecting the host physiology and immune response. Here, we investigated the impact of anti-TB antibiotics on host gut microbiota, immune response, and Mtb control. Methods: We pre-treated mice with isoniazid, rifampicin, pyrazinamide, and ethambutol (HRZE) for two months, followed by intranasal Mtb infection five days post-HRZE cessation. HRZE pre-treated mice received faecal microbiota transplants (FMT) or phosphate-buffered sa-line (PBS) pre- and post-infection. Faecal DNA was isolated, and 16S rRNA gene se-quencing was performed. Mycobacterial burden, histology, and immune response were assessed in tissues four weeks post-infection. Results: We observed an enrichment of Bacteroides, Alistipes, Alloprevotella, Paraprevotella, and Colidextribacter, and depletion of Clostridia UCG 014, Roseburia, Ruminococcus, and Rikenellaceae RC9 gut group in HRZE pre-treated Mtb-exposed mice compared to infected mice without HRZE (control group). HRZE pre-treatment followed by Mtb infection was associated with marked ileal histo-morphological damage compared to infection alone. Furthermore, gut microbiota alter-ations in HRZE pre-treated mice were associated with poor control of the mycobacterial burden, reduced frequencies of CD4+ T and CD68+ macrophage cell populations, and altered release of IFN-γ, IL-6, and PD-1. Notably, although not completely, FMT improved ileal features, normalised microbiota taxa abundance, lowered Mtb burden, and rescued impaired immune phenotypes. Conclusions: These data highlight the untoward con-sequences of recent anti-TB antibiotics for host control of subsequent Mtb infection and suggest a potential therapeutic avenue for mitigating the effects of HRZE-induced mi-crobiota dysbiosis through FMT or probiotics-associated host-directed therapies to prevent TB recurrence.
Keywords:
tuberculosis
; anti-tuberculosis antibiotics
; Mycobacterium tuberculosis
; gut microbiota
; programmed cell death protein-1
1. Introduction
More than two billion people are estimated to be infected with Mycobacterium tuberculosis (Mtb) worldwide [1]. Factors such as malnutrition, interferon-gamma (IFN-γ) gene deficiency, vitamin D deficiency, diabetes, and HIV infection contribute to the interindividual differences in host immunity to primary Mtb infection or the likelihood of progression to active tuberculosis (TB) disease [1,2,3]. However, there is still a lack of complete understanding of the factors that drive protective immunity against Mtb infection. Furthermore, despite the cure of most TB cases by prolonged anti-TB antibiotic regimens, there is an increased susceptibility rate to subsequent episodes of clinical TB after the first episode of TB [4,5,6]. For example, in a Cape Town study, new infection rates were 4 times higher among previously treated TB patients than in the general population [4]. The high rate of TB recurrence in treated TB patients has also been reported to be independent of HIV status [5], suggesting the involvement of possibly yet unidentified host-associated factors.
There is evidence that commensal bacteria in the mammalian gut, known as the gut microbiota, significantly influence various host physiological [7], metabolic [8], and immunological processes [7]. Despite the diversity of these microbes, a delicate balance is maintained, and alterations in microbiota composition, for example, by antibiotics, impact the development of intestinal and extra-intestinal diseases [9,10]. Along these lines, recent studies have shown that antibiotic-related perturbations of the gut microbiota compromise host immunity and increase Mtb susceptibility in the treated animals [11,12].
Drug-sensitive TB is treated with isoniazid, rifampicin, pyrazinamide, and ethambutol for two months (intensive phase) and isoniazid and rifampicin for an additional four months (continuation phase). While isoniazid, pyrazinamide, and ethambutol are presumed to have narrow-spectrum activity against mycobacteria, rifampicin is active against a wide range of bacteria [13,14,15,16]. The combination of these antibiotics induces profound dysbiosis in the gut microbiota in humans and mice [17,18] and may impair the host’s ability to launch an effective immune response against Mtb [19].
Although the overall microbial composition of the gut is largely restored following the cessation of anti-TB antibiotic treatment, species composition may be altered indefinitely with prolonged physiologic consequences [17,20,21]. Accordingly, the possibility exists that an initial episode of TB disease and treatment with anti-TB antibiotics impairs the foundational competence of the host to launch effective responses to resist the development of TB disease upon re-exposure to Mtb. In this regard, the unintended effects of anti-TB antibiotics on the gut microbiota that possibly undermine the host’s ability to achieve a sterilising cure and establish protective immunity to Mtb remain poorly investigated.
Herein, we aimed to investigate the effect of the first-line anti-TB antibiotics on the gut microbiota composition, the impact on host immune responses and Mtb susceptibility/disease severity, and whether faecal microbiota transplantation (FMT) can reverse dysbiosis and restore Mtb control.
2. Results
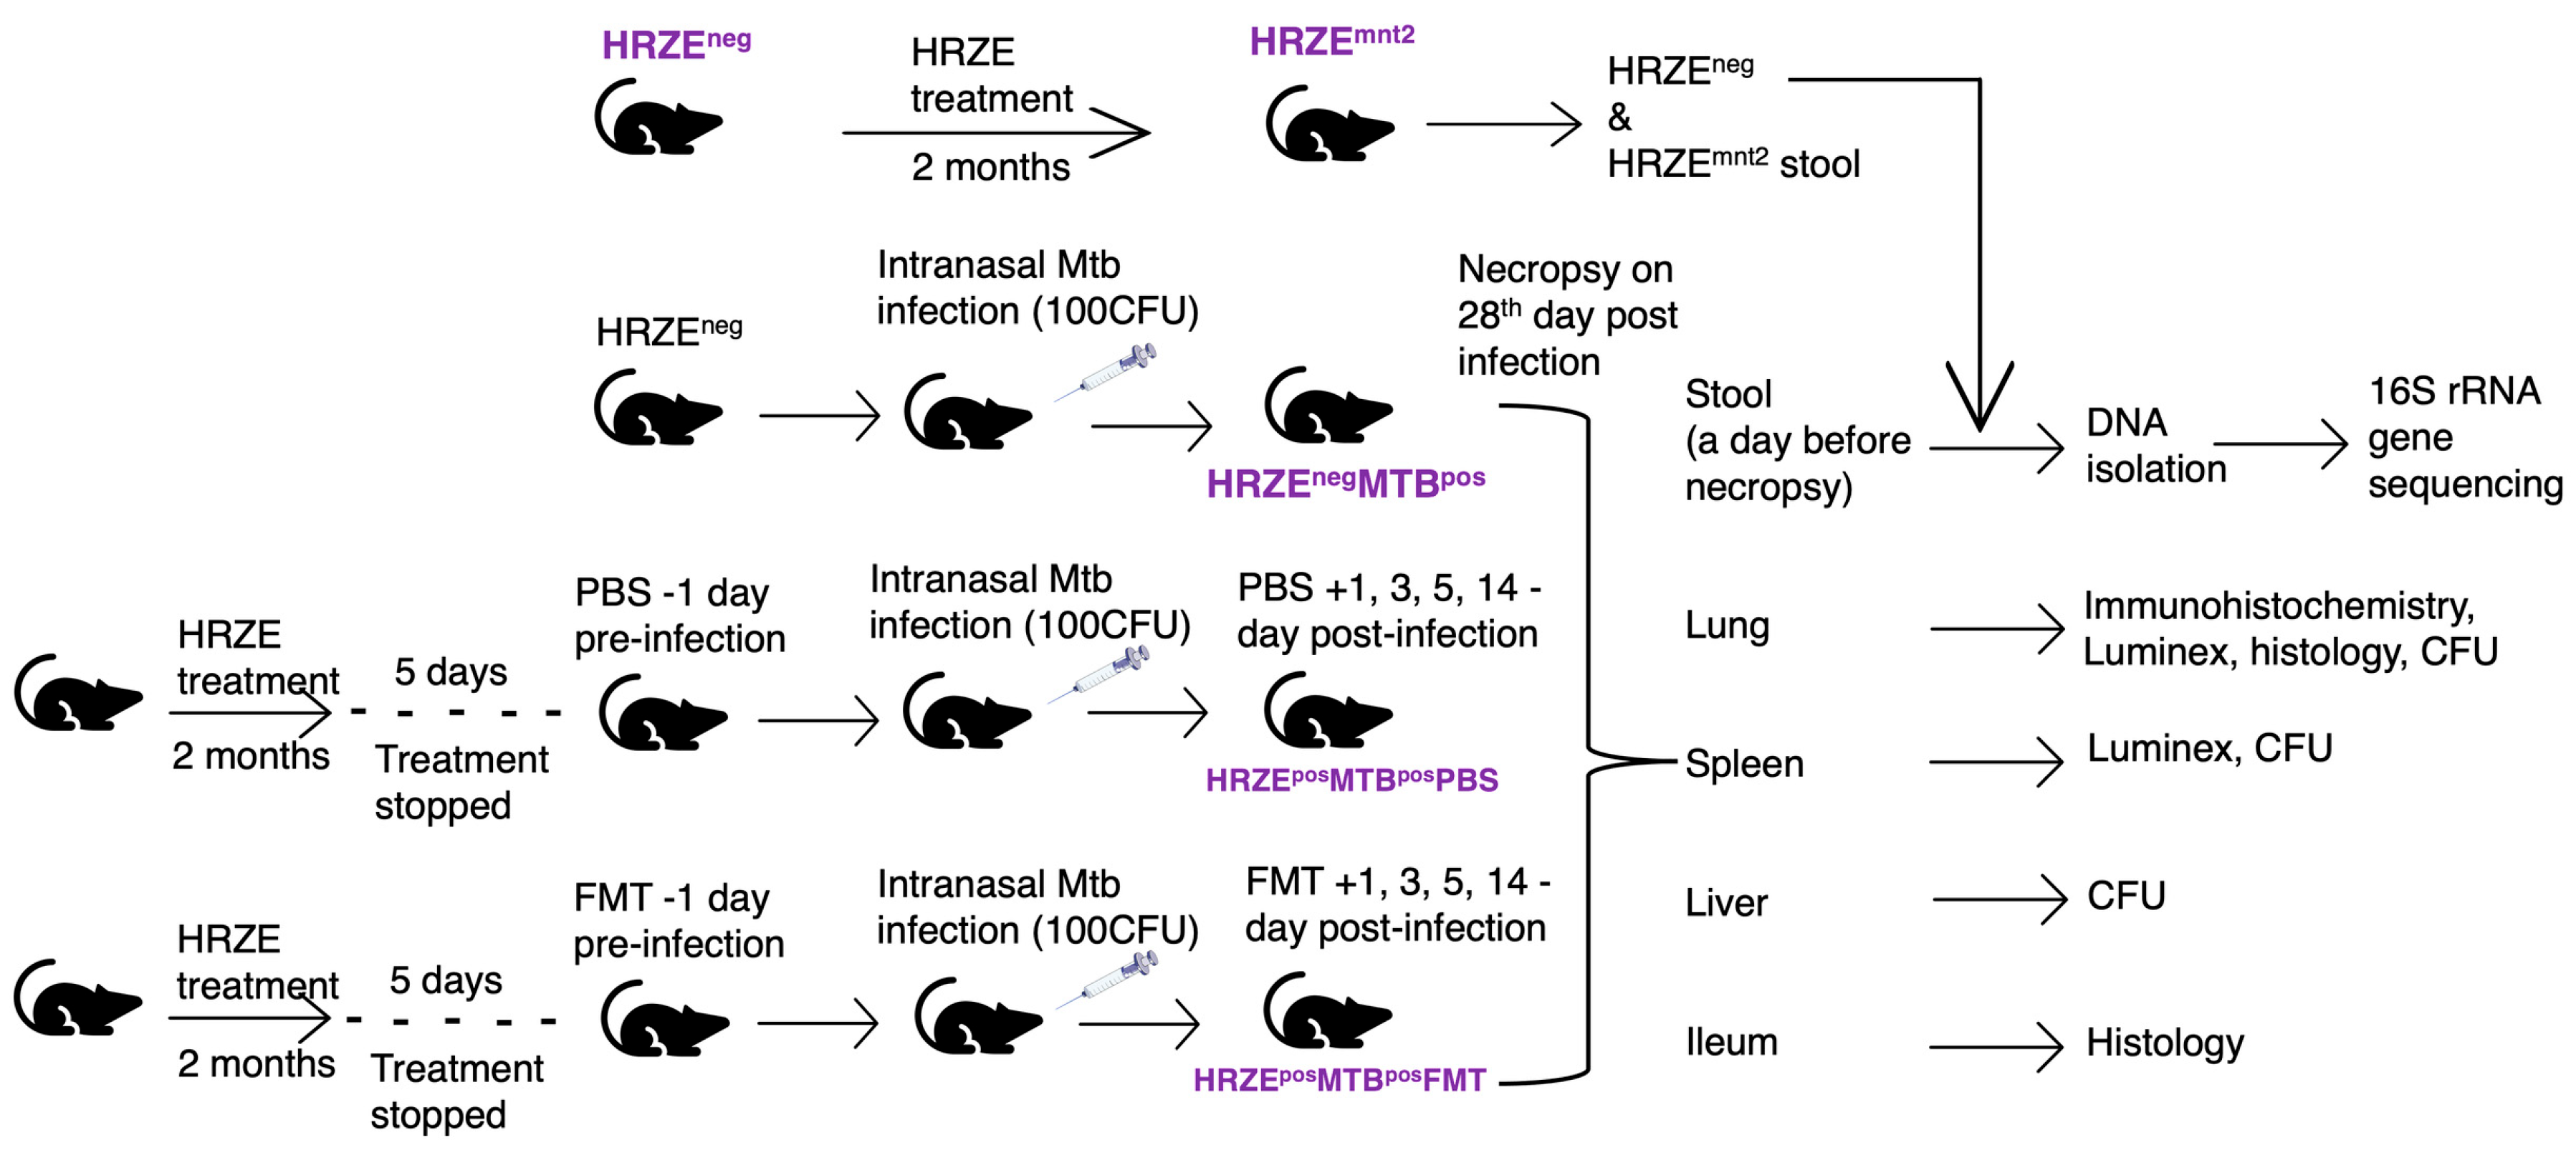
The gut microbiota plays significant roles in host immune system development and maintaining host physiology. In this study, we hypothesised that gut microbiota alterations induced by first-line anti-tuberculosis (anti-TB) antibiotics would compromise host immunity, which would have consequences for host control of Mtb burden. We administered isoniazid (H), rifampicin (R), pyrazinamide (Z), and ethambutol (E) to mice for two months. Five days after stopping HRZE treatment, the mice were infected with Mtb via the intranasal route. The infected mice that had undergone HRZE pre-treatment were then given either faecal microbiota transplants (HRZEposMTBposFMT) or phosphate-buffered saline (HRZEposMTBposPBS). HRZE-untreated Mtb-infected mice (HRZEnegMTBpos) were the controls. The animals were euthanised, and tissues harvested 28 days post-Mtb infection (Figure 1, materials and methods)
Figure 1.
C57BL/6 mice (n = 6 -12) were pre-treated with HRZE in drinking water for two months in two independent experiments. HRZE-treated mice were infected with Mtb five days after treatment was stopped. HRZE-treated Mtb-infected mice received FMT and PBS, respectively, a day before Mtb infection and on days 1, 3, 5 and 14 post-infections. HRZE-untreated Mtb-infected mice served as controls. In Mtb uninfected mice, faecal samples were collected before HRZE treatment (HRZEneg) and at month two following the initiation of antibiotic treatment (HRZEmnt2). In Mtb-infected mice, we collected faecal pellets from HRZE untreated (HRZEnegMTBpos) and HRZE pre-treated mice, which received PBS (HRZEposMTBposPBS) and FMT (HRZEposMTBposFMT), respectively. DNA was isolated, and 16S rRNA gene sequencing was performed on all faecal samples. Upon necropsy, the lung, spleen, liver, and ileum were harvested for CFU determination, histological analysis, immunohistochemical staining, and Luminex multiplex assay.
2.1. HRZE Antibiotic Treatment Alters Gut Microbiota Diversity and Composition
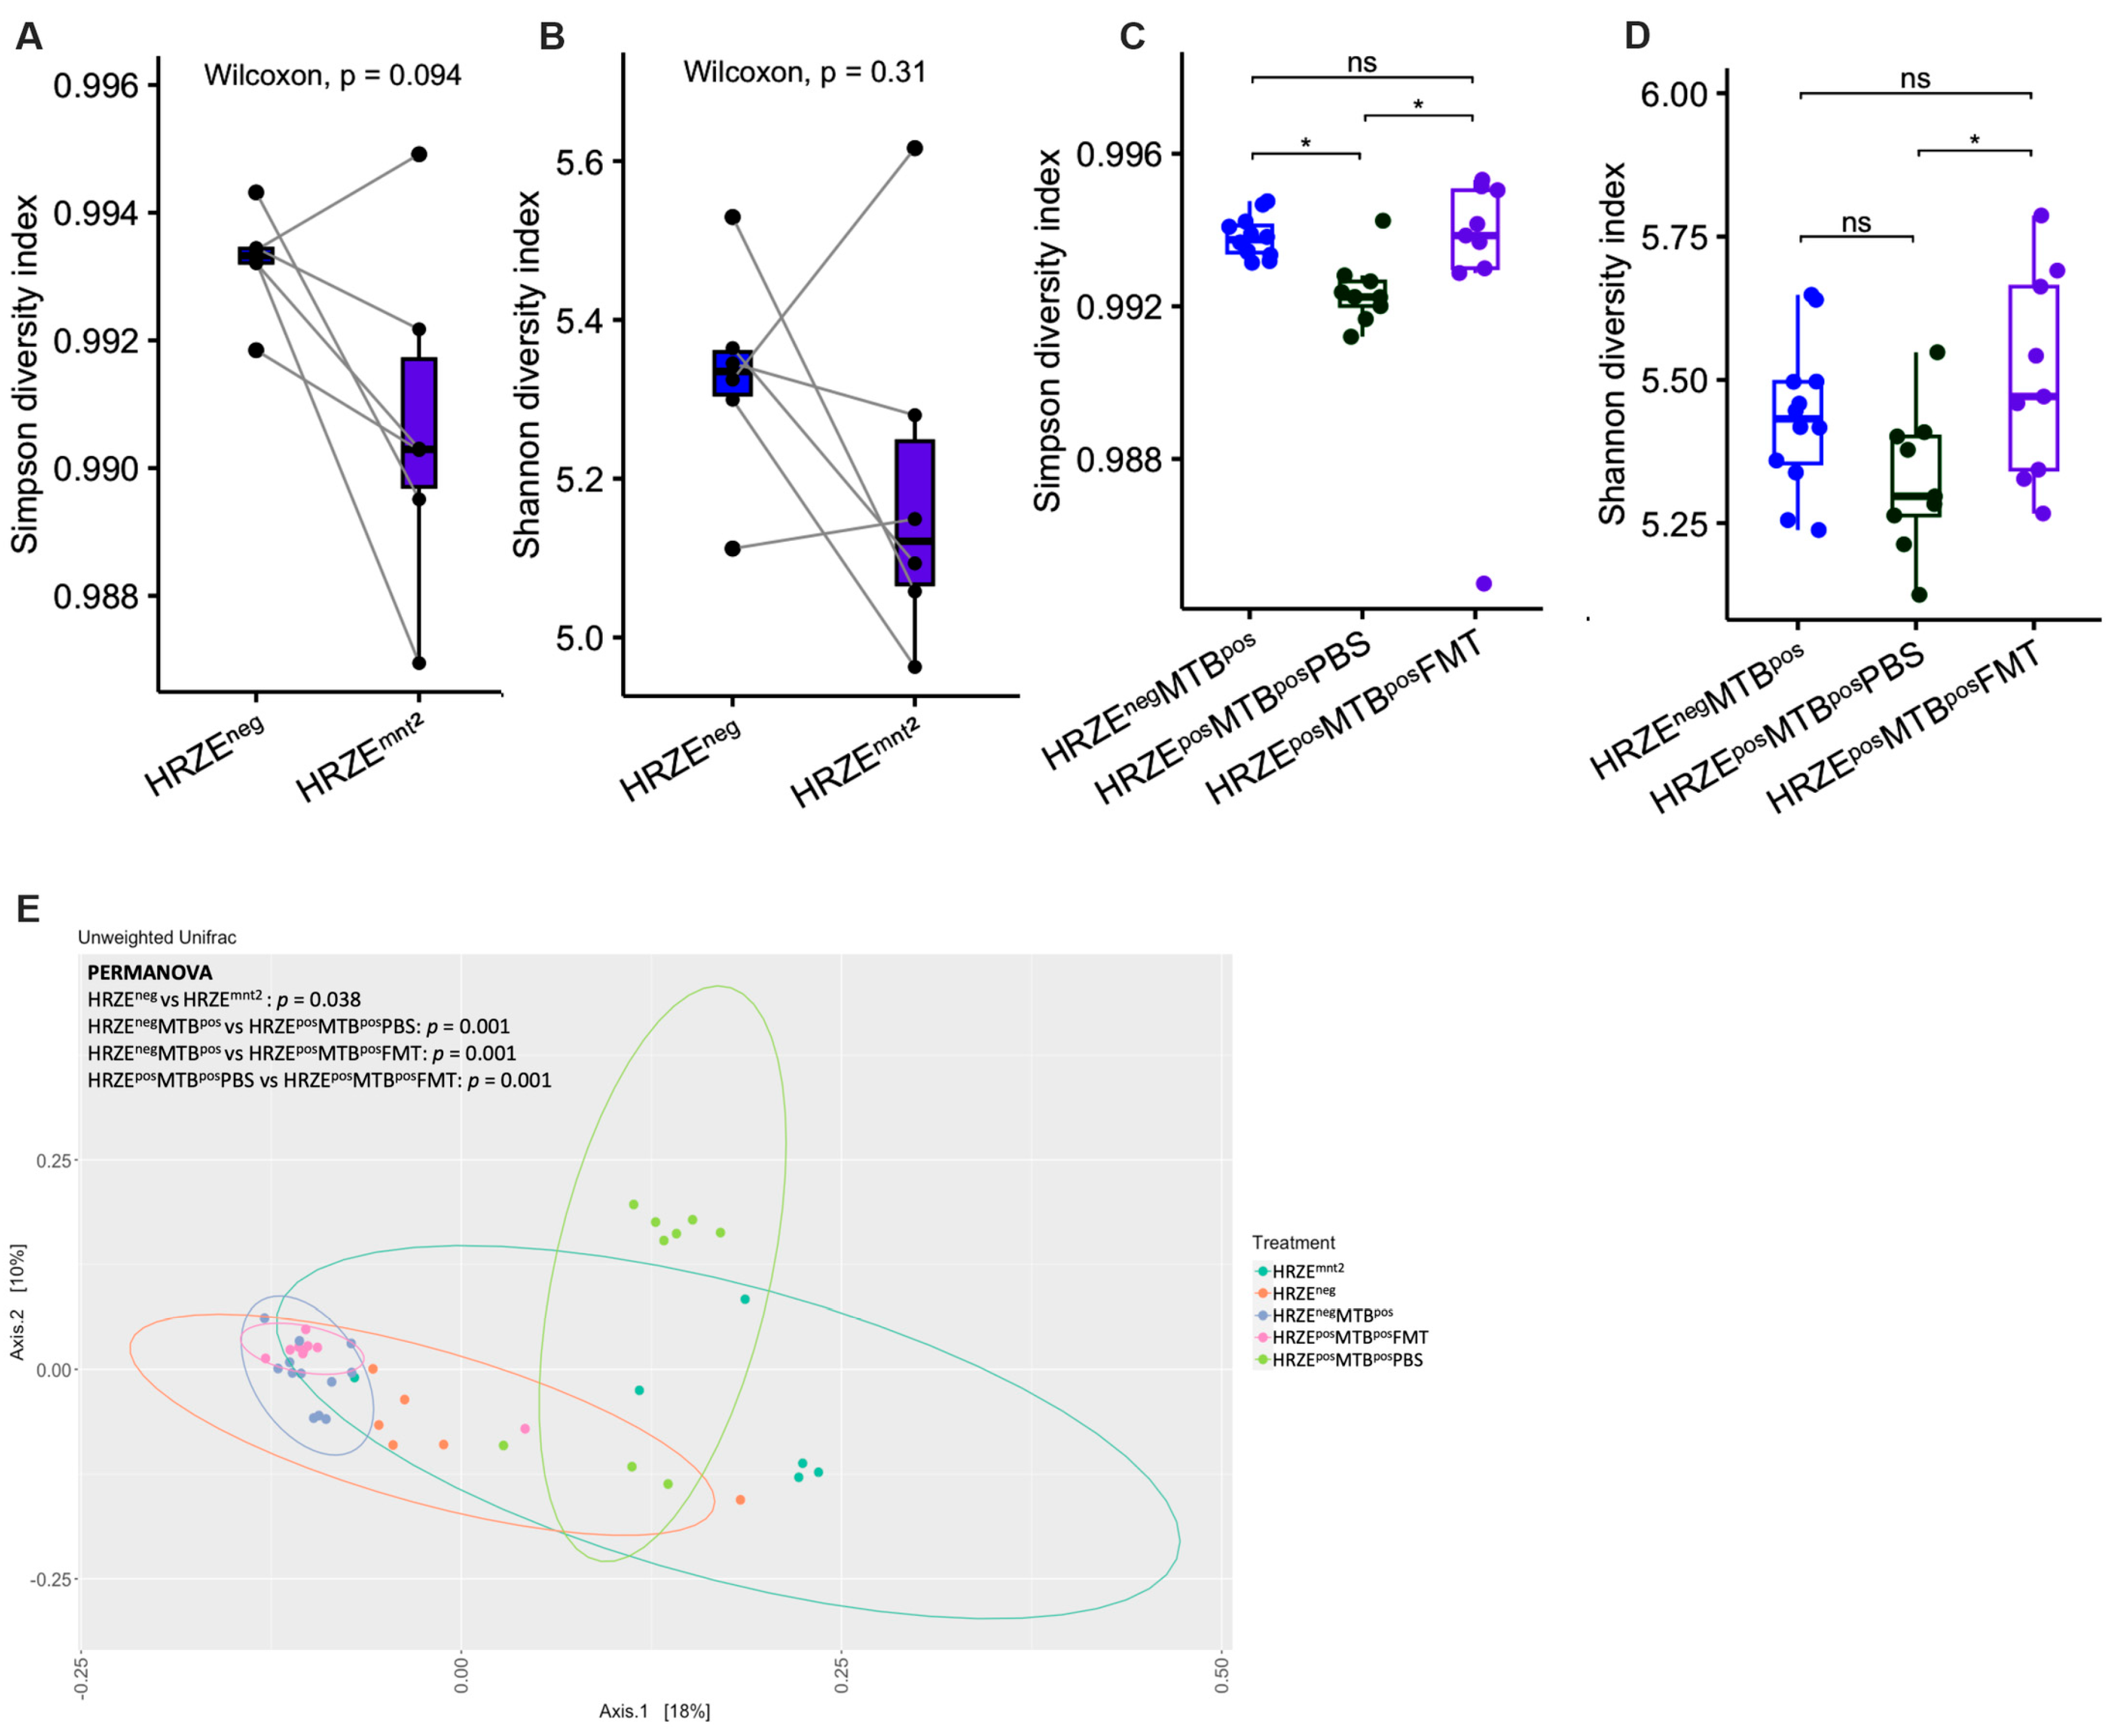
The standard antibiotic regimen for drug-sensitive TB in humans typically involves a six-month course of antibiotic therapy with HRZE for the first two months (intensive phase) and HR for the next four months (continuation phase). In our study, mice were treated with HRZE for two months, mirroring the standard intensive phase anti-TB regimen typically employed in clinical settings. Following the HRZE treatment in month two, we observed a decrease in alpha diversity, as determined by the Simpson index, although statistical significance was not reached (HRZEneg versus HRZEmnt2, P = 0.094) (Figure 2A). However, the Shannon index showed no differences (HRZEneg versus HRZEmnt2, P = 0.31) (Figure 2B). Simpson’s diversity index emphasises species evenness (relative abundance of each species), while Shannon’s index gives more weight to species richness [22]. Alpha diversity significantly decreased in HRZE-pretreated Mtb-infected mice compared to Mtb-infected mice without HRZE pre-treatment as determined by the Simpson index (HRZEposMTBposPBS versus HRZEnegMTBpos, P < 0.05) (Figure 2C). A decreasing trend was seen in the Shannon index, although statistical significance was not reached (Figure 2D).
Of note, FMT significantly increased the alpha diversity in HRZE pre-treated Mtb-infected mice compared to HRZE pre-treated Mtb-infected mice gavaged with PBS as determined by both Simpson and Shannon index (HRZEposMTBposFMT vs HRZEposMTBposPBS, P < 0.05 respectively) (Figure 2C-D). We observed significant differences in all beta diversity comparisons between the groups (Figure 2E).
Figure 2.
HRZE treatment alters the gut microbiota diversity. (A-B) α-diversity between baseline versus two months of HRZE treatment as determined by Simpson and Shannon diversity index. (C-D) α-diversity in HRZE-untreated Mtb-infected versus HRZE pre-treated Mtb-infected mice administered PBS and FMT, respectively, as determined by Simpson and Shannon diversity index. E Principal coordinate analysis plot of unweighted Unifrac distances with PERMANOVA p values. P values are shown or denoted by nsp > 0.05, *p < 0.05.
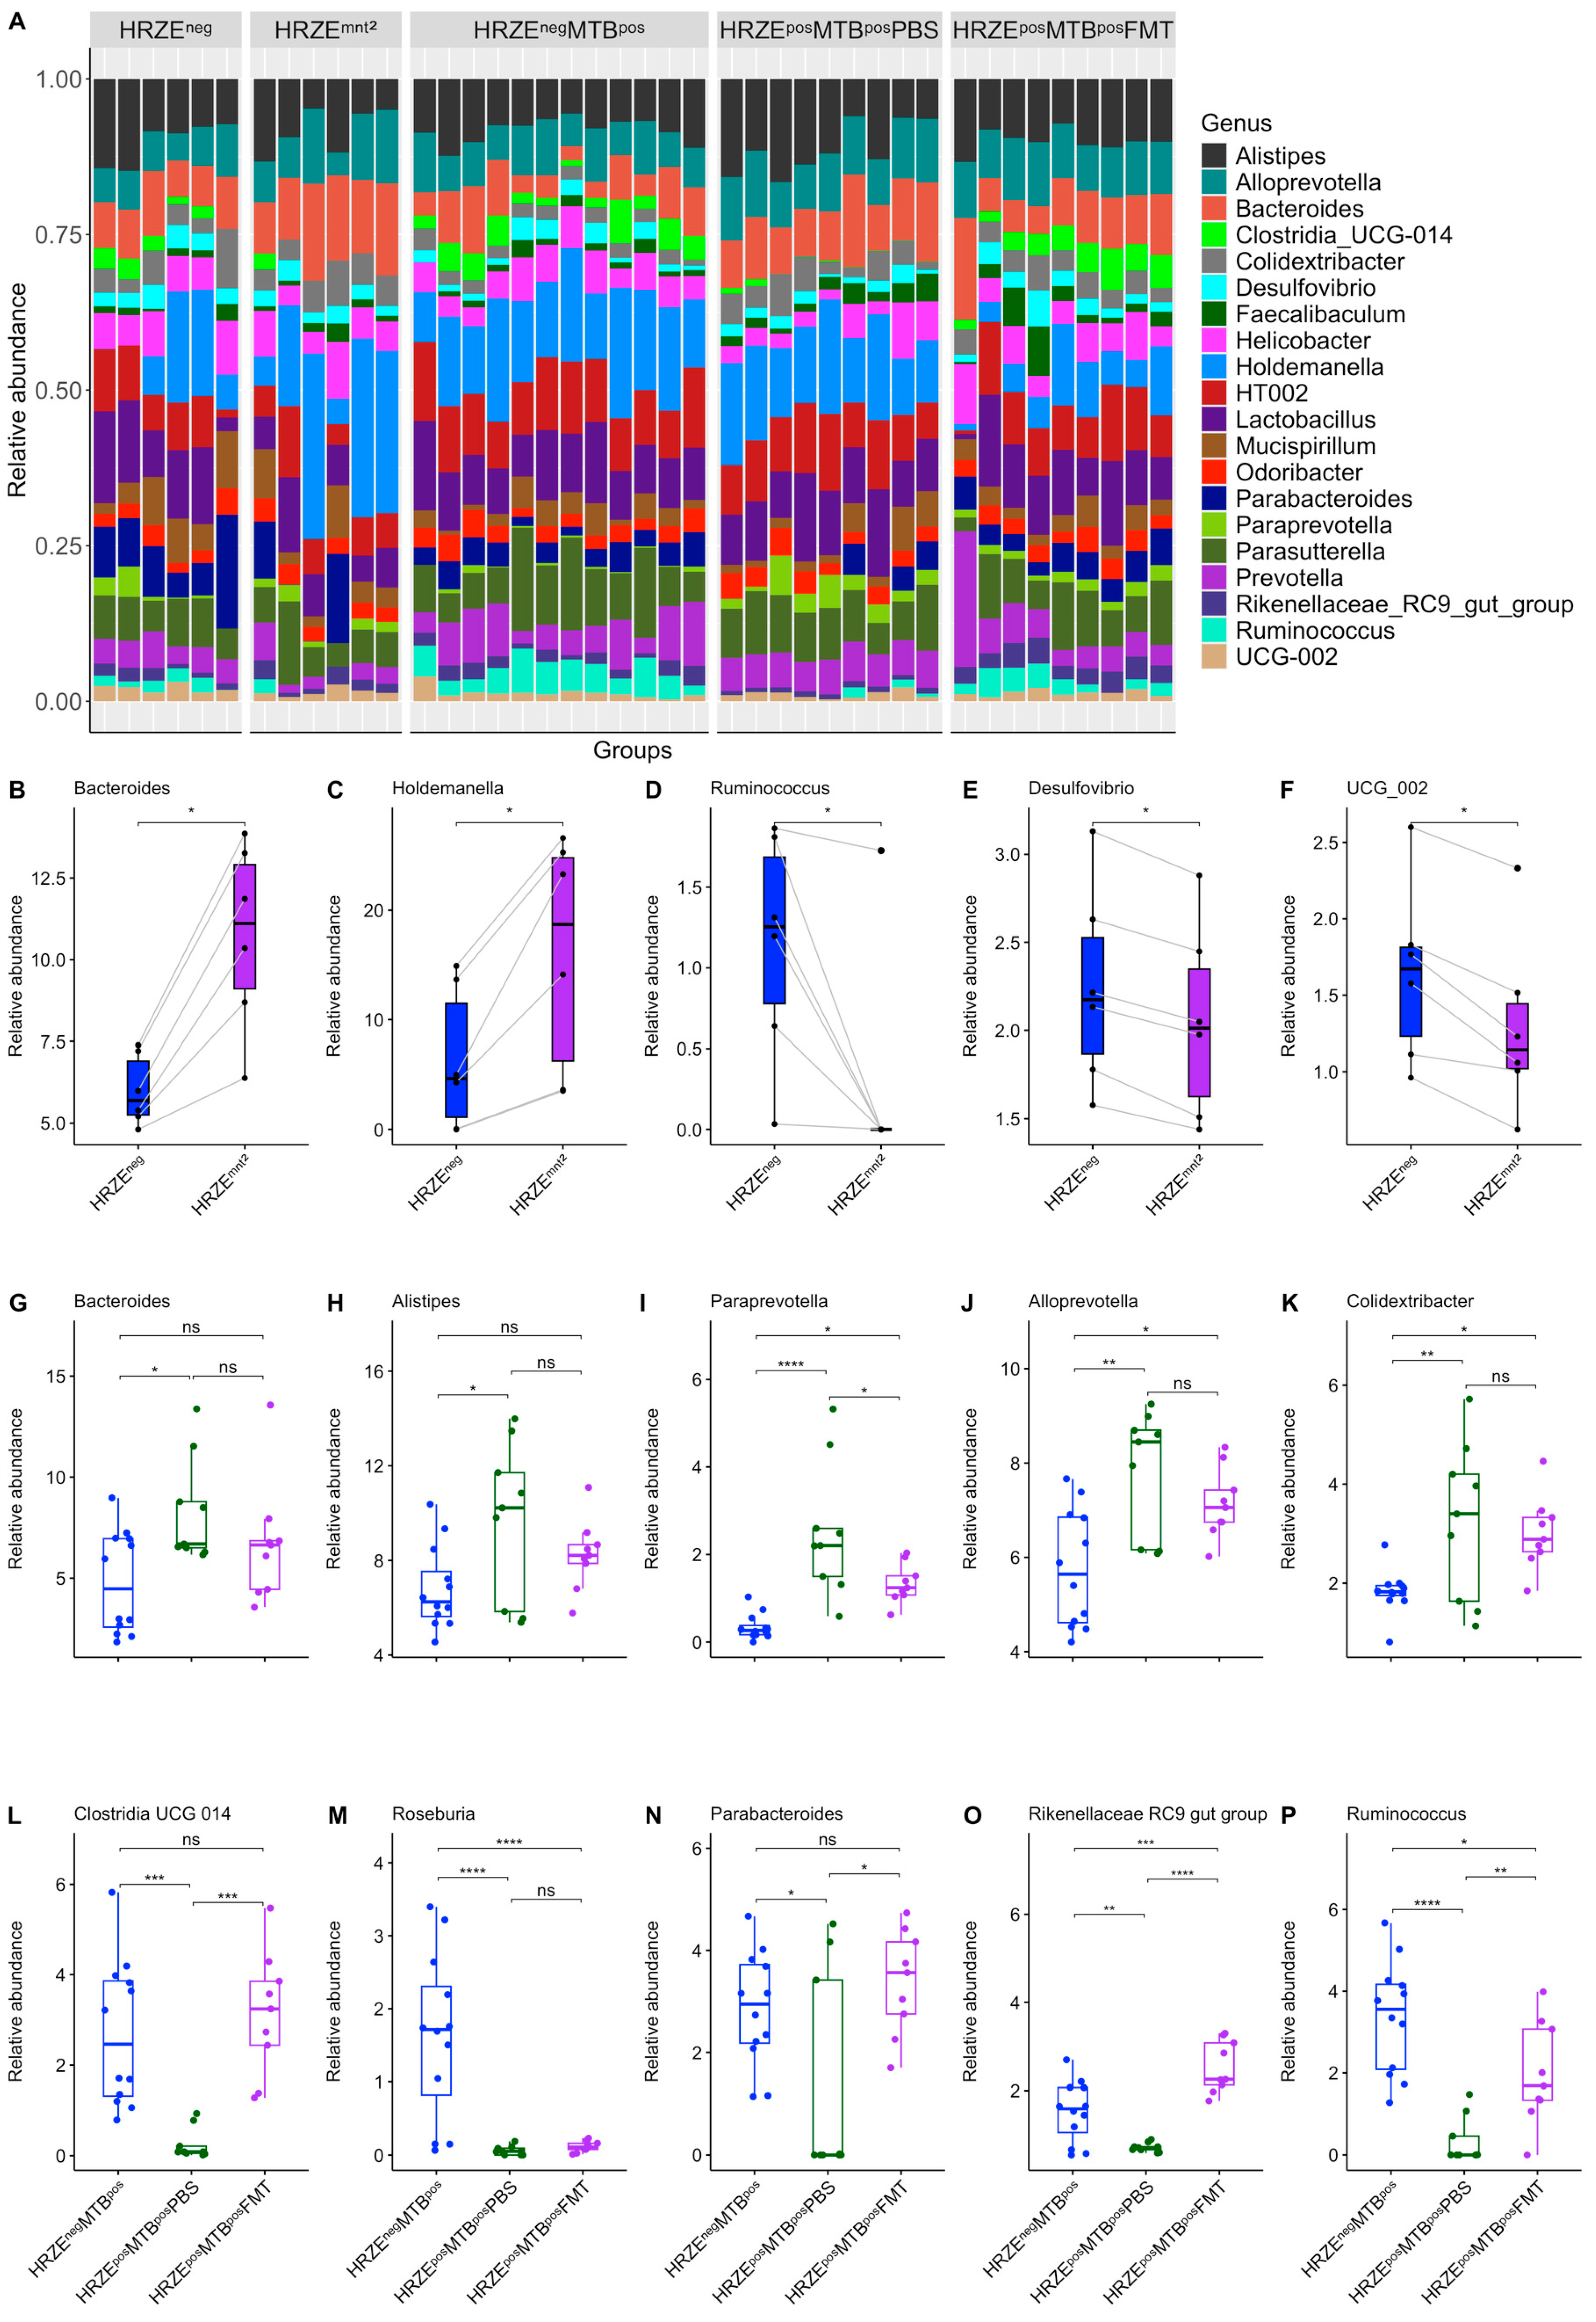
At the genus level, the relative abundance of Bacteroides and Holdemanella significantly increased in HRZEmnt2 compared to HRZEneg data, while Ruminococcus, Desulfovibro, and UCG 002 decreased (Figure 3A-F). Similarly, following Mtb infection of HRZE pre-treated mice, we observed a significant increase in the abundance of Bacteroides, Alistipes, Paraprevotella, Alloprevotella, and Colidextribacter in the HRZEposMTBposPBS compared to the HRZEnegMTBpos mice, while Clostridia UCG 014, Roseburia, Parabacteroides, Rikenellaceae RC9 gut group, and Ruminococcus were significantly depleted (Figure 3A, G-P). Although not entirely, the abundance of several differential genera was significantly restored in the HRZEposMTBposFMT mice to levels that were comparable to the abundance seen in the HRZEnegMTBpos mice (Figure 3A, G-P).
Figure 3.
HRZE treatment alters the gut microbiota composition. (A) Stacked bar plot of relative abundance of the top 20 most abundant genera. (B-F) The relative abundance of discriminatory genera between baseline and two months of HRZE treatment. (G-P) The relative abundance of discriminatory genera in HRZE-untreated Mtb-infected and HRZE pre-treated Mtb-infected mice administered PBS and FMT, respectively. Significant effects are denoted by nsp > 0.05. *p < 0.05, **p < 0.01, ***p < 0.001, ****p < 0.0001.
2.2. HRZE Pre-Treatment Is Accompanied by Significant Ileal Histomorphological Distortion
There is currently no data on the potential effect of the widely deployed HRZE antibiotics on intestinal histomorphology and integrity. Considering the impact of HRZE on the microbiota composition observed in our study, we examined whether these microbiota alterations were associated with changes in ileal histomorphology using the HRZEnegMTBpos mice as the control.
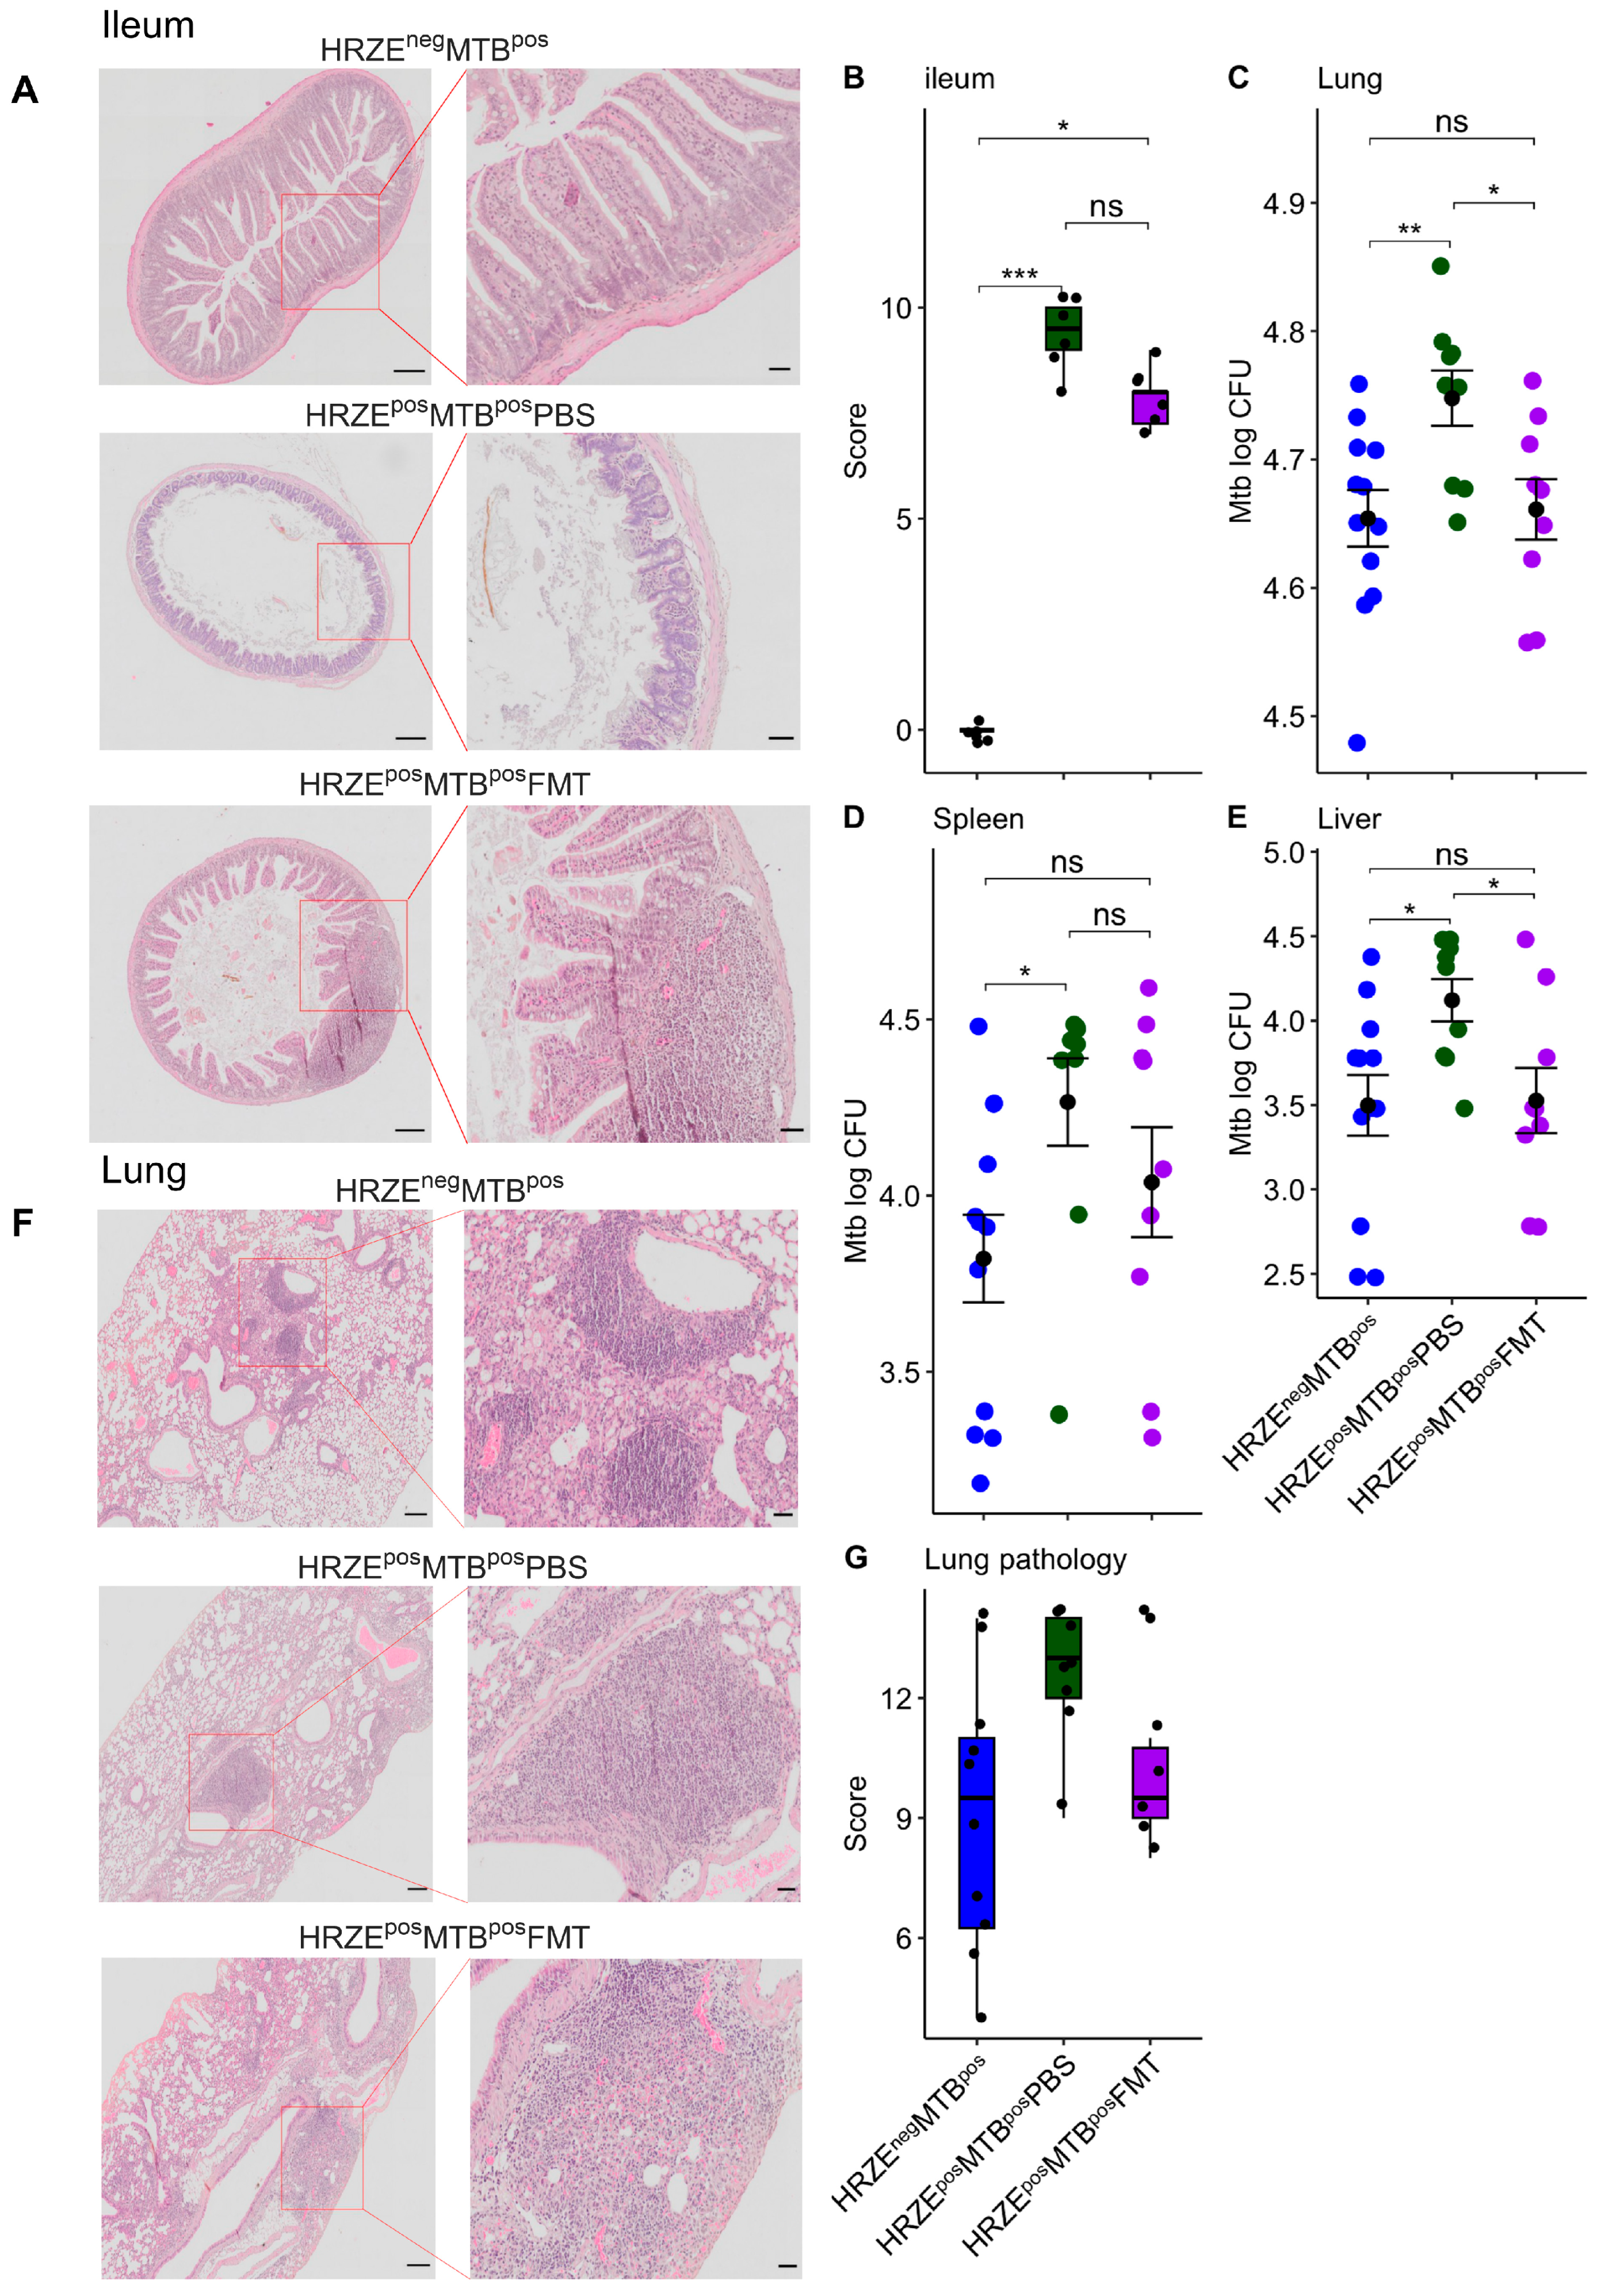
We found marked impairment in ileal features with striking crypt loss and alteration in epithelial and mucosal structure in the HRZEposMTBposPBS compared to the HRZEnegMTBpos mice (Figure 4A-B) (P < 0.001). Ileal features improved in HRZEposMTBposFMT compared to HRZEposMTBposPBS mice but differed from HRZEnegMTBpos mice (P < 0.05) (Figure 4A-B). Although we did not investigate ileal histomorphological impairment due to HRZE pre-treatment in the absence of Mtb infection, our data show the changes in histological morphology associated with HRZE antibiotics treatment for the first time.
Figure 4.
HRZE pre-treatment induced significant ileal histomorphological changes and increased Mtb burdens. (A) H&E-stained ileal sections. Scale bar (parent image left = 200µm, ROI right = 50µm). (B) Ileum histopathological scores. (C-E) Mtb burden in the lung, spleen, and liver. (F) H&E-stained lung sections. Scare bar (parent image left = 200µm, ROI right = 50µm). G Lung histopathological scores. Significant effects are denoted by nsp > 0.05, *p < 0.05, **p < 0.01, ***p < 0.001.
2.3. Gut Microbiota Alterations Are Associated with Increased Mtb Burdens
2.3.1. HRZE Pre-Treatment Followed by Mtb Infection Results in a Higher Mycobacterial Burden than with Infection Alone
To investigate whether the observed alterations to the gut microbiota influence the host’s susceptibility to Mtb infection, HRZE pre-treated mice were intranasally challenged with Mtb five days after stopping antibiotic exposure, and the infection was allowed to progress for 28 days. We observed significantly higher Mtb burdens in the HRZEposMTBposPBS lung compared to the HRZEnegMTBpos mice (p < 0.01) (Figure 4C). Significant dissemination of the bacilli to the spleen and liver was also seen in the HRZEposMTBposPBS compared to their HRZEnegMTBpos mice (Figure 4D-E) (P < 0.05, respectively). Lung histopathological severity scores did not differ statistically between the two groups, although a higher trend in severity scores was seen in the HRZEposMTBposPBS mice (Figure 4F-G).
2.3.2. Faecal Microbiota Transplantation Reverses Mtb Numbers in HRZE Pre-Treated Mtb-Infected Mice
To establish whether the observed increase in Mtb burden in HRZEposMTBposPBS mice was associated with changes in the gut microbiota, HZRE pre-treated mice received five FMT with faecal slurry prepared from HRZE untreated mice. We found significantly higher Mtb burdens in the lungs of the HRZEposMTBposPBS compared to the HRZEposMTBposFMT mice (P < 0.05) (Figure 4C). Significantly higher dissemination was also seen in the liver of the HRZEposMTBposPBS compared to the HRZEposMTBposFMT mice (P < 0.05) but not in the spleen (Figure 4D-E) (P > 0.05). We found no differences in the lung histopathological severity scores between the HRZEposMTBposPBS and the HRZEposMTBposFMT mice (Figure 4F-G).
2.4. Gut Microbiota Dysbiosis Alters Immune Cells and Secreted Cytokine Profiles
2.4.1. HRZE Pre-Treatment Followed by Mtb Infection Correlates with Diminished CD4+ T Cells and CD68+ Macrophage Frequencies and Aberrated Cytokine Secretion
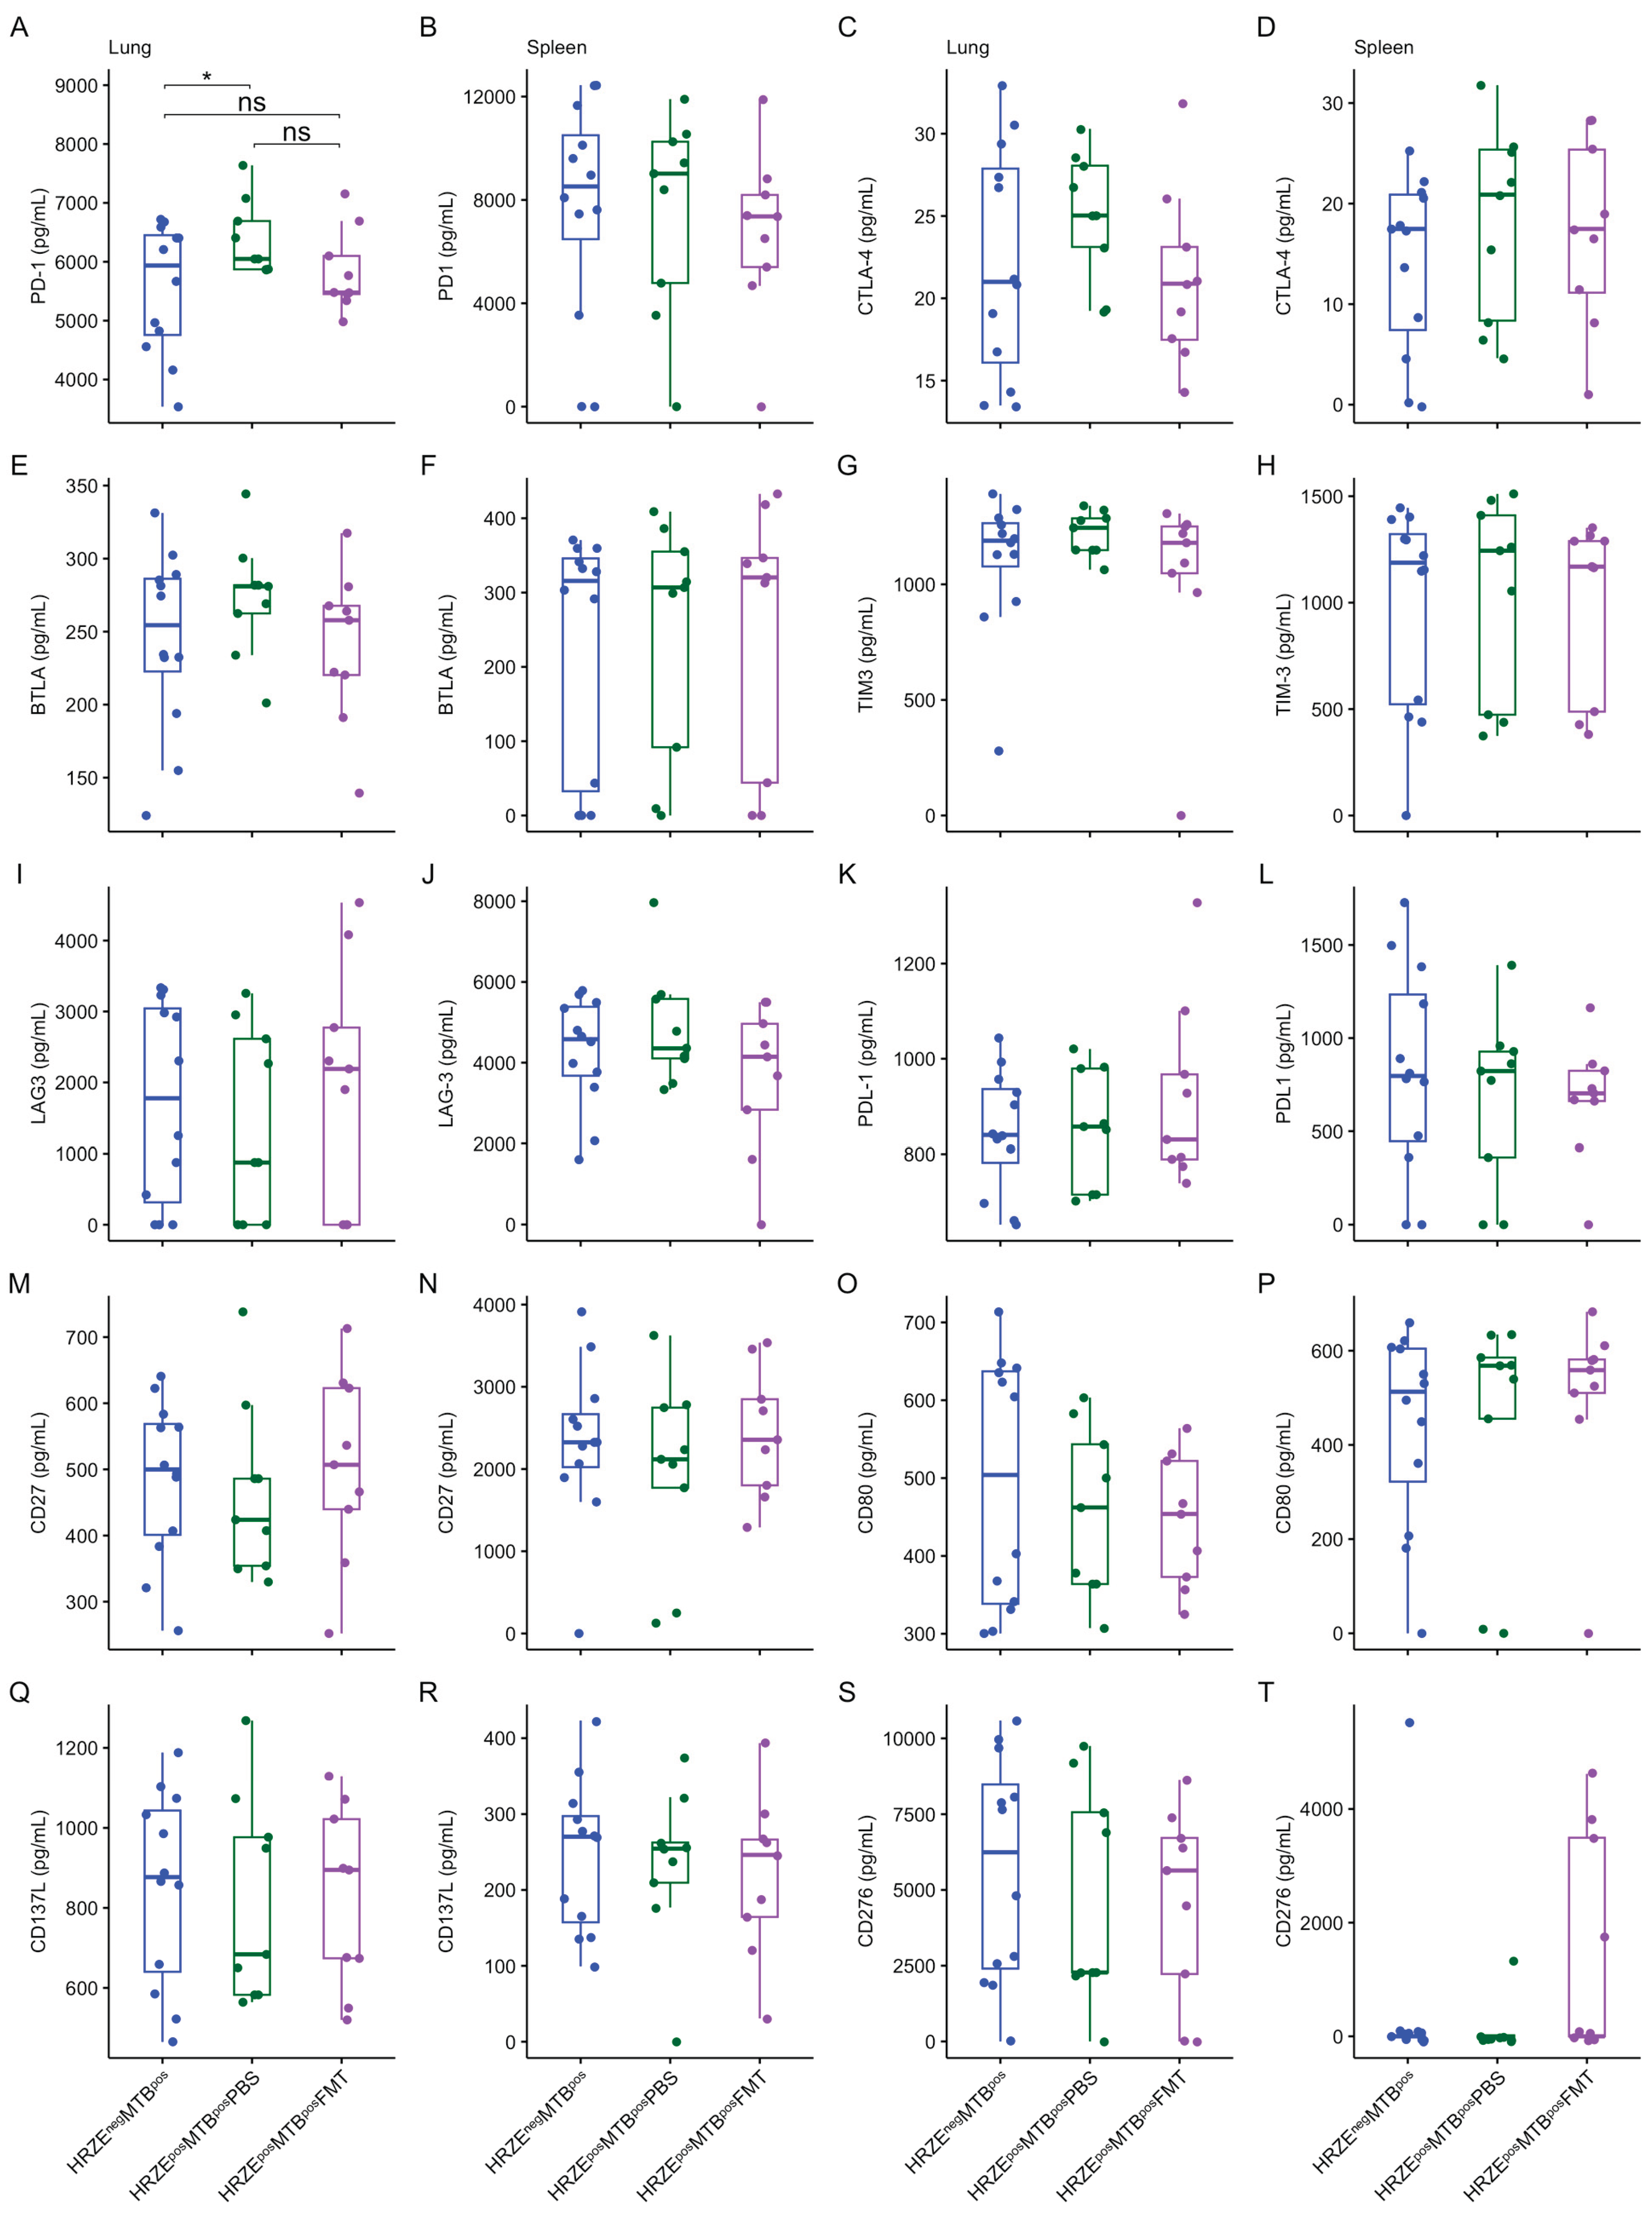
Next, we investigated immune factors possibly associated with increased Mtb susceptibility in HRZE pre-treated mice using immunohistochemical staining and Luminex assay. Although modest, we found a significantly lower proportion of CD4+ T cells and CD68+ macrophages in the lungs of the HRZEposMTBposPBS compared to HRZEnegMTBpos mice (Figure 5A-C) (P < 0.05). We observed no differences in the proportions of CD8, CD14, Ly6G, B220, and HMGB1, a proinflammatory danger signal, between the groups (Figure 5A, D-H). HRZEposMTBposPBS showed significantly elevated IFN-γ, IL-6, and PD-1 concentrations in the lung compared to the HRZEnegMTBpos mice (Figure 6A-D and Figure 7A-B) (P < 0.05, respectively). No differences were seen in the other cytokines and proteins measured in the lung and spleen supernatants (Figure 6E-T and Figure 7C-T).
Figure 5.
Reduced frequencies of CD4+ T cells and CD68+ macrophages in the lung of HRZE-pre-treated Mtb-infected mice. Altered CD4+ T cells and CD68+ proportion in HRZE-pre-treated Mtb-infected mice are rescued by FMT. (A) immunohistochemistry-stained lung sections for CD4, CD8, CD68, CD14, Ly6G, B220 and HMGB1 antibody. Scale bar = 50µm. (B-H) Proportion of immune phenotypes. Significant effects are denoted by nsp > 0.05; *p < 0.05.
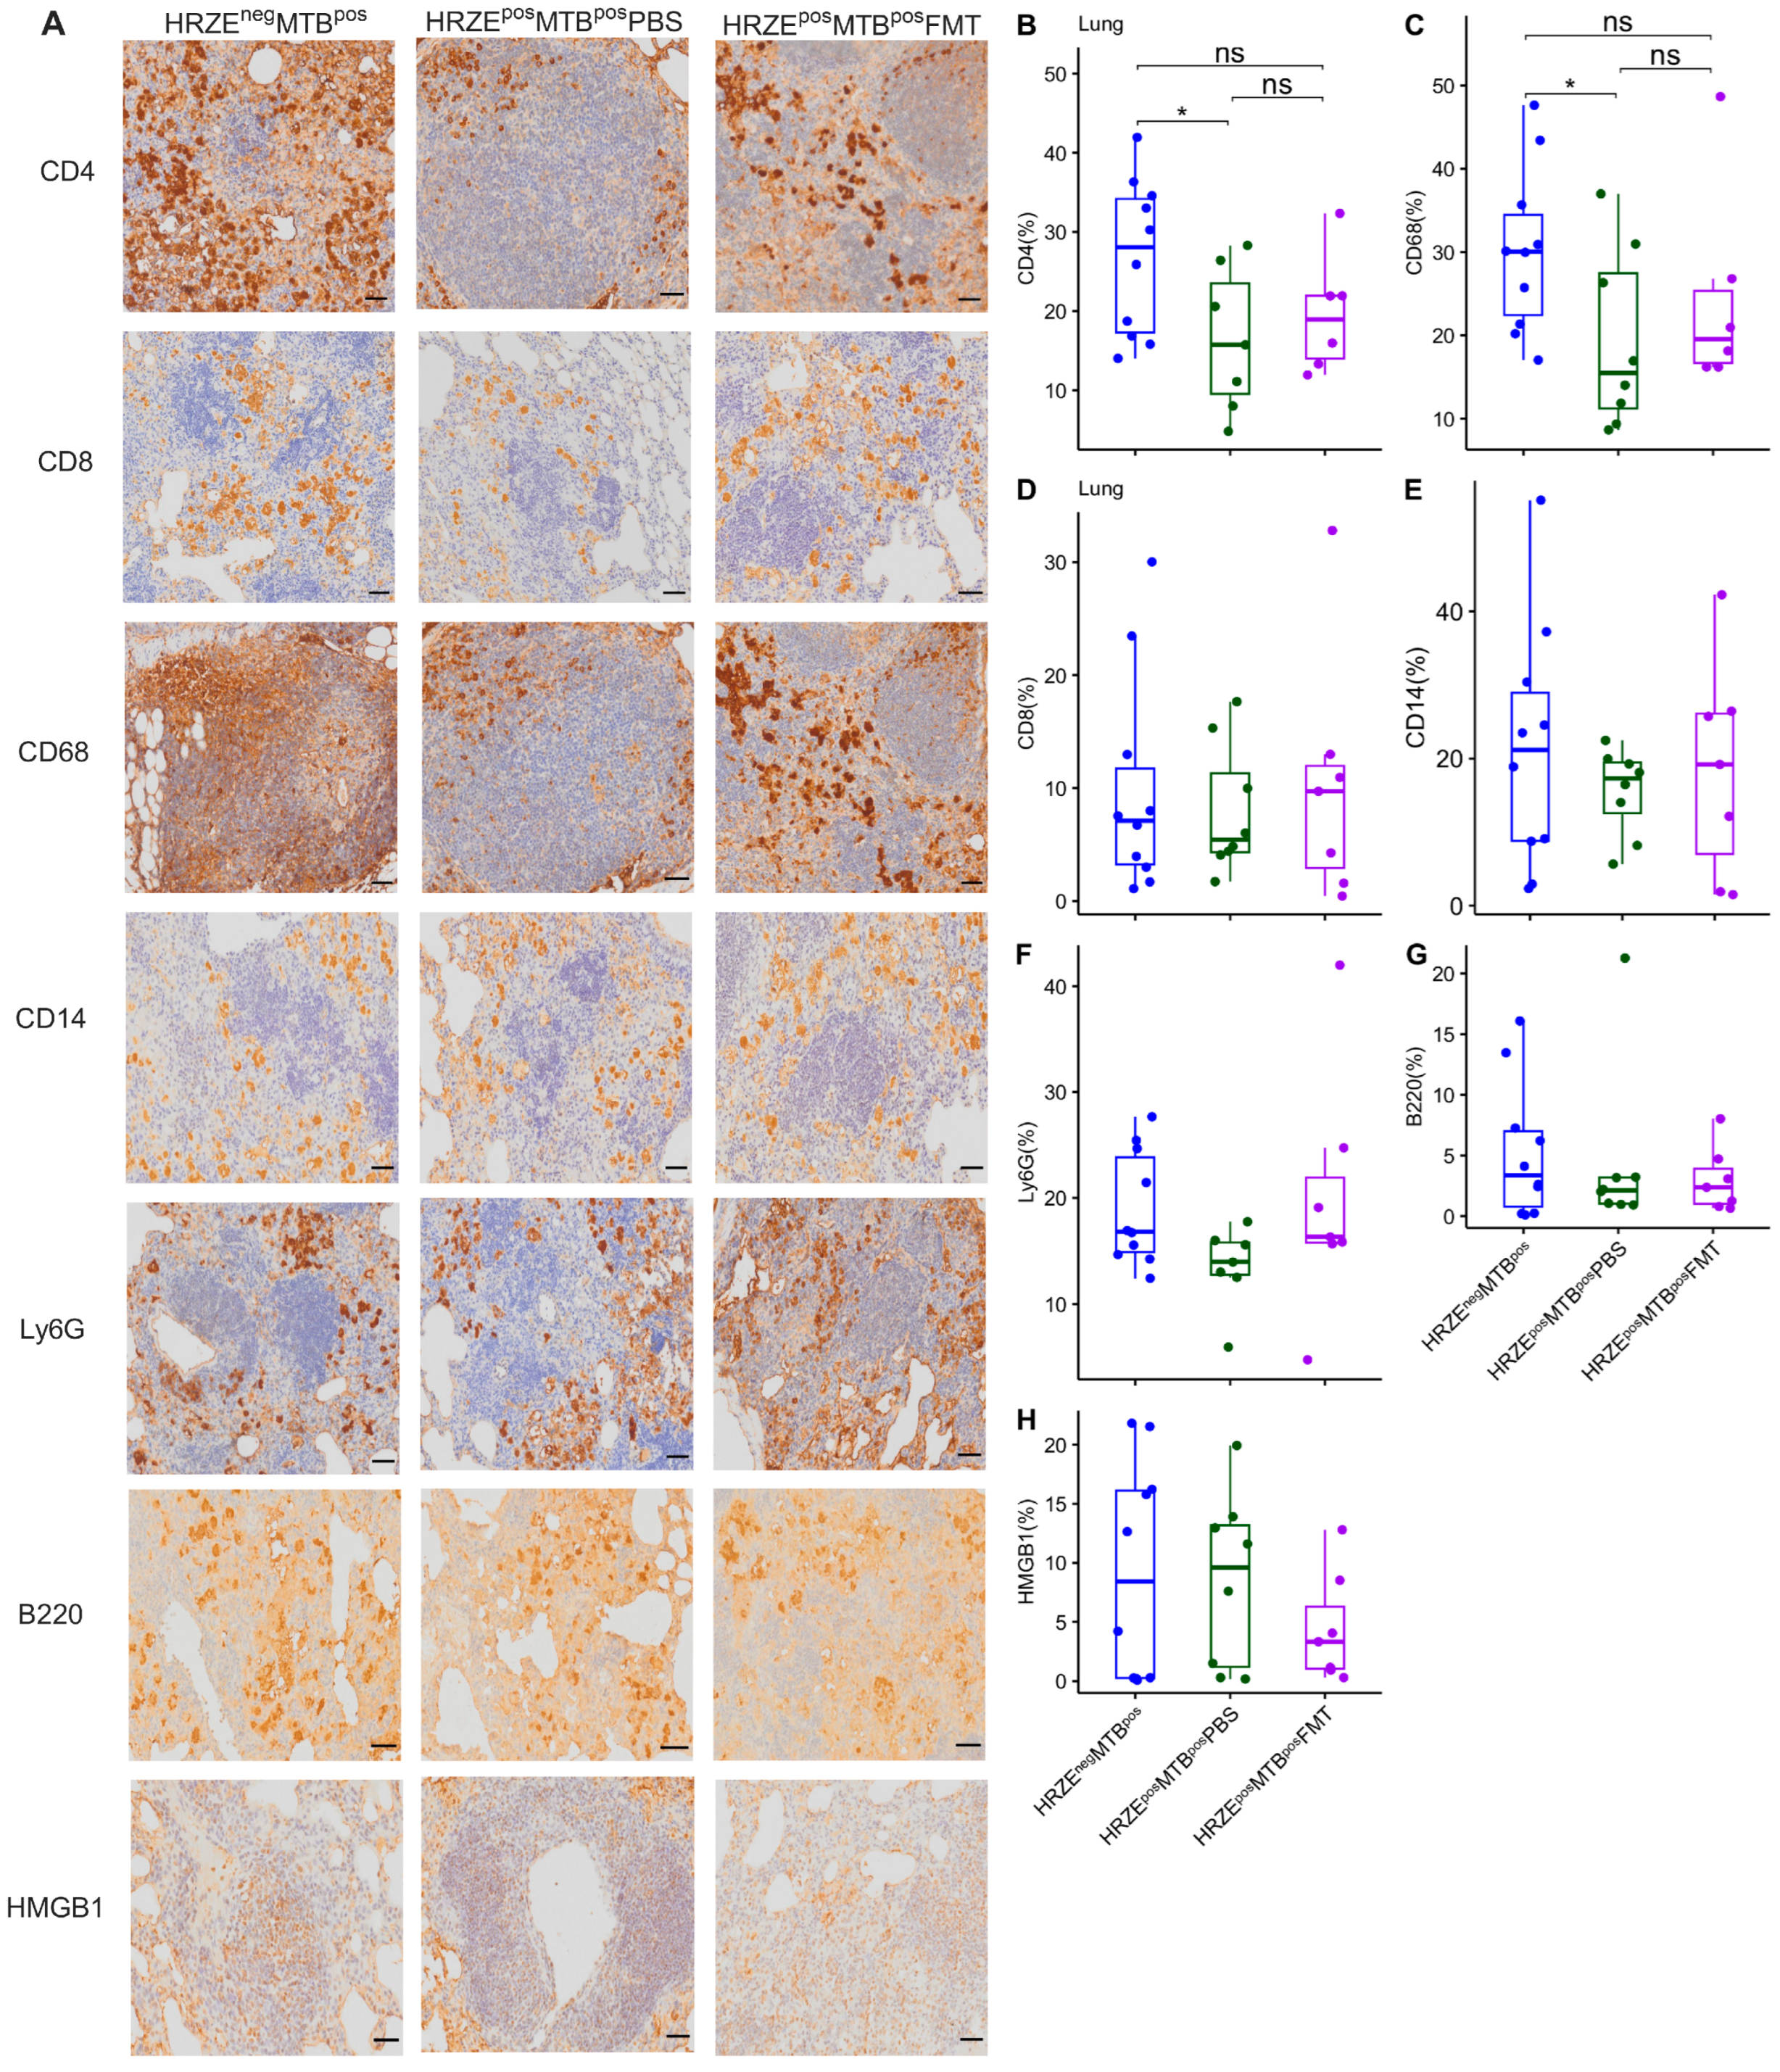
Figure 6.
(A-T) Box plots of secreted cytokine concentrations in the lung and spleen. Significant effects are denoted nsp > 0.05; *p < 0.05. All units are in pg/mL.
Figure 6.
(A-T) Box plots of secreted cytokine concentrations in the lung and spleen. Significant effects are denoted nsp > 0.05; *p < 0.05. All units are in pg/mL.
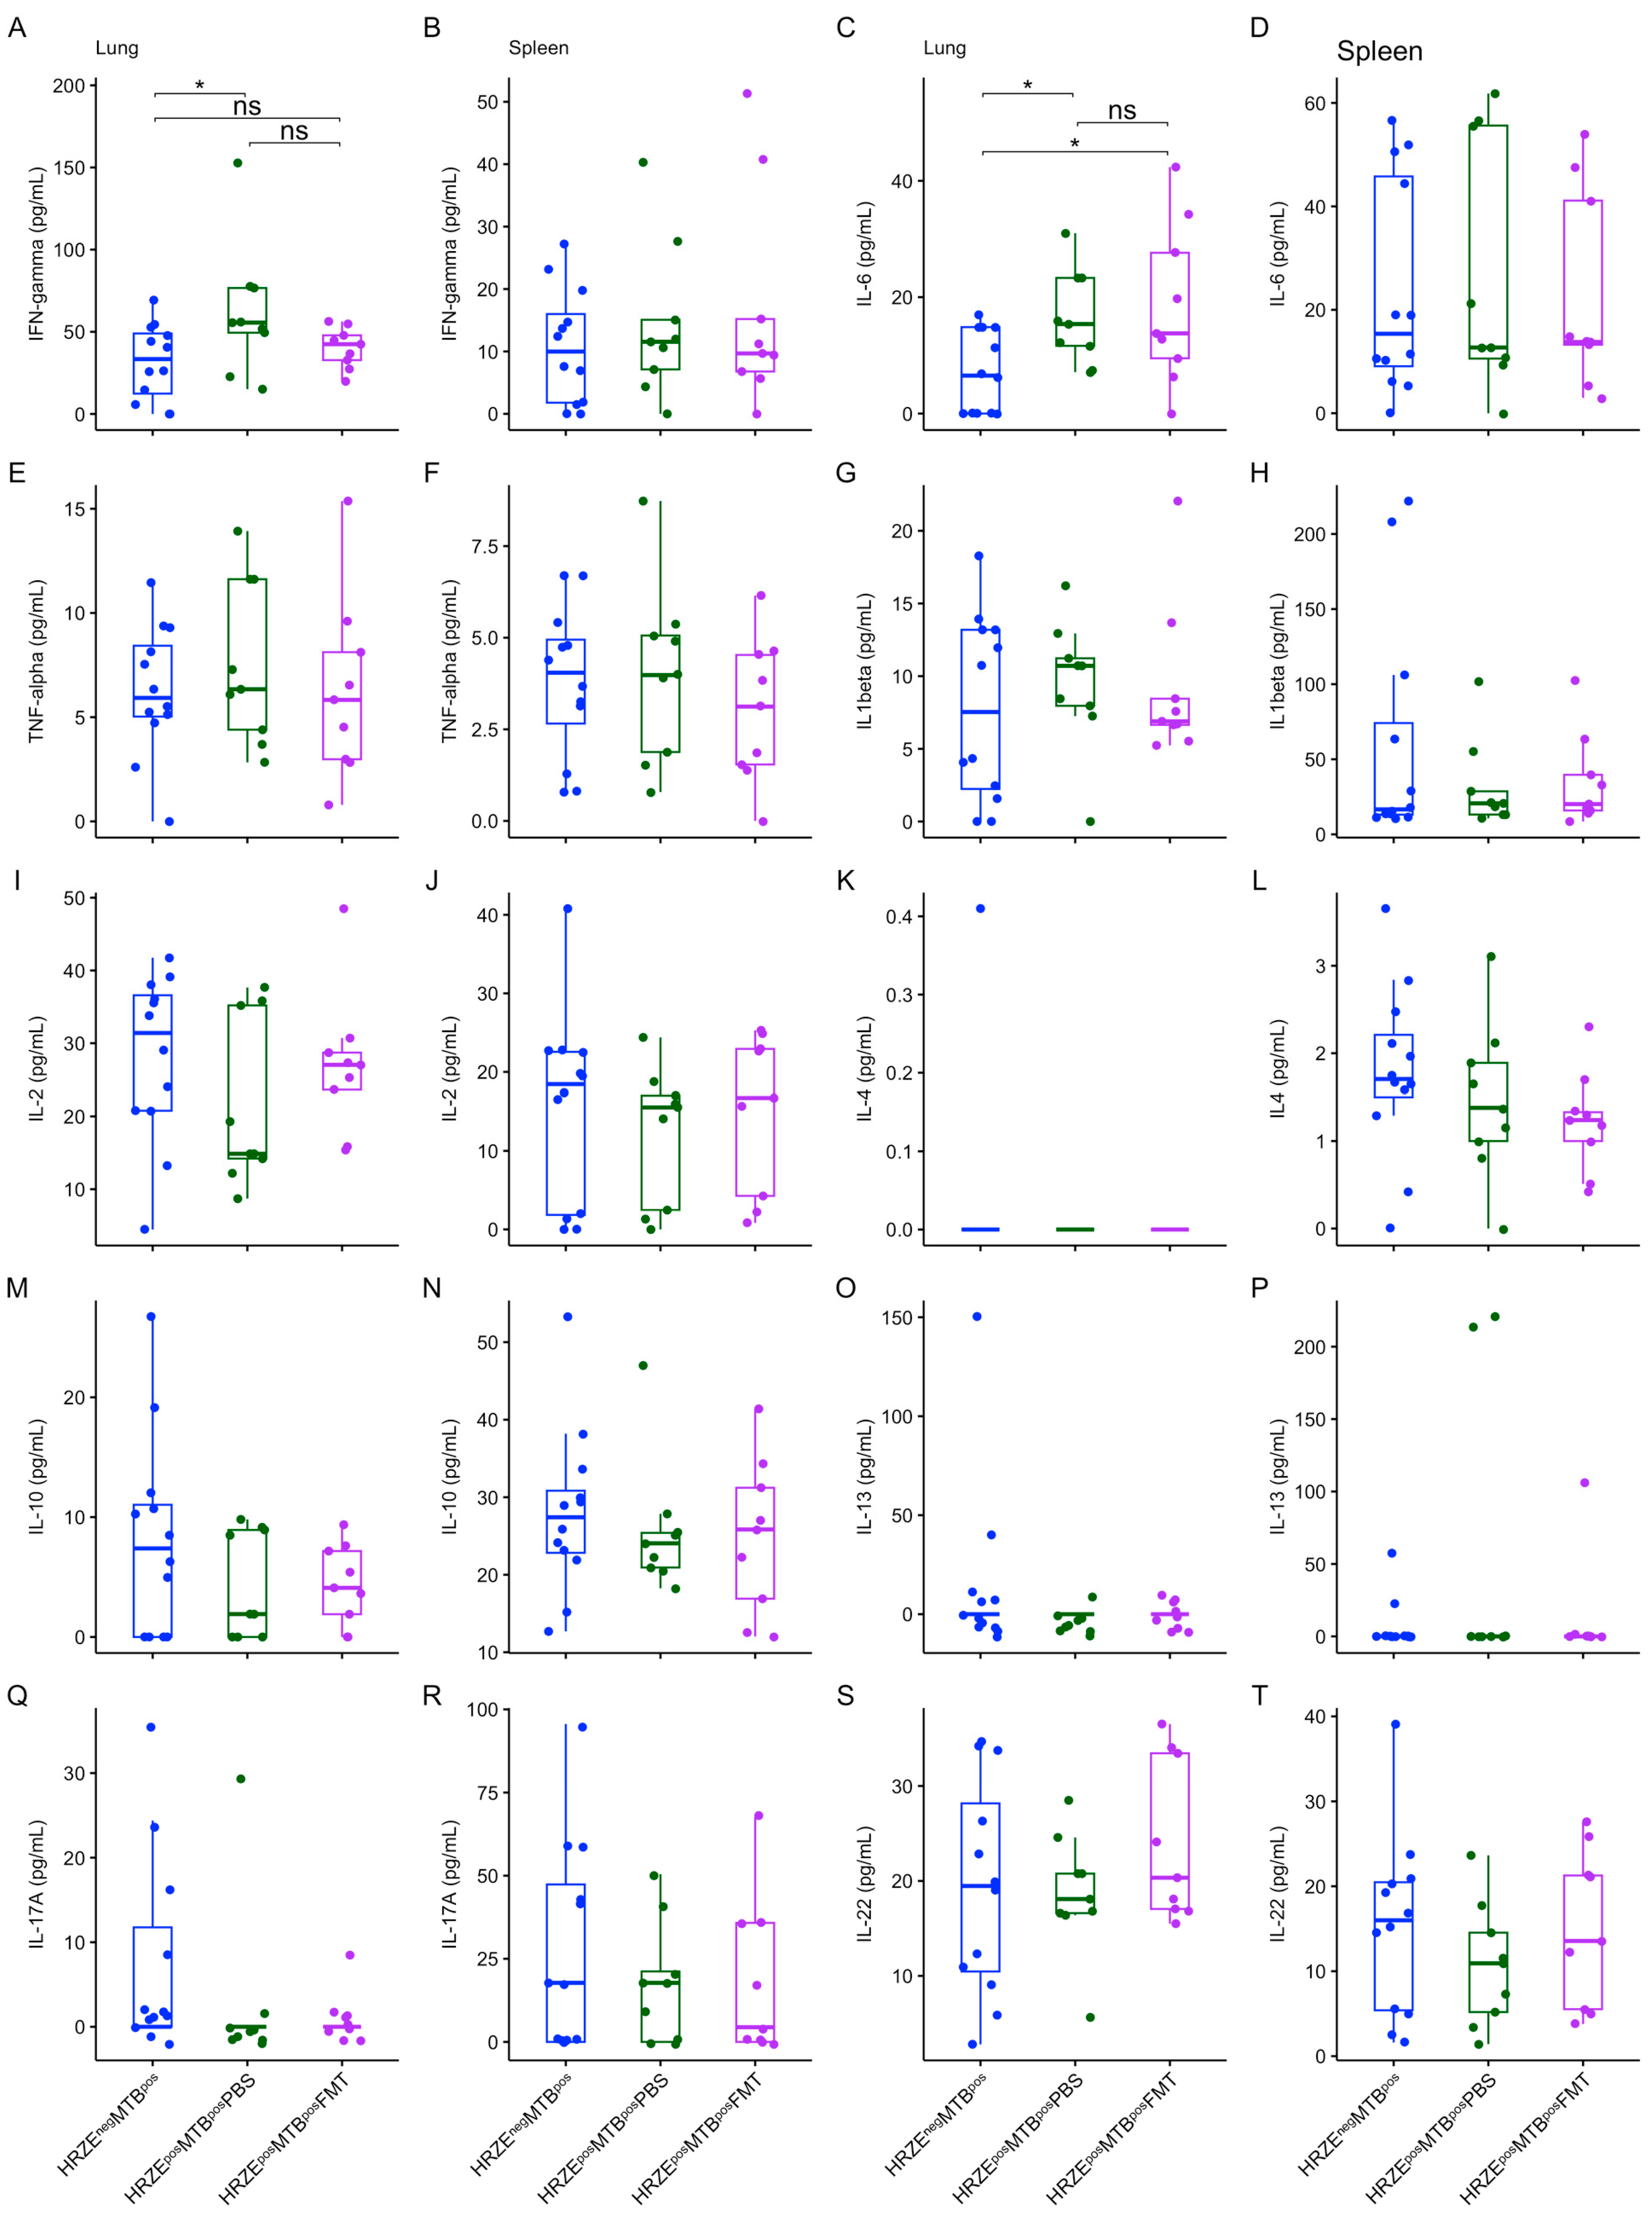
Figure 7.
(A-T) Box plots of secreted immune checkpoint protein concentrations in the lung and spleen. Significant effects are denoted nsp > 0.05; *p < 0.05. All units are in pg/mL.
Figure 7.
(A-T) Box plots of secreted immune checkpoint protein concentrations in the lung and spleen. Significant effects are denoted nsp > 0.05; *p < 0.05. All units are in pg/mL.
2.4.2. Faecal Microbiota Transplantation Partly Rescued Aberrated Lung Immune Profile in HRZE Pre-Treated Mtb-Infected Mice
We assessed the impact of FMT performed on the HRZE pre-treated Mtb-infected mice on the immune parameters. We found no differences in the proportion of CD4+ T cells and CD68+ macrophages in the HRZEposMTBposFMT compared to the HRZEnegMTBpos mice (Figure 5A-C) (P > 0.05), suggesting a trend towards reversal of the effect of microbiota dysbiosis on these cells. A higher trend in the proportion of CD4+ T cells and CD68+ macrophages was seen in the HRZEposMTBposFMT compared to the HRZEposMTBposPBS mice, but did not reach statistical significance (Figure 5A-C). Furthermore, the concentrations of lung IFN-γ and PD-1 in HRZEposMTBposFMT mice were not significantly different compared to the HRZEnegMTBpos animals (Figure 6A and 7A) (P > 0.05), also suggesting a trend towards reversal. However, the concentration of lung IL-6 remained significantly higher after FMT (HRZEposMTBposFMT versus HRZEnegMTBpos (P < 0.05) (Figure 6C).
3. Discussion
Alterations in the gut microbiota composition induced by antibiotics are reported to increase susceptibility to Mtb [11,12]. In this study, we investigated the effect of the widely deployed HRZE on the gut microbiota composition, its impact on the host immune response, and the control of Mtb infection.
Consistent with the existing literature, HRZE induced significant compositional differences in individual gut microbiota composition, with a modest effect observed in alpha diversity, showing a trend towards reduction in the HRZE-pretreated mice. Isoniazid, pyrazinamide, and ethambutol are narrow-spectrum antibiotics against mycobacteria and have been shown to cause a shift in individual gut microbiota composition [18,19]. Rifampicin, on the other hand, has broad-spectrum activity but was used at a low concentration due to its limited solubility in water, which requires an organic solvent for pre-dissolution. Therefore, it was unsurprising that while we noted minimal changes in the alpha diversity (within-sample), beta diversity (between-sample) and taxa composition significantly differed during the two months following HRZE treatment. This finding is consistent with similar studies, which have shown no changes in alpha diversity in mice pre-treated with a combination of isoniazid and pyrazinamide or isoniazid and pyrazinamide alone [18,19].
Available evidence suggests that the gut microbiota plays a critical role in maintaining the intestine's structural integrity, including regulating villi and crypt development, epithelial cell growth and differentiation, and modulating gut barrier functions [23,24]. Accordingly, gut microbiota perturbation may result in an overgrowth of pathobionts damaging the intestinal barrier [25]. To our knowledge, our study is the first to show the histomorphology changes induced by HRZE on intestinal histomorphology and the recuperative effect of faecal microbiota transplantation (FMT) on ileal features. Also significant was the restoration of the abundance of several microbiota taxa, which differed between the HRZE-pretreated mice that received PBS and the HRZE-untreated group following FMT. In this regard, FMT not only increased the composition of depleted genera (for example, Clostridia UCG 014, Parabacteroides, and Ruminococcus) but also reduced the composition of genera whose compositions were enriched by HRZE in the PBS group (for example, Bacteroides, Alistipes, and Paraprevotella), indicating the efficacy of FMT to both enrich and reduce/normalise altered taxa composition.
Intestinal histomorphology impairment can increase bacterial and metabolite translocation across the intestinal barrier, resulting in systemic inflammation [26,27,28,29]. Furthermore, metabolites may also be translocated to the lung, which directly modulates the local immune response, influencing the infection outcome. We have previously hypothesised mechanisms whereby gut microbiota/metabolites may directly participate during Mtb infection in the lung [30]. Therefore, manipulating the gut microbiome through FMT or transplantation of a microbiota cocktail demonstrated in our study may become a useful intervention to normalise the altered gut microbiome during anti-TB treatment, to improve gut barrier integrity, and reduce bacterial and metabolite translocation across the gut barrier. Additionally, given that the small intestine harbours important immunological sites, a key consideration in future studies may be investigating how changes in intestinal histomorphology induced by HRZE antibiotics affect local immunity in the gut.
A previous study by Khan and colleagues reported increased Mtb burdens in isoniazid/pyrazinamide-pre-treated mice associated with impaired alveolar macrophage metabolism. Here, we found that increased Mtb burdens and pulmonary pathology in the HRZE pre-treated mice were associated with reduced frequencies of CD4+ T cells and CD68+ macrophages and elevated PD-1, IFN-γ, and IL-6 in the lung. Although the magnitude of alterations in immune phenotypes between the HRZE-untreated Mtb-infected and HRZE-pretreated mice that received PBS was modest, the impact on Mtb burden control suggests a relevant biological and functional effect. Furthermore, performing five FMTs restored CD4+ T cells, CD68+ macrophages, PD-1, and IFN-γ (but not IL-6) to levels not significantly different from HRZE-untreated Mtb-infected control mice, suggesting that microbiota reconstitution may be valuable to augment host immunity and regulate physiological balance in the number or threshold of immune components/response during anti-TB therapy, possibly reducing the likelihood of TB recurrence.
CD4 T cells and macrophages play pivotal roles during Mtb infection. Macrophages are the primary host cell target and the first line of defence against Mtb. Indeed, poor control of Mtb growth in mice treated with broad-spectrum antibiotics was shown to be associated with reduced proportions of splenic IFNγ+ and TNF+ CD4+ T cells, accompanied by increased FoxP3+ Treg cells in a previous study [11]. Furthermore, a mouse study demonstrated that gut microbiota dysbiosis led to reduced frequency, activation, and responses of mycobacteria-specific CD4 and CD8 T cells and thwarted the generation of lung-resident and effector memory T cells [31].
Typically, Mtb infection switches host responses towards a pro-inflammatory Th1 cytokine profile. However, a delicate balance is necessary between the pro- and anti-inflammatory cell and cytokine milieus for an effective response. IFN-γ and IL-6 are pro-inflammatory cytokines that play critical roles in the immune response against Mtb. However, they could accelerate the spread of Mtb infection, mainly when secreted above the threshold required for a balanced and effective immune response [32]. Indeed, aberrant IFN-γ secretion can potentially cause tissue damage, necrosis, and excessive inflammation and has been linked to the progression of TB disease and severe pathology [33,34]. It has also been reported that Mtb may strategically upregulate IL-6, an event that suppresses macrophage responses to IFN-γ and inhibits type II interferon signalling [35,36].
While available reports are contradictory, PD-1 and other immune checkpoint proteins may play a crucial regulatory role during the immune response to Mtb infection. A recent study by Mitra and colleagues showed that blocking PD-1 in Mtb-infected mice restored polyfunctional T cell numbers, decreased Tregs, reduced Mtb lung burden and disseminated infection [37]. On the contrary, Kauffman and colleagues reported that treatment of macaques with anti-PD-1 antibodies increased the number and effector functions of Mtb-specific CD8 T cells and proinflammatory cytokines in the granulomas, which correlated with worse disease outcomes and higher Mtb loads [38]. Members of the family Ruminococcaceae were highly abundant in the anti-PD-1-treated macaques that showed increased Mtb burdens [38]. These studies suggest that elevated PD-1 expression or secretion during Mtb infection may reduce the functional capacity of Mtb-specific T-cell responses.
Although our study did not investigate the functional consequence of the increased PD-1 in the HRZE pre-treated Mtb-infected mice, it has been suggested that the protective response of CD4 T cells may require negative regulation of IFN-γ secretion by PD-1 to prevent lethal immune-mediated pathology [39]. Along these lines, to explain the increased lung levels of PD-1, IFN-γ, and IL-6 in the HRZE pre-treated mice following Mtb infection and the associated increased Mtb burdens, we hypothesise that the microbiota dysbiosis induced by the anti-TB antibiotics may have dysregulated host immune mechanisms leading to excess secretion of pro-inflammatory IFN-γ and IL-6, an event that required the counter-overproduction of inhibitory PD-1 to forestall the heightened pro-inflammatory Mtb response. In other words, increased inflammation led to a corresponding increase in PD-1 induction, which was counterproductive to optimal anti-TB immunity.
The study has some limitations. Although murine models offer valuable insights, they have inherent limitations in accurately recapitulating human TB disease. Within this context, we have used C57BL/6 mice, which are considered resistant to Mtb. In future studies, the same experimental approach may be tested in mice genetically susceptible to Mtb, such as C3HeB/FeJ or DBA/2J mice. Additionally, we did not investigate ileal histomorphological impairment due to HRZE pre-treatment in the absence of Mtb infection. Nevertheless, whether the Mtb infection amplified the intestinal impairment following HRZE pre-treatment, the improved ileal features in the FMT mice infected with Mtb suggest a role of the gut microbiota in maintaining intestinal integrity.
Furthermore, it is also unlikely that the impact of HRZE pre-treatment on immune parameters was a direct effect of the antibiotics and not associated with microbiota dysbiosis. The assumption is supported by the partial rescue of immune phenotypes by FMT. Besides, the proportion of immune parameters did not differ between the HRZE pre-treated Mtb-infected FMT mice and the HRZE-untreated Mtb-infected mice. Also, earlier time points may be considered in future studies to measure the immediate impact of HRZE antibiotics on both the gut microbiota and immune phenotypes.
Our study also did not measure microbiota dysbiosis in the lung compartment instigated by HRZE treatment. Anti-TB antibiotics cause significant microecological imbalances in the resident bacteria of the respiratory tract [40,41,42], and our results may be partly influenced by dysbiosis in the pulmonary microbiota. Additionally, the functional role of CD4 T cells and macrophages may be elucidated in mechanistic studies, for example, by adoptive transfer of CD4 T cells and macrophages isolated from FMT mice to HRZE-pre-treated mice to determine if observed phenotypes are rescued.
To conclude, although modest changes were observed in some parameters, overall, this study has shown that HRZE treatment followed by Mtb infection results in greater microbiota dysbiosis, mycobacterial load, altered immune profile, and histomorphological impairment than in mice infected with Mtb without HRZE pre-treatment. This study may provide some explanation as to why people treated previously for TB have a higher risk of getting TB again. Furthermore, we show that these impaired phenotypes are potentially rescuable via faecal microbiota transplantation. These data suggest a potential therapeutic avenue for mitigating the effects of HRZE-induced microbiota dysbiosis and associated impairments and open avenues for further research into microbiota-targeted interventions for TB management.
4. Materials and Methods
4.1. Mice
Eight-week-old male and female specific pathogen-free C57BL/6 mice were bred in the Animal Biosafety Level 3 (ABSL3) Laboratory at Tygerberg Campus, Stellenbosch University. Four to five mice per group (total n=45) were housed in ventilated temperature and humidity-controlled cages within the ABSL3 on a 12-hour light-dark cycle under pathogen-free conditions and fed an autoclaved diet and water. Each experimental group was assigned male and female animals of similar ages. However, male and female mice were caged separately, and cage positions randomised during the experiments. The experimental protocol was approved by the Stellenbosch University Animal Care and Use Ethics Committee (ACU-2020-15458).
4.2. Anti-Tuberculosis Antibiotics Treatment
We pre-treated groups of mice with a combination of isoniazid (H) (25mg/kg), rifampicin (R) (1mg/kg), pyrazinamide (Z) (25mg/kg), and ethambutol (E) (150mg/kg), (HRZE) (Sigma Aldrich) in drinking water for two months (Fig. 1). Rifampicin was first dissolved in 50 µL dimethyl sulphoxide (DMSO) before mixing in autoclaved tap drinking water (final DMSO concentration = 0.005%). Antibiotic-containing water was replaced with a new preparation at 4-day intervals. Control groups received autoclaved tap water.
4.3. Intranasal Mtb Infections
The Mtb H37Rv strain was grown in Middlebrook 7H9 media (BD Biosciences). The media was supplemented with 10% oleic acid–albumin-dextrose catalase (OADC) (BD Biosciences) and 0.5% glycerol (Sigma Aldrich) [19]. Five days after stopping antibiotic treatment, we infected HRZE pre-treated mice intranasally with approximately 100 colony-forming units (CFU) of Mtb (Fig. 1). Briefly, the animals were anaesthetised with ketamine (80mg/kg) and xylazine (5 mg/kg), and 30 µL of a 3.3 x 10³ CFU/mL H37Rv suspension was delivered into the external nares of the animals [43]. A day after Mtb infection, CFU numbers were confirmed by plating lung homogenates of five euthanised mice on Middlebrook 7H11 media (BD Biosciences) supplemented with 10% OADC (Sigma-Aldrich). HRZE-untreated Mtb-infected mice were the control animals (Figure 1).
4.4. Preparation of Faecal Slurry and Reconstitution of Mouse Microbiota
We collected 6-10 faecal pellets from antibiotics-untreated mice in 4 ml phosphate-buffered saline (PBS) for faecal microbiota transplant (FMT). The faecal pellets were vortexed, and the suspension was centrifuged at 800x g for 2 mins to remove the debris. Individual mice in separate groups of HRZE pre-treated mice were gavaged with 200µL faecal slurry or PBS, respectively (Figure 1). The FMT and PBS administration was done a day before infecting the mice with Mtb and on days 1, 3, 5, and 14 post-infection (Figure 1).
4.5. Experimental Groups
The experimental groups include i) HRZE-untreated mice (HRZEneg), ii) Mice treated with HRZE for two months (HRZEmnt2), iii) HRZE-untreated mice infected with Mtb (HRZEnegMTBpos), iv) Mice pre-treated with HRZE for 2 months, followed by Mtb infection and PBS gavage (HRZEposMTBposPBS), and v) Mice pre-treated with HRZE for 2 months, followed by Mtb infection and FMT gavage (HRZEposMTBposFMT).
4.6. DNA Isolation, 16S Ribosomal Ribonucleic Acid (rRNA) Gene Sequencing and Analysis
Fresh faecal pellets were collected from all experimental groups, and DNA was isolated using the QIAamp PowerFaecal Pro DNA Kit (Qiagen, USA) following the manufacturer's protocol. The V3-V4 16S region was PCR amplified, and the product was confirmed by running the samples on the Agilent Tapestation using the Agilent D1000 ScreenTape kit. Samples were purified using Agencourt AMPure XP Beads (Beckman Coulter, USA). Each sample was assigned a unique index combination using the Illumina Nextera XT Index Kit v2. The samples were then purified using Agencourt AMPure XP Beads (Beckman Coulter, USA) and quantified on the Agilent Tapestation instrument using the Agilent D1000 ScreenTape kit. One hundred (100) ng of each 16S sample library, or the average volume (3 μL) for the negative control, was pooled. The average size fragment distribution was determined on the Agilent 4200 TapeStation using the D1000 ScreenTape Assay. The library quantification of pooled libraries was achieved using the KAPA Illumina Library Quantification Kit (Roche) on the Quantstudio 12K Flex real-time PCR system (Thermo Fisher Scientific, England).
Four nM pooled sequencing libraries were denatured using 0.2 N NaOH and diluted to 5 pM. The libraries were combined with denatured PhiX control at a spike-in concentration of 10 % v/v, following the Illumina 16S Metagenomic Sequencing Library Preparation guide. The sequencing libraries were heat-denatured at 96 °C for two minutes and placed in an ice-water bath for 5 minutes. The denatured 16S libraries were loaded on the Illumina MiSeq instrument (Illumina, San Diego, CA, USA) and sequenced using the Illumina MiSeq Reagent Kit v2 (500 cycles). The sequencer was programmed to perform a paired-end, dual-indexed 2 x 251 cycle sequencing run for both runs. FASTQ files were automatically generated at the end of the run. The quality of the sequence run was analysed using Illumina Sequence Analysis Viewer 2.4.5.
The resulting sequences were pre-processed using Quantitative Insights into Microbial Ecology (QIIME2, 2022.11) as described previously [44]. The DADA2 plugin was used for denoising and clustering [45]. Merged representative sequences were aligned to the SILVA reference sequence database [46]. Sequences are available in the Sequence Read Archive (PRJNA1081830). Alpha (α)-diversity and β-diversity were computed using the q2-diversity plugin in QIIME2 [47]. Stack bar plots were generated to visualise the relative abundance of the different taxa [48].
4.7. Mice Euthanasia
Mice were humanely euthanised using an overdose of isoflurane followed by cervical dislocation as a secondary confirmation of death in accordance with institutional ethical guidelines. After euthanasia, organs (lungs, spleen, liver, and ileum) were aseptically harvested for downstream microbiological, histological, and immunological analyses.
4.8. Determination of Mtb Burdens
We determined the bacterial burdens of the lung, spleen, and liver after 28 days of progression of Mtb infection. Tissue homogenates were serially diluted in PBS-tween (0.05% Tween 80) (Sigma Aldrich) and plated on glycerol-containing (0.5% glycerol) Middlebrook 7H11 media (BD Biosciences) supplemented with 10% OADC (Sigma-Aldrich). The plates were incubated at 37oC, and colonies were counted after 28 days.
4.9. Hematoxylin and Eosin (H&E) Staining
We collected each mouse's left lung lobe and ileum for histological examination. The tissues were fixed in 10% formalin for 48 hrs at room temperature and processed in an automated tissue processor (Shandon-Elliott duplex processor). Five micrometres (5μm) thick tissue sections were cut using a rotatory microtome (Leica RM 2125 RT; Leica MicrosystemsGmbH, Wetzlar, Germany) and mounted on gelatine-coated histological slides and H&E stained using an autostainer (Leica Auto Stainer XL). Histological slides were scanned using an Olympus VS120 slide scanner and analysed using the Quantitative Pathology (Qupath, version 0.3.2) and FIJI (ImageJ) software.
4.10. Immunohistochemistry
The following primary antibodies were used: cluster of differentiation (CD) 4 (D7D2Z, Rabbit mAb, diluted 1:100), CD8α (D4W2Z, Rabbit mAb, diluted 1:400), CD68 (E3O7V, Rabbit mAb, diluted 1: 400), Lymphocyte antigen 6 complex locus G6D (Ly6G) (E6Z1T, Rabbit mAb, diluted 1:100), High mobility group box protein 1 (HMGB1)(D3E5, Rabbit mAb, diluted 1:200) (Cell Signaling Technology, USA), CD14 (SC69-02 Rabbit mAb, diluted 1:100) and CD45R/B220 (PTPRC/1783R, Rabbit mAb, diluted 1:50) (Novus Biologicals, USA). Staining was done on paraffin-embedded lung samples using the Leica Bond III immunohistochemistry autostainer (Leica Biosystems, Nussloch, Germany).
4.11. Luminex Multiplex Assay
We evaluated the concentrations of the cytokines; interferon-gamma (IFN-γ), tumour necrosis factor-alpha (TNF-α), interleukins (IL)-1beta (β), 2, 4, 6, 10, 13, 17A and 22 (Merck Millipore, USA), and the immune checkpoint proteins; B- and T-lymphocyte attenuator (BTLA), CD 27, 80, 276, 137 ligands (L), cytotoxic T lymphocyte antigen 4 (CTLA4), programmed cell death protein (PD)-1, lymphocyte-activation gene (LAG)-3, T cell immunoglobulin and mucin domain-containing protein (TIM)-3, PD-ligand 1, and 2 (Thermo Fisher Scientific, Austria) in lung and spleen supernatants following the manufacturer’s instructions.
4.12. Quantification of Histopathological and Immunohistochemical Stained Slides
H&E-stained lung sections were assigned quantitative scores following previously described methods with modifications [49,50]. In brief, the slides were scored based on four categories: the number of lesions/granulomas, the extent of lung lesion involvement, destructive inflammatory pathology, and the cellular composition of lesions. For the number of lesions/granulomas, each slide was scored on a five-point scale: (1) no granuloma, (2) 1–2 granulomas, (3) 3-5 granulomas, (4) 6-10 granulomas and (5) multiple or miliary patterns of lesions, respectively. For the extent of lung lesion involvement, the lung was scored on a four-point scale: (1)10%, (2) 10-25%, (3) 25-50%, and (4) greater than 50%. Destructive lung pathology was scored on a three-point scale: (1) well-delineated lesions/granulomas, (2) marked extension of inflammatory cells into neighbouring alveolar spaces or airway walls, (3) widespread inflammation or presence of necrosis foci and build-up of proteinaceous fluid or fibrin. Cellular composition of lesions was scored on a three-point scale: (1) lesions containing a higher proportion of lymphocytes, (2) mixture of lymphocytes and macrophages with few neutrophils, (3) high frequency of macrophages and neutrophils.
H&E stained ileum sections were evaluated and scored using the following features: (1) crypt damage (0- no crypt injury; 1- loss of basal one-third of the crypt; 2- loss of basal two-third of the crypt; 3- loss of full thickness of crypts; 4- total thickness of crypt loss with surface erosion (2) goblet cell loss, that is a reduction of goblet cell number relative to basal goblet cell number per crypt (0- no goblet cell loss; 1- minimal; 2- mild; 3- moderate; 4- marked (3) villous blunting (0- no blunting; 1- mild; 2- moderate; 3- severe 4-villous atrophy. The total score per mouse was calculated on a scale of 0-12 [51,52,53,54].
For immunohistochemical analysis, the average 3, 3'-diaminobenzidine (DAB) stains were quantified using the positive cell detection analysis on Qupath following an optimised workflow for each antibody [55].
4.13. Statistical Analysis
Sample size estimation for the number of mice used in the study was based on the number of animals used in similar models in the existing literature [11,18,19,56,57]. We performed two independent experiments and pooled the data together for statistical analysis. All analyses were performed in R version 4.3.3. Differences in the α-diversity and taxa relative abundance were computed using the Wilcoxon test for paired samples and the Kruskal-Wallis test, followed by pairwise comparison between the groups with Benjamini–Hochberg correction for multiple testing for unpaired samples. Unweighted-Unifrac metrics were used to estimate between-sample dissimilarity (β-diversity), followed by the distance-based permutation multivariate analysis of variance (PERMANOVA) [58]. Mtb burdens (CFU) were transformed to logarithms as log10 CFU. Differences in the CFU, Luminex, and immunohistochemistry data were performed using One-way Analysis of Variance (ANOVA) followed by the Least Significant Difference (LSD) post hoc analysis.
Author Contributions
Concept and design: N.N.C., O.A.E., N.D.P., G.W., MO., R.G., G.T., and CCN; murine experiments: O.A.E., N.A., C.G.G.B. and M.B.N; in vitro downstream experiments: O.A.E., H.T., B.H.C., and M.C.M; histological assessment and analysis: E.M.G., study supervision N.N.C., N.D.P., G.W., M.O., and R.G; manuscript's first draft: O.A.E; manuscript revision, editing and approval: all authors
Funding
The study was supported by Stellenbosch University, the South African Research Chair Initiative (SARChI): Biomarkers for TB (Project Number: SANRF86535), and another NRF award (grant no: 145930). O.A.E. received funding from South Africa’s National Research Foundation (NRF) and the World Academy of Sciences (TWAS).
Ethics statement
The experimental protocol was approved by the Stellenbosch University Research Ethics Committee: Animal Care and Use Ethics (REC: ACU); approval number: ACU-2020-15458.
Data Availability Statement
16S rRNA sequence data have been deposited in the NCBI Sequence Read Archive database under the accession number PRJNA1081830 and can be accessed through the link: https://www.ncbi.nlm.nih.gov/sra/?term=PRJNA1081830
Acknowledgements
Not applicable.
Conflicts of Interest
Besides the support from Stellenbosch University, additional funding support for this work was received from the South African National Research Foundation (NRF) through the South African Research Chair Initiative (SARChI): Biomarkers for TB (Project Number: SANRF86535, to GW) and another NRF research grant (grant no: 145930, awarded to NC). O.A.E. also received funding from the NRF and the World Academy of Sciences (TWAS).
References
- WHO. Global tuberculosis report 2022: Executive summary. 2022.
- Narasimhan, P.; Wood, J.; MacIntyre, C.R.; Mathai, D. Risk factors for tuberculosis. Pulm. Med. 2013, 2013, 828939. [Google Scholar] [CrossRef] [PubMed]
- Huang, S.-J.; Wang, X.-H.; Liu, Z.-D.; Cao, W.-L.; Han, Y.; Ma, A.-G.; Xu, S.-F. Vitamin D deficiency and the risk of tuberculosis: A meta-analysis. Drug Des. Dev. Ther. 2016, 11, 91–102. [Google Scholar] [CrossRef]
- Verver, S.; Warren, R.M.; Beyers, N.; Richardson, M.; Van Der Spuy, G.D.; Borgdorff, M.W.; Enarson, D.A.; Behr, M.A.; Van Helden, P.D. Rate of reinfection tuberculosis after successful treatment is higher than rate of new tuberculosis. Am. J. Respir. Crit. Care Med. 2005, 171, 1430–1435. [Google Scholar] [CrossRef]
- Hermans, S.M.; Zinyakatira, N.; Caldwell, J.; Cobelens, F.G.; Boulle, A.; Wood, R. High rates of recurrent tuberculosis disease: A population-level cohort study. Clin. Infect. Dis. 2021, 72, 1919–1926. [Google Scholar] [CrossRef]
- Uys, P.; Brand, H.; Warren, R.; Van der Spuy, G.; Hoal, E.G.; Van Helden, P.D. The risk of tuberculosis reinfection soon after cure of a first disease episode is extremely high in a hyperendemic community. PLoS ONE 2015, 10, e0144487. [Google Scholar] [CrossRef]
- Macpherson, A.J.; Harris, N.L. Interactions between commensal intestinal bacteria and the immune system. Nat. Rev. Immunol. 2004, 4, 478–485. [Google Scholar] [CrossRef]
- Cox, L.M.; Yamanishi, S.; Sohn, J.; Alekseyenko, A.V.; Leung, J.M.; Cho, I.; Kim, S.G.; Li, H.; Gao, Z.; Mahana, D. Altering the intestinal microbiota during a critical developmental window has lasting metabolic consequences. Cell 2014, 158, 705–721. [Google Scholar] [CrossRef]
- Gurung, M.; Li, Z.; You, H.; Rodrigues, R.; Jump, D.B.; Morgun, A.; Shulzhenko, N. Role of gut microbiota in type 2 diabetes pathophysiology. EBioMedicine 2020, 51, 102590. [Google Scholar] [CrossRef]
- Sobhani, I.; Bergsten, E.; Couffin, S.; Amiot, A.; Nebbad, B.; Barau, C.; de’Angelis, N.; Rabot, S.; Canoui-Poitrine, F.; Mestivier, D. Colorectal cancer-associated microbiota contributes to oncogenic epigenetic signatures. Proc. Natl. Acad. Sci. 2019, 116, 24285–24295. [Google Scholar] [CrossRef]
- Khan, N.; Vidyarthi, A.; Nadeem, S.; Negi, S.; Nair, G.; Agrewala, J.N. Alteration in the gut microbiota provokes susceptibility to tuberculosis. Front. Immunol. 2016, 7, 529. [Google Scholar] [CrossRef]
- Dumas, A.; Corral, D.; Colom, A.; Levillain, F.; Peixoto, A.; Hudrisier, D.; Poquet, Y.; Neyrolles, O. The host microbiota contributes to early protection against lung colonization by Mycobacterium tuberculosis. Front. Immunol. 2018, 9, 2656. [Google Scholar] [CrossRef] [PubMed]
- Brennan, P.; Young, D. Isoniazid. Tuberc. (Edinb) 2008, 88, 112–116. [Google Scholar] [CrossRef]
- Brennan, P.; Young, D. Pyrazinamide. Tuberc. (Edinb) 2008, 88, 141–144. [Google Scholar]
- Brennan, P.; Young, D. Rifampin. Tuberc. (Edinb) 2008, 88, 151–154. [Google Scholar]
- Brennan, P.; Young, D. Ethambutol. Tuberc. (Edinb) 2008, 88, 102–105. [Google Scholar]
- Wipperman, M.F.; Fitzgerald, D.W.; Juste, M.A.J.; Taur, Y.; Namasivayam, S.; Sher, A.; Bean, J.M.; Bucci, V.; Glickman, M.S. Antibiotic treatment for Tuberculosis induces a profound dysbiosis of the microbiome that persists long after therapy is completed. Sci. Rep. 2017, 7, 1–11. [Google Scholar] [CrossRef]
- Namasivayam, S.; Maiga, M.; Yuan, W.; Thovarai, V.; Costa, D.L.; Mittereder, L.R.; Wipperman, M.F.; Glickman, M.S.; Dzutsev, A.; Trinchieri, G. Longitudinal profiling reveals a persistent intestinal dysbiosis triggered by conventional anti-tuberculosis therapy. Microbiome 2017, 5, 1–17. [Google Scholar] [CrossRef]
- Khan, N.; Mendonca, L.; Dhariwal, A.; Fontes, G.; Menzies, D.; Xia, J.; Divangahi, M.; King, I.L. Intestinal dysbiosis compromises alveolar macrophage immunity to Mycobacterium tuberculosis. Mucosal Immunol. 2019, 12, 772–783. [Google Scholar] [CrossRef]
- Luo, M.; Liu, Y.; Wu, P.; Luo, D.-X.; Sun, Q.; Zheng, H.; Hu, R.; Pandol, S.J.; Li, Q.-F.; Han, Y.-P. Alternation of gut microbiota in patients with pulmonary tuberculosis. Front. Physiol. 2017, 8, 822. [Google Scholar] [CrossRef]
- Shi, W.; Hu, Y.; Ning, Z.; Xia, F.; Wu, M.; Hu, Y.O.; Chen, C.; Prast-Nielsen, S.; Xu, B. Alterations of gut microbiota in patients with active pulmonary tuberculosis in China: A pilot study. Int. J. Infect. Dis. 2021, 111, 313–321. [Google Scholar] [CrossRef]
- Nagendra, H. Opposite trends in response for the Shannon and Simpson indices of landscape diversity. Appl. Geogr. 2002, 22, 175–186. [Google Scholar] [CrossRef]
- Linda, C.Y.; Jin, T.; Shu-Chen, W. Yen-Hsuan Ni. Host-microbial interactions and regulation of intestinal epithelial barrier function: From physiology to pathology. World J Gastrointest Pathophysiol 2012, 3, 27–43. [Google Scholar]
- Guo, W.; Zhou, X.; Li, X.; Zhu, Q.; Peng, J.; Zhu, B.; Zheng, X.; Lu, Y.; Yang, D.; Wang, B. Depletion of gut microbiota impairs gut barrier function and antiviral immune defense in the liver. Front. Immunol. 2021, 12, 897. [Google Scholar] [CrossRef] [PubMed]
- Kamada, N.; Chen, G.Y.; Inohara, N.; Núñez, G. Control of pathogens and pathobionts by the gut microbiota. Nat. Immunol. 2013, 14, 685–690. [Google Scholar] [CrossRef]
- Zechner, E.L. Inflammatory disease caused by intestinal pathobionts. Curr. Opin. Microbiol. 2017, 35, 64–69. [Google Scholar] [CrossRef]
- Massier, L.; Blüher, M.; Kovacs, P.; Chakaroun, R.M. Impaired intestinal barrier and tissue bacteria: Pathomechanisms for metabolic diseases. Front. Endocrinol. 2021, 12, 616506. [Google Scholar] [CrossRef]
- Stolfi, C.; Maresca, C.; Monteleone, G.; Laudisi, F. Implication of intestinal barrier dysfunction in gut dysbiosis and diseases. Biomedicines 2022, 10, 289. [Google Scholar] [CrossRef]
- Di Tommaso, N.; Gasbarrini, A.; Ponziani, F.R. Intestinal barrier in human health and disease. Int. J. Environ. Res. Public Health 2021, 18, 12836. [Google Scholar] [CrossRef]
- Eribo, O.A.; du Plessis, N.; Ozturk, M.; Guler, R.; Walzl, G.; Chegou, N.N. The gut microbiome in tuberculosis susceptibility and treatment response: Guilty or not guilty? Cell. Mol. Life Sci. 2020, 77, 1497–1509. [Google Scholar] [CrossRef]
- Nadeem, S.; Maurya, S.K.; Das, D.K.; Khan, N.; Agrewala, J.N. Gut dysbiosis thwarts the efficacy of vaccine against Mycobacterium tuberculosis. Front. Immunol. 2020, 11, 726. [Google Scholar] [CrossRef]
- Lee, J.; Kornfeld, H. Interferon-γ regulates the death of M. tuberculosis-infected macrophages. J. Cell Death 2010, 3, JCD.S2822. [Google Scholar] [CrossRef]
- Belkaid, Y.; Rouse, B.T. Natural regulatory T cells in infectious disease. Nat. Immunol. 2005, 6, 353–360. [Google Scholar] [CrossRef] [PubMed]
- Miller, C.H.; Maher, S.G.; Young, H.A. Clinical use of interferon-γ. Ann. New York Acad. Sci. 2009, 1182, 69–79. [Google Scholar] [CrossRef]
- Nagabhushanam, V.; Solache, A.; Ting, L.-M.; Escaron, C.J.; Zhang, J.Y.; Ernst, J.D. Innate inhibition of adaptive immunity: Mycobacterium tuberculosis-induced IL-6 inhibits macrophage responses to IFN-γ. J. Immunol. 2003, 171, 4750–4757. [Google Scholar] [CrossRef] [PubMed]
- Boni, F.G.; Hamdi, I.; Koundi, L.M.; Shrestha, K.; Xie, J. Cytokine storm in tuberculosis and IL-6 involvement. Infect. Genet. Evol. 2022, 97, 105166. [Google Scholar] [CrossRef]
- Mitra, D.; Kamboj, D.; GUPTA, G.; Mehta, G.; Chakraborty, S.; Saurabh, A. Inhibiting PD-1 Pathway rescues protective immune response in TB patients: Impact on bacillary efflux pump and multidrug-resistance TB. Chest 2021, 160, A545. [Google Scholar] [CrossRef]
- Kauffman, K.D.; Sakai, S.; Lora, N.E.; Namasivayam, S.; Baker, P.J.; Kamenyeva, O.; Foreman, T.W.; Nelson, C.E.; Oliveira-de-Souza, D.; Vinhaes, C.L. PD-1 blockade exacerbates Mycobacterium tuberculosis infection in rhesus macaques. Sci. Immunol. 2021, 6, eabf3861. [Google Scholar] [CrossRef]
- Sakai, S.; Kauffman, K.D.; Sallin, M.A.; Sharpe, A.H.; Young, H.A.; Ganusov, V.V.; Barber, D.L. CD4 T cell-derived IFN-γ plays a minimal role in control of pulmonary Mycobacterium tuberculosis infection and must be actively repressed by PD-1 to prevent lethal disease. PLoS Pathog. 2016, 12, e1005667. [Google Scholar] [CrossRef]
- Xiao, G.; Cai, Z.; Guo, Q.; Ye, T.; Tang, Y.; Guan, P.; Zhang, J.; Ou, M.; Fu, X.; Ren, L. Insights into the unique lung microbiota profile of pulmonary tuberculosis patients using metagenomic next-generation sequencing. Microbiol. Spectr. 2022, 10, e01901–e01921. [Google Scholar] [CrossRef]
- Musisi, E.; Wyness, A.; Eldirdiri, S.; Dombay, E.; Mtafya, B.; Ntinginya, N.E.; Heinrich, N.; Kibiki, G.S.; Hoelscher, M.; Boeree, M. Effect of seven anti-tuberculosis treatment regimens on sputum microbiome: A retrospective analysis of the HIGHRIF study 2 and PanACEA MAMS-TB clinical trials. Lancet Microbe 2023, 4, e913–e922. [Google Scholar] [CrossRef]
- Hu, Y.; Kang, Y.; Liu, X.; Cheng, M.; Dong, J.; Sun, L.; Zhu, Y.; Ren, X.; Yang, Q.; Chen, X. Distinct lung microbial community states in patients with pulmonary tuberculosis. Sci. China Life Sci. 2020, 63, 1522–1533. [Google Scholar] [CrossRef] [PubMed]
- Derrick, S.C.; Kolibab, K.; Yang, A.; Morris, S.L. Intranasal administration of Mycobacterium bovis BCG induces superior protection against aerosol infection with Mycobacterium tuberculosis in mice. Clin. Vaccine Immunol. 2014, 21, 1443–1451. [Google Scholar] [CrossRef] [PubMed]
- Kuczynski, J.; Stombaugh, J.; Walters, W.A.; González, A.; Caporaso, J.G.; Knight, R. Using QIIME to analyze 16S rRNA gene sequences from microbial communities. Curr. Protoc. Microbiol. 2012, 27, 1E.5–1. [Google Scholar] [CrossRef] [PubMed]
- Callahan, B.J.; McMurdie, P.J.; Rosen, M.J.; Han, A.W.; Johnson, A.J.A.; Holmes, S.P. DADA2: High-resolution sample inference from Illumina amplicon data. Nat. Methods 2016, 13, 581–583. [Google Scholar] [CrossRef]
- Quast, C.; Pruesse, E.; Yilmaz, P.; Gerken, J.; Schweer, T.; Yarza, P.; Peplies, J.; Glöckner, F.O. The SILVA ribosomal RNA gene database project: Improved data processing and web-based tools. Nucleic Acids Res. 2012, 41, D590–D596. [Google Scholar] [CrossRef]
- Oksanen, J.; Blanchet, F.G.; Friendly, M.; Kindt, R.; Legendre, P.; McGlinn, D.; Minchin, P.R.; O’Hara, R.B.; Simpson, G.L.; Solymos, P.; et al.; vegan: Community Ecology Package R package version 2.5-6. Available online: https://cran.r-project.org/web/packages/vegan/index.html, 2019 (accessed on 6 June 2025).
- Love, M.I.; Huber, W.; Anders, S. Moderated estimation of fold change and dispersion for RNA-seq data with DESeq2. Genome Biol. 2014, 15, 1–21. [Google Scholar] [CrossRef]
- Robertson, G.T.; Ramey, M.E.; Massoudi, L.M.; Carter, C.L.; Zimmerman, M.; Kaya, F.; Graham, B.G.; Gruppo, V.; Hastings, C.; Woolhiser, L.K. Comparative Analysis of Pharmacodynamics in the C3HeB/FeJ Mouse Tuberculosis Model for DprE1 Inhibitors TBA-7371, PBTZ169, and OPC-167832. Antimicrob. Agents Chemother. 2021, 65, e00583–e00521. [Google Scholar] [CrossRef]
- Chen, C.Y.; Huang, D.; Wang, R.C.; Shen, L.; Zeng, G.; Yao, S.; Shen, Y.; Halliday, L.; Fortman, J.; McAllister, M. A critical role for CD8 T cells in a nonhuman primate model of tuberculosis. PLoS Pathog. 2009, 5, e1000392. [Google Scholar] [CrossRef]
- Zhou, F.; Hamza, T.; Fleur, A.S.; Zhang, Y.; Yu, H.; Chen, K.; Heath, J.E.; Chen, Y.; Huang, H.; Feng, H. Mice with inflammatory bowel disease are susceptible to clostridium difficile infection with severe disease outcomes. Inflamm. Bowel Dis. 2018, 24, 573–582. [Google Scholar] [CrossRef]
- Erben, U.; Loddenkemper, C.; Doerfel, K.; Spieckermann, S.; Haller, D.; Heimesaat, M.M.; Zeitz, M.; Siegmund, B.; Kühl, A.A. A guide to histomorphological evaluation of intestinal inflammation in mouse models. Int. J. Clin. Exp. Pathol. 2014, 7, 4557. [Google Scholar]
- Alshamy, Z.; Richardson, K.C.; Hünigen, H.; Hafez, H.M.; Plendl, J.; Al Masri, S. Comparison of the gastrointestinal tract of a dual-purpose to a broiler chicken line: A qualitative and quantitative macroscopic and microscopic study. PLoS ONE 2018, 13, e0204921. [Google Scholar] [CrossRef]
- Palffy, R.; Gardlik, R.; Behuliak, M.; Jani, P.; Balakova, D.; Kadasi, L.; Turna, J.; Celec, P. Salmonella-mediated gene therapy in experimental colitis in mice. Exp. Biol. Med. 2011, 236, 177–183. [Google Scholar] [CrossRef]
- Bankhead, P.; Loughrey, M.B.; Fernández, J.A.; Dombrowski, Y.; McArt, D.G.; Dunne, P.D.; McQuaid, S.; Gray, R.T.; Murray, L.J.; Coleman, H.G. QuPath: Open source software for digital pathology image analysis. Sci. Rep. 2017, 7, 1–7. [Google Scholar] [CrossRef]
- Zhang, M.; Li, S.-Y.; Rosenthal, I.M.; Almeida, D.V.; Ahmad, Z.; Converse, P.J.; Peloquin, C.A.; Nuermberger, E.L.; Grosset, J.H. Treatment of tuberculosis with rifamycin-containing regimens in immune-deficient mice. Am. J. Respir. Crit. Care Med. 2011, 183, 1254–1261. [Google Scholar] [CrossRef]
- Irwin, S.M.; Prideaux, B.; Lyon, E.R.; Zimmerman, M.D.; Brooks, E.J.; Schrupp, C.A.; Chen, C.; Reichlen, M.J.; Asay, B.C.; Voskuil, M.I. Bedaquiline and pyrazinamide treatment responses are affected by pulmonary lesion heterogeneity in Mycobacterium tuberculosis infected C3HeB/FeJ mice. ACS Infect. Dis. 2016, 2, 251–267. [Google Scholar] [CrossRef]
- Anderson, M.J. Permutational multivariate analysis of variance (PERMANOVA). Wiley Statsref: Stat. Ref. Online 2014, 1–15. [Google Scholar]
Disclaimer/Publisher’s Note: The statements, opinions and data contained in all publications are solely those of the individual author(s) and contributor(s) and not of MDPI and/or the editor(s). MDPI and/or the editor(s) disclaim responsibility for any injury to people or property resulting from any ideas, methods, instructions or products referred to in the content. |
© 2025 by the authors. Licensee MDPI, Basel, Switzerland. This article is an open access article distributed under the terms and conditions of the Creative Commons Attribution (CC BY) license (https://creativecommons.org/licenses/by/4.0/).
Copyright: This open access article is published under a Creative Commons CC BY 4.0 license, which permit the free download, distribution, and reuse, provided that the author and preprint are cited in any reuse.


