
Submitted:
27 October 2025
Posted:
28 October 2025
You are already at the latest version
Abstract
Background
Endometrial carcinoma (EC) is the most common uterine cancer in the USA with rising incidence and mortality rates. Microcephalin 1 (MCPH1) and Bromodomain Containing 4 (BRD4) are DNA repair proteins involved in maintaining genomic stability and chromatin regulation. Dysregulated expression of these genes has been linked to poorer patient outcomes in EC. Immunotherapy, particularly immune checkpoint inhibitors (ICIs), has emerged as a promising treatment for EC. However, response rates are variable, indicating the need to identify novel biomarkers to improve patient stratification for immunotherapy. This study assessed the association between MCPH1 and BRD4 mRNA and protein expression and EC clinical and molecular biomarkers, particularly immune markers.
Methods
Immunohistochemistry was performed on 403 ECs. Nuclear staining was quantified using Qu-Path software to generate H Scores. Both continuous and categorised data analysis were performed for clinical parameters, p53 mutational status, mismatch repair deficiency and ICI related markers PD-1, PD-L1 and CD8. Statistical analysis included Chi-squared, Fisher’s exact, Mann-Whitney U, Kruskal Willis, Kaplan-Meier and Cox regression.
Results
High MCPH1 (p=0.034) and BRD4 (p=0.044) protein expression levels were both significantly associated with reduced disease specific survival (DSS). High MCPH1 protein levels were also an independent predictor of DSS. MCPH1 protein expression showed no significant association with clinical parameters. By contrast, high BRD4 protein expression was significantly associated with non-endometrioid EC (p=0.003), high tumour grade (p=0.052) and lymphovascular space invasion (p=0.052). MCPH1 protein upregulation correlated significantly with CD8 infiltrate, PD-L1, PD-1, and mismatch repair proficiency (MMRp). In addition, BRD4 protein expression correlated with p53 mutation, CD8 infiltrate, PD-L1 and PD-1 expression.
Conclusions
High MCPH1 and BRD4 protein expression was associated with immune activation markers and worse survival in EC, suggesting their potential as prognostic biomarkers. Both MCPH1 and BRD4 may also represent potential predictive markers for response to ICI therapy in EC.
Keywords:
endometrial carcinoma
; MCPH1
; BRD4
; immunotherapy markers
1. Introduction
Endometrial cancer (EC) is the is the most common uterine cancer in the USA with rising incidence and mortality rates [1]. Mortality rate has doubled in the past two decades and continues to rise [2]. Surgery remains the primary treatment choice for patients without fertility concerns [3]. EC remains difficult to manage due to limited and often ineffective treatment options for recurrent and metastatic cases. The Cancer Genome Atlas (TCGA) has classified EC into four molecular subgroups: polymerase DNA epsilon (POLE) ultra-mutated, microsatellite instability hypermutated (MSI-H), copy-number low, and copy-number high [4,5]. These molecular classifications have enhanced clinical practice by improving outcome predictions, personalising adjuvant treatment and guiding the use of immune checkpoint inhibitors (ICIs) to reduce recurrence risk [6,7].
ICIs have revolutionised oncology, particularly for difficult-to-treat cancers. Key components of ICI efficacy involve targeting programmed cell death protein 1 (PD-1) and its ligand programmed death-ligand 1 (PD-L1) and cytotoxic T-lymphocyte-associated protein 4 (CTLA-4) which are expressed on immune effector cells, boosting the host immune response against cancer [8]. Among these, tumour infiltrating lymphocytes (TILs) play an important role in antitumour immunity and have been shown to correlate with prognosis in EC. However, while ECs overexpress PD-1 in 60-65% of cases and PD-L1 in 25-75% of cases [9], ICI therapy has only demonstrated a modest effectiveness. Yet, treatment of MSI-H or mismatch repair deficient (MMRd) subgroups which reportedly have higher PD-L1 expression appeared to result in superior clinical effectiveness [10,11]. Overall, the association between TIL density, tumour mutational burden (TMB), and MMR status can provide valuable insights into prognosis and represent potential clinical biomarkers for patient stratification to ICI therapy [12,13].
Microcephalin 1 (MCPH1), also known as BRCT-repeat inhibitor of TERT expression 1 (BRIT1) [14,15], plays an important role in carcinogenesis due to its role in DNA repair, chromosomal condensation and cell cycle checkpoints. MCPH1 deficiency impairs homologous recombination repair, promoting genomic instability [16]. In breast cancer cell lines, MCPH1 increases p53 protein stability by suppressing MDM2-mediated p53 ubiquitination [17]. A pan-cancer study linked reduced MCPH1 expression to centrosome amplification, a common feature of cancer. Moreover, the authors discovered that MCPH1 deletion frequently occurred in conjunction with TP53 mutation [18]. A small study profiled 14 DNA repair genes, including MCPH1 in 41 EC cases. MCPH1 deletions, insertions and frameshift mutations were observed in 12% of MSI-H cases. These mutations were predicted to produce truncated, non-functional proteins, suggesting that MCPH1 is a common mutation target in EC [19]. Examination of the immune microenvironment revealed that MCPH1 expression was positively linked to immune checkpoint gene expression and immune infiltration, suggesting that MCPH1 may contribute to the regulation of tumour immunity [20]. In EC in particular, MCPH1 expression was correlated with TMB, MSI and immune infiltration [20].
Bromodomain 4 (BRD4), a member of the bromodomain and extra-terminal (BET) family, is essential in cellular processes such as cell cycle progression, DNA damage response and oncogenesis [21]. BRD4 facilitates oncogenic transcription by recruiting transcription complexes to specific chromatin sites [21]. BRD4 is overexpressed in many cancers [21,22,23] and is correlated with lower patient survival in EC [24,25]. Based on TCGA data, BRD4 was strongly correlated with MMR gene (MLH1, MSH2, MSH6, PMS2) expression in many cancers, including EC, at both the mRNA and protein levels [26]. Furthermore, in EC, high BRD4 expression has been linked to increased TMB, suggesting that BRD4 can induce genetic instability and influence tumour mutation rates [27]. Increasing BRD4 leads to the induction of transcription-replication collisions, promoting R-loop accumulation, and leads to the downregulation of TopBP1, which impairs the DNA damage response, both of which increase TMB [27,28]. BRD4 inhibitors, particularly JQ1, have demonstrated anticancer effects by downregulating BRD4 and c-MYC, leading to reduced proliferation and increased EC cell apoptosis in vitro and in vivo [25,26,29].
While ICI strategies can be effective in EC, the need to stratify patients who might benefit from this therapy based on clear predictive biomarkers remains wanting. Therefore, this study investigated MCPH1 and BRD4 expression in relation to immune checkpoint activity, p53 status and prognosis, aiming to determine if these could be used as predictive biomarkers for ICI response and/or survival.
2. Materials and Methods
2.1. Gene Expression Profiling Interactive Analysis (GEPIA)
Bioinformatic analysis was conducted using the GEPIA2 platform, an online tool that utilises RNA sequencing data from The Cancer Genome Atlas (TCGA) and Genotype-Tissue Expression (GTEx) project. GEPIA2 enables differential gene expression analysis, and exploration of tumour expression patterns across various human cancers (http://gepia2.cancer-pku.cn/index). The expression levels of MCPH1 and BRD4 in both normal and EC tissues were analysed to identify potential correlations. Kaplan-Meier survival analyses were utilised to determine the impact of these genes on patient survival using the Kaplan-Meier plotter (https://kmplot.com) [30].
2.2. Patient Cohort
A total of 403 retrospective EC cases were collected from St James’s University Hospital Histopathology department, Leeds, United Kingdom between January 2005 and December 2012. Patients met the eligibility criteria of the International Federation of Gynaecology and Obstetrics (FIGO, 2014) for stage I-IV EC [31]. Treatment and subsequently anonymised follow-up clinical metadata were collected under ethical approval REC 05/Q1107/41. Disease specific survival (DSS) was defined as death specifically due to EC over a median follow-up period of five years at regular intervals (range: 5–129 months). Data of patients who were alive, disease-free and who died of an unrelated cause were censored; however, data with unknown date of last follow-up or event status were reported as missing.
Clinical metadata included demographic information, surgical pathology, oncological follow-up, clinicopathological data, treatment details and outcomes, and all cases slides and diagnoses were reviewed by a pathologist (NMO), leading to a single case of serous cervical carcinoma being excluded from the cohort. Clinicopathological data included age, stage, grade, morphological subtype, lymphovascular space invasion (LVSI), depth of myometrial invasion (DMI), metastatic lymph node status and treatment approach (neoadjuvant/adjuvant treatment, chemotherapy, pelvic radiotherapy and hormonal treatment). Immune profile biomarker data including PD-L1 combined positive score (CPS), PD-1, CD8 and p53 expression were provided by RJ and colleagues [32].
2.3. Tissue Microarray (TMA) Construction
Formalin fixed paraffin-embedded patient tissues were also obtained from the Histopathology department at St James’s University Hospital. Haematoxylin & eosin-stained slides were marked up by a pathologist (NMO) to identify an appropriate area for tissue microarray sampling. TMAs were constructed with a manual tissue arrayer (Beecher Instruments, Inc., Sun Praire, W1, USA) using 0.6 mm diameter coring needles, with three representative cores per case.
2.4. Immunohistochemistry
TMA sections were deparaffinised using xylene and rehydrated through a series of descending ethanol concentrations. An automated DAKO staining system was used to perform antigen retrieval, rehydration and deparaffinisation. Slides were then incubated with BLOXALL blocking solution (Vector) for 10 minutes. Next, slides were incubated with 2.5% normal horse serum (ImmPress) for 20 minutes, and then with the primary antibody diluted with antibody diluent (ImmPress) overnight at 4 °C. MCPH1 antibody (Proteintech) was diluted 1:400 and BRD4 (E2A7X) antibody (Cell signalling) 1:20,000 respectively. The following day, slides were washed with Tris-buffered saline at pH 7.6 for 5 minutes and incubated with horse anti-rabbit secondary antibody for 30 minutes. Detection was performed using ImmPACT DAB substrate for 5 minutes. Slides were then counterstained with haematoxylin followed by serial ascending dilutions of ethanol (100%, 90%, 70%, 50%) and dipped in xylene. Finally, slides were cover slipped using dibutylphthalate polystyrene xylene.
2.5. IHC Quantitation with QuPath
TMA slides were scanned at x40 using an Aperio GT450 DX slide scanner (Leica Biosystems, Wetzlar, Germany) and scored using QuPath software to calculate a H score [33]. The H score was calculated based on the intensity and percentage of positively stained tumour nuclei and determined for MCPH1 and BRD4 as the average of three replicates for each sample. The data were classified into two groups based on the threshold associated with cancer-specific OS using the Kaplan-Meier method. The cut-off values were chosen based on the highest statistical significance, with a H score of <22.8 as low and ≥22.8 as high for MCPH1 and <47.43 as low and ≥47.43 as high for BRD4. The immunoreactivity, scoring and categorisation of PD-L1, PD-1, CD8 and p53 were defined in this series, as previously described [32].
2.6. Statistical Analyses
All statistics were calculated using SPSS version 18.0.1.1 (IBM, Illinois, USA). Both continuous and dichotomised data analyses were performed. The distribution of MCPH1 and BRD4 H scores were checked for normality and subsequently, non-parametric tests including Chi-square, Fisher’s exact, Mann-Whitney U (MW), and Kruskal Wallis (KW) tests were used to compare groups or categorical data. Univariate Cox regression analyses were performed on clinical variables. DSS was estimated by Kaplan-Meier (KM) curve analysis. Multivariate analysis using the Cox proportional hazard model were used to determine the association between MCPH1 and BRD4 expression and DSS, adjusted for patient and tumour characteristics such as FIGO 2009 stage and tumour grade. A p<0.05 was considered statistically significant.
3. Results
3.1. MCPH1 and BRD4 mRNA Expression in Normal Endometrium and EC Samples
Initially, bioinformatic analysis was carried out using the GEPIA2 platform to determine the mRNA expression of MCPH1 and BRD4. Figure 1AI shows a high median expression level of MCPH1 in normal endometrium compared to EC cases. As illustrated in Figure 1AII, BRD4 median expression is higher in EC tissues than in normal endometrium. A correlation performed to identify any association between MCPH1 and BRD4 expression was moderately positive in normal endometrium (R: 0.66, p=0.014), in EC samples, although the correlation was weak (R: 0.28), the association was statistically significant (p=0.00023; Figures 1BI and BII).
The mRNA expression of MCPH1 and BRD4 and their association with survival were determined using the Kaplan-Meier (KM) plotter tool on 542 EC patients. Low MCPH1 expression was associated with lower overall survival (OS), although this did not reach statistical significance (Figure 1CI), while high BRD4 expression was statistically associated with lower OS (p=0.034; Figure 1CII).
3.2. MCPH1 and BRD4 Protein Expression in EC
A H score was determined to assess the nuclear protein expression of both MCPH1 and BRD4. Figure 1 illustrates a range of nuclear staining intensities for MCPH1 and BRD4 in EC. Strong nuclear staining for MCPH1 and BRD4 is shown in Figures 1D and 1G, respectively. Figures 1E and 1H show moderate staining levels of MCPH1 and BRD4, while low staining intensities of MCPH1 and BRD4 are displayed in Figures 1F and 1I.
3.3. Patient Demographic Data
This study included 12 TMAs of EC samples with different histological subtypes representing 403 patients. After excluding damaged TMA cores, 372 and 376 cores were assessed for MCPH1 and BRD4 expression, respectively. Patient characteristics were retrospectively reviewed including age, tumour grade and stage (FIGO 2009), lymph node (LN) status, presence of lymphovascular space invasion (LVSI), cervical stroma invasion, depth of myometrial invasion (MI) and use of adjuvant chemotherapy or radiotherapy. Age was divided into two groups <50 and ≥50 years based on average menopausal age (Table 1).
Among 376 cases, 87 patients (23.4%) died from EC during a 60-month median follow-up period (range 0.8-129.3 months). The primary age group was ≥50 years (322 patients; 86.6%). Most ECs were low grade (219 cases; 58.9%) and of endometrioid subtype (262 cases; 70.4%). Stage I disease was the commonest (231 cases; 62%), while stage IV was the least common (30 cases; 8%), (Table 1).
3.4. Correlation of MCPH1 and BRD4 Expression with Clinicopathological Data
Continuous MCPH1 expression displayed a median H score of 54.22 and interquartile range (IQR) of 58.43. No association with clinicopathological data was identified. Similarly, when the H score was categorised into low and high MCPH1 expression, no association with clinicopathological data was identified (Table 2).
Continuous BRD4 protein expression displayed a median H score of 47 and IQR of 60.76. Continuous data analysis of BRD4 found a significant association between BRD4 expression and dichotomised EC subtypes (p=0.03) with the highest median expression found in non-endometrioid lesions (56.97). Also, a higher median BRD4 expression was observed in high grade tumours (p=0.052) and with the presence of LVSI (p=0.052; Figure 5, Table 2). When the H score was classified into low and high BRD4 expression, no statistically significant associations with clinicopathological parameters were identified.
3.5. Correlation of MCPH1 and BRD4 Expression with ICI Biomarkers
Continuous data analysis of MCPH1 expression showed a significant association between positive PD-1 expression in tumour cells with a high median MCPH1 score of 85.27 (p<0.001) and positive CD8 infiltration with a median score of 56.21 (p=0.025) (Figure 3). Categorised MCPH1 expression identified an association with 62% of MMR-deficient cases demonstrating high MCPH1 expression (p=0.035). Moreover, positive PD-1 expression in tumour cells represented an association with 68% of high MCPH1 expression cases (p=0.001), (Table 3).
Continuous data analysis of BRD4 expression showed an association with mutant p53 status with a median BRD4 expression of 63.98 (p=0.011). Furthermore, when comparing p53 mutant to MMRp p53WT and MMRd subgroups high median BRD4 expression of 62.20 (p=0.054) was identified. Positive PD-1 expression in tumour cells represented an association with median BRD4 expression 84.02 (p<0.001) and PD-1 status in lymphocytes shows significant association with median BRD4 expression of 65.94 (p=0.003). Positive CD8 infiltration showed was also correlated with BRD4 expression, with a median of 51.3 (p=0.001; Figure 2, Table 3).
3.6. Univariate and Multivariate Analyses in EC and Survival
Univariate data analysis showed an association between MCPH1 expression (p=0.038), BRD4 expression (p=0.046), tumour grade (p<0.001), depth of MI (p<0.001), MMR and p53 status (p<0.001), presence of LVSI (p<0.001), cervical stromal involvement (p<0.001), FIGO stage (p<0.001), histopathological subtype (p<0.001), adjuvant chemotherapy (p<0.001), age (p=0.056), p53 status (p=0.017) and DSS. The multivariate analysis of prognosis biomarkers shows there was a clear correlation in the following parameters: MCPH1 expression (p=0.045), tumour grade (p=0.010), depth of MI (p=0.004), MMR and p53 status (p<0.001), presence of LVSI (p=0.027) and cervical stromal involvement (p=0.03; Table 4).
3.7. MCPH1 and BRD4 Expression Association with Survival
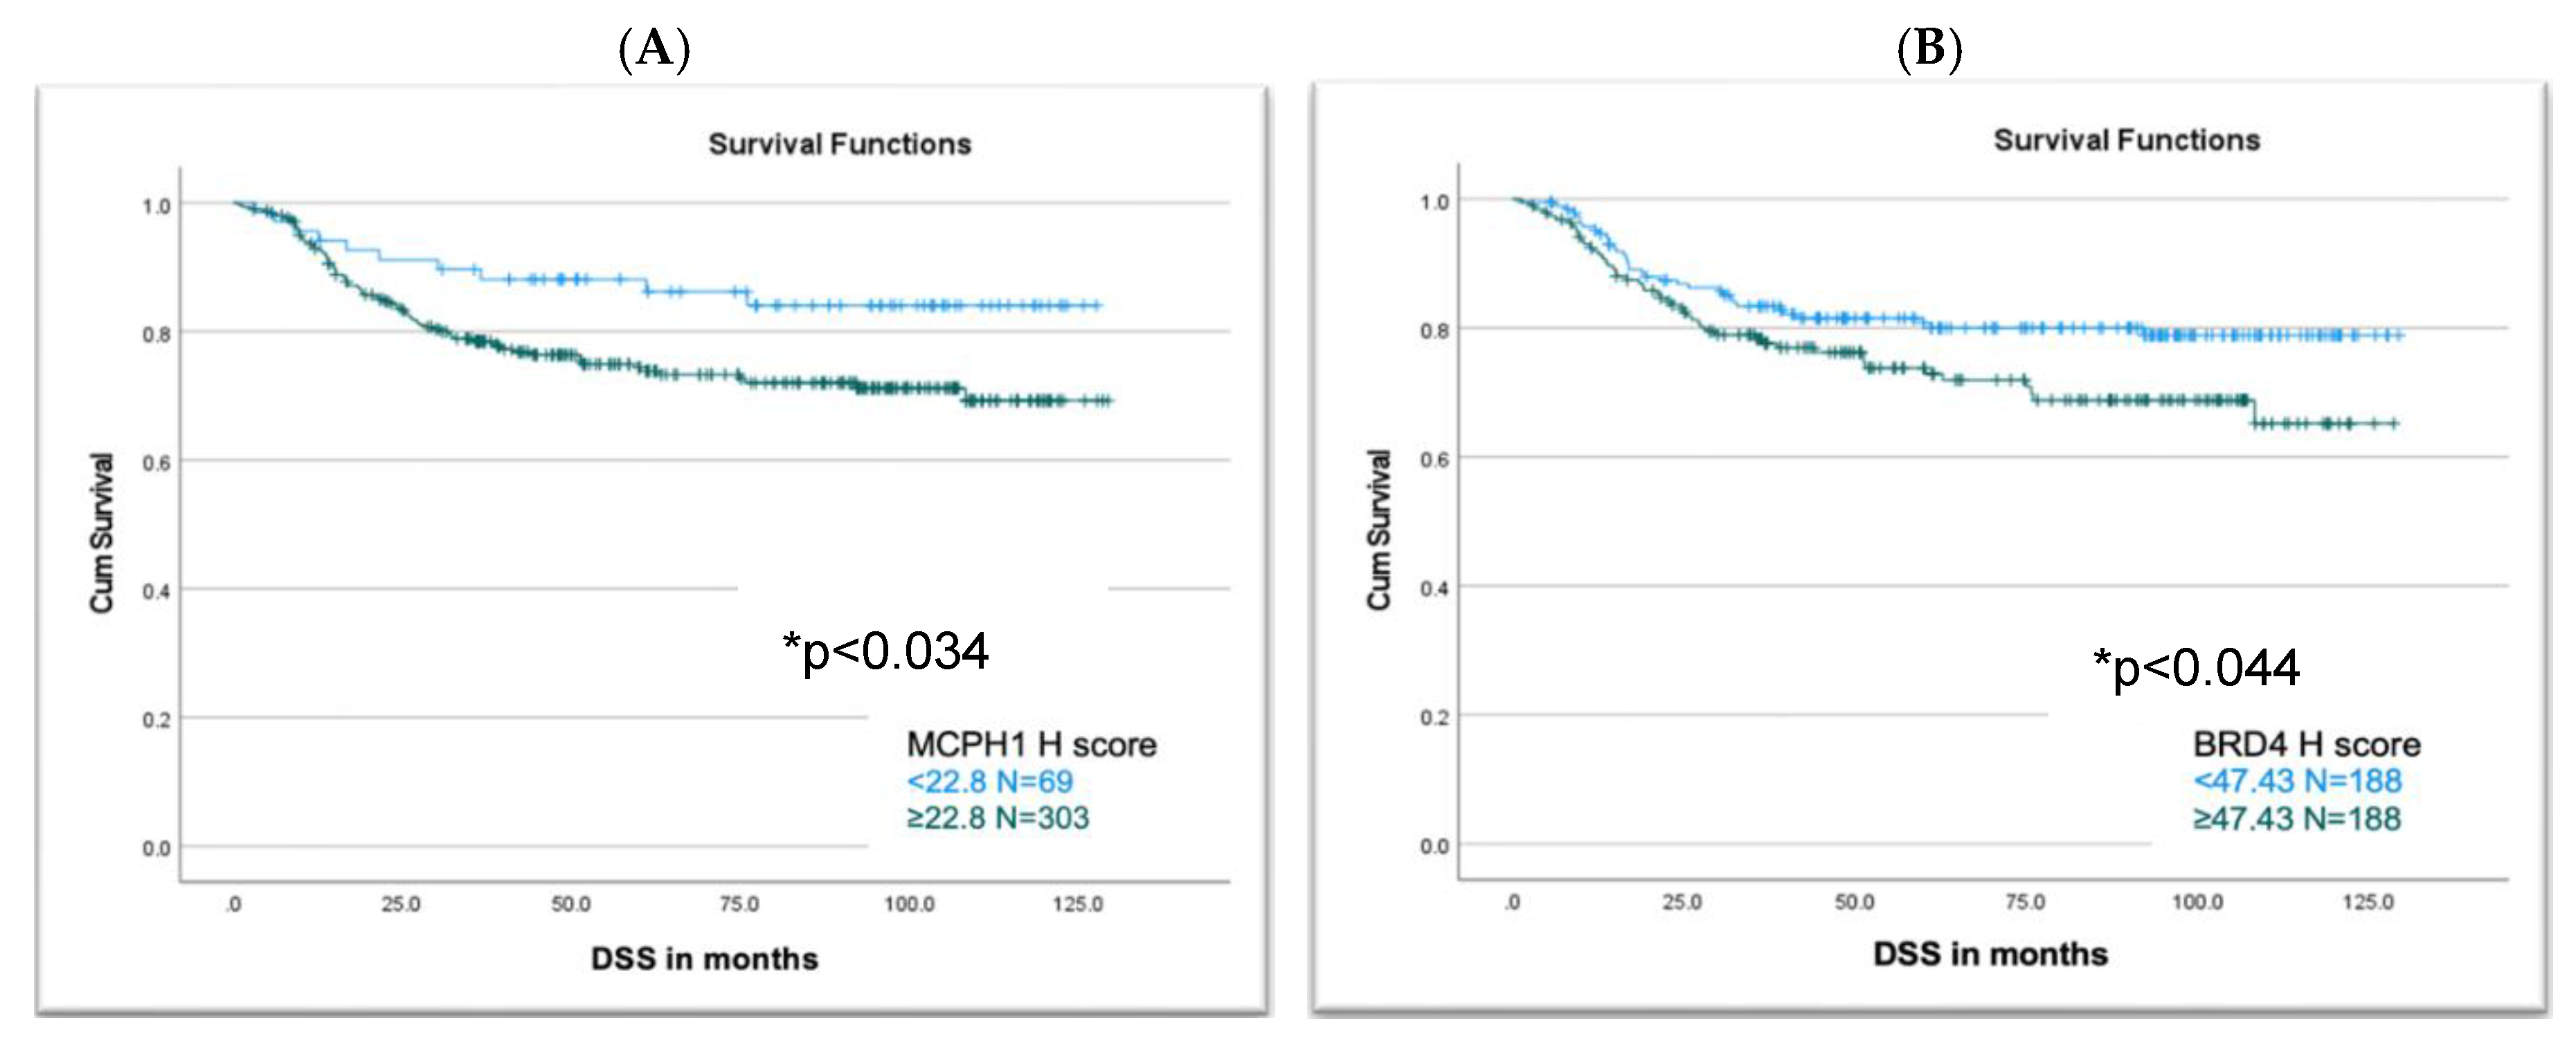
Analysis of MCPH1 and BRD4 categorised expression with DSS showed a statistically significant association of poor survival with high MCPH1 expression (p=0.034) and high BRD4 expression (p=0.044; Figure 3).
Figure 3.
Comparison between disease specific survival and MCPH1 and BRD4 expression. (A) MCPH1 H score showed a significant association with high expression in correlation with reduced DSS (p=0.034), (B) BRD4 H score showed a strong association with high expression associated with reduced DSS (p=0.044).
4. Discussion
This study highlights the association of MCPH1 and BRD4 overexpression in our EC cohort. Our findings demonstrate that both proteins are correlated with prognostic markers, immune biomarkers and poor survival, which together suggest a possible involvement in cancer progression. MCPH1 is a key regulator of the DNA repair response, and its dysregulation may contribute to genomic instability. Similarly, BRD4 plays an important role as a mediator between chromatin remodelling and the DNA damage response, making it critical to maintaining DNA repair. Upregulation of MCPH1 correlated significantly with CD8+ infiltrate, PD-L1, PD-1, and MMRp. In addition, BRD4 expression was correlated with high-grade, p53 mutation, CD8+ infiltration, and PD-L1 and PD-1 expression. MCPH1 was identified as an independent prognostic marker for EC to predict patient outcomes with significant association with DSS. The co-overexpression of these proteins and their significant association with poor survival, in addition to their role in DNA repair, may predict response to specific ICIs and suggest their potential as candidate prognostic biomarkers in EC.
This study identified a significant correlation between continuous MCPH1 expression and positive PD-L1 CPS expression. Positive PD-L1 expression in EC is linked to advanced stage and poor survival and predicts better response to ICIs such as anti-PD-1 and anti-PD-L1 therapies [34,35,36]. MCPH1 expression also demonstrated associations with CD8+ infiltrate, a recognised positive prognostic marker in EC [37,38,39]. Increased T cell infiltration, particularly CD8+, has also been reported to be associated with improved PFS in EC, potentially reflecting a more dynamic anti-tumour response [40]. Cancers with homologous recombination defects are more vulnerable to immunotherapy due to their higher neoantigen load and allied increase in PD-L1 expression, compared to homologous recombination-proficient tumours [41]. Previously, transcriptomic analysis of the tumour microenvironment using TCGA, OMCOMINE and GEO databases revealed a strong correlation between MCPH1 mRNA levels and the immune microenvironment in various cancers, including EC. A positive correlation was observed between MCPH1 expression and neoantigen load which may represent a direct association between MCPH1 and anti-tumour immune function and in turn susceptibility to immunotherapy [20]. Taken together, these observations suggest that MCPH1 expression may be considered a possible predictive biomarker to identify patients who would benefit from ICI therapy.
MCPH1 categorised expression analysis demonstrated that high MCPH1 expression was significantly associated with MMRp. Increased MCPH1 expression may reflect a partial compensatory response to DNA damage, akin to proteins like PARP, though insufficient to fully restore genomic integrity [42]. Previously, as part of the SWI/SNF complex, MCPH1 deficiency has also been associated with altered MMR protein expression and worse outcomes in EC [43].
Our data showed that high MCPH1 protein expression was significantly associated with shorter DSS (p=0.034) and importantly, that it was an independent prognostic indicator of DSS based on multivariable analysis. Downregulation of MCPH1, which promotes tumorigenesis and is associated with poor prognosis, is common in tumours such as breast and ovarian cancer [44]. However, in certain contexts, MCPH1 may act as an oncogene such that its overexpression is associated with lower survival rates. In a pan-cancer analysis, overexpression of MCPH1 was determined to be associated with poor prognosis in acute myeloid leukaemia, hepatocellular carcinoma and pancreatic adenocarcinoma, which suggests a context-dependent role of MCPH1 in cancer [20,44]. To the best of our knowledge, no study has addressed the link between MCPH1 and EC prognostic markers at the protein level.
In this study, high BRD4 expression was significantly associated with shorter DSS in the EC cohort, consistent with earlier reports linking increased BRD4 expression with poor prognosis and resistance to chemotherapy [25,27]. BRD4 promotes cell proliferation and signalling [25,27] while its inhibition can suppress tumour growth, induce apoptosis, trigger cell cycle arrest and increase chemosensitivity [25,45,46]. Furthermore, high BRD4 expression significantly positively correlated with higher grade tumours, supporting previous evidence of its association with tumour aggressiveness [47].
Furthermore, the present study demonstrated a significant association between BRD4 and p53 mutation. Previous studies have established a correlation between p53 mutations and higher tumour grade, stage and poor prognosis in EC, supporting the role of p53 mutation as a molecular hallmark of tumour aggressiveness in this disease [48]. The association between BRD4 and p53 is both complex and tissue dependent. BRD4 inhibitors have been reported to reduce the expression of both wild-type and mutant p53 leading to reduced tumour growth in breast cancer [49]. In oesophageal squamous cell carcinoma with p53 gain of function mutations BRD4 inhibition reduced tumour growth, invasion and metastasis suggesting that BRD4 may represent a potential therapeutic target for p53 mutant tumours [50]. In contrast in acute myeloid leukaemia BRD4 interacts with wild-type p53 increasing its tumour suppressor functions [51].
This study found that high BRD4 expression was significantly associated with negative PD-L1 expression, contrasting with prior studies which linked BRD4 with positive PD-L1 expression and poor prognosis, particularly in serous EC [27]. The discrepancy may stem from the predominance of the endometrioid subtype (70.4%) in our cohort which has previously been linked to positive PD-L1 expression and better prognosis [52,53]. In addition, both continuous and categorical analyses showed that BRD4 expression was significantly higher in tumours with positive PD-1 expression. This is in keeping with a previous acute myeloid leukaemia study, which showed a positive correlation between BRD4 and PD-1 expression [54]. In the present study, BRD4 was positively correlated with CD8+ infiltrates, suggesting that BRD4 expression was associated with enhanced recruitment of cytotoxic T lymphocytes into the tumour microenvironment. In this regard, increased infiltration of both T cells and macrophages with high BRD4 expression may indicate the latter’s role in recruiting immune effector cells to tumour sites [55].
BRD4 has been reported as a promising therapeutic target in aggressive EC [25,27]. Its inhibition can not only sensitise malignancies to targeted therapy [45,46] but can also enhance and promote anti-tumour immunity and further inhibit PD-L1 expression [26,47,56]. Inhibiting BRD4 can decrease MMR gene transcription impairing MMR function and increasing MMRd mutational signatures, ultimately inducing sensitivity to anti-PD-L1 [26,56]. Furthermore, the effect of inhibiting BRD4 as a potent antitumour strategy is not only related to its association with DNA repair and the tumour microenvironment but also has another effect based on c-MYC inhibition, which has been previously confirmed to reverse the immunosuppressive tumour microenvironment to an anti-tumour immune environment in multiple cancers [24,57,58,59].
5. Conclusions
Expression of both MCPH1 and BRD4 is implicated in EC prognosis and immune response modulation. Their co-overexpression and association with poor survival outcomes highlight their dual roles in DNA repair and immune regulation, suggesting that they may serve as valuable prognostic and therapeutic biomarkers, especially for stratifying patients for immune checkpoint inhibitor therapies.
Author Contributions
Conceptualisation: S.M.B., A.S.A., Methodology: A.S.A., L.P., R.J., N.G., Formal analysis: A.S.A., L.P., R.J., Data curation: A.S.A., L.P., R.J., Writing - original draft: A.S.A., S.M.B. Writing - review & editing: S.M.B., M.C., N.M.O. Supervision: S.M.B., M.C, N.M.O. All authors have read and agreed to the published version of the manuscript.
Funding
A.S.A. was supported by a scholarship from the Nursing Sciences and Research, Faculty of Nursing, Umm Al-Qura University, Makkah, Saudi Arabia.
Institutional Review Board Statement
The study was conducted in accordance with the Declaration of Helsinki, and approved by Wales Research Ethics Committee 5 Bangor (REC reference 18/WA/0222, approved 19/02/2020).
Informed Consent Statement
Informed consent was obtained from all subjects involved in the study.
Conflicts of Interest
The authors declare no conflicts of interest. The funders had no role in the design of the study; in the collection, analyses, or interpretation of data; in the writing of the manuscript; or in the decision to publish the results.
References
- Siegel RL, Miller KD, Wagle NS, Jemal A. Cancer statistics, 2023. CA Cancer J Clin. 2023;73:17–48.
- Mullins MA, Cote ML. Beyond obesity: the rising incidence and mortality rates of uterine corpus cancer. J Clin Oncol. 2019;37(22):1851–53. [CrossRef]
- National Comprehensive Cancer Network, Clinical Practice Guidelines in Oncology (NCCN Guidelines®), Uterine Neoplasms, Version 2.2024.
- Bell DW, Ellenson LH. Molecular Genetics of Endometrial Carcinoma. Annual Review of Pathology: Mechanisms of Disease. 2019;14:339-67. [CrossRef]
- Abdulfatah E, Wakeling E, Sakr S, Al-Obaidy K, Bandyopadhyay S, Morris R, et al. Molecular classification of endometrial carcinoma applied to endometrial biopsy specimens: Towards early personalized patient management. Gynecol Oncol. 2019;154(3):467-74. [CrossRef]
- Concin N, Matias-Guiu X, Vergote I, Cibula D, Mirza MR, Marnitz S, et al. ESGO/ESTRO/ ESP guidelines for the management of patients with endometrial carcinoma. Int J Gynecol Cancer. 2021;31(1):12-39. [CrossRef]
- Talhouk A, McConechy MK, Leung S, Yang W, Lum A, Senz J, et al. Confirmation of ProMisE: A simple, genomics-based clinical classifier for endometrial cancer. Cancer. 2017;123(5):802-13. [CrossRef]
- Brunner MC, Chambers CA, Chan FK, Hanke J, Winoto A, Allison JP. CTLA-4-Mediated inhibition of early events of T cell proliferation. J Immunol. 1999;162(10):5813-20.
- Yusof MN, Chew KT, Kampan NC, Shafiee MN. Expression of PD-1 and PD-L1 in Endometrial Cancer: Molecular and Clinical Significance. Vol. 24, Int J of Mol Sci. 2023;24(20):15233. [CrossRef]
- Howitt BE, Shukla SA, Sholl LM, Ritterhouse LL, Watkins JC, Rodig S, et al. Association of Polymerase e-Mutated and Microsatellite-Instable Endometrial Cancers with Neoantigen Load, Number of Tumor-Infiltrating Lymphocytes, and Expression of PD-1 and PD-L1. JAMA Oncol. 2015;1:1319–23. [CrossRef]
- Yamashita H, Nakayama K, Ishikawa M, Nakamura K, Ishibashi T, Sanuki K, et al. Microsatellite instability is a biomarker for immune checkpoint inhibitors in endometrial cancer. Oncotarget 2018;9:5652. [CrossRef]
- Lin-Zhi Z, Hong-Qi X, Jie C. Mismatch repair gene MSH6 correlates with the prognosis, immune status and immune checkpoint inhibitors response of endometrial cancer. Frontiers in Immunology 2024;15:1302797.
- Eerkens AL, Brummel K, Vledder A, et al. Neoadjuvant immune checkpoint blockade in women with mismatch repair deficient endometrial cancer: a phase I study. Nat Commun 2024;15:7695. [CrossRef]
- Lin SY, Elledge SJ. Multiple tumor suppressor pathways negatively regulate telomerase. Cell. 2003;113(7):881-9. [CrossRef]
- Jackson AP, Eastwood H, Bell SM, Adu J, Toomes C, Carr IM, et al. Identification of Microcephalin, a Protein Implicated in Determining the Size of the Human Brain. American Journal of Human Genetics. 2002;71(1):136-42. [CrossRef]
- Zhou Z-W, Tapias A, Bruhn C, Gruber R, Sukchev M, Wang Z-Q. DNA damage response in microcephaly development of MCPH1 mouse model. DNA Repair. 2013;12(8):645-55. [CrossRef]
- Zhang B, Wang E, Dai H, Hu R, Liang Y, Li K, et al. BRIT1 regulates p53 stability and functions as a tumor suppressor in breast cancer. Carcinogenesis. 2013;34(10):2271-80. [CrossRef]
- Denu RA, Burkard ME. Analysis of the “centrosome-ome” identifies MCPH1 deletion as a cause of centrosome amplification in human cancer. Sci Rep. 2020;10(1):11921. [CrossRef]
- Bilbao C, Ramírez R, Rodríguez G, Falcón O, León L, Díaz-Chico N, et al. Double strand break repair components are frequent targets of microsatellite instability in endometrial cancer. Eur J Cancer. 2010;46(15):2821-7. [CrossRef]
- Wang Z, Li M, Liu Z, Kang W, Cui Y, Han J, et al. The Oncogenic Role of Human Microcephalin Gene Revealed by Pan-Cancer Analysis. 2022. Available from: http://medrxiv.org/lookup/doi/10.1101/2022.11.18.22282275. [CrossRef]
- Fujisawa T, Filippakopoulos P. Functions of bromodomain-containing proteins and their role in homoeostasis and cancer. Nature Reviews. 2017;18(4):246-62. [CrossRef]
- Sun, SY. Essential roles of BRD4 in cancer: DNA damage, transcription regulation, and signal transduction. Global Translational Medicine. 2023;2(3):1442. [CrossRef]
- Shi J, Vakoc CR. The Mechanisms behind the Therapeutic Activity of BET Bromodomain Inhibition. Molecular Cell. 2014; (54):728-36. [CrossRef]
- Donati B, Lorenzini E, Ciarrocchi A. BRD4 and Cancer: Going beyond transcriptional regulation. Molecular Cancer. 2018;17:164. [CrossRef]
- Pang Y, Bai G, Zhao J, Wei X, Li R, Li J, et al. The BRD4 inhibitor JQ1 suppresses tumor growth by reducing c-Myc expression in endometrial cancer. J Transl Med. 2022;20(1):336. [CrossRef]
- Fu Y, Yang B, Cui Y, Hu X, Li X, Lu F, et al. BRD4 inhibition impairs DNA mismatch repair, induces mismatch repair mutation signatures and creates therapeutic vulnerability to immune checkpoint blockade in MMR-proficient tumors. J Immunother Cancer. 2023;11(4):e006070. [CrossRef]
- Saglam O, Cao B, Wang X, Toruner GA, Conejo-Garcia JR. Expression of epigenetic pathway related genes in association with PD-L1, ER/PgR and MLH1 in endometrial carcinoma. PLoS One. 2022;17(2). [CrossRef]
- Lam FC, Kong YW, Huang Q. et al. BRD4 prevents the accumulation of R-loops and protects against transcription–replication collision events and DNA damage. Nat Commun. 2020;11:4083. [CrossRef]
- Tanimoto S, Sone K, Jonouchi Y, Hachijo R, Suzuki E, Tsuboyama N, et al. BET inhibitor JQ1 induces apoptosis of ovarian and endometrial endometrioid carcinoma cells by downregulating c-Myc. Oncol Lett. 2024;29(3):106. [CrossRef]
- Gyorffy, B. Integrated analysis of public datasets for the discovery and validation of survival-associated genes in solid tumors. Innovation. 2024;5(3):100625. [CrossRef]
- Prat, J. FIGO’s staging classification for cancer of the ovary, fallopian tube, and peritoneum. J Gynecol Oncol. 2015;26(2):87-9.
- Johnson RJ, Cummings M, Thangavelu A, Theophilou G, Hutson R, Broadhead T, Nugent D, De Jong D, Munot S, Laios A, Allen K, Mappa G, Gahir N, Zubayraeva A, Grzelinski M, Orsi NM. PD-L1 and PD-1 expression is an independent prognostic marker in endometrial cancer, especially those with high-risk features. (in preparation for submission).
- Bankhead P, Loughrey MB, Fernández JA, Dombrowski Y, McArt DG, Dunne PD, et al. QuPath: Open source software for digital pathology image analysis. Sci Rep. 2017;7(1):16878. [CrossRef]
- Yusof MN, Chew KT, Kampan NC, Shafiee MN. Expression of PD-1 and PD-L1 in Endometrial Cancer: Molecular and Clinical Significance. Int J Mol Sci. 2023;24(20):15233. [CrossRef]
- Cao W, Ma X, Fischer JV, Sun C, Kong B, Zhang Q. Immunotherapy in endometrial cancer: rationale, practice and perspectives. Biomarker Research. 2021;9(11):49. [CrossRef]
- Engerud H, Berg HF, Myrvold M, Halle MK, Bjorge L, Haldorsen IS, et al. High degree of heterogeneity of PD-L1 and PD-1 from primary to metastatic endometrial cancer. Gynecol Oncol. 2020;157(1):260-67. [CrossRef]
- Kondratiev S, Sabo E, Yakirevich E, Lavie O, Resnick MB. Intratumoral CD8+ T lymphocytes as a prognostic factor of survival in endometrial carcinoma. Clinical Cancer Research. 2004;10(13):4450-6. [CrossRef]
- Lainé A, Gonzalez-Lopez AM, Hasan U, Ohkuma R, Ray-Coquard I. Immune Environment and Immunotherapy in Endometrial Carcinoma and Cervical Tumors. Cancers. 2023;15(7):2042. [CrossRef]
- Santin AD, Bellone S, Buza N, Choi J, Schwartz PE, Schlessinger J, et al. Regression of chemotherapy-resistant polymerase ϵ (POLE) ultra-mutated and MSH6 hyper-mutated endometrial tumors with nivolumab. Clinical Cancer Research. 2016;22(23):5682-7. [CrossRef]
- Heredia Soto V, Pellinen T, Turkki R, Ramón Patiño JL, Ruz-Caracuel I, García de la Calle LE, et al. Prognostic role of CD3, CD4, CD8 and FOXP3 positive populations in early-stage endometrial carcinoma. Annals of Oncology. 2020;31:862P.
- Strickland KC, Howitt BE, Shukla SA, Rodig S, Ritterhouse LL, Liu JF, et al. Association and prognostic significance of BRCA1/2-mutation status with neoantigen load, number of tumor-infiltrating lymphocytes and expression of PD-1/PD-L1 in high grade serous ovarian cancer. Oncotarget. 2016;7(12)13587-98. [CrossRef]
- Behnke A, Mack M, Fieres J, Christmann M, Bürkle A, Moreno-Villanueva M, et al. Expression of DNA repair genes and its relevance for DNA repair in peripheral immune cells of patients with posttraumatic stress disorder. Sci Rep. 2022;12(1). [CrossRef]
- Stewart CJR, Crook ML. SWI/SNF complex deficiency and mismatch repair protein expression in undifferentiated and dedifferentiated endometrial carcinoma. Pathology. 2015;47(5). [CrossRef]
- Alsolami M, Aboalola D, Malibari D, Alghamdi T, Alshekhi W, Jad H, et al. The emerging role of MCPH1/BRIT1 in carcinogenesis. Frontiers in Oncology. 2023;13. [CrossRef]
- Li X, Baek GH, Ramanand SG, Sharp A, Gao Y, Yuan W, et al. BRD4 Promotes DNA Repair and Mediates the Formation of TMPRSS2-ERG Gene Rearrangements in Prostate Cancer. Cell Rep. 2018;22(3):796-808. [CrossRef]
- Drumond-Bock AL, Wang L, Wang L, Cybula M, Rostworowska M, Kinter M, et al. Increased expression of BRD4 isoforms long (BRD4-L) and short (BRD4-S) promotes chemotherapy resistance in high-grade serous ovarian carcinoma. Genes Cancer. 2023;12;14:56-76.
- Jones D, Lin D. Amplification of the NSD3-BRD4-CHD8 pathway in pelvic high-grade serous carcinomas of tubo-ovarian and endometrial origin. Mol Clin Oncol. 2017; 7(2):301-7.
- Chen Y, Zhao W, Bi F, Pan X, Yin L, Zhao C. Significance of TP53 Mutational Status-Associated Signature in the Progression and Prognosis of Endometrial Carcinoma. Oxid Med Cell Longev. 2022;2022.1817339. [CrossRef]
- Zhou JX, Agborbesong E, Li LX, Li X. Bromodomain Protein BRD4-Mediated Mutant p53 Transcription Promotes TNBC Progression. Int J Mol Sci. 2022;23(23):15163. [CrossRef]
- Efe G, Dunbar KJ, Sugiura K, Cunningham K, Carcamo S, Karaiskos S, et al. p53 Gain-of-Function Mutation Induces Metastasis via BRD4-Dependent CSF-1 Expression. Cancer Discov. 2023;13(12). [CrossRef]
- Latif AL, Newcombe A, Li S, Gilroy K, Robertson NA, Lei X, et al. BRD4-mediated repression of p53 is a target for combination therapy in AML. Nat Commun. 2021; 11;12(1):241. [CrossRef]
- Feroz B, Pan TL, Leitner K, Ebner C, Steger K, Kildal W, et al. Tumoral programmed cell death 1 (PD1) expression in endometrial carcinoma is a prognostic marker for patient outcome. Int J Gynecol Cancer. 2024;34(11):1711-18. [CrossRef]
- Hu J, Li G, He X, Gao X, Pan D, Dong X, Huang W, Qiu F, Chen LF, Hu X. Brd4 modulates metabolic endotoxemia-induced inflammation by regulating colonic macrophage infiltration in high-fat diet-fed mice. Commun Biol. 2024;28;7(1):1708. [CrossRef]
- Chen C, Xu L, Gao R, Wang S, Zhang Y, Wang C, Zeng C, Li Y. Transcriptome-Based Co-Expression of BRD4 and PD-1/PD-L1 Predicts Poor Overall Survival in Patients with Acute Myeloid Leukemia. Front Pharmacol. 2021;11:582955. [CrossRef]
- Chen P, Zhou J, Li J, Zhang Q, Zuo Q. TIPE1 suppresses osteosarcoma tumor growth by regulating macrophage infiltration. Clinical and Translational Oncology. 2019;21(3):334-341. [CrossRef]
- Perrier A, Didelot A, Laurent-Puig P, Blons H, Garinet S. Epigenetic Mechanisms of Resistance to Immune Checkpoint Inhibitors. Biomolecules 2020;10:1061. [CrossRef]
- Lovén J, Hoke HA, Lin CY, Lau A, Orlando DA, Vakoc CR, et al. Selective inhibition of tumour oncogenes by disruption of super-enhancers. Cell. 2013;153(2): 320-334. [CrossRef]
- Casey SC, Tong L, Li Y, Do R, Walz S, Fitzgerald KN, GouwAM, Baylot V, Gutgemann I, Eilers M, et al. MYC regulates the antitumor immune response through CD47 and PD-L1. Science. 2016;353:227-231. [CrossRef]
- Wu SY, Lee CF, Lai HT, Yu CT, Lee JE, Zuo H, Tsai SY, Tsai MJ, Ge K, Wan Y, Chiang CM. Opposing Functions of BRD4 Isoforms in Breast Cancer. Mol Cell. 2020;78(6):1114-32. [CrossRef]
Figure 1.
MCPH1 and BRD4 mRNA and protein expression. (A) I MCPH1 mRNA expression was higher in normal endometrium (grey box) compared to EC (red box). II BRD4 expression was higher in normal endometrium (grey box) compared to EC (red box). (B) I Normal endometrium showed a significant correlation between MCPH1 and BRD4 expression (p=0.014), II Correlation in EC showed a stronger association between BRD4 and MCPH1 expression (p=0.00023). Data were generated using the Gene Expression Profiling Interactive Analysis (GEPIA2) website. (C) The KM plot illustrates overall survival (months) in the EC population. The red line represents high mRNA expression levels, and the black line represents low expression levels of MCPH1 and BRD4. Expression levels were divided based on an auto-selected cut-off value of 393 determined by the KM plotter tool to identify the most statistically significant difference in survival (p=0.0886). (C) I Represents low MCPH1 mRNA expression associated with a lower probability of survival, II Represents high BRD4 mRNA expression associated with a lower probability of survival. Representative MCPH1 and BRD4 IHC staining of EC TMA samples (D) High MCPH1 expression, (E) Moderate MCPH1 expression, (F) Low MCPH1 expression, (G) High BRD4 expression, (H) Moderate BRD4 expression, (I) Low BRD4 expression. 40X Magnification.
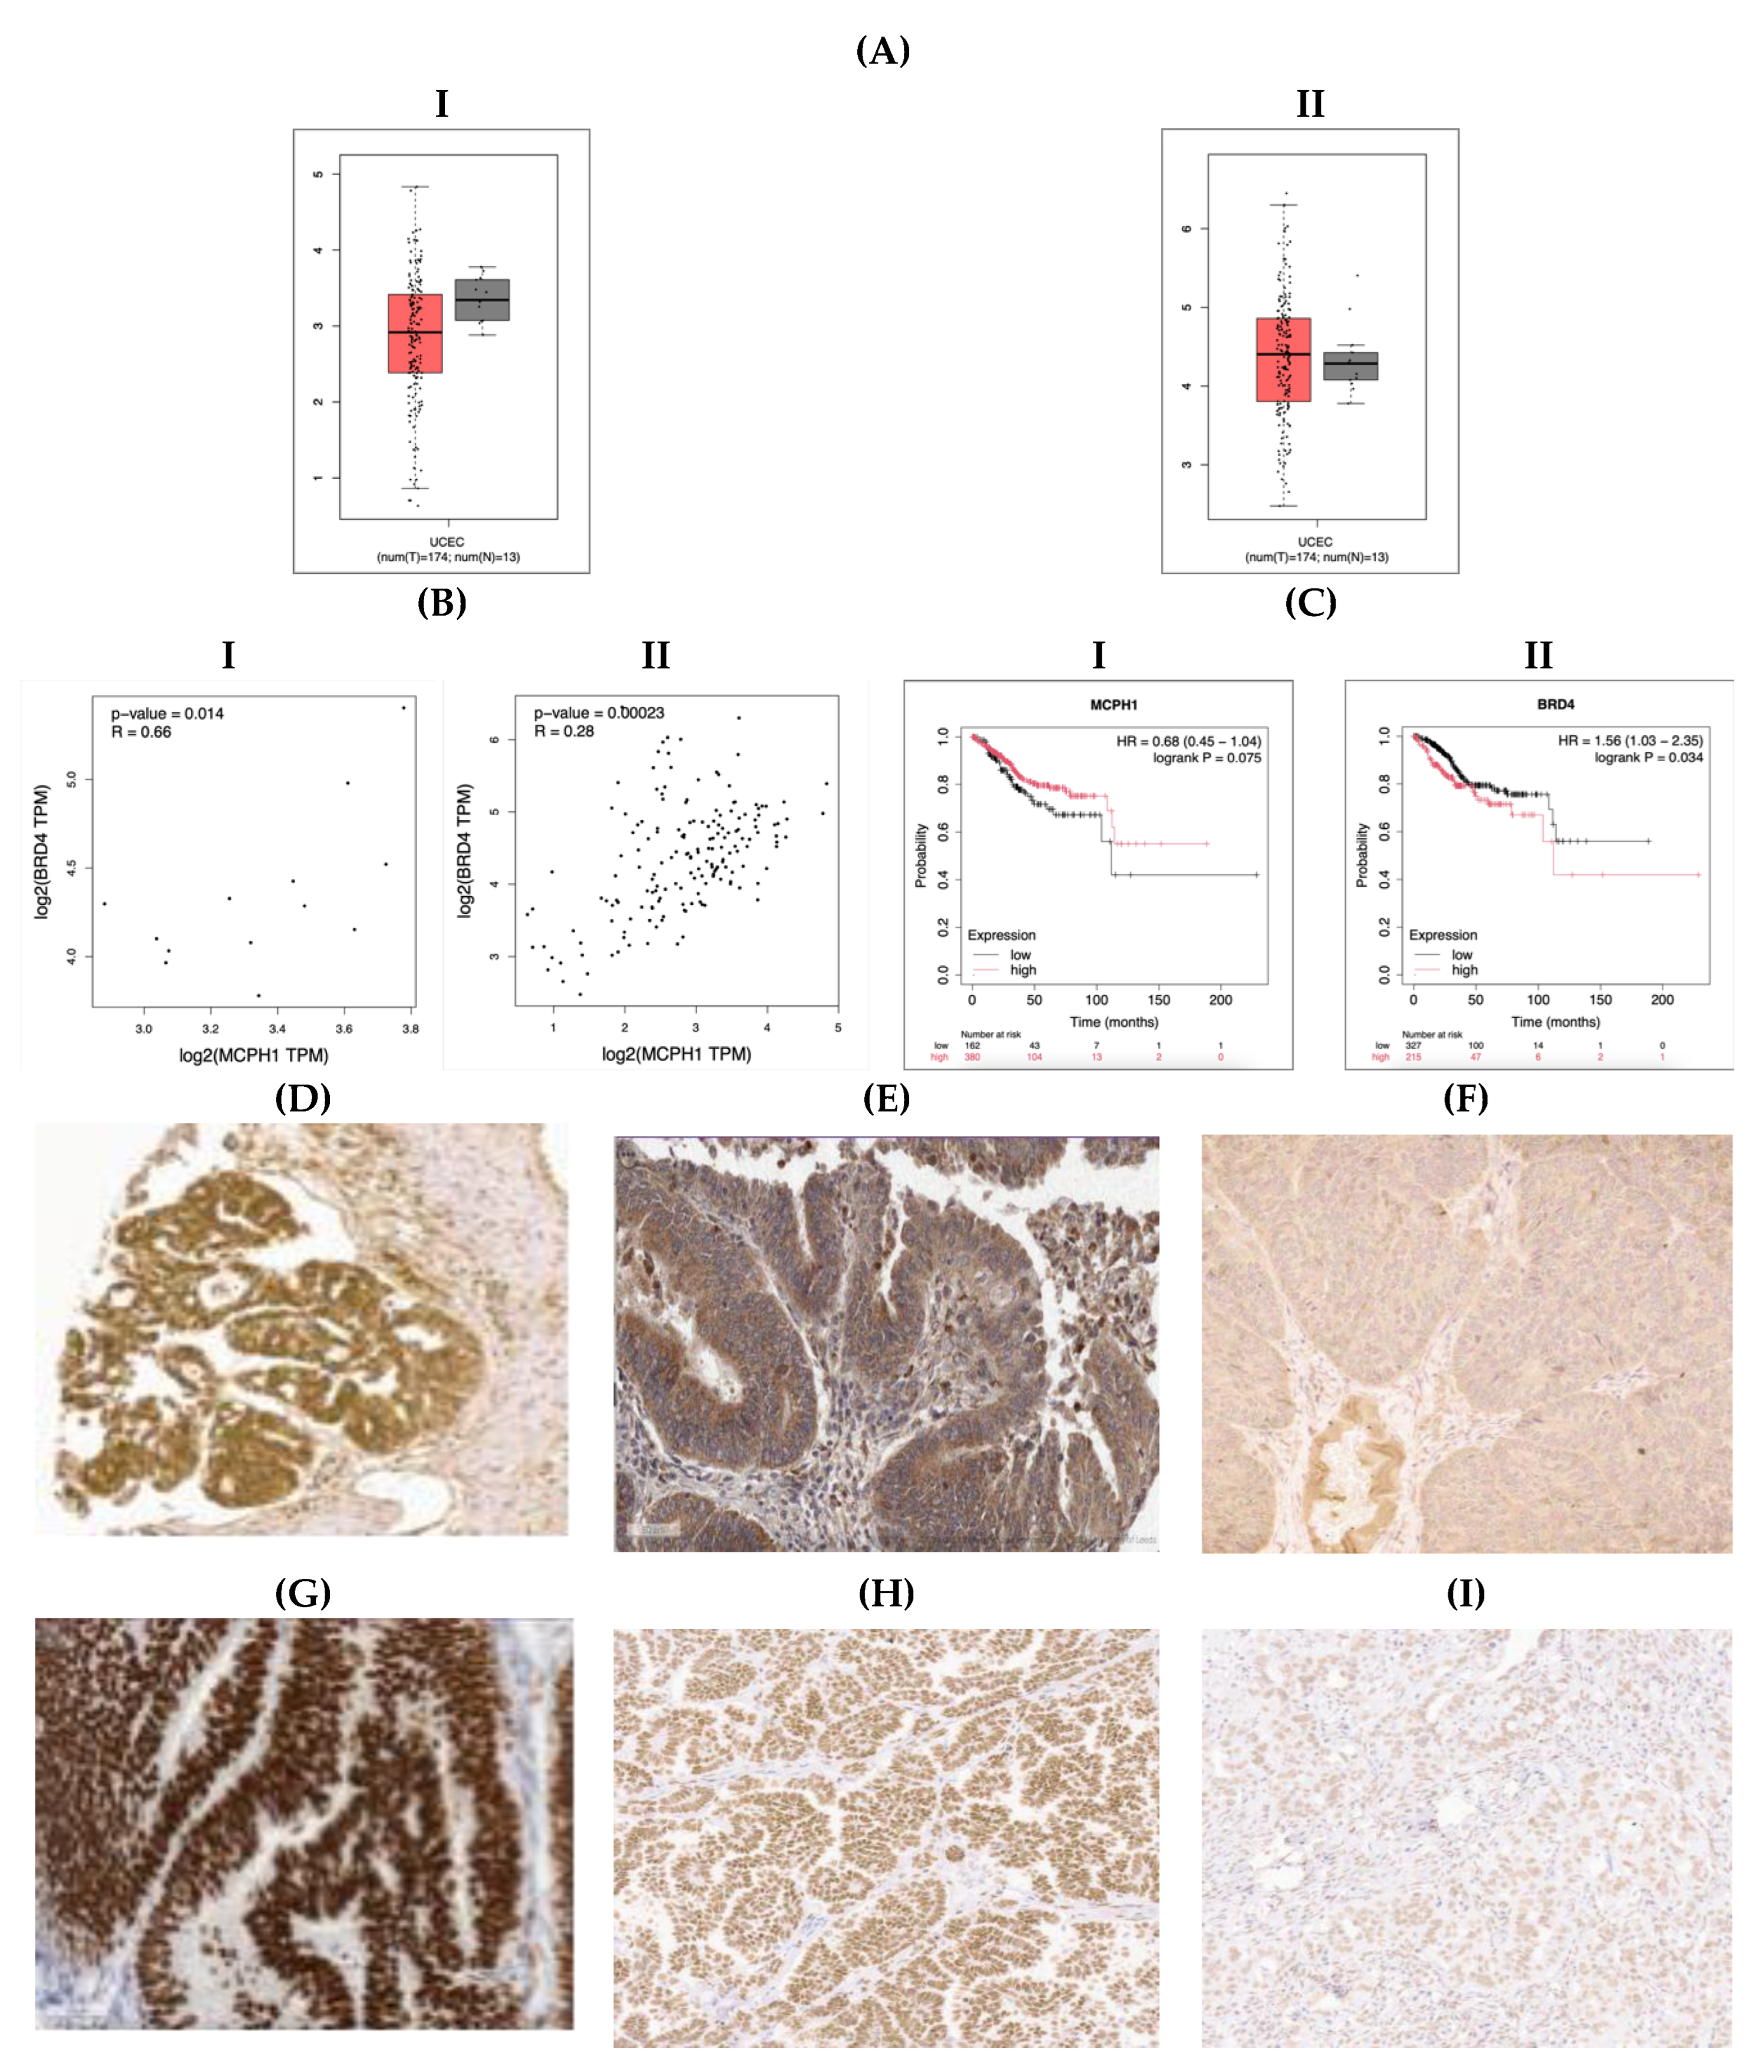
Figure 2.
Significant associations between median MCPH1 and BRD4 expression and EC ICI parameters. Box plots represent IQR, the central line median expression and the whiskers the minimum and maximum values (A) MCPH1 expression associated with positive CD8 infiltration (p=0.025), (B) MCPH1 expression associated with positive PD-L1 CPS (p<0.001), (C) MCPH1 expression associated with positive tumoural PD-1 expression (p<0.001), (D) BRD4 expression associated with the presence of p53 mutation (p=0.011), (E) BRD4 expression associated with p53 mutation compared to MMRp p53WT and MMRd (p=0.054) and (p=0.016) subgroups, (F) BRD4 expression associated with positive CD8 infiltration (p=0.001), (G) BRD4 expression associated with negative PD-L1 CPS (p=0.012), (H) BRD4 expression associated with positive PD-1 expression in tumour cells (p<0.001), (I) BRD4 expression associated with positive PD-1 expression in lymphocytes (p=0.003). Pair-wise MW comparison performed.
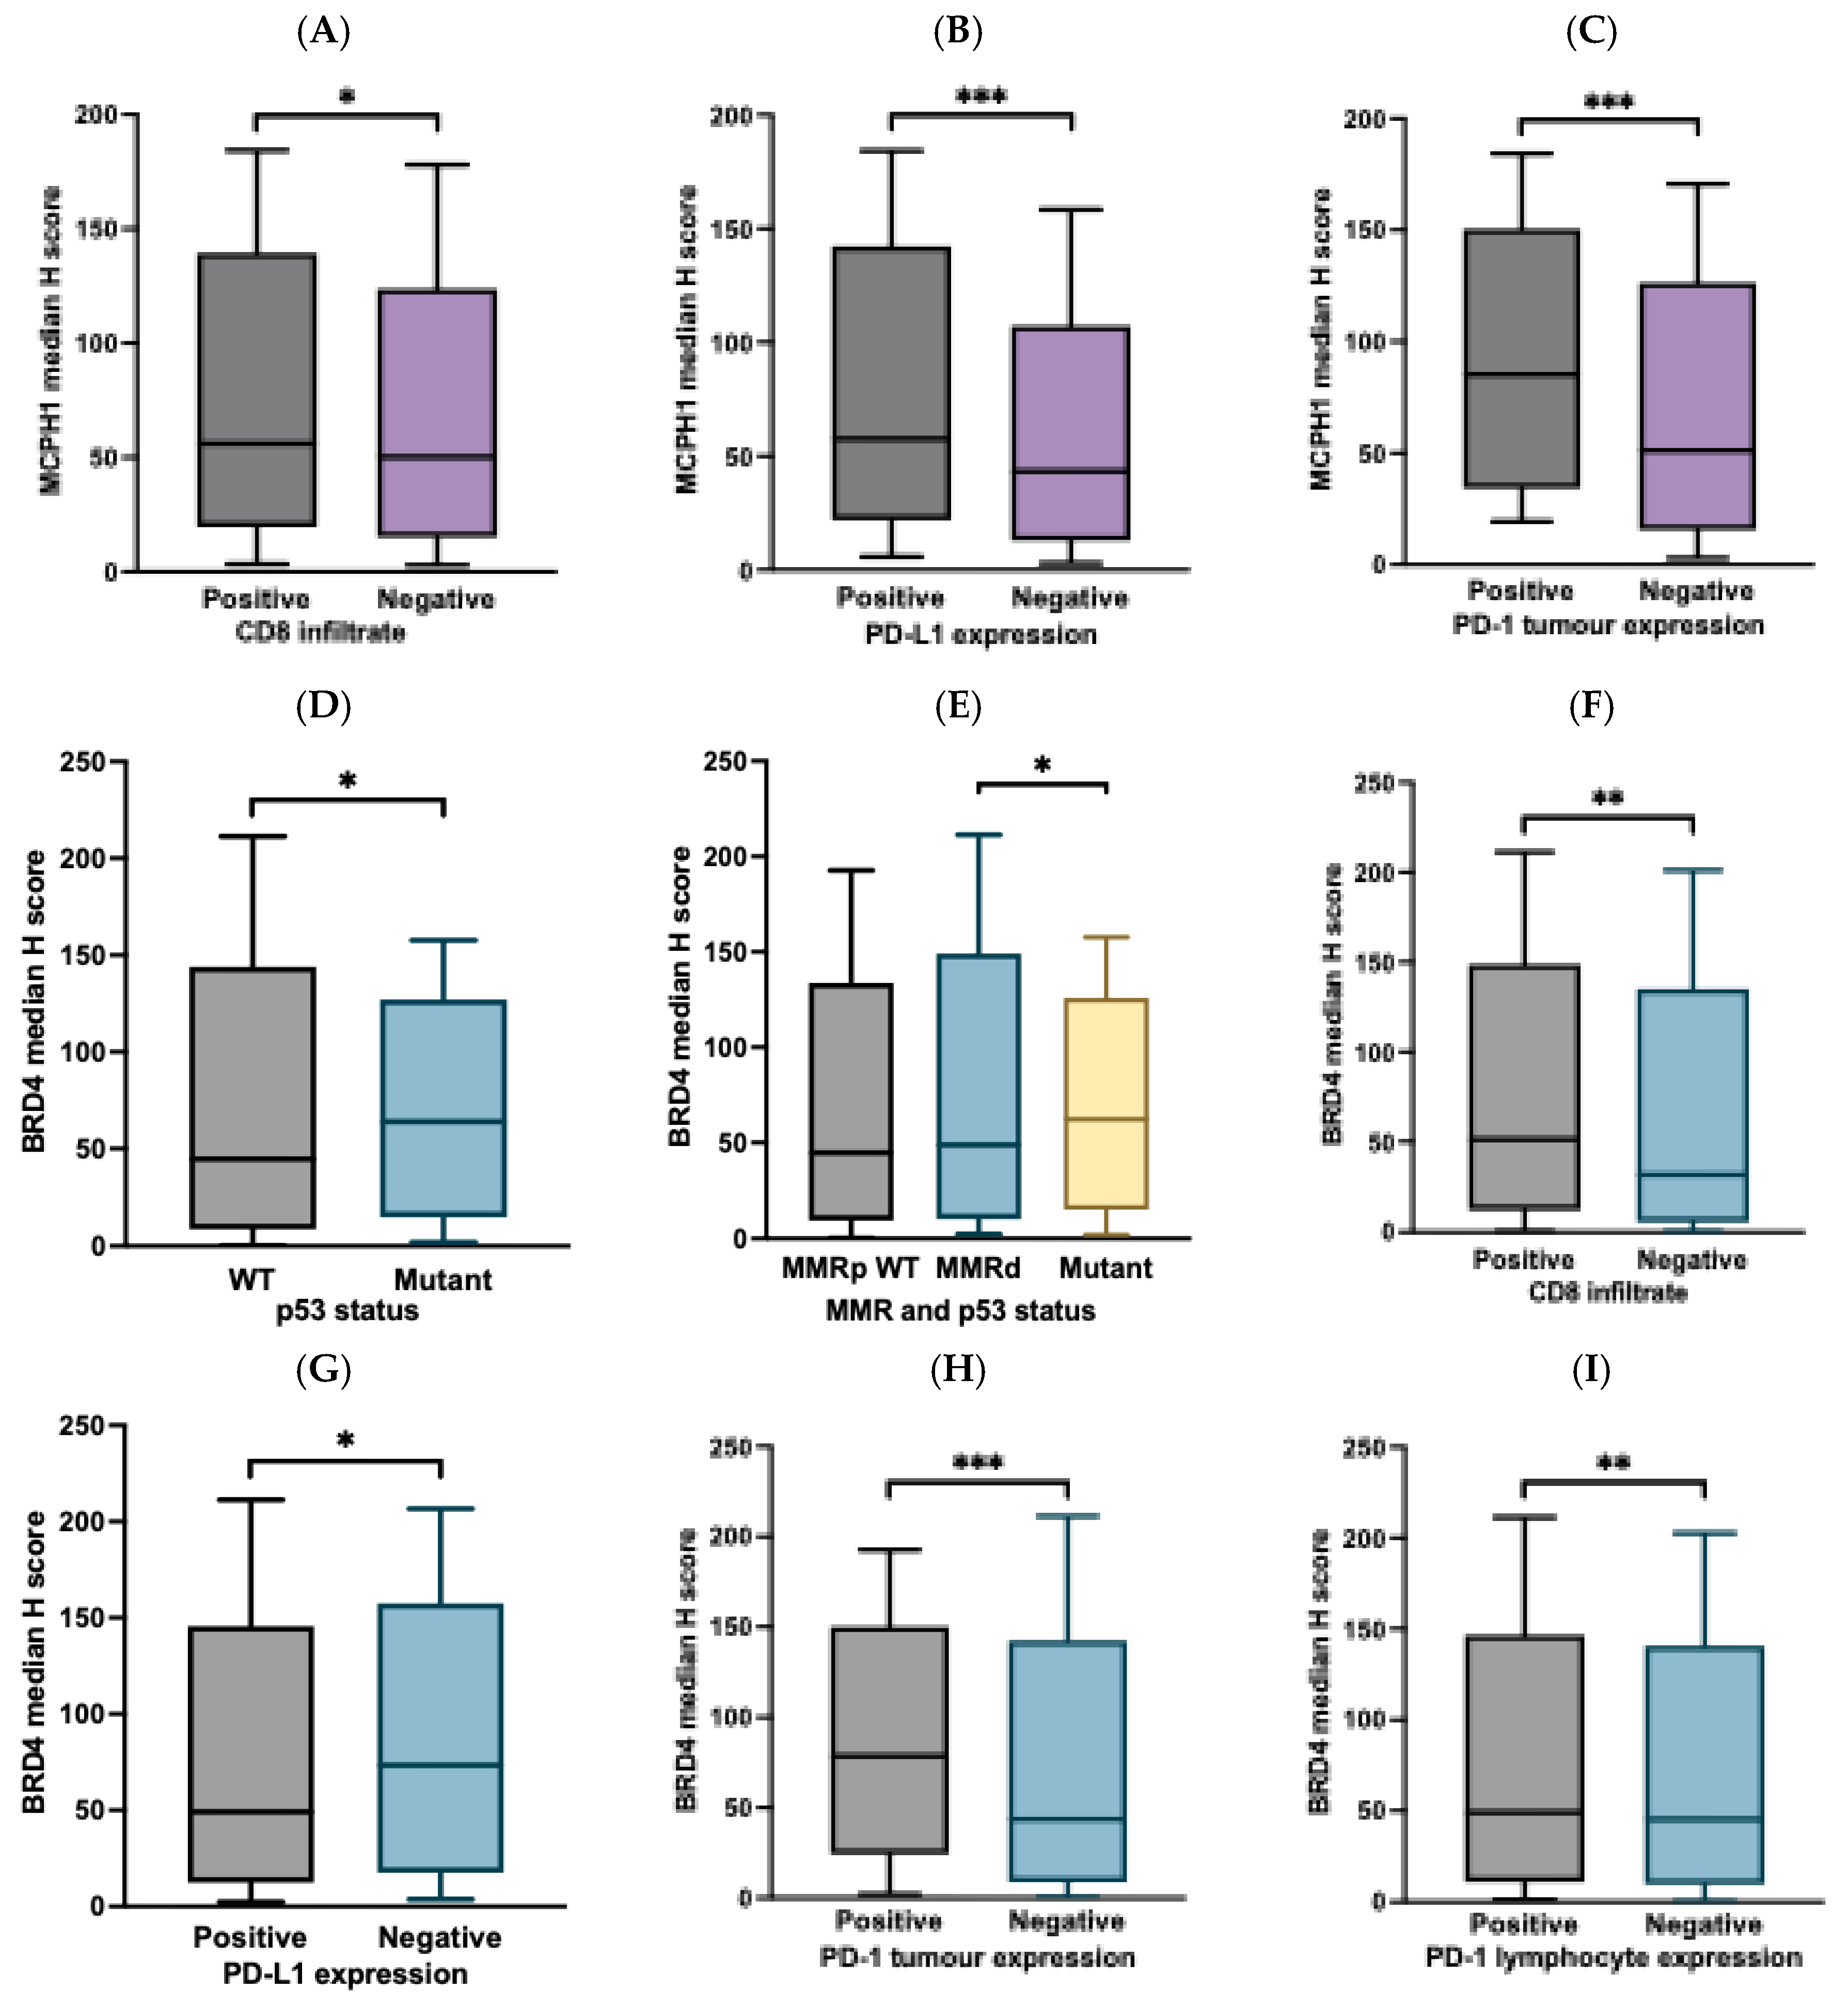

Table 1.
Study cohort clinicodemographic data.
| Parameter | MCPH1 N=372 N (%) | BRD4 N=376 N (%) |
|---|---|---|
| Age distribution | 372 | 376 |
| ≥ 50 | 322 (86.6) | 325 (86.4) |
| < 50 | 50 (13.4) | 51 (13.6) |
| Tumour grade | 372 | 376 |
| Low (grade I and II) | 219 (58.8) | 223 (59.3) |
| High (grade III) | 153 (41.1) | 153 (40.6) |
| FIGO stage | 372 | 376 |
| Stage I | 231 (62.0) | 235 (62.5) |
| Stage II | 38 (10.2) | 37 (9.8) |
| Stage III | 73 (19.6) | 74 (19.7) |
| Stage IV | 30 (8.0) | 30 (7.9) |
| Histological subtypes | 372 | 376 |
| Endometrioid | 262 (70.4) | 266 (70.7) |
| Serous | 30 (8.0) | 30 (7.9) |
| Clear cell | 11 (2.9) | 10 (2.6) |
| Carcinosarcoma | 24 (6.4) | 25 (6.6) |
| Mixed | 43 (11.5) | 43 (11.4) |
| Mucinous | 1(0.3) | 1 (0.3) |
| Undifferentiated | 1(0.3) | 1 (0.3) |
| Lymphovascular space invasion status | 369 | 373 |
| Present | 195 (52.8) | 197 (52.8) |
| Absent | 174 (47.2) | 176 (47.1) |
| Lymph node status | 372 | 377 |
| Non sampled | 74 (19.8) | 77 (20.4) |
| Positive | 56 (15) | 57 (15.1) |
| Negative | 242 (65) | 243 (64.4) |
| Cervical stromal invasion | 371 | 375 |
| Positive | 86 (23.1) | 86 (22.9) |
| Negative | 285 (76.8) | 289 (77.0) |
| Depth of myometrial invasion | 372 | 376 |
| Invasion of inner half | 186 (50) | 189 (50.2) |
| Invasion of outer half | 186 (50) | 187 (49.7) |
| Received Chemotherapy | 372 | 376 |
| Yes | 153 (41.1) | 63 (16.7) |
| No | 219 (58.8) | 313 (83.2) |
| Received Radiotherapy | 372 | 376 |
| Yes | 133 (35.7) | 133 (35.3) |
| No | 239 (64.2) | 243 (64.6) |
| Vital status | 372 | 376 |
| Alive | 285 (76.6) | 289 (76.9) |
| Deceased | 87 (23.4) | 87 (23.13) |
Table 2.
Correlation of MCPH1 and BRD4 expression with clinicopathological data.
| Parameter | MCPH1 H score expression | BRD4 H score expression | ||||||||
|---|---|---|---|---|---|---|---|---|---|---|
| Continuous* | Categorised** | Continuous* | Categorised** | |||||||
| Median | p value | Low (<22.8) N (%) |
High (≥22.8) N (%) |
p value | Median | p value | Low (<47.43) N (%) |
High (≥47.43) N (%) |
p value | |
| Age distribution | ||||||||||
| < 50 ≥ 50 |
53.40 53.13 |
0.933 | 9 (2.4) 60 (16.1) |
41 (11.0) 262 (70.4) |
0.915 | 43.54 48.73 |
0.318 | 29 (7.7) 159 (42.3) |
22 (5.9) 166 (44.1) |
0.292 |
| Tumour grade | ||||||||||
| Low grade High grade |
56.63 49.66 |
0.274 | 41 (11) 28 (7.5) |
178 (47.8) 125 (33.6) |
0.918 | 44.78 52.36 |
0.054 | 117 (31.1) 71 (18.9) |
106 (28.2) 82 (21.8) |
0.248 |
| FIGO stage | ||||||||||
| Stage I Stage II Stage III Stage IV |
53.22 61.41 53.54 51.56 |
0.764 |
48 (12.9) 6 (1.6) 12 (3.2) 3 (0.8) |
183 (49.2) 32 (8.6) 61 (16.4) 27 (7.3) |
0.454 |
47.07 44.09 51.82 50.82 |
0.661 | 120 (31.9) 20 (5.3) 35 (9.3) 13 (3.5) |
115 (30.6) 17 (4.5) 39 (10.4) 17 (4.5) |
0.777 |
| Histological subtypes | ||||||||||
| Endometrioid Serous Clear cells Carcinosarcoma Mixed Mucinous Undifferentiated |
53.28 46.26 73.43 43.18 71.78 00.00 00.00 |
0.093 | 51 (13.7) 7 (1.9) 2 (0.5) 3 (0.8) 6 (1.6) 0 (0) 0 (0) |
211 (56.7) 23 (6.2) 9 (2.4) 21 (5.6) 37 (9.9) 1 (0.3) 1 (0.3) |
0.896 | 44.66 63.00 31.20 57.63 48.85 00.00 00.00 |
0.131 | 139 (37) 11 (2.9) 6 (1.6) 9 (2.4) 21 (5.6) 1 (0.3) 1 (0.3) |
127 (33.8) 19 (5.1) 4 (1.1) 16 (4.2) 22 (5.9) 0 (0) 0 (0) |
0.316 |
| Histological categorised | ||||||||||
| Endometrioid Non-endometrioid |
53.28 52.11 |
0.577 | 51 (13.7) 18 (4.8) |
211 (56.7) 92 (24.7) |
0.482 | 44.66 56.97 |
0.030 | 139 (37) 49 (13) |
127 (33.8) 61 (16.2) |
0.174 |
| Lymphovascular space invasion | ||||||||||
| Positive Negative |
52.95 53.37 |
0.712 | 34 (9.2) 34 (9.2) |
161 (43.6) 140 (37.9) |
0.603 | 49.50 42.21 |
0.052 | 93 (24.9) 93 (24.9) |
104 (27.9) 83 (22.3) |
0.277 |
| Lymph node status | ||||||||||
| Positive Negative |
52.11 52.14 |
0.829 | 10 (3.4) 45 (15.1) |
46 (15.4) 197 (66.1) |
0.898 | 44.46 53.84 |
0.501 | 26 (8.7) 122 (40.7) |
31 (10.3) 121 (40.3) |
0.533 |
| Cervical stromal involvement | ||||||||||
| Positive Negative |
53.11 53.22 |
0.366 | 10 (2.7) 59 (15.9) |
76 (20.5) 226 (60.9) |
0.058 | 49.13 47.07 |
0.402 | 40 (10.7) 147 (39.2) |
46 (12.3) 142 (37.9) |
0.478 |
| Depth of myometrial invasion | ||||||||||
| Invasion of inner half Invasion of outer half |
53.92 51.56 |
0.917 | 37 (9.9) 32 (8.6) |
149 (40.1) 154 (41.4) |
0.505 | 43.54 62.66 |
0.132 | 100 (26.6) 88 (23.4) |
89 (23.7) 99 (26.3) |
0.257 |
| Adjuvant Chemotherapy | ||||||||||
| Yes No |
51.45 53.37 |
0.580 | 8 (2.2) 61 (16.4) |
54 (14.5) 249 (66.9) |
0.210 | 44.78 48.47 |
0.531 | 34 (9) 154 (41) |
29 (7.7) 159 (42.3) |
0.490 |
| Adjuvant Radiotherapy | ||||||||||
| Positive Negative |
52.96 53.32 |
0.692 | 27 (7.3) 42 (11.3) |
106 (28.5) 197 (53) |
0.517 | 44.90 48.85 |
0.692 | 70 (18.6) 118 (31.4) |
63 (16.8) 125 (33.2) |
0.450 |
| Adjuvant Therapy | ||||||||||
| Positive Negative |
52.46 53.39 |
0.810 | 29 (7.8) 40 (10.8) |
124 (33.3) 179 (48.1) |
0.866 | 44.90 48.85 |
0.980 | 80 (21.3) 108 (28.7) |
73 (19.4) 115 (30.6) |
0.462 |
| Event of EC death | ||||||||||
| Alive Deceased |
52.96 55.22 |
0.126 | 59 (15.9) 10 (2.7) |
226 (60.8) 77 (20.7) |
0.053 | 45.37 54.52 |
0.192 | 152 (40.4) 36 (9.6) |
137 (36.4) 51 (13.6) |
0.067 |
*The statistical analyses used are the Mann-Whitney U-test (MW) and Kruskal-Wallis equality of population rank test (KW), based on two or more groups with no assumption of normal distribution. **Statistical analysis used are Pearson’s Chi-squared test (PCS) or Fisher’s exact test (FE). ***Interquartile range (IQR). p<0.05 was considered significant and is shown in bold.
Table 3.
Correlation of MCPH1 and BRD4 expression with ICI biomarkers.
| Parameter | MCPH1 H score expression | BRD4 H score expression | ||||||||
|---|---|---|---|---|---|---|---|---|---|---|
| Continuous | Categorised | Continuous | Categorised | |||||||
| Median | p value |
Low (<22.8) N (%) |
High (≥22.8) N (%) |
p value | Median | p value | Low (<47.43) N (%) |
High (≥47.43) N (%) |
p value |
|
| p53 IHC staining status | ||||||||||
| Wild type (WT) Mutant |
51.06 51.34 |
0.620 | 53 (16.3) 12 (3.7) |
205 (63.1) 55 (16.9) |
0.631 | 44.66 63.98 |
0.011 | 139 (42.1) 25 (7.6) |
123 (37.3) 43 (13) |
0.017 |
| MMR IHC staining status* | ||||||||||
| MMR-proficient (MMRp) MMR-deficient (MMRd) |
52.63 52.61 |
0.972 | 41 (11.5) 24 (6.8) |
220 (62) 70 (19.7) |
0.035 | 47.5 48.7 |
0.966 | 132 (36.8) 46 (12.8) |
132 (36.8) 49 (13.6) |
0.792 |
| Mutation status | ||||||||||
|
MMRp p53WT MMRd p53 Mutant |
50.88 52.61 51.67 |
0.691 | 30 (9.1) 24 (7.3) 11 (3.3) |
139 (42.2) 70 (21.3) 55 (16.7) |
0.246 | 44.66 48.73 62.20 |
0.054 | 92 (27.5) 46 (13.8) 25 (7.5) |
80 (24) 49 (14.7) 42 (12.6) |
0.080 |
| CD8 infiltration status** | ||||||||||
| Positive Negative |
56.21 50.32 |
0.025 | 43 (16.7) 21 (22.8) |
215 (83.3) 71 (77.2) |
0.189 | 51.3 31.5 |
0.189 | 116(44.4) 61 (65.6) |
145 (55.6) 32 (34.4) |
<0.001 |
| PD-L1 CPS status | ||||||||||
| Positive Negative |
57.61 43.37 |
<0.001 | 24 (11.4) 14 (6.7) |
130 (61.9) 42 (20) |
0.117 | 49.14 73.47 |
0.012 | 76 (35.8) 19 (9.0) |
80 (37.7) 37 (17.5) |
0.056 |
| PD-1 tumour cells | ||||||||||
| Positive Negative |
85.27 51.18 |
<0.001 | 1 (0.3) 64 (17.6) |
50 (13.8) 248 (68.3) |
0.001 | 84.02 49.14 |
<0.001 | 13 (3.5) 171 (46.6) |
38 (10.4) 145 (39.5) |
<0.001 |
| PD-1 lymphocyte | ||||||||||
| Positive Negative |
52.63 53.28 |
0.845 | 8 (2.2) 57 (15.7) |
35 (9.6) 263 (72.5) |
0.899 | 65.94 44.8 |
0.003 | 12 (3.3) 172 (46.9) |
32 (8.7) 151 (41.4) |
0.001 |
* 1. PMS2, MSH2, MSH6, ** Expression of marker in tumour stroma IHC staining.
Table 4.
Univariate and multivariate Cox regression analysis of disease-specific survival (DSS) in patients with EC.
Table 4.
Univariate and multivariate Cox regression analysis of disease-specific survival (DSS) in patients with EC.
| Parameter | Univariate | Multivariate | ||
|---|---|---|---|---|
| HR (95%) | p value | HR (95%) | p value | |
|
MCPH1 expression High ≥ 22.8 Low <22.8 |
2.014 (1.041- 3.894) | 0.038 | 2.054 (1.017-4.149) | 0.045 |
|
BRD4 expression High ≥47.4 Low <47.4 |
1.544 (1.008- 2.367) | 0.046 | 1.112 (0.694-1.791) | 0.659 |
|
Tumour grade High vs Low |
2.948 (2.174- 3.997) | <0.001 | 2.244 (1.218-4.136) | 0.010 |
|
Lymphovascular space invasion Presence vs absence |
0.190 (0.114- 0.317) | <0.001 | 0.427 (0.201-0.907) | 0.027 |
|
Cervical stromal involvement Positive vs negative |
0.313 (0.021- 0.471) | <0.001 | 0.596 (0.368-0.964) | 0.035 |
|
Depth of myometrial invasion Invasion of inner half vs Invasion of outer half |
3.766 (2.372- 5.981) | <0.001 | 2.516 (1.336-4.741) | 0.004 |
|
Mutation status MMRp p53WT MMRd p53 Mutant |
3.093 (2.356- 4.061) | <0.001 | 2.212 (1.597-3.064) | <0.001 |
|
FIGO stage Stage I Stage II Stage III Stage IV |
2.661 (2.206- 3.210) | <0.001 | 2.355 (1.729-3.208) | <0.001 |
|
Histological subtypes Non EEC vs EEC |
1.273 (1.137-1.424) | <0.001 | 2.148 (1.059-4.357) | 0.034 |
|
p53 status Mutant vs Wild type |
6.192 (3.994- 9.600) | 0.017 | 0.001 (0.000-2.427E+46) | 0.897 |
|
Chemotherapy No vs Yes |
0.337 (0.219- 0.520) | <0.001 | 1.957 (1.068-3.586) | 0.030 |
|
Lymph node status Positive vs negative |
0.818 (0.652- 1.028) | 0.085 | 1.184 (0.791-1.772) | 0.412 |
|
MMR status MMRd vs MMRp |
0.917 (0.583- 1.441) | 0.706 | 22.052 (0.000-1.535E+26) | 0.916 |
|
Age <50 vs ≥50 years |
2.027 (0.982- 4.182) | 0.056 | 1.424 (0.570, 3.558) | 0.449 |
Variables included clinical stage, tumour grade, lymphovascular invasion, cervical stromal involvement, depth of myometrial invasion, MMR/p53 status, chemotherapy, age, FIGO stage, histologic subtype. MCPH1 (high ≥ 22.8) and BRD4 (high ≥ 47.4) were classified based on survival outcomes. Univariate analysis evaluated each variable separately, those with p< 0.05 were incorporated into a multivariate Cox proportional hazards model to determine independent survival predictors. The results display hazard ratios (HR) with 95% confidence intervals (CI) and p--values. Significant predictors in the multivariate analysis are highlighted in bold.
Disclaimer/Publisher’s Note: The statements, opinions and data contained in all publications are solely those of the individual author(s) and contributor(s) and not of MDPI and/or the editor(s). MDPI and/or the editor(s) disclaim responsibility for any injury to people or property resulting from any ideas, methods, instructions or products referred to in the content. |
© 2025 by the authors. Licensee MDPI, Basel, Switzerland. This article is an open access article distributed under the terms and conditions of the Creative Commons Attribution (CC BY) license (http://creativecommons.org/licenses/by/4.0/).
Copyright: This open access article is published under a Creative Commons CC BY 4.0 license, which permit the free download, distribution, and reuse, provided that the author and preprint are cited in any reuse.


