
Submitted:
27 October 2025
Posted:
28 October 2025
You are already at the latest version
Abstract
This study investigates vibration signals generated during end milling of thin-walled EN AW-7075 aluminum alloy components using a set of 24 tools with distinct cut-ting-edge microgeometries. Five characteristic parameters describing the dynamic re-sponse of the process, including both energy-related and statistical indicators, were ex-tracted and analyzed. The results clearly demonstrate the critical influence of tool micro-geometry on process dynamics. In particular, the introduction of an additional ze-ro-clearance flank land at the cutting edge proved decisive in suppressing vibrations. For the most favorable geometries, the root mean square (RMS) value of vibration was reduced by more than 50%, while the spectral power density (PSD) decreased by up to 70–75% compared with the least favorable configurations. Simultaneously, both time- and fre-quency-domain responses exhibited complex and irregular patterns, highlighting the lim-itations of intuitive interpretation and the need for multi-parameter evaluation. To enable a synthetic comparison of tools, the Vibration Severity Index (VSI), which integrates RMS and kurtosis into a single composite metric, was introduced. VSI-based ranking allowed the clear identification of the most dynamically stable geometry. For the selected tool, ad-ditional analysis was conducted to evaluate the influence of cutting parameters, namely feed per tooth and radial depth of cut. The results showed that the most favorable dynam-ic behavior was achieved at a feed of 0.08 mm/tooth and a radial depth of cut of 1.0 mm, whereas boundary conditions resulted in higher kurtosis and a more impulsive signal structure. Overall, the findings confirm that properly engineered cutting-edge microgeom-etry, especially the formation of additional zero-clearance flank land significantly en-hances the dynamic of thin-wall milling, demonstrating its potential as an effective strat-egy for vibration suppression and process optimization in precision machining of light-weight structural materials.
Keywords:
milling
; dynamic
; vibrations
; cutting tool
; geometry
; zero-clearance flank land
1. Introduction
Thin-walled components are widely used across various industrial sectors where manufactured parts must meet stringent strength requirements while maintaining minimal weight. For this reason, they are frequently employed in the aerospace and space industries [1,2]. From a structural integrity perspective, the most effective solution is often to produce thin-walled parts from a single block of material to minimize the presence of joints and eliminate casting process. Consequently, milling is one of the most widely applied industrial methods for manufacturing such components [3]. However, this type of machining poses numerous challenges, even with the current state of technology. During milling of low-stiffness structures, problems such as resonance, chatter vibrations, and stress accumulation can occur, leading to significant form and surface errors, and in extreme cases, even to wall fracture [4,5]. Selecting a tool with variable pitch or adjusting the cutting parameters is typically the first step in mitigating these phenomena, but high-volume production often requires more advanced vibration suppression strategies [6].
Among effective methods for damping vibrations in thin-walled milling, tool geometry modifications have proven particularly beneficial. Tools with variable pitch or crest-cut designs can extend the chatter-free cutting range by up to 40% [4]. Passive tuned mass dampers (TMDs) mounted directly on the workpiece can reduce the vibration amplitude of thin-walled structures by nearly 50% [7], while their enhanced version (LTMDI), installed within the tool holder, can potentially lower acceleration by as much as 60% [8]. Another effective approach involves filling the tool body with a lattice structure, which attenuates vibrations by approximately 15 dB [9]. Alternatively, adaptive control of cutting parameters based on process dynamics prediction can reduce vibration amplitude by up to 70% [10]. In terms of chatter detection, the HHT-EA method enables the onset of vibrations to be identified several spindle revolutions in advance [11], and the application of acoustic signal analysis combined with K-means clustering improves detection sensitivity by 12% [12]. Modern tool condition monitoring (TCM) systems integrating acceleration data, FFT analysis, and machine learning achieve tool classification accuracy as high as 95% [13]. Literature reviews further indicate that combining passive damping with online chatter detection currently represents the most effective development direction [14]. Moreover, recent studies on EN AW-7075 T651 alloy show that precise adjustment of cutting speed and feed rate results in a significant reduction in cutting forces and surface roughness (Ra), highlighting the strong influence of cutting parameters on the machining process [15].
The influence of cutting-edge microgeometry, defined here as the cutting-edge radius (R), the width of the zero-clearance flank land (bf), and additional features such as chamfers or Wiper surfaces is increasingly being linked not only to cutting forces and surface roughness but also to the dynamic behavior of the machining process. A classical literature review conducted more than a decade ago demonstrated that micrometer-scale edge modifications can alter the contact stiffness between the tool and the workpiece, as well as the tool’s susceptibility to vibrations, by up to an order of magnitude[16]. More recent systematic studies confirm that an appropriately selected radius R not only reduces local stresses but also shifts the natural frequencies of the tool–chip–workpiece system[17,18]. Experimental research has shown that even a slight change in R, just a few micrometers, can significantly reduce vibration amplitude and cutting forces; this has been demonstrated in milling stainless steel [19], with similar trends reported for SUS-316L [20] and nickel-based alloys [21]. Limits of process dynamics are also influenced by the proper form-factor of the edge rounding [22] and by controlled adjustment of the tool’s K-factor [23].
Applying a Wiper geometry or introducing a narrow zero-clearance flank land further enhances process dynamics and machining performance. It has been shown that a micro-chamfer with a width below 50 µm reduces the scatter of surface roughness Ra with only a slight increase in cutting forces [24], while subsequent optimization of this feature can shorten machining time by up to 18% without compromising the required surface quality [25]. The influence of flute shape and cutting-edge geometry has been described by numerous authors, demonstrating that a well-designed serration profile can increase the permissible feed rate by as much as 100% while maintaining chatter-free operation [26,27,28]. Promising results have also been obtained from finite element modeling (FEM) of cutter geometry, where simultaneous optimization of the cutting-edge radius R and the zero-clearance flank land enabled a reduction in the threshold resonance energy[29].
Thin-wall pieces vibration during end milling can have two causes. The first is chatter, a self-excited vibration due to previous passes; in thin walls both stiffness and modal mass change along milling, so stability conditions are all time varying, as defined in [30,31]. Other typical vibration is related to dynamic amplification due to cutting-edge continuous hits on piece’s surface. The tooth passing frequency can be close in value to thin-wall natural frequencies, so amplification could happen. The forced dynamic response can generate strong vibrations and marks on machined surfaces. The work present deal with those cases where neither chatter nor strong vibration happens, but vibrational response is high due to the small wall thicknesses.
The available literature still lacks studies investigating the combined influence of cutting-edge radius R and zero-clearance flank land width bf on the vibration spectrum during milling of thin-walled components. The authors’ recent works have already demonstrated that the selection of an appropriate zero-clearance flank land width, together with a micro-scale cutting-edge radius, has a significant impact on cutting forces [32] and, to a considerable extent, on surface roughness [33]. Both studies revealed that there are specific ranges of zero-clearance flank land width and edge radius for which cutting force and surface roughness reach their minimum values simultaneously. However, the effect of this innovative cylindrical zero-clearance flank land in combination with cutting edge radius on the amplitude and character of vibrations has not yet been investigated. This identified research gap, the absence of holistic studies linking micro-edge geometrical parameters with comprehensive vibration diagnostics, provides strong motivation for the present research and represents a key contribution of the novel tool concept with a zero-clearance flank land to the development of stable milling strategies for thin-walled structures.
In this study, a comprehensive experimental investigation was conducted to evaluate the influence of cutting-edge microgeometry, specifically the edge radius and the width of the zero-clearance flank land, on the dynamic behavior of thin-walled milling. A dedicated set of 24 custom-manufactured tools with distinct microgeometries was prepared and thoroughly characterized. Vibration signals were recorded during machining, and their energy- and statistics-based features were analyzed to assess process dynamics. The Vibration Severity Index (VSI) was introduced as a composite metric to compare tool performance, and the effect of cutting parameters such as feed per tooth and radial depth of cut was also examined. The obtained results provide new insights into the role of microgeometry in vibration suppression and contribute to the development of optimized tool designs for stable machining of thin-walled components.
2. Materials and Methods
For the purpose of this study, 27 end mills with specifically tailored geometries defined by variations in cutting-edge radius primary clearance angle and zero-clearance flank width were custom-manufactured. The microgeometry of the tools was produced using abrasive-jet machining, followed by the deposition of a 2 µm ZrN coating. However, the fabrication of such highly precise tools proved to be more challenging than initially anticipated, and the manufacturer was unable to deliver perfectly matched specimens for all the ordered configurations. Therefore, each tool underwent a detailed verification process prior to machining: its geometry was examined using an Alicona InfiniteFocus optical microscope. The results of this analysis revealed that not all tools met the desired geometric specifications. Consequently, repeated geometries were standardized, and the experimental campaign was carried out exclusively on 24 unique microgeometry configurations. Their dimensional parameters are summarized in Table 1 and illustrated in Figure 1.
For the vibration measurement experiments, an advanced data acquisition system was employed. The setup included a DMU 100 Monoblock CNC machining center, on which the test workpiece was mounted. A piezoelectric accelerometer (model M353B16, SN 144875) was attached directly to the workpiece. The sensor featured a sensitivity of 1000 mV/g, a measurement range from –5 g to 5 g, and a sampling frequency set to 25.6 kHz. The accelerometer was connected to a National Instruments (NI) 9234 data acquisition card, integrated with an NI USB-9162 interface, which enabled fast and reliable data transfer to a computer running Signal Express software. The acquired data were subsequently processed in the MATLAB environment (R2024a), which facilitated advanced signal analysis and processing for the identification and characterization of vibrations generated during the cutting process. A schematic representation of the experimental setup is shown in Figure 2.
The experimental setup was configured as follows: the accelerometer sensor was mounted on a 0.1 mm thick metal plate using a cyanoacrylate instant adhesive. This mounting method was necessary because the aluminum alloy used in the study is non-magnetic, while the sensor is designed for magnetic attachment. The chosen approach ensured a stable and durable connection between the sensor and the workpiece, while also allowing for quick repositioning of the sensor between successive tests.
The experimental investigation of the influence of cutting-edge microgeometry on vibrations during down milling was carried out under constant cutting conditions (Figure 3): feed per tooth of 0.06 mm/tooth, radial depth of cut of 0.4 mm, and axial depth of cut of 20 mm. Each test specimen consisted of a thin-walled structure with a wall thickness of 5 mm and a height of 20 mm, supported by a 24 mm wide clamping base at the bottom. The specimens were subjected to rough milling in their clamped state prior to the precision finishing operation, resulting in a final wall thickness of 2 mm. The spindle speed was set to 7 000 rpm, corresponding to a cutting speed of 440 m/min, as recommended by the tool manufacturer. Furthermore, this spindle speed was confirmed through modal analysis as the rotational speed that ensures stable cutting conditions.
The second part of the experimental study focused on investigating the influence of two key cutting parameters, feed per tooth and radial depth of cut on the characteristics of vibrations generated during machining. In addition, the spindle speed was increased to n = 12 000 rpm, corresponding to a cutting speed of 600 m/min, which is conditionally recommended by the tool manufacturer and also falls within the stable cutting regime identified for the process. The feed per tooth range was set between 0.06 and 0.10 mm/tooth, while the radial depth of cut varied from 0.4 to 1.0 mm (Table 2). The accelerometer mounting method and all other geometrical parameters of the cutting tool remained unchanged compared with the previous setup, ensuring accurate comparison of the effects of varying cutting parameters on the vibration phenomena under investigation.
3. Vibration Signal Analysis Method
The recorded vibration signal, typically longer than the actual cutting time, was trimmed to isolate the segment corresponding to the tool’s contact with the workpiece, which is characterized by a distinct change in amplitude. To achieve this, the point-by-point difference of the signal was calculated, and the onset of cutting engagement was identified as the point where the absolute value of this difference exceeded a threshold of 0.1 g [34]. Additionally, a 0.5 s time margin was added before and after the identified cutting segment. This procedure eliminated variations caused by differences in total measurement duration and ensured temporal consistency in the onset of vibrations across all samples.
After extracting the relevant portion of the signal, a band-pass filtering process was applied, following the methodology reported in previous studies [13] which were further validated by the authors through dedicated experiments. The frequency range was set between 200 Hz and 10 kHz. The lower cutoff frequency was chosen to eliminate low-frequency components (< 200 Hz) that could originate from machine table motion, structural vibrations of massive components, or tilting effects. The upper cutoff frequency removed very high-frequency components (> 10 kHz), which typically carry limited useful information in the context of milling process dynamics analysis. The filtering was implemented using a fourth-order Butterworth filter with zero-phase filtering to avoid introducing phase shifts into the signal [11,12]. Subsequently, both the raw and filtered signals were subjected to an in-depth analysis with respect to selected vibration parameters.
Analyzing vibration indicators for both the raw (unfiltered) and filtered signals provides a more comprehensive understanding of the dynamic behavior of the milling process. The raw signal reflects the full vibration response of the system, including low-frequency structural components and transient effects, which are valuable for assessing the overall dynamic state of the machine–tool–workpiece system. However, these low-frequency components can sometimes mask high-frequency features directly related to cutting dynamics and tool–workpiece interactions. Filtering the signal isolates the frequency range most relevant to the cutting process, enhancing the sensitivity of selected indicators (such as RMS, kurtosis, or PSD) to tool geometry and process conditions. Evaluating both signals therefore allows for a more robust interpretation: the unfiltered data provide insight into global dynamic phenomena, while the filtered signal enables a focused analysis of vibration characteristics directly linked to process dynamics and tool performance.
The main vibration parameters analyzed in this study were:
RMS (Root Mean Square) is a statistical measure used to quantify the average energy of a signal. It is particularly useful in vibration analysis as it enables the assessment of the mean power of a vibration signal regardless of its temporal variability [35,36]:
where x[n] is discrete signal sample at point n, N – total number of samples.
Band energy is a measure of the amount of signal energy contained within a specific frequency range (band). In the context of vibration analysis, band energy enables the identification and quantification of vibration energy distributed across different frequency bands [35,37]:
where Eband is band energy within the selected frequency range, k1 is lower bound of the frequency band, k2 is upper bound of the frequency band and X[k] is FFT (Fourier Transform) coefficient of the signal within the frequency range.
Peak-to-peak amplitude is the difference between the maximum and minimum values of the signal [38]. This parameter is sensitive to short-term impulses and provides an indication of the largest vibration excursions.
Kurtosis – a statistical parameter used to detect narrow, high-amplitude peaks within a signal. Kurtosis values significantly greater than 3 typically indicate the presence of more impulsive events compared with a normal distribution [39]. It can be calculated as follows:
where is the mean value of the signal and is the standard deviation of the signal.
PSD – Power Spectral Density – the power spectral density was calculated using Welch’s method, which involves averaging periodograms obtained from overlapping segments of the signal [40]. This approach reduces the variance of the spectral estimate at the expense of frequency resolution. Additionally, the sum of PSD values was used as a simplified indicator of the signal power in the frequency domain.
For each sample, four plots were generated (Figure 4):
- The original (unfiltered) vibration signal as a function of time,
- The filtered vibration signal,
- The power spectral density (PSD),
- The dominant frequencies identified based on the peaks in the PSD using the findpeaks function.
To identify which combinations of cutting tool geometrical parameters provide the most favorable dynamic performance of the milling process, a multi-criteria evaluation approach based on the Vibration Severity Index (VSI) was applied. This index was defined as the composite desirability (geometric mean) of two responses describing essential characteristics of the vibration signal: RMSFiltered – the root mean square of the filtered vibration amplitude, where lower values are considered beneficial and KURFiltered – the kurtosis of the filtered signal, representing its impulsiveness, for which lower values are also preferable.
The method is based on the widely used Derringer–Suich desirability function for multi-response optimization, which enables the transformation of individual response variables into a unified, dimensionless scale ranging from 0 to 1, followed by their aggregation as a geometric mean [41,42]. For smaller-the-better type responses (in this case: RMSFiltered and KURFiltered), the individual desirability function d(y) is defined as:
where: T – target (desired) value, U – upper unacceptable limit and s – shape parameter (set to s=1)
In this study, the values of T and U were defined as the minimum and maximum values observed within the dataset, respectively. Sensitivity analysis confirmed the dynamics of the ranking even when the thresholds were determined by the 10th and 90th percentiles. The composite desirability index (VSI) for the two responses, with weights w1 (RMS) and w2 (Kurtosis), was defined as the geometric mean:
In this study, equal weights were applied (w1=w2=1). The property of “limited compensation” ensures that an extremely unfavorable result in one criterion (e.g., excessively high kurtosis) significantly reduces the overall index value, which is a desirable feature when evaluating vibration severity.
4. Analysis of the Influence of Cutting-Edge Microgeometry
To characterize the dynamic behavior of the milling process, a detailed analysis of five fundamental vibration indicators was conducted: root mean square (RMS), band energy (BE), peak-to-peak amplitude (PTP), kurtosis (KUR), and total power spectral density (PSD) (Figure 5). Each parameter was calculated for both the raw signal and the band-pass filtered signal (200 - 10 000 Hz), which allowed the extraction of components most relevant to process dynamics.
For the RMS parameter, which represents the average vibration energy over time, a pronounced variation among the individual tools was observed (Figure 5a). The filtered RMS values ranged from 0.040 g to 0.159 g, corresponding to more than a threefold difference between the extreme cases. This indicates that the cutting tools exhibited significant differences in their ability to generate and attenuate vibrations within the analyzed frequency range. These results clearly show that certain tool geometries provide substantially lower levels of dynamic energy during the cutting process. In particular, tools no. 1, 4, 10, 11, 12, and 20 exhibited the lowest RMS values for both raw and filtered signals, indicating superior vibration suppression capability.
A similar trend was observed for the band energy parameter BE, which reflects the total vibration energy contained within the analyzed frequency band (Figure 5b). The filtered values varied widely, from approximately 240 J to nearly 4000 J. This extensive range exceeding 1500% clearly demonstrates the strong dependence of the mechanical efficiency of the cutting system on the specific geometrical features of the tool. However, when considering the band energy for both the raw and filtered signals, it is evident that tools no. 1, 4, and 20 consistently exhibited the lowest values, further confirming their advantageous dynamic performance.
The peak-to-peak (PTP) amplitude, which characterizes the maximum dynamic displacements, also exhibited considerable variation ranging from 0.924 g to over 3.0 g, as shown in Figure 5c. High values of this parameter may indicate an increased risk of chatter occurrence and impulsive chip–tool interactions, whereas lower values suggest more uniform cutting forces and reduced impact loading. It can be observed that tools no. 1, 2, 4, and 20 exhibited the lowest PTP values, but only for the filtered signal. In contrast, the peak-to-peak values for the raw (unfiltered) signal for these tools remained relatively high. Notably, only tool no. 11 demonstrated consistently low and similar PTP values for both the raw and filtered signals, indicating more stable dynamic behavior across the full frequency range.
Another parameter analyzed was kurtosis, which serves as a measure of the impulsiveness of the vibration signal. The range of observed values after filtering varied from 4.4 to 24.7 (Figure 5d), indicating that some tools generated quasi-stationary signal patterns, while others exhibited distinct energy spikes typical of unstable cutting conditions. Particularly high kurtosis values are associated with localized high-energy events, the presence of which may promote micro-damage to the cutting edge and deteriorate surface quality. It was observed that tools no. 2, 11, 13, 15, and 17 exhibited the lowest KUR values for both the raw and filtered signals. This indicates that machining with these tools results in the most stationary cutting process. An important observation for these tools is the very similar kurtosis values obtained for both the filtered and raw signals, which further confirms which confirms a stable and consistent dynamic behavior.
The total power spectral density (PSD) enabled the assessment of the energy distribution in the frequency domain (Figure 5e). The range of filtered PSD values varied from 0.0071 to 0.0728, with variations between tools exceeding 1000%. This parameter is particularly effective in illustrating the presence or absence of dominant resonances within the dynamic structure of the system and can serve as an indicator of its susceptibility to excitation of the natural frequencies of the machine tool or cutting tool. The most favorable and the lowest PSD values were recorded for tools no. 1, 4, 10, 11, 12, and 20. This applies to both the raw and filtered signals, indicating that these tools exhibit the lowest susceptibility to resonance excitation across the entire analyzed frequency range.
All plots present the results obtained before and after band-pass filtering, allowing for a direct comparison of the effects of isolating the signal components most representative of the cutting process. In most cases, the parameter values decreased after filtering, indicating the presence of low-frequency disturbances or components irrelevant from the perspective of cutting mechanics. In some cases, the parameter values after filtering were similar to those of the raw signal, which typically indicates the absence of disturbances and deviations from normal behavior.
The observed differences between tools were distinct and systematic across all analyzed parameters, demonstrating the high sensitivity of the machine–tool–workpiece system to changes in tool microgeometry. Consequently, an attempt was made to establish correlations between specific vibration signal parameters and selected microgeometrical features of the end mills, such as cutting-edge radius, zero-clearance flank land, and clearance angle. The objective of this analysis was to identify the tool microgeometry characteristics most conducive to minimizing vibrations and improve the dynamic of the milling process of EN AW-7075 aluminum alloy.
4.1. The Role of Cutting Edge Radius
Subsequently, an analysis of the variation of vibration signal parameters as a function of the cutting-edge radius R was conducted. This analysis was performed for tools with a constant clearance angle of α=10°. Figure 6 presents the vibration signal parameters for both raw and filtered signals. For most of the parameters, non-monotonic trends with a minimum occurring near intermediate edge radius values in the range of 18–19 µm were observed.
For small R values, corresponding to a sharp cutting edge, elevated RMS and band energy (BE) values were recorded, which is consistent with a higher susceptibility of the system to regenerative vibrations (Figure 6a,b). As the edge radius increases, both indicators decrease slightly and reach a minimum at intermediate R values, indicating a favorable compromise between increased local contact stiffness and additional process damping effects at the tool–workpiece system. However, further increases in radius lead to a renewed rise in RMS and BE, which can be attributed to intensified ploughing and friction effects.
A similar, though more irregular, trend is observed for the peak-to-peak (PTP) parameter (Figure 6c). The filtered PTP value reaches its minimum within the same radius range where RMS and BE are lowest, confirming a reduction in extreme vibration excursions at intermediate R values. For the raw signal, PTP values remain relatively high within certain radius ranges due to the presence of low-frequency components not directly related to cutting mechanics, further emphasizing the relevance of band-limited analysis.
The evolution of kurtosis (KUR) further supports these observations (Figure 6d). Near the optimal R value, kurtosis reaches a distinct minimum for both raw and filtered signals, indicating a more stationary process with fewer impulsive events (e.g., transient chip load variations). At very small or very large radii, kurtosis increases, indicating the appearance of energy spikes associated with chatter (sharp edge) or with friction and plastic deformation induced effects (excessive edge radius). A similar behavior is observed for the total power spectral density (PSD), which corroborates the previous findings (Figure 6e). The convergence of all parameters (RMS, BE, PTP, KUR, PSD) clearly indicates the existence of an “optimal radius range” that promotes more consistent milling dynamics.
This behavior can be explained from a physical standpoint. A too-small cutting-edge radius results in significant stress concentration in the chip formation zone, leading to rapid changes in force direction and potentially initiating micro-vibrations. Conversely, an excessively large radius increases the contact area, which can cause deterioration of dynamic behaviordue to local loss of stiffness in the tool–workpiece system. In both cases, the dynamic components of the process are amplified. An intermediate radius value appears to balance these phenomena, ensuring an optimal stress distribution and a smoother tool– workpiece interaction without abrupt force fluctuations.
4.2. The Influence of Zero-Clearance Flank Width on Process Dynamics
The analysis of the influence of the zero-clearance flank land width (bf) on vibration signal parameters reveals a clear increasing trend for most dynamic indicators as bf increases (Figure 7). Both the RMS values (Figure 7a), band energy BE (Figure 7b), and peak-to-peak amplitude PTP (Figure 7c) exhibit a systematic rise across the entire investigated range of flank land widths, indicating that increasing bf leads to a deterioration of the dynamic conditions of the cutting process. Higher RMS and BE values reflect a greater amount of vibration energy generated within the cutting system, while the increasing PTP amplitude suggests enhanced process dynamic, larger dynamic displacements, which may promote the occurrence of chatter.
Similar behavior is observed for kurtosis KUR (Figure 7d), whose values increase with increasing bf, indicating a higher impulsiveness of the vibration signal and the occurrence of localized high-energy events characteristic of unstable cutting conditions. The total power spectral density PSD (Figure 7e) also shows a distinct upward trend, reflecting an increased susceptibility of the system to resonance excitation and the stimulation of natural frequencies of the machine–tool–workpiece system.
It is worth noting that the lowest values of most vibration parameters, particularly for the filtered signal, are observed at a flank land width bf of approximately 40 µm. In this range, minimum values of RMS (Figure 7a), BE (Figure 7b), and PTP (Figure 7c) are observed, indicating a more consistent process and improved dynamic behavior. Beyond this threshold, the dynamic parameters increase significantly, reflecting a deterioration in cutting conditions.
These results demonstrate that increasing the flank land width bf beyond approximately 40 µm does not improve the dynamic of the milling process; on the contrary, it leads to higher vibration energy, increased signal impulsiveness, and greater susceptibility of the cutting system to excitation. This can be explained by the fact that a larger flank land substantially increases the contact area between the cutting tool and the workpiece, promoting friction, ploughing, and localized stiffness reduction. As a result, the dynamic components of the process intensify, and the cutting conditions deteriorate. The findings clearly confirm that a smaller or moderate flank land width (approximately 40 µm) promotes more stable cutting behavior.
4.3. The Role of Clearance Angle
The analysis of the influence of the primary clearance angle (α) on the dynamics of the milling process indicates that, within the investigated range, its effect on vibration-related indicators is marginal at best (Figure 8a–e).
The trend lines for RMS (Figure 8a), band energy BE (Figure 8b), peak-to-peak amplitude PTP (Figure 8c), kurtosis KUR (Figure 8d), and total power spectral density PSD (Figure 8e) are weakly sloped, often non-monotonic, and lack distinct minima or maxima, while the values of both raw and filtered signals remain relatively constant across the entire range of α. The absence of systematic changes and the overlap of measured data points suggest a low sensitivity of the dynamic response to variations in α, especially when compared to the pronounced effects observed for cutting edge radius R and zero-clearance flank land width bf.
From a physical perspective, as long as a positive and moderate clearance angle is maintained, the dominant mechanisms responsible for vibration generation in thin-walled structures, such as regenerative effects, modal coupling, and tooth-passing excitation are primarily governed by contact stiffness and local edge geometry (R and bf). Variations in α within the studied range do not significantly alter the contact area or the effective damping behavior of the process. Consequently, under the tested microgeometry conditions, the primary clearance angle plays a secondary role in the process dynamics compared with cutting edge radius R and flank land width bf. Its main function is limited to ensuring proper clearance and preventing rubbing at the flank surface, rather than directly influencing the vibration characteristics of the milling process.
4.4. Analysis of Tool Ranking in Terms of Process Dynamics
The ranking analysis of the tested tools in terms of their dynamic allowed for a comprehensive evaluation of their performance under milling conditions. In order to assess the suitability of individual tool geometries for further investigation, the Vibration Severity Index (VSI) was calculated for all samples. This index was derived from the filtered root mean square value of vibration (RMSFiltered) and the kurtosis of the filtered signal (KURFiltered). For each sample, individual partial desirability functions (dRMS and dKUR) were determined and subsequently aggregated into a composite desirability index (VSI) according to the methodology described in the previous subsection.
The results of this analysis are presented in two complementary plots. The first one (Figure 8a) shows the distribution of all samples in the R–bf space, where the color of each point corresponds to the VSI value. Lighter shades indicating higher “dynamic quality” of the tool and the labels denote the tool numbers. This representation enabled a direct correlation between the multi-criteria evaluation results and the geometric parameters of the cutting edge. The second plot (Figure 8b) presents the ranking of all tools sorted in descending order of VSI, which allowed for straightforward identification of both the most and the least favorable tool configurations.
By incorporating the VSI as a comparative criterion, it was possible to simultaneously assess both the vibration intensity and the qualitative nature of the tool’s dynamic response. This dual-parameter approach provided deeper insight into the interaction between tool geometry and process dynamics than a simple amplitude-based evaluation.
The results clearly demonstrated that individual tool geometries exhibited distinct dynamic behaviors. Tools characterized by low vibration amplitudes but high impulsiveness showed indications of irregular process dynamics, despite relatively small overall vibration levels. Conversely, tools with smoother signal characteristics but higher amplitudes indicated more stable yet energetically intense cutting conditions.
A detailed analysis of the VSI map further revealed a clear relationship between tool geometry and the process dynamics. Cutters with small or moderate cutting edge radius R, combined with a low or medium width of the zero-clearance flank land bf, achieved the highest VSI values, indicating superior dynamic behavior. In contrast, large bf values were generally associated with reduced VSI scores, highlighting a deterioration in dynamic performance. An illustrative example is tool no. 7, for which an extremely high kurtosis (24.72) caused the partial desirability component dKUR to drop to zero, resulting in a total VSI of 0 despite otherwise favorable parameters. Similarly, tool no. 21 exhibited the highest RMS value (0.1589 g), which led to dRMS = 0 and consequently a VSI of 0.
An increase in the cutting edge radius and the width of the zero-clearance flank land has a significant influence on the dynamic of the milling process. A larger edge radius causes the tool to penetrate the workpiece material in a less aggressive manner, with the material removal process involving a greater degree of plastic deformation rather than pure shearing. As a result, the nature of the tool-workpiece interaction changes: the contact becomes more continuous and distributed rather than localized. This alteration increases the susceptibility of the system to the excitation of natural vibrations, since the cutting edge ceases to act as a sharply defined initiator of material removal and instead engages in a broader interaction with the surface, which promotes self-excited phenomena.
The presence of a wider zero-clearance flank land further increases the area of contact between the tool and the workpiece. The primary flank face no longer serves merely as a clearance surface but becomes an active element of the interaction. This leads to more intense mechanical coupling at the tool-workpiece interface, making the system more sensitive to microscopic vibrations and disturbances. Even minor geometrical deviations or material inhomogeneities can then generate oscillations that grow due to regenerative feedback mechanisms.
Moreover, both a larger cutting edge radius and a wider zero-clearance flank land affect the phase relationship between the tool motion and the system’s dynamic response. The tool tends to respond with a certain delay to variations in cutting conditions, which promotes the onset of regenerative chatter. As the cutting edge becomes less sharp, there is also an increased tendency for it to slide over the machined surface before chip formation occurs. Consequently, each subsequent pass of the cutting edge is influenced by the surface waviness left by previous tool engagements, amplifying the regenerative effect.
In consequence, the combined effect of an increased cutting edge radius and a wide zero-clearance flank land is a transformation of the tool–workpiece contact from a localized and impulsive interaction into a more continuous and distributed one. Such a modification of tool geometry facilitates the development of self-excited vibrations, reduces the system’s resistance to disturbances, and ultimately leads to a higher susceptibility of the milling process to chatter and deterioration of dynamic behavior.
Based on the overall ranking (Figure 8b), tool no. 4 was selected for further investigation. This tool was distinguished by a favorable balance between low vibration amplitude and limited signal impulsiveness, which in practice indicates stable and predictable behavior under machining conditions. The obtained result suggests that the geometry of tool no. 4 provides an optimal compromise between efficient cutting performance and the suppression of phenomena that could lead to an increase in the dynamics of the process, making it the most promising candidate for the next stage of the study.
4.5. The Influence of Cutting Parameters
The next stage of the study focused on determining the influence of technological parameters on the dynamics of the milling process. For this purpose, experiments were conducted using tool no. 4, which exhibited the lowest dynamics in previous tests. The experiments were carried out according to a full factorial 3 x 3 two-factor design. The variable parameters were feed per tooth, which was set to three levels (0.06 mm, 0.08 mm, and 0.10 mm), and radial depth of cut (0.4, 0.7, and 1.0 mm).
For the smallest radial depth of cut (ae = 0.4 mm), increasing the feed from 0.06 mm to 0.08 mm resulted in a slight reduction of RMS by approximately 6%, indicating a smoother vibration pattern associated with the transition from intermittent rubbing to more continuous cutting (Figure 9a). A further increase in feed to 0.10 mm, however, led to a significant reduction in RMS by more than 50% compared with the value at fz = 0.08 mm. Under intermediate cutting conditions (ae = 0.7 mm), increasing the feed from 0.06 mm to 0.08 mm caused a pronounced decrease in RMS of about 32%, after which the values remained nearly constant with further feed increase to 0.10 mm. This suggests that in this chip thickness range, an optimal balance is achieved at a medium feed, and additional increases in fz have little influence on vibration energy. At the highest radial depth of cut (ae = 1.0 mm), the initial feed increase lowered RMS by approximately 35%, but exceeding f = 0.08 mm/tooth resulted in a sudden, more than twofold increase in RMS, indicating that the process dynamics threshold had been surpassed (Figure 9a).
The behavior of band energy BE closely followed that of RMS (Figure 9b). For the smallest radial depth (ae = 0.4 mm), increasing the feed from 0.06 to 0.10 mm/tooth reduced BE by more than 50%, reflecting a transition from highly intermittent cutting to a more continuous process. At ae = 0.7 mm, changing the feed from 0.06 to 0.08 mm reduced BE by about 30%, and further feed increases did not significantly affect the vibration level. However, at ae = 1.0 mm, a feed of 0.08 mm/tooth reduced BE by about 35%, whereas at fz = 0.10 mm/tooth, a sudden more than twofold increase in BE was observed, again indicating that the dynamics limit of the process was exceeded.
The peak-to-peak vibration amplitude responded to changes in feed in a less predictable manner (Figure 9c). Under the lowest engagement conditions (ae = 0.4 mm), increasing the feed from 0.06 to 0.08 mm/tooth reduced the PTP by only about 2%, while a further increase to 0.10 mm/tooth resulted in a significant 63% reduction. Under intermediate engagement (ae = 0.7 mm), increasing the feed from 0.06 to 0.08 mm caused only a minimal decrease (~0.5%), while a higher feed of 0.10 mm increased the amplitude by about 13%, indicating localized overloading. In full-immersion conditions (ae = 1.0 mm), a moderate feed of 0.08 mm suppressed impulsive vibration spikes by more than 65%, but a further increase to 0.10 mm caused the amplitude to rise more than threefold, signaling that the process dynamics threshold had been exceeded.
For ae = 0.4 mm, kurtosis decreases by nearly 43% when the feed is increased from 0.08 to 0.10 mm/tooth, reaching its minimum level, while the previous change of fz from 0.06 to 0.08 mm has virtually no effect on the impulsiveness of the signal (Figure 9d). Under intermediate cutting conditions (ae = 0.7 mm), the lowest kurtosis occurs already at the smallest feed, and a further 33% increase in f almost triples the value of this parameter, after which it remains at a similar level. In contrast, at ae = 1.0 mm, increasing the feed from 0.06 to 0.08 mm/tooth reduces kurtosis by approximately 44%, while a further increase to 0.10 mm leads to a renewed rise of nearly 50%.
The analysis of the power spectral density (PSD) confirms that a feed of fz = 0.08 mm/tooth typically minimizes the resonance components of vibrations (Figure 9e). For ae = 0.4 mm, increasing the feed from 0.06 to 0.08 mm reduces PSD by almost 50%, and a further increase to 0.10 mm provides an additional ~35% attenuation. Similarly, for ae = 0.7 mm, a reduction of approximately 47% is observed initially, followed by an additional 13%. The behavior of the system is markedly different at ae = 1.0 mm: a moderate feed reduces PSD by more than 60%, but increasing it to 0.10 mm results in a sudden, more than fourfold increase in spectral power, indicating the excitation of resonances and the crossing of the process critical dynamics threshold. These results demonstrate that while a medium feed effectively suppresses vibration energy, excessive feed may lead to strong dynamic excitations.
The analysis of the influence of radial depth of cut (ae) on all five vibration signal parameters reveals consistent yet distinct trends (Figure 9). RMS almost always exhibits non-monotonic behavior: at the lowest feed rate, RMS initially increases by approximately 45% as ae increases from 0.4 to 0.7 mm, and then drops by more than 50% at ae = 1.0 mm. For fz = 0.08 mm/tooth, RMS remains stable at around 0.28 g up to ae = 0.7 mm, with full tool immersion reducing it by about 60% (Figure 9e). Finally, at fz = 0.10 mm/tooth, RMS gradually increases by nearly 200% across the entire ae range, indicating that the process dynamics is elevated.
The band energy BE exhibits a similar, though more pronounced, trend (Figure 9f). For fz = 0.06 mm, the energy rises by nearly 20% up to ae = 0.7 mm, followed by a dramatic drop of about 80% at ae = 1.0 mm. In the case of f = 0.08 mm, the optimal reduction exceeds 90% as ae increases to 1.0 mm, whereas at f = 0.10 mm, the energy doubles with increasing ae, indicating a buildup of dynamic loads.
The peak-to-peak amplitude behaves somewhat differently: regardless of feed rate, its minimum values consistently occur at ae = 1.0 mm, with reductions of up to 65% compared to ae = 0.4 mm (Figure 9g). However, at fz = 0.10 mm/tooth, the average impulse amplitude may increase again by about 15% between ae = 0.7 and 1.0 mm, demonstrating that while vibration impulsiveness is most effectively damped at optimal tool engagement, it remains susceptible to overload effects.
Kurtosis decreases dramatically with increasing ae up to 1.0 mm, particularly at a feed fz of 0.08 mm/tooth, where the reduction reaches 60%, and even at fz = 0.06 mm, the decrease exceeds 50% (Figure 9h). At fz = 0.10 mm/tooth, kurtosis increases by approximately 70% up to ae = 0.7 mm and then decreases, indicating that signal smoothing occurs only at full tool immersion.
The PSD also exhibits a clear minimum at ae = 1.0 mm for all feed rates: the reduction ranges from 50% (fz = 0.06 mm) to 65% (f = 0.08 mm), with a dramatic more than fourfold change observed at fz = 0.10 mm (Figure 9i). This indicates that increasing the radial depth of cut effectively suppresses resonance components, unless the feed is too high in which case the effect reverses abruptly.
In summary, although radial depth of cut affects each parameter in a nonlinear manner and is strongly dependent on feed rate, ae = 1.0 mm combined with a medium feed (0.08 mm/tooth) provides the most favorable combination in practice: the lowest RMS, minimal band energy, the greatest impulse suppression, the lowest impulsiveness, and minimal resonance components.
5. Conclusions
The conducted research has demonstrated that the cutting-edge microgeometry of the end mill has a crucial influence on the dynamics of the milling process of thin-walled EN AW-7075 aluminum components. Both the cutting edge radius and the width of the zero-clearance flank land significantly determine the level of vibration generated and the dynamics of the machine–tool–workpiece system. The key findings of this study can be summarized as follows:
- The relationship between vibration parameters and the cutting edge radius R is non-monotonic. The lowest values of RMS, band energy, kurtosis, and PSD were obtained for a radius of approximately 18–19 µm. An excessively small radius leads to stress concentration and the initiation of microvibrations, while an excessively large radius increases the contact area and intensifies friction and material ploughing effects.
- The width of the zero-clearance flank land bf significantly affects process dynamics — with its increase, a distinct rise in vibration energy and signal impulsiveness is observed. The most favorable conditions were obtained at a width of approximately 40 µm, beyond which the dynamic characteristics of the process deteriorate.
- The primary clearance angle within the investigated range does not exert a significant influence on vibration levels or process dynamics. Its role is limited to ensuring proper contact between the tool and the workpiece and preventing rubbing on the flank surface.
- Technological parameters shape the dynamics of the process in a nonlinear manner. A moderate feed rate (fz = 0.08 mm/tooth) most often leads to reduced vibration amplitude and effective suppression of resonance components. However, excessively high feed rates result in a rapid increase in vibration energy and exceedance of the process dynamics.
- The radial depth of cut (ae) affects all analyzed indicators in a strongly feed-dependent manner. The most stable cutting conditions were achieved for ae = 1.0 mm combined with a moderate feed, resulting in minimal RMS, BE, PTP, kurtosis, and PSD values.
The results clearly indicate that deliberate shaping of cutting-edge microgeometry — particularly the cutting edge radius and zero-clearance flank land width — combined with the optimal selection of technological parameters represents an effective strategy for improving process dynamics and machining quality of thin-walled components.
Author Contributions
All the authors contributed to the study conception and design. Material preparation and data collection were performed by [Łukasz Żyłka and Rafał Flejszar], research planning, development of experimental procedures were performed by [Łukasz Żyłka], analysis was performed by [Łukasz Żyłka, and Rafał Flejszar] and discussion of the results was done by [Łukasz Żyłka and Luis Norberto López de Lacalle]. The first draft of the manuscript was written by [Rafał Flejszar], and all the authors commented on previous versions of the manuscript. All the authors have read and approved the final manuscript.
Funding
This work was supported by PODKARPACKIE CENTRUM INNOWACJI, grant number 55/PRZ/1/DG/PCI/2021, grant title: Innovative mill cutter for high-speed HSC machining of aircraft aluminum structures, realized under the Regional Operational Programme for the Podkarpackie Region for the years 2014–2020 financed by the European Union from the European Regional Development Fund.
Institutional Review Board Statement
Not applicable.
Informed Consent Statement
Not applicable.
Data Availability Statement
The data presented in this study are available on request from the corresponding author.
Acknowledgments
During the preparation of this manuscript, the authors used ChatGPT (OpenAI, version GPT-5, accessed October 2025) and Writefull Version 2025.45.0 for the purposes of improving language clarity and consistency. The authors have reviewed and edited the output and take full responsibility for the content of this publication.
Conflicts of Interest
The authors have no competing interests to declare that are relevant to the content of this article. The authors have no relevant financial or non-financial interests to disclose.
Abbreviations
The following abbreviations are used in this manuscript:
| RMS | Root Mean Square |
| BE | Band Energy |
| PTP | Peak-to-Peak (Amplitude) |
| KUR | Kurtosis |
| PSD | Power Spectral Density |
| VSI | Vibration Severity Index |
| FFT | Fast Fourier Transform |
| FEM | Finite Element Method |
| TCM | Tool Condition Monitoring |
| HHT-EA | Hilbert–Huang Transform with Empirical Approach |
| TMD | Tuned Mass Damper |
| LTMDI | Lathe/Toolholder Tuned Mass Damper Insert |
| R | Cutting-Edge Radius |
| bf | Zero-Clearance Flank Land Width |
| α | Primary Clearance Angle |
| fz | Feed per Tooth |
| ae | Radial Depth of Cut |
| ap | Axial Depth of Cut |
| wt | Wall Thickness |
| n | Spindle Speed |
References
- Lin, M.; Wang, C.; Yue, T.; Guo, G.; Guan, W.; Shen, B. Deformation Prediction in Flank Milling of Thin-Walled Parts Based on Cutter-Workpiece Engagement. Journal of Manufacturing Processes 2024, 115, 375–386. [Google Scholar] [CrossRef]
- Buk, J.; Sułkowicz, P.; Szeliga, D. The Review of Current and Proposed Methods of Manufacturing Fir Tree Slots of Turbine Aero Engine Discs. Materials 2023, 16, 5143. [Google Scholar] [CrossRef] [PubMed]
- Ma, L.; Ba, S.; Zhang, Y.; Liu, H.; Li, L.; Gao, F.; Zhang, F.; Ma, J. Prediction of Milling Deformation for Frame-Type Thin-Walled Parts Considering Workblank Initial Residual Stress and Milling Force. JMMP 2025, 9, 146. [Google Scholar] [CrossRef]
- Tehranizadeh, F.; Berenji, K.R.; Yıldız, S.; Budak, E. Chatter Stability of Thin-Walled Part Machining Using Special End Mills. CIRP Annals 2022, 71, 365–368. [Google Scholar] [CrossRef]
- Stepan, G.; Hajdu, D.; Iglesias, A.; Takacs, D.; Dombovari, Z. Ultimate Capability of Variable Pitch Milling Cutters. CIRP Annals 2018, 67, 373–376. [Google Scholar] [CrossRef]
- Li, Z.; Song, Q.; Jin, P.; Liu, Z.; Wang, B.; Ma, H. Chatter Suppression Techniques in Milling Processes: A State of the Art Review. Chinese Journal of Aeronautics 2024, 37, 1–23. [Google Scholar] [CrossRef]
- Ma, W.; Yang, Y.; Yu, J.; Yang, G. Improving Processing Stability of Thin-Walled Casing Workpieces by Sucker-Mounted TMD: Optimization, Design, and Implementation. Mechanical Systems and Signal Processing 2024, 216, 111512. [Google Scholar] [CrossRef]
- Li, Z.; Ma, R.; Xu, K.; Han, Q. Closed-Form Solutions for the Optimal Design of Lever-Arm Tuned Mass Damper Inerter (LTMDI). Mechanical Systems and Signal Processing 2024, 206, 110889. [Google Scholar] [CrossRef]
- Yang, Y.; Yang, Y.; Liu, H.-C.; Wan, M.; Zhang, W.-H. A New Cutting Tool Filled with Metallic Lattice and Design Method for Vibration Suppression in Milling. Mechanical Systems and Signal Processing 2024, 212, 111310. [Google Scholar] [CrossRef]
- Dang, X.; Wan, M.; Yang, Y. Prediction and Suppression of Chatter in Milling of Structures with Low-Rigidity: A Review. Journal of Advanced Manufacturing Science and Technology 2021, 1, 2021010–2021010. [Google Scholar] [CrossRef]
- Fu, Y.; Zhang, Y.; Zhou, H.; Li, D.; Liu, H.; Qiao, H.; Wang, X. Timely Online Chatter Detection in End Milling Process. Mechanical Systems and Signal Processing 2016, 75, 668–688. [Google Scholar] [CrossRef]
- Peng, C.-Y.; Raihany, U.; Kuo, S.-W.; Chen, Y.-Z. Sound Detection Monitoring Tool in CNC Milling Sounds by K-Means Clustering Algorithm. Sensors 2021, 21, 4288. [Google Scholar] [CrossRef]
- Nagaraj, S.; Diaz-Elsayed, N. Tool Condition Monitoring in the Milling of Low- to High-Yield-Strength Materials. Machines 2025, 13, 276. [Google Scholar] [CrossRef]
- Navarro-Devia, J.H.; Chen, Y.; Dao, D.V.; Li, H. Chatter Detection in Milling Processes—a Review on Signal Processing and Condition Classification. Int J Adv Manuf Technol 2023, 125, 3943–3980. [Google Scholar] [CrossRef]
- Korpysa, J.; Zawada-Michałowska, M.; Pieśko, P.; Habrat, W.; Lisowicz, J. Machinability Assessment of Aluminium Alloy EN AW-7075 T651 Under Varying Machining Conditions. Acta Mechanica et Automatica 2025, 19, 300–308. [Google Scholar] [CrossRef]
- Denkena, B.; Biermann, D. Cutting Edge Geometries. CIRP Annals 2014, 63, 631–653. [Google Scholar] [CrossRef]
- Li, B.; Zhang, S.; Du, J.; Sun, Y. State-of-the-Art in Cutting Performance and Surface Integrity Considering Tool Edge Micro-Geometry in Metal Cutting Process. Journal of Manufacturing Processes 2022, 77, 380–411. [Google Scholar] [CrossRef]
- Zhuang, K.; Fu, C.; Weng, J.; Hu, C. Cutting Edge Microgeometries in Metal Cutting: A Review. Int J Adv Manuf Technol 2021, 116, 2045–2092. [Google Scholar] [CrossRef]
- Fulemova, J.; Janda, Z. Influence of the Cutting Edge Radius and the Cutting Edge Preparation on Tool Life and Cutting Forces at Inserts with Wiper Geometry. Procedia Engineering 2014, 69, 565–573. [Google Scholar] [CrossRef]
- Lv, D.; Wang, Y.; Yu, X. Effects of Cutting Edge Radius on Cutting Force, Tool Wear, and Life in Milling of SUS-316L Steel. Int J Adv Manuf Technol 2020, 111, 2833–2844. [Google Scholar] [CrossRef]
- Hronek, O.; Zetek, M. The Influences of Cutting Edge Radius on Surface Roughness When Milling Nickel Alloy. In DAAAM Proceedings; Katalinic, B., Ed.; DAAAM International Vienna, 2017; Vol. 1, pp. 1037–1043 ISBN 978-3-902734-11-2.
- Zhao, T.; Agmell, M.; Persson, J.; Bushlya, V.; Ståhl, J.E.; Zhou, J.M. Correlation between Edge Radius of the cBN Cutting Tool and Surface Quality in Hard Turning. J. Superhard Mater. 2017, 39, 251–258. [Google Scholar] [CrossRef]
- M, P.; N, S.P. Effect of Cutting Edge Form Factor (K-Factor) on the Performance of a Face Milling Tool. CIRP Journal of Manufacturing Science and Technology 2020, 31, 305–313. [Google Scholar] [CrossRef]
- Muthuswamy, P.; Nagarajan, S.K. Experimental Investigation on the Effect of Different Micro-Geometries on Cutting Edge and Wiper Edge on Surface Roughness and Forces in Face Milling. Lubricants 2021, 9, 102. [Google Scholar] [CrossRef]
- Muthuswamy, P. Influence of Micro-Geometry of Wiper Facet on the Performance of a Milling Insert: An Experimental Investigation and Validation Using Numerical Simulation. Sādhanā 2022, 47, 140. [Google Scholar] [CrossRef]
- Grabowski, R.; Denkena, B.; Köhler, J. Prediction of Process Forces and Stability of End Mills with Complex Geometries. Procedia CIRP 2014, 14, 119–124. [Google Scholar] [CrossRef]
- Burek, J.; Zylka, L.; Plodzien, M.; Gdula, M.; Sulkowicz, P. The Influence of the Cutting Edge Shape on High Performance Cutting. AEAT 2018, 90, 134–145. [Google Scholar] [CrossRef]
- Burek, J.; Plodzien, M.; Zylka, L.; Sulkowicz, P. High-Performance End Milling of Aluminum Alloy: Influence of Different Serrated Cutting Edge Tool Shapes on the Cutting Force. Adv produc engineer manag 2019, 14, 494–506. [Google Scholar] [CrossRef]
- Li, A.; Zhao, J.; Pei, Z.; Zhu, N. Simulation-Based Solid Carbide End Mill Design and Geometry Optimization. Int J Adv Manuf Technol 2014, 71, 1889–1900. [Google Scholar] [CrossRef]
- Pérez-Ruiz, J.; González-Barrio, H.; Sanz-Calle, M.; Gómez-Escudero, G.; Munoa, J.; De Lacalle, L.L. Machining Stability Improvement in LPBF Printed Components through Stiffening by Crystallographic Texture Control. CIRP Annals 2023, 72, 141–144. [Google Scholar] [CrossRef]
- Bravo, U.; Altuzarra, O.; López De Lacalle, L.N.; Sánchez, J.A.; Campa, F.J. Stability Limits of Milling Considering the Flexibility of the Workpiece and the Machine. International Journal of Machine Tools and Manufacture 2005, 45, 1669–1680. [Google Scholar] [CrossRef]
- Żyłka, Ł.; Flejszar, R.; Lajmert, P. Influence of Cutting-Edge Microgeometry on Cutting Forces in High-Speed Milling of 7075 Aluminum Alloy. Materials 2023, 16, 3859. [Google Scholar] [CrossRef]
- Żyłka, Ł.; Flejszar, R.; Krupa, K.; Lajmert, P. Redefinition of Precision in Finishing Milling: Exploring the Influence of Tool Margin and Edge Micro-Radius on Surface Roughness. Manufacturing Letters 2024, 41, 52–58. [Google Scholar] [CrossRef]
- Ghosh, N.; Ravi, Y.B.; Patra, A.; Mukhopadhyay, S.; Paul, S.; Mohanty, A.R.; Chattopadhyay, A.B. Estimation of Tool Wear during CNC Milling Using Neural Network-Based Sensor Fusion. Mechanical Systems and Signal Processing 2007, 21, 466–479. [Google Scholar] [CrossRef]
- Li, H.; Hu, Y.; Wang, S. Signal Detection Based on Power-Spectrum Sub-Band Energy Ratio. Electronics 2020, 10, 64. [Google Scholar] [CrossRef]
- Fedorova, D.; Tlach, V.; Kuric, I.; Dodok, T.; Zajačko, I.; Tucki, K. Technical Diagnostics of Industrial Robots Using Vibration Signals: Case Study on Detecting Base Unfastening. Applied Sciences 2024, 15, 270. [Google Scholar] [CrossRef]
- Ji, X.; An, R.; Jiang, H.; Du, Y.; Zheng, W. Research on Fault Recognition of Roadheader Based on Multi-Sensor and Multi-Layer Local Projection. Applied Sciences 2025, 15, 2663. [Google Scholar] [CrossRef]
- Sánchez, R.-V.; Macancela, J.C.; Ortega, L.-R.; Cabrera, D.; García Márquez, F.P.; Cerrada, M. Evaluation of Hand-Crafted Feature Extraction for Fault Diagnosis in Rotating Machinery: A Survey. Sensors 2024, 24, 5400. [Google Scholar] [CrossRef] [PubMed]
- Sawalhi, N.; Randall, R.B. The Application of Spectral Kurtosis to Bearing Diagnostics. 2004.
- Pirrotta, C.; Gueli, A.M.; Imposa, S.; Salerno, G.A.; Trigona, C. Vibration Analysis at Castello Ursino Picture Gallery (Sicily, Italy) for the Implementation of Self-Generating AlN-MEMS Sensors. Sensors 2024, 24, 5617. [Google Scholar] [CrossRef]
- Costa, N.R.; Lourenço, J.; Pereira, Z.L. Desirability Function Approach: A Review and Performance Evaluation in Adverse Conditions. Chemometrics and Intelligent Laboratory Systems 2011, 107, 234–244. [Google Scholar] [CrossRef]
- Vera Candioti, L.; De Zan, M.M.; Cámara, M.S.; Goicoechea, H.C. Experimental Design and Multiple Response Optimization. Using the Desirability Function in Analytical Methods Development. Talanta 2014, 124, 123–138. [Google Scholar] [CrossRef] [PubMed]
Figure 1.
The View of the milling cutter with microgeometry designations: R – cutting edge radius; bf – zero-clearance flank width; α – primary clearance angle.
Figure 1.
The View of the milling cutter with microgeometry designations: R – cutting edge radius; bf – zero-clearance flank width; α – primary clearance angle.
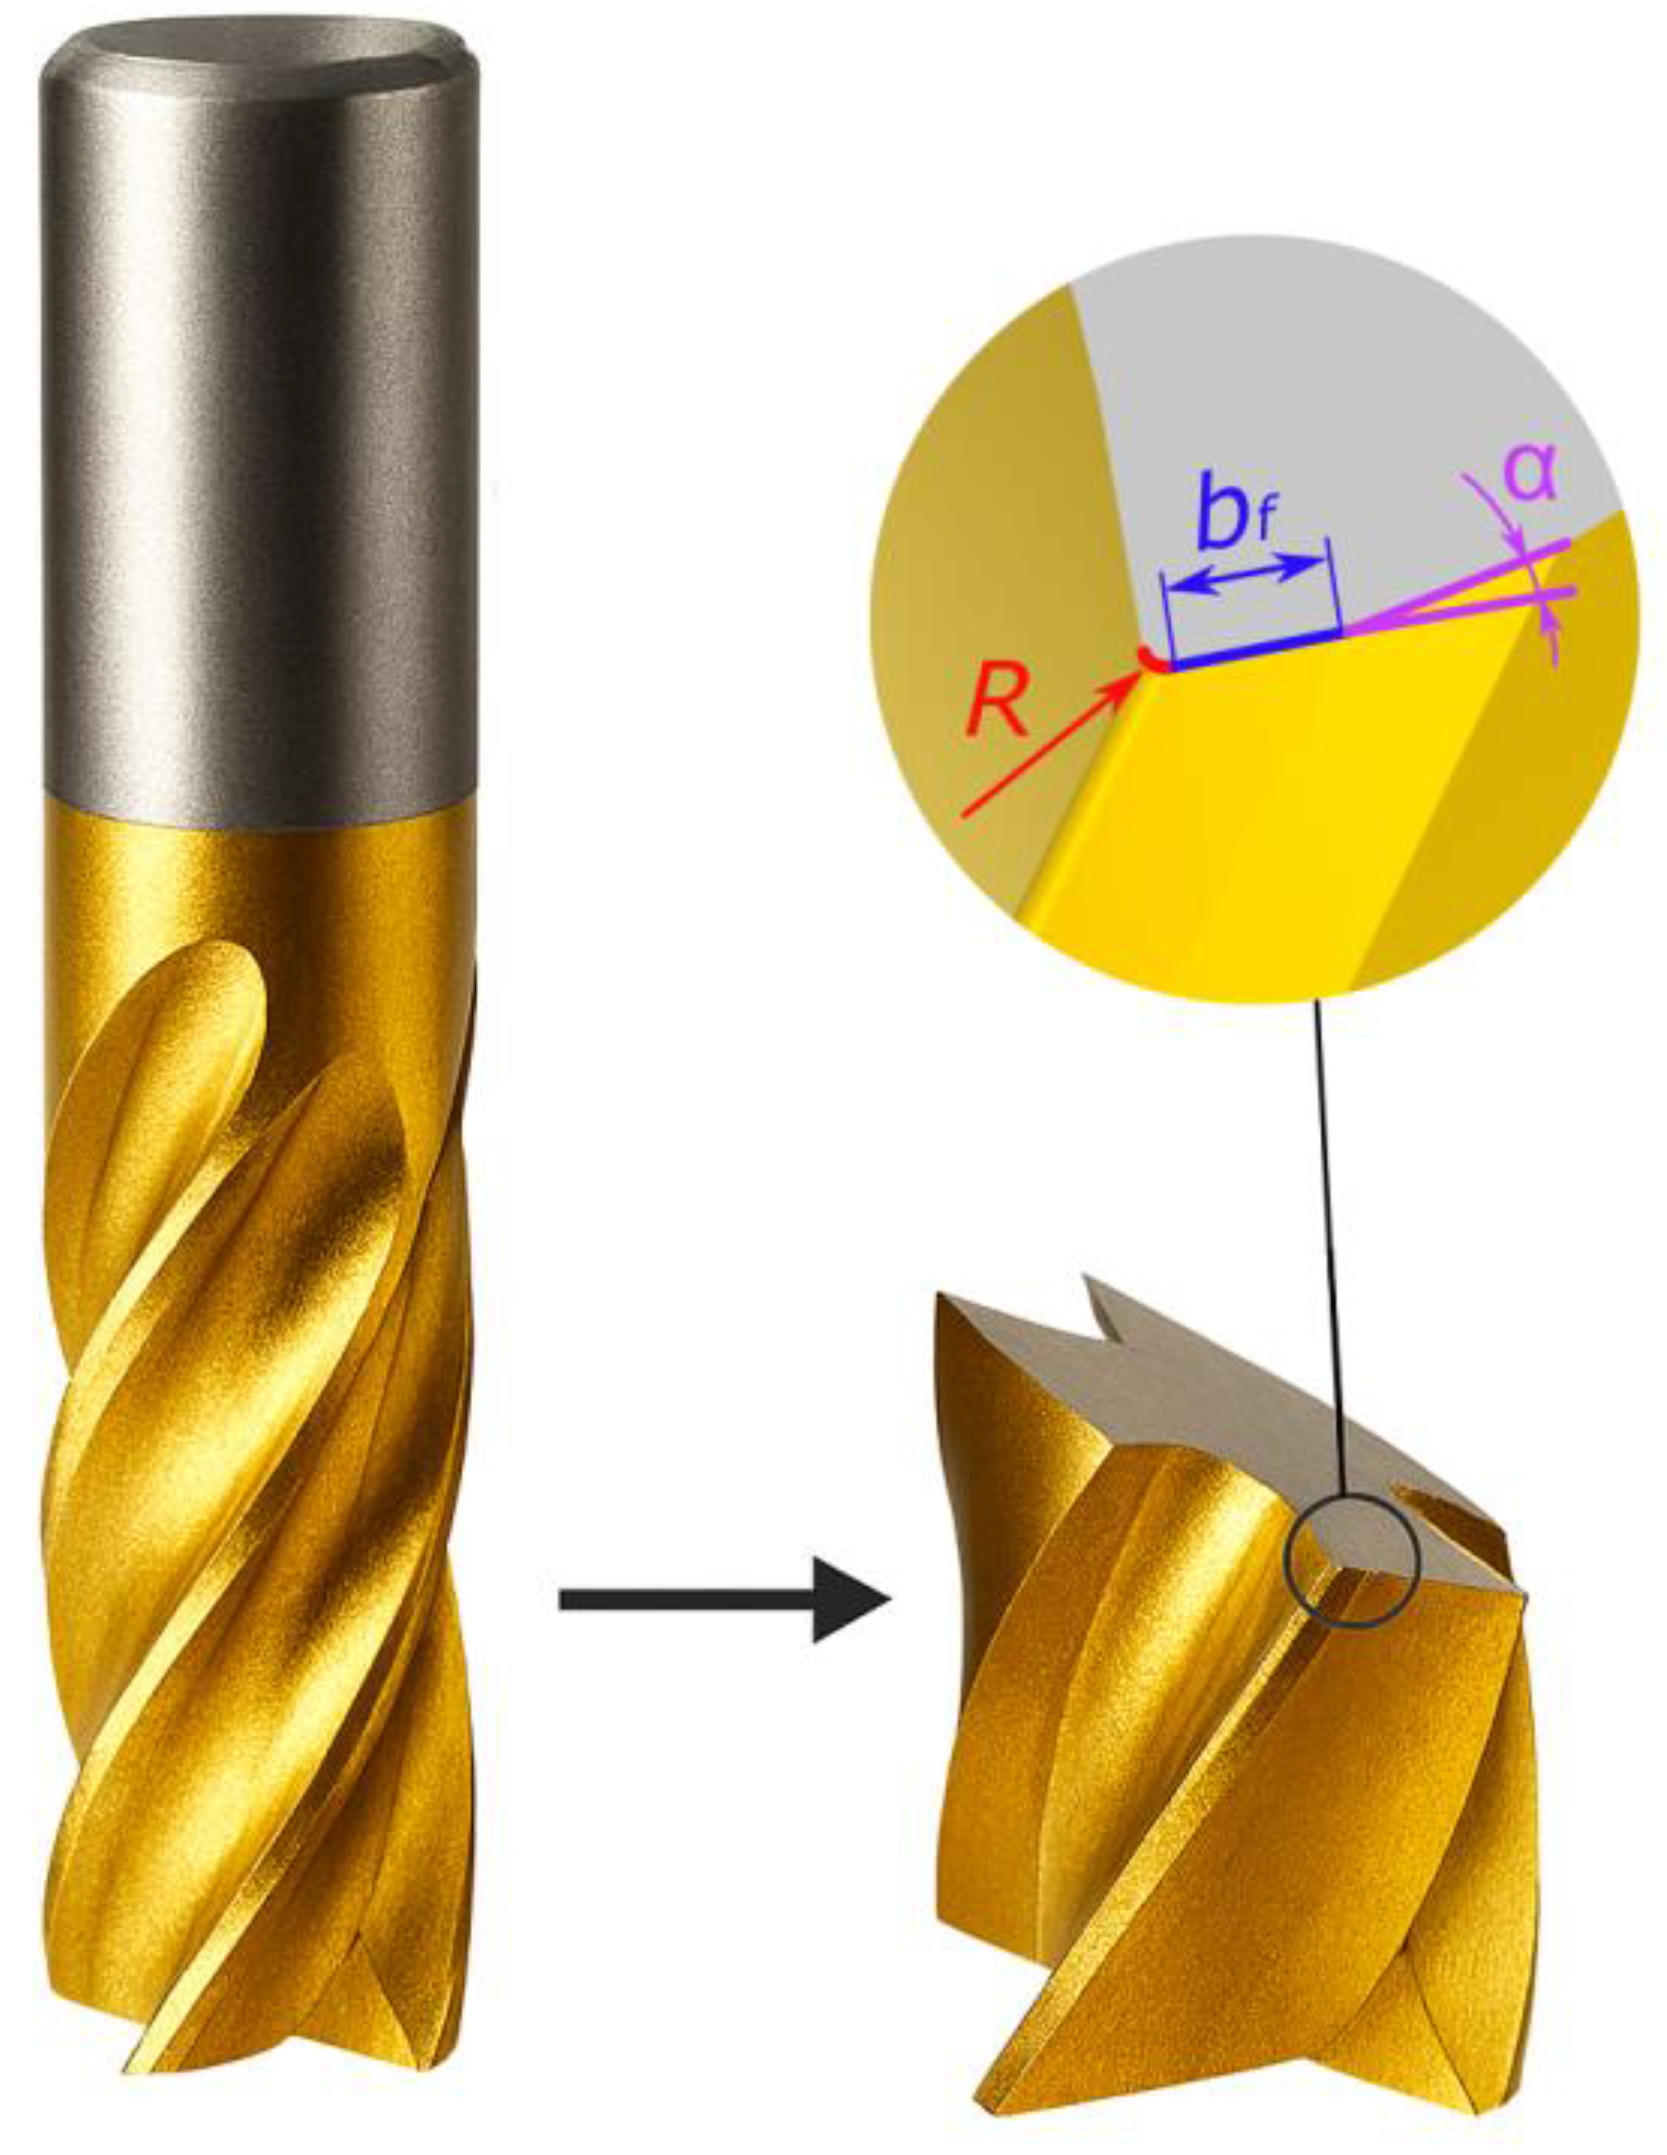
Figure 2.
Schematic of the measurement setup: 1 – Milling cutter; 2 – Thin-walled workpiece specimen; 3 – Machine vise; 4 – Plate bonded with cyanoacrylate adhesive; 5 – Vibration sensor; 6 –Data acquisition card; 7 – Computer with dedicated software.
Figure 2.
Schematic of the measurement setup: 1 – Milling cutter; 2 – Thin-walled workpiece specimen; 3 – Machine vise; 4 – Plate bonded with cyanoacrylate adhesive; 5 – Vibration sensor; 6 –Data acquisition card; 7 – Computer with dedicated software.
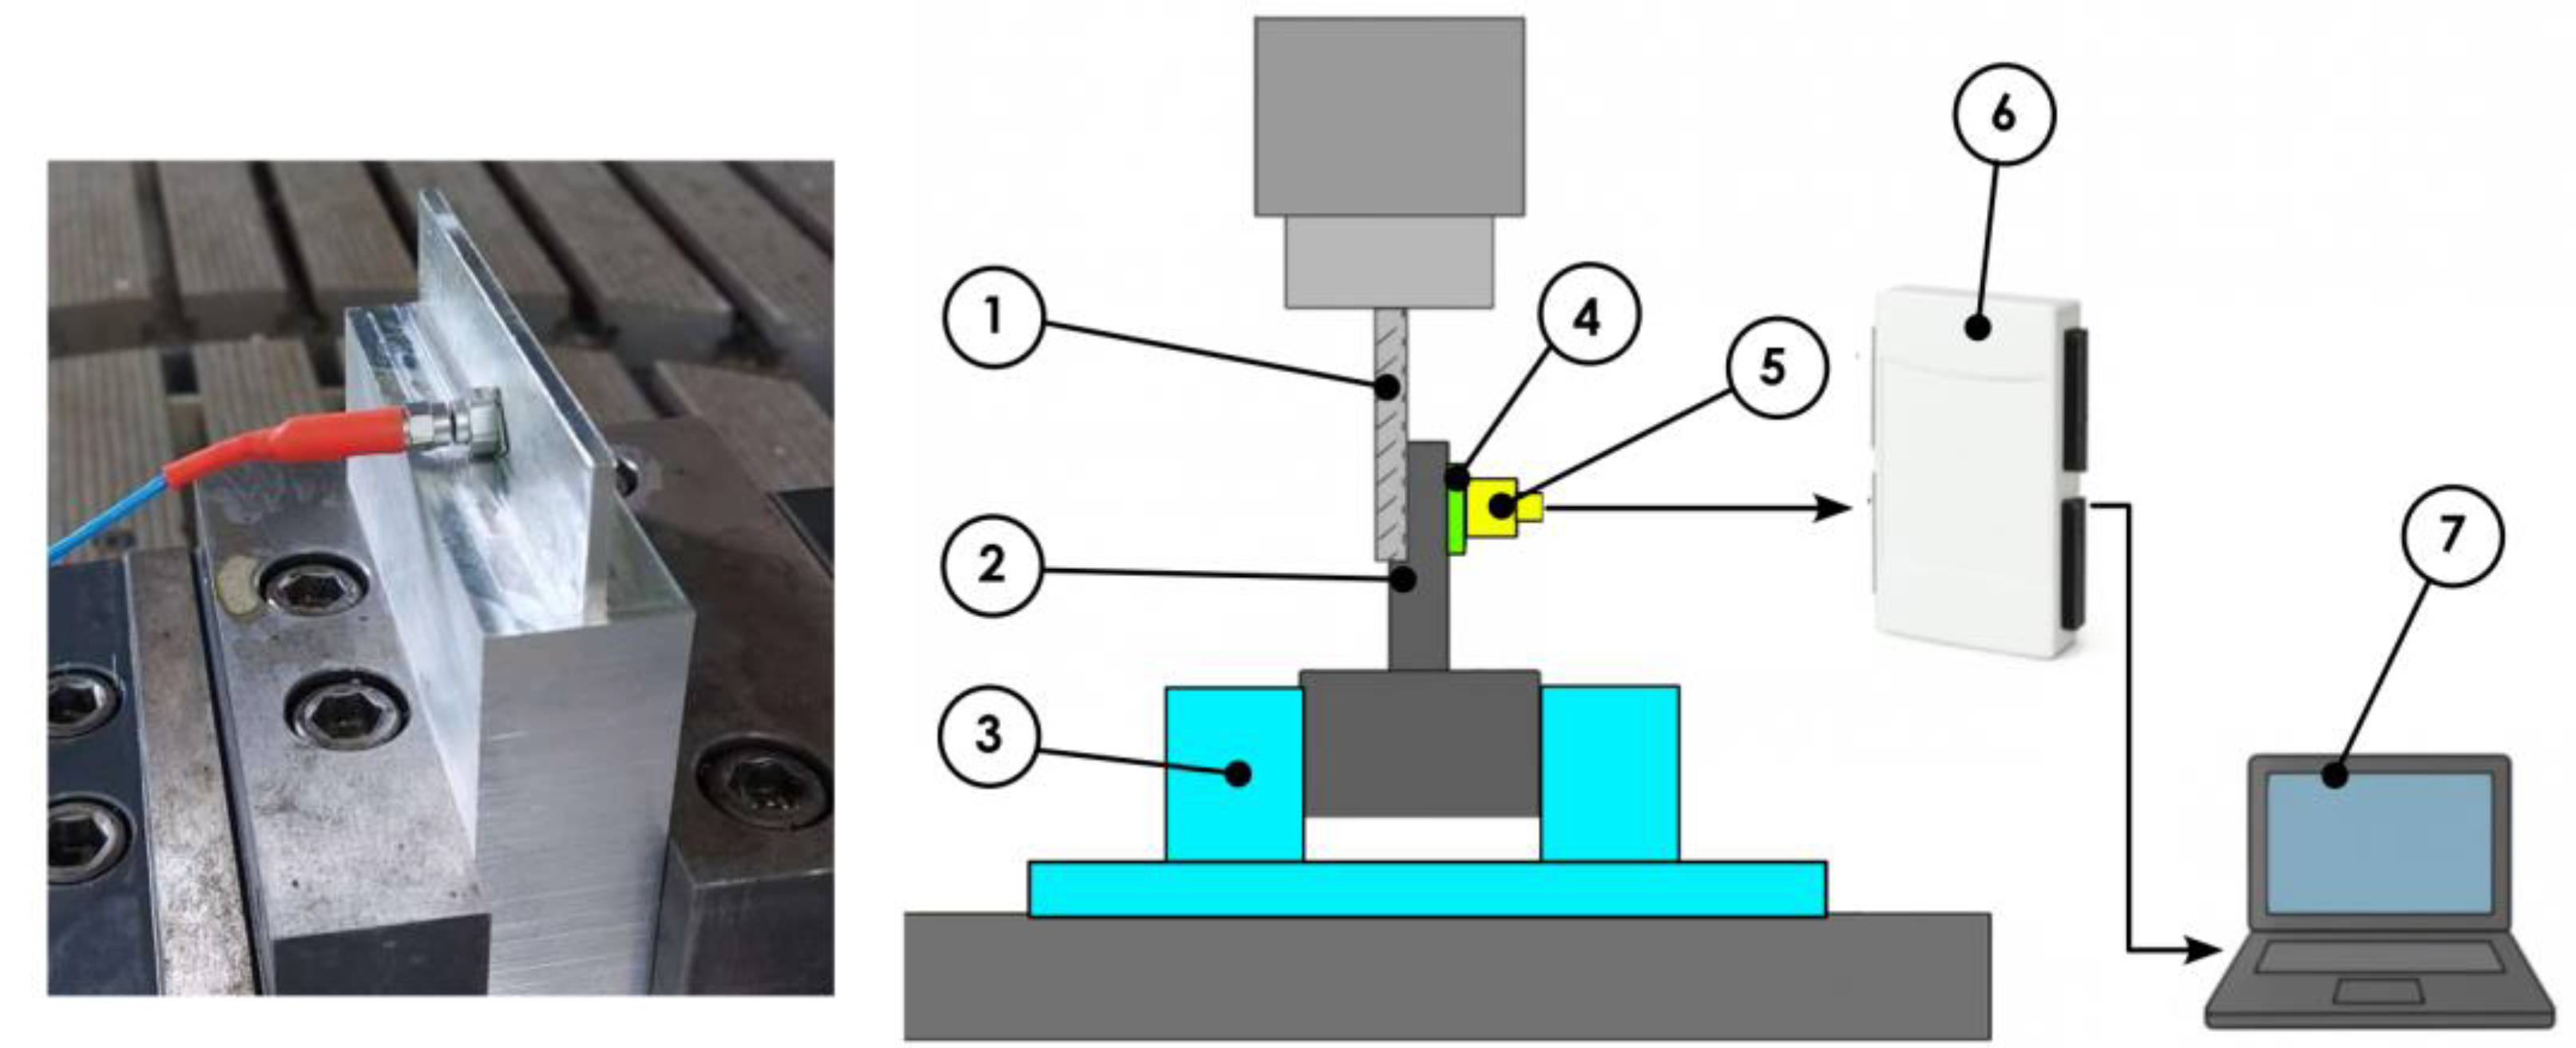
Figure 3.
Technological and geometrical parameters adopted during the machining process: n – spindle speed (rpm); wₜ – wall thickness (mm); aₚ – axial depth of cut (mm), approximately equal to the wall height; aₑ – radial depth of cut (mm).
Figure 3.
Technological and geometrical parameters adopted during the machining process: n – spindle speed (rpm); wₜ – wall thickness (mm); aₚ – axial depth of cut (mm), approximately equal to the wall height; aₑ – radial depth of cut (mm).
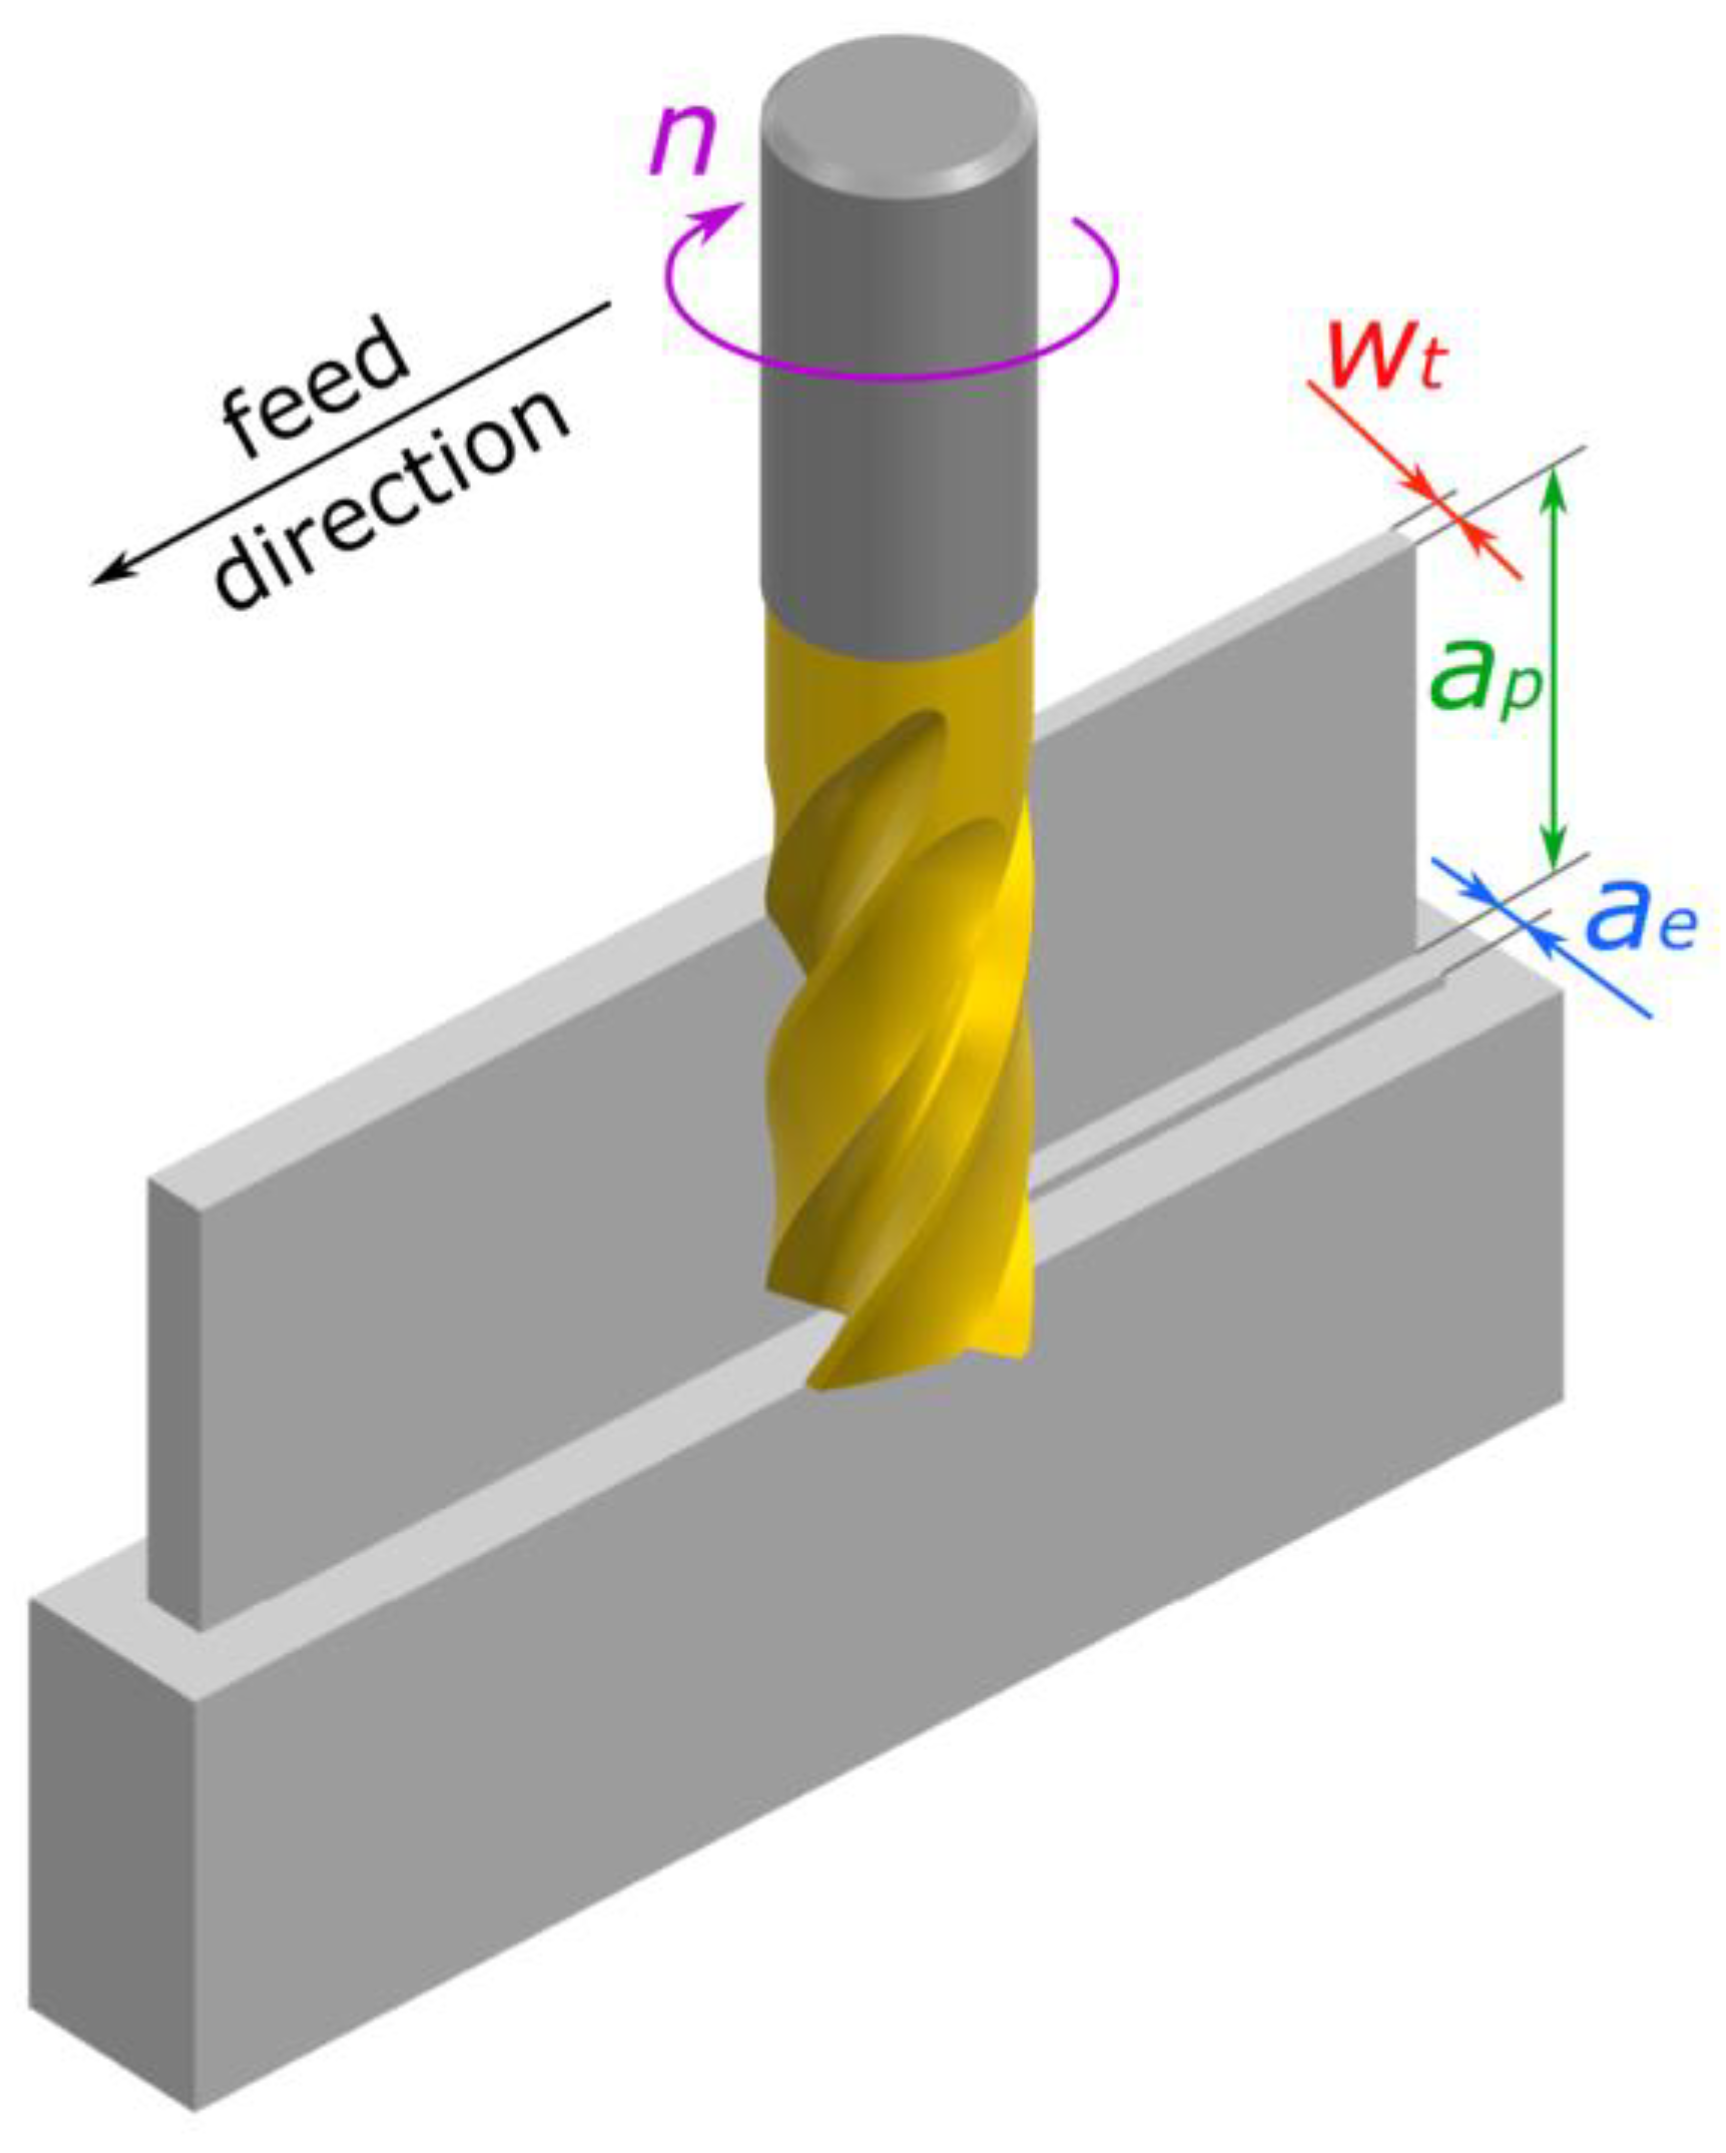
Figure 4.
Example of plots generated for each specimen: (a) time-domain waveform of the unfiltered signal; (b) time-domain waveform of the filtered signal; (c) power spectral density (PSD) illustrating the frequency content of the signal; (d) extracted dominant frequencies with corresponding power values.
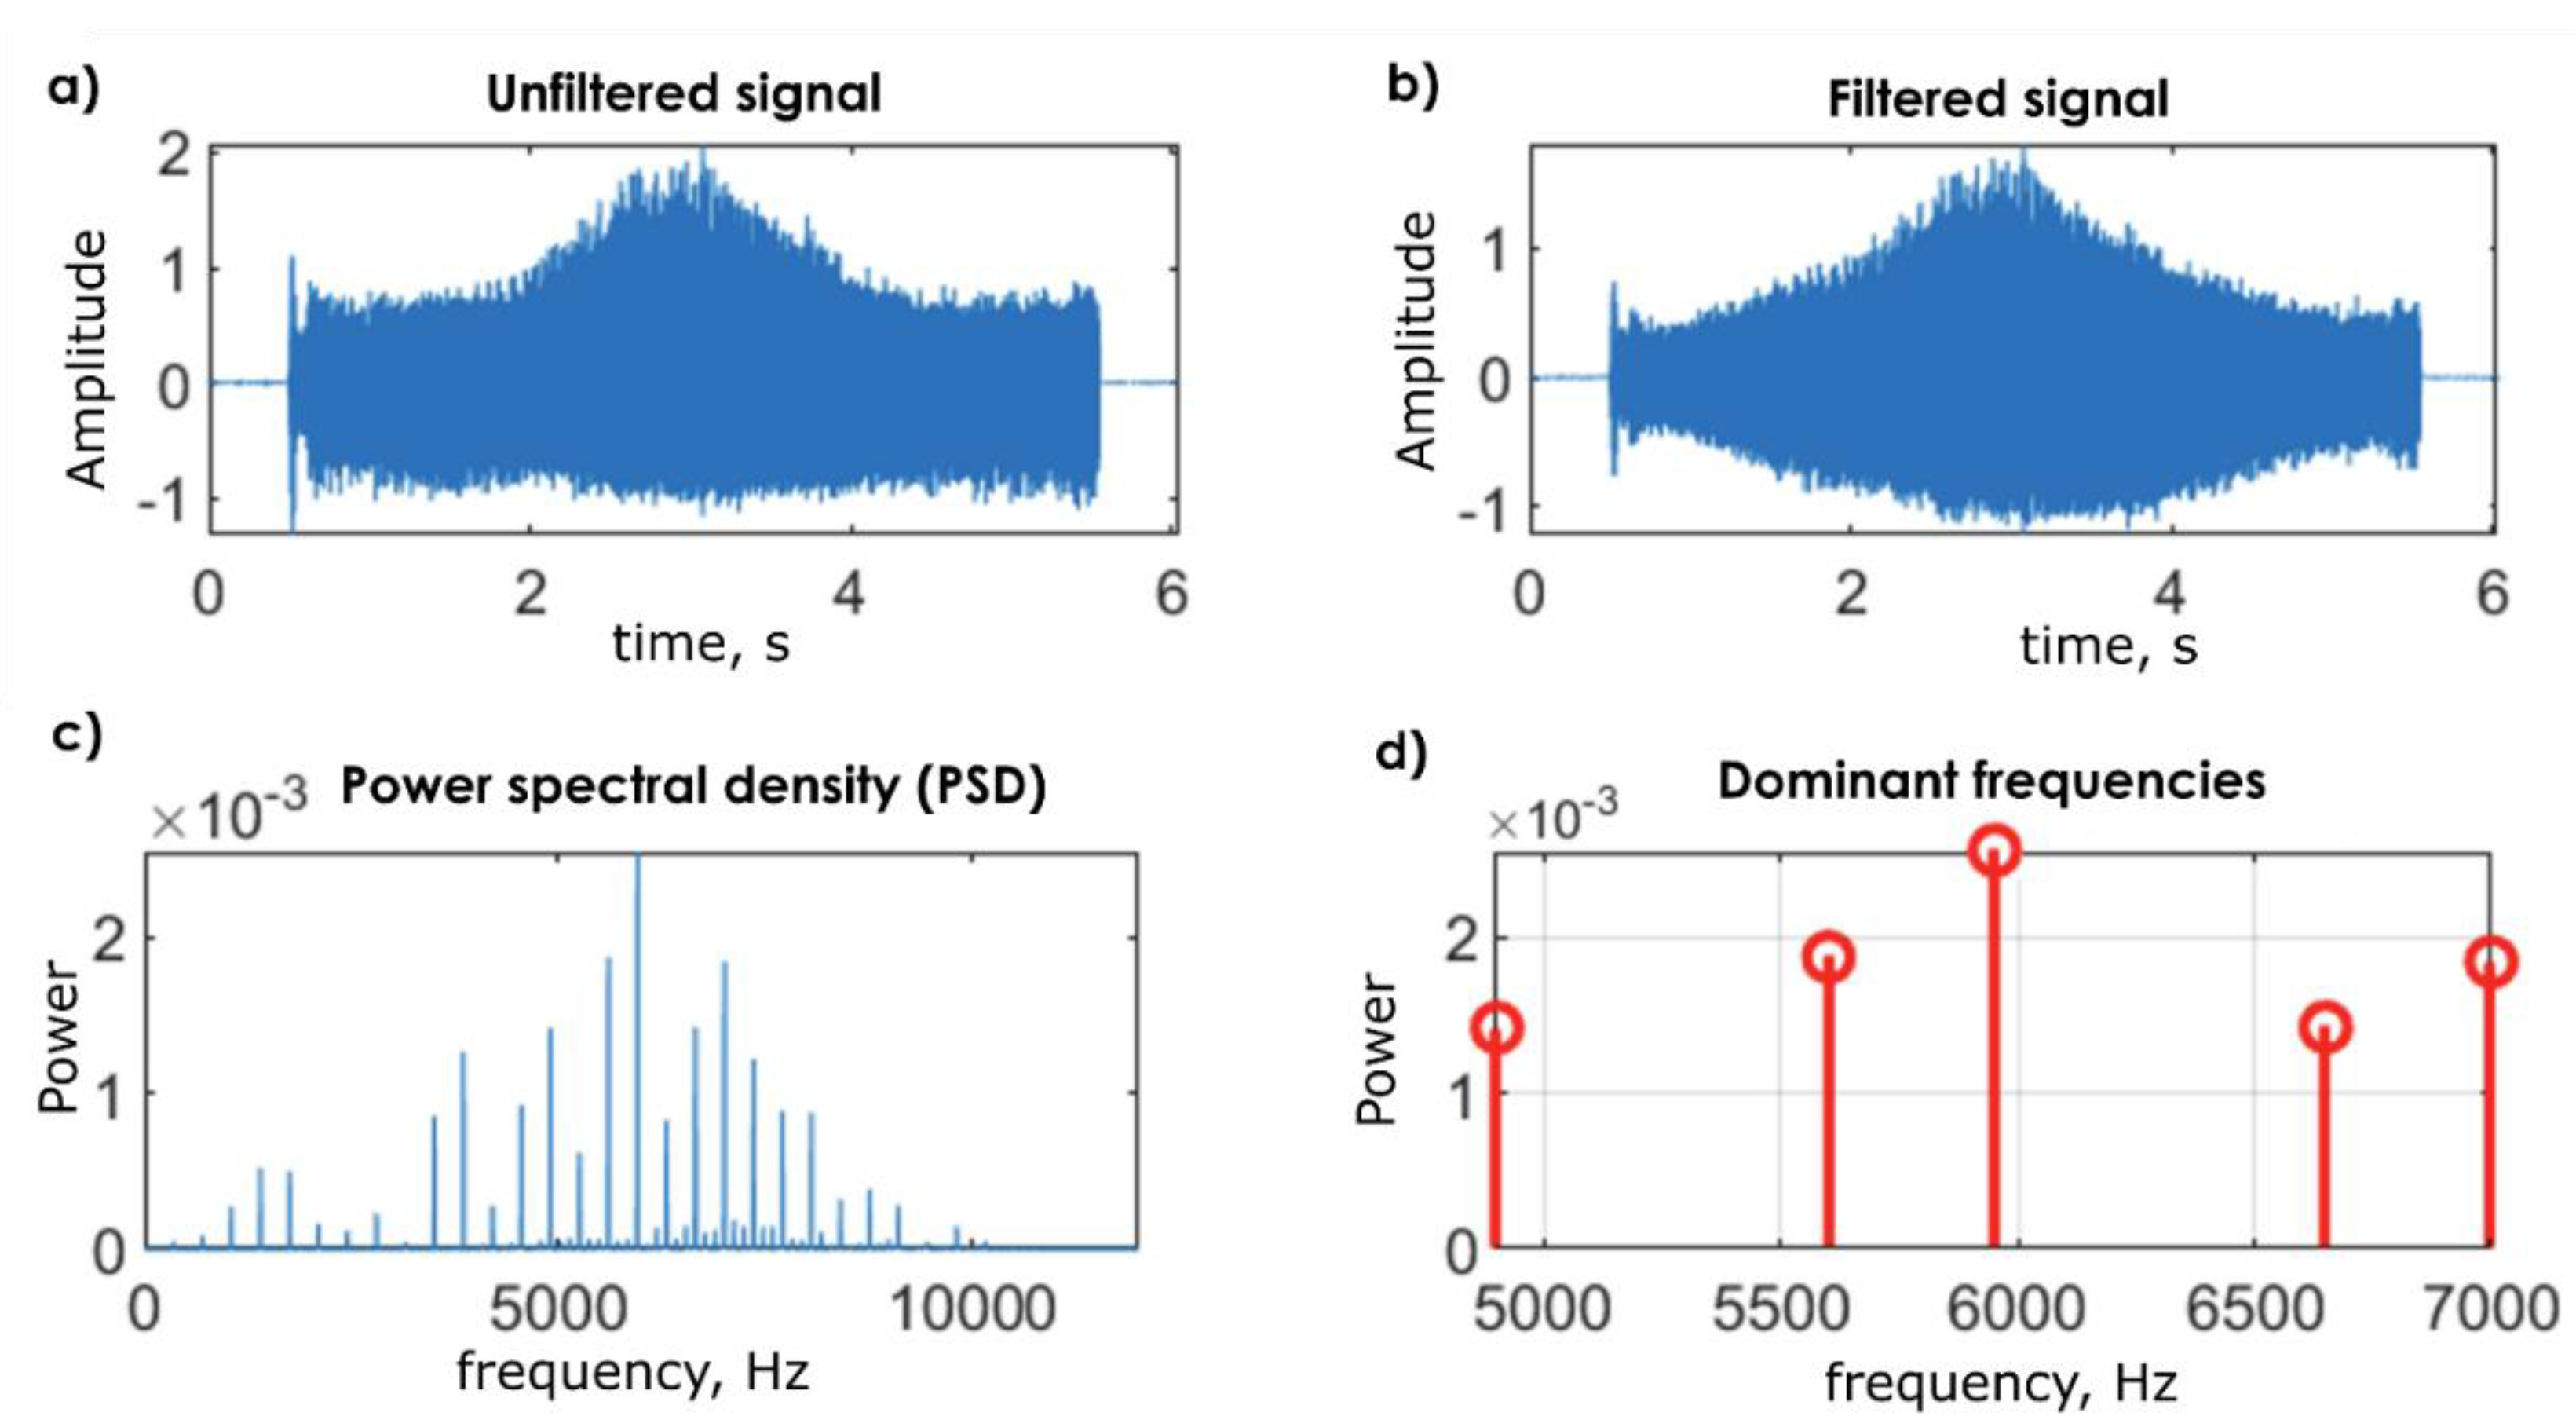
Figure 5.
Vibration signal parameter values for individual tools: a) RMS; b) BE; c) PTP; d) KUR; e) PSD.
Figure 5.
Vibration signal parameter values for individual tools: a) RMS; b) BE; c) PTP; d) KUR; e) PSD.
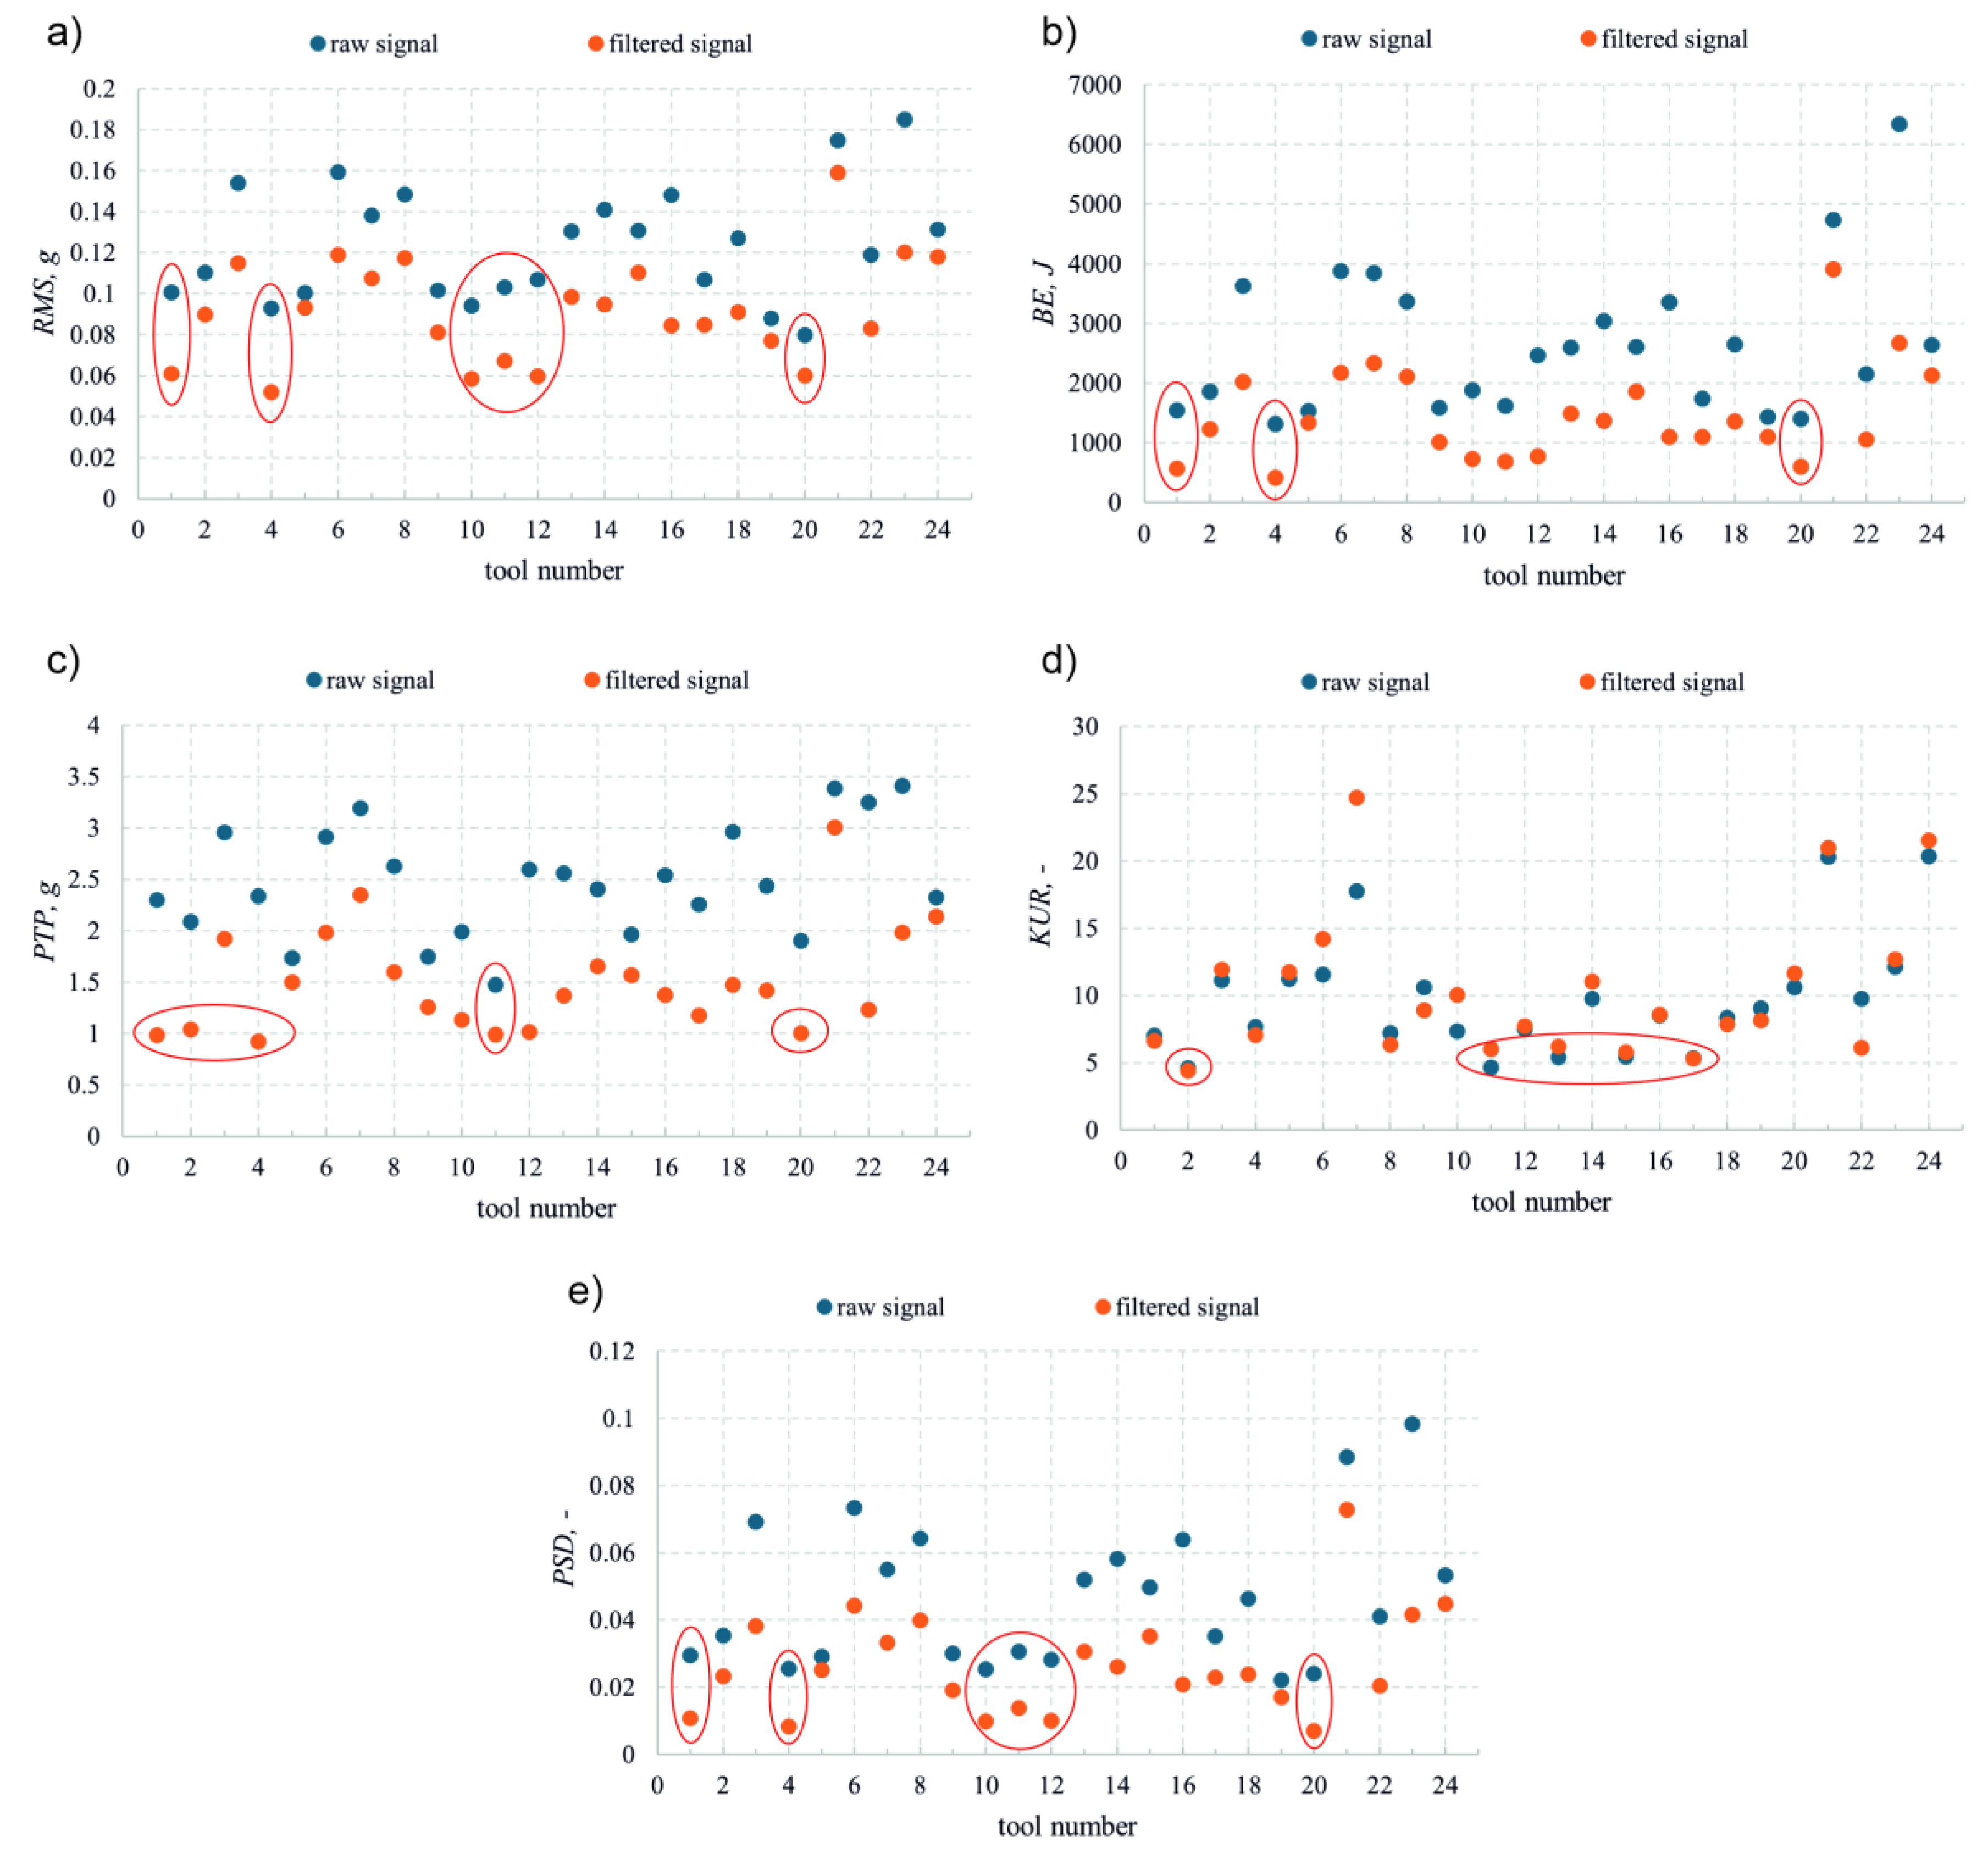
Figure 6.
Vibration signal parameter values in the radius R domain: a) RMS; b) BE; c) PTP; d) KUR; e) PSD.
Figure 6.
Vibration signal parameter values in the radius R domain: a) RMS; b) BE; c) PTP; d) KUR; e) PSD.
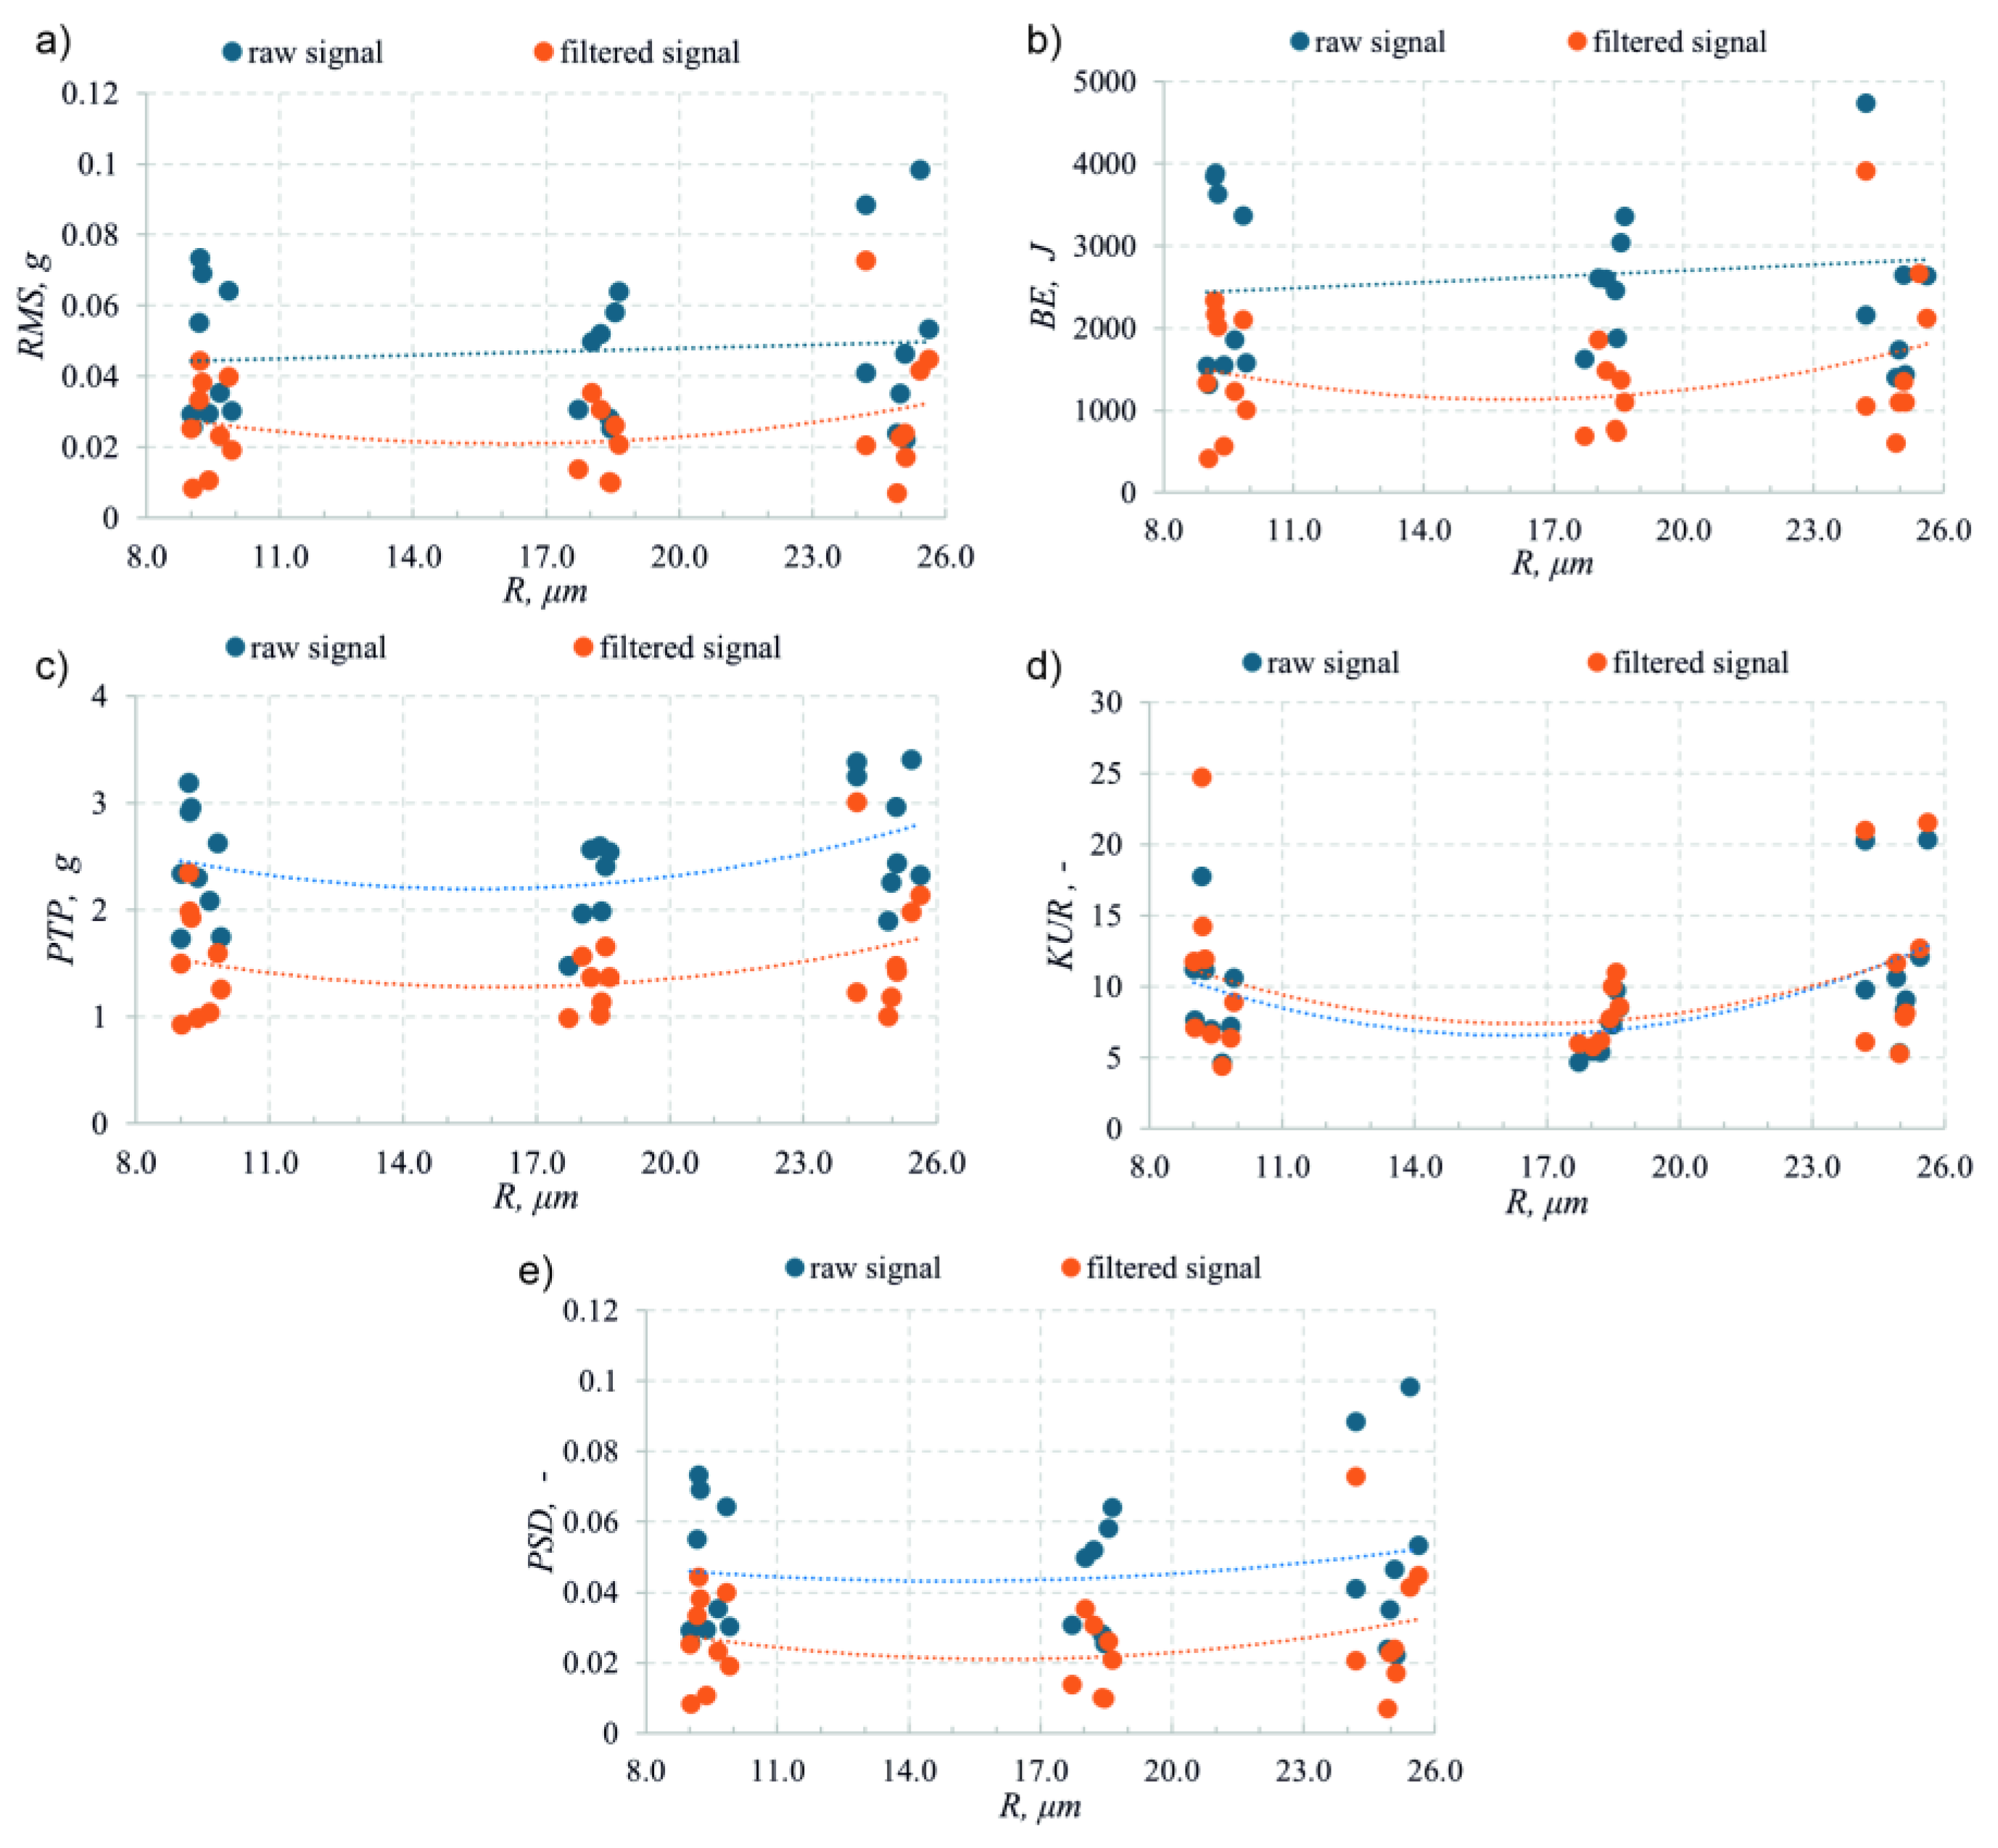
Figure 7.
Vibration signal parameter values in the function of zero-clearance flank width: a) RMS; b) BE; c) PTP; d) KUR; e) PSD.
Figure 7.
Vibration signal parameter values in the function of zero-clearance flank width: a) RMS; b) BE; c) PTP; d) KUR; e) PSD.
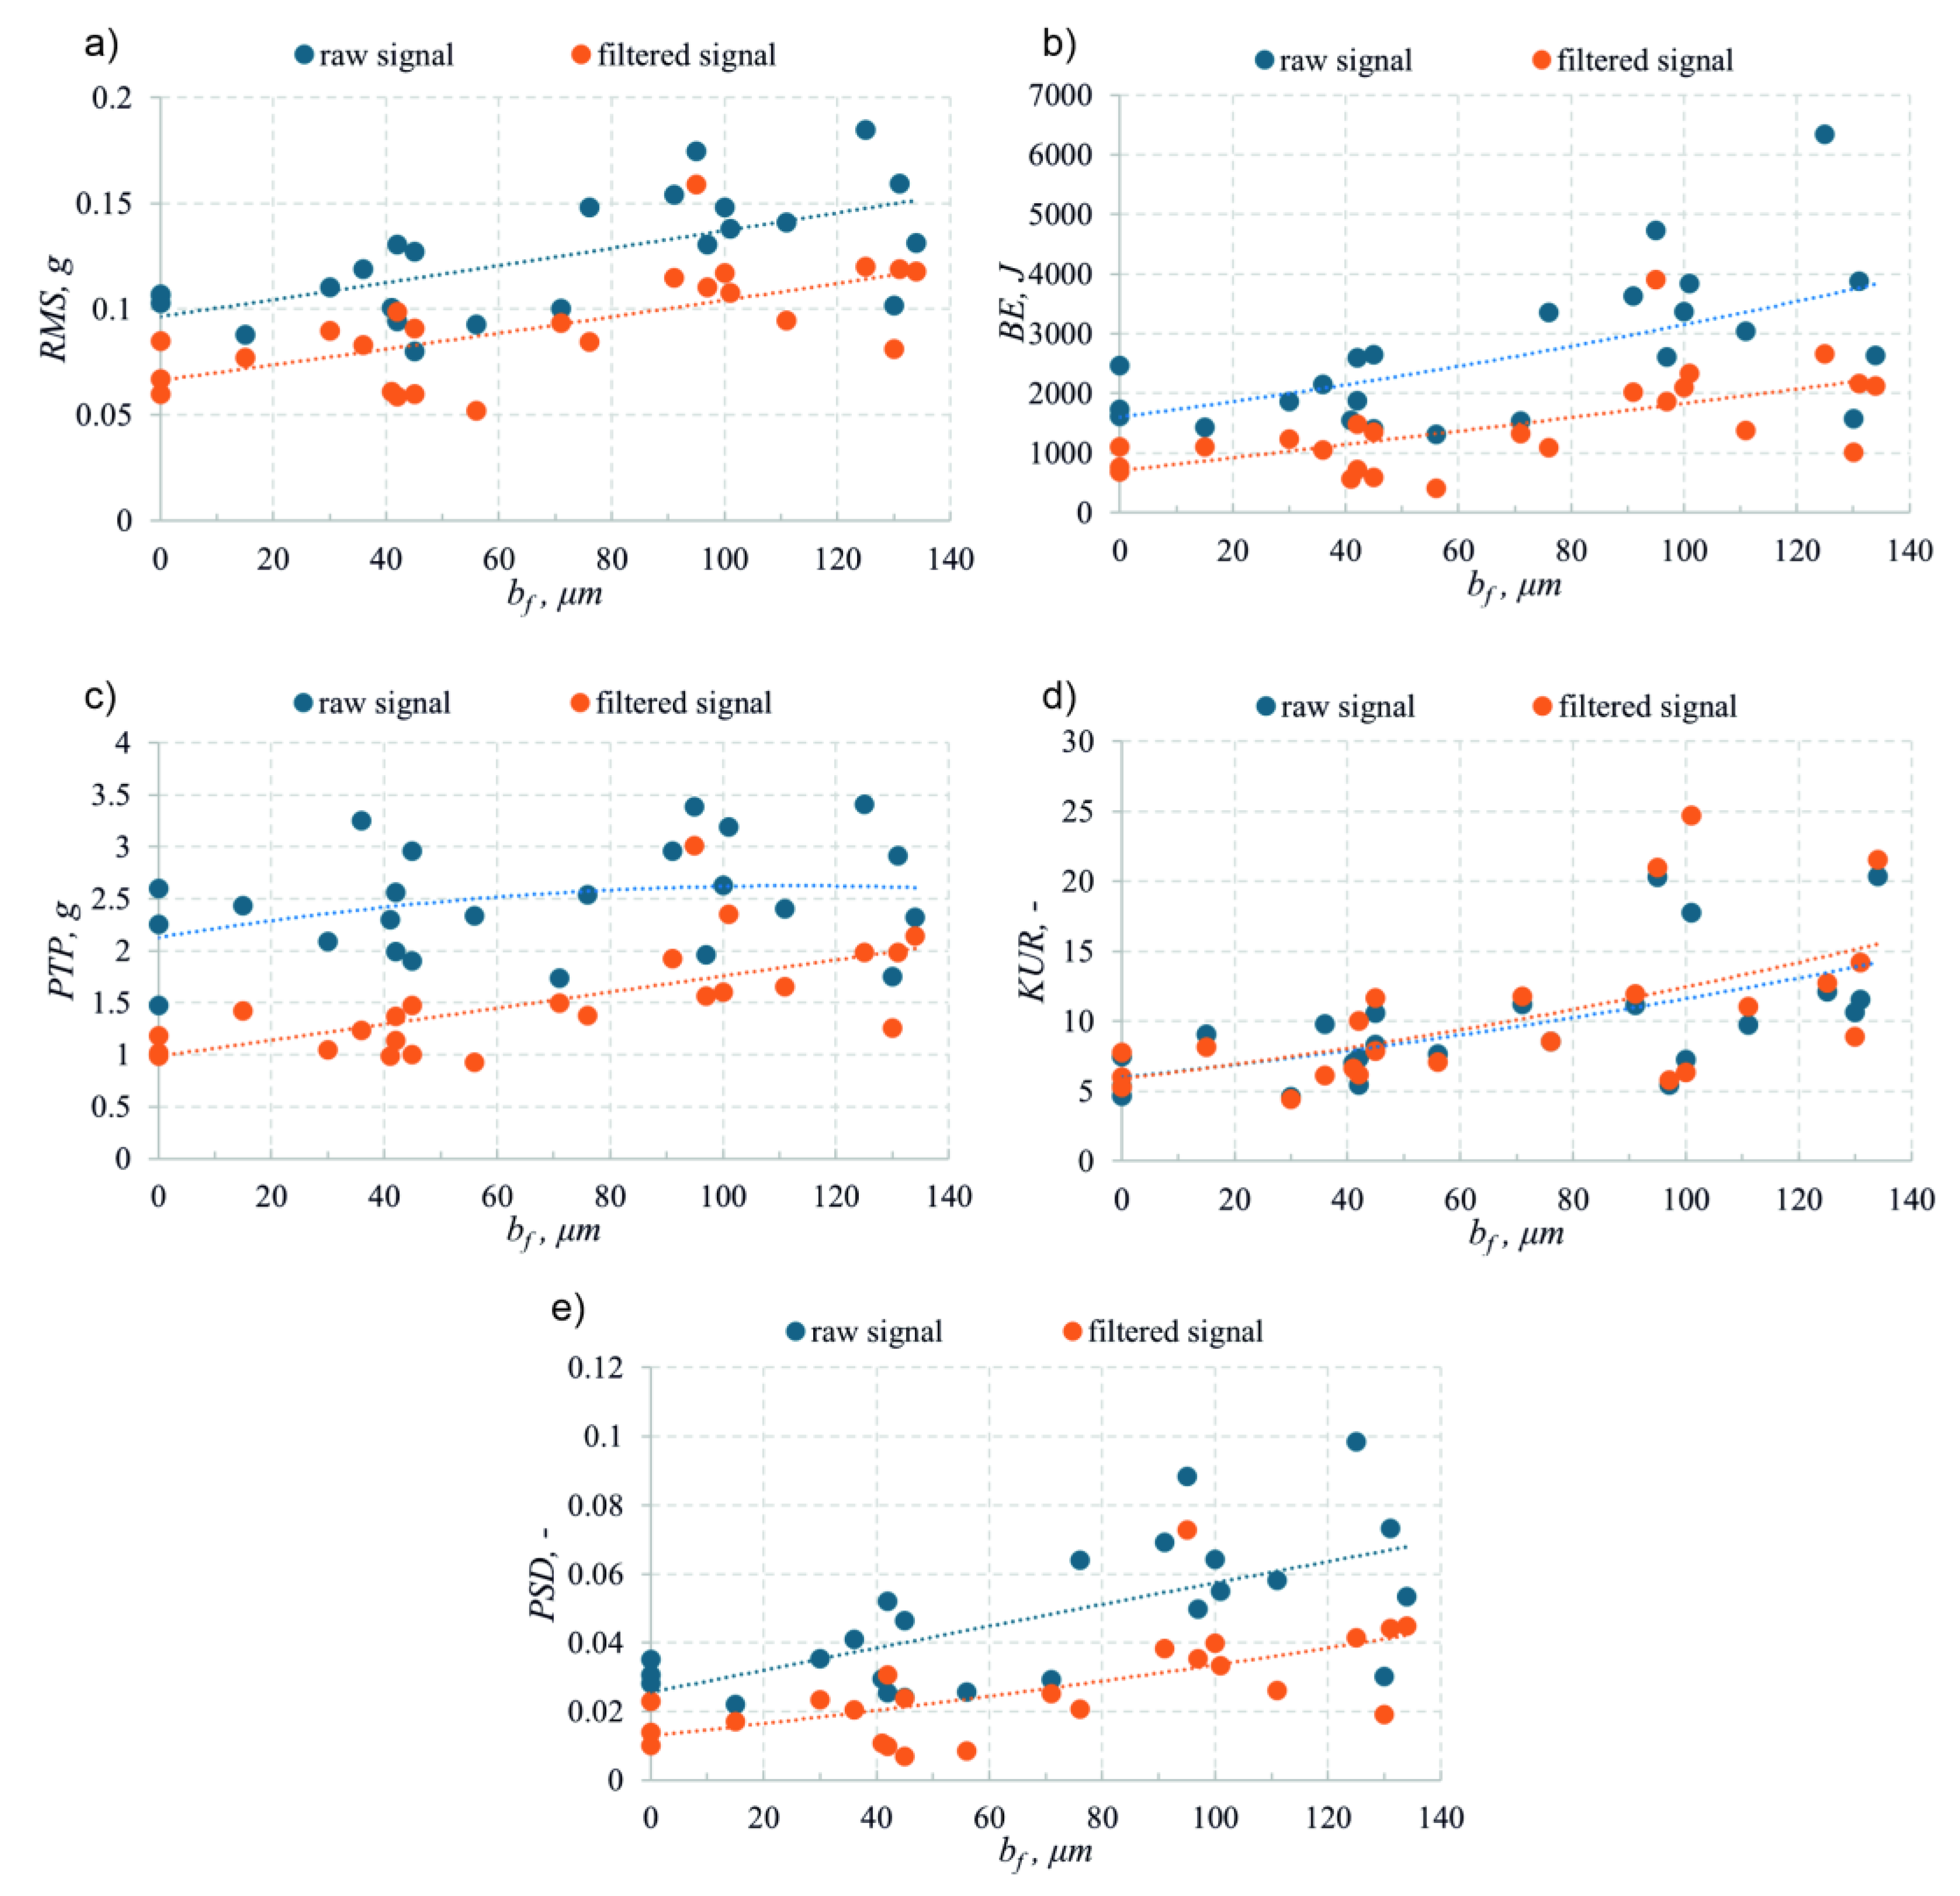
Figure 7.
Vibration signal parameter values for the different clearance angle values: a) RMS; b) BE; c) PTP; d) KUR; e) PSD.
Figure 7.
Vibration signal parameter values for the different clearance angle values: a) RMS; b) BE; c) PTP; d) KUR; e) PSD.
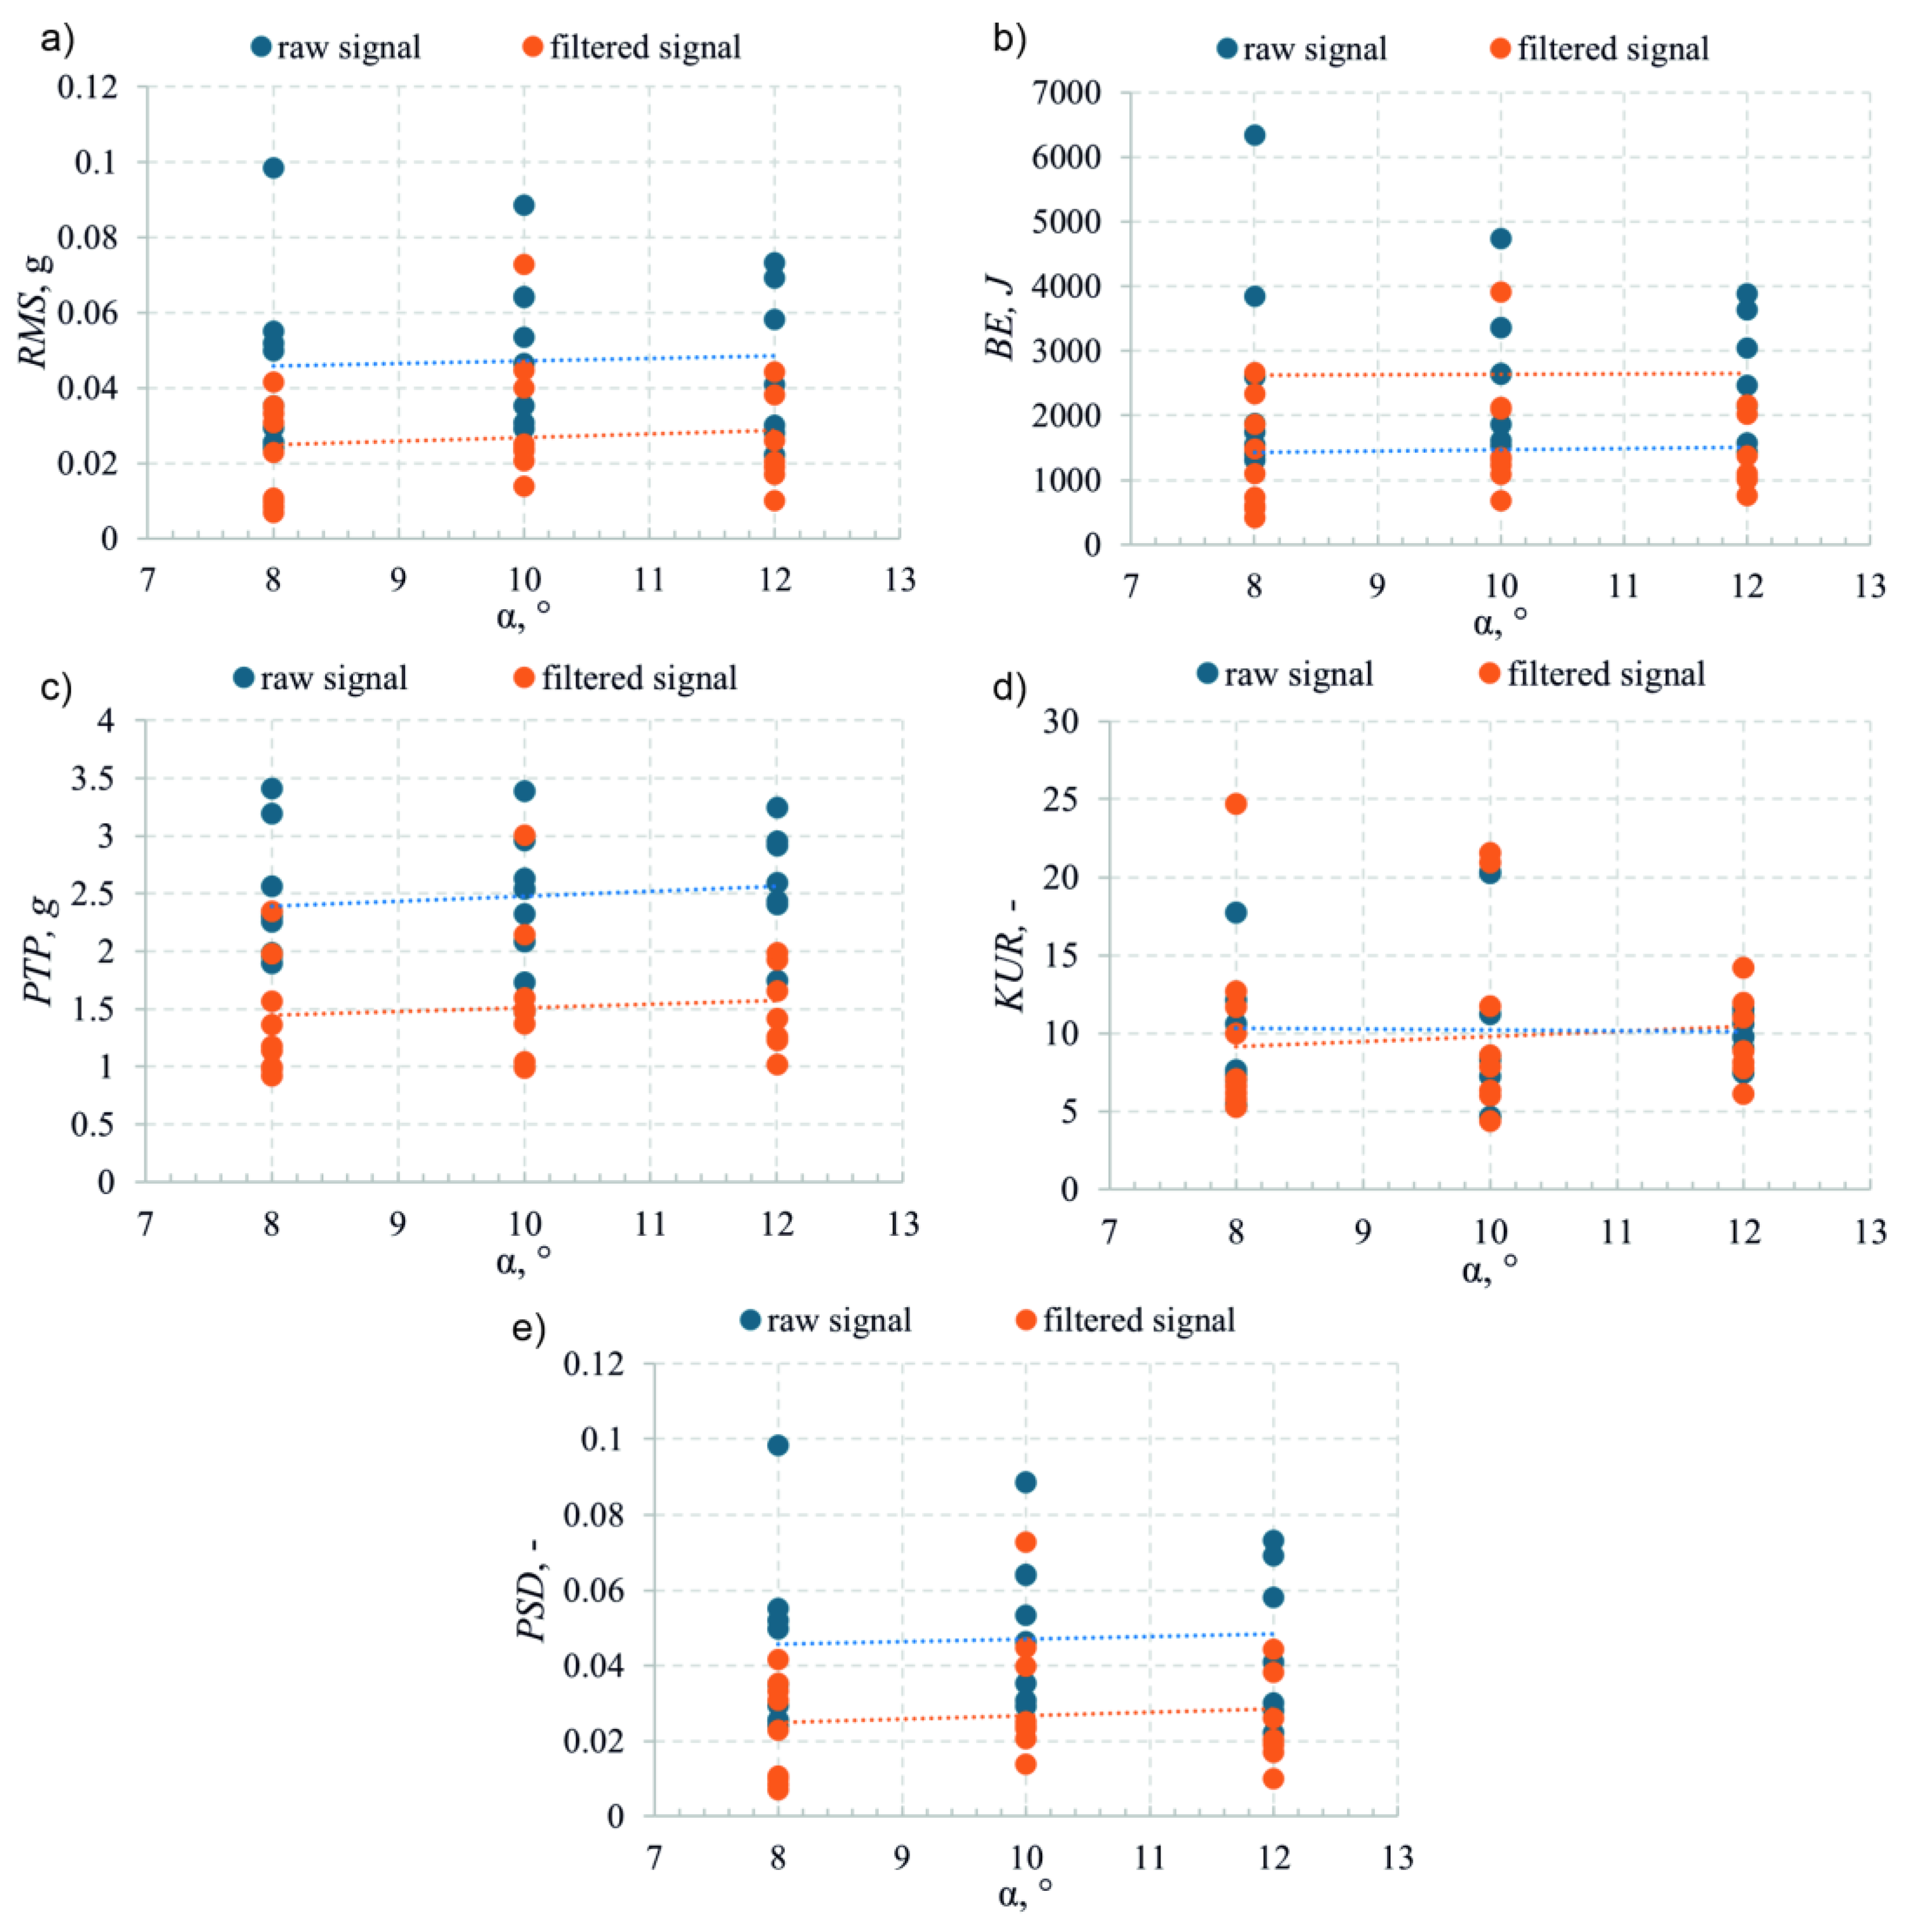
Figure 8.
VSI analysis of end mills with different geometry: a) VSI map in the R-bf domain; b) tool ranking.
Figure 8.
VSI analysis of end mills with different geometry: a) VSI map in the R-bf domain; b) tool ranking.
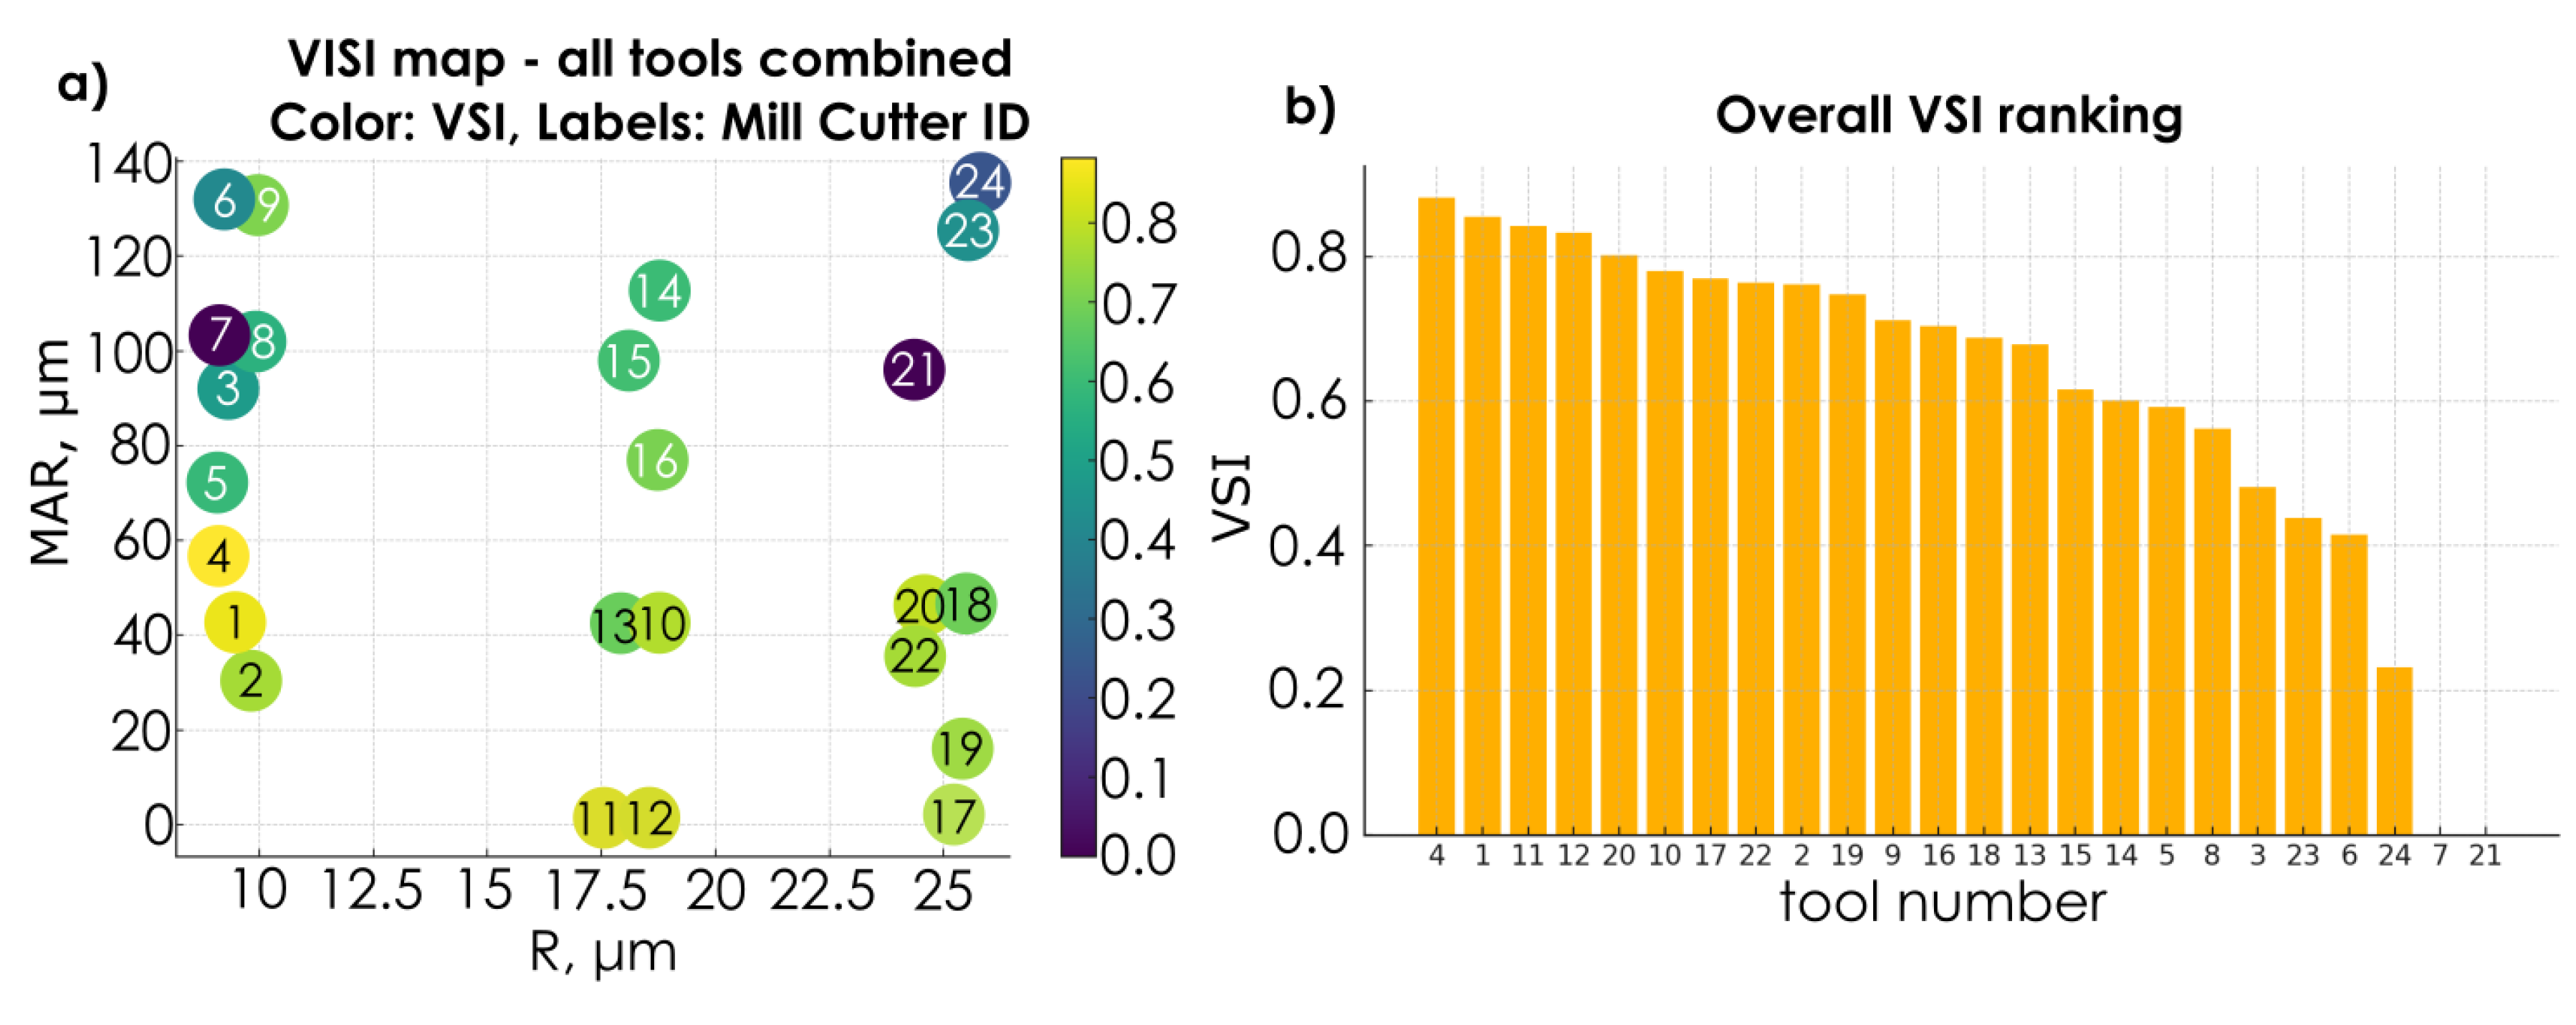
Figure 9.
Vibration signal parameter values in the function of feed per tooth: a) RMS; b) BE; c) PTP; d) KUR; e) PSD and radial depth of cut: f) RMS; g) BE; h) PTP; i) KUR; j) PSD.
Figure 9.
Vibration signal parameter values in the function of feed per tooth: a) RMS; b) BE; c) PTP; d) KUR; e) PSD and radial depth of cut: f) RMS; g) BE; h) PTP; i) KUR; j) PSD.
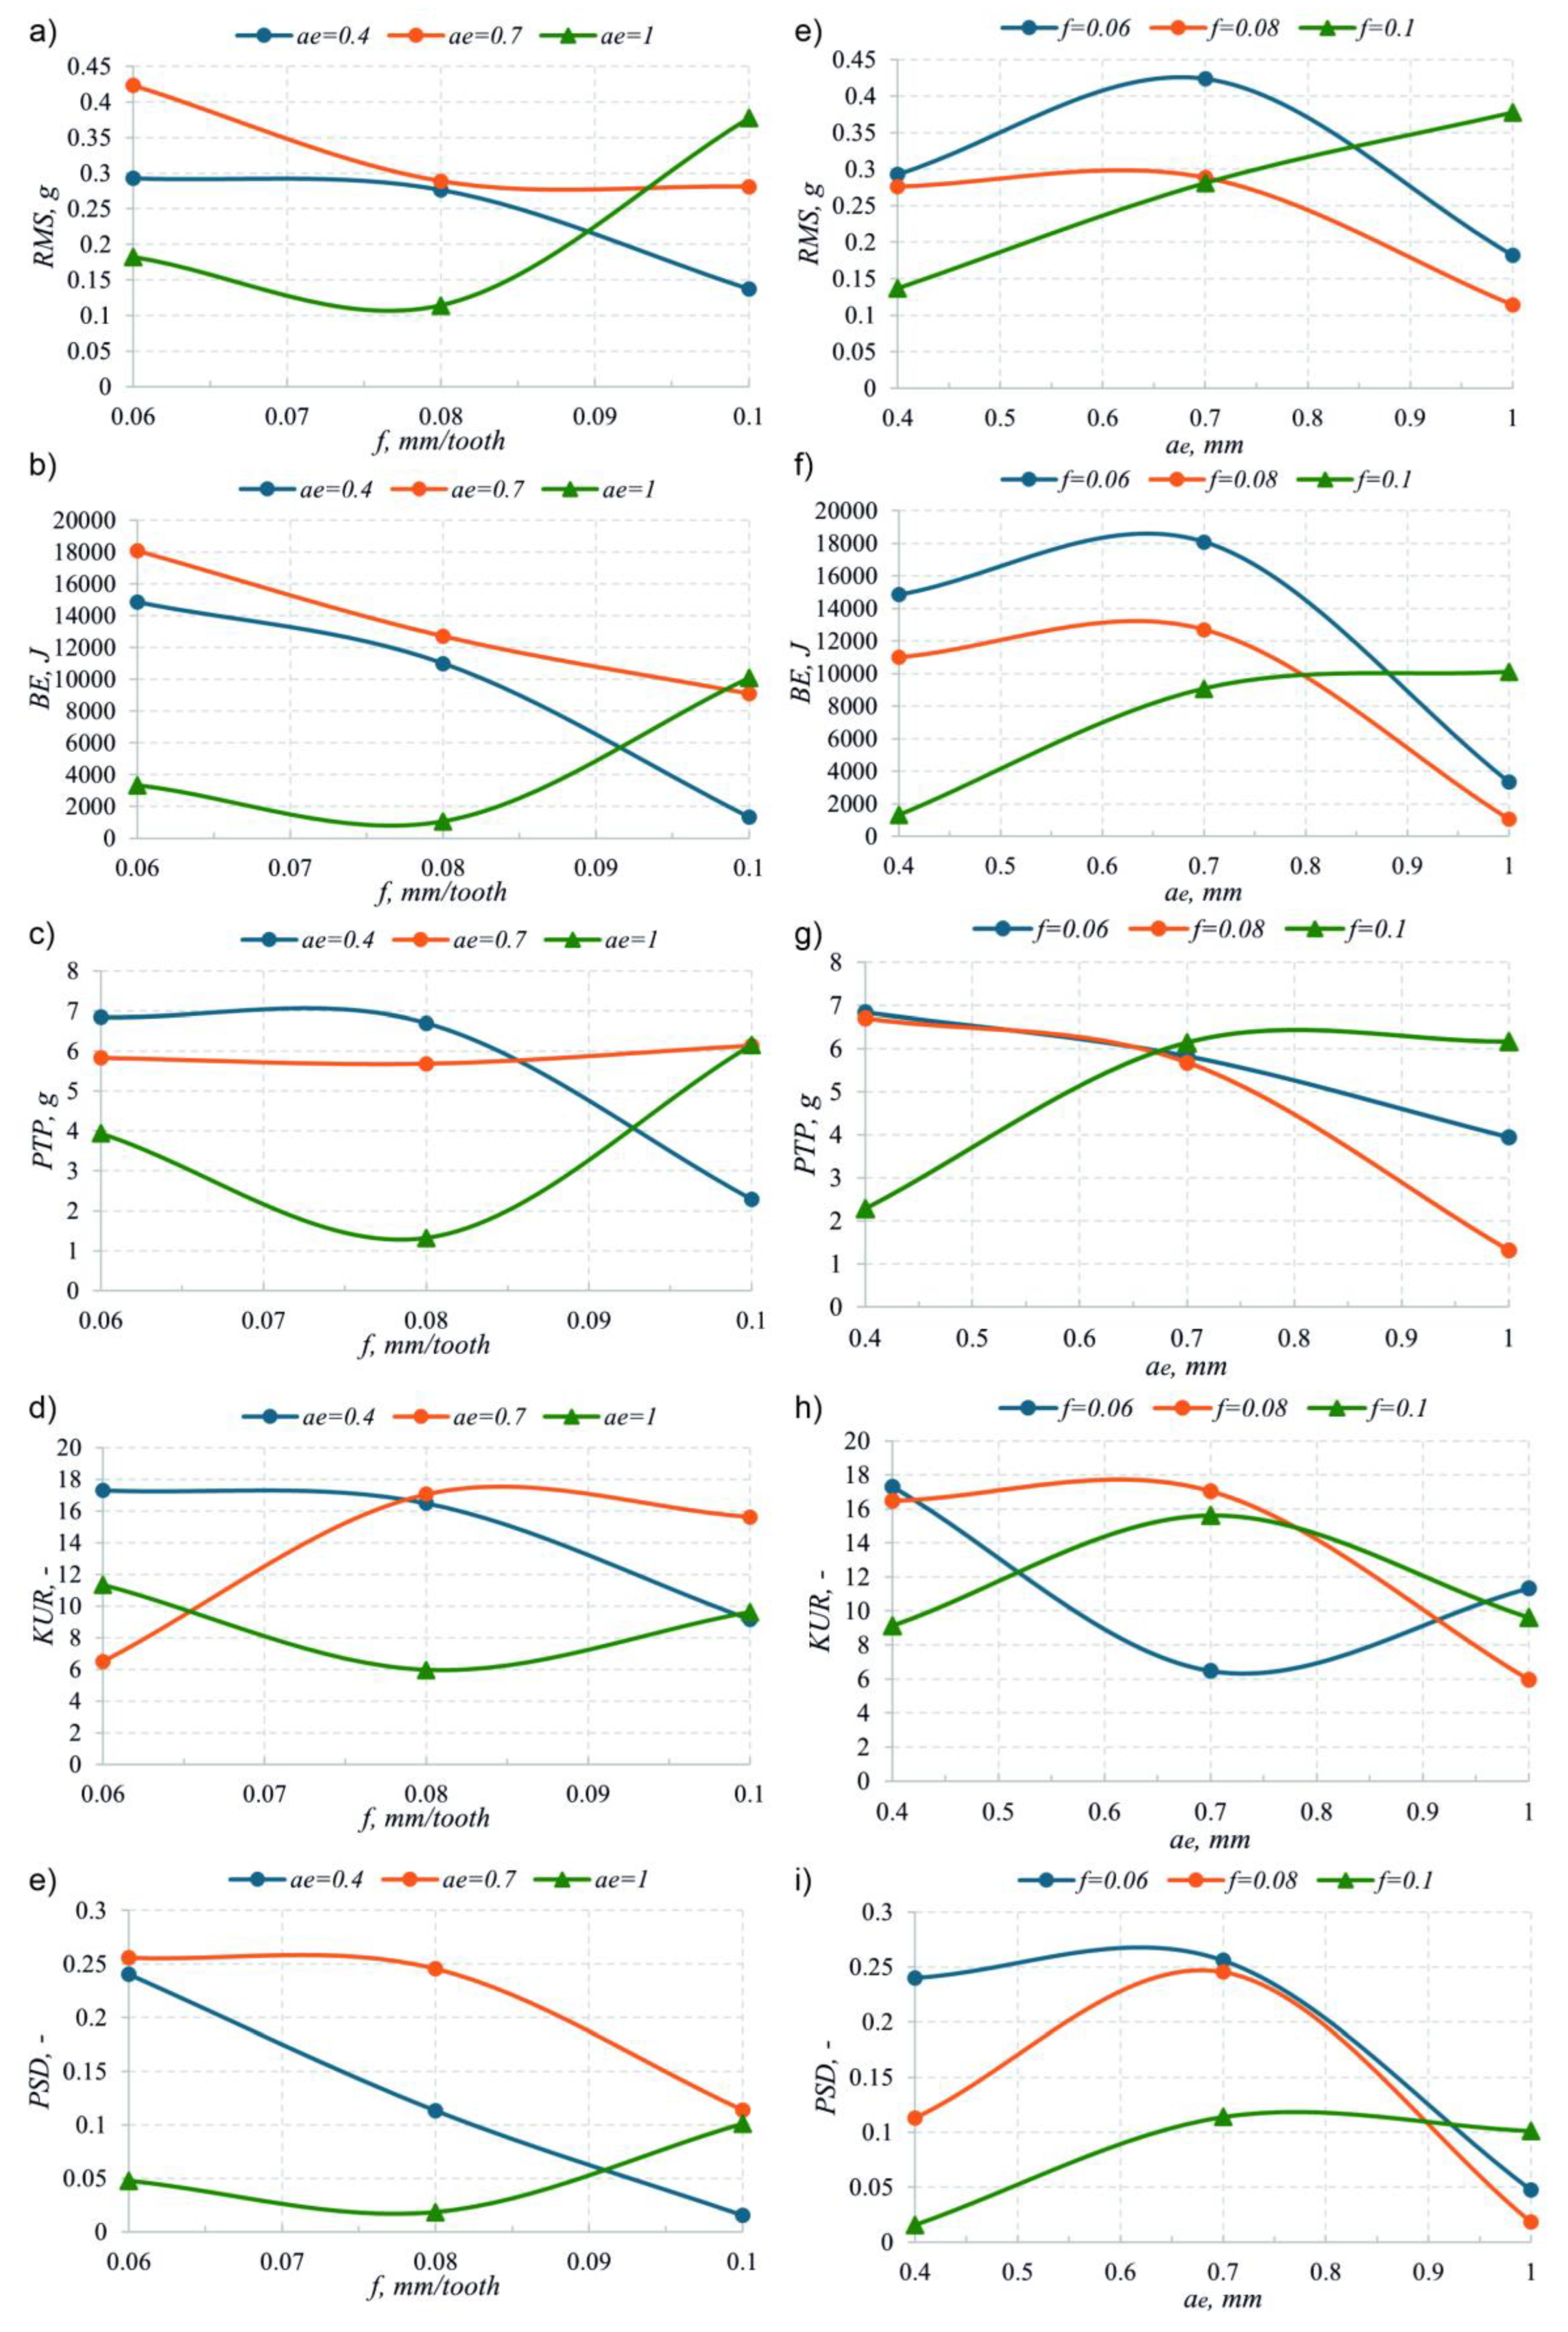

Table 1.
Geometrical parameters of the tested end mills.
|
End mill cutter number |
Edge radius R, μm |
Flank width bf, μm |
Clearance angle α, ° |
| 1 | 9.4 | 41 | 8 |
| 2 | 9.7 | 30 | 10 |
| 3 | 9.3 | 91 | 12 |
| 4 | 9.0 | 56 | 8 |
| 5 | 9.0 | 71 | 10 |
| 6 | 9.2 | 131 | 12 |
| 7 | 9.2 | 101 | 8 |
| 8 | 9.8 | 100 | 10 |
| 9 | 9.9 | 130 | 12 |
| 10 | 18.5 | 42 | 8 |
| 11 | 17.7 | 0 | 10 |
| 12 | 18.4 | 0 | 12 |
| 13 | 18.2 | 42 | 8 |
| 14 | 18.6 | 111 | 12 |
| 15 | 18.0 | 97 | 8 |
| 16 | 18.6 | 76 | 10 |
| 17 | 25.0 | 0 | 8 |
| 18 | 25.1 | 45 | 10 |
| 19 | 25.1 | 15 | 12 |
| 20 | 24.9 | 45 | 8 |
| 21 | 24.2 | 95 | 10 |
| 22 | 24.2 | 36 | 12 |
| 23 | 25.4 | 125 | 8 |
| 24 | 25.6 | 134 | 10 |
Table 2.
This is a table. Tables should be placed in the main text near to the first time they are cited.
Table 2.
This is a table. Tables should be placed in the main text near to the first time they are cited.
| Test number |
Feed per tooth fz, mm/tooth |
Radial depth of cut ae, mm |
| 1 | 0.06 | 0.4 |
| 2 | 0.06 | 0.7 |
| 3 | 0.06 | 1 |
| 4 | 0.08 | 0.4 |
| 5 | 0.08 | 0.7 |
| 6 | 0.08 | 1 |
| 7 | 0.1 | 0.4 |
| 8 | 0.1 | 0.7 |
| 9 | 0.1 | 1 |
Disclaimer/Publisher’s Note: The statements, opinions and data contained in all publications are solely those of the individual author(s) and contributor(s) and not of MDPI and/or the editor(s). MDPI and/or the editor(s) disclaim responsibility for any injury to people or property resulting from any ideas, methods, instructions or products referred to in the content. |
© 2025 by the authors. Licensee MDPI, Basel, Switzerland. This article is an open access article distributed under the terms and conditions of the Creative Commons Attribution (CC BY) license (http://creativecommons.org/licenses/by/4.0/).
Copyright: This open access article is published under a Creative Commons CC BY 4.0 license, which permit the free download, distribution, and reuse, provided that the author and preprint are cited in any reuse.


