
Submitted:
27 October 2025
Posted:
28 October 2025
You are already at the latest version
Abstract
Drought stress profoundly impacts citrus growth and soil health, yet the role of rhizosphere microbial communities in plant drought tolerance remains poorly understood. This study investigated the rhizosphere microbial structure, soil enzymatic activities, and physicochemical properties of drought-tolerant (DR) and drought-sensitive (DS) citrus varieties under drought stress condition. High-throughput sequencing revealed that drought significantly altered microbial community composition, enriching for gram-negative, stress-tolerant, and potentially pathogenic bacteria, as well as plant pathogenic fungi, while reducing undefined saprotrophs. Notably, the DR variety exhibited more stable and complex bacterial network, higher enrichment of beneficial fungi like Penicillium and Trichoderma, and unique recruitment of mycorrhizal fungi, which were absent in DS. Furthermore, soil catalase and urease activities downregulated under drought, whereas acid phosphatase activity upregulated, particularly in drought tolerant cultivar. Correlation analyses indicated that these microbial shifts were closely linked to changes in soil nutrient availability. Our findings demonstrate that the drought-tolerant citrus variety modulates its rhizosphere microbiome towards a more cooperative and resilient state, highlighting the critical role of host-specific microbial recruitment enhances plant adaptation to drought stress for sustainable agriculture.
Keywords:
citrus
; rhizosphere microorganisms
; drought
; physiological characteristics
; soil indicators
1. Introduction
Water scarcity represents a pervasive challenge confronting global agriculture, with the drought stress it induces resulting in substantial economic losses to agricultural production worldwide each year [1]. In response to this intense natural selection pressure, plants have evolved intricate survival strategies over extended periods, encompassing multi-dimensional adaptive adjustments that range from macroscopic morphological changes to microscopic cellular modifications [2]. For instance, under drought stress conditions, the activities of antioxidant enzymes, such as peroxidase (POX), superoxide dismutase (SOD), and catalase (CAT) in plants upregulated significantly [3,4,5]. Additionally, substances like proline within the osmotic adjustment system also exhibit elevated levels. This response effectively mitigates the accumulation of reactive oxygen species (ROS) and reduces water loss in leaf tissues, thereby enhancing the drought resistance of plants [6].
Recent studies have increasingly demonstrated that plants do not confront adverse conditions in isolation; rather, the microbial ecosystem surrounding their roots ”the rhizosphere” plays an indispensable role as an ally in this process [7,8,9]. Rhizosphere microorganisms significantly influence the health and growth of their host plants by regulating soil nutrient transformation, promoting the secretion of plant growth substances, and decomposing organic residues. Notably, they exhibit considerable potential in alleviating environmental stresses, such as drought. A crucial insight emerging from recent studies are that the establishment of the rhizosphere microbiome is not a passive phenomenon; rather, it is likely actively shaped by the genotype of the host plants [10,11]. Distinct plant species, and even different cultivars within a single species, have the capacity to select diverse microbial communities through variations in root architecture and, more significantly, differences in the composition of root exudates [12,13]. Drought-tolerant genotypes tend to selectively enrich specific microbial taxa that contribute to enhanced drought resilience capacity. These microorganisms include those capable of producing exopolysaccharides, which improve soil water-holding capacity, as well as those that synthesize plant growth-promoting hormones or antioxidants [14,15]. While numerous studies have documented the direct impacts of drought on soil microbial communities, there has been less extensive exploration into how drought sensitivity in host plants modulates these responses. Therefore, utilizing microbial resources as a sustainable ecological tool to enhance the environmental adaptability of crops is emerging as a cutting-edge focus in contemporary agricultural research. To achieve this objective, it is crucial to elucidate the response patterns and functional combination rules of rhizosphere microorganisms under drought conditions, thereby establishing a foundation for the effective utilization of this "living resource bank."
As a cornerstone of the global horticultural industry, the yield and quality of citrus (Citrus spp.) have a direct impact on the livelihoods and nutrition of hundreds of millions of people worldwide [16]. The primary production areas are predominantly situated in tropical and subtropical regions that are susceptible to seasonal droughts. Insufficient water availability often results in a significant decline in yield, with reductions reaching as high as 50% in certain instances [17]. At the molecular level, transcriptomic and proteomic analyses have effectively identified drought-responsive genes and proteins involved in abscisic acid (ABA) signal transduction, photosynthesis, and stress resistance mechanisms [18,19,20,21]. These findings have further clarified the intrinsic genetic regulatory mechanisms that underlie citrus adaptation to drought conditions. In terms of nutrient uptake, drought conditions alter the availability of nutrients in the soil and the root system's capacity for absorption [22]. Notably, this situation particularly inhibits the uptake of essential nutrients, such as nitrogen, phosphorus, and potassium, thereby influencing the overall nutritional status and fruit quality of citrus trees [23]. The rhizosphere microbial community serves as a crucial interface between plant roots and the soil environment. Previous studies on fruit trees have primarily concentrated on how various covering measures reshape the structure of this microbial community [24,25]. However, when it comes to gaining a comprehensive understanding of the drought tolerance in citrus plants, research into rhizosphere microorganisms has remained a relatively overlooked aspect. Most related studies have concentrated on the mechanisms through which the inoculation of arbuscular mycorrhizal fungi (AMF) mitigates the adverse effects of drought stress on citrus [26,27]. However, there is a paucity of research examining how different genotypes of citrus influence the composition and structure of root-associated microorganisms. Therefore, incorporating the microbial dimension into the existing framework for understanding citrus drought tolerance is crucial for a comprehensive understanding of this phenomenon.
In the present study, we compared a citrus variety with poor drought tolerance (DS) and a citrus variety with strong drought tolerance (DR) to test the central hypothesis that the drought tolerance of citrus varieties determines the structural and functional responses of their rhizosphere microbial communities to drought stress. We integrated the evaluations of plant physiology, soil chemistry, and enzyme activities, along with high-throughput sequencing, functional prediction, and co-occurrence network analysis of bacterial and fungal communities, aiming to: (1) Probe into the differences existing in the rhizosphere microenvironments of the two varieties; (2) Unveil the drought-induced alterations in microbial diversity, composition, and potential functions; (3) Elucidate the disparities in microbial network stability and interactions under stress between both varieties. The findings of our study aim to establish the mechanistic connections among plant genotypes, drought stress, and the rhizosphere microbiota, offering novel insights for the development of microbiota - based strategies to improve crop drought tolerance efficiency.
2. Results
2.1. Variations in the Physicochemical Properties of Rhizosphere Soil and Physiological Indicators of Citrus Varieties under Drought Stress
In our study, a comparative analysis of the growth metrics between the two control groups, DSCK and DRCK, was performed, revealing significant inherent disparities. Across all examined growth metrics, the values for the DRCK group consistently surpassed those of the DSCK group. Specifically, the average shoot height (34.89cm), root length (25.84cm), fresh weight (30.30g), and dry weight (9.09g) for the DRCK group were markedly superior to those recorded for the DSCK group, which had corresponding values of approximately 27.66cm, 23.05cm, 21.44g, and 4.67g respectively. Compared to their respective control groups, both drought stress treatments (DS and DR) significantly inhibited plant growth. In particular, the DSS treatment resulted in a marked decline across all growth indicators when compared to the well-growing DSCK control group. The most pronounced reduction was observed in dry biomass (DB), which decreased from 4.67 to 1.83g, indicating that drought stress severely impeded the accumulation of photosynthetic products in plants. Similarly, all growth indicators shoot height (SH), root length (RL), fresh weight (FB), dry biomass (DB) within the DR group were significantly lower than those observed in the corresponding DRCK control group. In the direct comparison of the two stress treatments, the average shoot height (18.41 cm), root length (12.27cm), fresh weight (9.16g), and dry weight (1.83g) observed in the DS treatment were all significantly lower than their corresponding values in the DR treatment (22.35cm, 17.19cm, 15.91g, and 3.18g) [Figure 1].
A distinct gradient relationship was evident among the four treatment groups across all growth indicators. The order of plant growth performance, from optimal to suboptimal conditions, was as follows: DRCK > DSCK > DR > DS. Under drought treatments, both citrus varieties exhibited significant inhibition in growth; notably, the inhibitory effect induced by DS was markedly more pronounced than that resulting from DR .
To gain a deeper understanding of the effects of drought stress treatments on the rhizosphere microenvironments of various resistant varieties, this study assessed the activities of catalase (CAT), urease (UE), acid phosphatase (ACP), and invertase (SE) in the soils from each treatment group. The comparative analysis of soil enzyme activities in the two control groups, i.e., DSCK and DRCK, revealed that the activities of CAT, UE, and SE were significantly higher in the DRCK as compared to DSCK group. This finding suggests that there are inherent differences in the soil biochemical environments between the two experimental systems under non-stress conditions. Conversely, the activities of acid phosphatase (ACP) were found to be at comparable levels in both groups, indicating no significant differences (Figure 2).
In the context of stress effects, the DS and DR varieties exhibited distinct patterns in their impacts on various soil enzyme activities. Regarding CAT and UE, the stress treatments consistently demonstrated significant inhibitory effects. When compared to their respective control groups, DS and DR treatments resulted in the marked decline in CAT activity. Notably, the inhibitory effect of DS was particularly pronounced, with its CAT activity measured at 53.22 U·g-1, substantially lower than DR at 67.15 U·g-1 (Figure 2A). Similarly, under the DS treatment, UE activity reached its lowest level. These findings indicated that both stresses reduced the soil's antioxidant capacity and nitrogen transformation potential; however, the influence of the DS treatment was more profound (Figure 2B). Conversely, for acid phosphatase (ACP), stress treatments led to a significant increase in its activity. The ACP activity in DS and DR treatment groups was significantly higher than that observed in their respective control groups. It is noteworthy that among these stress treatments, DR exhibited a markedly stronger enhancing effect on ACP activity, achieving the highest enzyme activity levels (Figure 2C). For sucrase (SE), differences among treatment groups were relatively low; no consistent or significant pattern of response to stress was discernible (Figure 2D).
In this study, the both experimental treatments implemented (DS and DR) had significant negative impacts on key chemical properties of the soil, particularly concerning nutrient availability and organic carbon storage (Figure 3). In comparison to the control group (DSCK), the DS treatment significantly reduced the levels of soil available potassium (AK), available phosphorus (AP), available nitrogen (AN), and soil organic carbon (SOC). The average SOC content in the DS treatment group was 34.38 g/kg, indicating the 23.8% decrease compared to 45.11 g/kg in the DSCK group (Figure 3A). Furthermore, the soil microbial biomass carbon (MBC), microbial biomass phosphorus (MBP), and microbial biomass nitrogen (MBN) in the DS treatment group were measured at 240.31, 21.63, and 203.61 mg/kg, respectively. All of which were lower than observed in the DSCK group, which recorded values of 277.56 mg/kg for MBC, 30.58 mg/kg for MBP, and 215.67 mg/kg for MBN (Figure S1). Similarly, the contents of AK, AP, AN, SOC, MBC, MBP, and MBN in the DR treatment group were also significantly lower than control group (DRCK). It is noteworthy that DS and DR resulted in significant reductions across all measured chemical indicators (AK, AP, AN, SOC) as well as microbial biomass indicators (MBC, MBN, MBP) relative to their respective control groups; there were distinct differences regarding the severity of impact on soil properties between these treatments. The DS treatment resulted in pronounced decline across all indicators with absolute values being consistently lower than other groups assessed. In contrast to this finding; although indicators within the DR treatment group were also significantly diminished when compared to those from DRCK; they exhibited a comparatively less severe degree of influence overall. Specifically concerning absolute values, the contents of AK, AP, AN, SOC, MBC, MBN, and MBP within the DR treatment cohort remained systematically higher than recorded under DS conditions. Moreover, when evaluating percentage reductions relative to their respective control groups it became evident that depletion resulting from DR treatment was notably less extensive than induced by the DS intervention.
2.2. Diversity of Rhizosphere Microbial Communities of Different Citrus Under Drought Treatment
To investigate the soil microbial structure of various plant varieties under drought conditions, we conducted α- and β-diversity analyses on the soil microorganisms across four treatment groups. The results indicated that there were no significant differences in coverage among the various treatments, and the overall coverage was deemed satisfactory. At the bacterial level, analyses of the ACE and Chao1 index revealed no significant differences among the four treatment groups. This suggests that different treatments had a negligible impact on soil bacterial richness. However, when comparing the Shannon and Simpson index, significant differences were observed across all treatment groups. Notably, substantial differences were found between DS and DR, as well as between drought treatments and control groups (DS vs. DSCK; DR vs. DRCK), with these differences being highly significant. This indicates that drought stress significantly influenced the evenness of the bacterial community, leading to considerable variations in the relative abundance of soil bacterial communities among different drought-resistant varieties under conditions of drought stress (Figure 4A, B). We conducted an Operational Taxonomic Unit (OTU) clustering analysis on all treatments utilizing principal coordinates analysis (PCoA) to investigate the differences in soil microbial composition between two varieties exhibiting distinct levels of drought tolerance under drought and control conditions. Our analyses revealed that bacterial and fungal communities could be categorized into four clusters, effectively distinguishing between different treatments as well as varying drought-tolerant varieties. Further examination indicated that within the bacterial community, the drought-treated and CK groups were clearly separated into two distinct clusters. However, differentiation among various varieties under identical treatment conditions was not significant. In contrast, for fungi, the degree of community separation was more pronounced than observed in the bacterial community (Figure 4C, D).
In the bacterial community compositions at the phylum level across each treatment group, Proteobacteria emerged as the predominant phylum. Its relative abundance exceeded 34% in all treatment groups, with minimal differences observed among them. The other principal phyla included Acidobacteriota, Actinobacteriota, and Chloroflexi. The combined relative abundance of these three phyla surpassed 30%. Notably, when compared to the control groups (DSCK and DRCK), the relative abundances of Actinobacteriota and Chloroflexi in the treatment groups DS and DR exhibited declining trend. The relative abundance of Acidobacteriota showed slight increase in these treatment groups. Moreover, there was remarkable increase in the proportion of Bacteroidota within the DR group (9.97%), which was approximately 1.5 to 2 times higher than observed in the other groups. Cyanobacteria also demonstrated significant increases in DS and DR groups (Figure 5A). At the genus level, the bacterial community was predominantly composed of substantial number of low-abundance species, with the proportion of the "Others" category exceeding 69.9% in all instances. Among the major identifiable genera, the relative abundances of Pseudolabrys and Gaiella in the DS and DR treatment groups were significantly lower than control groups (Figure 5B).
Analysis of the fungal community structure at the phylum level across different treatment groups revealed significant compositional differences. The phylum Ascomycota was predominant in the DS (84.87%) and DR (84.99%) groups, exhibiting substantially higher proportion compared to the CK group. In contrast, unclassified Fungi were notably abundant in the DSCK group (53.82%), but their prevalence significantly decreased in the DS, DRCK, and DR groups. While Basidiomycota demonstrated relatively high abundance in the DRCK group (23.39%), it declined to 6.63% in the DR group. However, this percentage remained significantly higher than DS group, suggesting its potential role as a key taxon influencing drought resistance in citrus species (Figure 5C). In the analysis conducted at the fungal genus level, the genus Fusarium emerged as the most dominant in the drought-stressed and drought-resistant groups. Its abundance was significantly higher than control group. Drought treatment notably increased the relative abundances of the genera Penicillium and Trichoderma. Conversely, significant decrease in the abundance of Thermomyces was recorded under drought conditions. Further analysis revealed that the DR treatment favored the enrichment of beneficial or functional fungi, including Penicillium, Trichoderma, and Albifimbria. Simultaneously, it significantly reduced the proportion of unclassified taxa. This finding suggests that under drought conditions, DR treatment exerts more positive regulatory influence on fungal community structure compared to DS treatment (Figure 5D).
We utilized LEfSe to conduct comprehensive analysis of rhizosphere microorganisms. The findings revealed that, in the DSCK treatment, the abundances of 1 phylum, 2 classes, 2 orders, and 2 families exhibited significant increases. In the DRCK treatment, there were notable increases in the abundances of 2 phyla, 2 classes, 2 orders, and 1 family (unclassified_SBR1031). For the DS treatment, an increase was observed solely in 1 order (Burkholderiales). In contrast, the DR treatment showed increased abundances for 1 phylum (Bacteroidota) and 3 classes (Gammaproteobacteria, Bacteroidia, Cyanobacteria) (Figure 6A). In addition, using an LDA score threshold of ≥ 4.0 as the criterion, we identified biomarkers of bacterial communities across different treatments (Figure 6B). Among the bacterial communities in DSCK, the top three were from the f_Alphaproteobacteria, p_Actinobacteriota, and f_Thermoleophilia. In DRCK, the predominant bacterial communities included p_Chloroflexi, o_SBR1031, and o_Saccharimonadales. In DS, only o_Burkholderiales within the bacterial community met this criterion. Conversely, in DR, the leading groups comprised c_Gammaproteobacteria , c_Bacteroidia, and p_Bacteroidota (Figure S2A).
The results of LEfSe analysis of fungi indicated that, compared to bacteria, the number of enriched taxa in each treatment except DSCK increased significantly. Specifically, DRCK exhibited enrichment in one phylum (Basidiomycota), four classes, five orders, six families, and six genera. DS showed enrichment in one phylum (Ascomycota), two families, and two genera. Meanwhile, DR demonstrated enrichment in one class (Sordariomycetes), two orders, five families, and four genera (Figure 6B). Based on the criterion of LDA ≥ 3.5, biomarkers of fungal groups under different soil carbon levels were determined. The top three biomarkers identified in DRCK were p_Basidiomycota, o_Eurotiales, and c_Eurotiomycetes. In DSCK, only s_Mortierella_exigua met the criterion of having a score exceeding 3.5. In DS, the leading three biomarkers consisted of p_Ascomycota, f_Nectriaceae, and g_Fusarium. Meanwhile, in DR, the primary biomarkers included c_Sordariomycetes, o_Hypocreales, and g_Penicillium (Figure S2B).
2.3. Functional Classification of Rhizosphere Microbial Communities
The phenotypic classification prediction of rhizosphere soil communities was carried out using BugBase. The results showed that the proportion of Gram - negative (Gram_Negative) bacteria in the treatment groups (DS- 19.7% & DR- 20.0%) was slightly higher than control groups (DSCK- 18.1% & DRCK- 18.3%). In contrast, the proportion of Gram - positive (Gram_Positive) bacteria showed substantial decrease in the treatment groups. Specifically, the proportion in DS decreased by 31.7% compared to DSCK, and the proportion in DR decreased by 39.1% compared to DRCK. Forms_Biofilms and the Contains_Mobile_Elements exhibited lower abundances in the treatment groups, with the lowest values attained in the DR group. This implies that drought treatments (particularly in the DR treatment) may have suppressed certain population behaviors and genetic mobility of microorganisms. The stress - tolerant (Stress_Tolerant) phenotype was 3.5% in the DS treatment group and reached the maximum value of 4.0% in the DR treatment group. The values in both treatment groups were significantly higher than DRCK control group (2.6%) and the DSCK control group (2.7%). Moreover, the potentially pathogenic (Potentially_Pathogenic) trait also exhibited an increasing trend in the treatment groups. This suggests that under drought stress, the root system might have selected microbial taxa with greater competitive potential (Figure 7A).
The fungal functional prediction results based on the FUNGuild database revealed that different treatments significantly modified the functional structure of the fungal community. As the most preponderant functional group, Undefined Saprotroph exhibited a significantly lower relative abundance in the treatment groups (DS- 54.0% & DR- 41.5%) than control groups (DSCK- 76.2% & DRCK- 44.9%). Conversely, the functional abundance of plant pathogen increased substantially in the treatment groups. The abundances in the DS (25.4%) and DR (22.9%) groups were considerably higher than corresponding control groups (DSCK- 8.4%; & DRCK- 20.3%). Notably, Mycorrhizal fungi showed a remarkable enrichment in the DR group (10.2%), while their abundances were nearly negligible in the other groups (<0.1%). This represents one of the most unique functional features of the DR treatment (Figure 7B).
2.4. Correlation Analysis of Soil Characteristics and Microbial Community Structure and Co-Occurrence Network Analysis of Rhizosphere Microorganisms
The correlation analysis was performed between the top ten enriched microorganisms at the bacterial genus level and soil characteristics. The results revealed that, among the soil characteristic indicators, ACP and other indicators could be distinctly classified into two groups, while the microorganisms were grouped into three categories. Specifically, unclassified_Vicinamibacterales, unclassified_Chloroflexi, and unclassified_SBR1031 exhibited significant positive correlations with multiple environmental factors. In contrast, Gaiella, Pseudolabrys, and unclassified_Gemmatimonadaceae showed negative correlations with the majority of environmental factors. Sphingomonas and unclassified_Vicinamibacteraceae demonstrated moderate degree of environmental responsiveness. Meanwhile, uncultured_gamma_proteobacterium and unclassified_Bacteria indicated relatively weak environmental correlations (Figure 7C). There are obvious differences in the responses of different bacterial groups to environmental factors, and such differences may reflect the intrinsic driving forces of the changes in microbial community structure among various treatment groups.
Among the fungi, Fusarium and Trichoderma were significantly negatively correlated with key environmental factors, while Thermomyces and unclassified_Sordariomycetes were significantly positively correlated with most environmental factors (Figure 7D). This result was highly consistent with the variation characteristics of the fungal community structure among the different treatment groups.
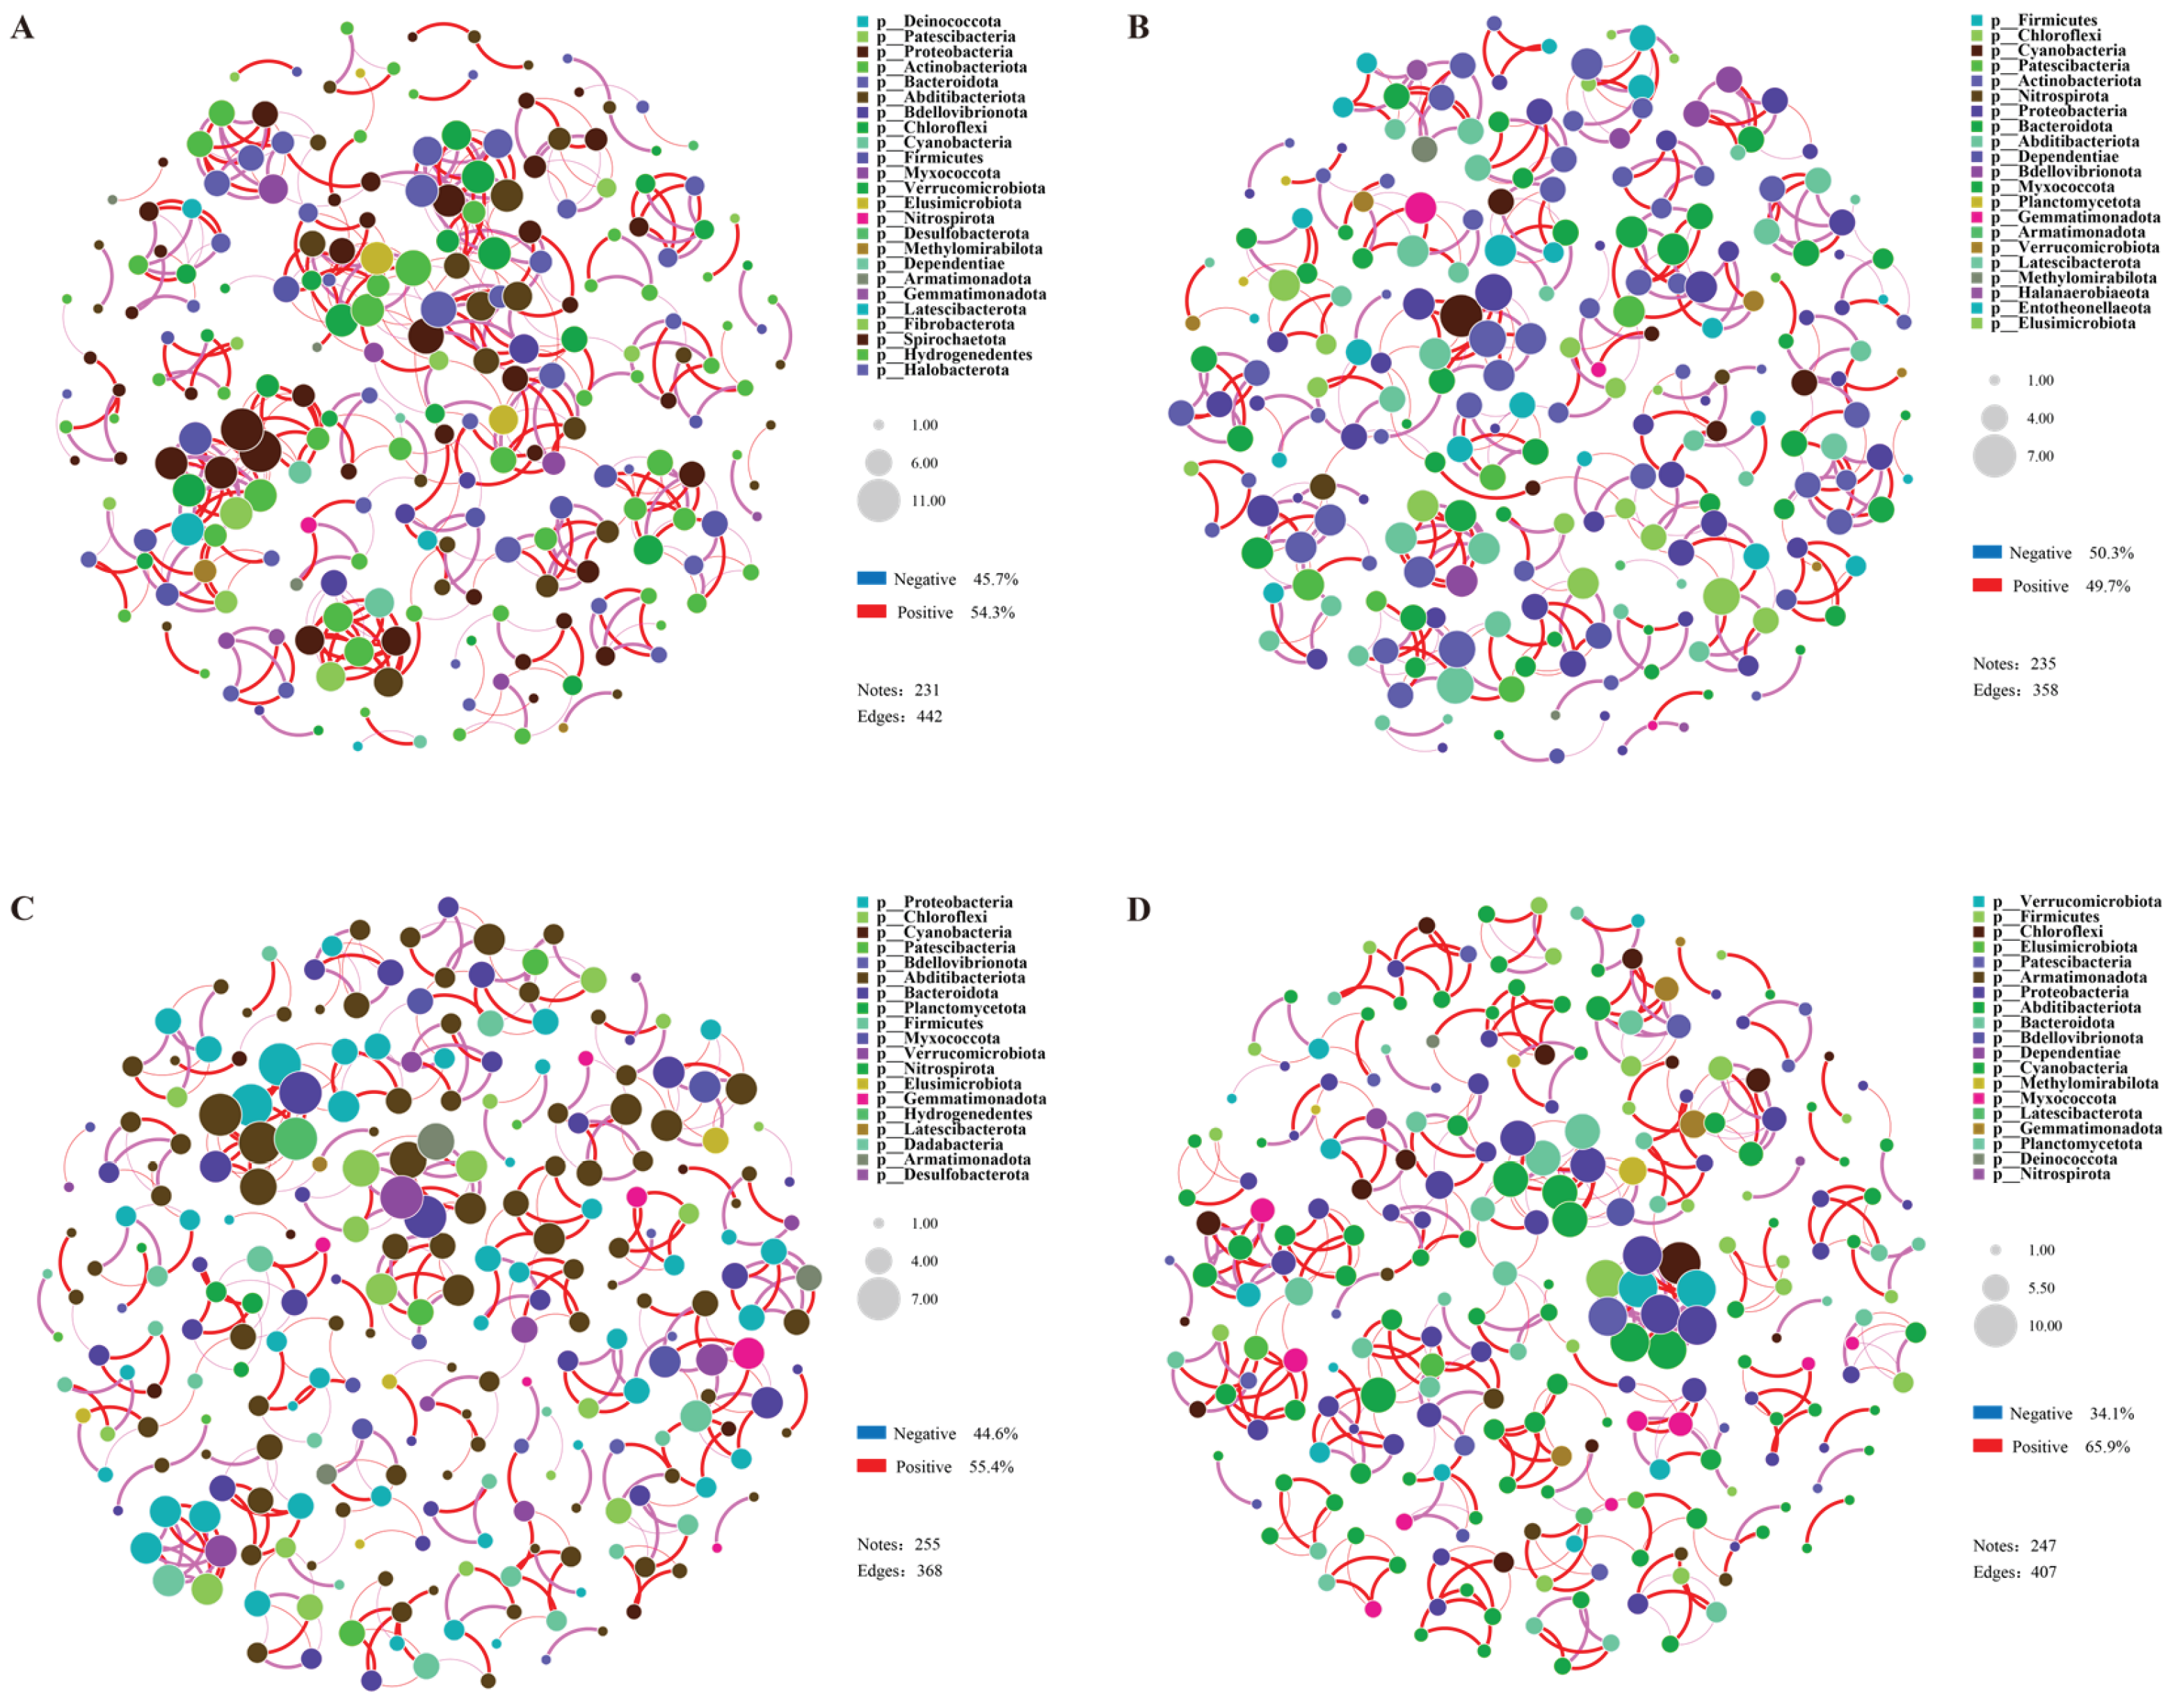
Selected top 80 OTUs to conduct a co-linearity network analysis, aiming to explore the interactions among rhizosphere microorganisms of the drought tolerant variety (DR) and the drought sensitive variety (DS) under drought stress. Overall, the number of nodes in the bacterial networks of the two treatments in DR was lower than two treatments of DS, while the opposite pattern was observed for fungi. Meanwhile, the number of edges and the density of correlation networks of bacteria in the two citrus varieties were significantly higher than fungi, indicating that the network structure of bacteria in the rhizosphere soil was more complex than fungi. In the comparison between the drought treatment and CK control group, the bacterial network of material DR under drought treatment was relatively more compact than DRCK, with the number of edges increasing by 23.5%, the proportion of positive correlations between bacterial OTUs increasing from 49.7 to 54.3%, and the proportion of negative correlations decreasing from 50.3 to 45.7% (Figure 8A, B). Similar to bacteria, the number of edges of fungi increased by 89.6%, and the number of nodes increased from 41 to 65, but its impact on the proportion of correlations among units was not significant (Figure 2SA, B). In the two treatments of DS, the fungal networks were loose, with the number of edges and nodes being less than corresponding treatments of DR. Different from DR, under the drought treatment, the bacterial network of DS was more loose compared to DSCK. Despite having a greater number of nodes (DS- 255 & DSCK- 247), the number of edges decreased from 407 in DSCK to 368 in the drought treated DS (Figure 8C, D). The proportion of positive correlations among bacterial OTUs decreased from 65.4 to 55.4%, and the proportion of negative correlations increased from 34.1 to 44.6% (Figure S3C, D). The results indicated that the complexity and variation patterns of the rhizosphere microbial networks of the two citrus materials under drought stress were significantly different, which might be closely related to the differences in their drought resistance.
3. Discussion
3.1. The Growth and Rhizosphere Microenvironment of Citrus With Different Genotypes Under Drought Stress
The seedling stage of plants serves as the basis for the physiological development of plants and intricately associated with the formation of crop yields. Nevertheless, a variety of abiotic stresses can undermine the normal growth of plants during the early growth phase, exerting persistent impacts and ultimately resulting in reduction in the final crop yield [28]. Our study clearly demonstrates distinct differences in the physiological growth of drought-susceptible (DS) and drought-tolerant (DR) citrus genotypes under drought stress condition. Specifically, DR exhibits significantly greater root length and shoot height compared to DS. In contrast, the biomass of DS is markedly reduced. Simultaneously, when comparing these genotypes with their respective well-watered control groups after the application of drought stress, plant growth status and substance accumulation showed significant decline. This observation indicates that low water potential under drought conditions diminishes the nutrient absorption capacity of roots. Consequently, this leads to retarded growth and development in citrus seedlings. Furthermore, the intrinsic relationship between substance synthesis and consumption within the plant becomes disrupted, resulting in the reduction of plant biomass [29]. It is evident that DR is significantly less affected by drought factors than DS. Notably, regarding the dry weight index for DR, the rate of decline exceeds that observed for DS (with DS exhibiting 60.8% decrease while DR shows 65% decrease). This phenomenon may be attributed to more extensive root growth experienced by DR under drought stress, which necessitates higher energy consumption during its initial stages [30].
Compared with DR, the deterioration of rhizosphere soil conditions in DS is more severe. This coordinated decline includes the reduction in nutrient availability (AK, AP, AN, SOC), decrease in microbial biomass (MBC, MBN, MBP), and significant inhibition of key enzyme activities (catalase and urease). This finding is consistent with previous observations that drought-sensitive plants tend to exacerbate the deterioration of their rhizosphere environment [31]. This consistent response strongly indicates that the susceptibility of drought-sensitive plants is a syndrome involving the plants themselves and their associated rhizosphere systems [32]. Meanwhile, even under water-sufficient conditions, the inherent advantages of DR varieties are reflected in the higher initial soil enzyme activities in DRCK. This further underscores the role of plant genotypes in pre - determining the rhizosphere micro - environment, potentially enabling plants and their associated microorganisms to be better adapted to stress [33].
3.2. Drought - Induced Reorganization of Root Microbial Communities in Citrus with Different Genotypes
The structural and functional adaptations of microbial communities to drought are reliant on soil type, tillage regime, and plant variety [34,35]. In this study, although drought stress did not significantly change the richness of bacteria, it substantially reshaped the structure and evenness of bacterial and fungal communities. The distinct separation in the principal coordinates analysis (PCoA) plots confirmed that water deficit serves as a major driving force for microbial community assembly. Under drought stress, the fungal community showed higher sensitivity than bacterial community (with more significant changes in the Chao1 index), which is contrary to the general belief that fungi have stronger drought tolerance but more difficult to recover than bacteria [36,37]. This might be due to the fact that certain groups of ascomycetes can form symbiotic relationships with plants under short-term drought stress, and their relative abundance increases rapidly (Figure 5C). In previous studies, Fusarium was found to be more enriched as the severity of drought increased [38,39], which is similar to our results. In contrast, Basidiomycota significantly decreased with the intensification of drought. In wheat, its abundance was higher under moderate drought than severe drought [40], which to some extent indicates that the DR rhizosphere environment was less affected by drought under the same treatment (the relative abundance of Basidiomycota was 34.6% higher in DR than DS).
The LEfSe analysis identified Penicillium and Trichoderma (order Hypocreales) as key biomarkers for the DR rhizosphere under drought. These genera are well-documented biocontrol agents and plant growth promoters. Trichoderma species, for instance, can enhance plant drought tolerance by inducing systemic resistance and improving root growth [41,42,43]. Interestingly, mycorrhizal fungi were significantly and abundantly enriched only in the drought recovery treatment, and mycorrhizal fungi are widely recognized for their important role in enhancing plant drought resistance [44,45,46]. Although their functional significance in citrus requires further study, this indicates highly specific plant-fungal interactions. This suggests that the DR genotype actively forges mutualistic alliances under drought, potentially enhancing water and nutrient acquisition. This strategic recruitment of beneficial fungi by the DR variety contrasts with the passive microbial shifts in the DS variety, underscoring the host-genotype-dependent mediation of the stress response.
In terms of bacteria, the content of Bacteroidetes and Patescibacteria in DR rhizosphere soil has increased. Different members of these phyla are fast-growing bacteria that thrive in nutrient-rich environments, such as the rhizosphere and can promote nutrient cycling, collaborating with other species to enhance the drought resistance of crops [47,48,49]. This selective enrichment further demonstrates that the drought-tolerant plant genotype does not merely resist microbial change but actively shapes the functionally beneficial consortium under stress.
3.3. Functional shifts in the microbiome: From pathogen enrichment to strategic adaptation
The functional predictions reveal a complex picture of microbial strategy under drought. The increase in "Potentially Pathogenic" and "Stress Tolerant" bacterial phenotypes in treatments indicates the general shift towards more competitive and resilient microbiome, a typical response to drought stress [50,51,52]. Under drought stress, the phenotypes of "forming biofilms" and "containing mobile genetic elements" were reduced, which is consistent with the findings of previous studies [53].
The fungal functional profile provides deeper insights. The universal decline in "Undefined Saprotrophs" and the surge in "Plant Pathogen" abundance align with the taxonomic rise of Fusarium. However, the DR variety uniquely counterbalanced this risk by significantly enriching for "Mycorrhizal" fungi (Figure 7). This strategic functional shift suggests that the DR genotype fosters mutualistic relationships to enhance nutrient acquisition, thereby offsetting the negative impacts of the pathogen-enriched community. This functional redundancy or synergy between pathogenic and mutualistic guilds may be crucial for maintaining ecosystem functionality and plant fitness under stress. The DR variety’s microbiome appears to be functionally more robust, capable of balancing competing demands suppressing the negative effects of pathogens while enhancing beneficial processes.
3.4. Correlation Analysis and Network Complexity Reveal the Mechanisms of Different Drought Resistances
The positive correlations between key bacterial groups, such as Vicinamibacterales、Chloroflexi and SBR1031 soil enzymes and nutrients highlight their indispensable role as integral components in the nutrient cycling mechanism [54,55,56,57], which is more tightly coupled within the DR rhizosphere.
The co-occurrence network analysis offers the systems-level perspective on microbial interactions. The more complex, stable, and cooperative bacterial network in the DR variety under drought (increased edges and higher proportion of positive correlations) is a hallmark of resilient microbial community. In contrast, the simpler, more fragmented network in DS, with an increase in negative correlations, suggests community under intense competitive pressure and ecological instability. This stark contrast implies that the drought-tolerant plant genotype fosters more interconnected and synergistic root-associated microbiome. A robust microbial network likely enhances the functional stability of the rhizosphere, facilitating better nutrient cycling and stress protection, which collectively contributes to the superior drought tolerance of the DR citrus variety. The stability of the microbial network itself may be the critical factor, often overlooked in favor of taxonomic composition, that underpins the plant's ability to withstand drought.
4. Materials and Methods
4.1. Cultivar Selection and Field Experiment Design
This experiment was conducted in the greenhouse of Chongqing Three Gorges Vocational College, Wanzhou District, Chongqing, China from April to July 2023. A drought-sensitive citrus material (GN-1, a bud mutation of Eureka 38, from Gan Ning in Chongqing) that was previously screened and selected, and drought-tolerant Wanzhou Red Tangerine plants collected from the Wanzhou Red Tangerine germplasm resource garden of Chongqing Three Gorges Vocational College were chosen as experimental materials and named DS and DR respectively in this experiment. Sufficient seeds were obtained by collecting the fruits of the two citrus materials. After germination in an artificial climate chamber, they were sown in the planting pools in the greenhouse. The same management measures were adopted for their cultivation. After 45 days, healthy seedlings of similar size and consistent growth conditions were selected and transplanted into flowerpots with a diameter of 50 cm and height of 40 cm, keeping the original soil attached to the roots. The flowerpots were filled with the same amount of soil. A total of 40 pots were prepared, with 20 pots for each material. Each pot contained 3 citrus plants. After 5 days of acclimatization, 10 pots from each material were selected for subsequent drought treatment (DS and DR), while the remaining 20 pots were watered normally and named DSCK and DRCK, respectively. Irrigation was carried out based on the weekly water requirement of citrus. During the initial planting period, the control plants were watered regularly and continuously. For drought treatment, drought stress was induced by controlling irrigation, and the soil moisture content was measured using the TDR-100 soil moisture meter (Spectrum Technologies, Aurora, Illinois, USA).
4.2. Measurement of Soil Chemical Properties and Determination of Soil Enzyme Activities
At the end of the drought stress duration (day 20), plants with consistent growth conditions were selected from each group. From each of the four treatments, three plants from three pots were taken. The root systems were dug out along with the surrounding soil, and large soil clumps and stones were removed. Loose soil was gently shaken off, and the rhizosphere soil adhering to the root surface was collected with a brush. Subsequently, these samples were passed through a 2 mm sieve and thoroughly mixed, resulting in 12 independent soil samples (n = 12). Each soil sample was divided into two parts, placed in self-sealing bags, and then transported in a sample box with ice packs at low temperature to the laboratory. Upon arrival at the laboratory, one part was stored in at 4℃ refrigerator for subsequent analysis of soil enzyme activity, microbial biomass, carbon and nitrogen content, and available nutrient content. The other part was stored in -80 ℃ refrigerator for microbial community structure analysis.
Soil organic carbon (SOC) was determined by the K2Cr2O7 wet oxidation method [58]. Soil available nitrogen (AN) was measured by the Kjeldahl method. Available phosphorus (AP) was determined by the molybdenum-antimony-antimony colorimetric procedure. Available potassium (AK) was extracted with ammonium acetate and quantified by flame photometry. Microbial biomass nitrogen (MBN) was analyzed by the chloroform fumigation extraction method. Soil microbial biomass carbon (MBC) content was determined by the K2Cr2O7-H2SO4 external heating method. Soil microbial biomass phosphorus (MBP) was measured by the fumigation extraction method combined with colorimetry [59].
Catalase (CAT) and urease (UE) were determined by potassium permanganate titration and sodium phenolate-sodium hypochlorite colorimetry. Alkaline phosphatase and sucrose were detected by sodium phenyl phosphate colorimetry and 3,5-dinitrosalicylic acid colorimetry.
4.3. Soil Microbial DNA Extraction and High-Throughput Sequencing
Total genomic DNA was extracted from soil samples using the TGuideS96 Magnetic Soil/Stool DNA Kit (Tiangen Biotech Co., Ltd., Beijing, China) in accordance with the manufacturer's instructions. The hypervariable region V3-V4 of the bacterial 16S rRNA gene was amplified using primer pairs, specifically 338F: 5′-ACTCCTACGGGAGGCAGCA-3′ and 806R: 5′-GGACTACHVGGGTWTCTAAT-3′. The PCR products were assessed via agarose gel electrophoresis and subsequently purified utilizing the Omega DNA Purification Kit (Omega Inc., Norcross, GA, USA). The purified PCR products were collected, and paired-end sequencing (2 × 250 bp) was performed on the Illumina NovaSeq 6000 platform. The Internal Transcribed Spacer (ITS) variable regions of fungi were amplified using primers ITS1FI2 (5’-GTGARTCATCGAATCTTTG-3′) and ITS2 (5’-TCCTCCGCTTATTGATATGC-3′). The ITS region, situated between the small subunit (SSU) and large subunit (LSU) ribosomal RNA genes, exhibits high variability and commonly employed for fungal identification as well as phylogenetic analysis. The amplification procedure and conditions mirrored those utilized for the amplification of 16S rDNA. The resulting amplified products underwent high-throughput sequencing on the Illumina HiSeq 2500 PE250 second-generation sequencing platform. Sequencing services were provided by Beijing Biomarker Biotechnology Co., Ltd., China.
4.4. Bioinformatic Analysis
The operational taxonomic units (OTUs) with similarity threshold of 97% were clustered using UPARSE (version 10.0), and chimeric sequences were identified and removed [60]. The classification of each representative OTU sequence was analyzed against the 16S rRNA database Silva v138 using RDA Classifier, and compared against the ITS database through UNITE with confidence threshold of 0.7. α-diversity analysis was conducted using QIIME2 (V1.9.1) software to determine the species diversity and complexity of each sample [61]. β-diversity was calculated based on the Bray-Curtis distance algorithm using principal coordinate analysis (PCoA) to assess species complexity. One-way analysis of variance (ANOVA) was used to compare bacterial abundance and diversity. Linear discriminant analysis (LDA) combined with effect size (LEfSe) was applied to evaluate the differentially abundant taxa. All the analysis was conducted based on R software (version 4.1.3).
5. Conclusions
In conclusion, this study establishes that the drought sensitivity of citrus cultivars fundamentally shapes the response of their rhizosphere microbiome. The tolerant genotype modulates its associated microbial community towards more cooperative, functionally redundant, and resilient state, which in turn supports plant performance under water deficit condition. These findings highlight the critical role of host-mediated microbiome assembly in plant stress adaptation and provide scientific basis for developing microbiome-based strategies, such as the use of specific microbial consortia, to enhance crop drought tolerance.
Supplementary Materials
The following supporting information can be downloaded at the website of this paper posted on Preprints.org. Figure S1. Characteristics of rhizosphere soil chemical properties of two citrus varieties with different drought tolerance under drought treatments. MBC: microbial biomass carbon, MBP: microbial biomass phosphorus, MBN:microbial biomass nitrogen. The meanings of the asterisks (*) in the figure are as follows: *, P < 0.05; **, P < 0.01; ***, P < 0.001. Figure S2. A bar chart of biomarkers of bacterial (A) and fungal (B) taxonomic groups. Note: The red, blue and green dots represent significantly enriched bacteria and fungi respectively. In bacteria, the LDA value is ≥ 4, and in fungi, the LDA value is ≥ 3.5. Figure S3. Network diagrams of rhizosphere soil fungi under each treatment (A) DR (B) DRCK (C) DS (D) DSCK. Note: The size of the nodes in the figure represents species abundance, and different colors represent different species. The color of the connecting lines represents positive and negative correlations: red lines indicate significant positive correlations, and blue lines indicate significant negative correlations. The thickness of the lines represents the magnitude of the correlation coefficient, and Pearson correlation analysis was used. The default value of the correlation coefficient in the figure is p < 0.01. The number of lines indicates the closeness between nodes.
Author Contributions
Conceptualization, Y.T. and Y.L.; methodology, Y.L.; resources, Q.W.; data curation, J.C.; writing—original draft preparation, Y.T.; writing—review and editing, Y.L, K.Z., C.Y.; visualization, M.Y.; funding acquisition, Y.L., and K.Z. All authors have read and agreed to the published version of the manuscript.
Funding
This research was funded by the Project of the Science and Technology Research of Chongqing Municipal Education Commission (KJQN202303518), Research Initiation Project for Doctor Recruitment of Chongqing Three Gorges Vocational College (sxzybs-202201), and National Natural Science Foundation of China (32201766).
Institutional Review Board Statement
Not applicable.
Informed Consent Statement
Not applicable.
Data Availability Statement
Data are contained within the article and Supplementary Materials.
Acknowledgments
We would like to express our gratitude to the cnsknowall mapping platform for the assistance it provided during the visualization of some data.
Conflicts of Interest
The authors declare no conflicts of interest.
References
- Liu, X.; Zhu, X.; Pan, Y.; Li, S.; Liu, Y.; Ma, Y. Agricultural Drought Monitoring: Progress, Challenges, and Prospects. J. Geogr. Sci. 2016, 26, 750–767. [Google Scholar] [CrossRef]
- Gupta, A.; Rico-Medina, A.; Caño-Delgado, A.I. The Physiology of Plant Responses to Drought. Science 2020, 368, 266–269. [Google Scholar] [CrossRef] [PubMed]
- Ali, S.; Tyagi, A.; Park, S.; Mir, R.A.; Mushtaq, M.; Bhat, B.; Mahmoudi, H.; Bae, H. Deciphering the Plant Microbiome to Improve Drought Tolerance: Mechanisms and Perspectives. Environmental and Experimental Botany 2022, 201, 104933. [Google Scholar] [CrossRef]
- Qiao, M.; Hong, C.; Jiao, Y.; Hou, S.; Gao, H. Impacts of Drought on Photosynthesis in Major Food Crops and the Related Mechanisms of Plant Responses to Drought. Plants 2024, 13, 1808. [Google Scholar] [CrossRef] [PubMed]
- Yang, X.; Lu, M.; Wang, Y.; Wang, Y.; Liu, Z.; Chen, S. Response Mechanism of Plants to Drought Stress. Horticulturae 2021, 7, 50. [Google Scholar] [CrossRef]
- Ghosh, U.K.; Islam, M.N.; Siddiqui, M.N.; Cao, X.; Khan, M.A.R. Proline, a Multifaceted Signalling Molecule in Plant Responses to Abiotic Stress: Understanding the Physiological Mechanisms. Plant Biol J 2022, 24, 227–239. [Google Scholar] [CrossRef]
- Ge, J.; Li, D.; Ding, J.; Xiao, X.; Liang, Y. Microbial Coexistence in the Rhizosphere and the Promotion of Plant Stress Resistance: A Review. Environmental Research 2023, 222, 115298. [Google Scholar] [CrossRef]
- Li, Y.; Zhang, K.; Chen, J.; Zhang, L.; Feng, F.; Cheng, J.; Ma, L.; Li, M.; Wang, Y.; Jiang, W.; et al. Rhizosphere Bacteria Help to Compensate for Pesticide-Induced Stress in Plants. Environ. Sci. Technol. 2024, 58, 12542–12553. [Google Scholar] [CrossRef]
- Khan, N.; Ali, S.; Shahid, M.A.; Mustafa, A.; Sayyed, R.Z.; Curá, J.A. Insights into the Interactions among Roots, Rhizosphere, and Rhizobacteria for Improving Plant Growth and Tolerance to Abiotic Stresses: A Review. Cells 2021, 10, 1551. [Google Scholar] [CrossRef]
- Dilla-Ermita, C.J.; Lewis, R.W.; Sullivan, T.S.; Hulbert, S.H. Wheat Genotype-Specific Recruitment of Rhizosphere Bacterial Microbiota under Controlled Environments. Frontiers in plant science 2021, 12, 718264. [Google Scholar] [CrossRef]
- Xiong, J.; Lu, J.; Li, X.; Qiu, Q.; Chen, J.; Yan, C. Effect of Rice (Oryza Sativa L.) Genotype on Yield: Evidence from Recruiting Spatially Consistent Rhizosphere Microbiome. Soil Biology and Biochemistry 2021, 161, 108395. [Google Scholar] [CrossRef]
- Lazcano, C.; Boyd, E.; Holmes, G.; Hewavitharana, S.; Pasulka, A.; Ivors, K. The Rhizosphere Microbiome Plays a Role in the Resistance to Soil-Borne Pathogens and Nutrient Uptake of Strawberry Cultivars under Field Conditions. Scientific Reports 2021, 11, 3188. [Google Scholar] [CrossRef] [PubMed]
- Wei, F.; Feng, Z.; Yang, C.; Zhao, L.; Zhang, Y.; Zhou, J.; Feng, H.; Zhu, H.; Xu, X. Genetic Control of Rhizosphere Microbiome of the Cotton Plants under Field Conditions. Appl Microbiol Biotechnol 2024, 108, 371. [Google Scholar] [CrossRef]
- Lastochkina, O.V. Adaptation and Tolerance of Wheat Plants to Drought Mediated by Natural Growth Regulators Bacillus Spp.: Mechanisms and Practical Importance. Agric. Biol 2021, 56, 843–867. [Google Scholar] [CrossRef]
- Khan, A.; Singh, A.V. Multifarious Effect of ACC Deaminase and EPS Producing Pseudomonas Sp. and Serratia Marcescens to Augment Drought Stress Tolerance and Nutrient Status of Wheat. World J Microbiol Biotechnol 2021, 37, 198. [Google Scholar] [CrossRef]
- Sharma, P.; Vishvakarma, R.; Gautam, K.; Vimal, A.; Gaur, V.K.; Farooqui, A.; Varjani, S.; Younis, K. Valorization of Citrus Peel Waste for the Sustainable Production of Value-Added Products. Bioresource technology 2022, 351, 127064. [Google Scholar] [CrossRef]
- Ziogas, V.; Tanou, G.; Morianou, G.; Kourgialas, N. Drought and Salinity in Citriculture: Optimal Practices to Alleviate Salinity and Water Stress. Agronomy 2021, 11, 1283. [Google Scholar] [CrossRef]
- Khan, F.S.; Gan, Z.-M.; Li, E.-Q.; Ren, M.-K.; Hu, C.-G.; Zhang, J.-Z. Transcriptomic and Physiological Analysis Reveals Interplay between Salicylic Acid and Drought Stress in Citrus Tree Floral Initiation. Planta 2022, 255, 24. [Google Scholar] [CrossRef] [PubMed]
- Khan, M.A.; Liu, D.-H.; Alam, S.M.; Zaman, F.; Luo, Y.; Han, H.; Ateeq, M.; Liu, Y.-Z. Molecular Physiology for the Increase of Soluble Sugar Accumulation in Citrus Fruits under Drought Stress. Plant Physiology and Biochemistry 2023, 203, 108056. [Google Scholar] [CrossRef]
- Xu, Y.; Zeng, R.; Zhou, H.; Qiu, M.; Gan, Z.; Yang, Y.; Hu, S.; Zhou, J.; Hu, C.; Zhang, J. Citrus FRIGIDA Cooperates with Its Interaction Partner Dehydrin to Regulate Drought Tolerance. The Plant Journal 2022, 111, 164–182. [Google Scholar] [CrossRef] [PubMed]
- Shafqat, W.; Jaskani, M.J.; Maqbool, R.; Chattha, W.S.; Ali, Z.; Naqvi, S.A.; Haider, M.S.; Khan, I.A.; Vincent, C.I. Heat Shock Protein and Aquaporin Expression Enhance Water Conserving Behavior of Citrus under Water Deficits and High Temperature Conditions. Environmental and Experimental Botany 2021, 181, 104270. [Google Scholar] [CrossRef]
- Devin, S.R.; Prudencio, Á.S.; Mahdavi, S.M.E.; Rubio, M.; Martínez-García, P.J.; Martínez-Gómez, P. Orchard Management and Incorporation of Biochemical and Molecular Strategies for Improving Drought Tolerance in Fruit Tree Crops. Plants 2023, 12, 773. [Google Scholar] [CrossRef]
- Liu, X.; Gao, T.; Liu, C.; Mao, K.; Gong, X.; Li, C.; Ma, F. Fruit Crops Combating Drought: Physiological Responses and Regulatory Pathways. Plant Physiology 2023, 192, 1768–1784. [Google Scholar] [CrossRef]
- Liu, Y.; Teng, Y.; Zheng, J.; Khan, A.K.; Li, X.; Cui, J.; Verma, K.K.; Guo, Q.; Zhu, K. The Impact of Long-Term Mulching Cultivation on Soil Quality, Microbial Community Structure, and Fruit Quality in" Wanzhou Red Mandarin" Citrus Orchard. Frontiers in Microbiology 2025, 16, 1616151. [Google Scholar] [CrossRef] [PubMed]
- Olmos-Ruiz, R.; Hurtado-Navarro, M.; Pascual, J.A.; Carvajal, M. Mulching Techniques Impact on Soil Chemical and Biological Characteristics Affecting Physiology of Lemon Trees. Plant Soil 2025, 509, 809–831. [Google Scholar] [CrossRef]
- Cheng, H.-Q.; Giri, B.; Wu, Q.-S.; Zou, Y.-N.; Kuča, K. Arbuscular Mycorrhizal Fungi Mitigate Drought Stress in Citrus by Modulating Root Microenvironment. Archives of Agronomy and Soil Science 2022, 68, 1217–1228. [Google Scholar] [CrossRef]
- Zhou, L.-J.; Wang, Y.; Alqahtani, M.D.; Wu, Q.-S. Positive Changes in Fruit Quality, Leaf Antioxidant Defense System, and Soil Fertility of Beni-Madonna Tangor Citrus (Citrus Nanko\times C. Amakusa) after Field AMF Inoculation. Horticulturae 2023, 9, 1324. [Google Scholar] [CrossRef]
- Gupta, A.; Rico-Medina, A.; Caño-Delgado, A.I. The Physiology of Plant Responses to Drought. Science 2020, 368, 266–269. [Google Scholar] [CrossRef] [PubMed]
- Seleiman, M.F.; Al-Suhaibani, N.; Ali, N.; Akmal, M.; Alotaibi, M.; Refay, Y.; Dindaroglu, T.; Abdul-Wajid, H.H.; Battaglia, M.L. Drought Stress Impacts on Plants and Different Approaches to Alleviate Its Adverse Effects. Plants 2021, 10, 259. [Google Scholar] [CrossRef]
- Ranjan, A.; Sinha, R.; Singla-Pareek, S.L.; Pareek, A.; Singh, A.K. Shaping the Root System Architecture in Plants for Adaptation to Drought Stress. Physiologia Plantarum 2022, 174, e13651. [Google Scholar] [CrossRef]
- Bakhshandeh, S.; Corneo, P.E.; Yin, L.; Dijkstra, F.A. Drought and Heat Stress Reduce Yield and Alter Carbon Rhizodeposition of Different Wheat Genotypes. J Agronomy Crop Science 2019, 205, 157–167. [Google Scholar] [CrossRef]
- Fang, J.; Ma, J.; Wen, T.; Niu, G.; Wei, S.; Su, S.; Yi, L.; Cheng, Y.; Yuan, J.; Zhao, X. Cry for Help from Rhizosphere Microbiomes and Self-Rescue Strategies Cooperatively Alleviate Drought Stress in Spring Wheat. Soil Biology and Biochemistry 2025, 206, 109813. [Google Scholar] [CrossRef]
- Prudent, M.; Dequiedt, S.; Sorin, C.; Girodet, S.; Nowak, V.; Duc, G.; Salon, C.; Maron, P. The Diversity of Soil Microbial Communities Matters When Legumes Face Drought. Plant Cell & Environment 2020, 43, 1023–1035. [Google Scholar] [CrossRef]
- Bogati, K.; Walczak, M. The Impact of Drought Stress on Soil Microbial Community, Enzyme Activities and Plants. Agronomy 2022, 12, 189. [Google Scholar] [CrossRef]
- Breitkreuz, C.; Herzig, L.; Buscot, F.; Reitz, T.; Tarkka, M. Interactions between Soil Properties, Agricultural Management and Cultivar Type Drive Structural and Functional Adaptations of the Wheat Rhizosphere Microbiome to Drought. Environmental Microbiology 2021, 23, 5866–5882. [Google Scholar] [CrossRef]
- Gao, C.; Xu, L.; Montoya, L.; Madera, M.; Hollingsworth, J.; Chen, L.; Purdom, E.; Singan, V.; Vogel, J.; Hutmacher, R.B. Co-Occurrence Networks Reveal More Complexity than Community Composition in Resistance and Resilience of Microbial Communities. Nature communications 2022, 13, 3867. [Google Scholar] [CrossRef] [PubMed]
- Canarini, A.; Fuchslueger, L.; Schnecker, J.; Metze, D.; Nelson, D.B.; Kahmen, A.; Watzka, M.; Pötsch, E.M.; Schaumberger, A.; Bahn, M. Soil Fungi Remain Active and Invest in Storage Compounds during Drought Independent of Future Climate Conditions. Nature Communications 2024, 15, 10410. [Google Scholar] [CrossRef] [PubMed]
- Pierre, E.; Fabiola, Y.N.; Vanessa, N.D.; Tobias, E.B.; Marie-Claire, T.; Diane, Y.Y.; Gilbert, G.T.; Louise, N.W.; Fabrice, F.B. The Co-Occurrence of Drought and Fusarium Solani f. Sp. Phaseoli Fs4 Infection Exacerbates the Fusarium Root Rot Symptoms in Common Bean (Phaseolus Vulgaris L.). Physiological and Molecular Plant Pathology 2023, 127, 102108. [Google Scholar] [CrossRef]
- Sinha, R.; Irulappan, V.; Mohan-Raju, B.; Suganthi, A.; Senthil-Kumar, M. Impact of Drought Stress on Simultaneously Occurring Pathogen Infection in Field-Grown Chickpea. Scientific Reports 2019, 9, 5577. [Google Scholar] [CrossRef]
- Xiang, Q.; Yang, K.; Cui, L.; Sun, A.-Q.; Lu, C.-Y.; Gao, J.-Q.; Hao, Y.-L.; Ma, B.; Hu, H.-W.; Singh, B.K. Global Exploration of Drought-Tolerant Bacteria in the Wheat Rhizosphere Reveals Microbiota Shifts and Functional Taxa Enhancing Plant Resilience. Nature Food 2025, 1–14. [Google Scholar] [CrossRef]
- Scudeletti, D.; Crusciol, C.A.C.; Bossolani, J.W.; Moretti, L.G.; Momesso, L.; Servaz Tubaña, B.; De Castro, S.G.Q.; De Oliveira, E.F.; Hungria, M. Trichoderma Asperellum Inoculation as a Tool for Attenuating Drought Stress in Sugarcane. Frontiers in Plant Science 2021, 12, 645542. [Google Scholar] [CrossRef]
- Bashyal, B.M.; Parmar, P.; Zaidi, N.W.; Aggarwal, R. Molecular Programming of Drought-Challenged Trichoderma Harzianum-Bioprimed Rice (Oryza Sativa L.). Frontiers in microbiology 2021, 12, 655165. [Google Scholar] [CrossRef]
- Singh, P.; Singh, R.; Madhu, G.S.; Singh, V.P. Seed Biopriming with Trichoderma Harzianum for Growth Promotion and Drought Tolerance in Rice (Oryza Sativus). Agric Res 2023, 12, 154–162. [Google Scholar] [CrossRef]
- Branco, S.; Schauster, A.; Liao, H.; Ruytinx, J. Mechanisms of Stress Tolerance and Their Effects on the Ecology and Evolution of Mycorrhizal Fungi. New Phytologist 2022, 235, 2158–2175. [Google Scholar] [CrossRef]
- Bunn, R.A.; Corrêa, A.; Joshi, J.; Kaiser, C.; Lekberg, Y.; Prescott, C.E.; Sala, A.; Karst, J. What Determines Transfer of Carbon from Plants to Mycorrhizal Fungi? New Phytologist 2024, 244, 1199–1215. [Google Scholar] [CrossRef]
- Frey, S.D. Mycorrhizal Fungi as Mediators of Soil Organic Matter Dynamics. Annu. Rev. Ecol. Evol. Syst. 2019, 50, 237–259. [Google Scholar] [CrossRef]
- Lu, K.; Chen, C.; Zhou, J.; Yuan, J.; Lu, M.; Qiu, J.; Xiao, Z.; Tan, X. Metagenomic and Metabolomic Profiling of Rhizosphere Microbiome Adaptation to Irrigation Gradients in Camellia Oil Trees. Industrial Crops and Products 2025, 232, 121250. [Google Scholar] [CrossRef]
- Veach, A.M.; Chen, H.; Yang, Z.K.; Labbe, A.D.; Engle, N.L.; Tschaplinski, T.J.; Schadt, C.W.; Cregger, M.A. Plant Hosts Modify Belowground Microbial Community Response to Extreme Drought. mSystems 2020, 5, 10.1128/msystems.00092-20. [Google Scholar] [CrossRef] [PubMed]
- Pan, X.; Raaijmakers, J.M.; Carrión, V.J. Importance of Bacteroidetes in Host–Microbe Interactions and Ecosystem Functioning. Trends in microbiology 2023, 31, 959–971. [Google Scholar] [CrossRef]
- Cambon, M.C.; Cartry, D.; Chancerel, E.; Ziegler, C.; Levionnois, S.; Coste, S.; Stahl, C.; Delzon, S.; Buée, M.; Burban, B.; et al. Drought Tolerance Traits in Neotropical Trees Correlate with the Composition of Phyllosphere Fungal Communities. Phytobiomes Journal 2023, 7, 244–258. [Google Scholar] [CrossRef]
- Gao, C.; Montoya, L.; Xu, L.; Madera, M.; Hollingsworth, J.; Purdom, E.; Singan, V.; Vogel, J.; Hutmacher, R.B.; Dahlberg, J.A. Fungal Community Assembly in Drought-Stressed Sorghum Shows Stochasticity, Selection, and Universal Ecological Dynamics. Nature Communications 2020, 11, 34. [Google Scholar] [CrossRef] [PubMed]
- Lin, T.; Tang, J.; Li, S.; Li, S.; Han, S.; Liu, Y.; Yang, C.; Chen, G.; Chen, L.; Zhu, T. Drought Stress-mediated Differences in Phyllosphere Microbiome and Associated Pathogen Resistance between Male and Female Poplars. The Plant Journal 2023, 115, 1100–1113. [Google Scholar] [CrossRef] [PubMed]
- Carezzano, M.E.; Paletti Rovey, M.F.; Cappellari, L. del R.; Gallarato, L.A.; Bogino, P.; Oliva, M. de las M.; Giordano, W. Biofilm-Forming Ability of Phytopathogenic Bacteria: A Review of Its Involvement in Plant Stress. Plants 2023, 12, 2207. [Google Scholar] [CrossRef]
- Liu, L.; Huang, X.; Zhang, J.; Cai, Z.; Jiang, K.; Chang, Y. Deciphering the Relative Importance of Soil and Plant Traits on the Development of Rhizosphere Microbial Communities. Soil Biology and Biochemistry 2020, 148, 107909. [Google Scholar] [CrossRef]
- Ji, Z.; Liu, Y.-Y.; Liu, F.-C.; Yao, Y.; Zhu, C.-Y.; Yi, X.-C.; Chen, B.; Xiao, G.-L. Effects of Drought Stress on Rhizosphere Soil Bacterial Community of Potato throughout the Reproductive Period. 2023.
- Maisnam, P.; Jeffries, T.C.; Szejgis, J.; Bristol, D.; Singh, B.K.; Eldridge, D.J.; Horn, S.; Chieppa, J.; Nielsen, U.N. Severe Prolonged Drought Favours Stress-Tolerant Microbes in Australian Drylands. Microb Ecol 2023, 86, 3097–3110. [Google Scholar] [CrossRef]
- Fang, J.; Liu, Z.; Deng, Y.; Song, B.; Adams, J.M. Key Microbial Taxa Play Essential Roles in Maintaining Soil Muti-Nutrient Cycling Following an Extreme Drought Event in Ecological Buffer Zones along the Yangtze River. Frontiers in plant science 2024, 15, 1460462. [Google Scholar] [CrossRef] [PubMed]
- Walinga, I.; Kithome, M.; Novozamsky, I.; Houba, V.J.G.; Van Der Lee, J.J. Spectrophotometric Determination of Organic Carbon in Soil. Communications in Soil Science and Plant Analysis 1992, 23, 1935–1944. [Google Scholar] [CrossRef]
- Jenkinson, D.S.; Brookes, P.C.; Powlson, D.S. Measuring Soil Microbial Biomass. Soil biology and biochemistry 2004, 36, 5–7. [Google Scholar] [CrossRef]
- Edgar, R.C. UPARSE: Highly Accurate OTU Sequences from Microbial Amplicon Reads. Nature methods 2013, 10, 996–998. [Google Scholar] [CrossRef]
- Hall, M.; Beiko, R.G. 16S rRNA Gene Analysis with QIIME2. In Microbiome Analysis; Beiko, R.G., Hsiao, W., Parkinson, J., Eds.; Methods in Molecular Biology; Springer New York: New York, NY, 2018; Vol. 1849, pp. 113–129 ISBN 978-1-4939-8726-9.
Figure 1.
Variations in physiological indicators of different citrus varieties under drought stress condition. Stem height (A), root length (B), fresh weight (C), and dry weight of the plants (D). RL and SH refers to the root length and shoot height, FB and DB stands for the plant fresh and dry biomass. In the figure, the asterisks (*) have the following meanings: *, P < 0.05; **, P < 0.01; ***, P < 0.001.
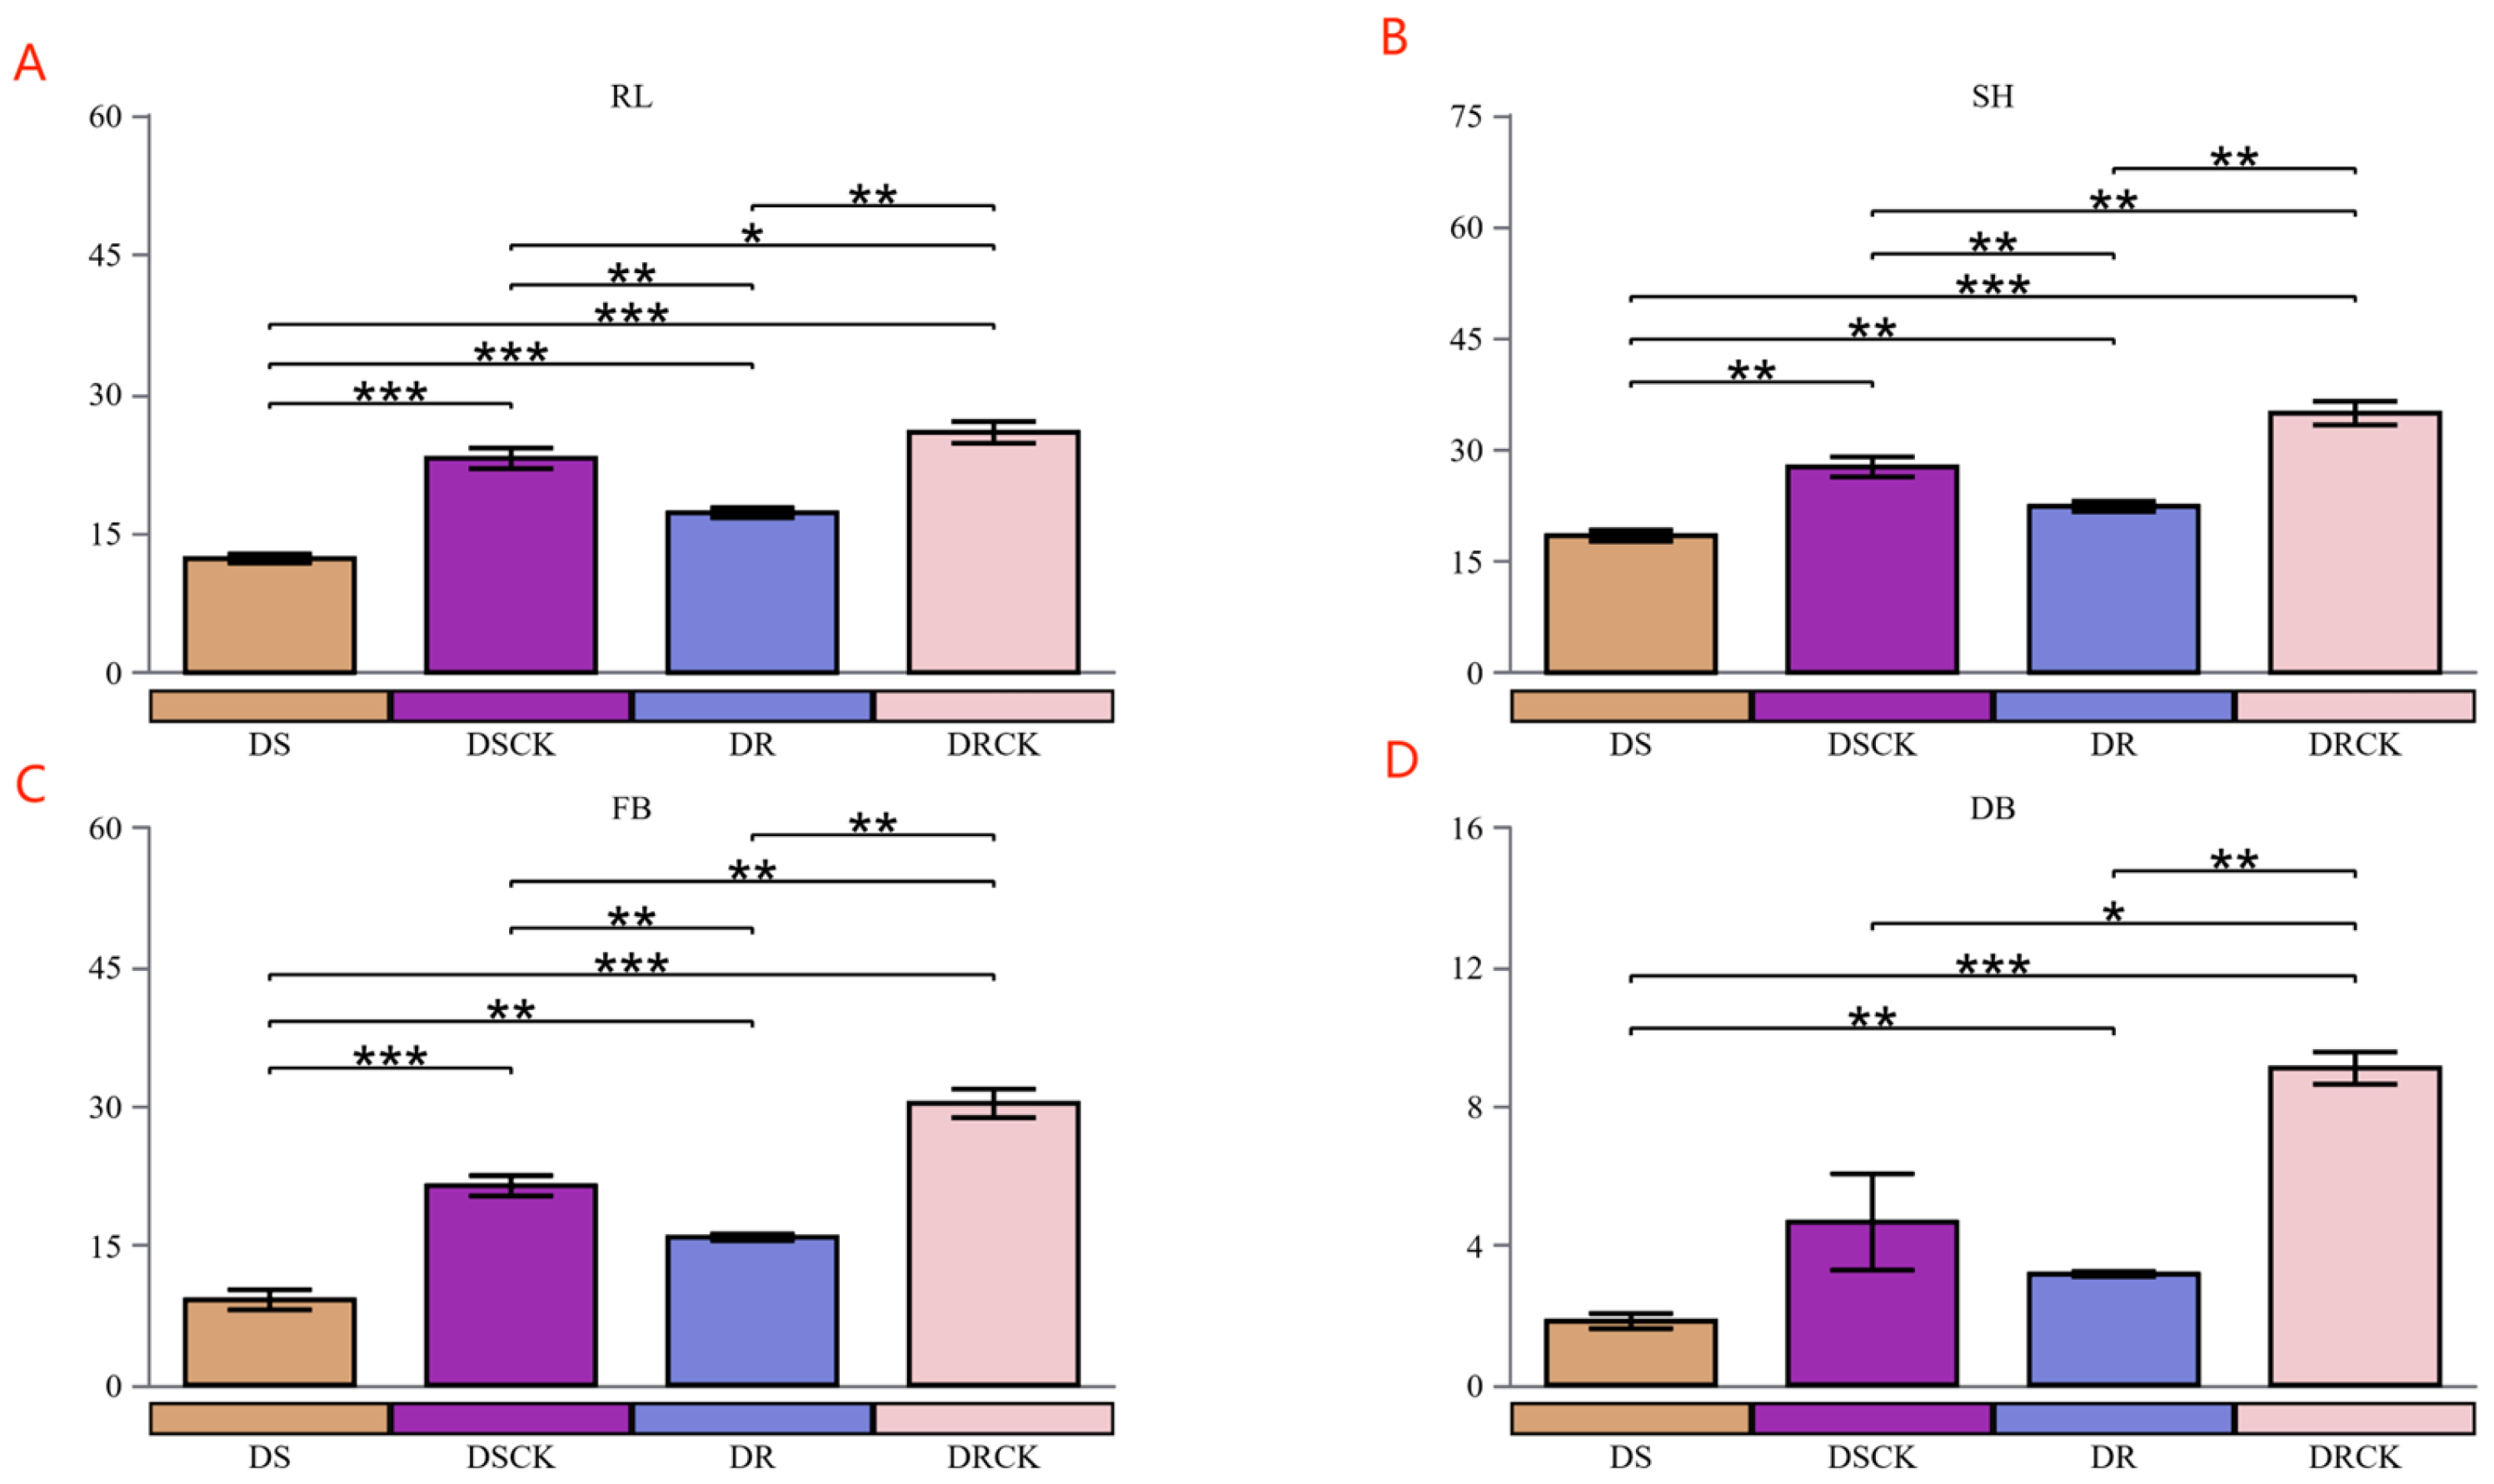
Figure 2.
Differences in soil enzyme activities among different citrus varieties under drought stress. Catalase (A) Urease (B) Acid phosphatase (C), and Sucrase (D). The asterisks (*) in the figure are as follows: *, P < 0.05; **, P < 0.01; ***, P < 0.001.
Figure 2.
Differences in soil enzyme activities among different citrus varieties under drought stress. Catalase (A) Urease (B) Acid phosphatase (C), and Sucrase (D). The asterisks (*) in the figure are as follows: *, P < 0.05; **, P < 0.01; ***, P < 0.001.
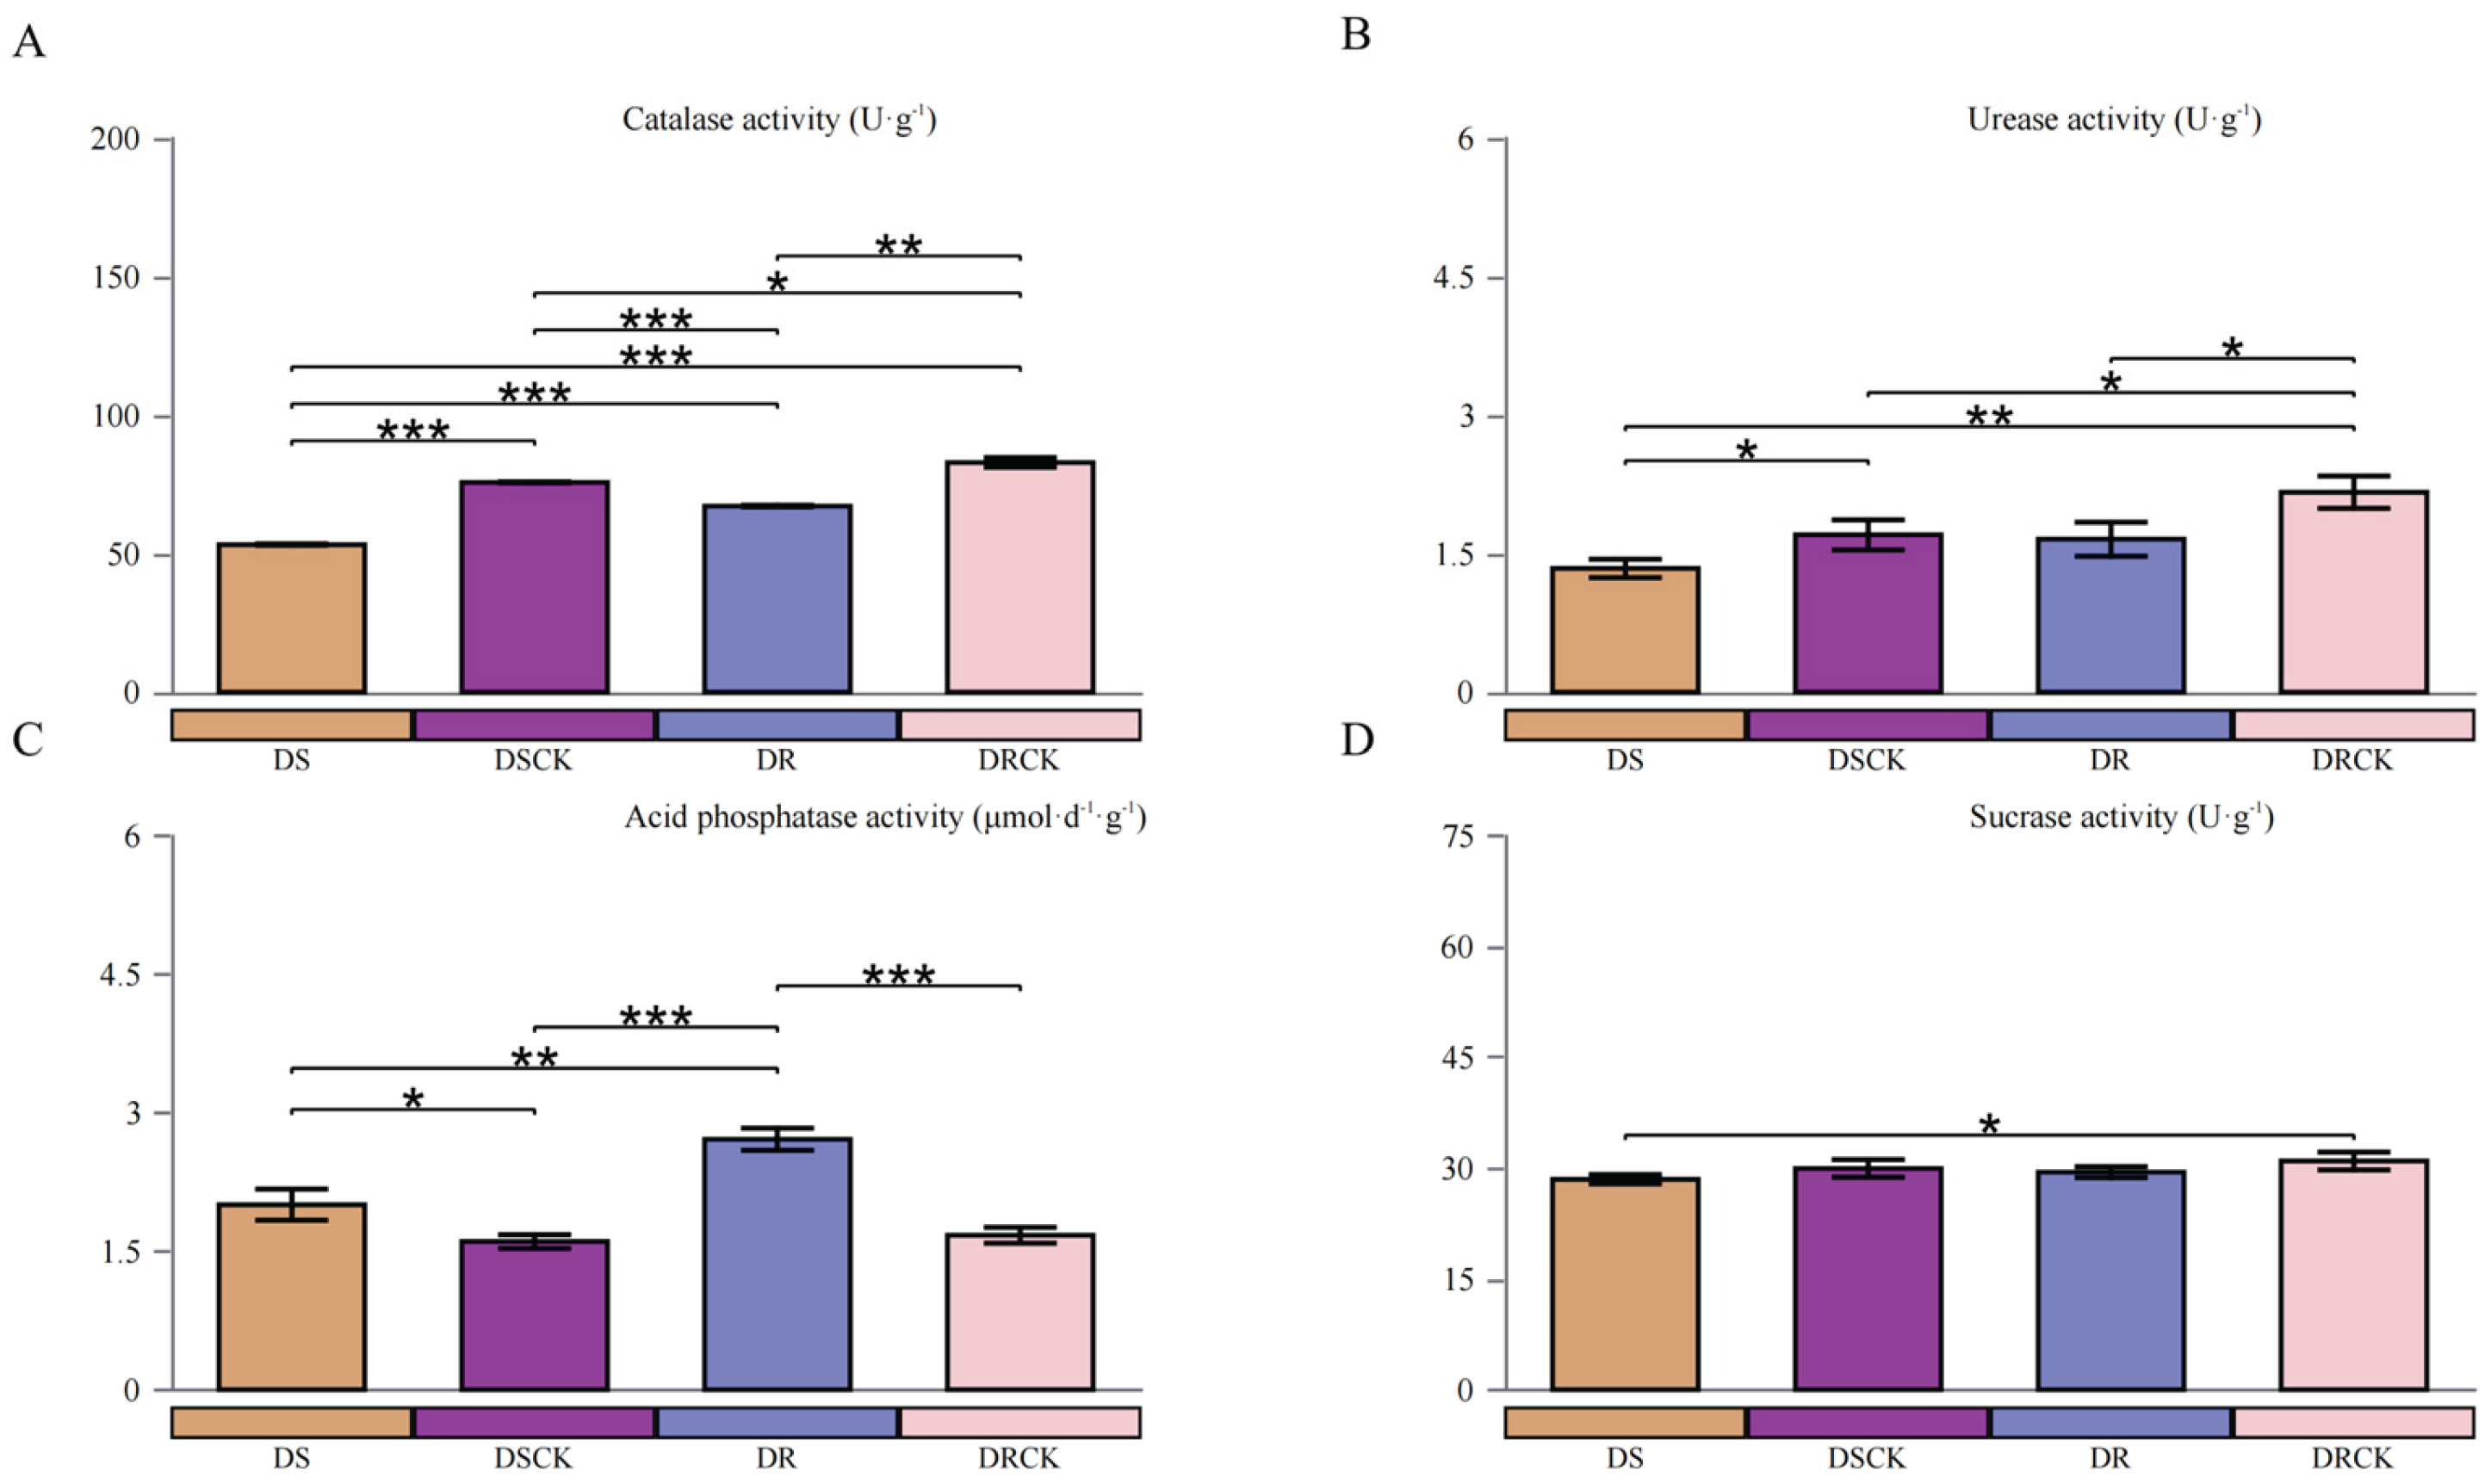
Figure 3.
Characteristics of rhizosphere soil chemical properties of two citrus varieties with different drought tolerance efficiency under drought treatments. Available potassium (A), available phosphorus (B), available nitrogen (C), and soil organic carbon content (D). The meanings of the asterisks (*) in the figure indicates the statistical significance levels as follows: *, P < 0.05; **, P < 0.01; ***, P < 0.001.
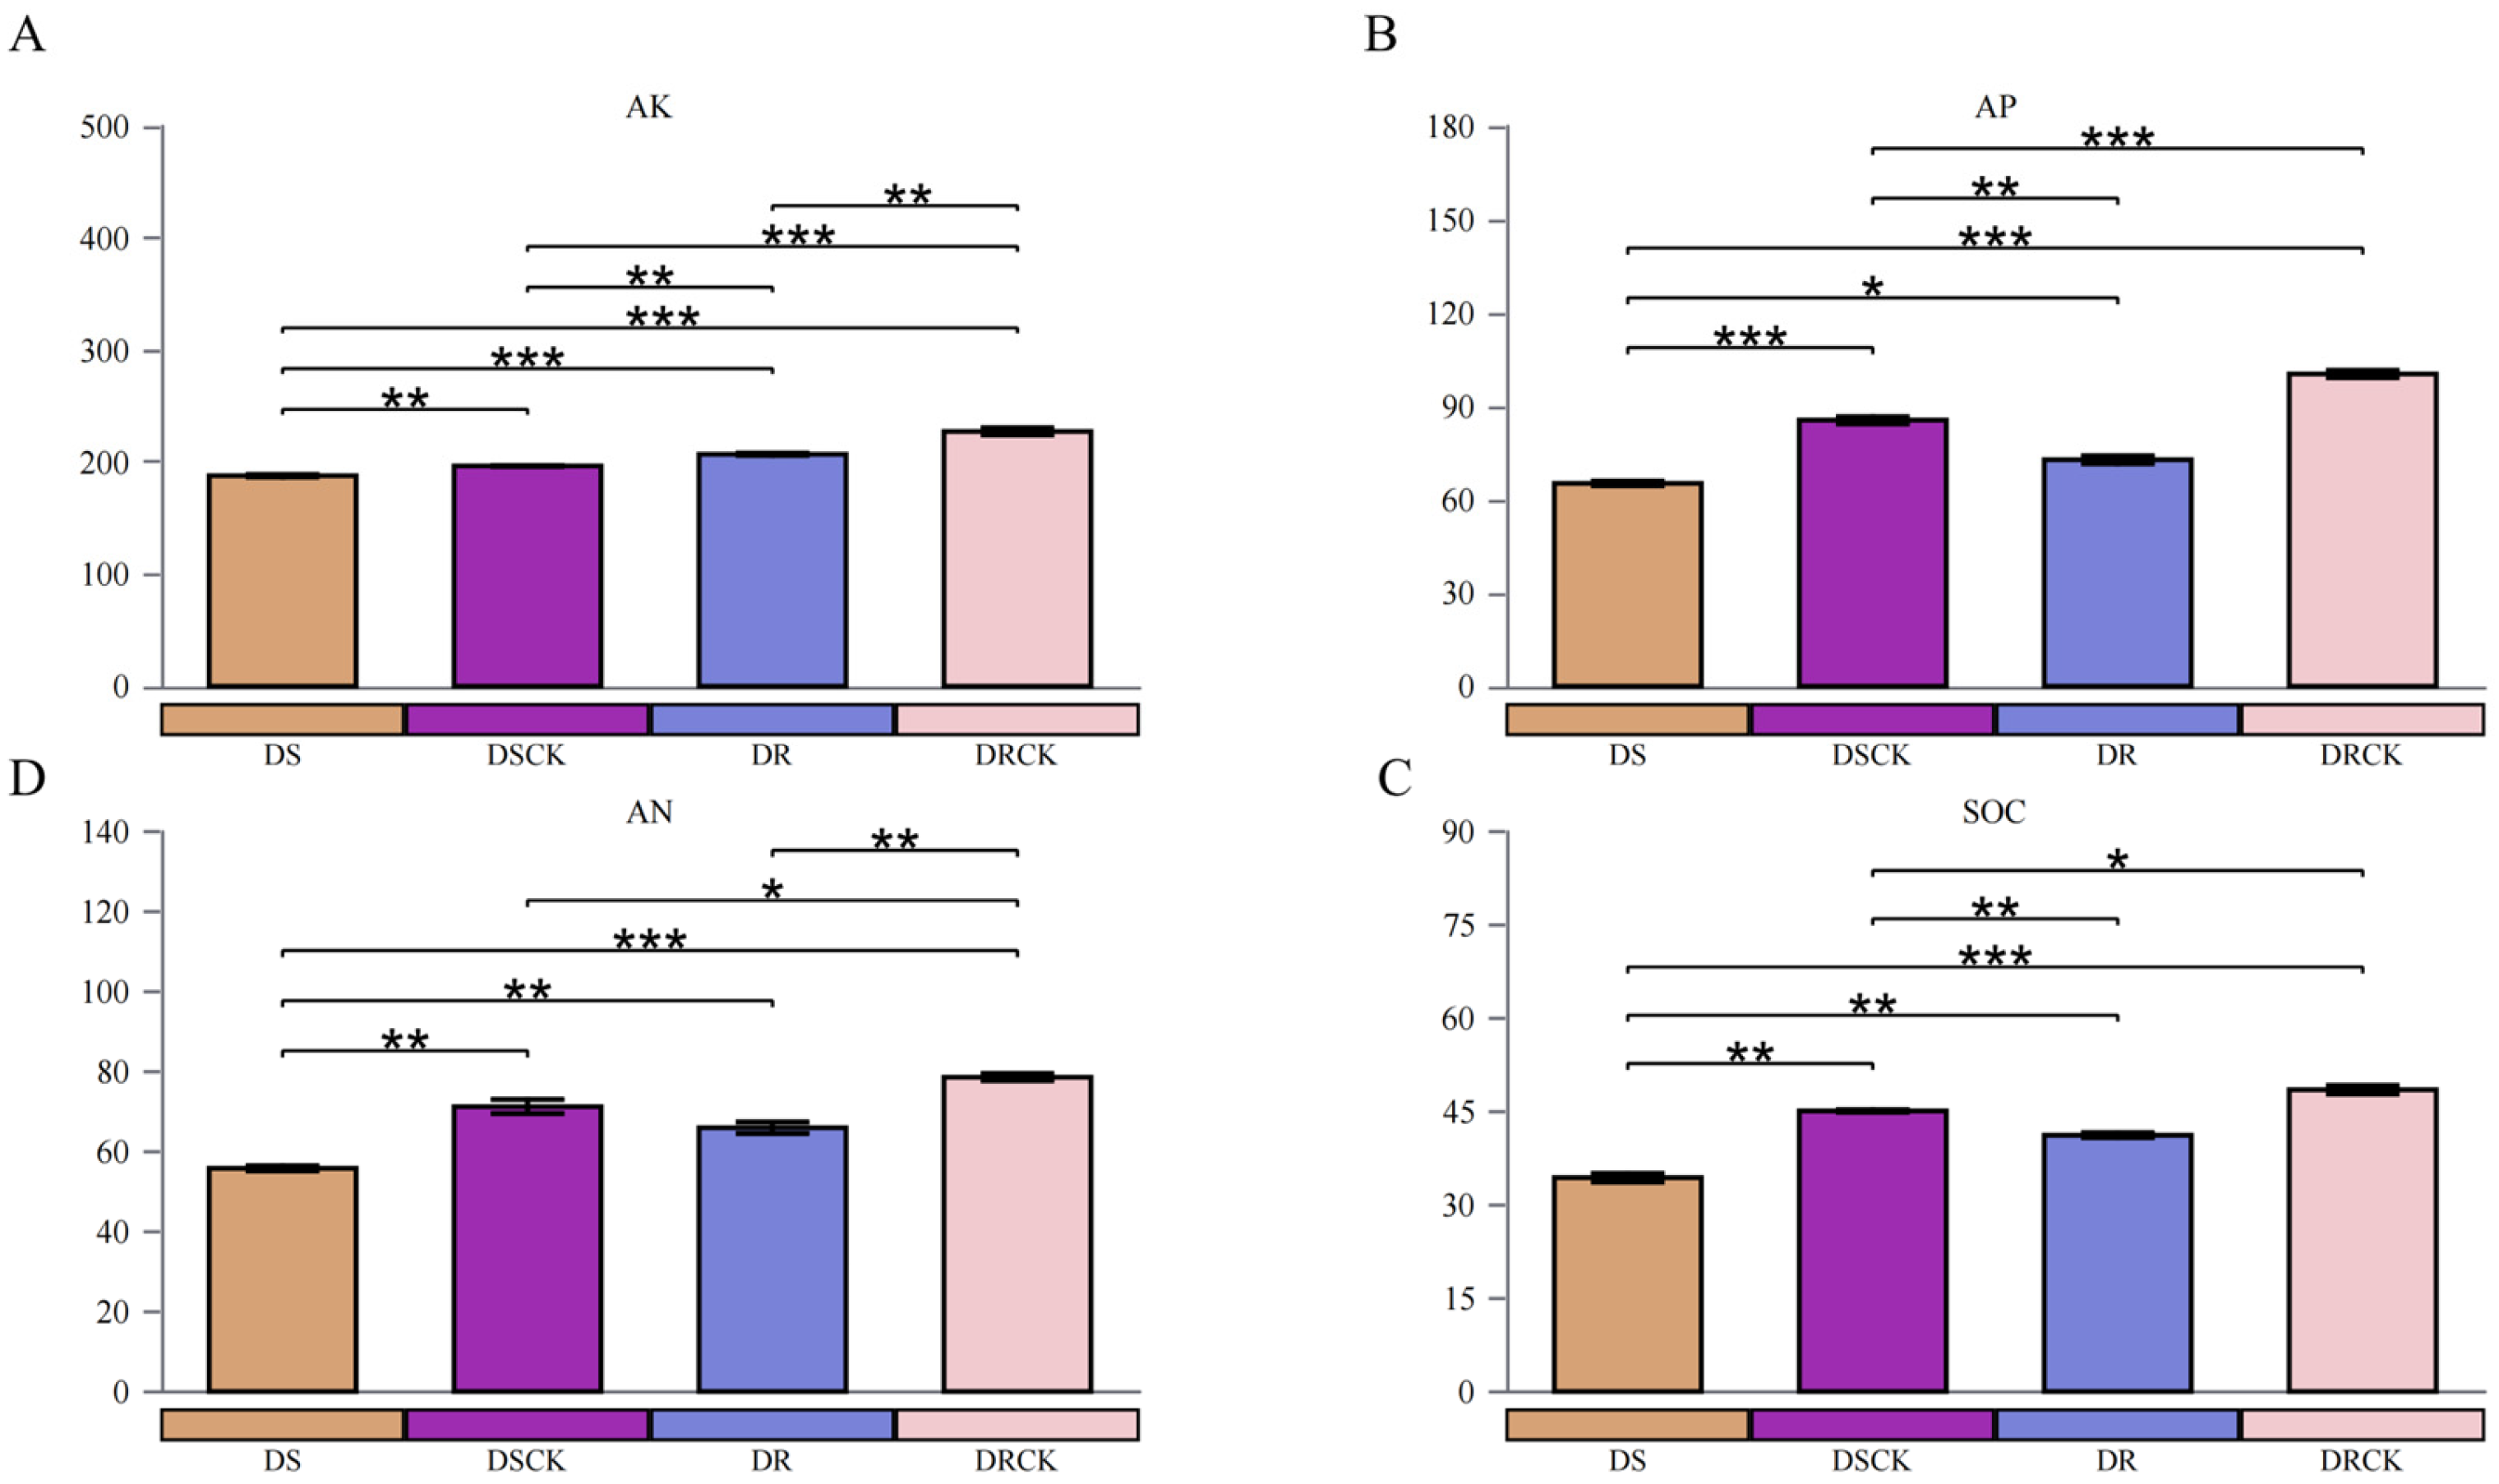
Figure 4.
Analysis of diversity differences of bacteria and fungi in the rhizosphere soil of citrus under drought treatment. The measured values of α diversity of rhizosphere bacteria and fungi in different treatments and varieties in terms of ACE, Chao 1 abundance, Shannon diversity, Simpson index (A,C), and principal coordinate analysis of bacteria and fungi diversity (B,D). Significant differences at *p<0.05, **p<0.01, ***p<0.001.
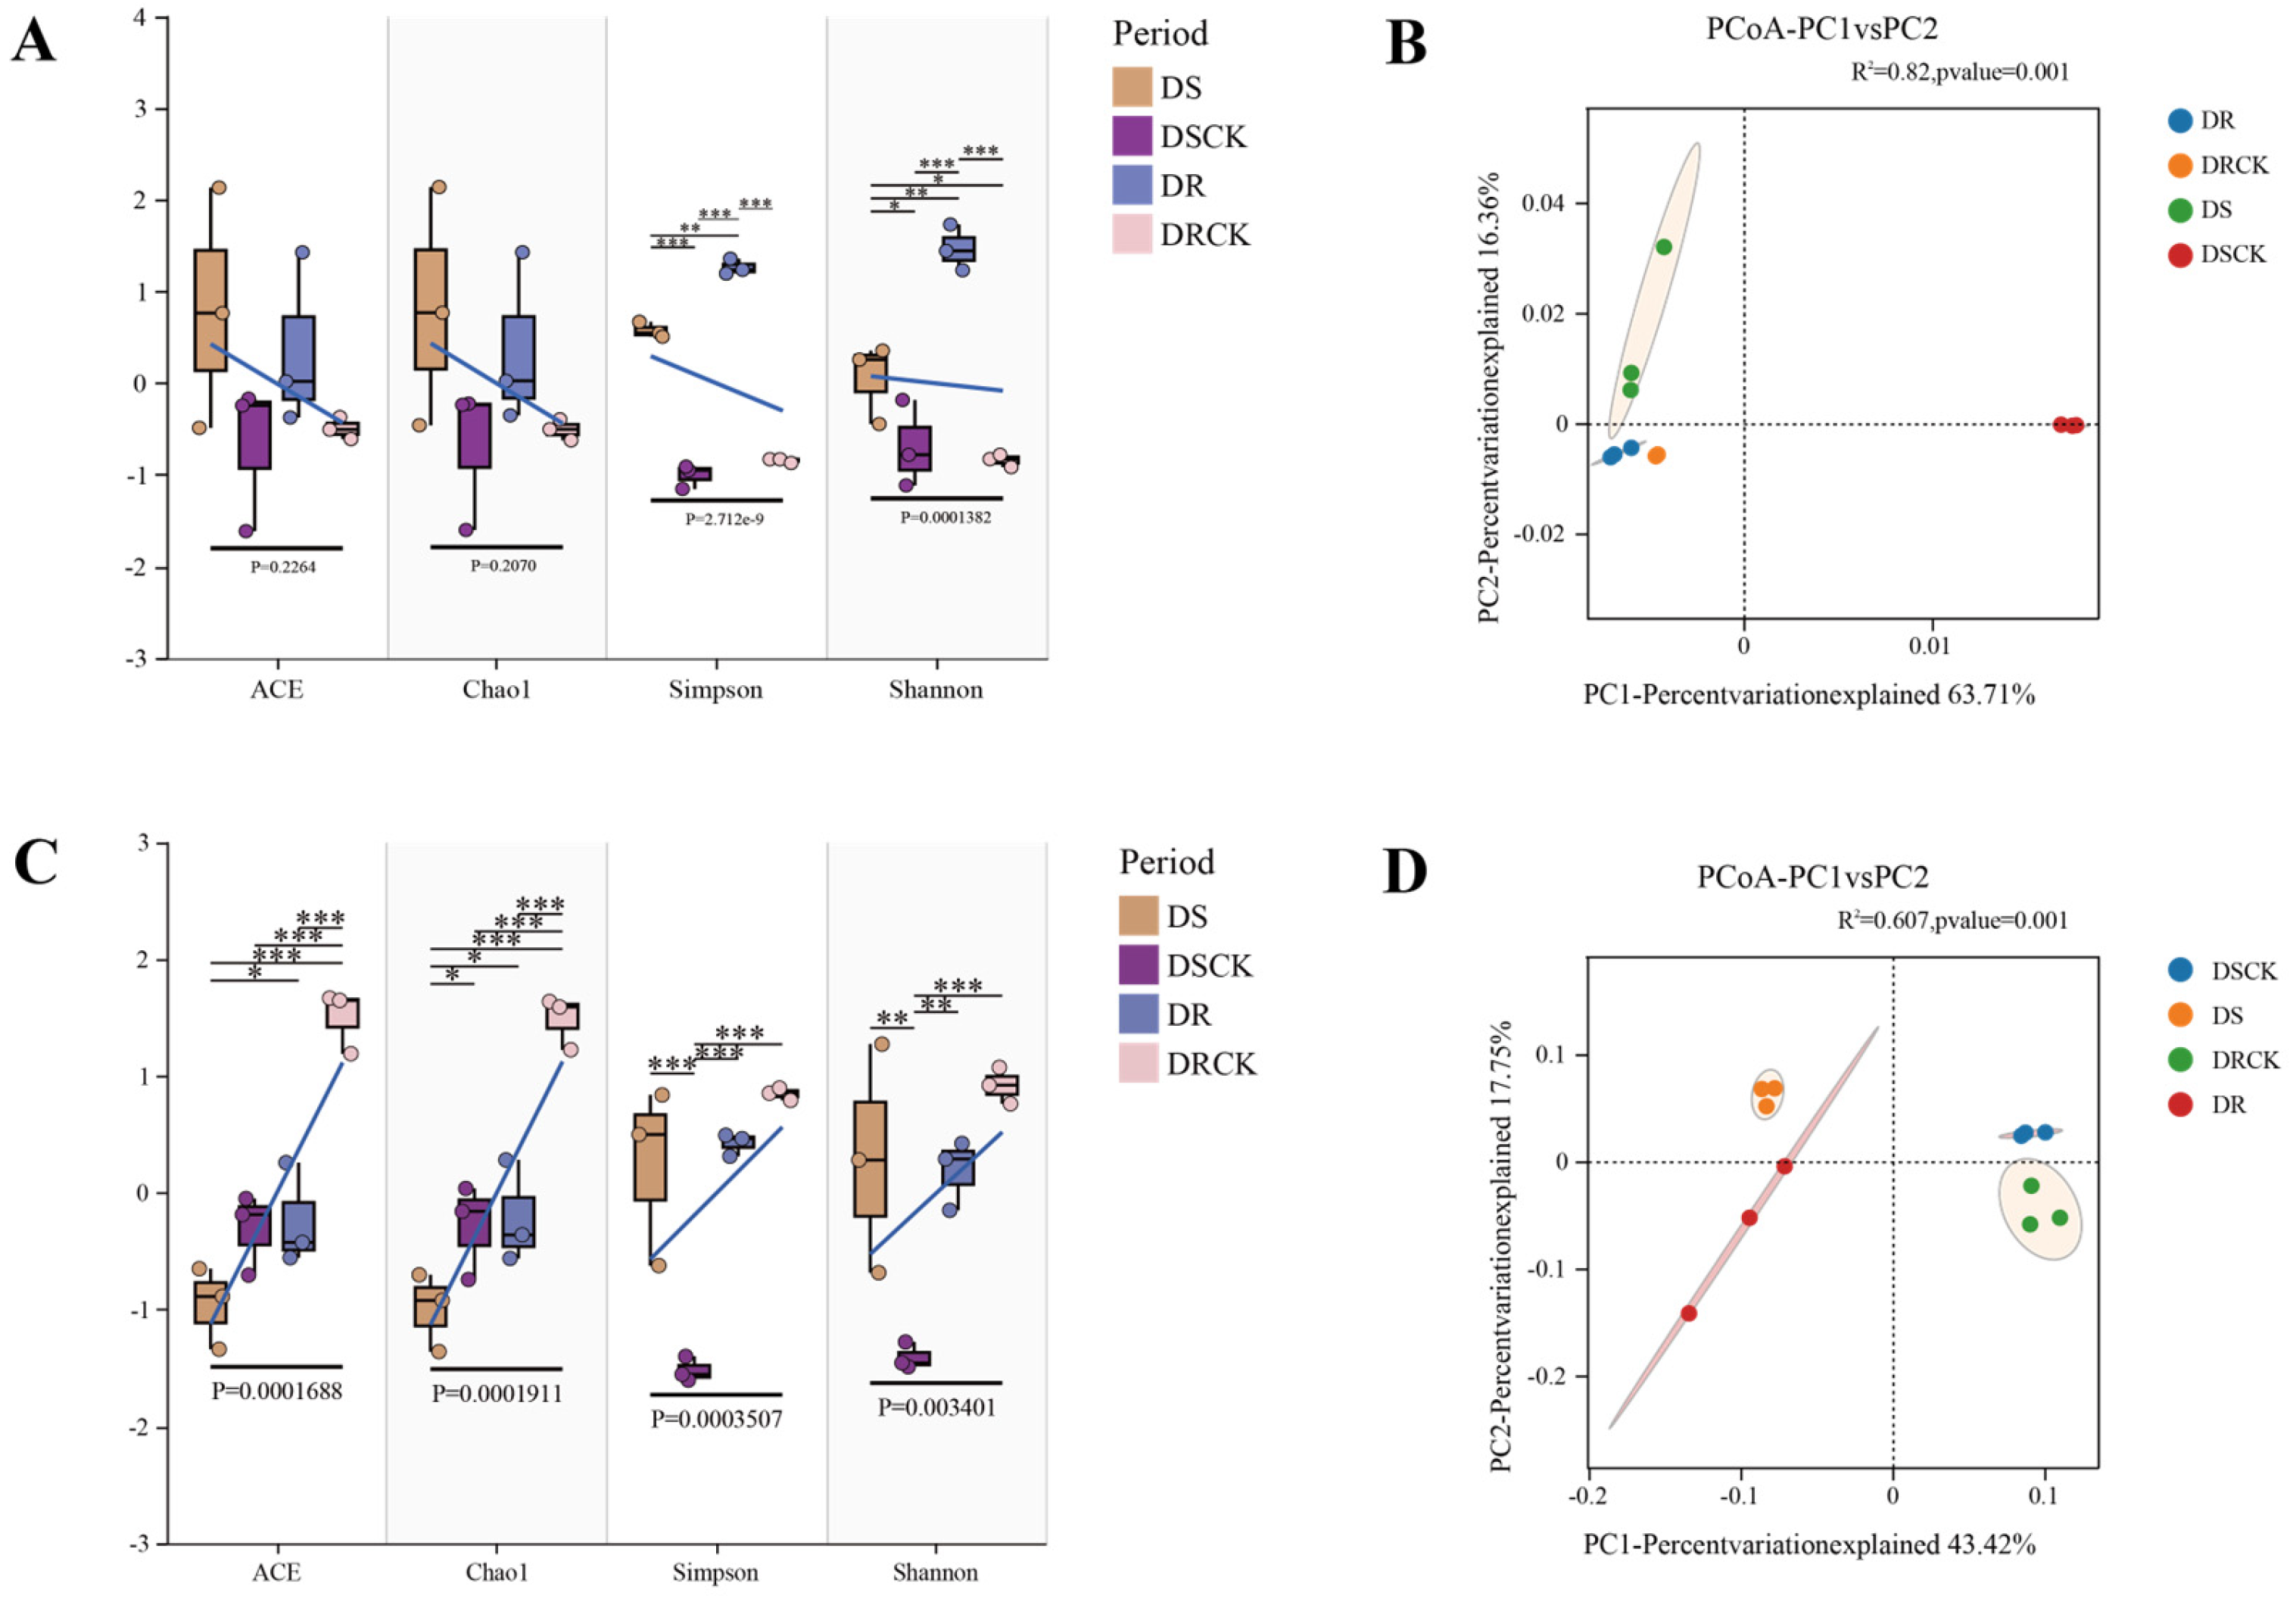
Figure 5.
The relative abundance of bacterial and fungal communities in the rhizosphere soil of different citrus varieties in response to different treatments, i.e., CK and drought at the phylum level (A, C) and genus level (B, D). The x-axis represents sample names, and the y-axis represents relative abundance.
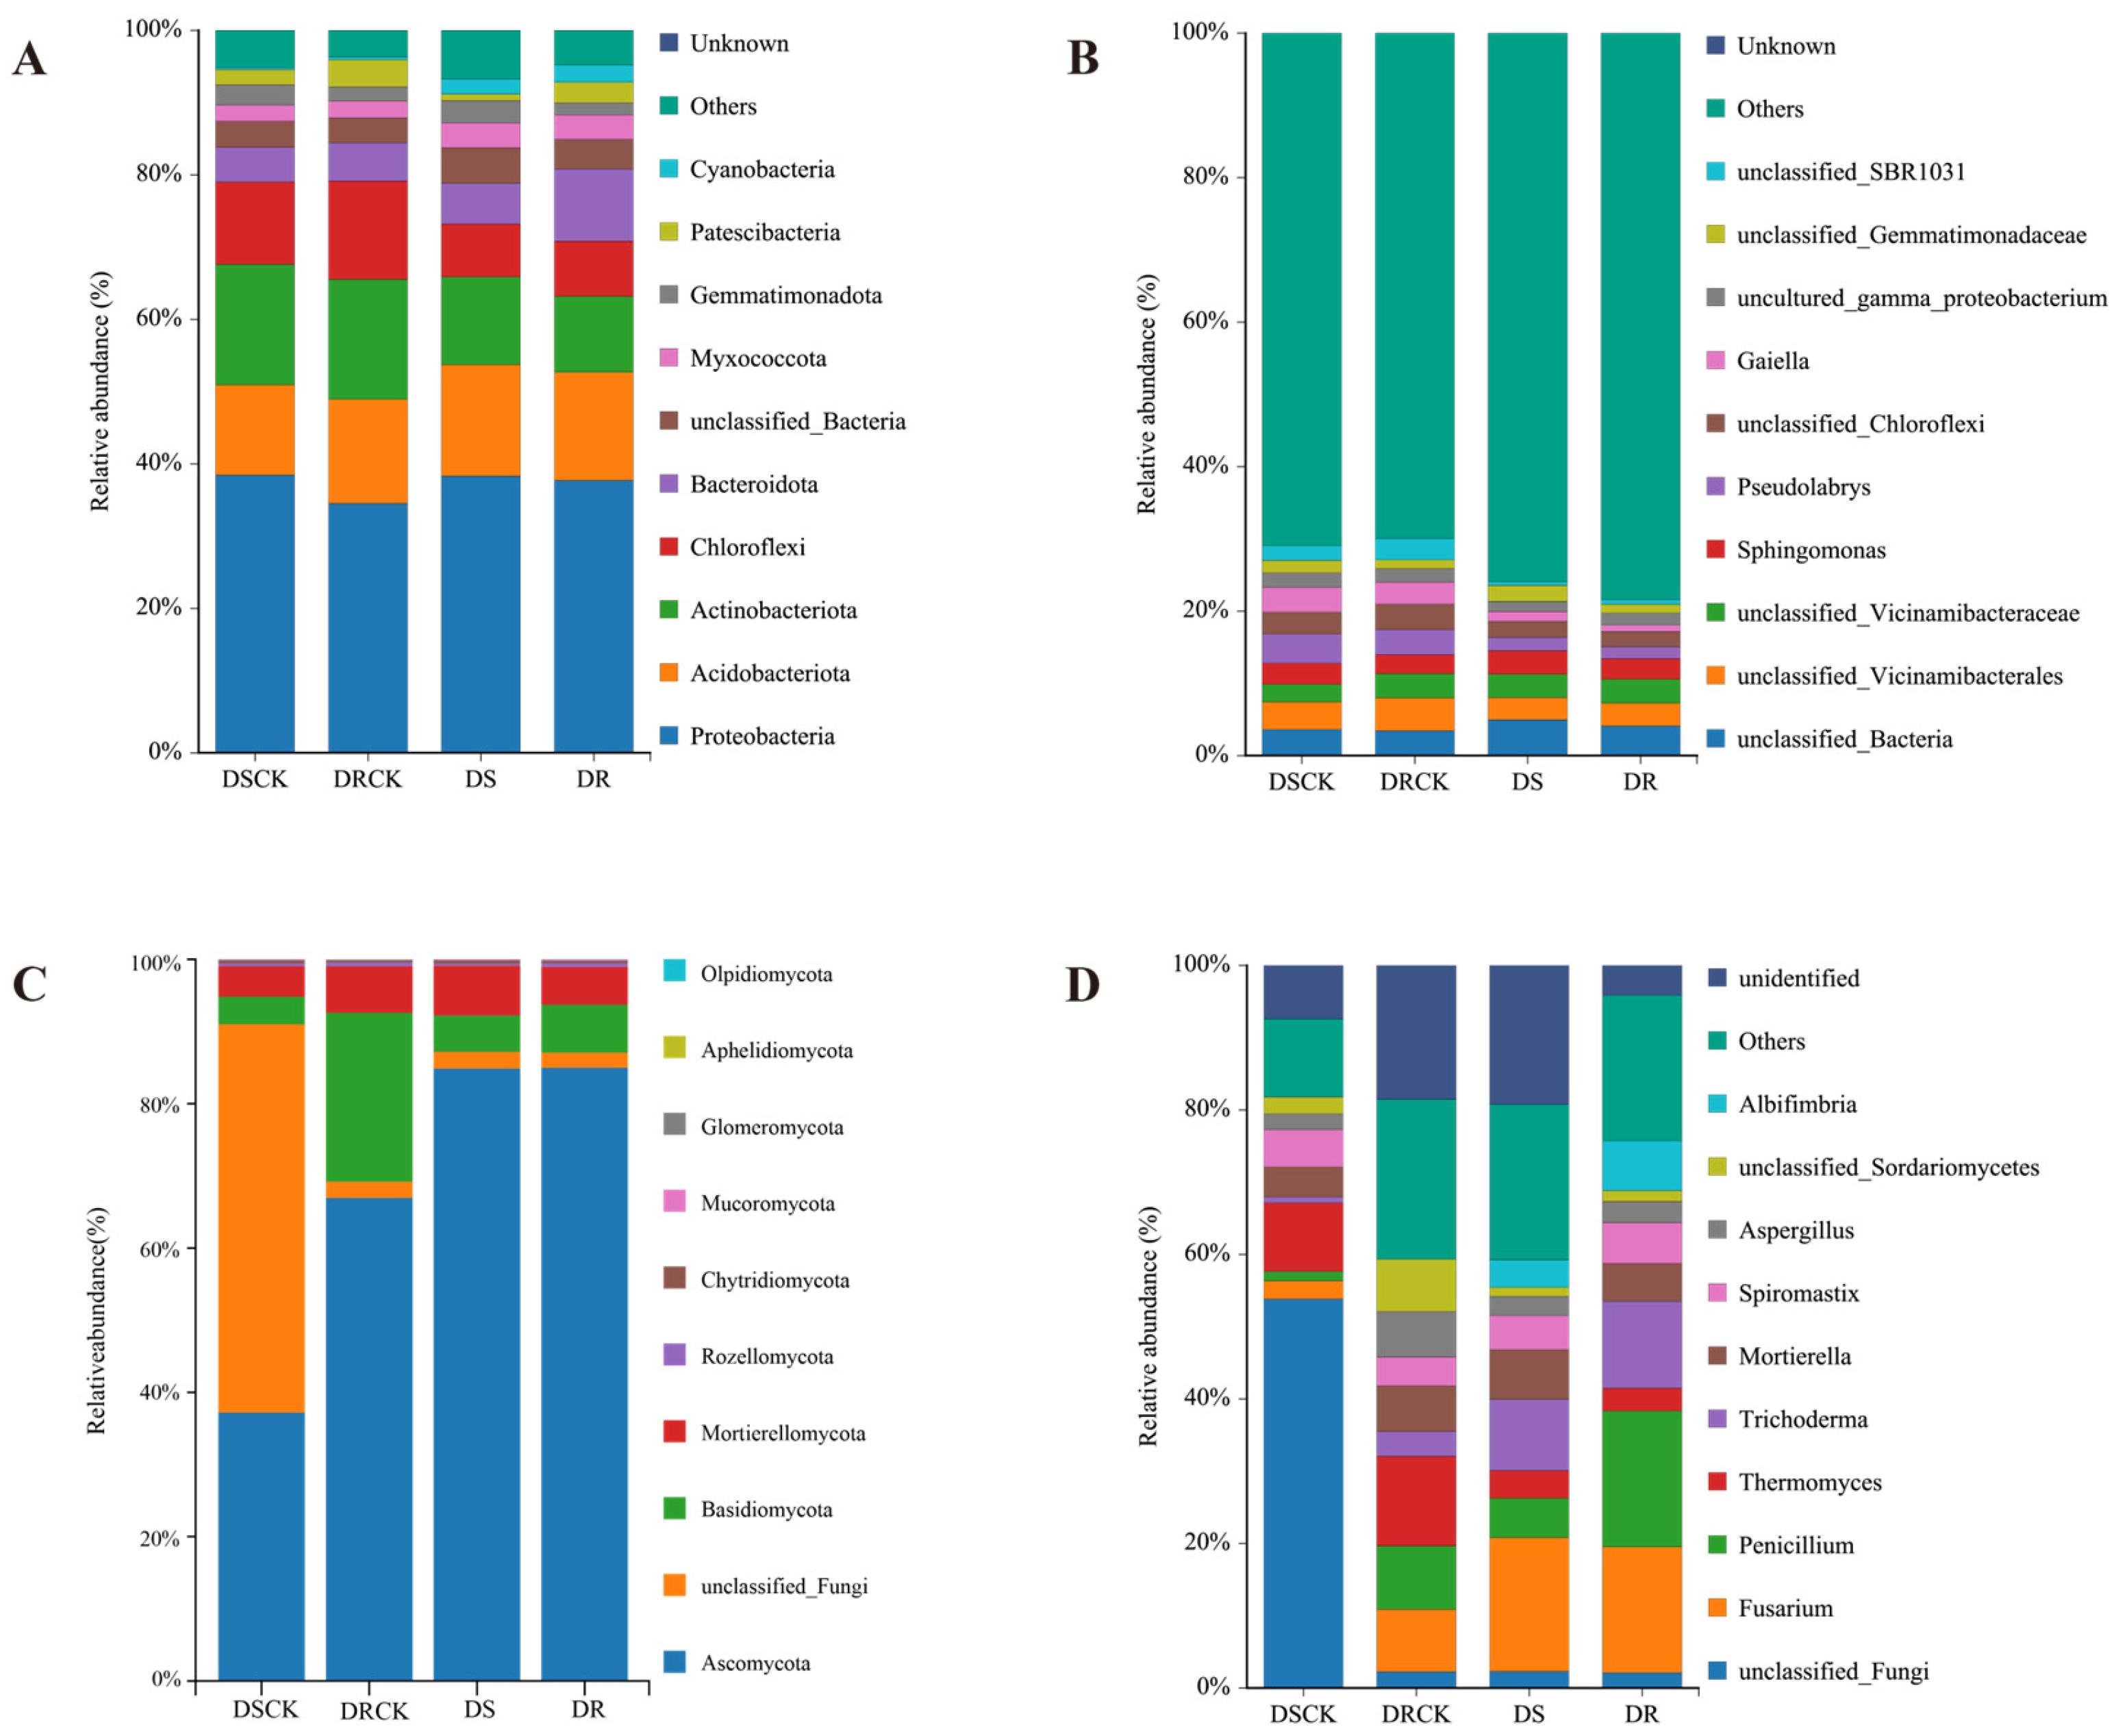
Figure 6.
LEfSe analysis of each treatment group, the phylogenetic tree shows the distribution of bacterial (A) and fungal (B) lineages.
Figure 6.
LEfSe analysis of each treatment group, the phylogenetic tree shows the distribution of bacterial (A) and fungal (B) lineages.
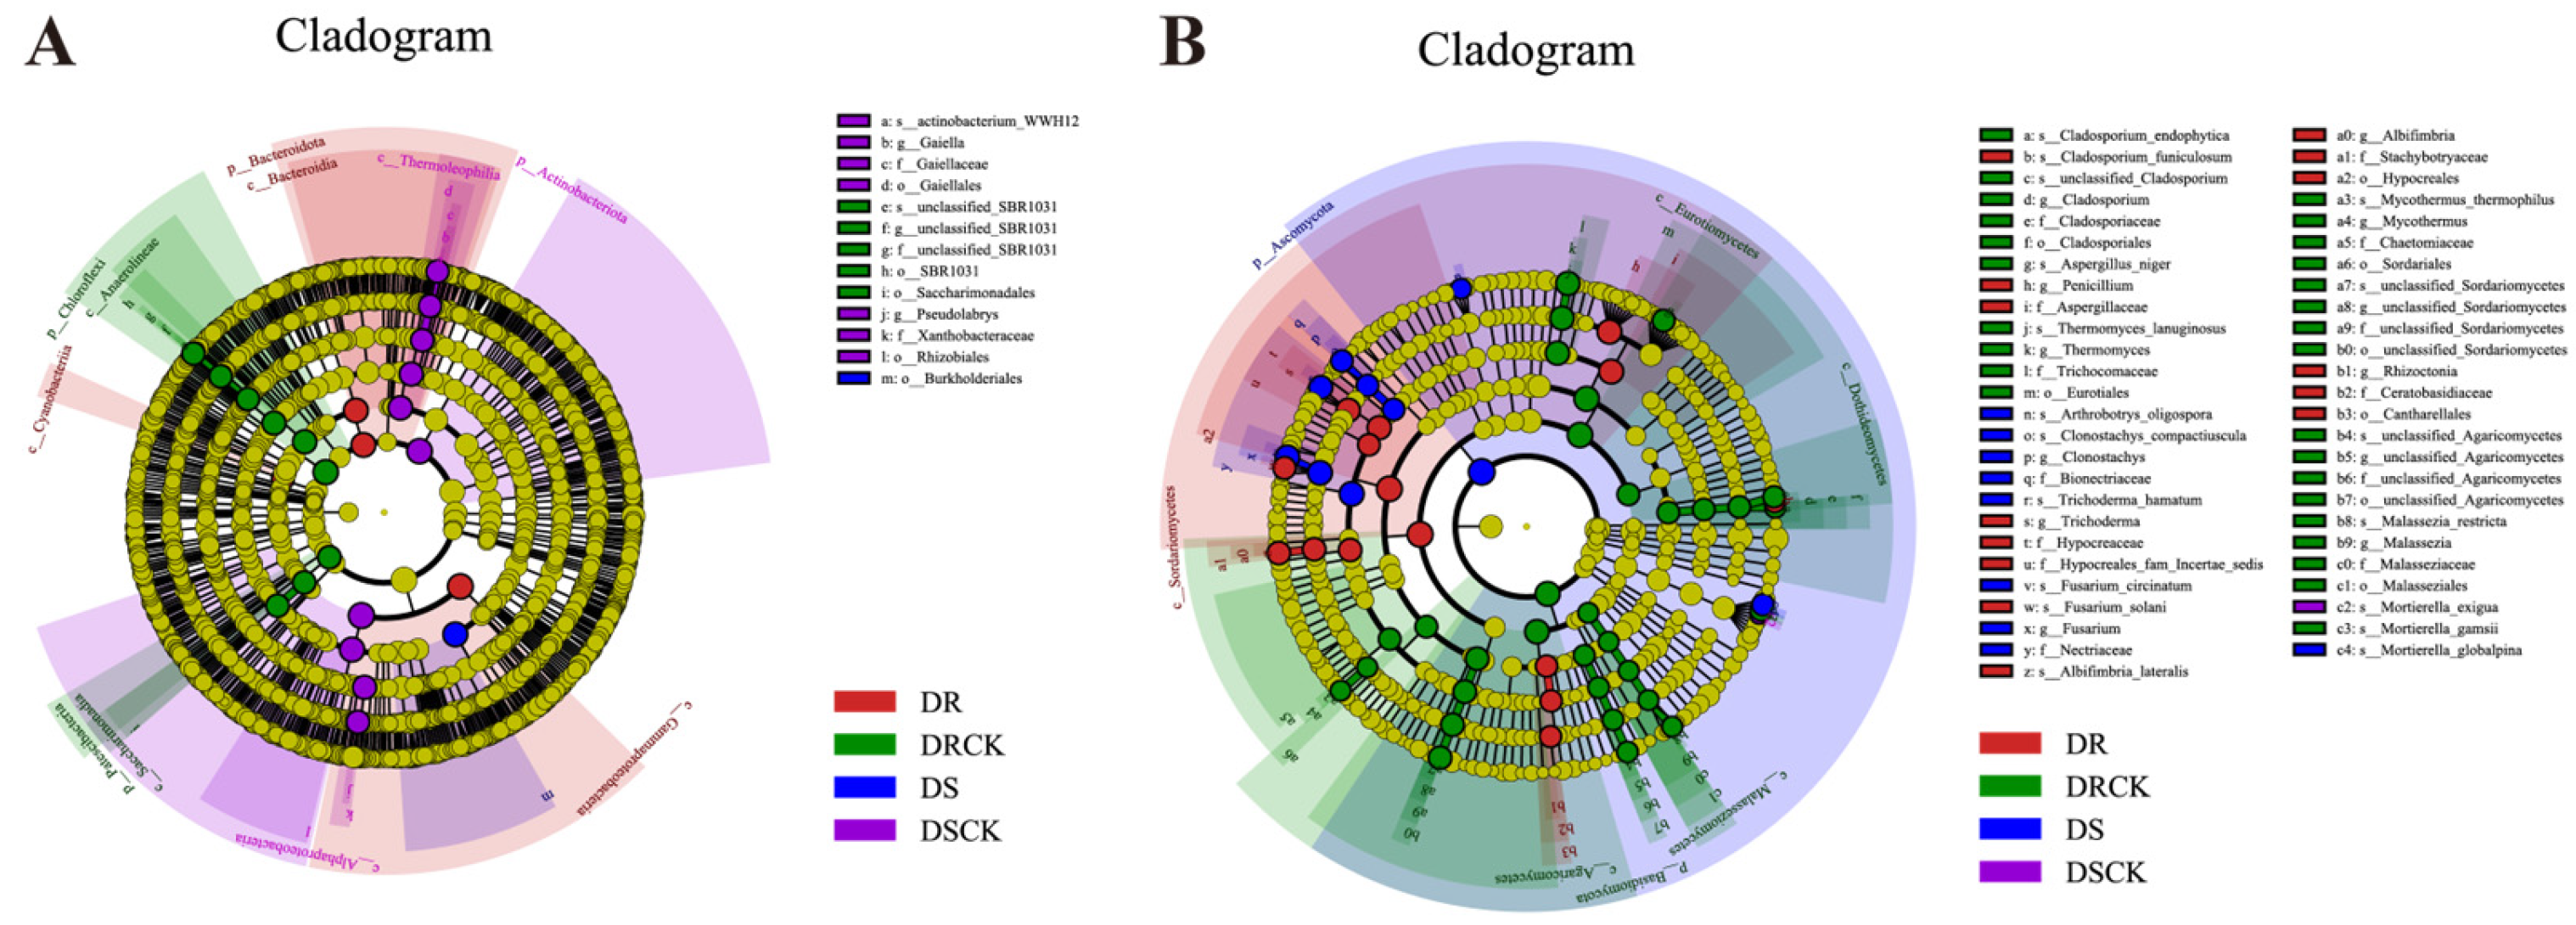
Figure 7.
Functional classification of rhizosphere microorganisms in different citrus varieties and correlation analysis with soil properties. The bar charts present the classification of microbial functions for bacteria (A), and fungi (B). Panels (C) and (D) are heat maps of the correlation analysis between soil physicochemical property indicators and the community structures of soil bacteria and fungi (at the genus level) based on Pearson analysis. A red color indicates a positive correlation, while a blue color indicates a negative correlation. The deeper the color, the stronger the correlation. The symbols in the figures denote the significance levels at * p < 0.05; ** p < 0.01; *** p < 0.001.
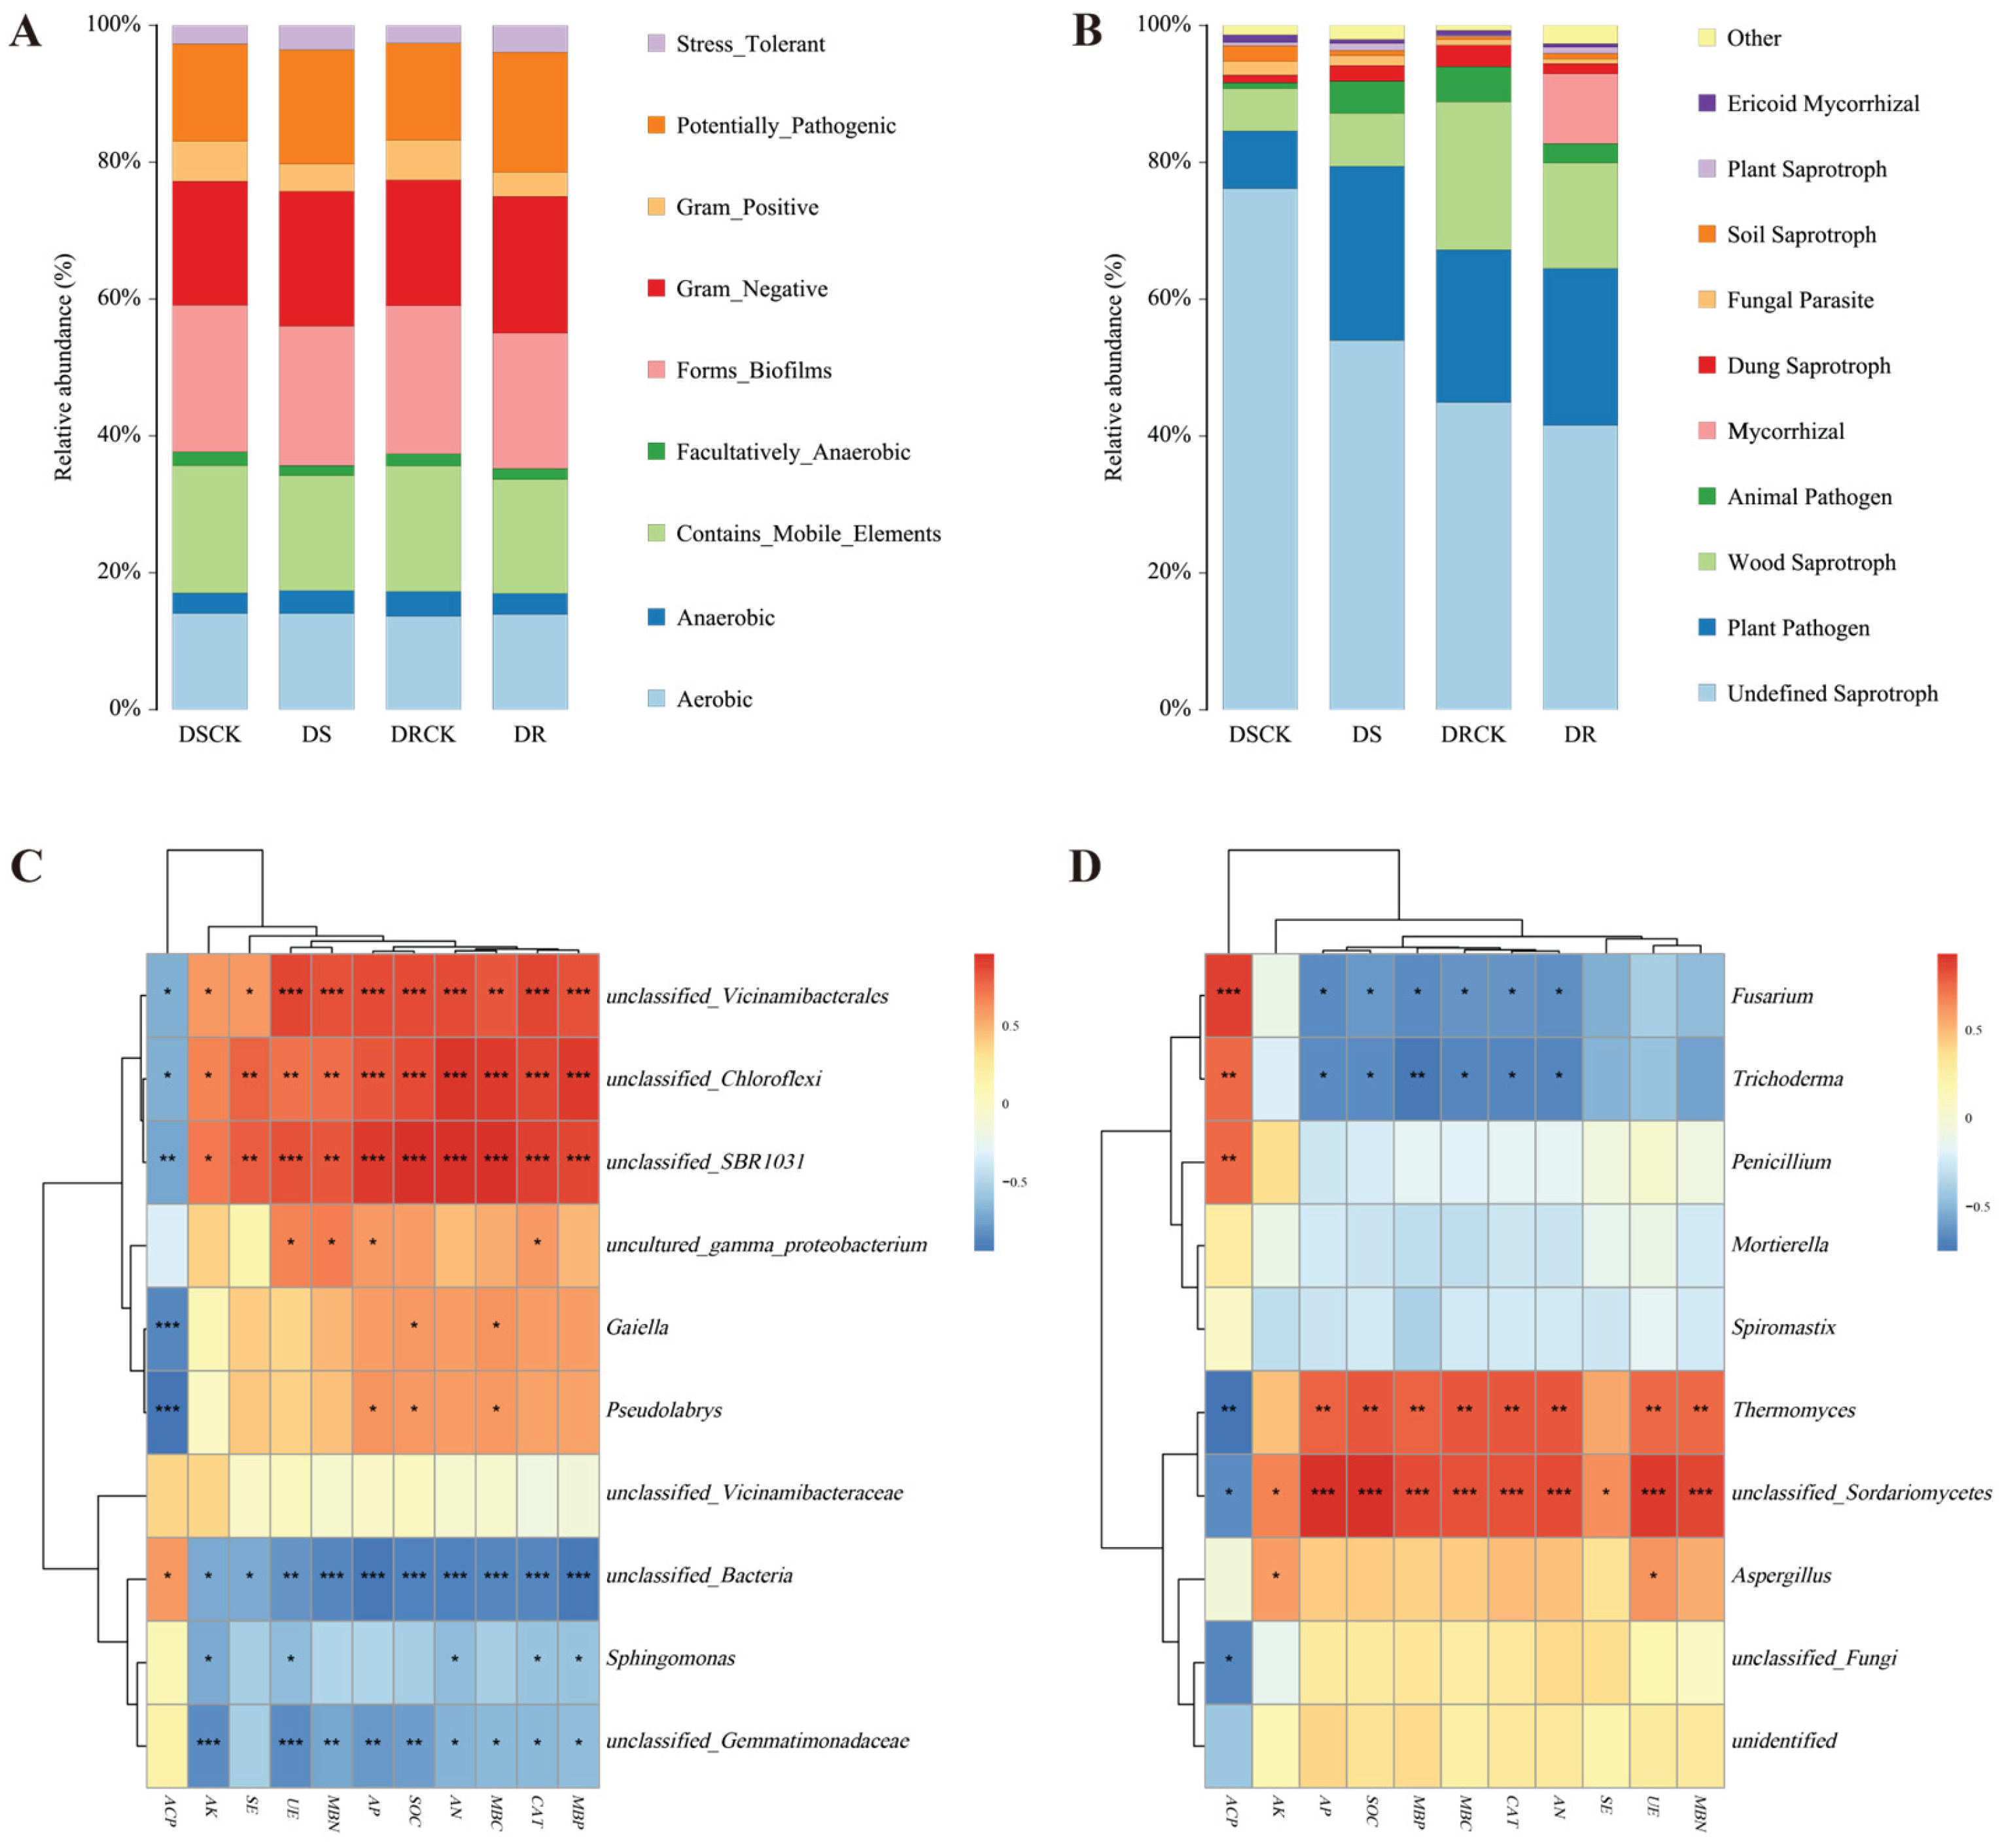
Figure 8.
Network diagrams of rhizosphere bacteria under each treatment of DR (A), DRCK (B), DS (C), and DSCK (D). Note: The size of the nodes in the figure represents species abundance, and different colors represent different species. The color of the connecting lines represents positive and negative correlations. Red lines indicate significant positive correlations, and blue lines indicate significant negative correlations. The thickness of the lines represents the magnitude of the correlation coefficient, and Pearson correlation analysis was used. The default value of the correlation coefficient in the figure is p < 0.01. The number of lines indicates the closeness between nodes.
Disclaimer/Publisher’s Note: The statements, opinions and data contained in all publications are solely those of the individual author(s) and contributor(s) and not of MDPI and/or the editor(s). MDPI and/or the editor(s) disclaim responsibility for any injury to people or property resulting from any ideas, methods, instructions or products referred to in the content. |
© 2025 by the authors. Licensee MDPI, Basel, Switzerland. This article is an open access article distributed under the terms and conditions of the Creative Commons Attribution (CC BY) license (http://creativecommons.org/licenses/by/4.0/).
Copyright: This open access article is published under a Creative Commons CC BY 4.0 license, which permit the free download, distribution, and reuse, provided that the author and preprint are cited in any reuse.


