
Submitted:
27 October 2025
Posted:
28 October 2025
You are already at the latest version
Abstract
Extruded polystyrene (XPS) has recently been used for construction such as in walls, and floors. When it is used for walls, axial load is inevitably applied along the length direction, raisinga concerns of collapse owing to buckling deformation. To address this, the buckling behavior of XPS should be appropriately characterized. However, such characterization has often been ignored because XPS has not conventionally been used as a structural material but solely as a thermal insulation material. In addition, the classical methods typically applied to analyze buckling behaviors are well-established; therefore, many researchers might not consider buckling analysis to be novel. However, as the use of XPS in construction increases, its buckling behaviors cannot be ignored, and few studies have investigated them to date. In this study, buckling tests of XPS were conducted using columns with various slenderness ratios, and the buckling stress–slenderness ratio was analyzed using the following three methods: the authors’ proposed method, Southwell’s method, and the modified Euler method. Independently of the buckling tests, short column compression and three-point bending tests were performed, and the buckling stress–slenderness ratio relationship was predicted using the properties obtained from these tests. Buckling stress could be effectively determined using these three methods across a wide range of slenderness ratios, whether elastic or inelastic buckling occurred. Our proposed method was superior to the other two methods owing to its simplicity. In contrast, it was difficult to predict the buckling stress–slenderness ratio using the properties obtained from either the compression tests alone or three-point bending tests alone. However, the relationship could be appropriately determined using the properties obtained from both tests together.
Keywords:
extruded polystyrene
; buckling test
; buckling stress
; slenderness ratio
; compression test
; three-point bending test
1. Introduction
Foamed plastics have been conventionally used as heat-insulating materials and cushioning materials, owing to their high thermal insulation and lightweight properties, respectively [1,2]. In addition, they have found use in construction for floors and walls in housing because they are free from formaldehyde, a cause of sick building syndrome, as well as efficiently attenuating seismic forces [3,4,5,6,7,8,9,10,11,12,13,14,15,16,17,18,19]. As the use of foamed plastics in construction increases, it is essential to gain a deeper insight into their mechanical properties. In particular, when they are used for walls, axial load is inevitably applied along the length direction, raising concerns of collapse owing to buckling deformation. To address this, it is important to characterize the buckling properties of foamed plastics.
Several studies have investigated the buckling properties of composite materials where foamed plastics were used as a sandwich core [20,21,22], but few have explored the buckling properties of the foamed plastics themselves. Their buckling behaviors have often been ignored because they have not conventionally been used as structural materials but rather as thermal insulation materials, as described above. In fact, it is difficult to find characterization methods in major standards, including the International Organization for Standardization (ISO), ASTM International, and Japanese Industrial Standards (JIS). Although a method for detecting buckling load is standardized for continuous ceramic matrix composites in ISO 20504:2006 [23] and JIS R 1673:2007 [24], the principal aim of these standards is the prevention of buckling. This lack of standardization for foamed plastics specifically makes characterizing their buckling properties more difficult. In addition, the methods typically applied to analyze buckling behavior are well-established; therefore, many researchers might not consider buckling analysis to be novel. However, as described above, buckling behaviors cannot be ignored, as the frequency of using foamed plastics as construction materials is increasing. When foamed plastics are used for walls, it is important to analyze plate buckling behaviors, which are more complex than column buckling behaviors, but even the latter remain insufficiently elucidated.
The buckling properties of columns are usually characterized using the buckling stress (or buckling load) corresponding to the slenderness ratio. In this characterization, actual buckling tests are performed and the relationship between the load and loading-line displacement or that between load and lateral deflection is often used [26,27,28,29]. Otherwise, the strains of the column are measured on both side surfaces, and the buckling is determined when the strain reversal is induced in one surface [30,31]. However, it is often difficult to determine buckling stress precisely using these methods, as detailed below. In previous studies, the authors proposed a method for determining buckling stress using solid wood and cardboard samples with a high slenderness ratio [32,33,34]. This method is promising for determining the buckling stress of foamed plastics while reducing the drawbacks of the conventional methods described above.
Instead of performing buckling tests, buckling stress can be predicted using the stress–strain relationship obtained from compression tests of short columns [25]. In this method, when the slenderness ratio is sufficiently large, the buckling stress is predicted based on classical Euler theory. In contrast, when the slenderness ratio is regarded to be intermediate, the buckling stress is predicted using Engesser–Kármán theory or other empirical formulas [25]. However, the applicability of these methods for foamed plastics, including extruded polystyrene (XPS), has not been well verified
In this study, buckling tests were performed using XPS columns with various slenderness ratios, ranging from intermediate to long, and the buckling stress was analyzed using different three methods. In addition, compression and three-point bending tests were performed independently of the buckling tests, and the data obtained from them were also used to predict buckling stress.
2. Theoretical Background
2.1. Buckling Stress Determination
Figure 1 represents a diagram of the column in the pre- and post-buckling conditions. The length, width, and depth of the column are defined as L, B, and H, respectively, whereas the axial load applied to the column and loading-line displacement are defined as P and xlld, respectively. Based on these definitions, the axial stress induced in the column sAX is derived as P/(BH). Buckling is induced when sAX reaches the critical stress for buckling (i.e., buckling stress) scr, whereas xlld at sAX = scr is defined as xCR
Figure 2 shows the typical sAX-xlld relationships obtained under various L in this study, with these relationships including significantly nonlinear and plateau portions. In this experiment, flexural deformation was not visually observed in the linear portion of the relationship. Therefore, buckling was supposed to be induced at a certain load in the post-linear portion. Several methods have been suggested to determine the scr value using the sAX-xlld relationship. Kúdela and Slaninka [27] and Kotšmíd and Beňo [29] determined buckling stress using the stress at the proportional limit in the sAX-xlld relationship. In their method, a straight-line is drawn onto the linear segment in the sAX-xlld curve. Based on visual observation, the deviation point between the straight-line and sAX-xlld curve is determined to be scr. However, this determination is often prone to error owing to the subjectivity in the visual observation. In contrast, Fairker [26] and Koczan and Kozakiewicz [28] determined buckling stress as the maximum of sAX. However, in the buckling test, flexural deformation is often induced prior to the maximum sAX. Instead of using the sAX-xlld relationship, buckling stress can be determined from the strains obtained using strain gauges bonded on both surfaces of the sample [30,31]. In the pre-buckling condition, compressive strains are induced on both surfaces. After flexural deformation is induced, the polarity of the strain at the convex surface inverts, and scr is determined from sAX at the occurrence of the strain inversion. However, this method is not always suitable for porous materials such as XPS because the strain cannot be precisely measured using strain gauges [35]. Due to the aforementioned drawbacks, these conventional methods are not always relevant for determining the scr value of XPS.
There are several methods of making it easier to determine scr using the load–deflection relationship in the post-buckling condition. As shown in Figure 1, the deflection at the mid-length of the sample is defined as dM, whereas the angle between the loading line and sample length is defined as a. The radius of curvature at the mid-length is denoted as kM. The effective displacement for inducing the deflection is defined as xeff and is obtained by subtracting xCR from xlld, as shown in Figure 1. According to elastica theory, a = 0-30°, 30-60°, and 60-90° correspond to xeff/L = 0-0.0676, 0.0676-0.259, and 0.259-0.543, respectively, and the dM/L- xeff/L and kML-xeff/L relationships under a pin-pin end condition are approximated as follows [32,33,34]:
and
The flexural stress and longitudinal strain at the mid-length surface, sFLEX and eFLEX, respectively, are derived as
and
Figure 3a and b show the dM/P-dM and sFLEX-eFLEX relationships obtained directly by substituting xlld into xeff in Equations (1) and (2), respectively; both relationships showed anomalous tendencies. In a previous study, xCR was determined by deriving the minimum value of dM/P, as shown in Figure 3a [32,33,34]. The P and dM values at xlld = xCR are denoted as PCR and dCR, respectively. Figure 3c and d illustrate the dM/P-dM and sFLEX-eFLEX relationships obtained by substituting xeff (= xlld - xCR) into Equations (1) and (2), respectively. The anomalous tendencies found in Figure 3a and b are effectively reduced. Using this method, scr is derived as PCR/(BH). Hereafter, this method is denoted as Method (A).
When using the buckling test data, the scr value can be evaluated using the following two classical methods in addition to Method (A):
(B) Southwell’s method:
In Southwell’s method, the buckling load is determined using the dM/P-dM relationship. As represented in Figure 3c, the dM/P-dM relationship is linear at the initiation of flexural deformation; therefore, it can be regressed into the following equation [25]:
where 1/PS and b correspond to the slope and intercept of the regressed relationship, respectively; therefore, PCR is obtained from the inverse of the slope (= PS). Similar to Method (A), scr is derived as PCR/(BH).
(C) Modified Euler method:
According to classical Euler theory, scr is predicted using data obtained from compression tests using a short column, which is performed independently of the buckling test, as follows [25]:
where Ecomp is the Young’s modulus determined using the compression test, and l is the slenderness ratio. For a sample with a rectangular cross section, l is derived using the cross-sectional area A and secondary moment of area I as follows:
As shown in Figure 3d, the initial slope of the sFLEX-eFLEX relationship is denoted as EFLEX, and scr is derived using EFLEX instead of Ecomp in Equation (6) as follows:
2.2. Buckling Stress Predicted from the Compression Test Using Short Column
As described above, scr can be predicted using Ecomp obtained from the compression tests of short columns based on classical Euler theory. Although classical Euler theory is applicable alone for a slender column where the buckling is induced prior to the onset of nonlinearity, it was extended to Engesser–Kármán theory to predict the buckling stress of a column across a wide range of slenderness ratio. To predict scr according to Engesser–Kármán theory, the stress–strain relationship obtained using compression tests should be formulated into an equation. The relationship between the compression stress scomp and compression strain ecomp is approximated into the following Ramberg–Osgood type equation [36]:
where Fcomp is the compressive strength, and Kcomp and ncomp are the parameters obtained by regression. Using Equation (9), the tangent modulus, denoted as ETAN, is derived as follows:
According to Engesser–Kármán theory, scr is represented using ETAN instead of Ecomp in Equation (6) as follows:
The scr value can be obtained by solving Equation (11) numerically. This method is defined as Method (D).
Method (D) is not always convenient because of the complexity in solving Equation (11). Several methods have been proposed to address this, such as the Johnson–Euler method, in which the scr is derived using the following two formulas [37]:
where ly is the slenderness ratio at the intersectional point between the two formulas in Equation (11); therefore,
The method for determining the scr-l relationship using Equation (12) is defined as Method (E).
3. Materials and Methods
3.1. Materials
An XPS panel (STYROFOAM IB; Dupont Styro Corporation, Tokyo, Japan) was used for the tests. It had initial dimensions of 1820, 910, and 25 mm in length, width, and thickness, respectively, the directions of which are denoted as the L-, T-, and Z-axes, respectively. The panel was roughly cut using a heat cutter into smaller dimensions, and the final dimensions of the sample were cut using a heat wire. The density of the sample was 28.7 ± 0.4 kg/m3. The length direction of the sample coincided with the L- and T-axes of the panel. The former and latter samples were defined as L- and T-type samples, respectively. In both types, the width direction coincided with the Z-axis. Five samples were used for each test condition. A universal testing machine (AUTOGRAPH AG-100kNG, Shimadzu Corporation, Kyoto, Japan) was used for all the tests.
2.2. Buckling Tests
Buckling tests were performed using the L- and T-type samples with various slenderness ratios. The value of L varied from 50 mm to 500 mm at intervals of 50 mm, whereas the values of B and H were fixed at 25 and 20 mm, respectively. From Equation (7), l varied from approximately 8.66 to 86.6 at intervals of 8.66.
Figure 4 shows a photograph of the buckling test performed in this study. An axial load P was applied via the cylindrical attachment equipped on both ends of the sample to realize the pin–pin end condition. The test was continued after the flexural deformation was significantly induced as shown in Figure 4.
The rate of loading-line displacement (= crosshead speed) is denoted as . When L was greater than 250 mm, was determined from the rate of flexural strain in the post-buckling condition . When xeff/L is in the range of 0 to 0.0676, is obtained using Equations (2) and (4) as follows:
Because xlld is derived by summing xCR and xeff, is equal to . Therefore, was derived by substituting = 0.015 /min into Equation (14) for the samples with L greater than 250 mm. However, when was determined using Equation (14) for the samples with L lower than 200 mm, the flexural deformation was not induced easily, and the testing time often exceeded 15 min. Therefore, the crosshead speed was fixed at 0.87 mm/min when L was lower than 250 mm. Table 1 lists the values of corresponding to L. The total testing time was approximately 5 min under these testing conditions.
When xlld was directly substituted into xeff in Equations (1) and (2), the dM/P-dM relationship was obtained as shown in Figure 3a. Therefore, by substituting xlld directly into xeff in Equations (1) and (2), the xCR, dCR, and scr values were determined using this dM/P-dM relationship at the minimum of dM/P, according to Method (A). Then the scr values were determined according to Methods (B) and (C) based on the aforementioned procedures.
2.2. Compression Tests Using Cubic Samples
Compression tests were performed using short columns (cubic samples) to obtain the scomp-ecomp relationship. Figure 5a and b show the detail and setup for the compression test, respectively. A cubic sample with dimensions of 25, 25, and 25 mm was used. As shown in Figure 5a, a black square with dimensions of 10 and 10 mm was marked using a stamp at the center of an LT-plane to measure ecomp. A load was applied along the L- or T-direction of the sample via a spherical attachment to reduce the bending moment at both ends of the sample with a crosshead speed of 0.5 mm/min, and scomp was obtained. During the test, the length along the loading direction of the black square was measured using a CCD camera at intervals of 0.5 sec (Figure 5b), and ecomp was analyzed using a high-speed digital image sensor (Keyence CV-5000, Keyence Corporation, Osaka, Japan). The scomp-ecomp relationship was regressed into Equation (9), and the Ecomp, Fcomp, ncomp, and Kcomp values were obtained. Using these properties, the scr-l relationships were determined according to Methods (D) and (E).
2.3. Three-Point Bending Tests
The scr-l relationship could not be obtained accurately using the Engesser–Kármán and Johson–Euler methods when using the properties obtained from the compression tests. To improve the accuracy, three-point bending tests were performed in addition to the compression tests, and the properties obtained from the former were also used to determine the scr-l relationships using the Engesser–Kármán and Johson–Euler methods.
Figure 6 shows the setup for the three-point bending test. The length, depth, and width of the sample were 400, 10, and 25 mm, respectively. Similar to the buckling test, the length direction of the sample corresponded to the L- or T-axes. The distance between the supports l was 300 mm, and a load PTPB was applied to the midspan with a crosshead speed of 50 mm/min until the load reached its maximum. The bending stress and bending strain at the outer surface of the midspan, sTPB and eTPB, respectively, are derived as follows:
where b and h are the width and depth of the sample, respectively, and dTPB is the deflection at the midspan. Similar to Equation (9), the sTPB-eTPB relationship was regressed into the following Ramberg–Osgood-type equation [36]:
where ETPB and FTPB are the bending Young’s modulus and bending strength, respectively, and KTPB and nTPB are the parameters obtained by regression. The scr-l relationship was determined based on Methods (D) using the properties obtained from the three-point bending tests as follows:
In contrast, Equation (12) was modified using ETPB and FTPB as follows:
The scr-l relationship was also determined using Equations (17) and (18).
3. Results and Discussion
3.1. Buckling Stress Obtained from Actual Buckling Test
Figure 7 illustrates comparisons of the scr-l and coefficient of variation (COV)-l relationships obtained using Methods (A), (B), and (C). Analysis of variance (ANOVA, Tukey tests) was performed on scr corresponding to l using EZR [37], and the scr-l relationships obtained using the different three methods statistically coincided with each other. In a previous study, buckling analyses were performed using a slender column of solid wood and cardboard, whose l exceeded 100 and 200, respectively [32,33]. There, the buckling preceded the onset of nonlinearity induced by the compressive force axially applied to the material. In contrast, l was lower than 100 in this study, and the buckling was often induced after the onset of material nonlinearity. When the buckling is induced in the elastic condition, EFLEX obtained from the sFLEX-eFLEX relationship should be constant. However, as shown in Figure 8, the EFLEX value decreased as l decreased. Tukey tests were also performed, and the decreasing tendency was significant when l was lower than 52.0, corresponding to L = 300 mm. Therefore, the buckling was induced after the material nonlinearity when l was lower than 52.0, and the coincidence of the results obtained using Methods (A), (B), and (C) indicates the validity of these analysis methods. In particular, Method (A) is simpler and easier than Methods (B) and (C); therefore, it is recommended to determine the buckling stress of XPS using the actual buckling test data in a wide range of slenderness ratio.
Figure 7 also indicates that the COV values calculated using the L-type samples were often greater than those calculated using the T-type samples. The anisotropic cell arrangement in XPS may partly explain this difference, but further research involving microscopic observation is required to elucidate this phenomenon.
3.2. Buckling Stress Predicted Using the Compression and Three-Point Bending Test Data
Figure 9 illustrates the representative scomp-ecomp and sTPB-eTPB relationships obtained from the compression and three-point bending tests, respectively, depicted using black solid lines. These relationships were determined as follows:
(a) The Fcomp value corresponding to each sample was determined using the maximum value of scomp.
(b) The experimentally obtained scomp-ecomp relationship was regressed into Equation (9), and the values of Ecomp, ncomp, and Kcomp were calculated for each sample.
(c) The average value of Fcomp, defined as , was calculated using five samples. Then the ecomp value corresponding to scomp = (N = 1, 2, …, 100) was calculated by substituting Ecomp, ncomp, and Kcomp into Equation (9).
(d) The ecomp values at NFcomp/100 obtained using five samples were averaged, and the averaged value was defined as .
(d) The - relationship was regressed again into Equation (9). The properties obtained from this procedure, defined as , , and , are listed in Table 2, as well as .
(e) The abovementioned process was also performed using the data obtained from the three-point tests. The values of , , and are also listed in Table 2.
Table 2 indicates that the anisotropy of XPS affected the properties. Additionally, the properties obtained using compression and three-point bending tests are significantly different from each other. In particular, the Ecomp values are approximately half the ETPB values, and these differences affect the prediction of the scr-l relationship.
Figure 10a and b show the scr-l relationships predicted by Methods (D) and (E) using Equations (12) and (13), respectively. In contrast, Figure 10c and d show the relationships predicted using Equations (17) and (18). In addition to these predictions, the results obtained using Method (A), which are close to those obtained using Methods (B) and (C), are included in these figure panels. Figure 10a and b indicate that the predictions using the properties obtained from the compression tests are close to the scr-l relationship obtained using Method (A) when l is not sufficiently great. However, this closeness is not applicable as l increases. In contrast, the inverse tendencies are significant when using the properties obtained from the three-point bending tests as shown in Figure 10c and d.
When l is sufficiently great, the Young’s modulus is dominant in determining scr; therefore, the use of ETPB is more appropriate than that of Ecomp. In contrast, as l decreases, the inelastic component in the stress–strain relationship becomes dominant. Considering these tendencies, Equations (12), (13), (19), and (20) were modified as follows:
and
Figure 10e and f represent the scr-l relationships predicted using Equations (19) and (20). The coincidence is more significant than that when using the properties obtained from the compression or three-point bending tests alone. Buckling analyses of solid wood were performed in several previous studies, and it was found that the buckling stress of long and intermediate columns could be predicted appropriately using compression test data for a short column alone [39,40]. However, as shown in Table 2, the properties of XPS obtained using the compression and bending tests were significantly different from each other. In particular, XPS can be regarded as a bi-modular material in that the tensile and compressive Young’s moduli are different from each other. Such bi-modular characteristics are commonly found in several rocks [41], and further research should be conducted to reveal the bi-modular nature of XPS. However, when both the properties obtained using compression tests and those obtained using bending tests are combined, the buckling stress of XPS can be appropriately predicted under various slenderness ratios based on Engesser–Kármán theory and the Johnson–Euler method.
4. Conclusions
In this study, buckling tests were performed using extruded polystyrene (XPS) samples with various slenderness ratios to determine their buckling stress. In addition to the buckling tests, compression and three-point bending tests were performed independently, and the buckling stress was also predicted using the properties obtained from these tests. The dependence of the buckling test on the slenderness was analyzed, and the following results were obtained:
(1) Buckling stress could be effectively determined via the actual buckling test using our proposed method, Southwell’s method, and the modified Euler method across a wide range of slenderness ratios, whether buckling occurred in the elastic or inelastic region.
(2) Among the three methods mentioned in (1), our proposed method was superior to the other two, owing to its simplicity.
(3) It was difficult to predict the buckling stress using the properties obtained from the compression tests alone or those obtained from the bending tests alone.
(4) The buckling stress could be appropriately determined when using the properties obtained from both the compression and three-point bending tests together.
Author Contributions
Conceptualization, H.Y.; methodology, H.Y.; software, H.Y.; validation, H.Y., K.Y., M.Y. and M.M.; formal analysis, H.Y.; investigation, H.Y.; resources, H.Y.; data curation, H.Y. and K.Y.; writing—original draft preparation, H.Y.; writing—review and editing, H.Y.; visualization, H.Y.; supervision, M.Y. and M.M.; project administration, H.Y. All the authors have read and agreed to the published version of the manuscript.
Funding
This research received no external funding.
Institutional Review Board Statement
Not applicable.
Data Availability Statement
The data presented in this study are available on request from the corresponding author.
Acknowledgments
This work was supported by JSPS KAKENHI Grant Number 23K26970.
Conflicts of Interest
The authors declare no conflicts of interest.
Nomenclature
b = width of the sample used for the three-point bending test;
B = width of the sample used for the buckling test;
Ecomp = Young’s modulus obtained from the compression test;
EFLEX = Young’s modulus obtained from the buckling test under post-buckling condition;
ETAN = tangent modulus;
ETPB = Young’s modulus obtained from the three-point bending test;
h = depth of the sample used for the three-point bending test;
H = depth of the sample used for the buckling test;
l = length between the span in the three-point bending test;
L = length of the sample used for the buckling test;
ncomp and Kcomp = parameters obtained by regressing the scomp-ecCOMP relationship into the Ramberg–Osgood type function;
nTPB and KTPB = parameters obtained by regressing the sTPB-eTPB relationship into Ramberg-Osgood type function;
P = load applied to the sample;
xCR = critical displacement for buckling;
xeff = effective displacement for lateral deflection;
xlld = loading-line displacement;
ecomp = strain in the loading direction obtained from the compression test;
eTPB = strain at the surface of the midspan obtained from the three-point bending test;
l = slenderness ratio;
scomp = compressive stress in the loading direction obtained from the compression test;
scr = critical stress for buckling;
sTPB = bending stress at the surface of the midspan obtained from the three-point bending test;
ANOVA = analysis of variance;
COV = coefficient of variation;
L, T, and Z = length, width, and thickness directions of the XPS panel, respectively;
XPS = extruded polystyrene;
References
- Wheatley, S.J.; Mallett, A.J. Foam plastic insulation for high temperature and shock protection. J. Cell. Plast. 1970, 6, 112-118. [CrossRef]
- Wang, K.; Yang, L.; Kucharek, M. Investigation of the effect of thermal insulation materials on packaging performance. Packag. Technol. Sci. 2020; 33, 227-236.
- Seto, H.; Saito, I.; Onuki, A.; Takeuchi, M.; Tsuchiya, T. Presumption of the source of indoor air pollution. Amounts of styrene and butanol generation from construction materials. Ann. Rep. Tokyo Metr. Res. Lab. P. H. 2000, 51, 219-222. [CrossRef]
- Aoyagi, R.; Matsunobu, K.; Matsumura T. Development of continuous vapor generation for calibration styrene with permeation tube method. Indoor Environ. 2009, 52, 97-102.
- Matsumoto, T.; Iwamae, A.; Wakana, S.; Mihara, N. Effect of the temperature-humidity condition in the room and under the floor by heat insulation tatami and flooring. Summaries of Technical Papers of Annual Meeting, Kobe, Japan, 13 September; Architectural Institute of Japan (Environmental Engineering II): Tokyo, Japan, 2014.
- Ishida, M.; Sasaki, H.; Horie, K. Compressive strength of insulation materials for heatstorage tank. Summaries of Technical Papers of Annual Meeting, Kobe, Japan, 13 September; Architectural Institute of Japan (Environmental Engineering II): Tokyo, Japan, 2011.
- Gnip, I.; Keršulis, V.; Vaitkus, S.; Vėjelis, S. Assessment of strength under compression of expanded polystyrene (EPS) slabs. Mater Sci. 2004, 10, 326-329.
- Hu, Y.; Nakao, T.; Nakai, T.; Gu, J.; Wang, F. Dynamic properties of three types of wood-based composites. J. Wood Sci. 2005, 51, 7-12. [CrossRef]
- Hu, Y.; Nakao, T.; Nakai, T.; Gu, J.; Wang, F. Vibrational properties of wood plastic plywood. J. Wood Sci. 2005, 51, 13-17. [CrossRef]
- Kawasaki, T.; Kawai, S. Thermal insulation properties of wood-based sandwich panel for use as structural insulated walls and floors. J. Wood Sci. 2005, 52, 75-83. [CrossRef]
- Glass, S.; Kochkin, V.; Drumheller, S.C.; Barta, L. Moisture performance of energy-efficient and conventional wood-frame wall assemblies in a mixed-humid climate. Buildings 2015, 5, 759-782. [CrossRef]
- Kim, J.H.; You, Y.-C. Composite behavior of a novel insulated concrete sandwich wall panel reinforced with GFRP shear grids: effect of insulation types. Materials 2015, 8, 899-913. [CrossRef]
- Vervloet, J.; Kapsalis, P.; Verbruggen, S.; Kadi, M.E.; De Munck, M.; Tysmans, T. Characterization of the bond between textile reinforced cement and extruded polystyrene by shear test. Proceedings 2018, 2, 419.
- Selver, E.; Kaya, G. Flexural properties of sandwich composite laminates reinforced with glass and carbon Z-pins. J. Compos. Mater. 2019, 53, 1347-1359. [CrossRef]
- Cai, S.; Zhang, B.; Cremaschi, L. Review of moisture behavior and thermal performance of polystyrene insulation in building applications. Buil. Environ. 2017, 123, 50-65. [CrossRef]
- Gupta, R.K.; Agarwal, S.; Mukhopadhyay, P. Plastics in buildings and construction. In: Kutz M (eds) Applied plastics engineering handbook. 3rd ed. Amsterdam: Elsevier, 2024, pp.683-703.
- 30 May.
- 30 May.
- Doroudiani S. and Omidian H. Environmental, health and safety concerns of decorative mouldings made of expanded polystyrene in buildings. Buil Environ 2010; 45: 647–654.
- Kardomateas, G.A; Simitses, G.J. Comparative studies on the buckling of isotropic, orthotropic, and sandwich columns. Mech. Adv. Mater. Struct. 2004, 11, 309-327. [CrossRef]
- Liu, T.; Deng, Z.C.; Lu, T.J. Analytical modeling and finite element simulation of the plastic collapse of sandwich beams with pin-reinforced foam cores. Int. J. Solid. Struct. 2008, 45, 5127-5151. [CrossRef]
- Eyvazian, A.; Taghizadeh, S.A.; Hamouda, A.M.; Tarlochan, F.; Moeinifard, M.; Gobbi, M. Buckling and crushing behavior of foam-core hybrid composite sandwich columns under quasi-static edgewise compression. J. Sandwich Struct. Mater. 2021, 23, 2643-2670. [CrossRef]
- 2: 20504, 2050; 23. ISO 20504:2006, Fine ceramics (advanced ceramics, advanced technical ceramics)-Test method for compressive behaviour of continuous fibre-reinforced composites at room temperatures, International Organization for Standardization, Geneva, Switzerland, 2006.
- 2: R 1673, 1673; 24. JIS R 1673:2007, Test method for compressive behavior of continuous fiber-reinforced ceramic matrix composites at room temperatures, Japan Standards Association, Tokyo, Japan, 2007.
- Timoshenko, S.P.; Gere, J.M. Theory of elastic stability, 2nd ed.; McGraw-Hill: Singapore, 1963; pp. 163-184.
- Fairker, J.E. A study of the strength of short and intermediate wood columns by experimental and analytical methods. For. Prod. Lab. Rep. FPL-028, 1964, 330-335.
- Kúdela, J.; Slaninka, R. Stability of wood columns loaded in buckling Part 1. Centric buckling. Wood Res. 2002, 47, 19-34.
- Koczan, G.; Kozakiewicz, P. (2016) Comparative analysis of compression and buckling of European beech wood (Fagus sylvatica L.). Ann. WULS SGGW, For. Wood Technol. 2016, 95, 81-90.
- Kotšmíd, S.; Beňo, P. Determination of buckling loads for wooden beams using the elastic models. Arch. Appl. Mech. 2019, 89: 1501-1512. [CrossRef]
- Kambe, W.; Takahashi, S.; Ito, T.; Aoki, K. An experimental study on compression resistant performance of thick plywood as an axial member. J. Struct. Construct. Eng. AIJ 2013, 684, 355-361. [CrossRef]
- Li, Z.; He, M.; Tao, D.; Li, M. Experimental buckling performance of scrimber composite columns under axial compression. Compos B 2016, 86, 203-213. [CrossRef]
- Yoshihara, H.; Maruta, M. Critical load for buckling of solid wood elements with a high slenderness ratio determined based on elastica theory. Holzforschung 2021, 76, 179-187. [CrossRef]
- Yoshihara, H; Yoshinobu, M.; Maruta, M. Buckling test of flat cardboard and examination of critical load for fuckling. Mokuzai Gakkaishi 2022, 68, 165-171. [CrossRef]
- Yoshihara, H; Yoshinobu, M.; Maruta, M. Effects of testing methods and sample configuration on the flexural properties of extruded polystyrene. Polymers 2024, 16, 1857. [CrossRef]
- Yoshihara, H.; Maruta, M. Measurement of the shear properties of extruded polystyrene foam by in-plane shear and asymmetric four-point bending tests. Polymers 2020, 12, 47. [CrossRef]
- Ramberg, W.; Osgood, W.R. Description of stress-strain curves by three parameters. NACA TN-902, 1943.
- Timoshenko, S.P.; Gere, J.M. Theory of elastic stability, 2nd ed.; McGraw-Hill: Singapore, 1963; pp. 195-197.
- .
- Yoshihara, H.; Ohta, M. Analysis of the buckling stress of an intermediate wooden column by the tangent modulus theory. Mokuzai Gakkaishi 1995, 41, 367-372. [CrossRef]
- Yoshihara, H.; Ohta, M.; Kubojima, Y. Prediction of the buckling stress of intermediate wooden columns using the secant modulus. J. Wood Sci. 1998, 44, 69-72. [CrossRef]
- Patel, S.; Martin, C.D. Evaluation of tensile Young’s modulus and Poisson’s ratio of a bi-modular rock from the displacement measurements in a Brazilian test. Rock Mech. Rock Eng. 2018, 51, 361-373.
Figure 1.
Diagram of the pre- and post-buckling conditions in an axially loaded column. Dashed and solid lines represent the pre- and post-buckling conditions, respectively.
Figure 1.
Diagram of the pre- and post-buckling conditions in an axially loaded column. Dashed and solid lines represent the pre- and post-buckling conditions, respectively.
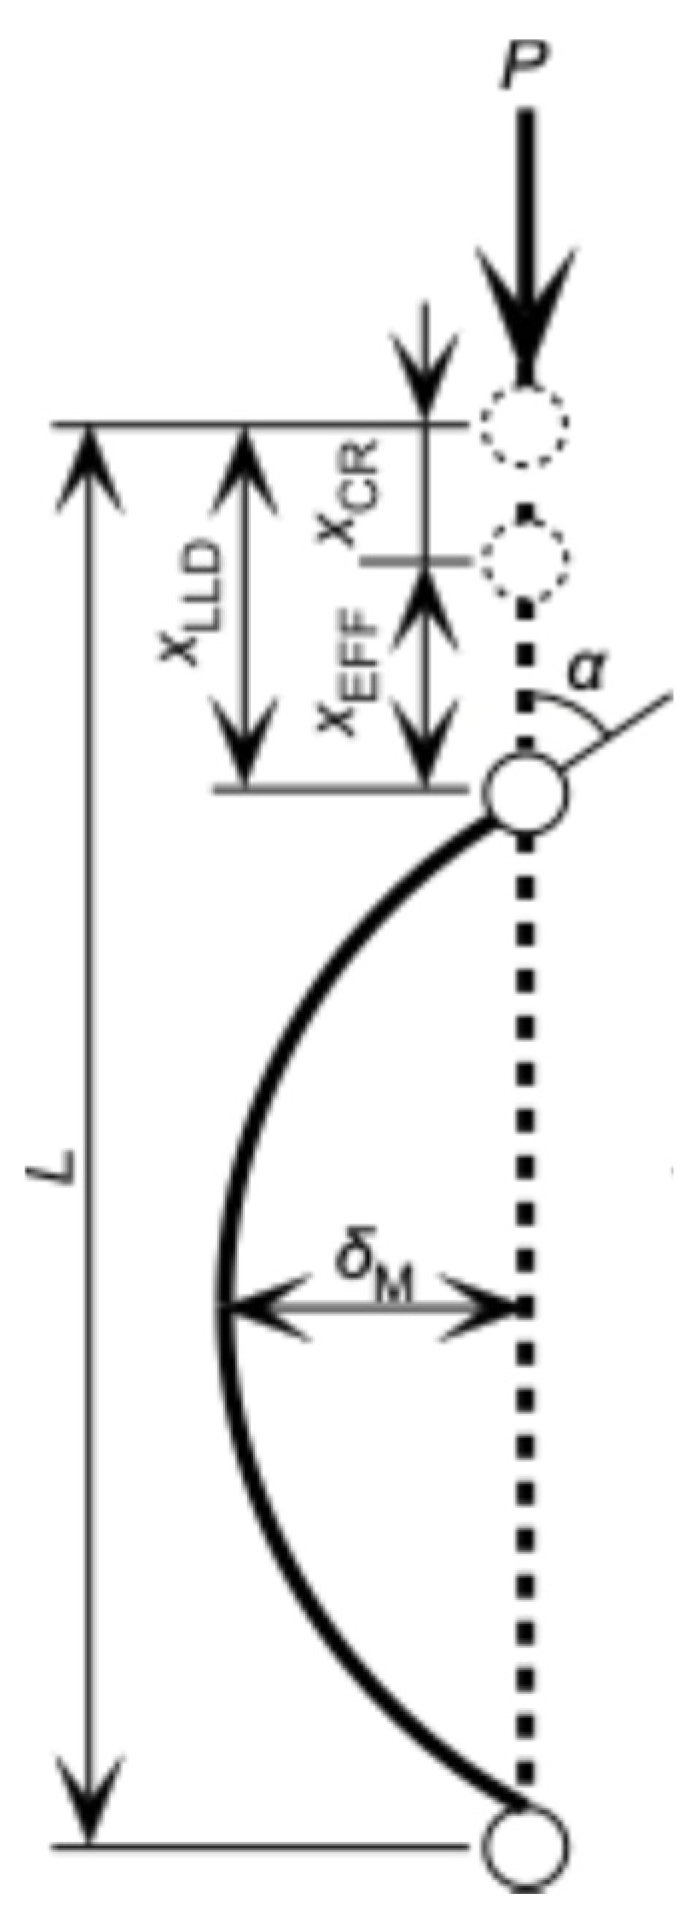
Figure 2.
Relationships between axial stress sAX and loading-line displacement xlld obtained using XPS samples with various lengths.
Figure 2.
Relationships between axial stress sAX and loading-line displacement xlld obtained using XPS samples with various lengths.
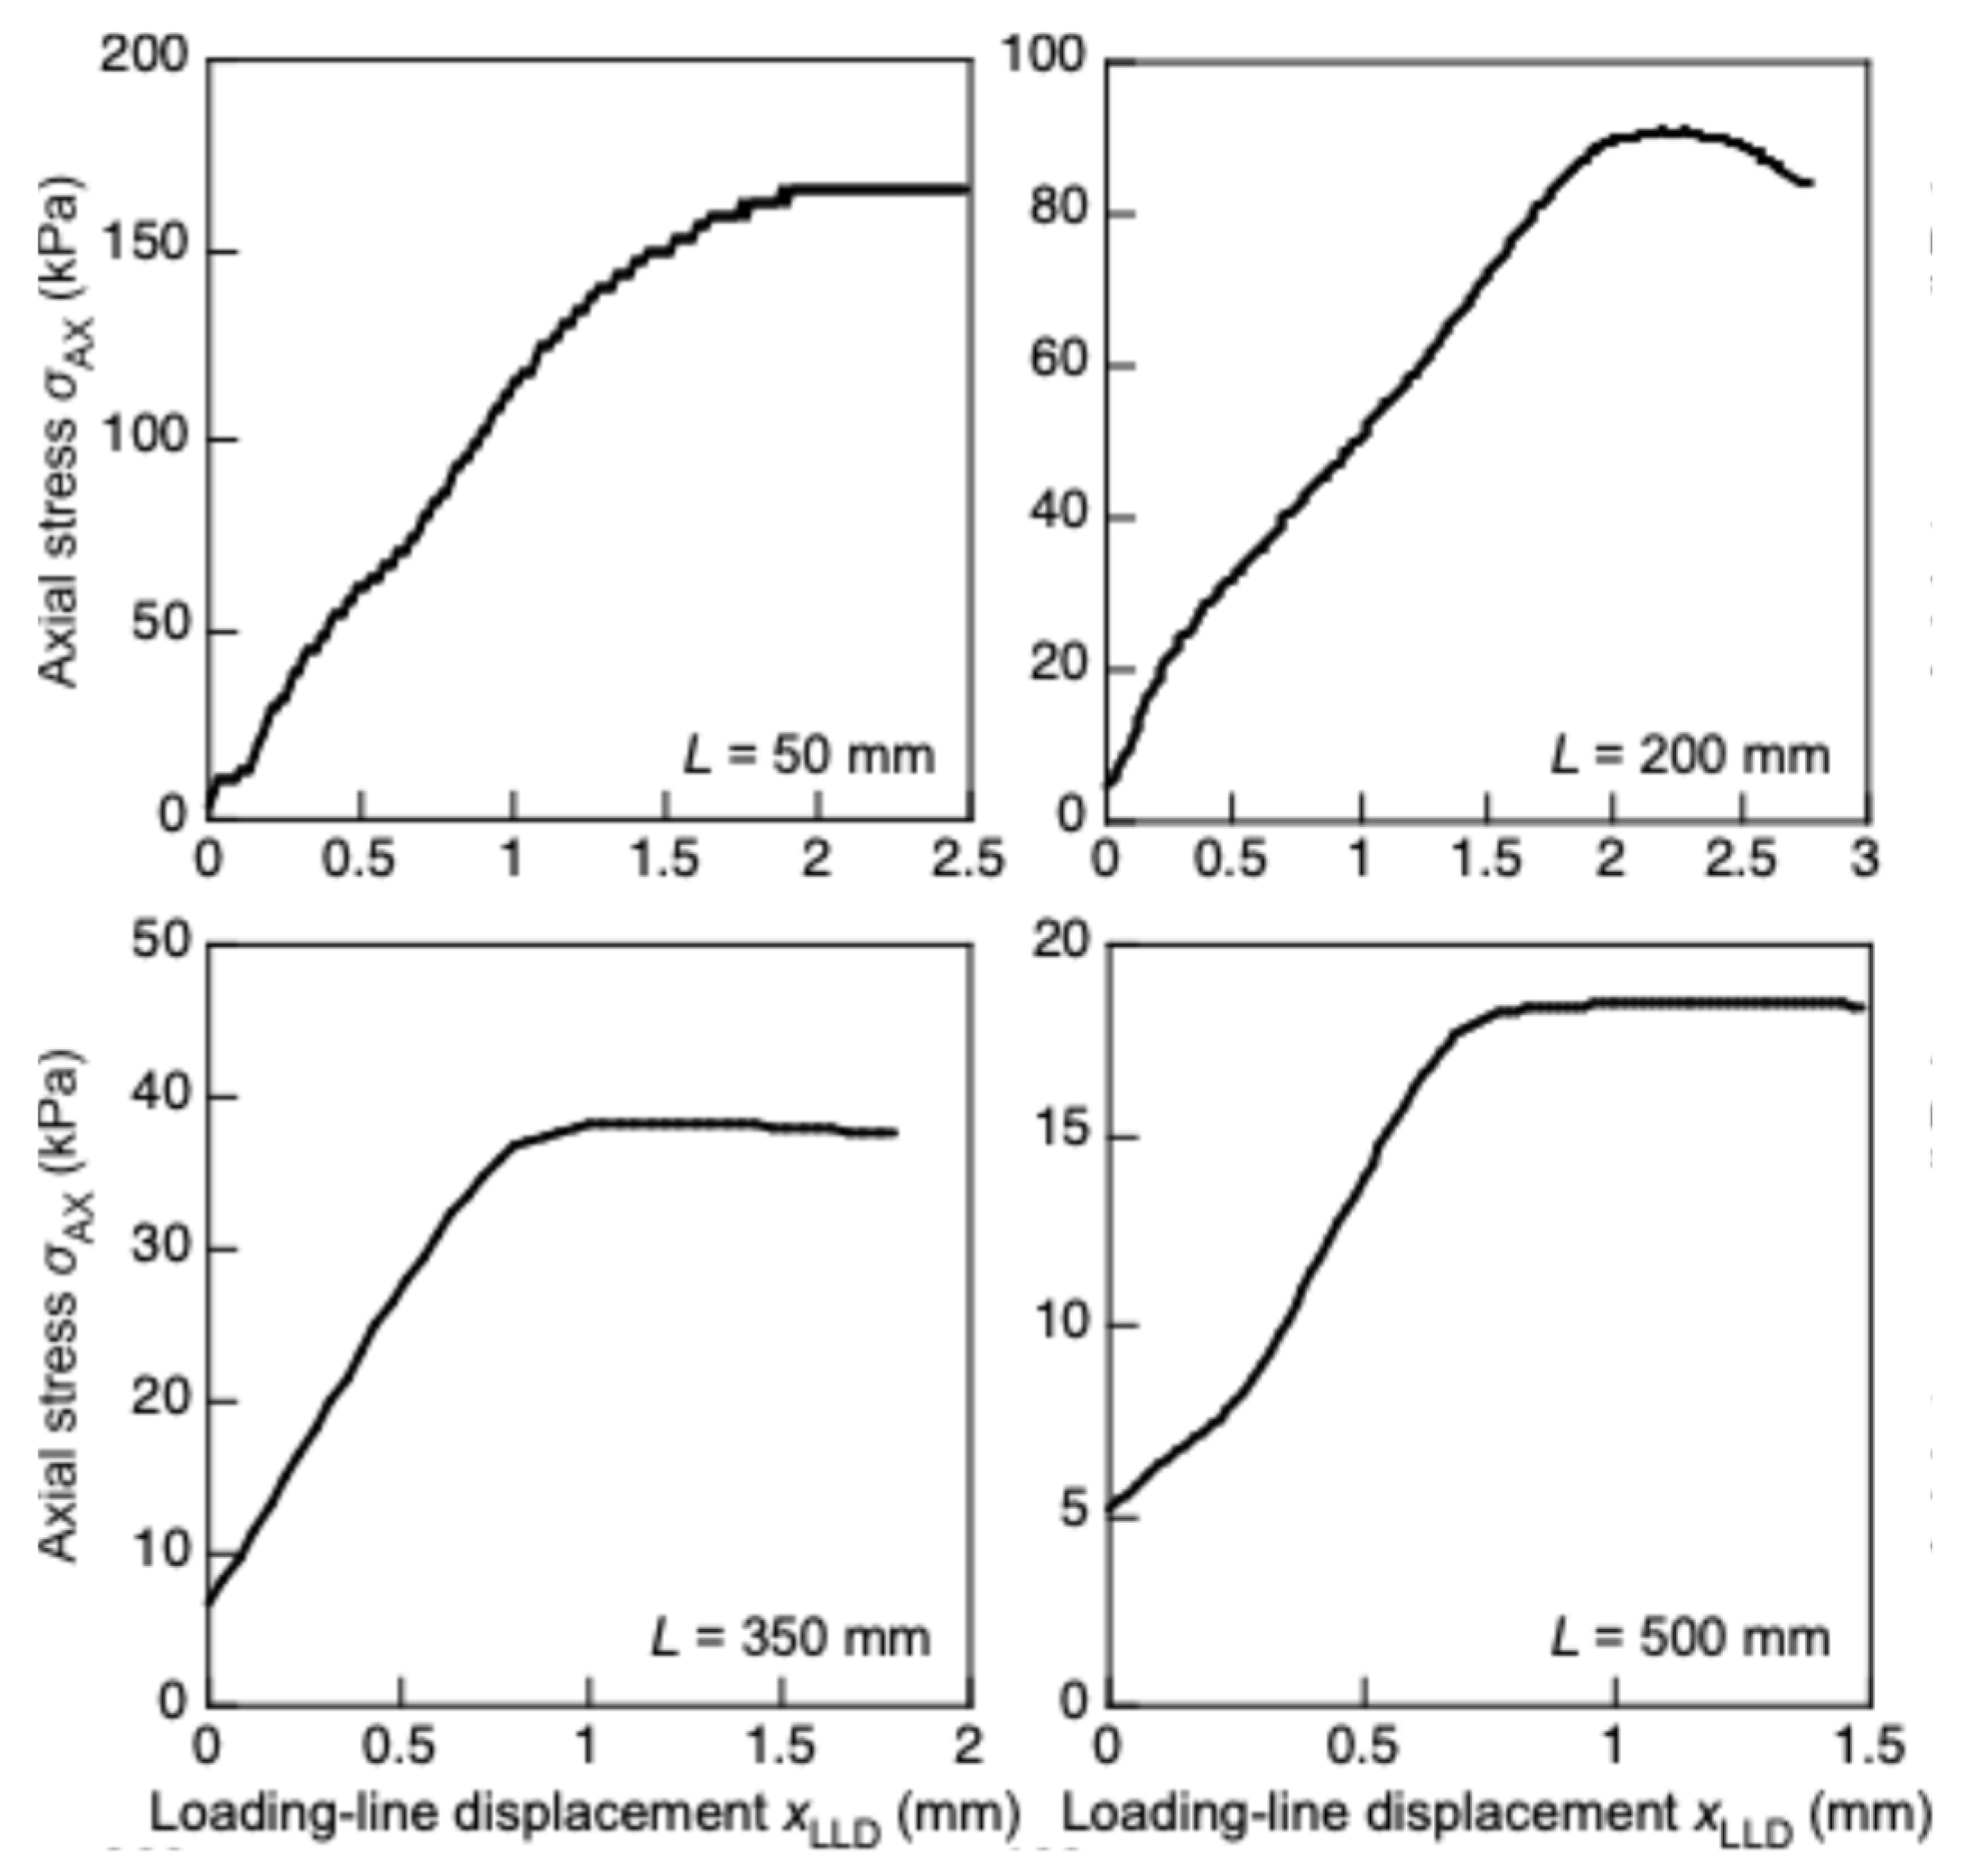
Figure 3.
(a) and (b) dM/P-dM and sFLEX-eFLEX relationships obtained directly by substituting xlld into x in Equations (1) and (2), respectively, and (c) and (d) dM/P-dM and sFLEX-eFLEX relationships obtained by substituting the loading-line displacement after subtracting xCR from xlld, respectively.
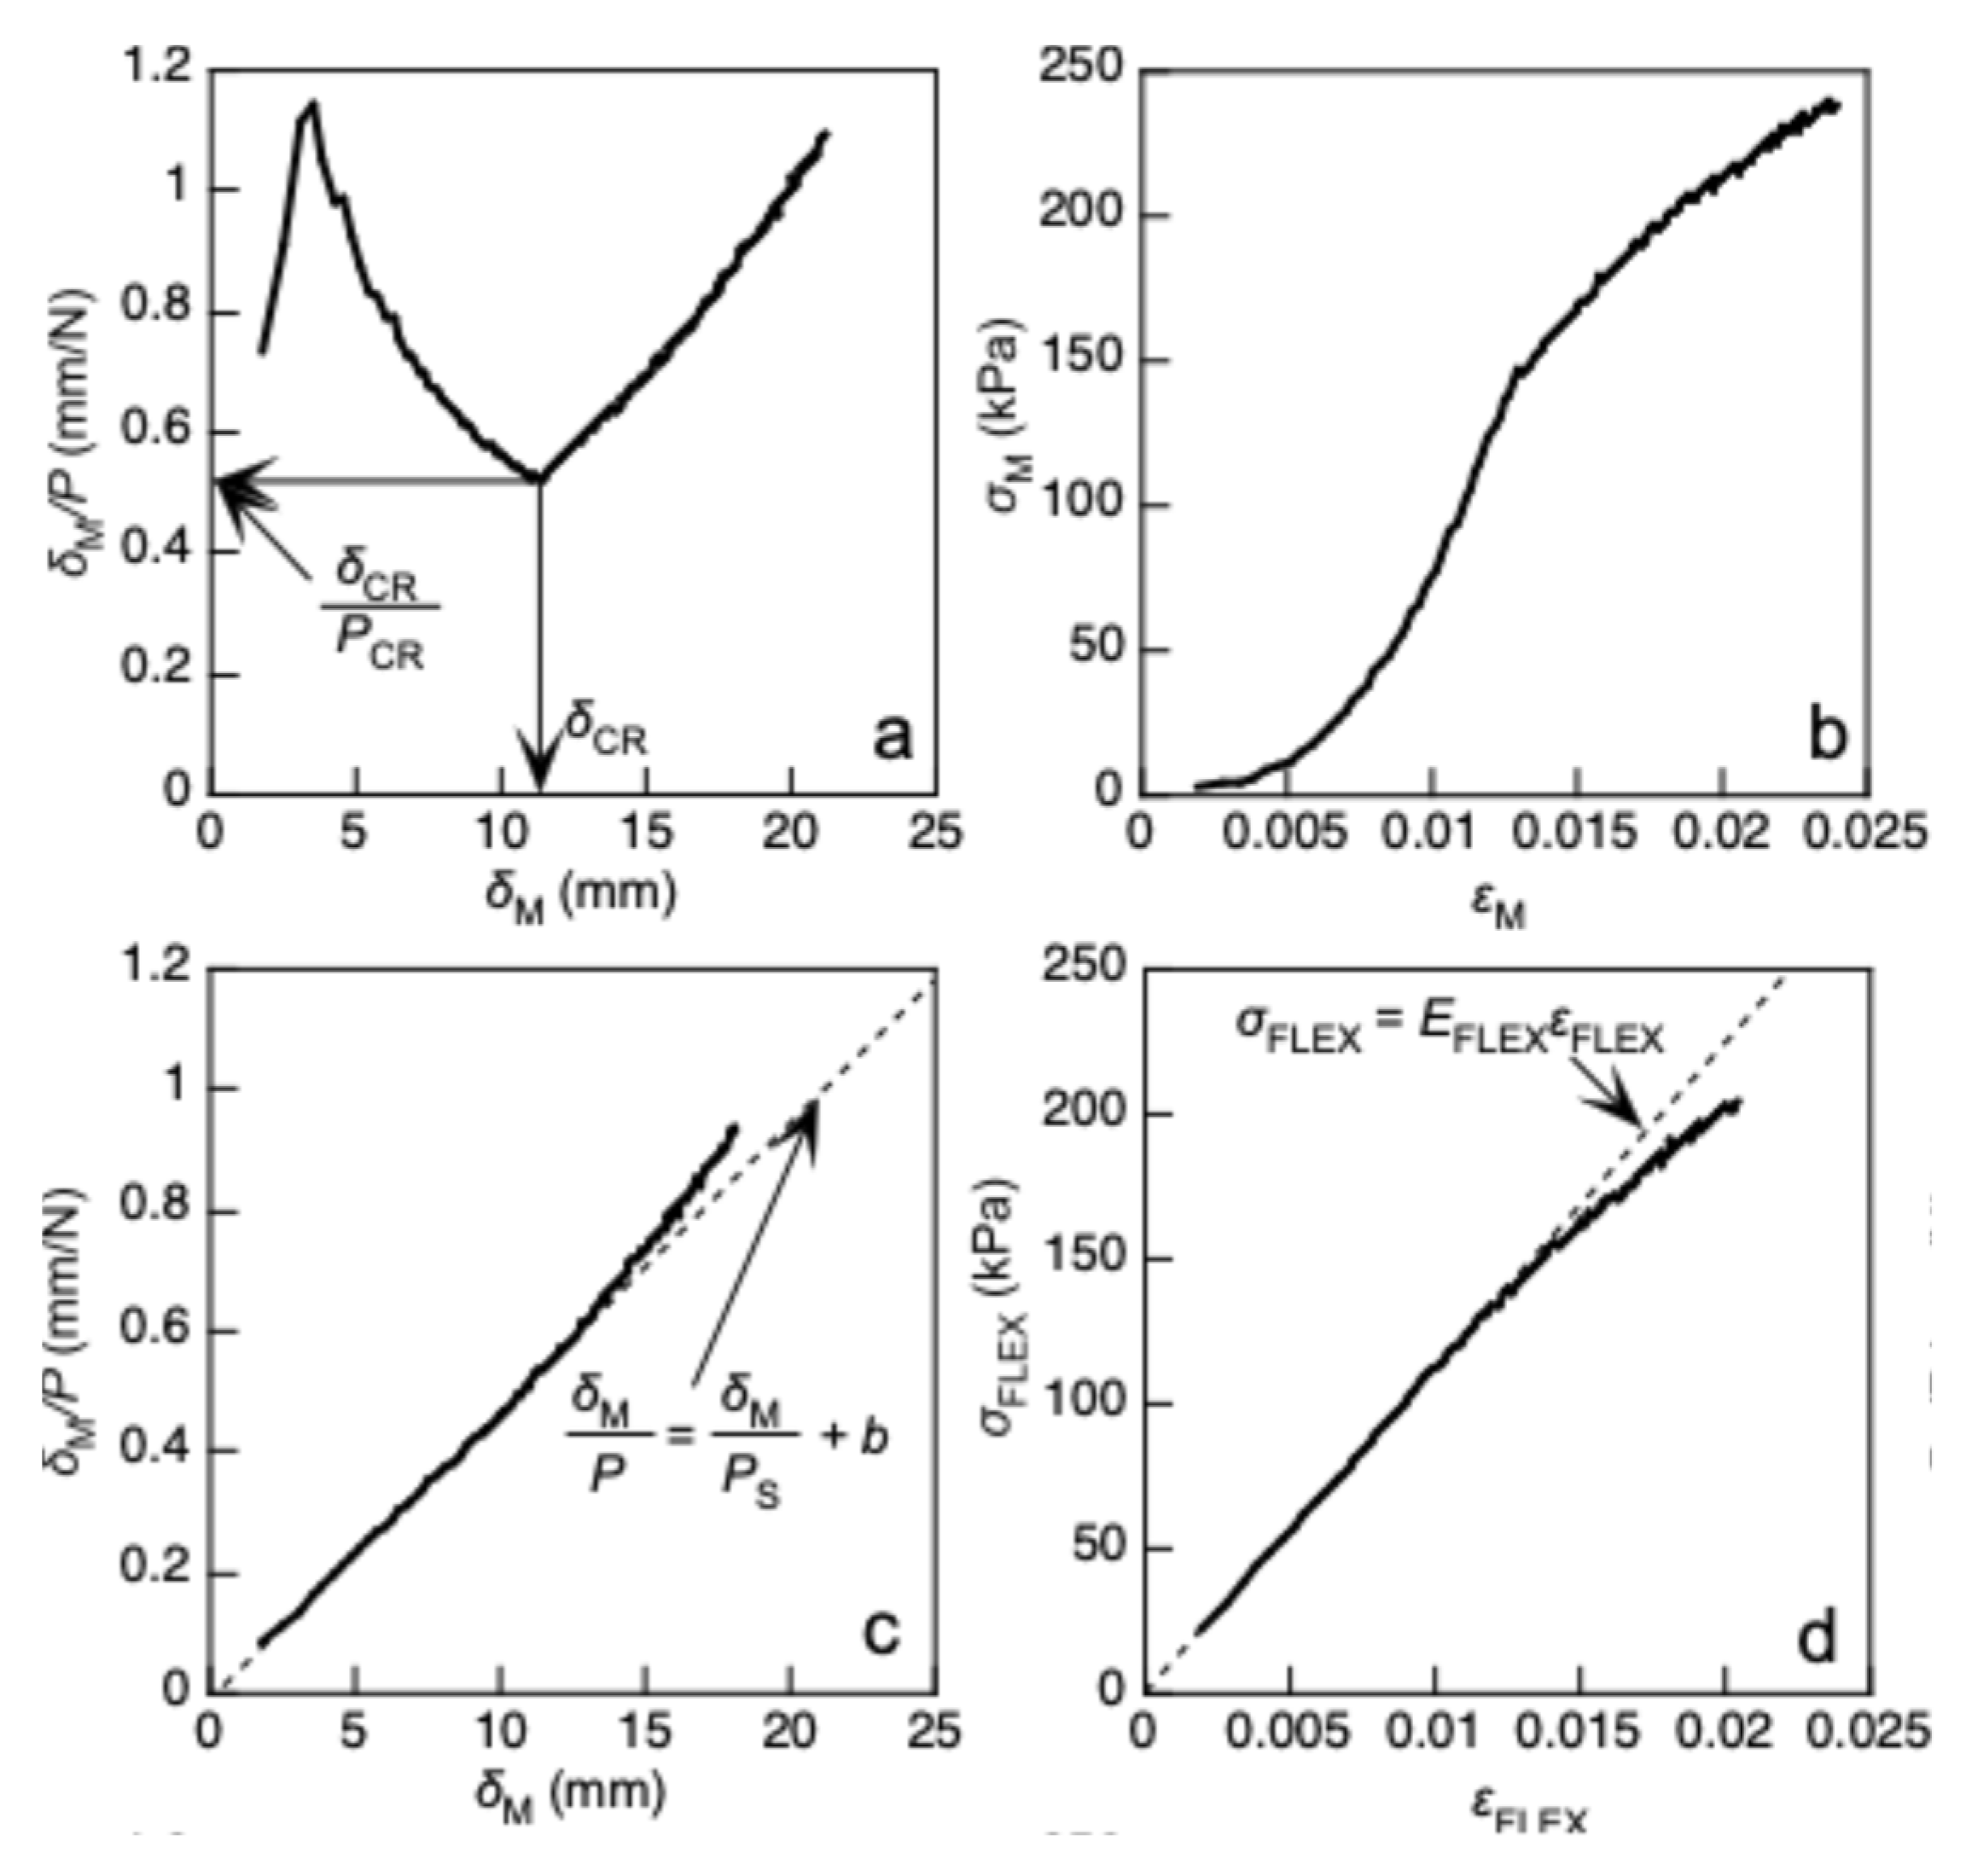
Figure 4.
Setup for the buckling test and flexural deformation of the sample in the post-buckling condition.
Figure 4.
Setup for the buckling test and flexural deformation of the sample in the post-buckling condition.
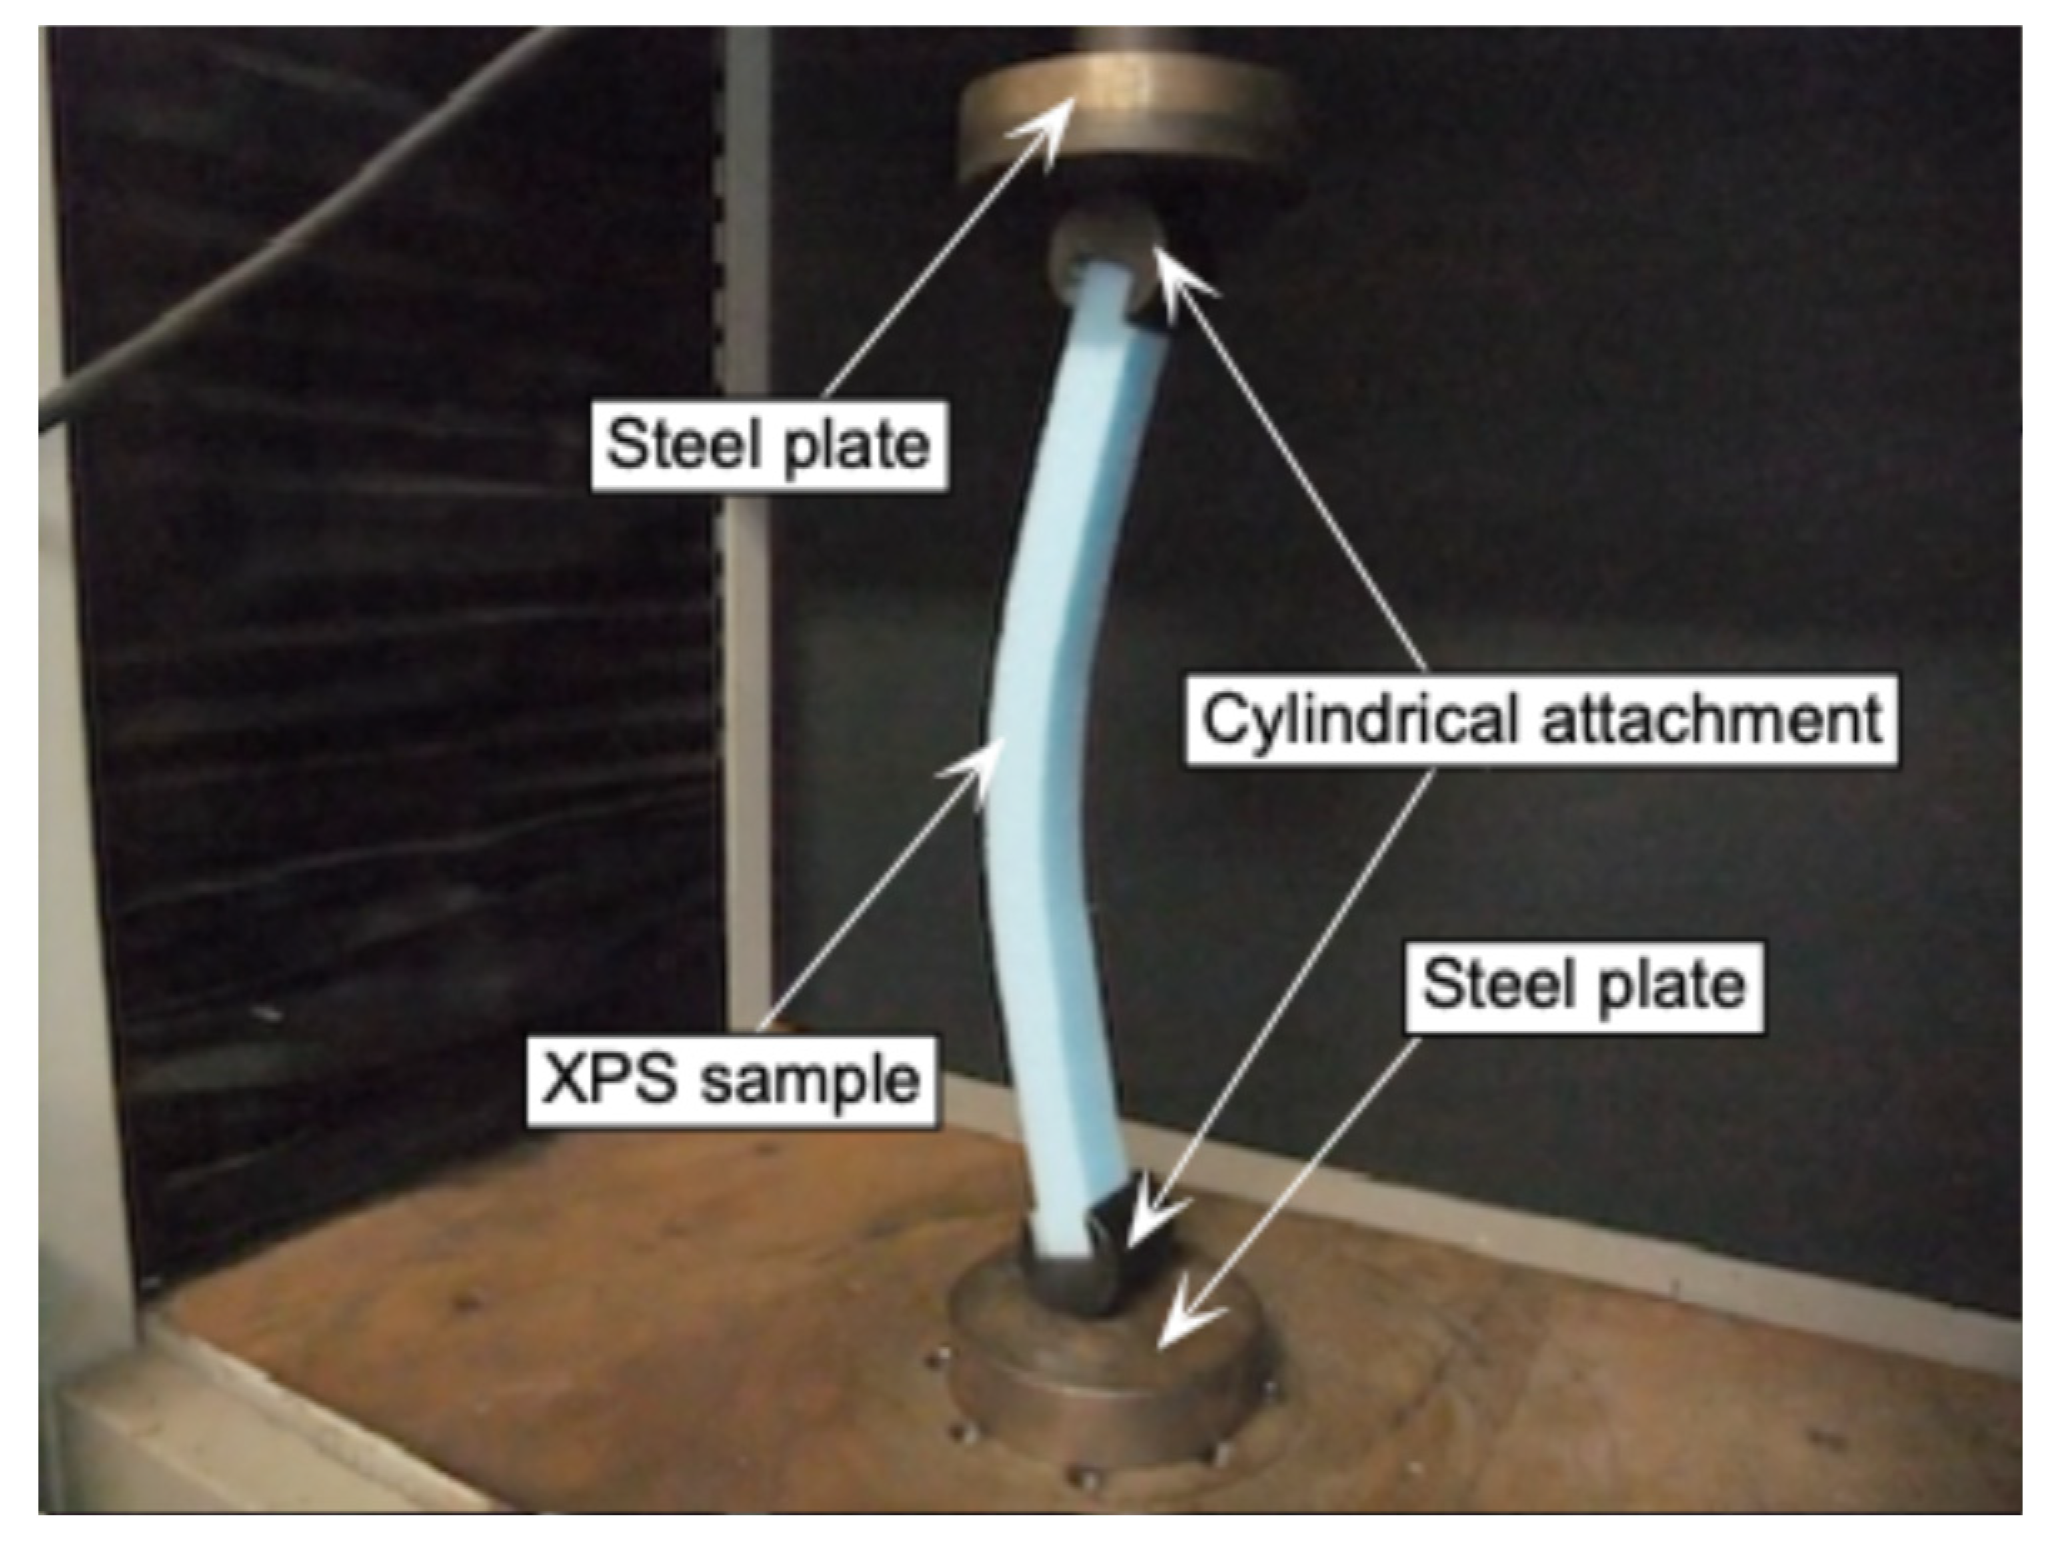
Figure 5.
Detail (a) and setup (b) of the compression test.
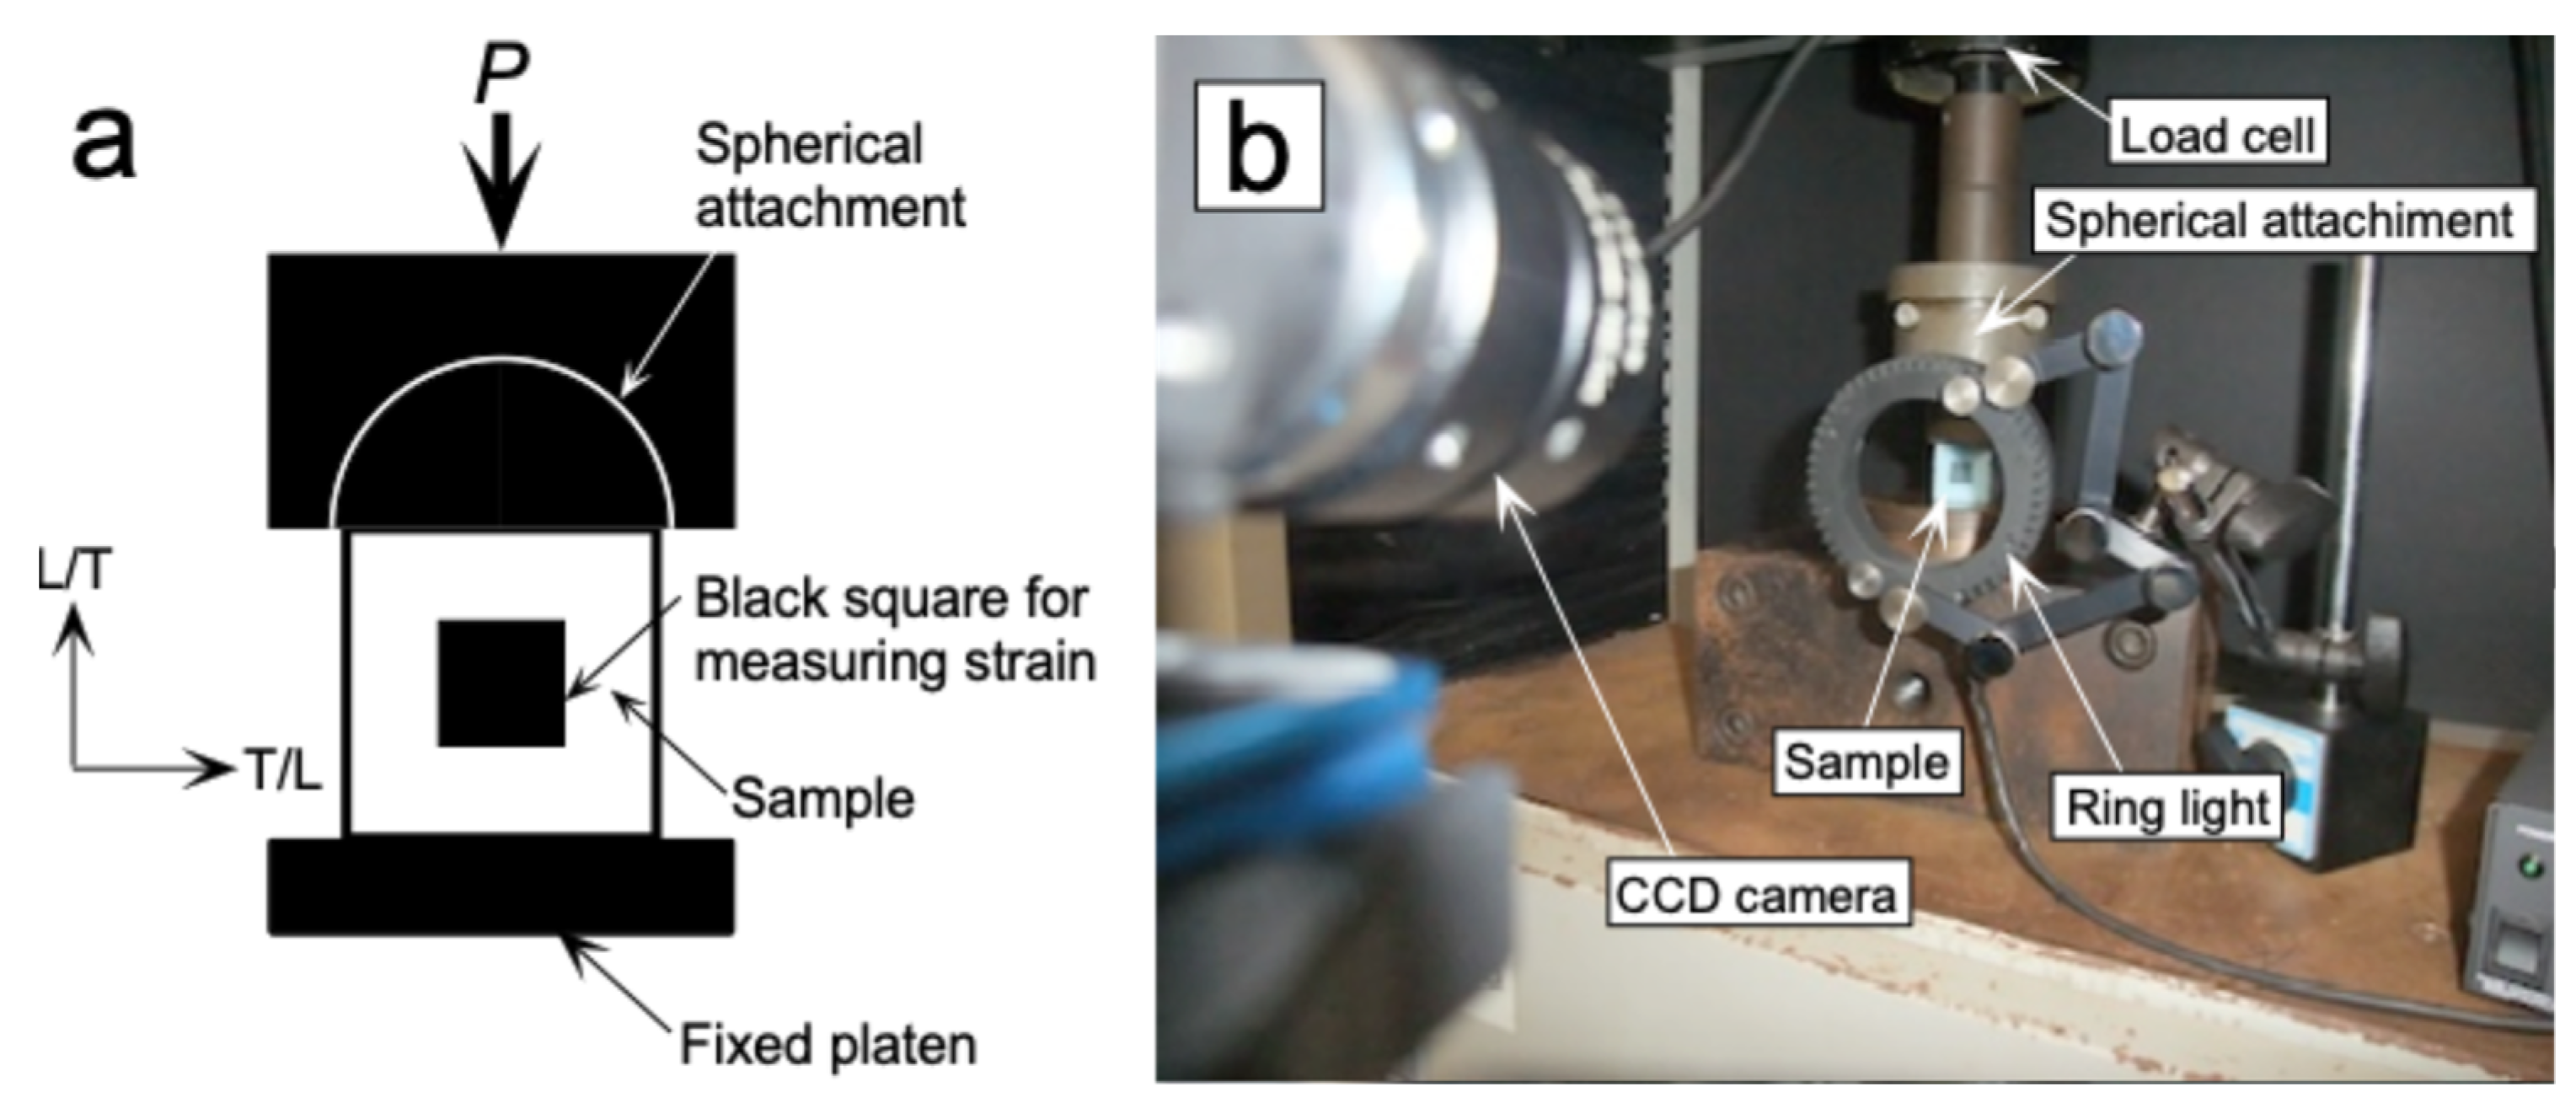
Figure 6.
Setup for the three-point bending test.
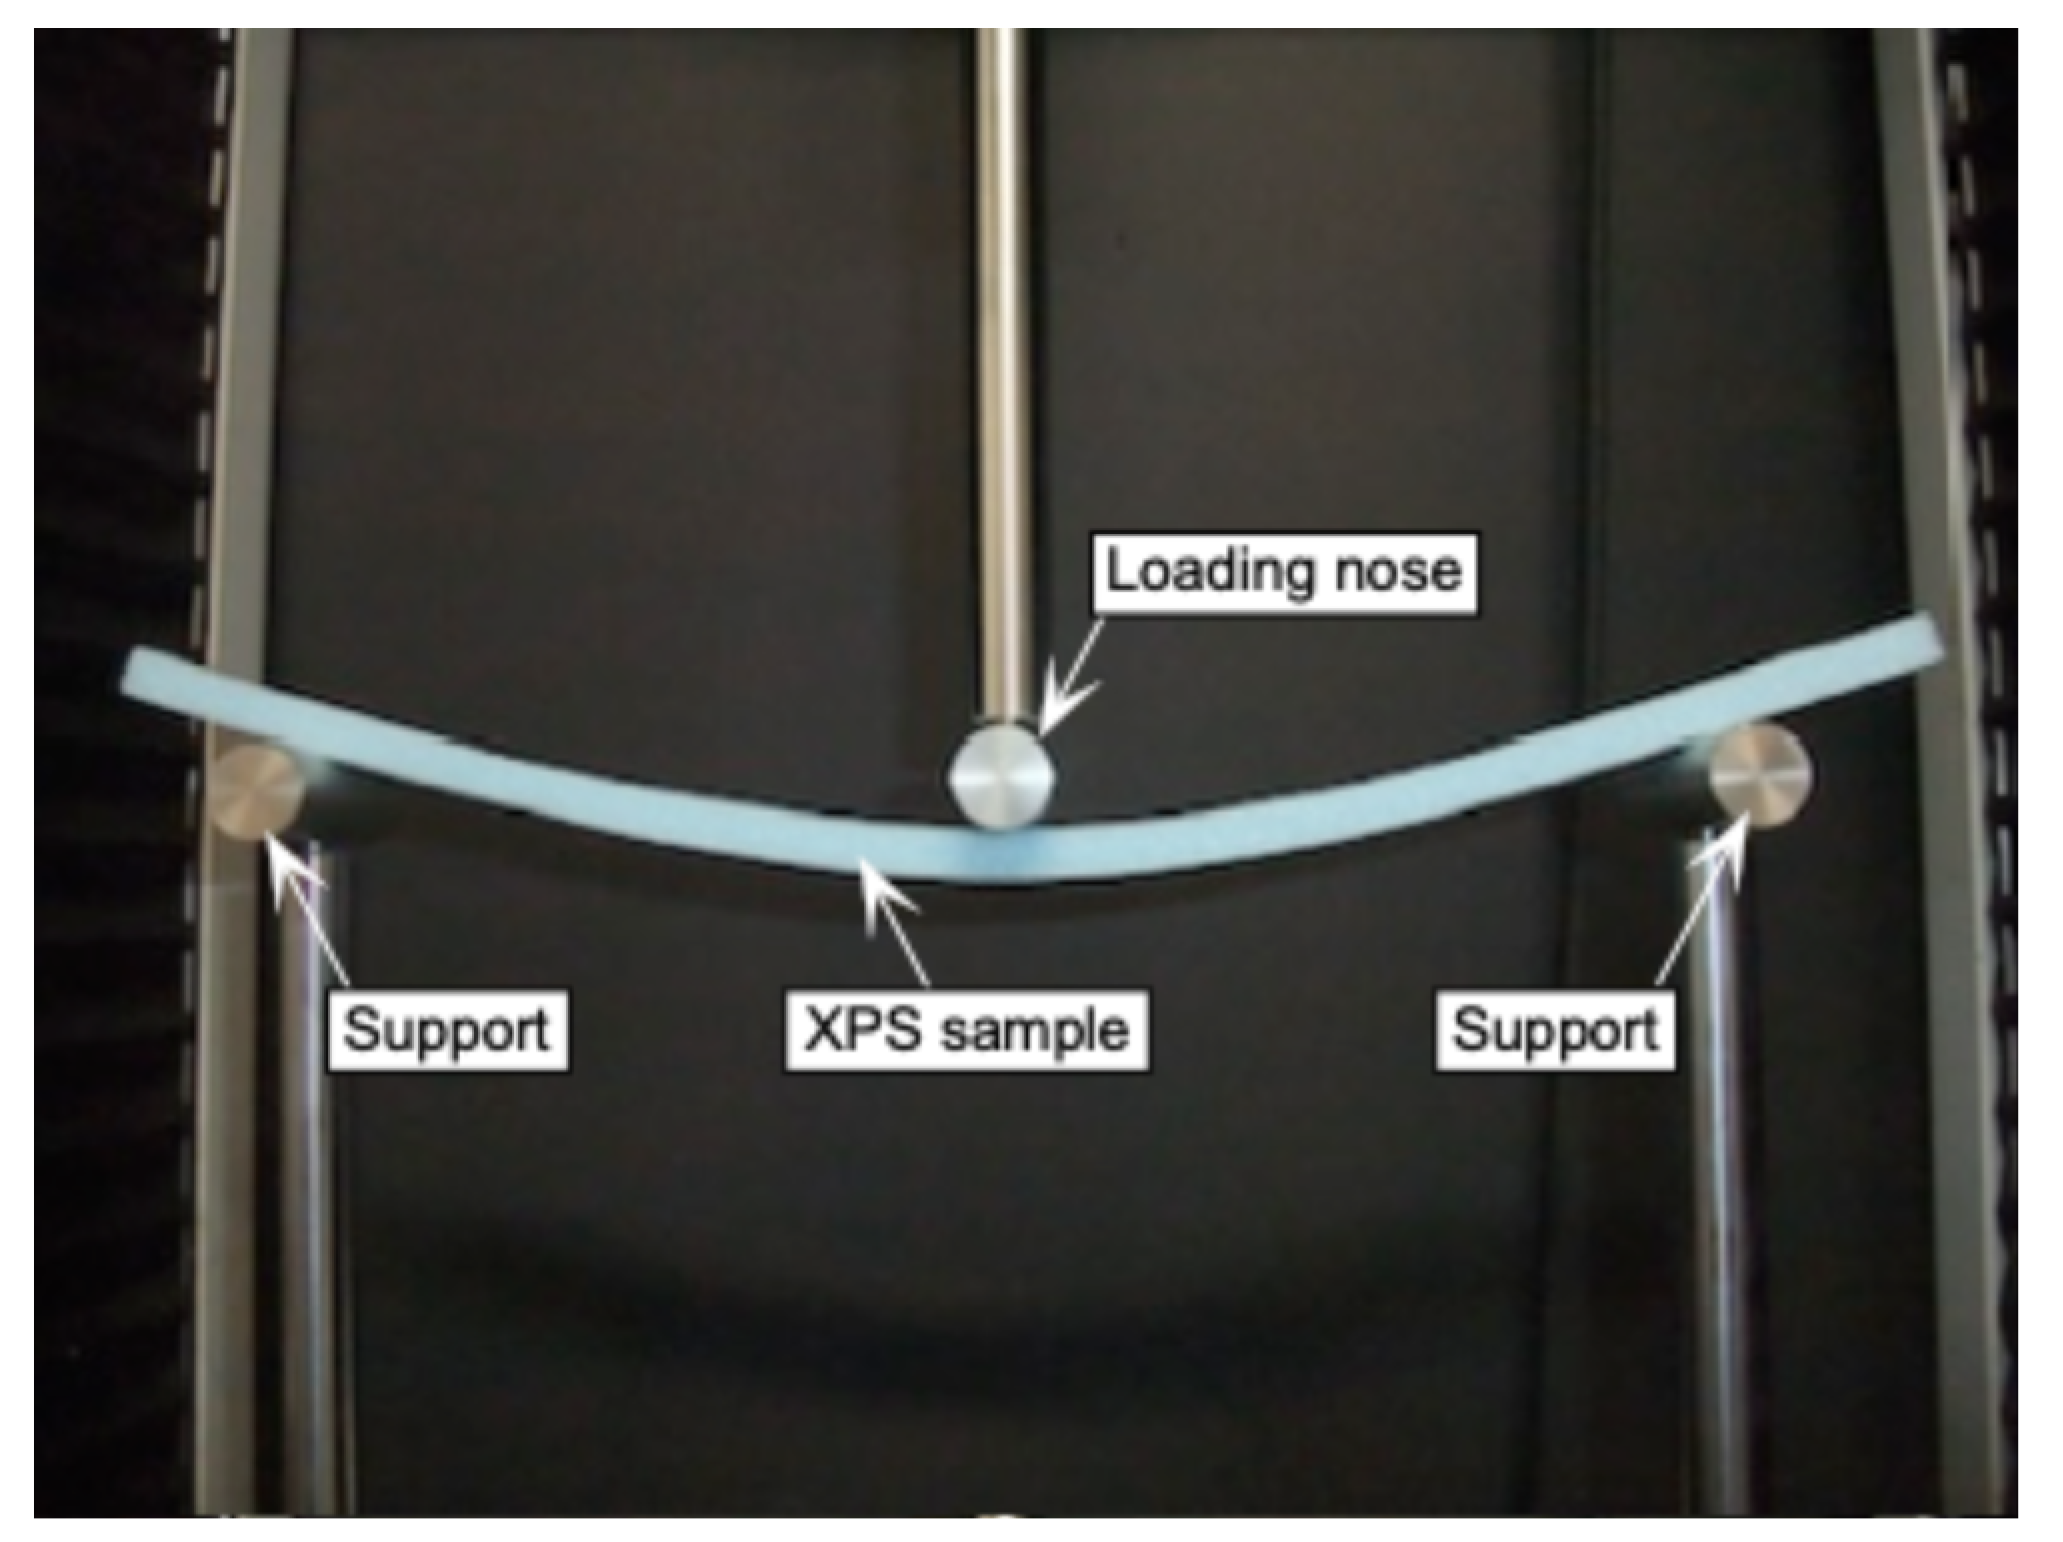
Figure 7.
scr-l and COV-l relationships obtained using Methods (A), (B), and (C).
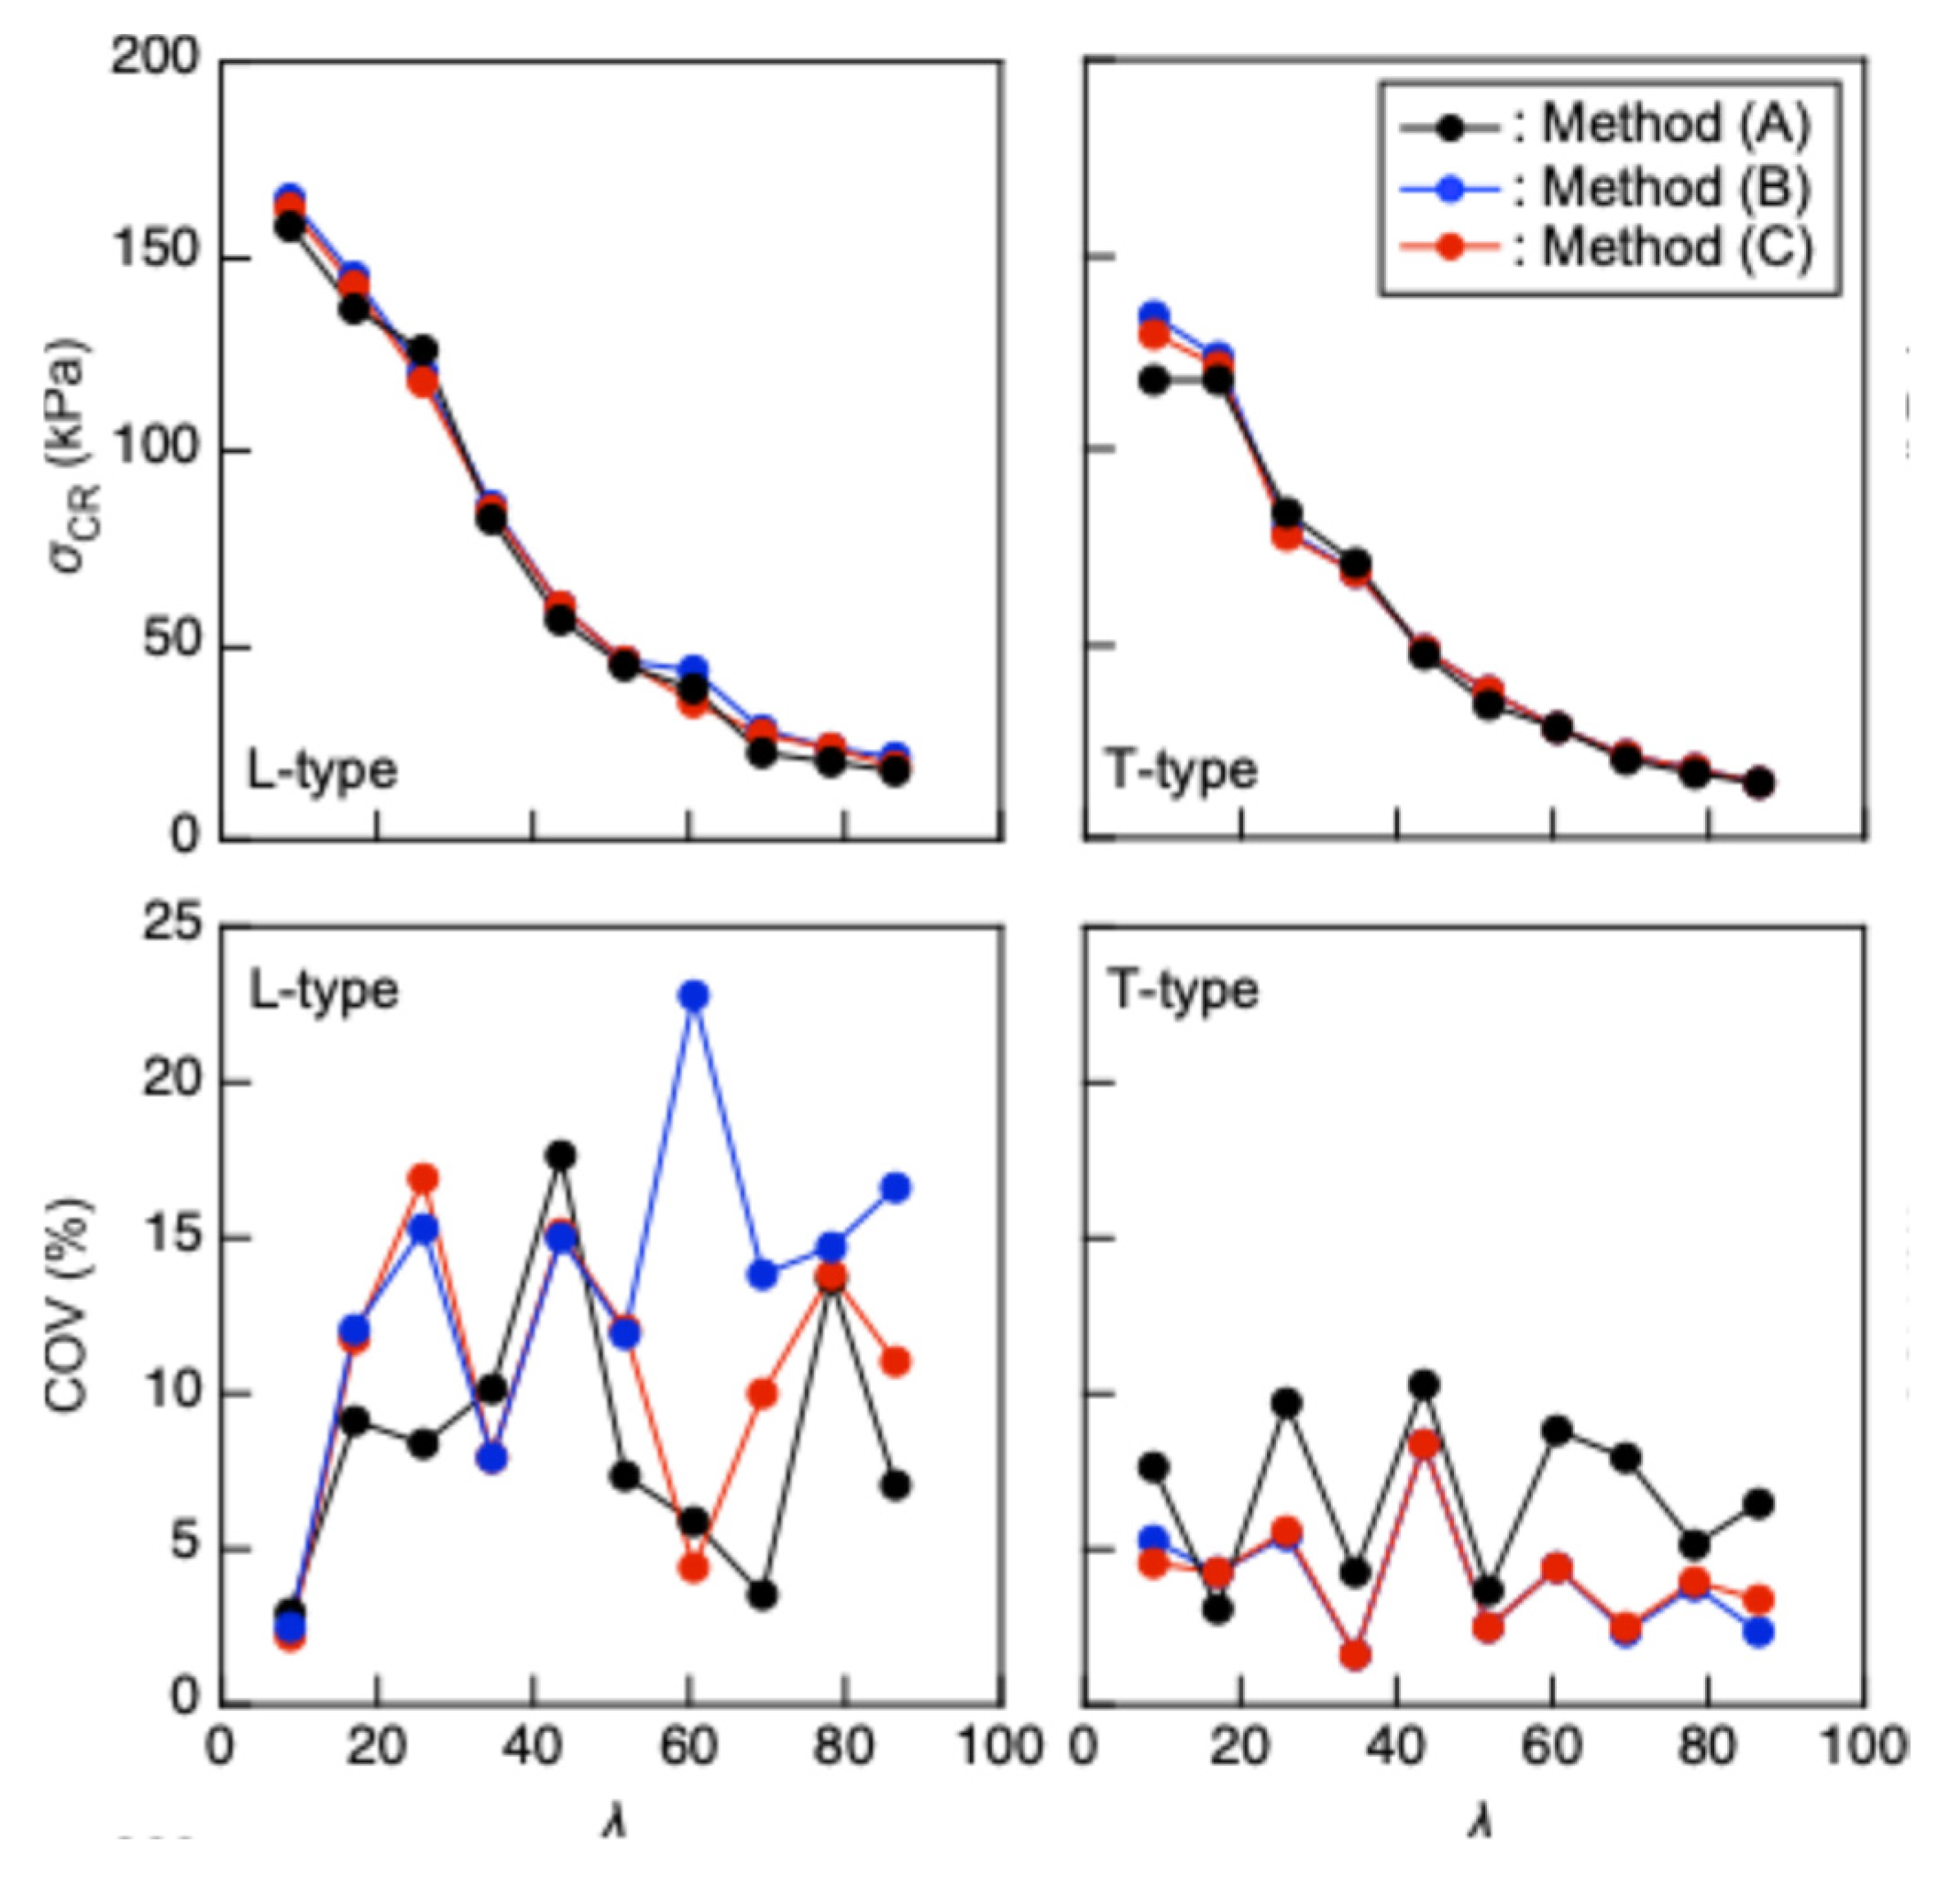
Figure 8.
EFLEX-l relationship obtained using Method (B). Results = average ± standard deviations.
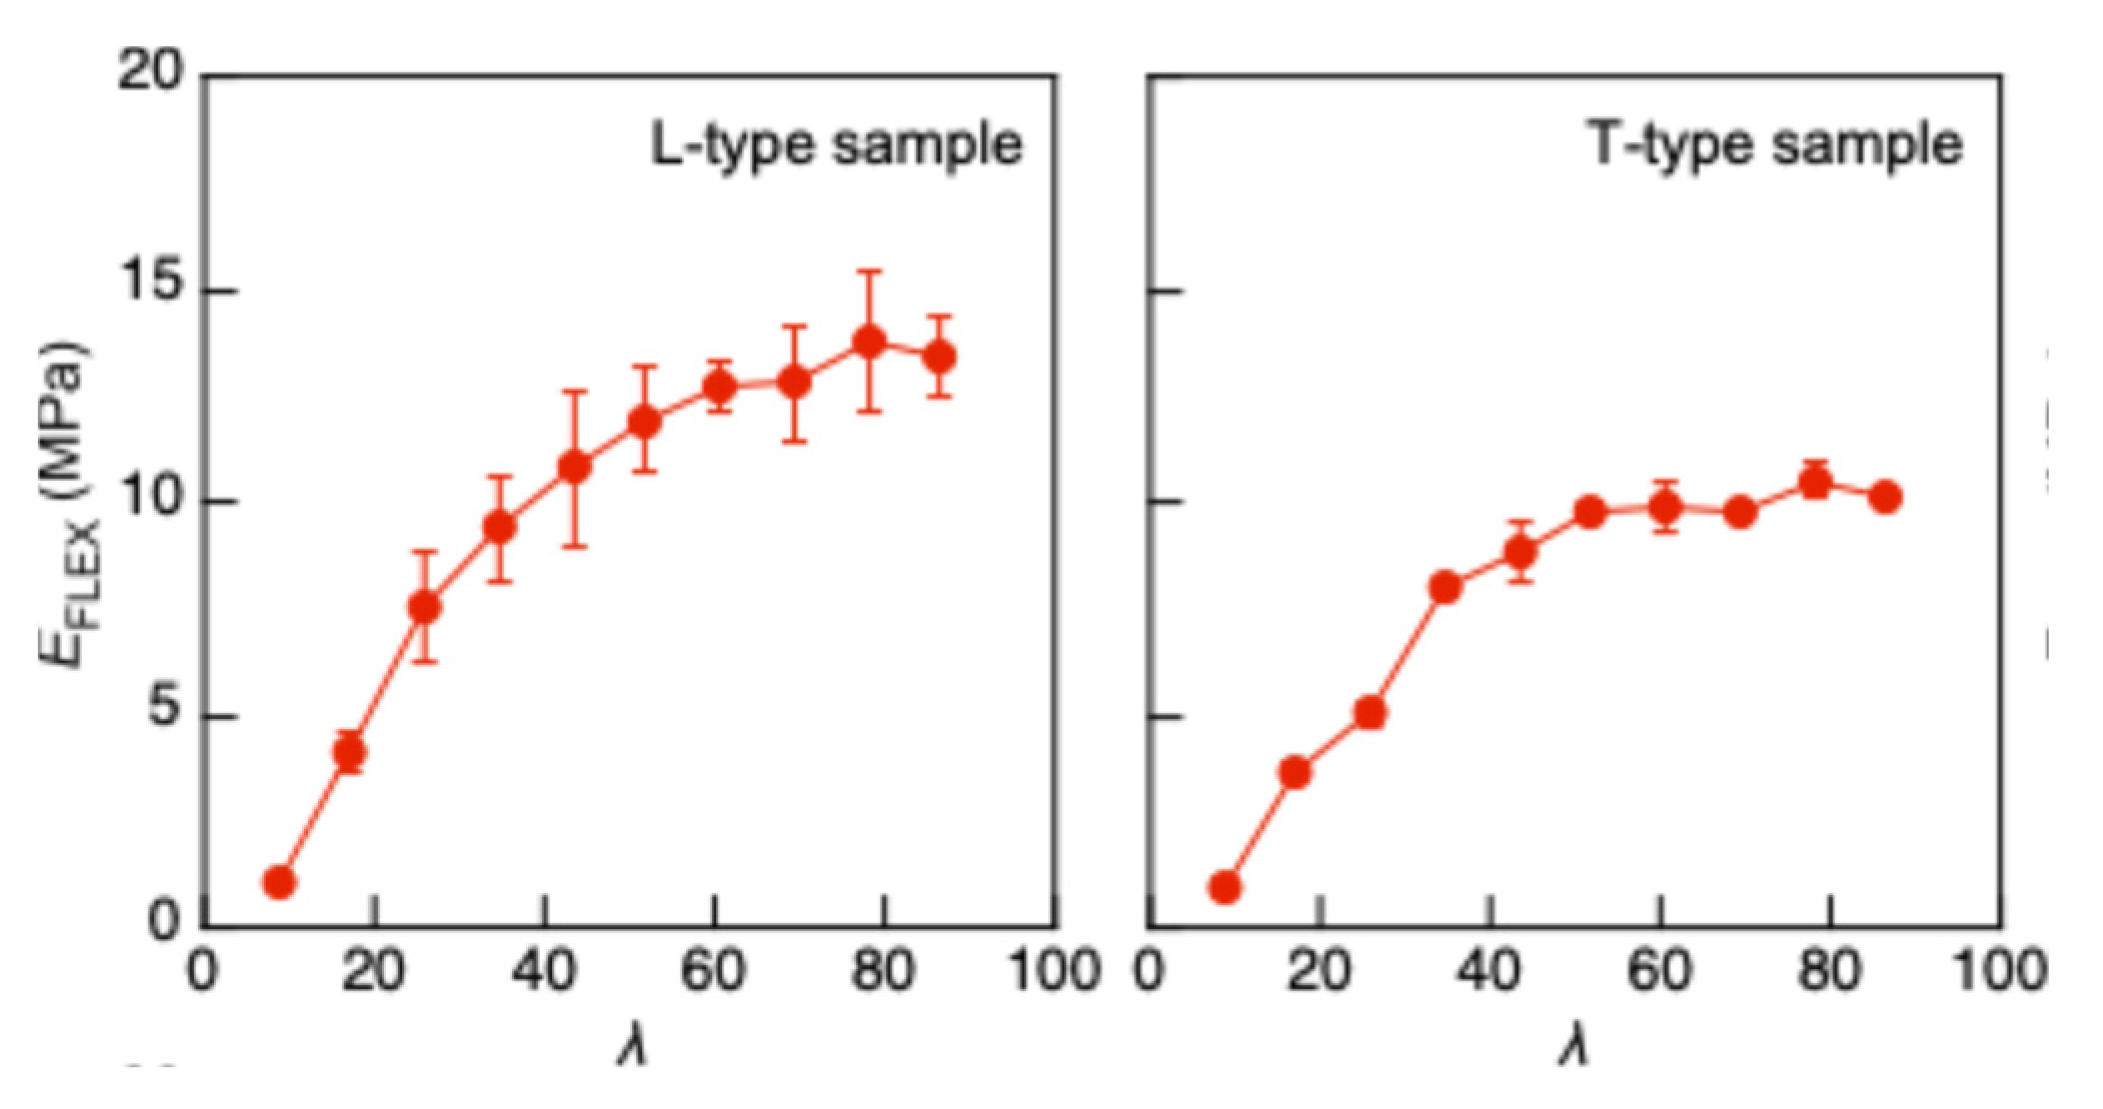
Figure 9.
scomp-ecomp and sTPB-eTPB relationships obtained via the compression and three-point bending tests, respectively.
Figure 9.
scomp-ecomp and sTPB-eTPB relationships obtained via the compression and three-point bending tests, respectively.
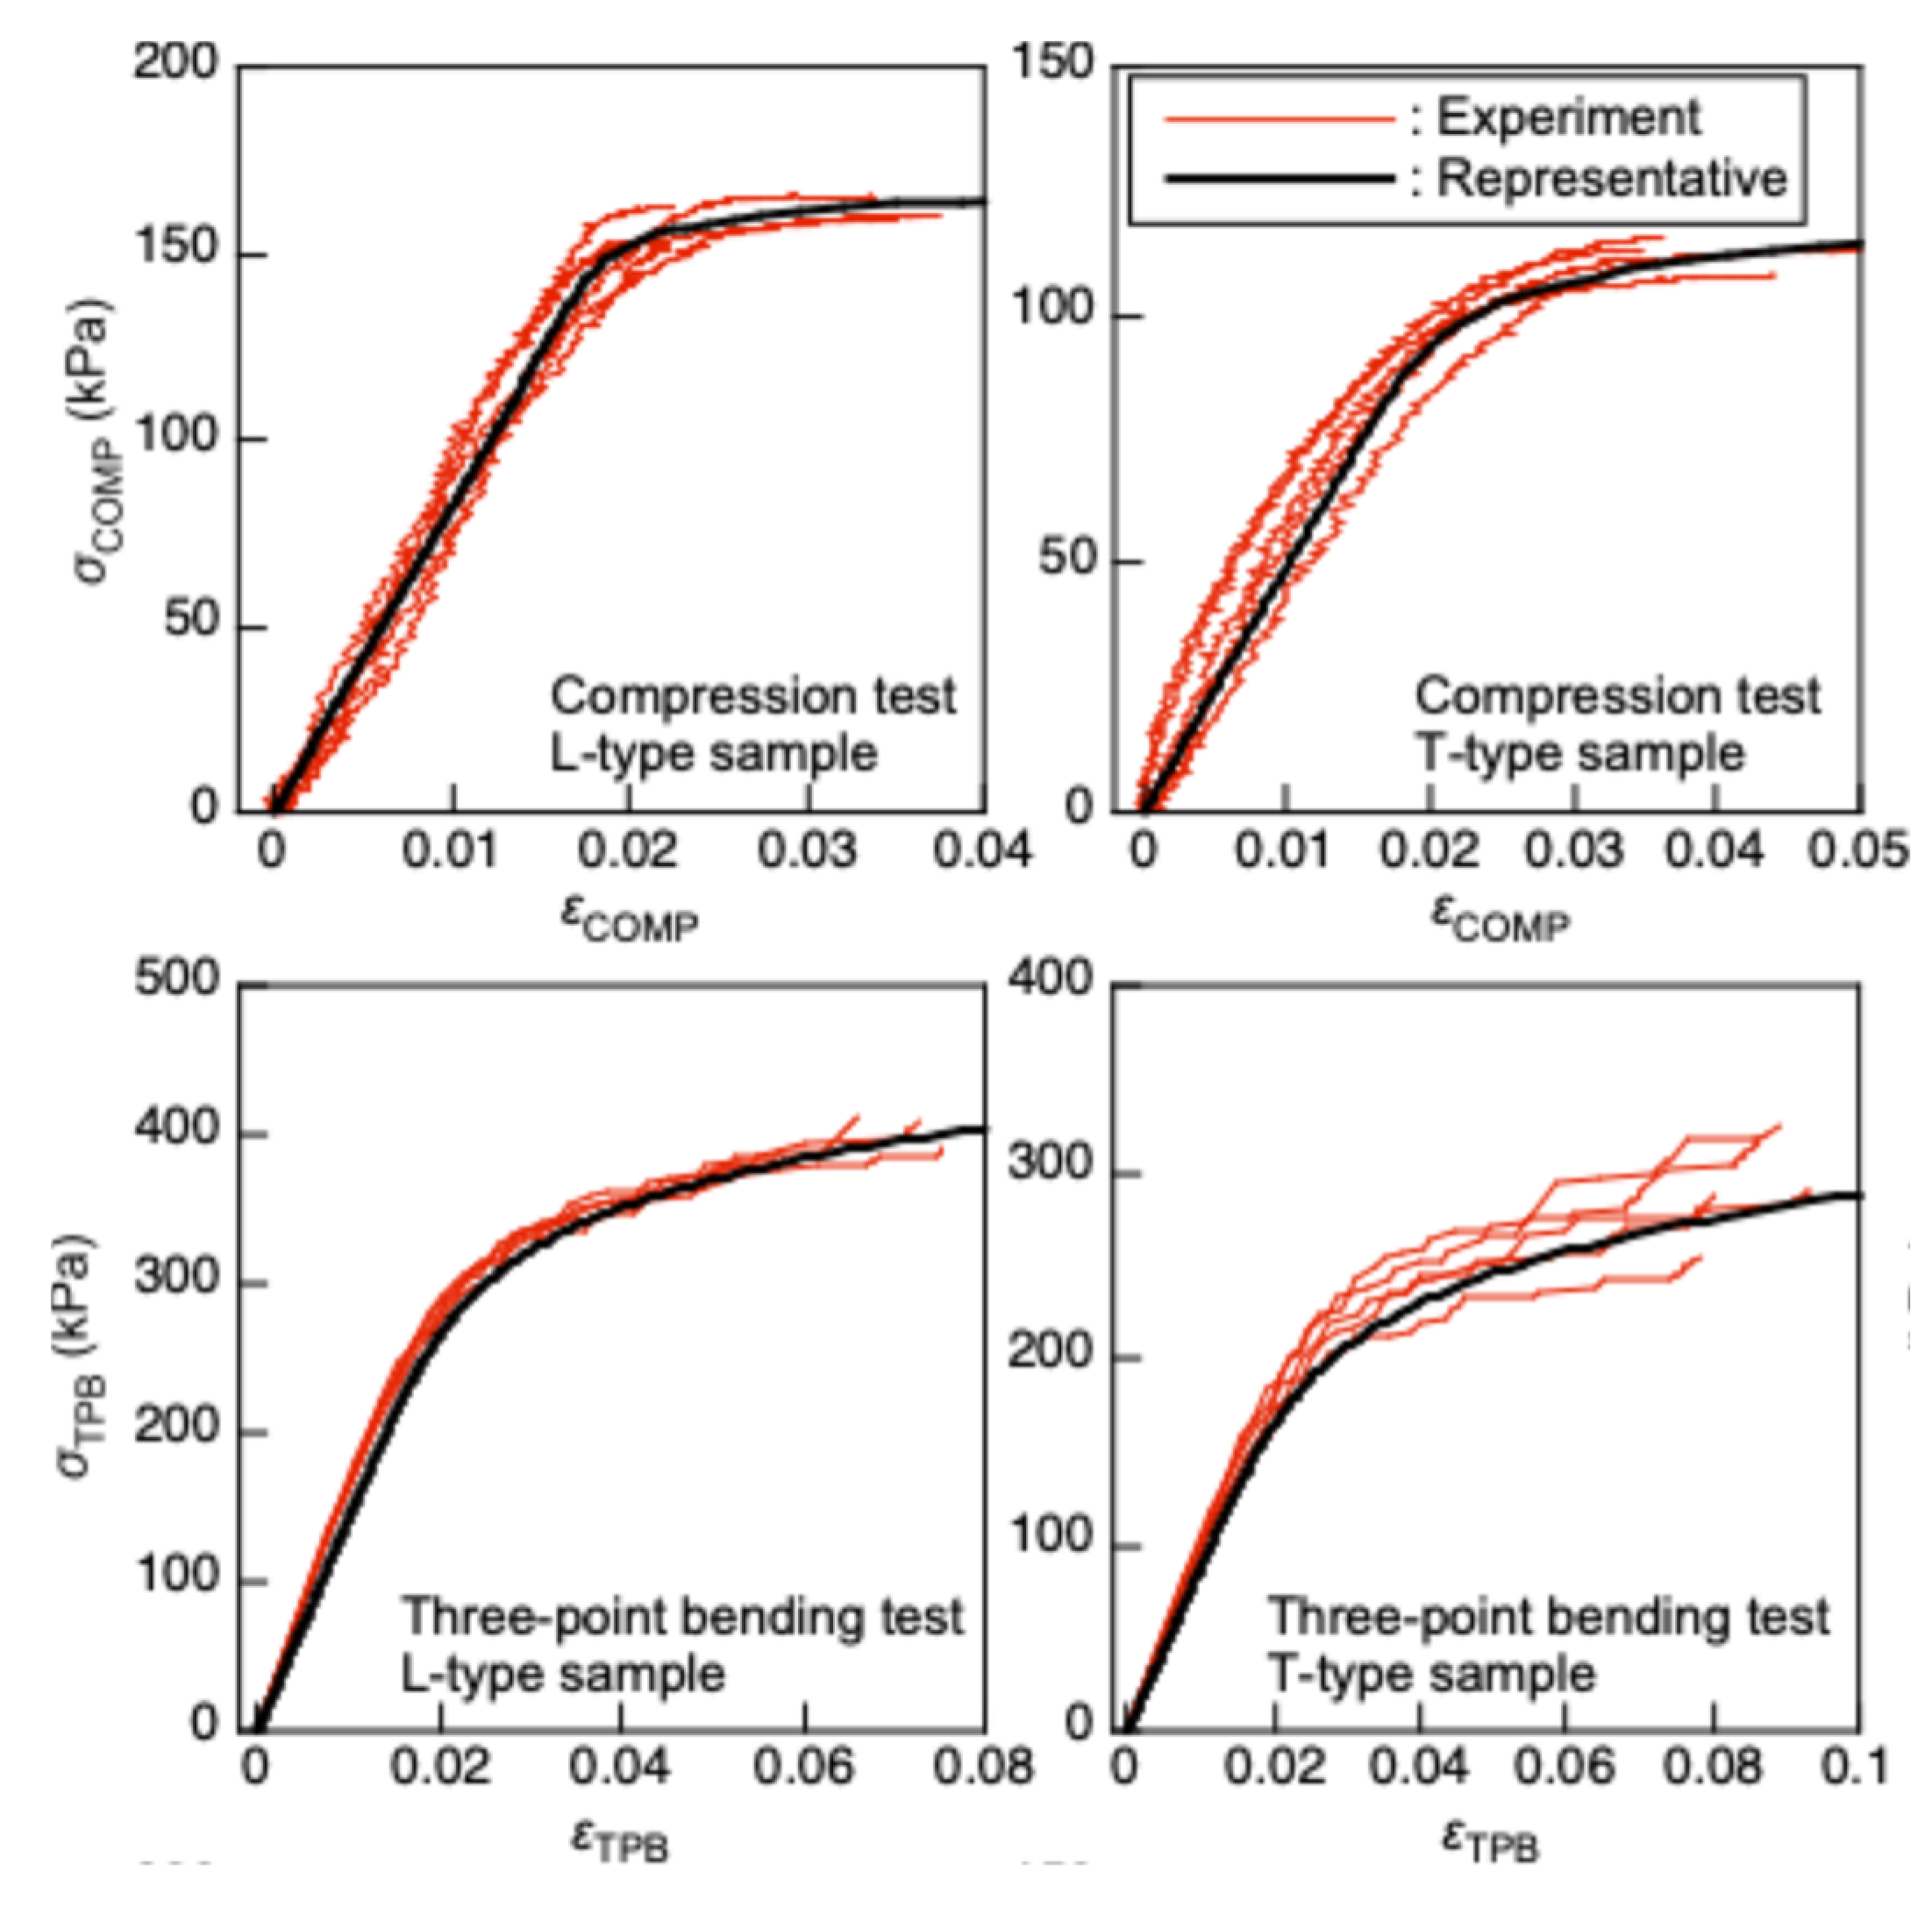
Figure 10.
scr-l relationships predicted using the compression and three-point bending test data. Equations (11) and (12) are used in a and b, Equations (17) and (18) are used in c and d, and Equations (19) and (20) are used in e and f.
Figure 10.
scr-l relationships predicted using the compression and three-point bending test data. Equations (11) and (12) are used in a and b, Equations (17) and (18) are used in c and d, and Equations (19) and (20) are used in e and f.
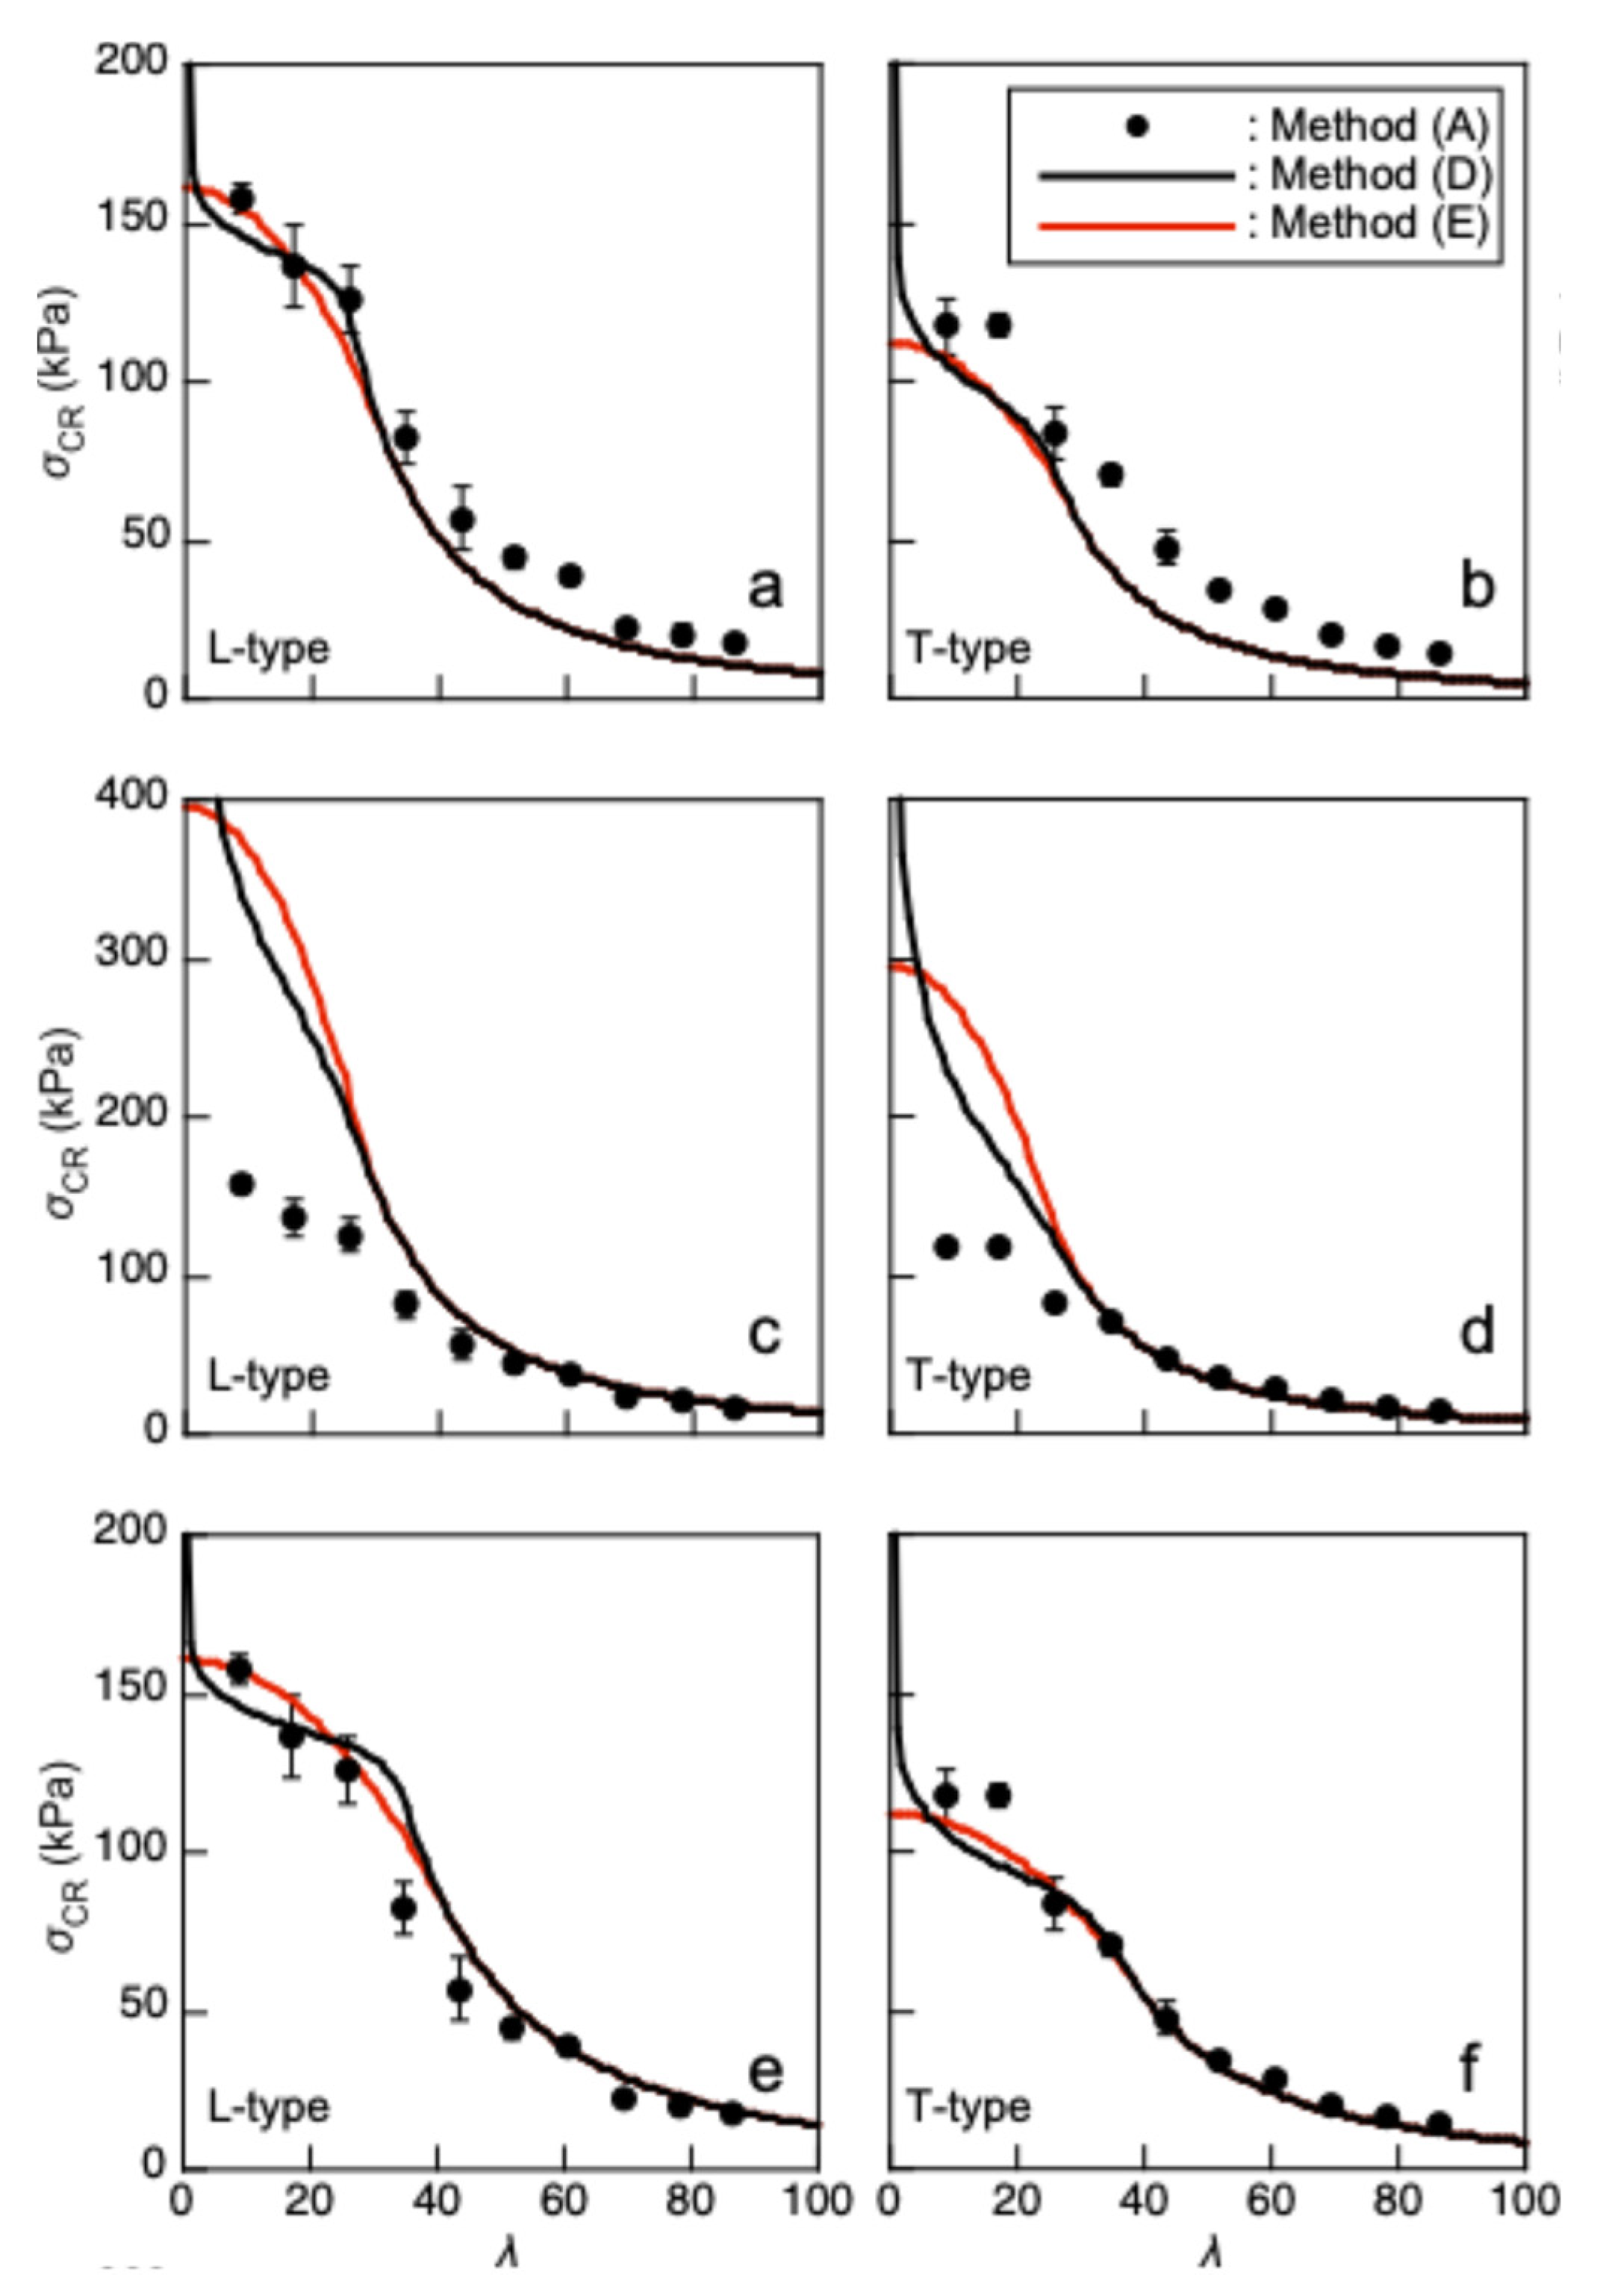

Table 1.
corresponding to L.
| L (mm) | 50 | 100 | 150 | 200 | 250 | 300 | 350 | 400 | 450 | 500 |
|---|---|---|---|---|---|---|---|---|---|---|
| (mm/min) | 0.87 | 0.87 | 0.87 | 0.87 | 0.87 | 1.5 | 2.4 | 3.5 | 5.0 | 6.9 |
Table 2.
Properties calculated by regressing the stress–strain relationships obtained from the compression and three-point bending tests.
Table 2.
Properties calculated by regressing the stress–strain relationships obtained from the compression and three-point bending tests.
| (MPa) | (kPa) | (× 10-3) | ||
|---|---|---|---|---|
| L-type | 8.19 | 161 | 34.8 | 9.87 |
| T-type | 4.93 | 112 | 16.4 | 18.1 |
| (MPa) | (kPa) | (× 10-3) | ||
| L-type | 14.3 | 396 | 8.58 | 43.2 |
| T-type | 8.84 | 295 | 6.93 | 7.97 |
Disclaimer/Publisher’s Note: The statements, opinions and data contained in all publications are solely those of the individual author(s) and contributor(s) and not of MDPI and/or the editor(s). MDPI and/or the editor(s) disclaim responsibility for any injury to people or property resulting from any ideas, methods, instructions or products referred to in the content. |
© 2025 by the authors. Licensee MDPI, Basel, Switzerland. This article is an open access article distributed under the terms and conditions of the Creative Commons Attribution (CC BY) license (http://creativecommons.org/licenses/by/4.0/).
Copyright: This open access article is published under a Creative Commons CC BY 4.0 license, which permit the free download, distribution, and reuse, provided that the author and preprint are cited in any reuse.


