Preprint
Article

This version is not peer-reviewed.

Rethinking Coastal Areas Through Youth Perceptions and the Coastality-Gap Index: A Case Study of the Island of Mallorca

A peer-reviewed article of this preprint also exists.

Submitted:

24 October 2025

Posted:

28 October 2025

You are already at the latest version

Abstract

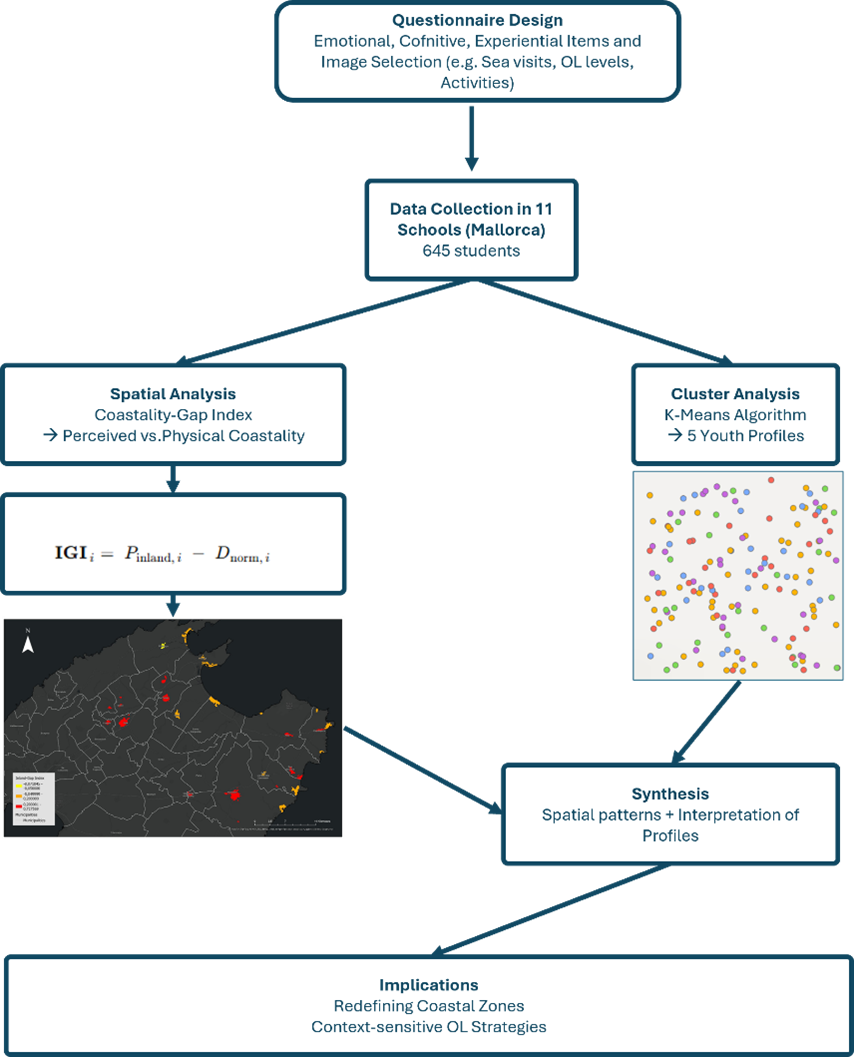
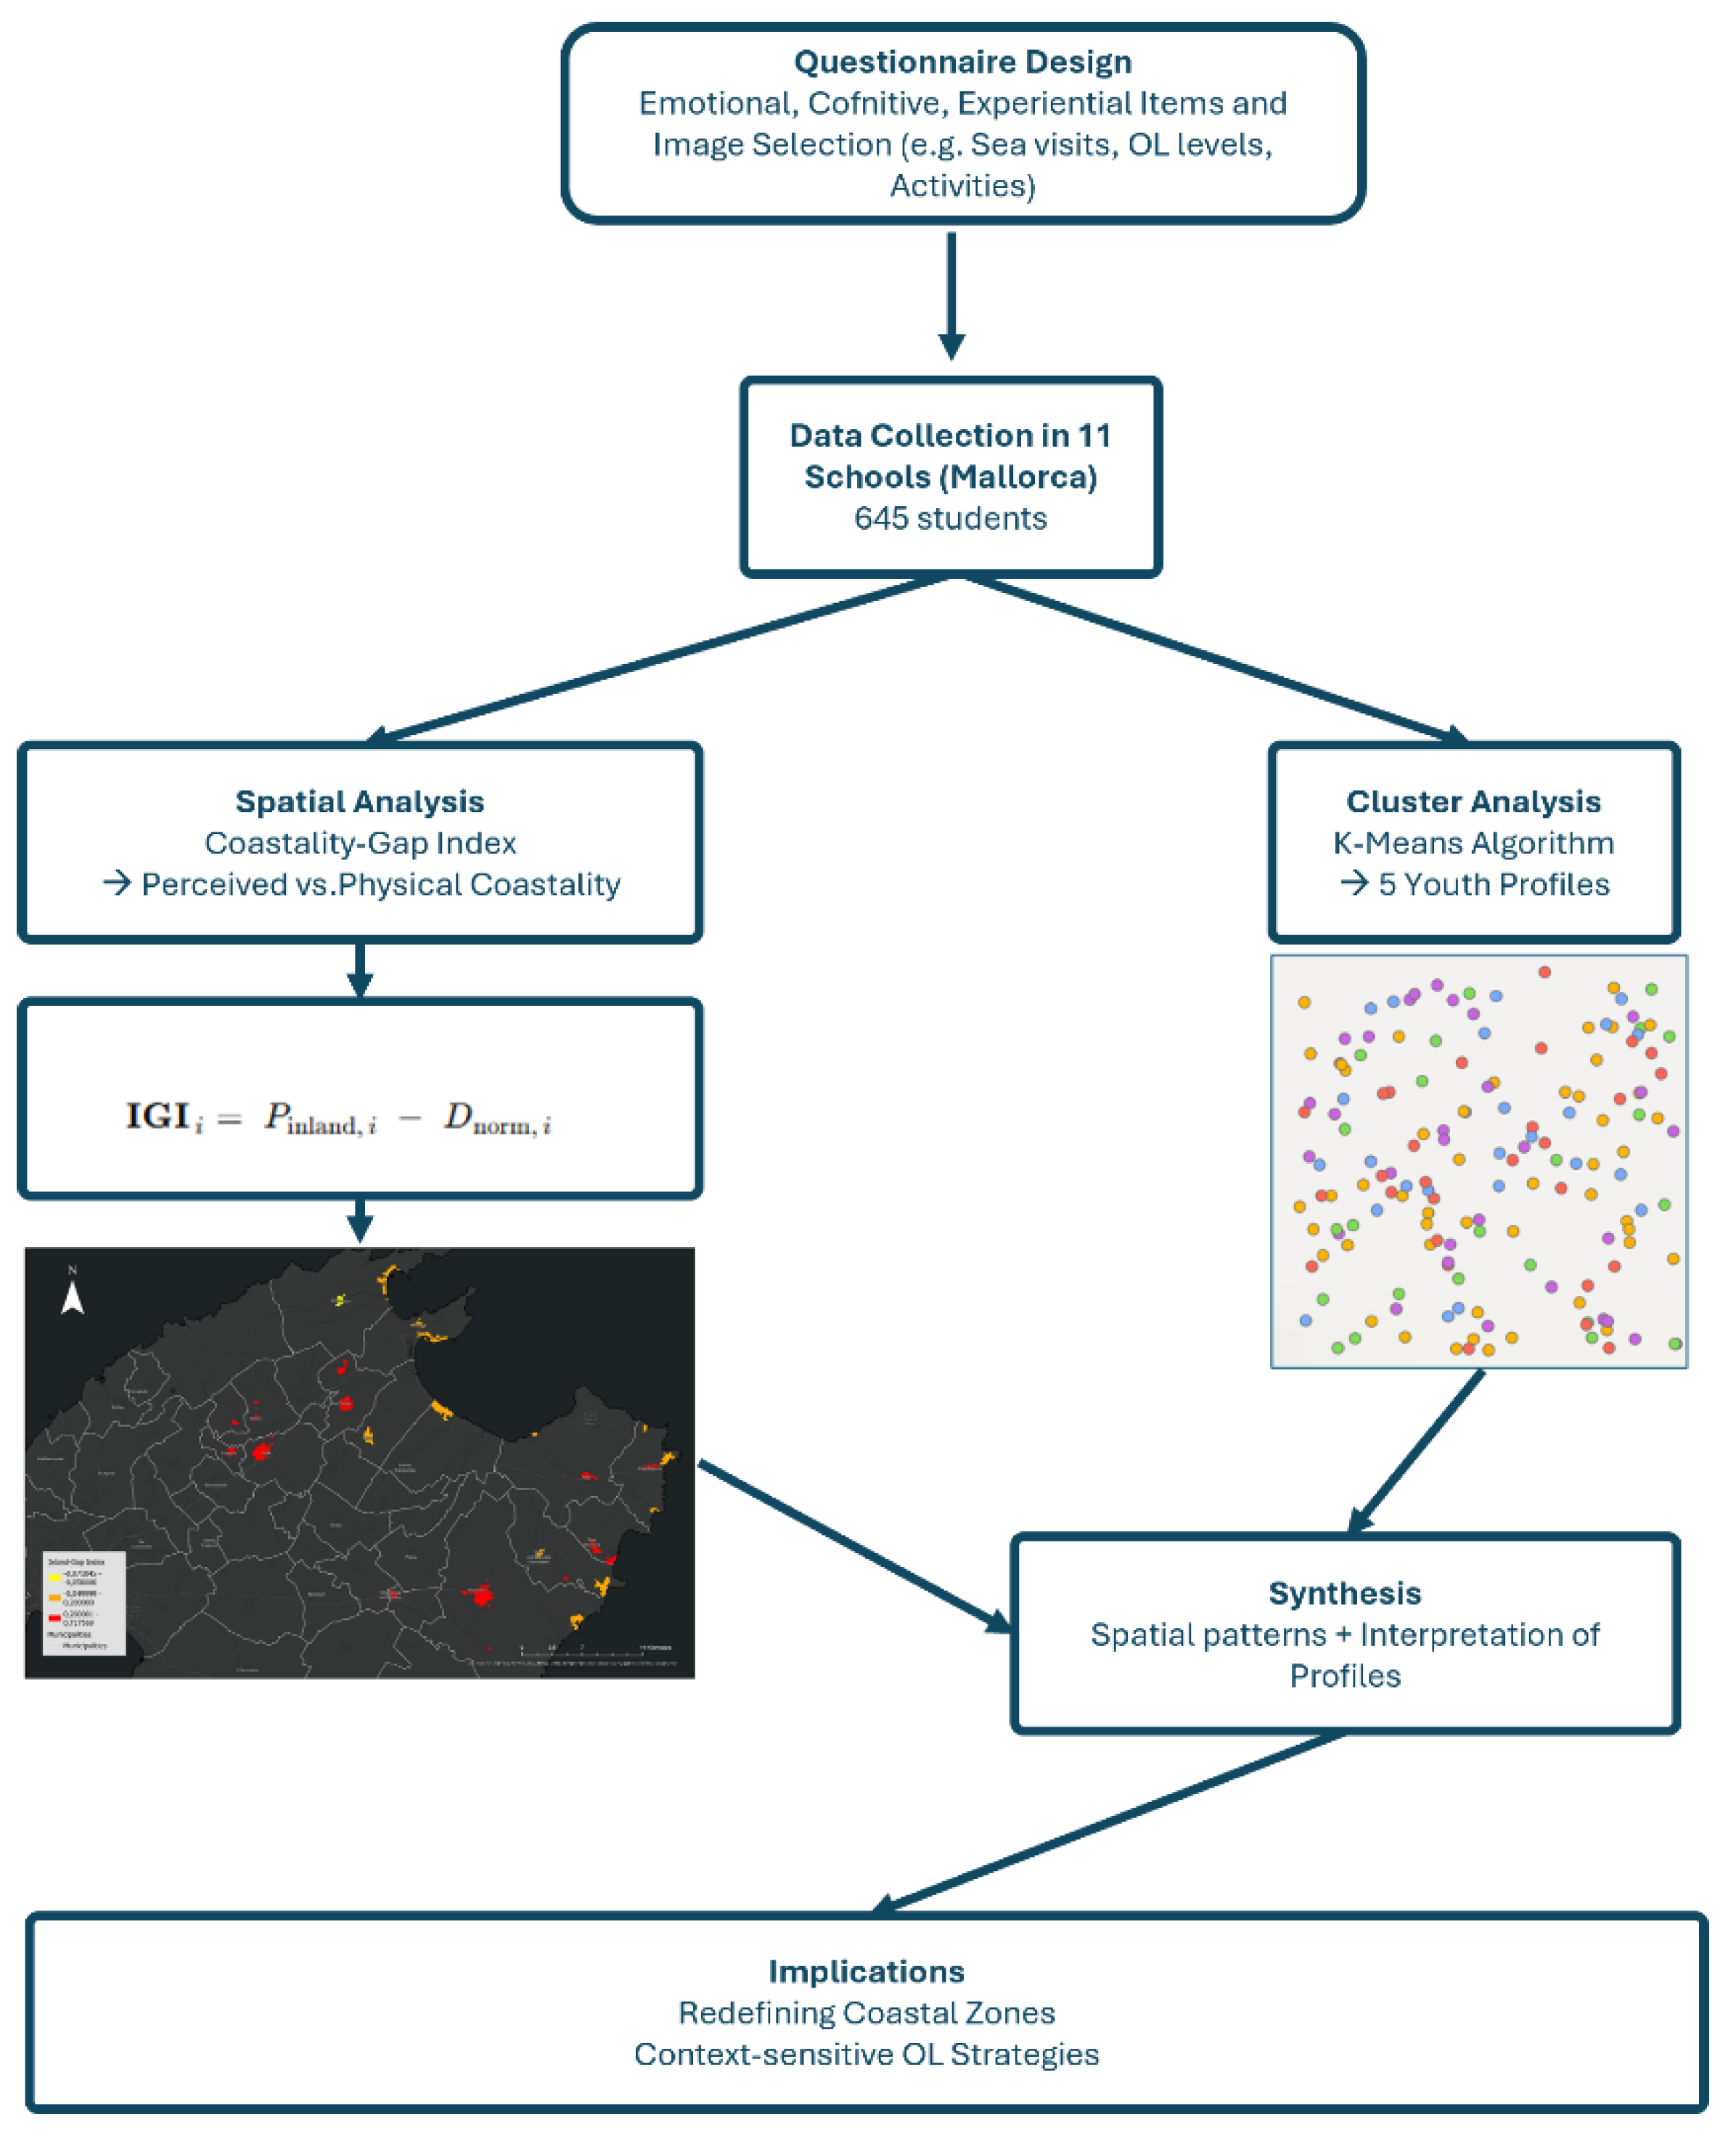
Coastality, the degree to which a place or community is functionally, spatially, or symbolically oriented toward the ocean, has received limited attention in Ocean Literacy research. This study introduces perceived coastality as a youth-centered construct and develops the Coastality-Gap Index, a spatial indicator measuring the divergence between students’ coastal–inland identity and their actual geographic proximity to the sea. A mixed-methods design was applied to data from 645 students aged 10–17 across 11 schools in five municipalities in Mallorca (Spain). The questionnaire explored emotional, cognitive, and experiential connections to the ocean, including indicators of marine knowledge and spatial self-identification. K-means clustering was used to identify perceptual profiles, which were mapped using GIS to examine their spatial distribution. Five distinct profiles emerged, ranging from students who perceive themselves as coastal and show strong experiential, emotional, and cognitive ties to the ocean, to others who live near the coast yet exhibit limited awareness or connection. The Coastality-Gap Index revealed that 14 of the 29 population centers studied were inland-oriented despite coastal proximity, highlighting educational blind spots not captured by the European Union’s fixed 20 km coastal belt. Together, the perceptual typology and spatial indicator provide a transferable framework for rethinking blue education strategies and designing context-sensitive Ocean Literacy interventions.

Keywords: 
;  ;  ;  ;  ;  

1. Introduction

1.1. Coastality as a Framework for Understanding Symbolic Connections to the Ocean

Coastality refers to the extent to which a given location or community exhibits spatial, functional, or symbolic orientation toward the ocean. Although still underdeveloped as a theoretical construct, the term has been applied in archaeological and territorial studies to analyse how maritime proximity shapes patterns of settlement, mobility, and coastal engagement, both materially and culturally [1,2]. While coastality emphasizes symbolic and perceptual orientation, it is useful to contrast this with how coastal status is defined in institutional and policy contexts based on spatial criteria.
Definitions of what constitutes a coastal area vary across institutional and disciplinary contexts. At the international level, the Food and Agriculture Organization defines coastal zones as areas within 100 kilometers of the shoreline or with an elevation below 100 meters above mean sea level [3].An ecological perspective is offered by the United States Commission on Marine Science, Engineering and Resources, which defined the coastal zone as "that part of the land affected by its proximity to the sea and that part of the sea affected by its proximity to the land, to the extent that measurable changes can be observed in the chemical composition of the water and marine ecology [4]. In the European context, Eurostat classifies a local administrative unit (LAU) as coastal if it either borders the sea directly or if at least 50% of its surface lies within 10 kilometers of the coastline[5]. The Copernicus Land Monitoring Service also applies a 10-kilometer inland boundary for defining coastal zones, though its focus is on land use and ecosystem monitoring. Complementing these spatial definitions, the Copernicus Marine Service emphasizes the socio-economic importance of the 50-kilometer coastal strip, where nearly 40% of the EU population resides, framing it as a priority zone for environmental observation and marine policy [6]. Additionally, the EU Blue Schools programme uses a 20-kilometer distance from the coast as its operational definition for determining whether a school is considered coastal or inland [7].
Despite its relevance, the concept of coastality remains largely absent from mainstream Ocean Literacy (OL) literature. Instead, related constructs have gained prominence in the fields of environmental psychology and marine education. Place identity [8] marine identity [9] and broader theories of sense of place [10] suggest that physical proximity to the ocean does not automatically generate emotional attachment or marine awareness. Rather, symbolic belonging is shaped through historical land–sea dynamics, cultural narratives, and lived experiences, including formal and informal education. Recent scholarship further supports this symbolic turn: Jones [11] introduces the concept of “blue geopolitics”, capturing an oceanic turn in political geography theories, emphasizing the role of the sea in global environmental and political systems, while Oishi, Talhelm, and Lee [12] demonstrate that landscape preferences (mountain vs. ocean) stem from personality traits rather than mere physical distance. This resonates with the anthropological perspective of Ignasi Terradas [13] who distinguishes between juridical identification, anchored in ownership and property, and lived identity, which “cultivates, among other things, the landscape as perception and memory of life”.
Furthermore, evidence from case studies such as Cap de Creus [14] also shows that reinforcing emotional and cultural ties to the coastal environment can be more effective in fostering conservation behavior than increasing marine knowledge alone.
We introduce the concept of perceived coastality to describe the subjective sense of connection to the ocean, which does not always correspond to physical distance. Some individuals may feel a strong coastal identity even when living 20 kilometers inland, while others might feel detached from the ocean despite residing only 10 kilometers away. This highlights the importance of symbolic connection as a critical, yet often overlooked, dimension of marine engagement.
Integrating perceived coastality into OL research can support the development of context-sensitive educational strategies that align with local symbolic geographies. In practice, it can inform more inclusive approaches to marine education by helping inland students foster meaningful connections to the sea, while also addressing disengagement among coastal youth.
Moreover, in policy and conservation contexts, recognizing symbolic detachment or marine apathy can support efforts to socially anchor the Blue Economy, strengthen participatory governance, and improve the effectiveness of outreach campaigns in coastal resilience, marine protection, and ocean stewardship. Ultimately, perceived coastality offers not only a diagnostic tool for identifying disconnection but also a conceptual foundation for designing more culturally grounded interventions in marine education, communication, and policy planning.

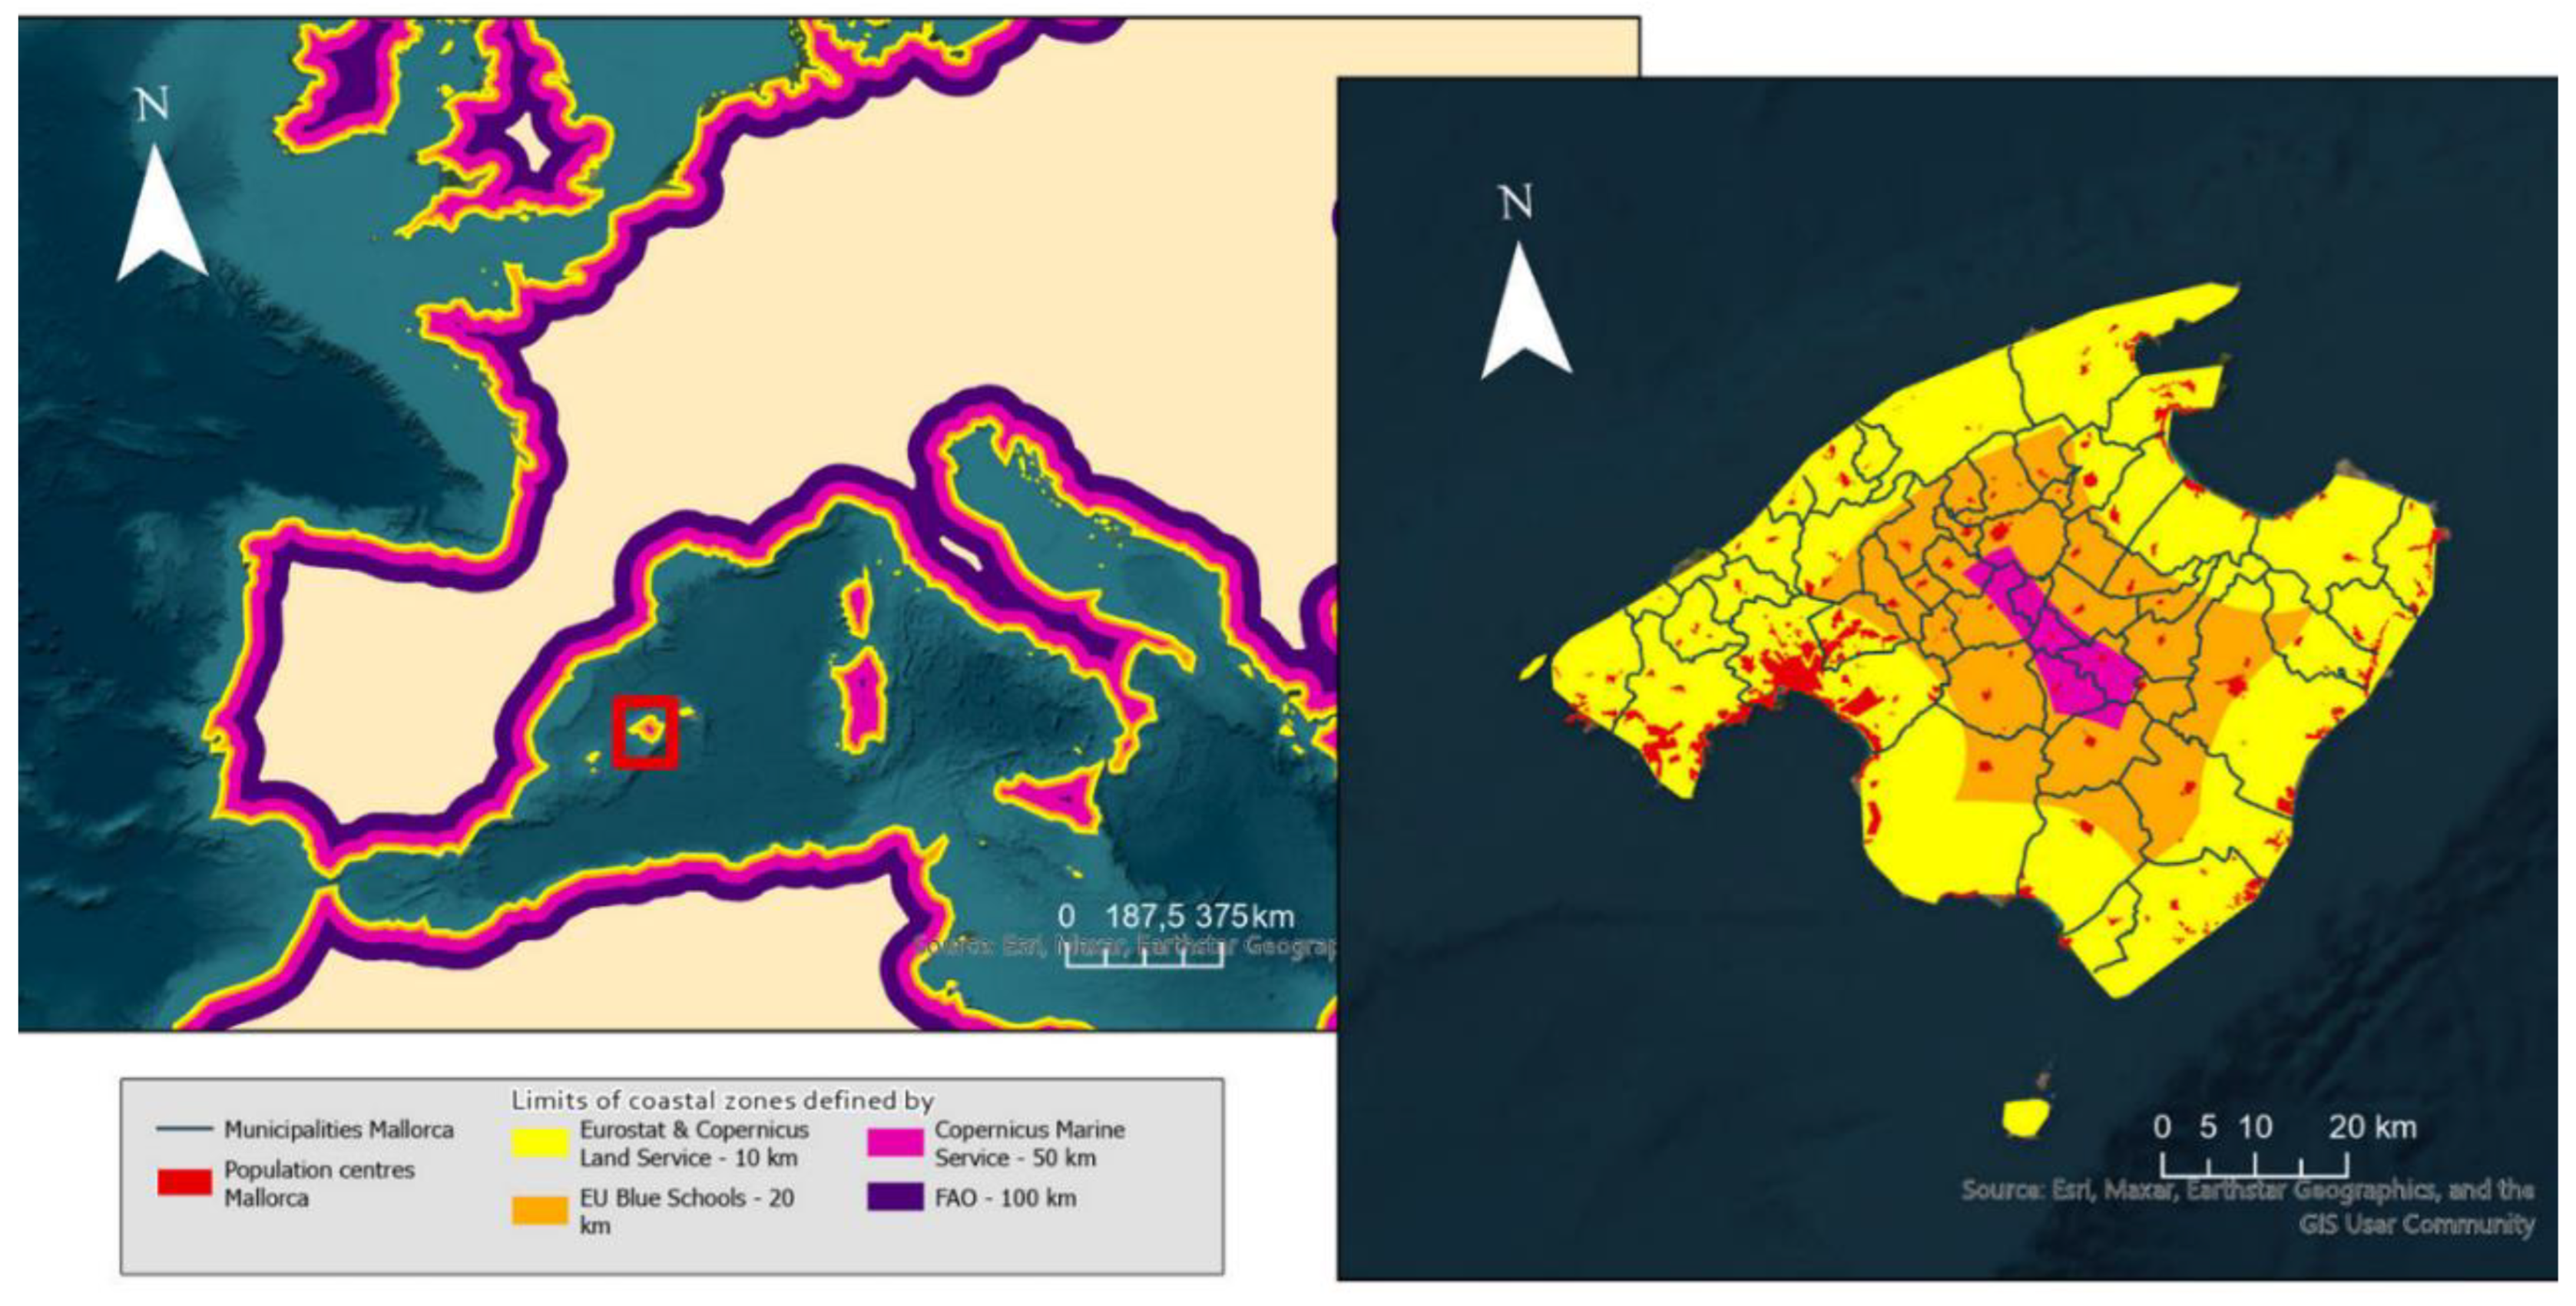
1.2. Contextual Focus: The Case of Mallorca

Island contexts, such as Mallorca, provide a particularly rich setting for examining how coastality manifests in everyday perception. Despite the island’s insular geography, with over 555 kilometers of coastline [15] and a total surface area of approximately 3.640 square kilometers [16], symbolic connections to the marine environment cannot be taken for granted. In fact, residents do not always perceive their hometowns as coastal, even though no point on the island lies more than 25 kilometers from the sea [17]a distance that would fall within the definition of “coastal area” under at least two formal frameworks (FAO and Copernicus) and comes close to the 20-kilometer threshold used by the EU Blue Schools programme.
Mallorca, like other Mediterranean islands, falls under a complex framework of maritime jurisdiction. According to the international law UNCLOS [18] the territorial waters of Spain extend 12 nautical miles from the baseline, while the Exclusive Economic Zone (EEZ) may reach up to 200 nautical miles. Within this maritime space, the Balearic Islands exercise autonomous competences over coastal fisheries, aquaculture, and marine heritage through legislation such as the Balearic Law 6/2013 on maritime fishing and aquaculture [19].
Historically, the configuration of Mallorcan settlements reflects longstanding defensive strategies. Many towns were deliberately established several kilometers inland to protect inhabitants from coastal attacks, particularly during periods of frequent piracy and military threats [20,21]. This historical pattern resulted in a clear distinction between inland urban centers and their corresponding ports, as seen in examples such as Pollença and Port de Pollença or Sóller and Port de Sóller. This spatial organization was further transformed by the 20th-century tourism boom, which dramatically reshaped Mallorca’s territorial dynamics [22] The landscape became increasingly bifurcated into tourism-oriented coastal zones and urbanized or agricultural interiors. Tourism-driven urban expansion led to the emergence of new social spaces that disrupted traditional socio-economic patterns, benefiting local communities in some ways, but also generating new territorial and social disconnections [23] These transformations continue to influence symbolic geographies today, reinforced through education, media representations, and local development practices [24]. This divide is clearly illustrated in Figure 1, which shows that in many coastal municipalities, the historical and administrative centers are located approximately 10 kilometers inland, while the primary economic activities now take place in the coastal resort areas.
These historical and contemporary spatial dynamics have important implications for how island residents symbolically relate to their environment. Understanding these perceptions requires moving beyond mere geographic distance and considering broader cultural, historical, and educational processes.
In the specific context of Mallorca, empirical studies [25,26] reveal that many children marginalize, or entirely omit, the sea in their mental maps and representations of the island, often showing only a limited number of coastal landmarks, despite living in an insular territory. Their findings underline how local perceptions are shaped by historical trajectories and educational frameworks, further challenging the assumption that coastal living inherently fosters maritime awareness.
To better understand perceived coastality, this study examines how young people in Mallorca subjectively position themselves along a symbolic inland–coastal gradient. We explore how emotional, experiential, and educational factors influence their internal sense of being ‘coastal’ or ‘inland’, regardless of geographic proximity. Building on this concept, we introduce a complementary spatial tool, the Coastality-Gap Index, to visualise areas where symbolic identification diverges from actual shoreline distance. This index combines students’ self-reported inland/coastal orientation with a normalised distance metric, offering a scalable method to detect perceptual disconnects and guide targeted OL strategies.
In this context, the present study uses the term ocean to refer to global and conceptual dimensions, particularly in relation to OL frameworks, while sea is used to describe the local Mediterranean setting and everyday relationships with the marine environment in Mallorca. This linguistic distinction also reflects the fact that, in Mallorquin (Catalan dialect spoken in Mallorca), the sea is simply referred to as “la mar” (the sea).

1.3. Research Aims and Hypotheses

Based on this conceptual and contextual foundation, the study examines three core dimensions: (1) the relationship between objective coastal proximity and symbolic self-identification, operationalised through both self-reported inland-coastal identity and a spatial indicator, and (2) the existence of distinct perceptual profiles among students in relation to the marine environment.
From these objectives, the following hypotheses are proposed:
H1. Although many students reside in municipalities classified as coastal according to objective EU criteria (less than 10 km [5,6] or 20 km [7] from the coastline), a significant proportion will perceive themselves as living inland, both in their self-identification and in the symbolic images they select to represent their environment.
H2. Beyond a simple coastal/inland divide, distinct perceptual profiles can be identified among students, based on their emotional connection, symbolic associations, experiential practices, and knowledge levels.

2. Materials and Methods

As shown in Figure 2, the study began with the design and administration of a questionnaire to 645 students (ages 10–17) across 11 schools in Mallorca, conducted through a series of pre-planned workshops and in-class activity. The questionnaire captured emotional, cognitive, experiential, and identity-related dimensions of students’ perceived relationship with the marine environment, including a symbolic image-selection task. The resulting dataset supported two parallel analytical strands. In the spatial strand, students’ self-reported inland–coastal orientation was combined with normalised shoreline distance to generate the Coastality-Gap Index, which quantifies mismatches between symbolic and physical coastality. In the profiling strand, K-means clustering identified five distinct perceptual profiles based on recurring patterns of emotion, knowledge, practice, and self-identification. These outputs were then integrated to examine how spatial patterns of symbolic detachment align, or diverge, from the emergent perceptual typology, offering a more nuanced framework for defining coastal zones and informing context-sensitive OL strategies.

2.1. Participants and Context

The workshops were implemented across five municipalities on the island of Mallorca: Artà, Capdepera, and Pollença, three coastal municipalities bordering the Channel of Menorca, the area wherein the videos of the workshops were mainly filmed; Manacor, the second biggest coastal municipality on the island; and Inca, a municipality with no direct access to the coast.
Artà- Colònia de Sant Pere, Capdepera- Cala Rajada, Pollença - Port de Pollença, and Manacor- Porto Cristo demonstrate dual territorial identities. Their inland urban centers maintain close geographic and functional ties to nearby coastal settlements, typically former fishing ports or beach communities. In contrast, Inca represents a distinctly inland case, located approximately 21 kilometers from the nearest coastline (Alcúdia), placing it beyond the European Union’s operational definition of a coastal zone. The distances between urban centers and their respective coastal settlements are shown in Figure 3. While the workshops were officially conducted in these five municipalities, the final dataset reflects a broader territorial reach. Students attending the selected schools came from a total of 29 distinct population centres, due to the fact that many schools in these municipalities serve surrounding areas, including smaller towns, coastal villages, and dispersed settlements. This extended territorial coverage enriched the spatial diversity of the sample and provided a more nuanced view of how young people from both primary and secondary settlements perceive coastality across the island.
Manacor and Inca were selected not only for territorial diversity but also for their demographic significance. With populations ranging between 30,000 and 50,000 inhabitants [27], both municipalities rank among the largest urban centers outside Palma and serve as regional hubs for education and public services. Notably, although Inca is geographically inland, many students report regular personal or family ties to coastal areas, particularly Can Picafort [28] offering a valuable case for exploring the interplay between physical geography and perceived coastality.
All schools located within the five target municipalities were invited to participate in the workshops. Initial contact focused on those already certified as EU Blue Schools [29], given their established commitment to OL and prior engagement with marine education. This strategy ensured thematic alignment and facilitated implementation. Of the 15 schools that ultimately participated, all but one, Col·legi Sant Bonaventura (Artà), had been certified prior to the study. Certification status was later considered in the analysis to assess its potential influence on students’ marine knowledge and perceptions.
While all schools within the five target municipalities were invited, participation ultimately depended on logistical feasibility and school availability during the proposed time periods. The workshops were organized three months in advance, and selection was coordinated directly through the Balearic Network of Blue Schools. As coordinator of one of the largest Blue School networks in Europe, comprising over 100 affiliated schools[30], the lead author was able to leverage established relationships to facilitate efficient and targeted communication with educators. The outreach was not random; rather, it prioritized schools that had previously demonstrated interest in OL and could accommodate the proposed workshop schedule.
In many cases, interest exceeded available capacity. This was attributed not only to the thematic appeal of the workshops, but also to their delivery model: rather than requiring schools to travel to Palma, as is typical for extracurricular educational activities in the Balearic Islands, the workshops were brought directly to each municipality. This place-based approach significantly lowered barriers to participation and increased perceived relevance among local educators.
Each day was dedicated to a single school, with between four and six one-hour sessions delivered throughout the day. The workshops targeted students aged 10 to 17, with flexibility to accommodate different educational levels. Inclusion was a core educational principle: students enrolled in adapted curriculum pathways, programs designed to ease academic demands and support students at risk of not completing compulsory education, as well as those in UEECO classrooms (special education units), also participated. Workshop content and explanations were adapted to suit varied learning needs and cognitive levels, ensuring broad accessibility and pedagogical alignment. The final sample comprised 645 students aged 10 to 17 across 11 schools.
The study was conducted in accordance with the Ethical Code for Educational Practice of the Educational Commission of the Government of the Balearic Islands (Competencies 1 and 2) [31] ensuring respect for students’ dignity, data transparency, and wellbeing during all educational research activities. Data collection and processing complied fully with the General Data Protection Regulation (EU) 2016/679 (GDPR) [32]and Spanish Organic Law 3/2018 on the Protection of Personal Data and Guarantee of Digital Rights (LOPDGDD)[33]. The questionnaire was provided to teachers, and teachers invested 1 to 2 sessions in class to collect data from participants. Data were collected, processed exclusively for scientific research purposes, stored securely, and retained only for the statutory limitation periods.

2.2. Instruments

Data were collected by the teachers through a structured questionnaire specifically designed by the research team to investigate students’ perceptions, emotional connections, and knowledge related to the marine environment. The questionnaire was developed through an iterative process involving experts in marine science education, biology, and geography to ensure content validity and coherence with the educational goals of the workshops. Particular emphasis was placed on integrating multiple dimensions of OL that may influence students' place identity, following the conceptual approach proposed by [34] A full version of the questionnaire is available in Annex 1.
In addition to exploring place-based perceptions, the questionnaire was carefully aligned with international educational and sustainability frameworks. It aimed to minimally address the seven essential principles of OL, drawing on foundational contributions by Cava, 2005 [35] and Schoedinger et al. 2005 [36]. Furthermore, the design considered connections with the OL Challenges and Outcomes framework, the UN Sustainable Development Goals (SDGs), and broader OL aspects promoted by global initiatives such as the UN Decade of Ocean Science for Sustainable Development [37,38,39]. This multidimensional alignment was intended to ensure the questionnaire’s relevance and coherence within current international efforts to advance OL and sustainability education in line with the 2030 Agenda.
The instrument was composed of six thematic sections, driven mostly from a pilot OL survey conducted in Catalonia in the educational sector, inspired by previous OL surveys [40,41,42,43,44,45]:
  • Self-identification of territoriality and personal information: this section was designed to explore how students perceive their place of residence in relation to the coast. Students were asked to indicate their gender, municipality of residence, and whether they considered it to be coastal or inland. They also provided information about their current grade level and school name.
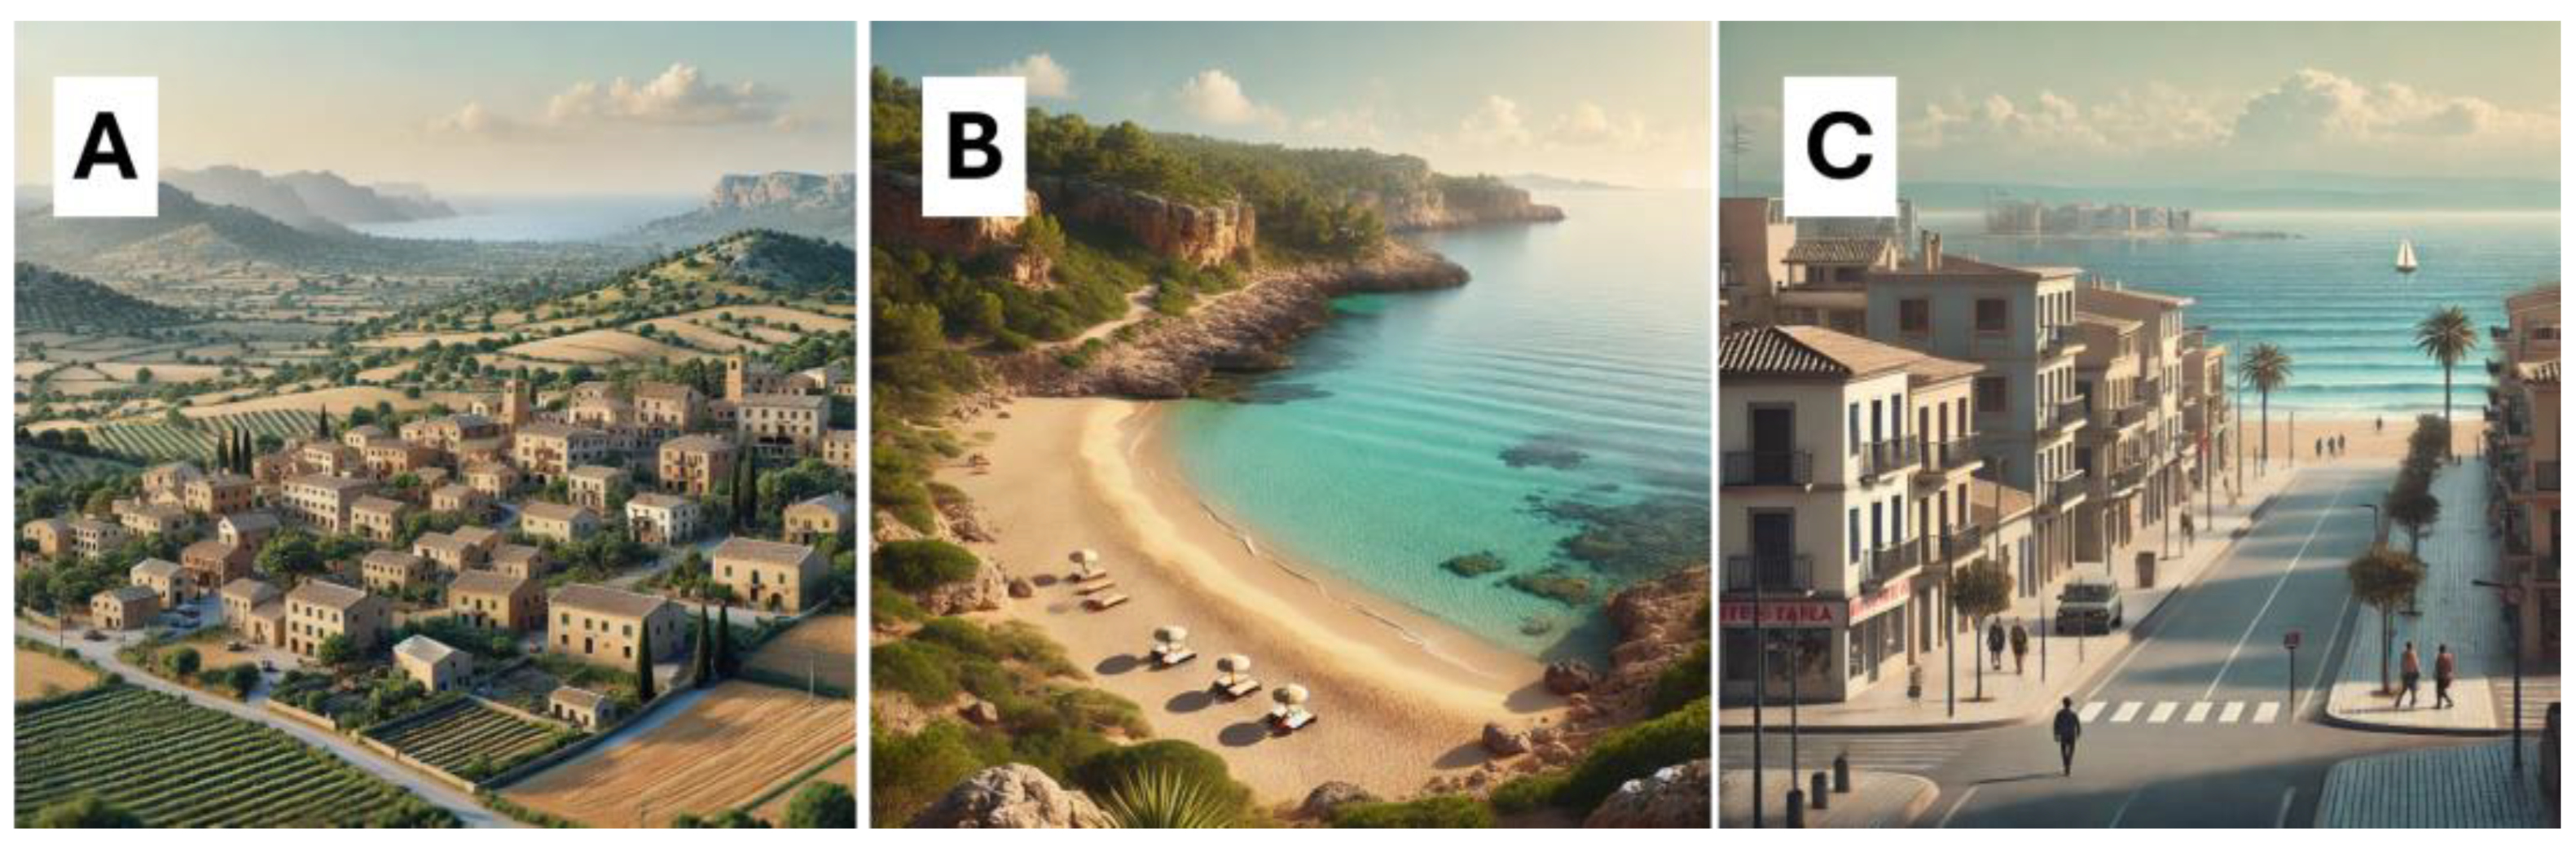
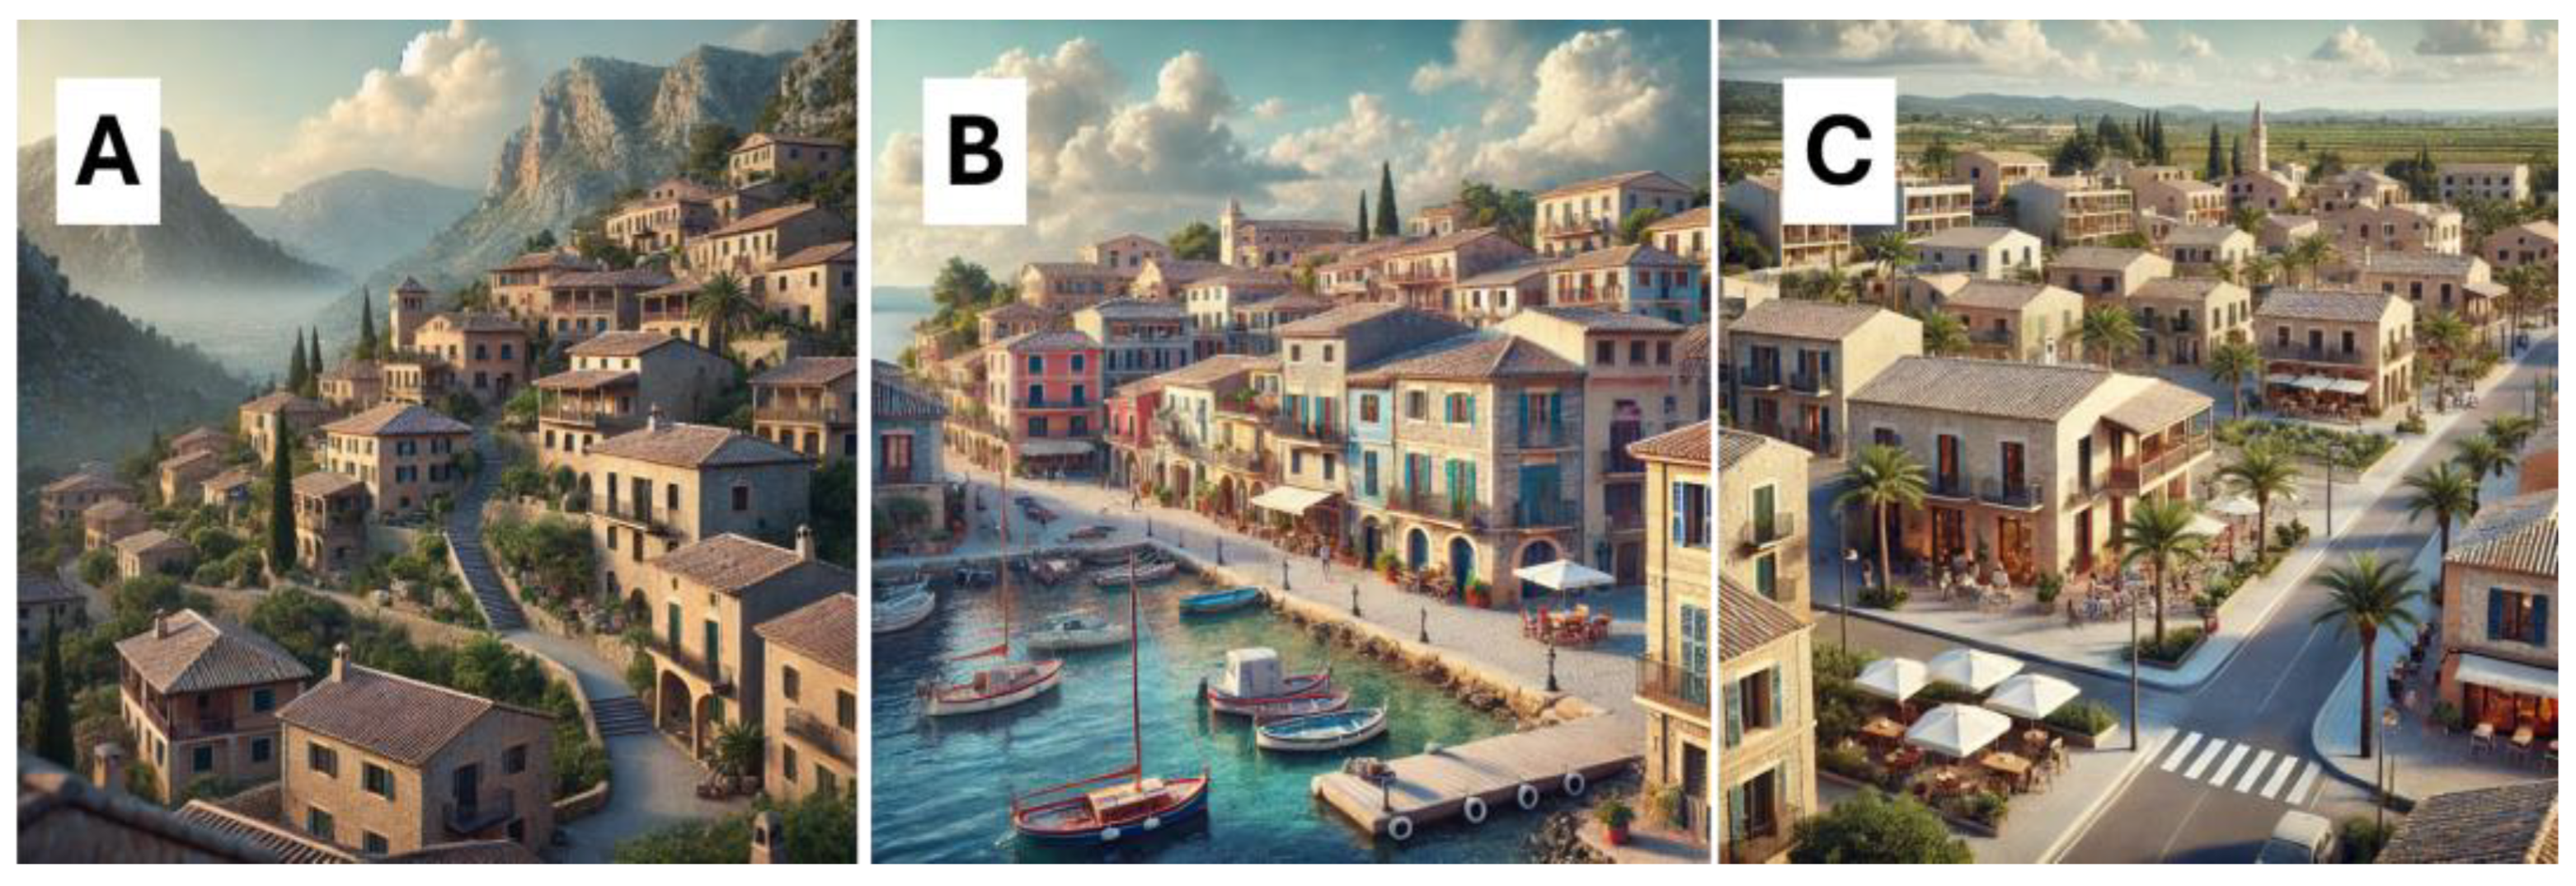
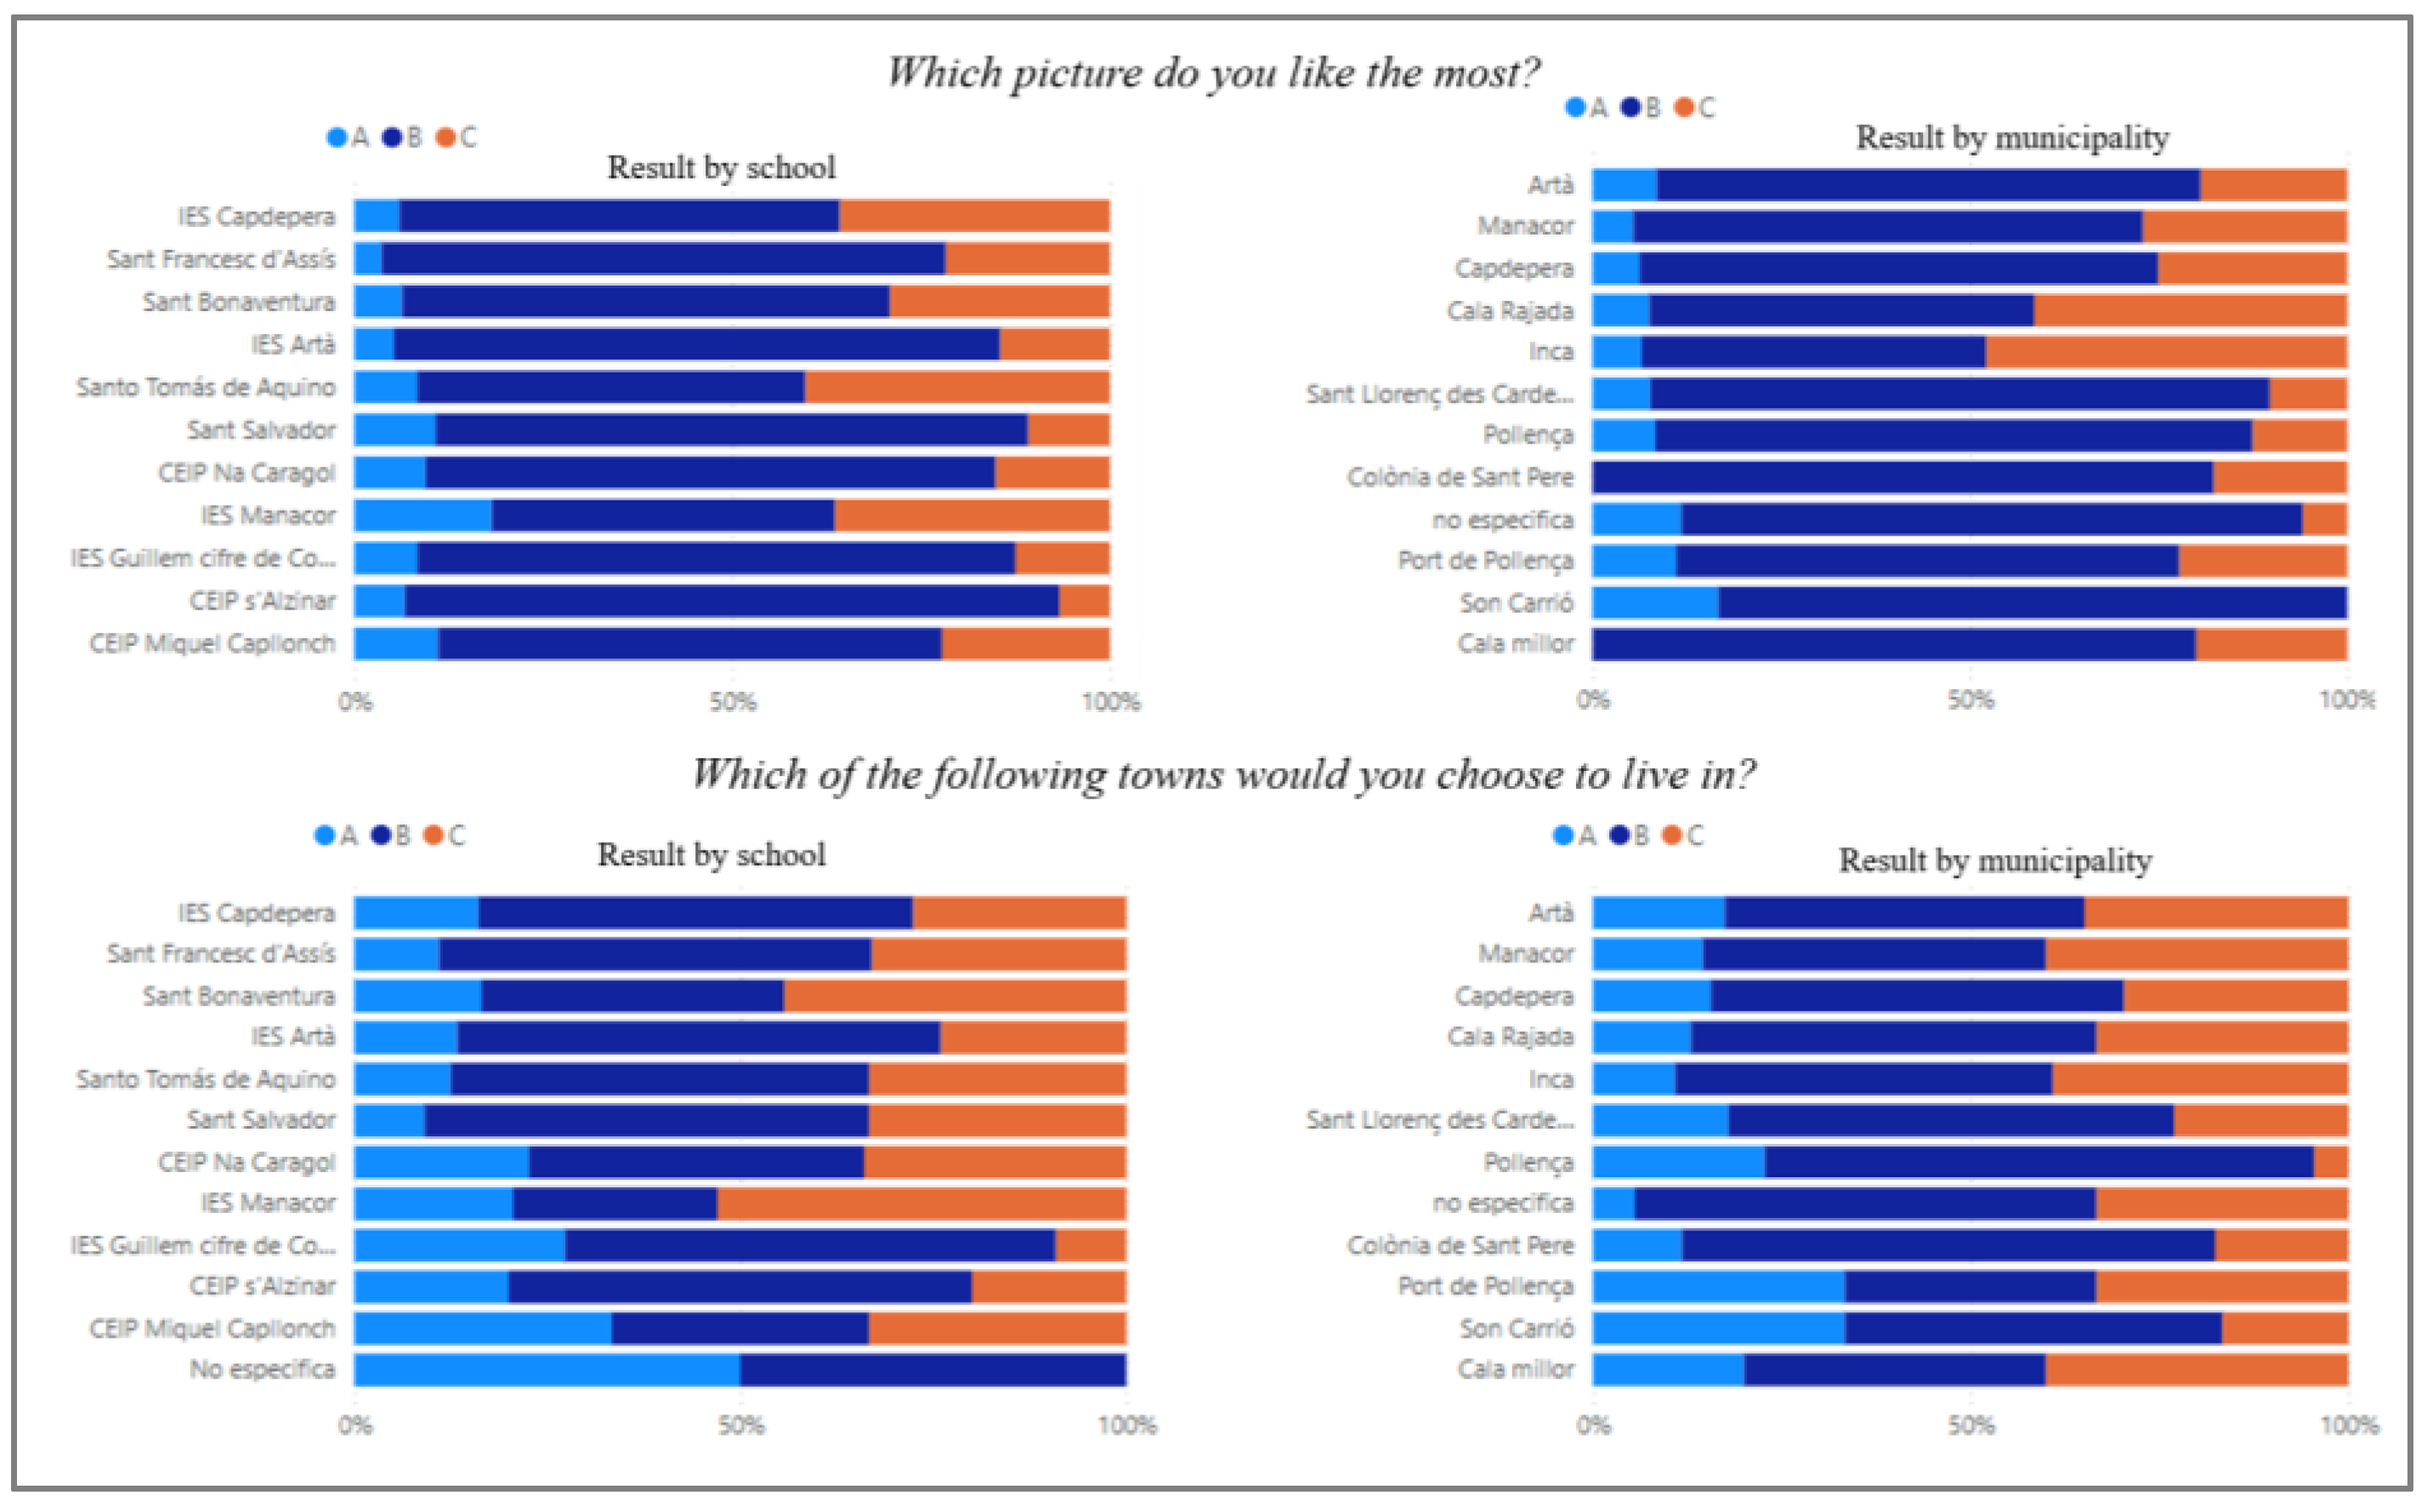
  • Symbolic representation: These questions draw on established methodologies in tourism research, particularly the use of image-based preference tests to explore affective and motivational responses to landscapes [46]. These techniques aim to reveal the symbolic meanings and emotional associations that individuals attach to different environments, offering insights into how people perceive, idealize, or identify with landscape types. Students were shown a series of standardized images and asked two questions. First, they were asked to choose the image they liked the most. Second, they were asked to indicate in which landscape they would prefer to live. All images were generated using artificial intelligence to deliberately avoid depicting specific, recognisable locations in Mallorca. This approach was chosen to ensure neutrality, preventing students from being influenced by personal familiarity or associations with particular towns.
The first set of images depicted three symbolic coastal environments, all featuring the sea but differing in development intensity and visual framing:
(A) a rural settlement with sea and mountains in the distance
(B) natural beach with light tourist use
(C) a built-up coastal resort typical of tourism zones.
Figure 4. Which picture do you like the most? AI-generated with ChatGPT. A: rural settlement with sea and mountains in the distance. B: natural beach with light tourist use. C: built-up coastal resort typical of tourism zones.
Preprints 182198 g004
The second set represented symbolic inland settlement types found across the island:
(A) a typical mountain town in Mallorca,
(B) a typical port town, and
(C) a typical rural town without coastal access.
Figure 5. Which of the following towns would you choose to live in?AI-generated with ChatGPT. A: a typical mountain town in Mallorca. B: a typical port town. C: a typical rural inland town without coastal access.
Preprints 182198 g005
This two-part visual activity aimed to better understand how students relate emotionally and symbolically to different Mallorcan environments, beyond their own physical place of residence.
3. Emotional connection to the marine environment: Students reported their emotional responses toward the sea, choosing among a list of positive, neutral and negative feelings.
4. Experiential interaction: Students described the frequency of their visits to the coast and the activities they engaged in (e.g., leisure, fishing, or sport-related practices).
5. Communication and information sources: Students identified their main sources of communication and information about the sea (family, friends, school, internet, books, television).
6. Marine knowledge indicators: Two dimensions of marine knowledge were assessed.
(a) General OL was evaluated through students’ self-perceived knowledge, their level of agreement with key OL principles, and their perceptions of human–ocean interactions. This approach focused on subjective understandings aligned with the OL Framework, rather than factual recall, to capture how students internalize and relate to marine concepts.
(b) Local marine knowledge was measured through the recognition of culturally and environmentally significant elements of the Mallorcan marine environment. These included Posidonia oceanica (a key seagrass species), the traditional fishing boat (llaüt), and common fish species such as Coryphaena hippurus (llampuga) and Pagellus erythrinus (pagell). Other indicators of place-based familiarity included terms like embat (local sea breeze), rissaga (meteotsunami), albufera (coastal lagoon), and species of ecological importance such as the endangered bivalve nacra (Pinna nobilis). Additionally, elements of maritime craftsmanship, such as the role of the mestre d’aixa (master boatbuilder), and traditional small boats like the batel, were used to capture deeper layers of local marine heritage.

2.3. Procedure

An immersive workshop for discovering both the deep sea and the similarities that can be found between marine and land environments [47] was conducted during October and November 2024. Designed by the Institute of Marine Sciences (ICM-CSIC) and implemented in collaboration with the Balearic Network of Blue Schools, the workshop aimed to bring the ocean directly into the classroom, fostering emotional and cognitive engagement with the marine environment.
Figure 6. Pictures taken during the workshops.
Preprints 182198 g006
Through an experiential learning approach, students explored marine similarities with familiar terrestrial elements during the Land or Sea activities. Key ideas included comparing marine and terrestrial plant species (e.g., Posidonia oceanica meadows versus land prairies), illustrating similarities between ocean currents and atmospheric dynamics, or showing parallel geological and ecological processes as well as human impacts in both systems. In the second part of the workshop, students viewed real video footage from a submarine exploring the Menorca Channel, which introduced them to lesser-known but nearby marine ecosystems and underscored the importance of local oceanographic research. The workshop was specifically designed to awaken students’ “ocean awareness and knowledge” and “ocean consciousness” and to enhance their perception of the continuity between terrestrial and marine ecosystems, as well as to make the ocean more present and accessible through imagination and personal experiences in nature.
Following the completion of the workshop activities, students responded to the structured questionnaire in a classroom setting under teacher supervision. Participation was voluntary and anonymous, and data collection was conducted in compliance with ethical standards for educational research. Due to organizational constraints within the schools, only 11 of the 15 schools were able to complete the full questionnaire protocol. From the 940 collected questionnaires, a stratified subsample of 645 student responses was selected to ensure balanced representation across geographic location and educational level.
Table 1. Distribution of Selected Student Questionnaires by School and Educational Level. The sample reflects the availability of data across participating schools. All secondary education levels (1r to 4t ESO) are represented, along with the final two years of primary education (5è and 6è). In addition, one vocational education and training (VET) group and one 1r de Batxillerat class (first year of preparatory education for university) also took part in the workshop. Notably, 1r and 3r ESO had the highest participation, aligning with curriculum stages where biology and environmental topics are given greater emphasis.
School 5è Primària
10-years
6è Primària
11-years
1r ESO
12-years
2n ESO
13-years
3r ESO
14-years
4t ESO
15-years
1r Batx
Pre HE
VET
Total
CEIP Miquel Capllonch 9 9
CEIP Na Caragol 40 14 54
CEIP s'Alzinar 15 15
IES Artà 37 45 1 83
IES Capdepera 16 19 26 12 27 15 115
IES Guillem C. de Colonya 24 1 25
IES Manacor 34 34
Sant Bonaventura 24 14 23 19 80
Sant Francesc d'Assís 24 1 25 19 16 85
Sant Salvador 17 19 22 15 73
Santo Tomás de Aquino 21 16 16 18 1 72
Total 78 97 153 77 137 64 27 15 645

2.4. Data Analysis

Data analysis was structured according to the study’s three main objectives:
a) Descriptive and comparative analysis
Following similar approaches in studies about spatial perceptions of coastal proximity [48], a visual exploratory analysis was conducted to compare students' objective coastal proximity with their self-perceived coastality (coastal vs inland).
The analysis was implemented through the combination the GIS Software [49] ArcGIS Pro [50], and interactive dashboards created with Power BI [51], allowing for a visual examination of:
  • The distribution of objective versus perceived coastality,
  • Potential mismatches between physical proximity and symbolic identification,
  • Differences by municipality and school center.
Students' symbolic image selections (coastal, rural, or mountainous) were also analyzed descriptively to explore alternative representations of territorial identity. The aim of this visual analysis was to assess whether the hypothesized divergence between real and perceived coastality (H1) was observable in the data patterns.
b) Spatial Analysis: Coastality-Gap Index
To spatially analyse the alignment (or mismatch) between symbolic coastal identification and physical proximity to the sea, we developed the Coastality-Gap Index, a raster-based indicator that compares students’ self-reported inland identity with the geographic distance of their residential nuclei to the coastline.
The index was calculated using the following steps in ArcGIS Pro:
  • Distance to Coastline: A Euclidean distance raster was generated from the official coastline of Mallorca using a 250m resolution. The values were normalised to a 0–1 scale, with 1 representing the point farthest from the sea on the island.
  • Symbolic Inlandness: For each populated nucleus with survey data, the percentage of students who identified their municipality as “inland” was calculated and rasterised using the same 1 km grid.
  • Index Formula: The Coastality-Gap Index was derived by subtracting the normalised distance from the symbolic inlandness value:
I G I i = P . i n l a n d i D . n o r m i
Preprints 182198 i001
This operation yielded a continuous raster where:
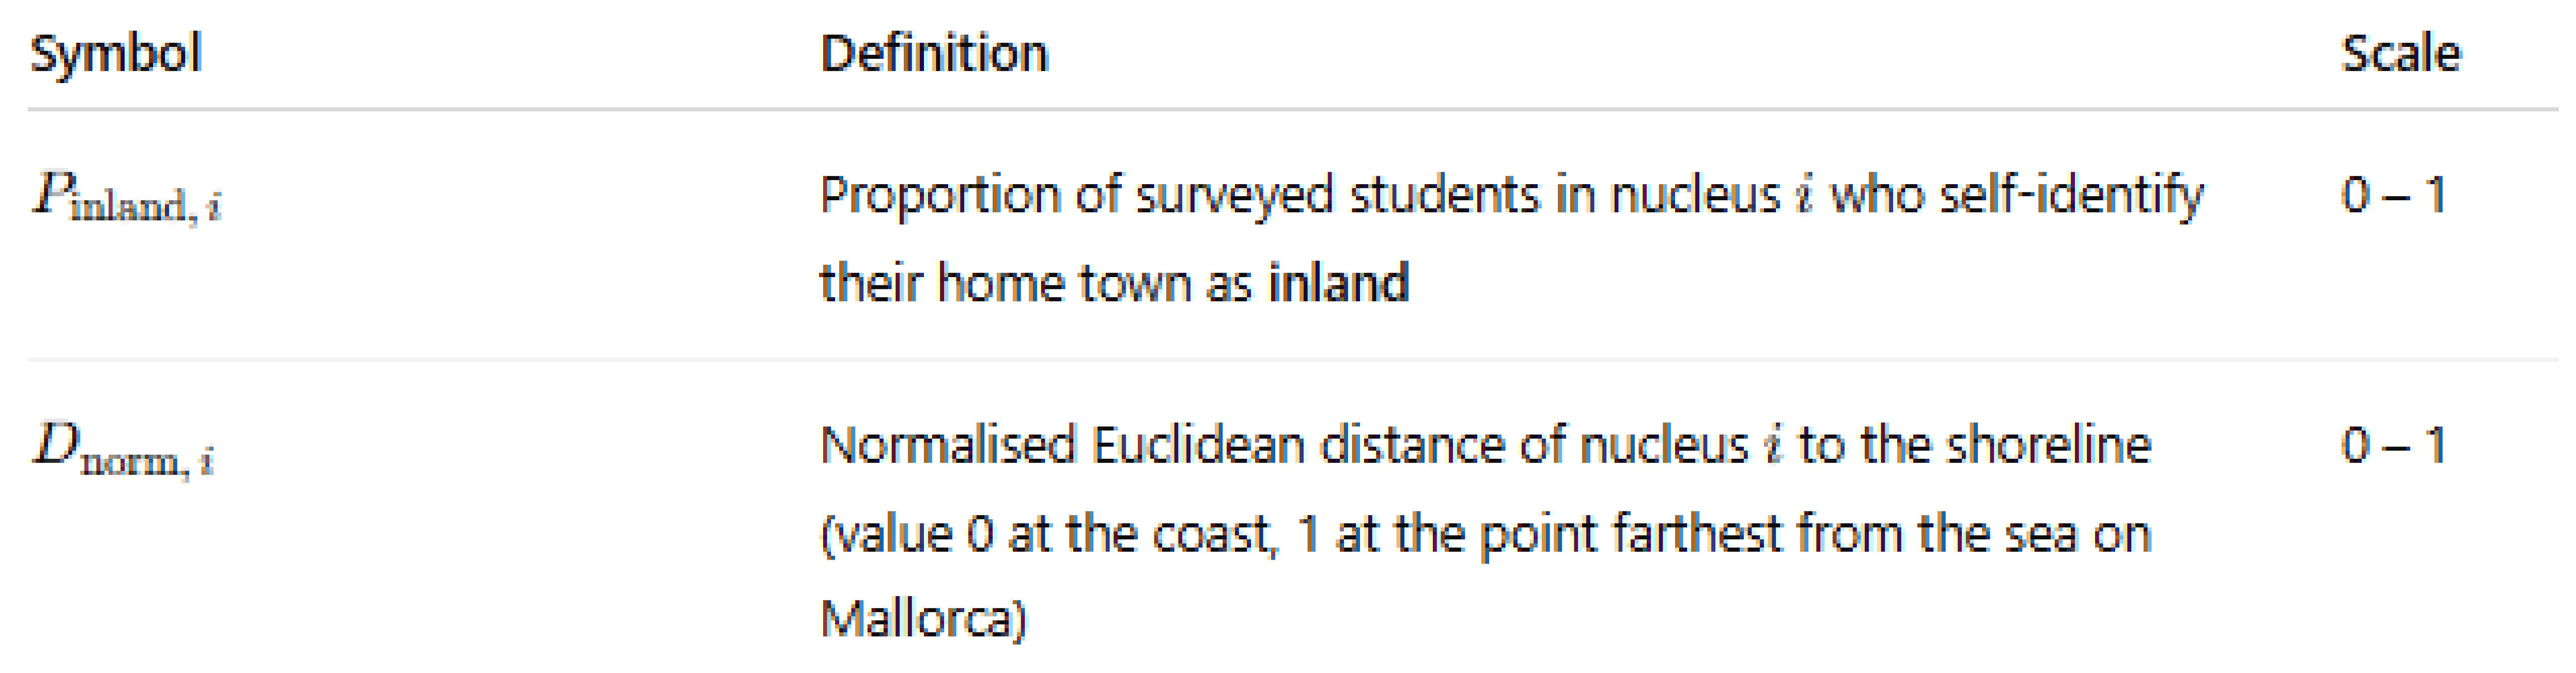
  • Positive values indicate areas where inland identification exceeds expectations based on distance.
  • Negative values represent zones where students feel coastal despite being relatively inland.
  • Values near zero suggest symbolic–spatial alignment.
4. Classification and Interpretation. These intervals were calibrated through exploratory data analysis to reflect substantial perceptual mismatches, rather than minor deviations. For interpretation, it was grouped into three zones:
  • Symbolically coastal (Gap Index < –0.05)
  • Spatial-symbolic alignment (–0.05 to +0.20)
  • Inland identification gap (> +0.20)
This index enabled the creation of a spatial typology that supports the broader analysis of perceived coastality and highlights symbolic inland “hotspots” that may be overlooked by traditional buffer-based coastal definitions.
c) Cluster analysis
To complement the index gap analysis and further explore underlying perceptual patterns among students, a K-means clustering procedure was employed. This allowed for the identification of distinct student profiles based on key variables: emotional connection to the ocean, frequency of sea visits, engagement in marine activities, OL at both global and local levels, and knowledge of local marine species. The clustering was performed using ArcGIS Pro [50] which also facilitated the spatial visualization of perceptual typologies across municipalities.
Before clustering, continuous variables were categorized to reduce noise and facilitate the identification of more distinct perceptual profiles. This categorization approach is common in behavioral and environmental studies to quantify self-reported experiences and exposures, allowing for a more nuanced analysis of experiential and social dimensions [52,53]
Assigning ordinal values to categorical data enables the integration of experiential measures into statistical models. For instance, coding the frequency of coastal visits as an ordinal variable aligns with established methodologies in studies exploring the impact of nature exposure on well-being. Similarly, ordinal scales are frequently employed to assess emotional connection to nature [54,55] and the extent of social discussions regarding environmental issues [56] Meanwhile, continuous variables such as the OL score provide standardized metrics for assessing knowledge, aligning with approaches in OL research [40]
The optimal number of clusters was determined using the Elbow Method [57], ensuring both statistical robustness and interpretability. Each cluster was then analyzed descriptively to characterize dominant emotional, experiential, and cognitive features.
Table 2. Variables Included in the K-Means Clustering Model: Descriptions and Coding Schemes for Emotional, Experiential, and Cognitive Dimensions.
Variable Description Type and coding
coastal-inland identification Student coastal-inland identification of their hometown Ordinal 0 -1
Emotional connection to the sea Emotional polarity and intensity toward the sea Ordinal (-2 to +3)
Frequency of coastal visits Frequency of visits to coastal areas Continuous (0 to 10)
Local ocean literacy level Knowledge of local marine terms Continuous (0 to 10)
Global ocean literacy level General ocean literacy knowledge Continuous (0 to 10)
Marine sports and activities Number of different marine activities practiced Continuous (0 to 6)
Talking about the sea Number of social agents discussing the sea Continuous (0 to 10)
Sources of information Number of information sources regarding the sea Continuous (0 to 10)
Local species knowledge Ability to identify local marine species Continuous (0 to 10)

3. Results

This section presents the findings in alignment with the three core objectives of the study:
  • To identify patterns of perceived coastality, that is, how students perceive their environment as “coastal” or “inland”, in relation to their school’s actual geographic location.
  • To analyse the Coastality-Gap Index, a spatial measure designed to capture the mismatch between symbolic self-identification and physical proximity to the coast.; and
  • To explore the factors that influence both perception and knowledge through correlation analysis, and to identify student profiles using cluster analysis.
The results are organized to guide the reader from students’ symbolic identification with the ocean, through their cognitive understanding of marine topics, to a data-driven interpretation of the variables shaping these patterns.

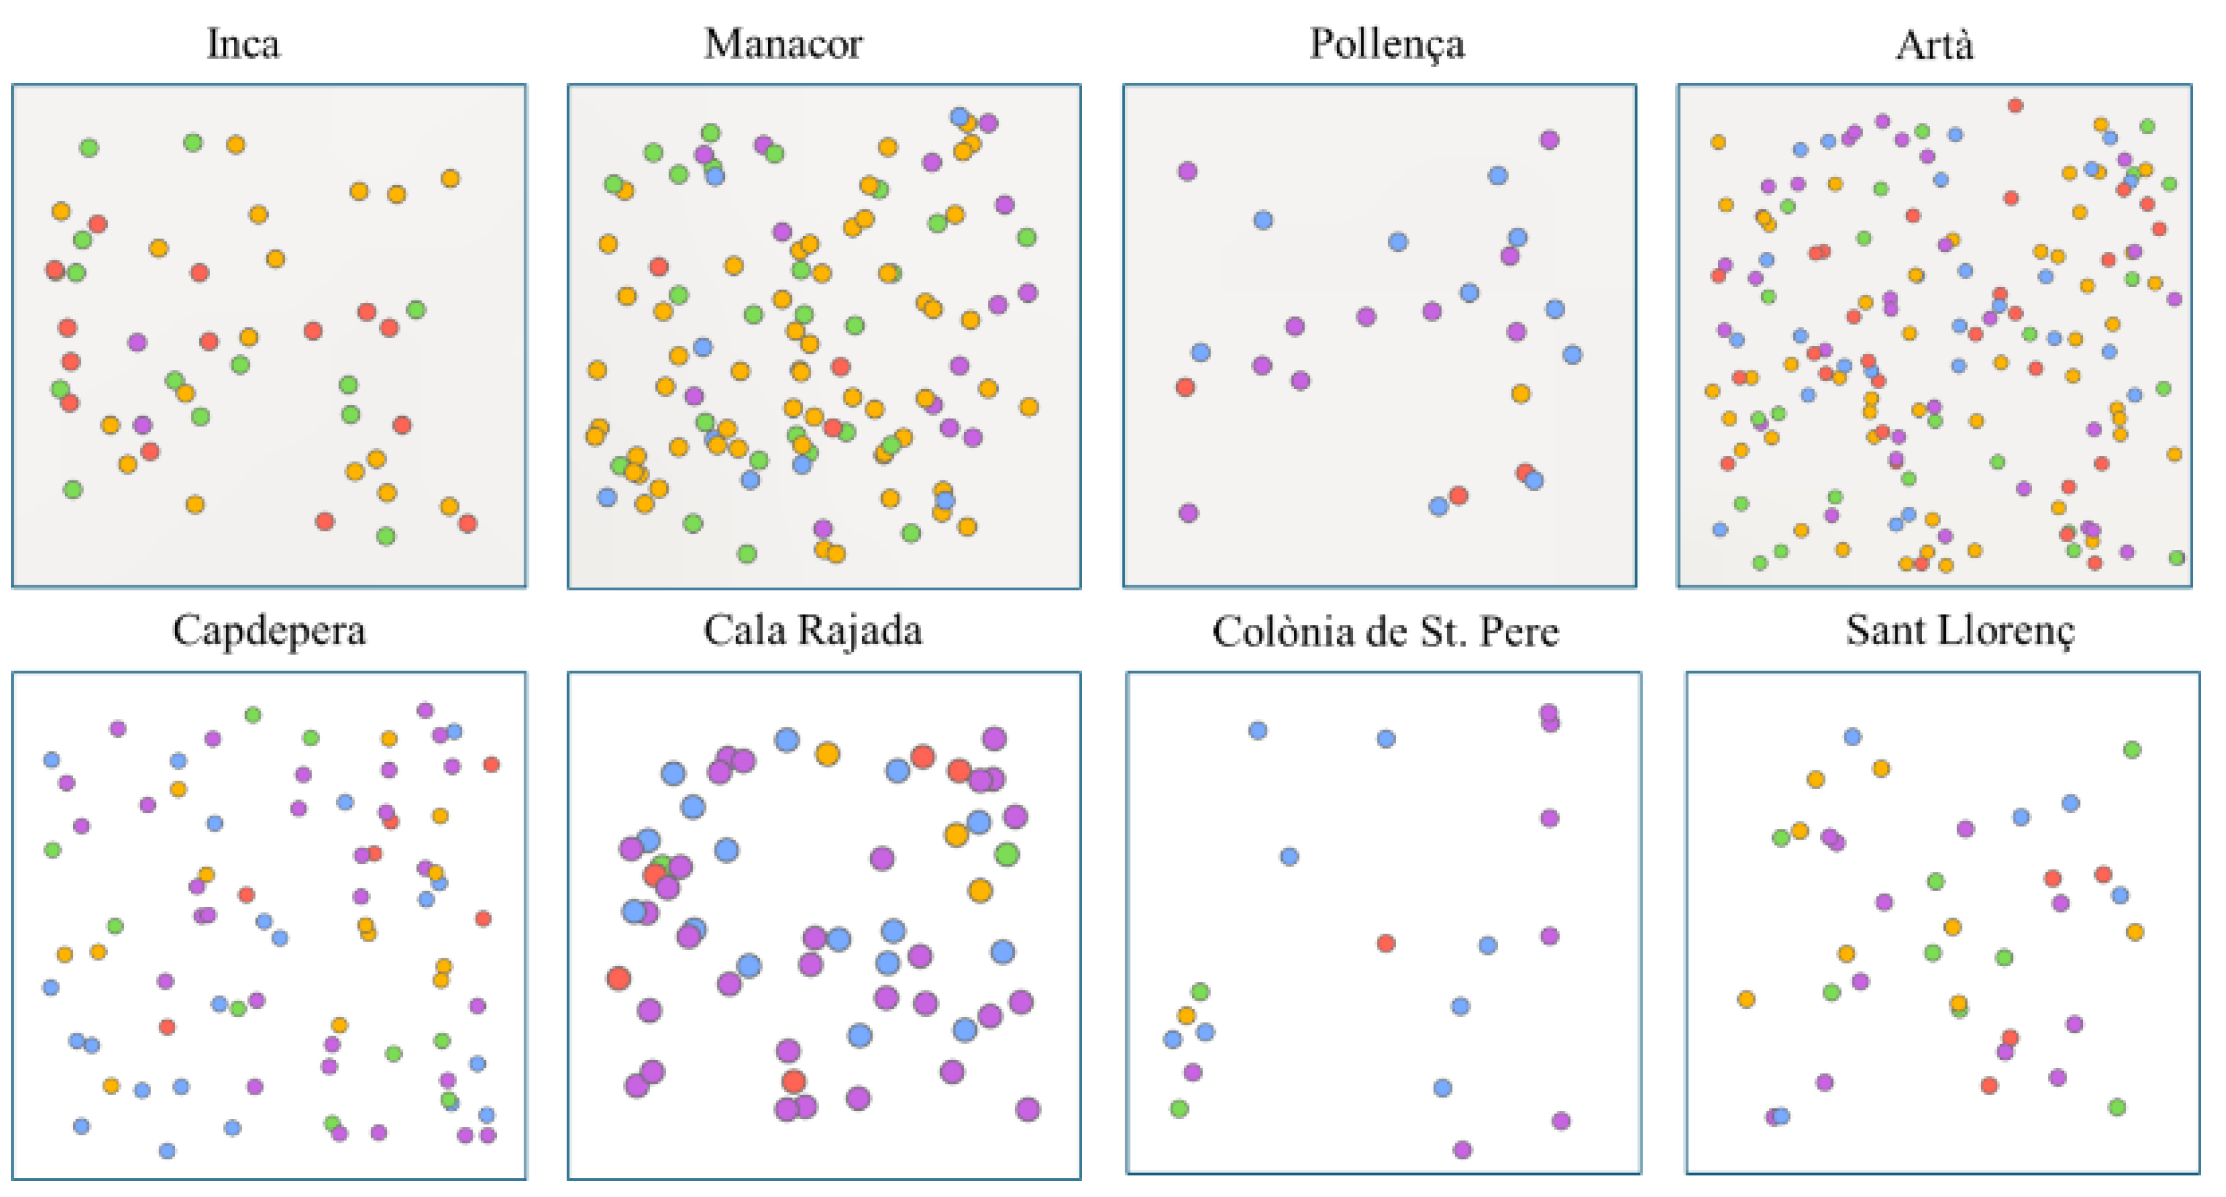
3.1. Visual Exploration of Real vs. Perceived Coastality

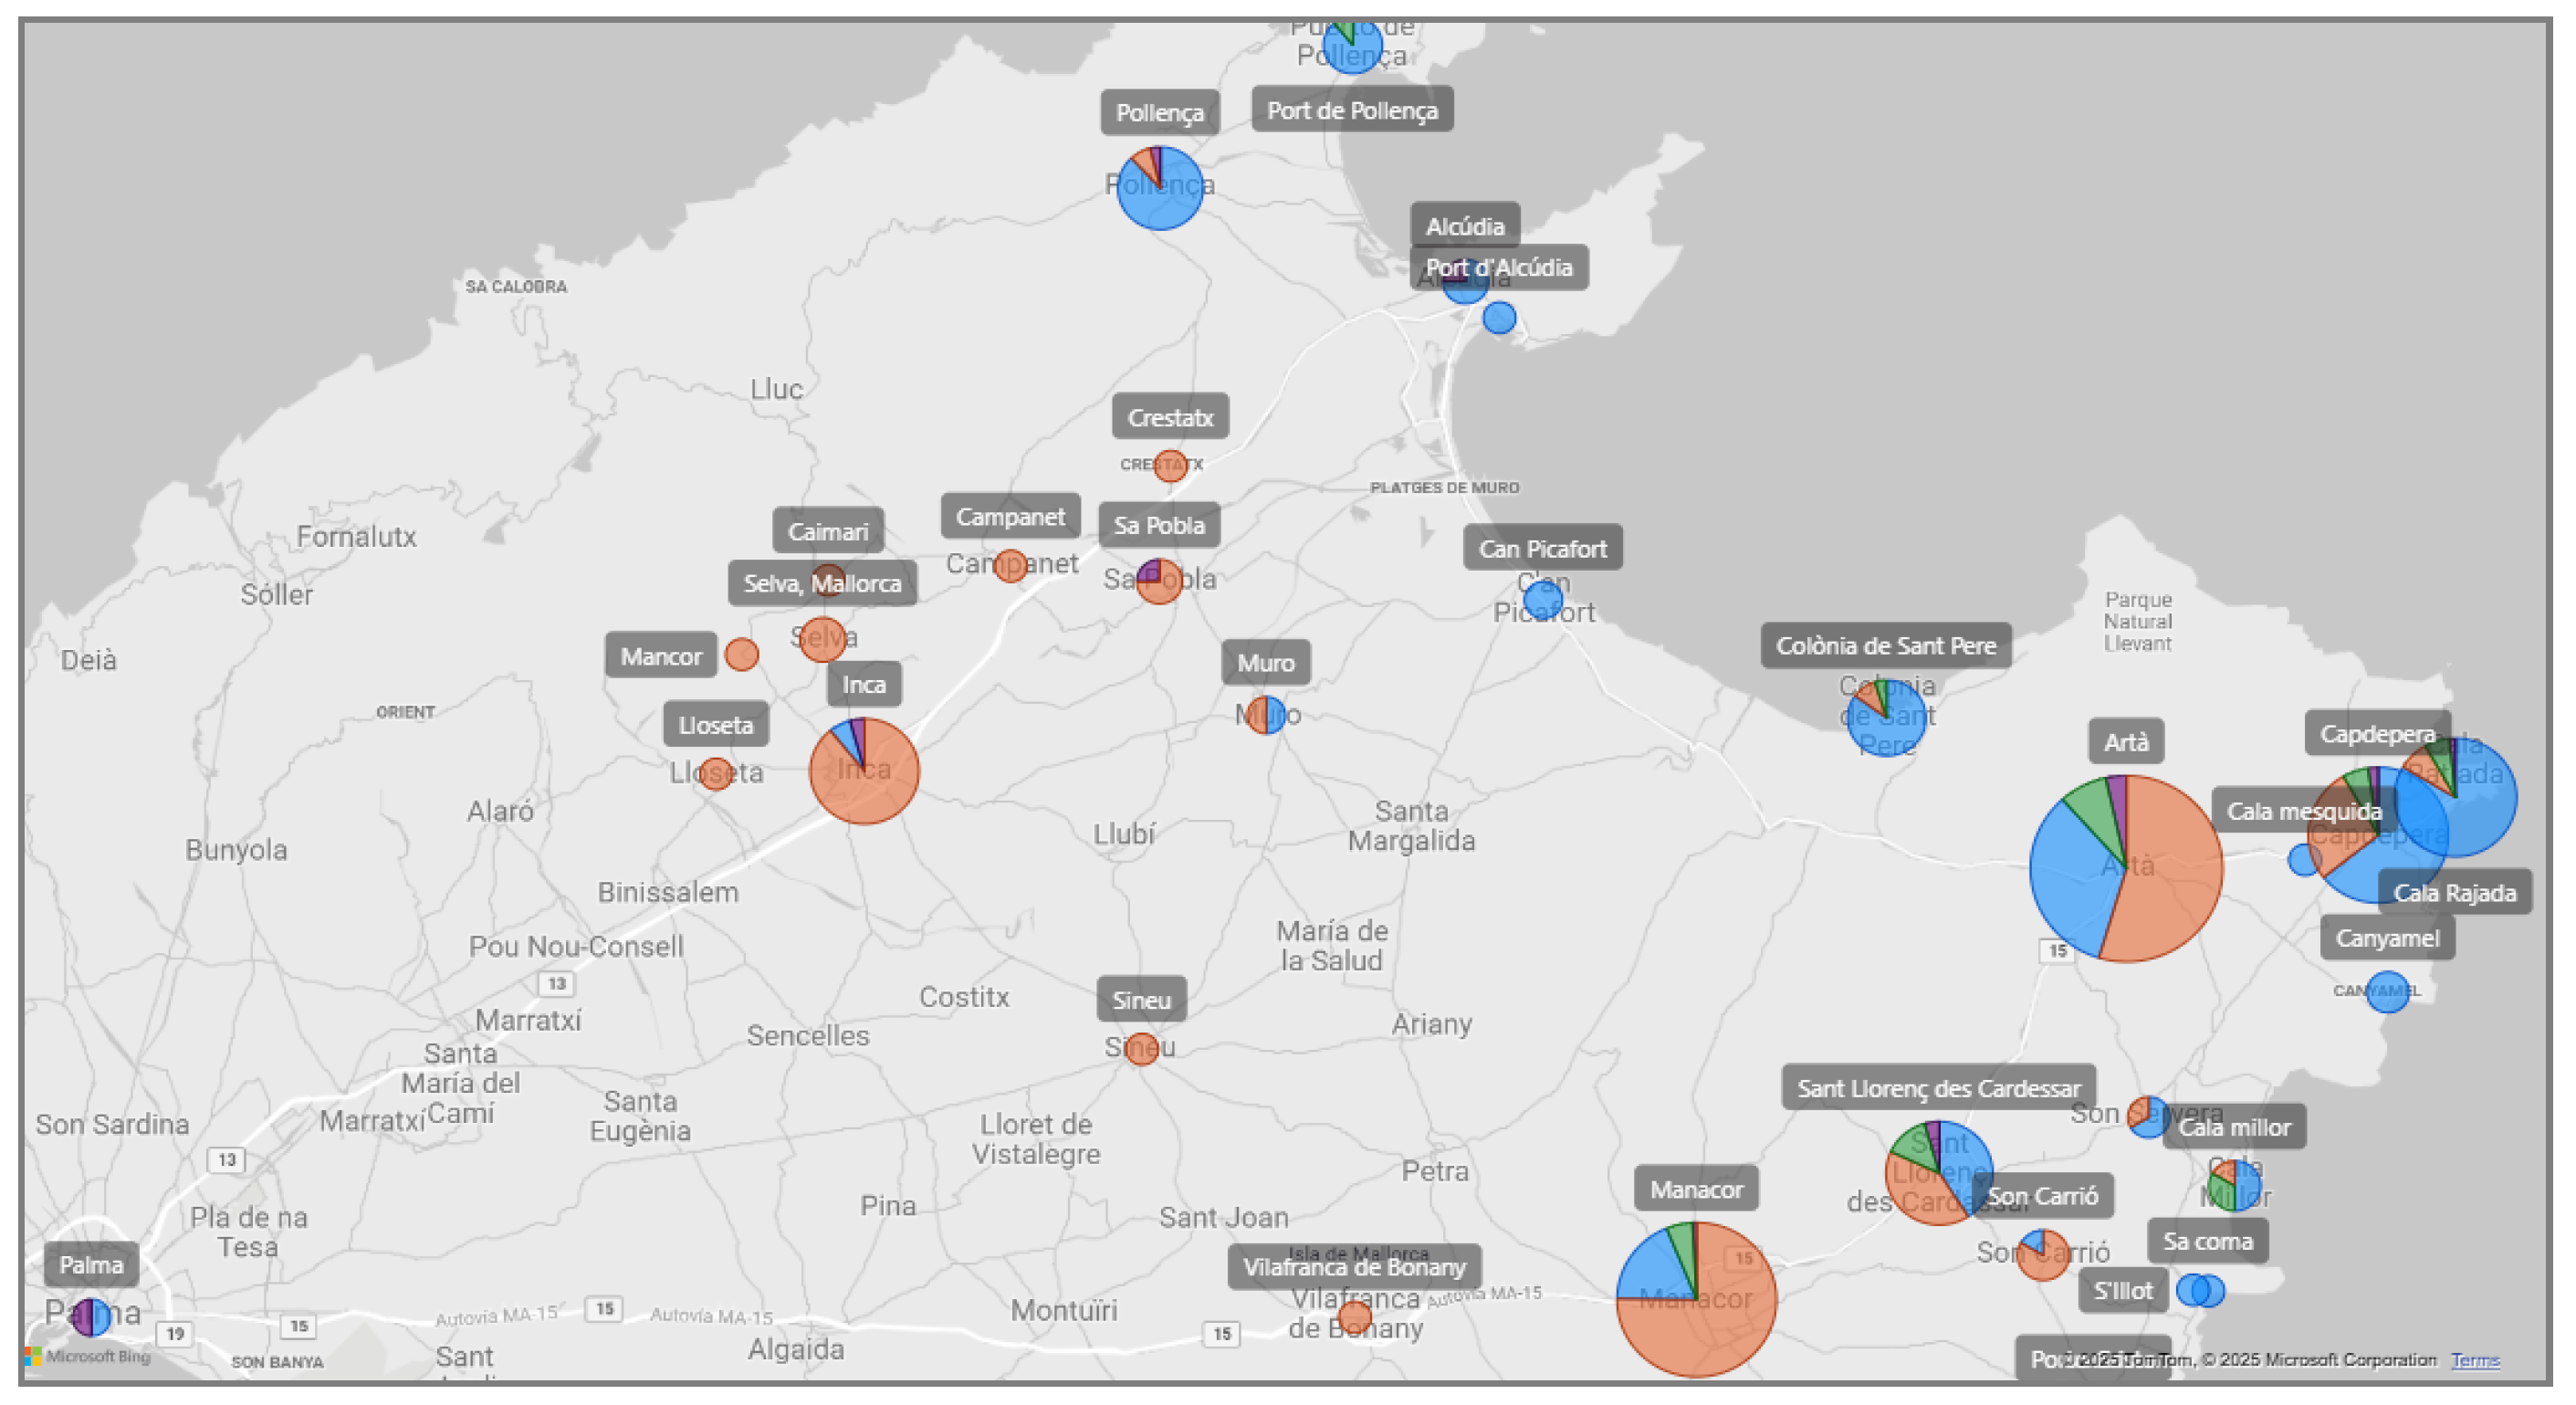
3.1.1. Coastal-Inland Divide

The results reveal a notable misalignment between students’ symbolic self-perceptions and the objective geographic realities of their municipalities. Even in coastal municipalities with direct access to the sea, such as Artà, Capdepera, and Manacor, a significant proportion of students identified their environment as “inland”.
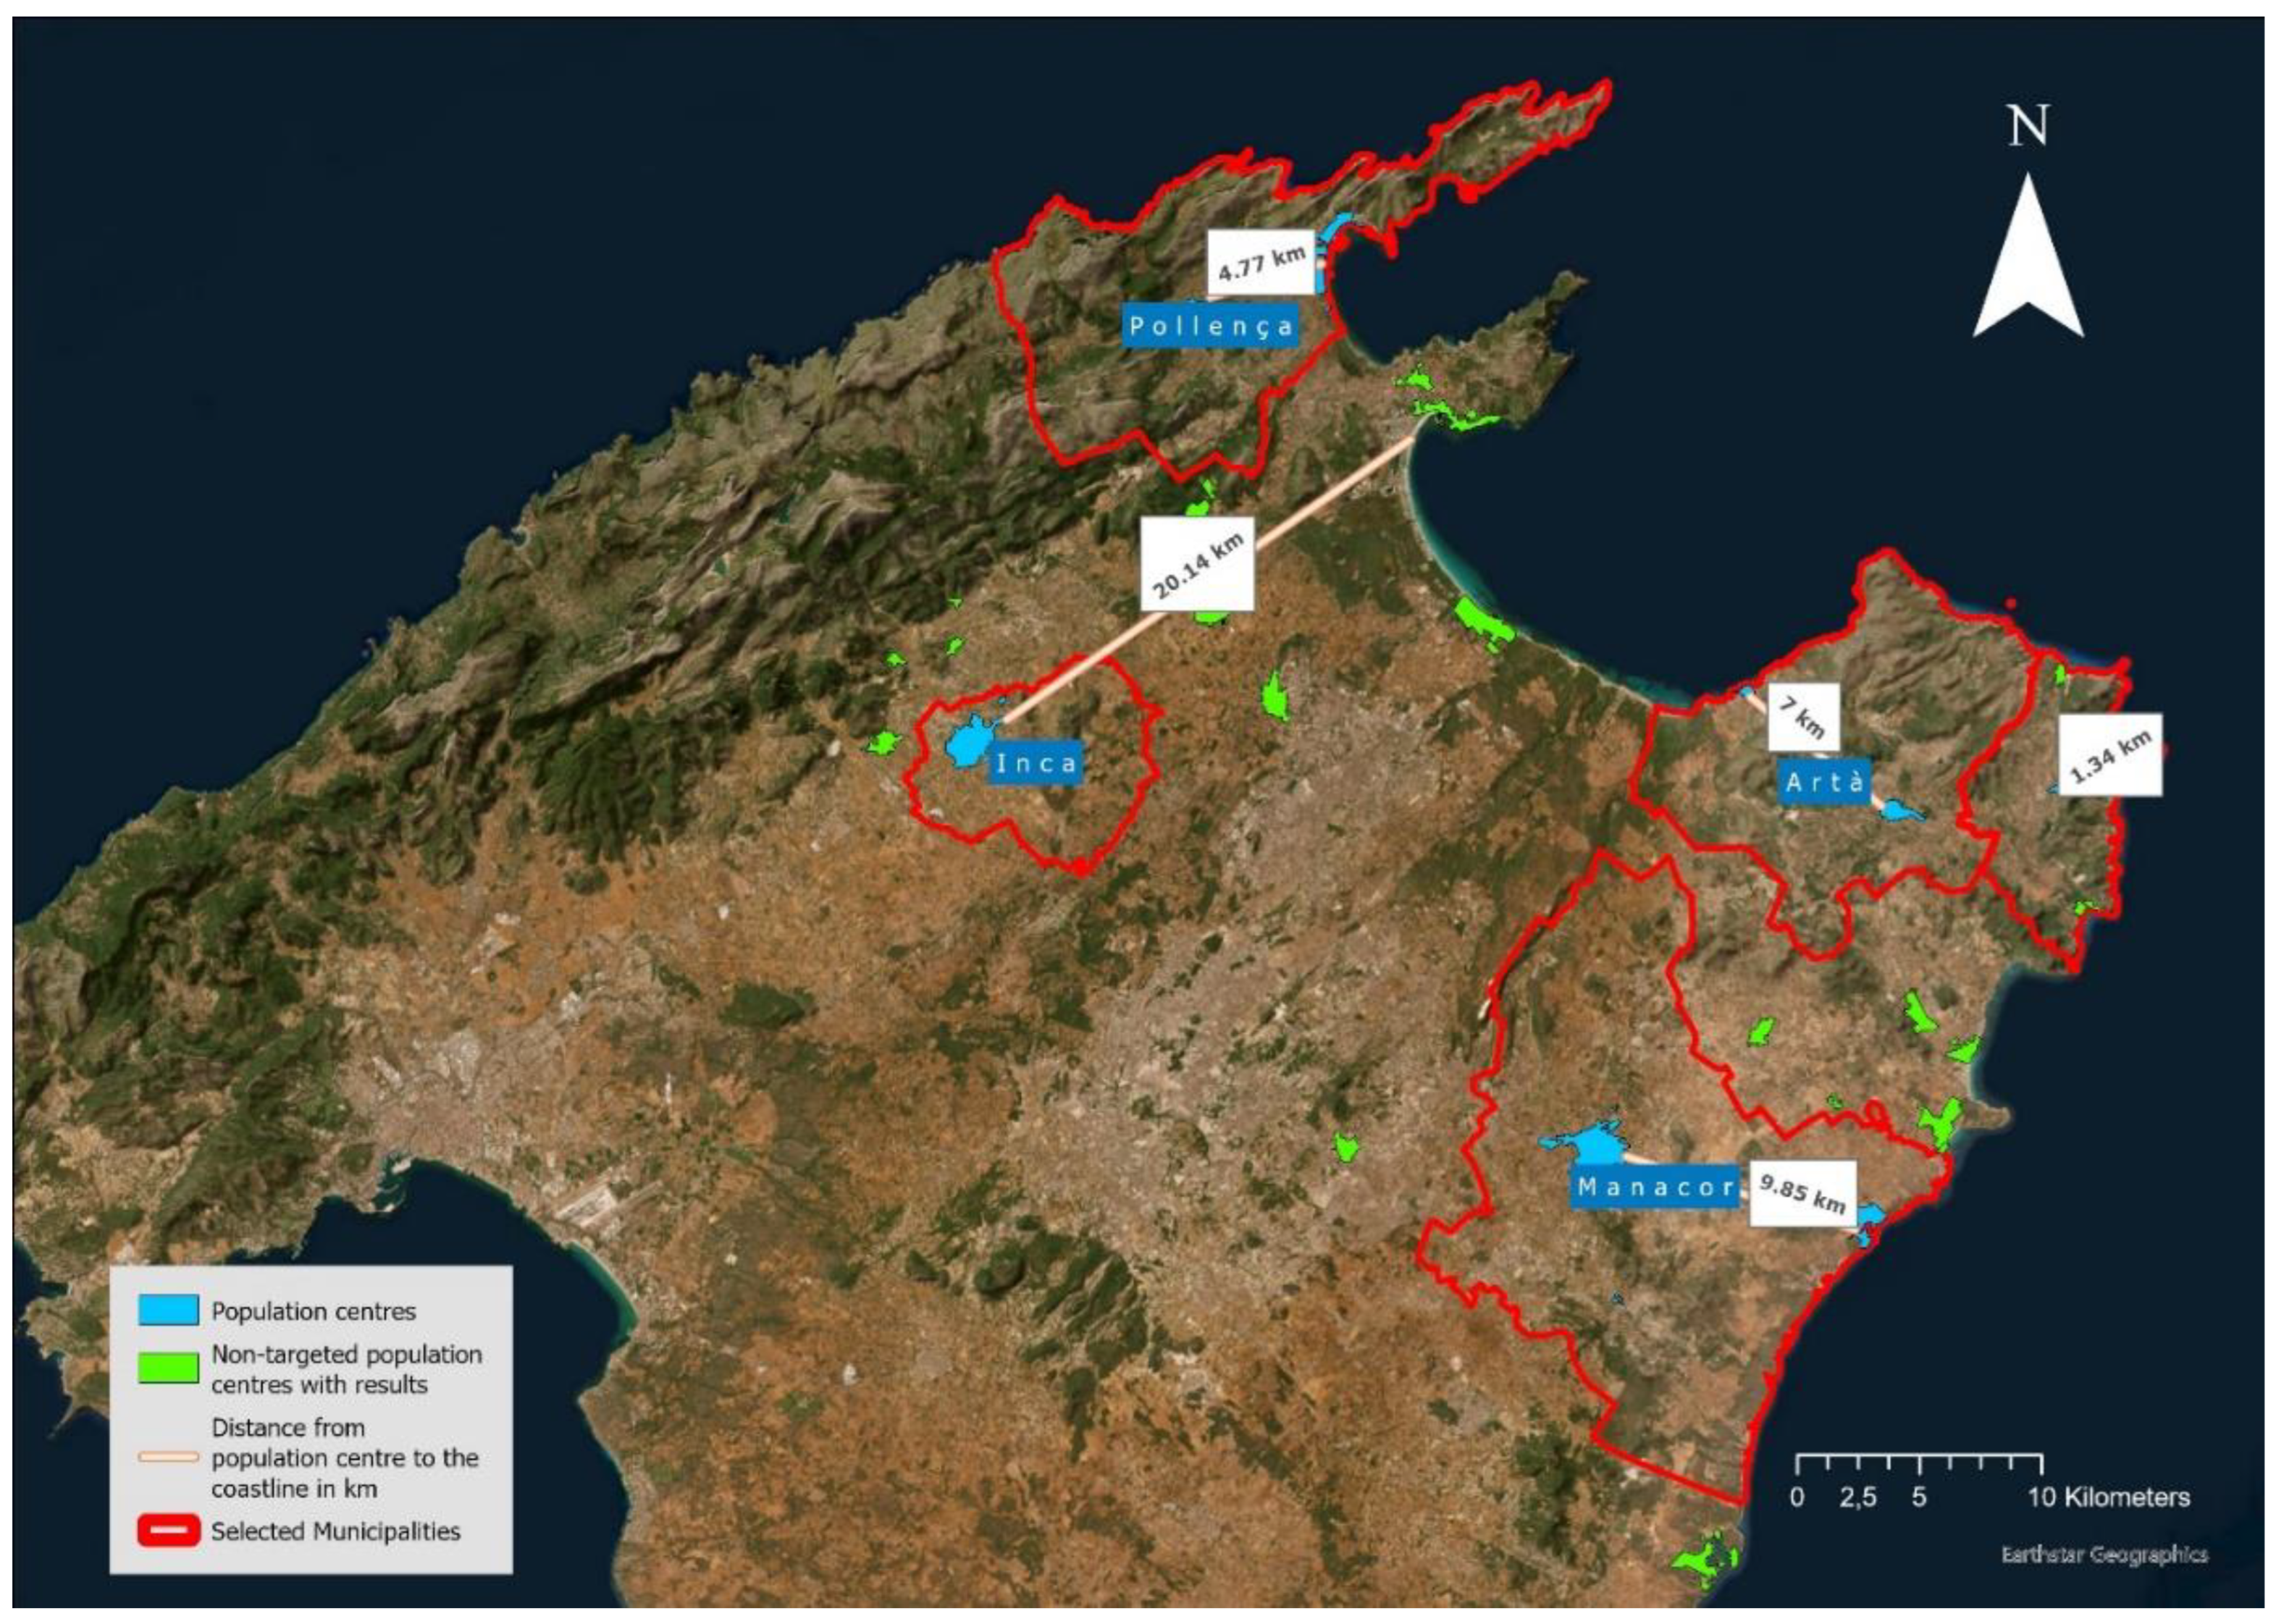
  • In Artà, despite the municipality having one of the longest coastlines on the island, 54.65% of students perceived their school environment as inland.
  • In Capdepera, where the administrative center lies only 2.6 km from the coast, almost 27% of students identified their municipality as “inland”.
  • In Manacor, 75.22% of students perceived their municipality as “inland”, a markedly higher rate than in Pollença, where only 8% expressed this perception, despite both municipalities are situated at comparable distances from the coast.
As expected, Inca, an “inland” municipality without direct coastal access, recorded the highest “inland” self-perception rate (89,13%).
Table 3. Student Perceptions of Coastal or Inland Identity by Municipality Compared to Real Distance to the Coast (in km). Survey results from towns with between 20 and 172 student respondents. The table illustrates the symbolic coastal–inland divide, highlighting discrepancies between student perceptions and the actual physical distance of each municipality to the coast.
Municipality Coastal Coastal and inland Inland Not specified Distance to coast in km
Artà 33,72% 3,49% 54,65% 8,14% 12.8
Cala rajada 83,61% 1,64% 8,20% 6,56% 0
Capdepera 64,29% 2,38% 27,38% 5,95% 2.6
Colònia de sant pere 85,00% 10,00% 5,00% 0
Inca 6,52% 4,35% 89,13% 23.4
Manacor 18,58% 0,88% 75,22% 5,31% 11.8
Pollença 88,00% 4,00% 8,00% 6.68
Sant llorenç des cardessar 40,91% 4,55% 40,91% 13,64% 11.5
Total 43,19% 2,65% 47,79% 6,37%
When considering smaller towns, where sample sizes were lower, the “coastal” vs “inland” division remains evident within EU proximity thresholds. However, notable cases emerge:
  • In Sant Llorenç des Cardassar, student responses were almost evenly split between “coastal” and “inland” self-identification.
  • Interestingly, even in port settlements such as Cala Rajada (Capdepera) and Colònia de Sant Pere (Artà), 6.5% and 10% of students, respectively, identified themselves as “inland”.
Further clarity emerges when examining municipalities with only 1 to 10 student respondents. A clear dichotomy is observed:
  • Port towns and coastal tourism hubs, such as Port d’Alcúdia, Portocristo, Portocolom, Cala Mesquida, and Can Picafort, registered 100% coastal self-identification.
  • Conversely, inland municipalities with no direct coastal access, such as Sineu, Lloseta, Campanet, and Selva, exhibited 100% inland identification.
However, municipalities with coastlines but urban centers located more than 5–10 km from the shoreline, such as Muro and Son Servera, produced mixed results, further underscoring the complexity of coastality as a perceived rather than strictly spatial concept.
Figure 7. Self-perceived coastality by population centre. Bubble size reflects the number of student respondents in each town. Colour coding indicates the dominant self-identification: blue for “coastal”, orange for “inland”, purple for mixed responses, and green for non-responded (NA).
Preprints 182198 g007

3.1.2. Symbolic Landscape Preferences: Image and Place Identity

For the question “Which image do you like the most?”, image B emerged as the dominant preference across the sample, selected by 68% of respondents.
When disaggregated by perceived coastality, students who identified as coastal chose Image B slightly more often (69.6%) than those from “inland” areas (66.4%). Inland-identified students showed a modestly stronger preference for Image C (27.0%, compared to 22.1% among coastal students), suggesting that urban-tourism imaginaries may play a more aspirational role for those without direct access to the coast. Across all coastality groups, Image A received the fewest selections, particularly among students identifying as both coastal and inland, for whom support for A dropped to 3.9%.
At the municipal level, Colònia de Sant Pere exhibited the strongest symbolic alignment with the natural coast, with 82.4% of students selecting Image B. Conversely, students from Inca demonstrated the lowest preference for B and the highest for Image C, reflecting a symbolic projection toward coastal leisure environments from an “inland” position. In Artà, Capdepera, and Cala Rajada, Image B remained the most popular, although Capdepera students expressed relatively stronger interest in Image C, indicating a more urbanised or tourism-driven symbolic framing of the coast.
Differences at the school level further reinforced these patterns. At CEIP s’Alzinar, Image B was selected by 86.7% of students, with minimal support for A and C. Similarly, IES Artà students strongly favoured Image B (81.3%), with limited interest in the resort image. In contrast, IES Capdepera recorded the highest selection of Image C (35.7%), suggesting a symbolic model of the coast more influenced by built environments and tourism. A more balanced profile was observed at CEIP Miquel Capllonch (Port de Pollença), where 66.7% chose B, followed by 22.2% for C and 11.1% for A.
Figure 8. Results of the image selection by school (left side) and municipality (right side).
Preprints 182198 g008
When asking students “In which village would you prefer to live?”, overall, port villages (option B) were the most popular residential ideal, selected by more than 50% of students across all coastality groups. Inland villages (C) attracted greater support from inland students (31,25%), while mountain villages (A:14,35%) were generally the least favoured, with a few noteworthy exceptions.
Students from Pollença and Port de Pollença, located in the Serra de Tramuntana (mountain range), expressed the highest preference for mountain villages (22.73% and 33% respectively), suggesting alignment between symbolic place identity and local geography. By contrast, students in Inca exhibited a clear preference for inland villages (39.1%), with minimal symbolic attachment to the coast or mountains. In Colònia de Sant Pere, 70.6% of students selected the port village, reinforcing the strong symbolic pull of coastal identity in this location.
At the school level, IES Guillem Cifre de Colonya (Pollença) reflected the geographical trends of its municipality, with a notably high preference for mountain villages (27.3%) and the lowest support for inland settings (9.1%). IES Manacor showed the opposite pattern: 52.9% of students preferred inland villages, despite the town’s coastal access, pointing to a potential symbolic disconnection from the maritime domain. Sant Bonaventura (Artà) followed IES Manacor in reporting a high preference for inland villages (45%), in contrast to the other three schools in Artà, IES Artà, CEIP Na Caragol, and Sant Salvador, where support for inland options ranged from 25% to 33%.

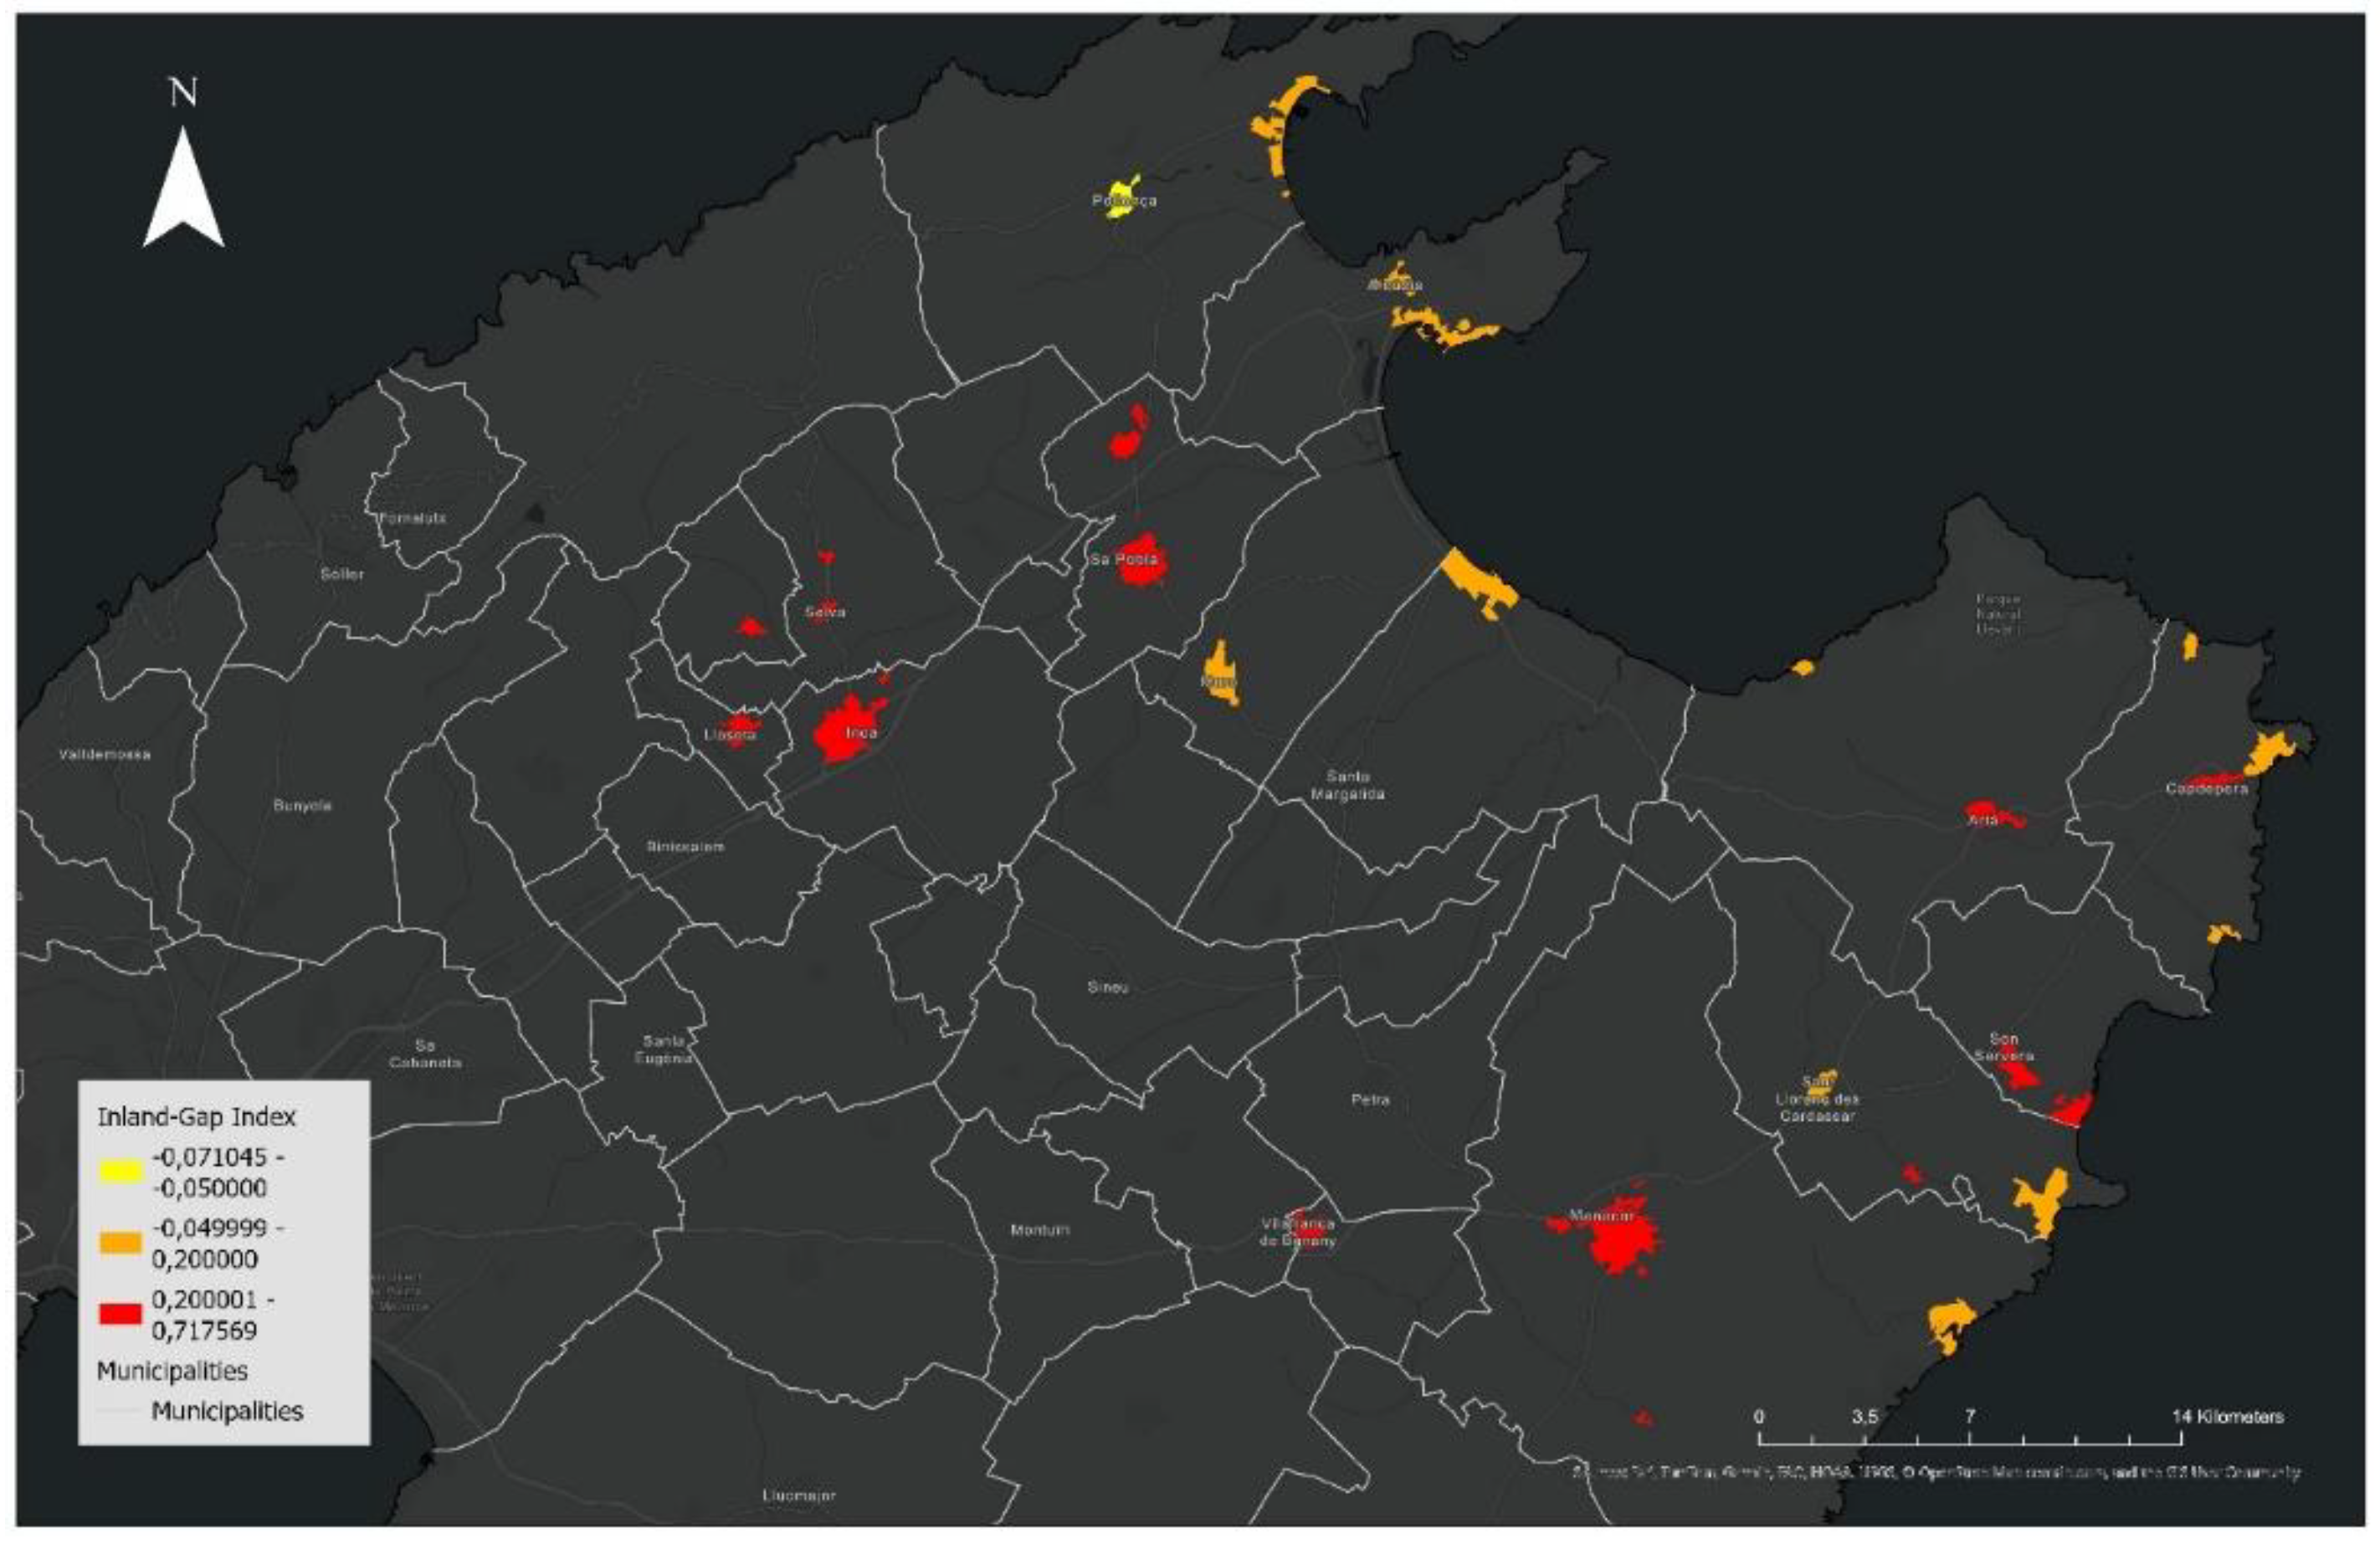
3.2. Results of the Index Gap

The Coastality-Gap Index revealed substantial spatial mismatches between symbolic and geographic coastality across the 29 population centres studied in Mallorca. Index values ranged from –0.07 to +0.72, reflecting both cases of symbolic coastal identification despite geographic distance, and conversely, inland symbolic orientation even in locations near the coastline.
To interpret these patterns, three zones were defined based on index thresholds:
  • Symbolically coastal (Index < –0.05): This category includes only Pollença (–0.07) where students expressed a strong symbolic attachment to the ocean despite moderate inland distances. These cases suggest that local culture, traditions, or family engagement with the sea may shape symbolic identity more strongly than geography.
  • Symbolic–geographic alignment (–0.05 to +0.20): The majority of centres fell into this zone, showing consistency between perceived inlandness and actual distance to the coast. Examples include port areas such as Portocolom (0.00), Port de Pollença (0.00) and Cala Rajada (0.09), and presents interesting results in Muro (0.17) and Sant Llorenç (0,15). These locations typically lie within 11 km of the coastline and show moderate levels of inland self-identification.
  • Coastality-Gap zone (Index > +0.20): This group reveals a notable divergence between physical proximity and symbolic perception. Despite being only 6–10 km from the coast, students in centres such as Son Macià (0.72), Sa Pobla (0.67) and Son Carrió (0.64), reported high rates of inland self-identification. The highest value, found in Son Macià, suggests a symbolic detachment from the marine environment even in relatively accessible coastal areas.
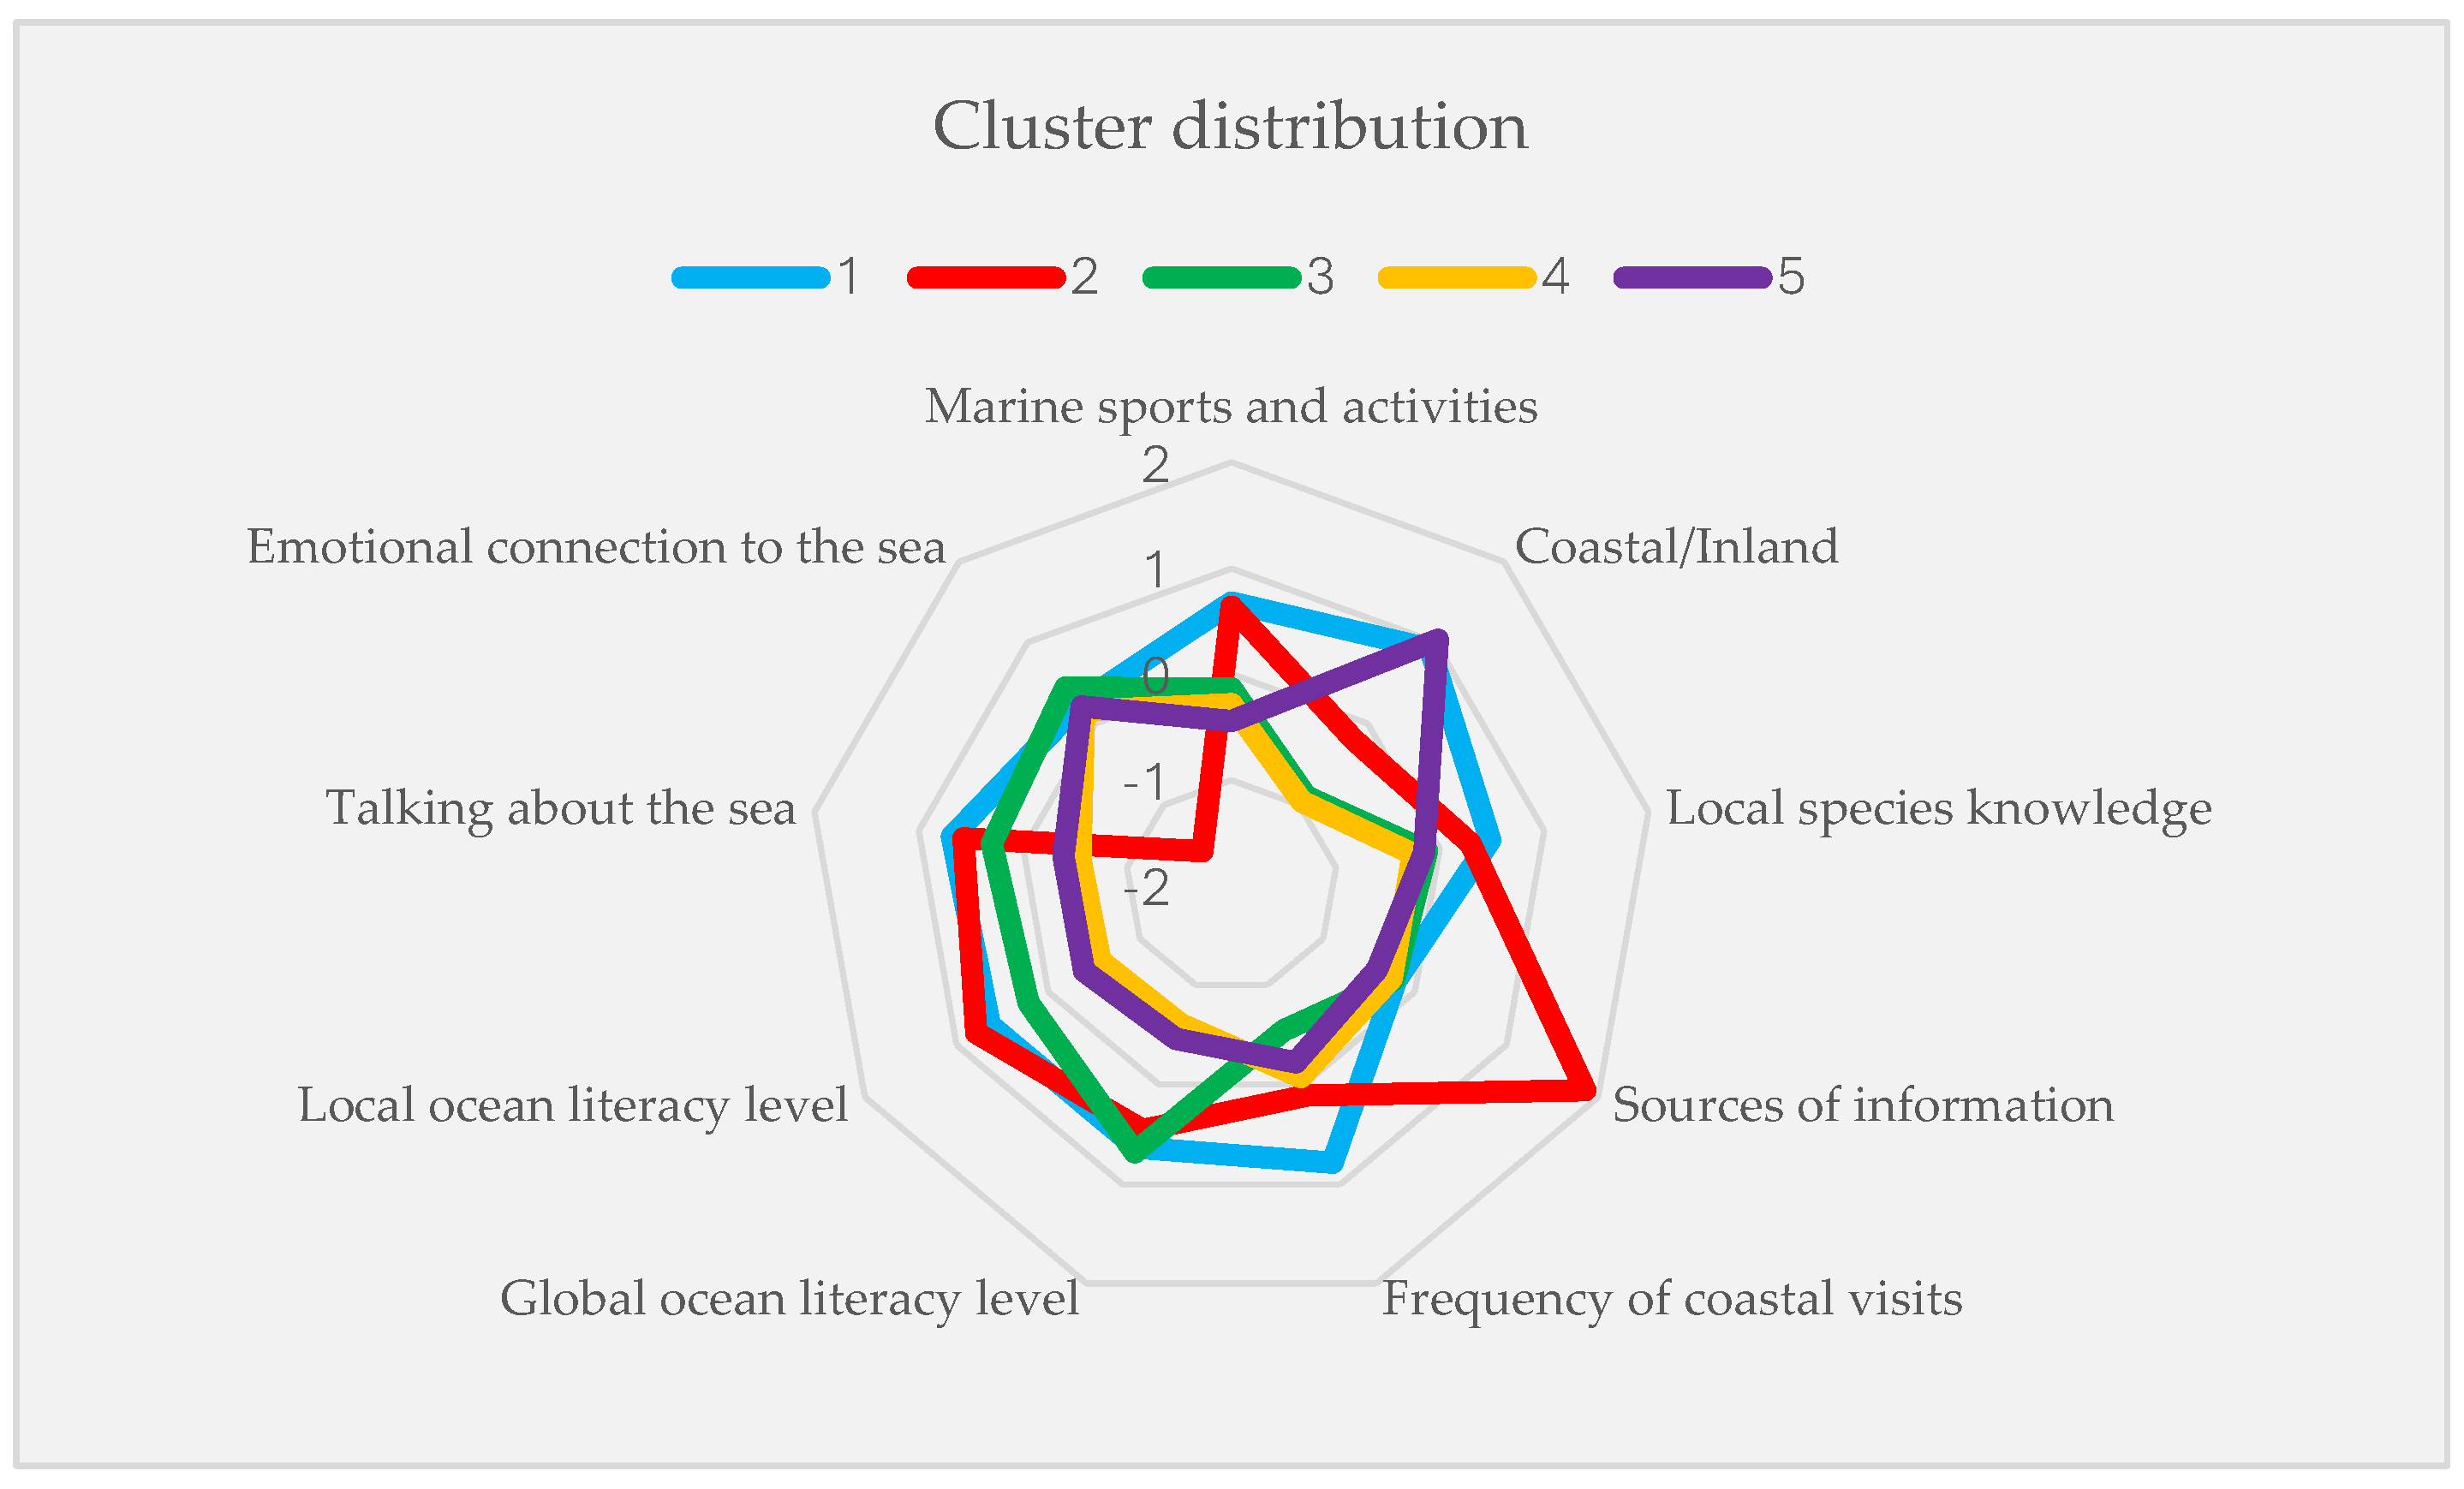
A complete list of all population centres and their corresponding Coastality-Gap values is provided in Table 4. The results indicate that geographic proximity alone does not guarantee symbolic or emotional identification with the sea. This supports the study’s first hypothesis and raises important questions for OL strategies that assume linear relationships between physical space and coastal identity.
Mapping the index (see Figure 9) reveals a pattern of symbolic inland hotspots in inland and transitional areas, particularly in central and northern Mallorca. Notably, big population centres like Artà and Manacor exhibit high Coastality-Gap values (0.34 and 0.41, respectively), despite being within 11 km of the coastline.
The Coastality-Gap Index thus serves as a complementary tool to student self-reports, offering a spatialised and interpretable measure of symbolic detachment from the sea. Rather than relying solely on administrative boundaries or fixed-distance buffers, the index captures mismatches between objective proximity and subjective coastal identity. Crucially, it does not attempt to impose a rigid or universal definition of what constitutes a “coastal area.” Instead, it highlights where perceived coastality lags behind geographic opportunity, enabling policymakers and educators to identify target areas for OL or Blue School interventions.
Figure 9. Mapping of the Coastality-Gap Index in the studied nuclei.
Preprints 182198 g009

3.3. Clustering

The analysis revealed five distinct perceptual profiles, each reflecting a different mode of engaging with the ocean. These profiles range from highly integrated marine identities to students with minimal emotional or cognitive attachment to the ocean. Together, they offer a nuanced typology that supports the design of targeted OL interventions that go beyond spatial proximity or school location.
  • Cluster 1 – Connected Coastal Engagers: This group represents students who self-identify as coastal (0.9207) and exhibit strong integration of marine experience and knowledge. They frequently visit the sea (0.7842), engage in marine sports (0.6751), and demonstrate high global (0.6328) and local (0.6394) OL. They actively talk about the sea (0.6827), express a positive emotional connection (0.2425), and have above-average knowledge of local marine species (0.4818). This profile reflects a balanced and well-developed marine identity.
  • Cluster 2 – Informed but Emotionally Disconnected: These students tend to perceive their environment as inland (-0.2036) but demonstrate high local OL (0.7798) and moderate global OL (0.4564). Despite marine sports engagement (0.6355) and low frequency of sea visits (0.1103), they access a wide range of information sources (1.8588) and frequently talk about the sea (0.5714). However, their emotional connection is strongly negative (-1.5776), pointing to a disconnect between knowledge and emotional experience.
  • Cluster 3 – Curious Distant Observers: Students in this cluster perceive their municipality as more inland (-0.8984) and report low frequency of coastal visits (-0.5473). They engage little in marine sports (-0.1347) and have limited species knowledge (-0.1242). Despite these limitations, they show moderately high global OL (0.6804), but only low local OL (0.2183). Their emotional connection is slightly positive (0.4419), and their conversations about the sea are infrequent (0.2990). This group demonstrates cognitive potential but remains physically and socially distant from the sea.
  • Cluster 4 – Disconnected and Unaware: These students strongly perceive their region as inland (-0.9665) and exhibit the lowest scores in nearly every dimension. They rarely visit the sea (-0.0756), do not engage in marine sports (-0.2847), and show low global (-0.6090) and local (-0.5717) OL. Knowledge of species is minimal (-0.2606), discussions about the sea are rare (-0.5498), and they consult very few sources (-0.2518). Their emotional connection is neutral (0.1613), reinforcing a general detachment.
  • Cluster 5 – Passive Coastal Residents: This group perceives their municipality as coastal (1.0328), but shows low levels of marine activity and knowledge. Their participation in marine sports is low (-0.4424), sea visits are infrequent (-0.2236), and they show limited global (-0.4587) and local (-0.3928) OL. They rarely discuss marine topics (-0.3884), use few information sources (-0.4143), and their emotional connection is only slightly positive (0.2054). Their perceived coastal identity is not reflected in active engagement.
Figure 10. Student Profiles Derived from Cluster Analysis: Municipality, sport and activities by the sea, Knowledge, sources of information, Communication, and Emotions.
Preprints 182198 g010
The cluster analysis reveals three broad patterns of student engagement with the marine environment across the eight municipalities: active coastal engagement, passive or disconnected coastal identity, and inland-informed but emotionally distant profiles (Figure 11).
  • Pollença stands out as the clearest example of active coastal engagement, with most students falling into Cluster 1 (Connected Coastal Engagers) and Cluster 5 (Passive Coastal Residents). This distribution reflects a population that predominantly identifies as coastal, where a significant portion not only lives near the sea but also integrates marine experiences, sports, and knowledge into their identity. The presence of Cluster 5 suggests that while coastal identity is strong, it does not always translate into active participation. A similar duality appears in Cala Rajada, Capdepera, and Colònia de Sant Pere. These municipalities show a dominant presence of Cluster 5, indicating students who perceive themselves as coastal but lack strong emotional connection, knowledge, or regular engagement with the sea. Cluster 1 also appears in each of these locations, though to a lesser extent than in Pollença, suggesting that while some students are actively involved, the broader trend is one of passive affiliation with the marine environment. This pattern points to a coastal but disengaged identity, where proximity to the sea does not necessarily foster deeper involvement.
  • Artà and Manacor share a different profile: one of diverse and fragmented engagement. Both municipalities display a wide distribution across all five clusters, with no single dominant group. In Artà, Cluster 4 (Disconnected and Unaware) is the most prevalent, while Clusters 1, 2, and 3 also have strong representation. Manacor shows a similar spread, with moderate presence across Clusters 2, 3, 4, and 5. This distribution indicates communities where students’ relationships with the sea are highly variable, some informed, others curious but distant, and many with low awareness or connection, reflecting internal heterogeneity in marine identity and literacy.
  • Inca and Sant Llorenç des Cardessar represent a third group, characterized by inland-informed but emotionally disconnected profiles. In both cases, Cluster 1 is nearly absent, while Clusters 2 (Informed but Emotionally Disconnected), 3 (Curious Distant Observers), and 4 dominate. Students in these areas may access information about the sea and demonstrate some cognitive understanding especially global and local OL, but lack direct experiences, emotional resonance, or regular interaction with marine environments. These patterns reflect a geographic and symbolic distance from the sea, where knowledge exists in the absence of personal or cultural connection.

4. Discussion

4.1. Symbolic Detachment in Geographically Coastal Areas

The Coastality-Gap Index revealed that 14 of the 29 population centres analysed, nearly half, were perceived as inland by students, despite being geographically classified as coastal. This suggests a form of symbolic detachment from the ocean that conventional spatial definitions, such as the EU’s 20-kilometre coastal belt, may not fully reflect. Such inland-oriented perceptions were particularly evident in towns like Sa Pobla, Manacor, and Artà, where the sea is geographically near but appears emotionally and cognitively distant in the minds of local youth.
This perceptual dissonance supports Tuan’s distinction between space and place, wherein a location becomes meaningful, transformed into place, through lived experience, familiarity, and emotional connection.

4.2. Youth Profiles Show Diverse Relationships with the Sea

The five perceptual profiles identified through cluster analysis reflect a broad spectrum of youth–sea relationships that go beyond physical proximity. Some students (Cluster 1) show strong marine identity, emotional attachment, and regular sea engagement. Others (Cluster 2) demonstrate cognitive awareness but emotional distance, while students in Cluster 4 are disengaged on all levels. Notably, Cluster 5 includes students living near the sea but with limited participation and symbolic disconnection, showing that geography alone is not a predictor of coastal identity.
These findings align with research suggesting that place identity involves an interplay of cognitive, affective, and experiential dimensions [58]. They also echo Salazar et al. (2025), who argue that youth participation in marine activities does not automatically lead to stronger emotional connection or ecological commitment. Without contextual understanding or reflective engagement, such experiences may remain superficial, limiting their impact on identity formation. This complexity reinforces the need to interpret marine identity as a layered construct shaped not just by behaviour, but by emotion, meaning, and local context.

4.3. Territorial Patterns and Local Contrasts

The spatial distribution of perceptual profiles reveals clear territorial patterns. While coastal municipalities like Pollença and Artà display a mix of engaged (Cluster 1) and passive (Cluster 5) students, others such as Inca and Sant Llorenç show a predominance of disconnected or uninvolved profiles (Clusters 3 and 4). These contrasts suggest that coastality is not merely a function of physical location but emerges through layered socio-spatial dynamics.
This aligns with Lefebvre’s theory of the production of space, where symbolic and lived experiences shape how space is perceived and inhabited[59]. The Coastality-Gap Index complements this perspective by offering a spatially explicit tool to detect mismatches between geographic and symbolic coastality, highlighting areas where intervention may be most needed.

4.4. Implications for Educational Strategies

These findings call for educational approaches that go beyond simple proximity to the sea. Towns identified by the Coastality-Gap Index as symbolically inland, despite being physically coastal, may require targeted strategies to re-establish emotional and experiential ties with the marine environment. Research in environmental education emphasizes the importance of embodied, place-based experiences in fostering environmental identity and stewardship [60]
The cluster typology can help educators adapt content and methods. For example, emotionally disconnected students (Cluster 2) may benefit from reflective storytelling or cultural-historical explorations of the ocean while students with low experiential exposure (Cluster 4) may require direct, sensory engagement to build familiarity and comfort.

5. Conclusions

This study introduces perceived coastality as a construct that captures how young people relate emotionally, cognitively, and experientially to the ocean, regardless of physical distance. Through survey data from 645 students across 11 schools in Mallorca, we identified five distinct perceptual profiles that reflect diverse combinations of coastal identity, marine knowledge, and symbolic attachment.
The Coastality-Gap Index allowed for the detection of inland-oriented perceptions in physically coastal municipalities, revealing that nearly half of the 29 population centres studied exhibited symbolic detachment from the sea. These findings highlight a disconnect between geographical definitions and lived coastal identity, challenging fixed spatial boundaries such as the EU’s 20-km coastal belt.
Together, the cluster typology and the Coastality-Gap Index offer a transferable framework for analysing youth–ocean relationships and for designing more context-sensitive OL strategies. They allow educators and policymakers to tailor interventions not only based on where students live, but on how they feel, think, and engage with the marine environment.
Future research could examine how the immediate physical environment around schools, such as landscape features, coastal access, infrastructure, and visibility of the sea, influences students’ engagement with Blue Education. Buffer zone analysis using GIS could reveal whether certain environmental factors (e.g., proximity to ports, touristic zones, or degraded coastal areas) correlate with lower marine identity or participation in OL activities. This spatially explicit approach would allow researchers and educators to better understand the contextual barriers or enablers that shape Blue Education outcomes, and to design more place-responsive strategies for inland and coastal communities alike.

Author Contributions

Conceptualization, Christian Esteva-Burgos; methodology, Christian Esteva-Burgos, Maurici Ruiz Pérez, Begoña Vendrell-Simón, Janire Salazar, and Josep Maria Gili; software, Christian Esteva-Burgos; validation, Christian Esteva-Burgos and Maurici Ruiz Pérez; formal analysis, Christian Esteva-Burgos; investigation, Christian Esteva-Burgos; resources, Maurici Ruiz Pérez and Josep Maria Gili; data curation, Christian Esteva-Burgos, Maurici Ruiz Pérez, Begoña Vendrell-Simón, Janire Salazar, and Josep Maria Gili; writing—original draft preparation, Christian Esteva-Burgos; writing—review and editing, Maurici Ruiz Pérez, Begoña Vendrell-Simón, Janire Salazar, and Josep Maria Gili; visualization, Christian Esteva-Burgos; supervision, Maurici Ruiz Pérez and Josep Maria Gili; project administration, Christian Esteva-Burgos.All authors have read and agreed to the published version of the manuscript.

Funding

This research received no external funding.The APC was funded by the authors.

Institutional Review Board Statement

Ethical review and approval were waived for this study in accordance with the Ethical Code for Educational Practice of the Educational Commission of the Government of the Balearic Islands[31], which regulates research activities in formal educational contexts. The study did not involve any medical or psychological intervention, experimental manipulation, or the collection of identifiable human data that would require review by an ethics committee. All procedures complied with the ethical standards of the institutional and national research committees and with the Declaration of Helsinki (revised 2013).

Informed Consent Statement

Informed consent for participation was obtained from the participating schools and teachers prior to data collection, following institutional educational research procedures. Student participation was voluntary, anonymous, and conducted within ordinary classroom activities. No personal, biometric, or sensitive information was gathered, and all data were analyzed in aggregate form.
According: to Regulation (EU) 2016/679 (GDPR), the Spanish Organic Law 3/2018 on Data Protection and Guarantee of Digital Rights (LOPDGDD), and the Balearic Educational Ethical Code, formal ethical committee approval was not required, as the research did not involve any processing of identifiable human data.

Data Availability Statement

The data presented in this study are available on request from the corresponding author. The data are not publicly available due to privacy and ethical restrictions.

Acknowledgments

The authors wish to thank the teachers and students who participated in the study, as well as the SharkMed team for their collaboration and support during the workshops. During the preparation of this manuscript, the authors used ChatGPT (OpenAI, GPT-5, 2025 version) to create the pictures to be shown to students during the workshops.

Conflicts of Interest

The authors declare no conflicts of interest.

Abbreviations

The following abbreviations are used in this manuscript:
OL Ocean Literacy
CGI Coastality-Gap Index
GIS Geographic Information System
EEZ Exclusive Economic Zone
UNCLOS United Nations Convention on the Law of the Sea
SDG(s) Sustainable Development Goal(s)
OLP Ocean Literacy Principles (si lo mencionas explícitamente)
FAO Food and Agriculture Organization
EU European Union
VET Vocational Education and Training
GDPR General Data Protection Regulation
LOPDGDD Ley Orgánica de Protección de Datos y Garantía de los Derechos Digitales
HE Higher Education

Appendix A

Appendix A shows the questionnaire that was designed by the team and distributed by teachers to students during class:
ASSESSMENT OF THE MARINE FORESTS AND SUBMARINE WORKSHOPS: STUDENT SURVEY
(Mark with an X, circle, or underline the chosen answer, or write in the space provided.)
PROFILE
  • Gender
☐ Female
☐ Male
☐ Non-binary
☐ Prefer not to say
2.
Municipality (town/city) where you live:
____________________________________________________________________________________
3.
Would you describe your area as...
☐ Coastal
☐ Inland
4.
What grade are you in?
☐ 5th Primary
☐ 6th Primary
☐ 1st ESO
☐ 2nd ESO
☐ 3rd ESO
☐ 4th ESO
☐ Other: ________________________________
5.
Which school do you attend? _________________________________
6.
Write the first three words that come to mind when you think of the sea:
7.
__________________________________________________________________
8.
__________________________________________________________________
9.
__________________________________________________________________
10.
Which image do you like the most? (see images on the table)
A ☐ B ☐ C ☐
11.
Which of the following towns in Mallorca would you choose to live in?
A ☐ B ☐ C ☐
12.
How would you rate your knowledge about the following?
(Mark with a cross: 1 = I know almost nothing, 5 = I know a lot)
  • The ocean: ☐1 ☐2 ☐3 ☐4 ☐5
  • Climate change: ☐1 ☐2 ☐3 ☐4 ☐5
  • Marine conservation: ☐1 ☐2 ☐3 ☐4 ☐5
  • Currents and winds: ☐1 ☐2 ☐3 ☐4 ☐5
  • Dune systems: ☐1 ☐2 ☐3 ☐4 ☐5
  • Ecosystem services: ☐1 ☐2 ☐3 ☐4 ☐5
  • Eutrophication: ☐1 ☐2 ☐3 ☐4 ☐5
  • Freshwater systems: ☐1 ☐2 ☐3 ☐4 ☐5
  • The Balearic Sea: ☐1 ☐2 ☐3 ☐4 ☐5
  • Marine biodiversity: ☐1 ☐2 ☐3 ☐4 ☐5
  • Marine pollution: ☐1 ☐2 ☐3 ☐4 ☐5
  • Blue carbon: ☐1 ☐2 ☐3 ☐4 ☐5
  • Carbon sinks: ☐1 ☐2 ☐3 ☐4 ☐5
  • One Health: ☐1 ☐2 ☐3 ☐4 ☐5
  • Blue economy: ☐1 ☐2 ☐3 ☐4 ☐5
  • Streams: ☐1 ☐2 ☐3 ☐4 ☐5
10. Do you know the following words?
☐ Llaüt
☐ Embat
☐ Albufera
☐ Mestre d’aixa
☐ Posidonia
☐ Rissaga
☐ Batel
☐ Llampuga
☐ Nacra
☐ Pagell
11. Read the following statements and indicate your level of agreement:
(1 = disagree, 2 = neutral, 3 = agree)
  • The Earth has a large ocean with varied characteristics. ☐1 ☐2 ☐3
  • The ocean and its life shape the Earth’s properties. ☐1 ☐2 ☐3
  • The ocean has a strong influence on weather and climate. ☐1 ☐2 ☐3
  • The ocean made Earth habitable. ☐1 ☐2 ☐3
  • The ocean supports high biodiversity and ecosystems. ☐1 ☐2 ☐3
  • The ocean and humanity are inextricably connected. ☐1 ☐2 ☐3
  • The ocean remains largely unexplored. ☐1 ☐2 ☐3
  • Protecting the ocean requires studying and understanding it. ☐1 ☐2 ☐3
  • The sea influences my life. ☐1 ☐2 ☐3
  • My daily actions affect the sea, even if I live inland. ☐1 ☐2 ☐3
  • If everyone made small changes to help the ocean/environment, it would have global effects. ☐1 ☐2 ☐3
  • I miss the sea when I haven’t been there for a long time. ☐1 ☐2 ☐3
  • There is a special place for me on the coast or at sea. ☐1 ☐2 ☐3
  • I enjoy going to coastal areas / the sea. ☐1 ☐2 ☐3
  • In general, people do not know enough about marine ecosystems in Mallorca. ☐1 ☐2 ☐3
What do you usually feel when you go to the sea? (Select up to 5)☐ Worry
☐ Wonder
☐ Curiosity
☐ Calm / Relaxation
☐ Happiness
☐ Joy
☐ Shame
☐ Anger
☐ Anxiety
☐ Motivation
☐ Guilt
☐ Fear
☐ Enthusiasm
☐ Surprise
☐ Fulfillment
☐ Boredom
☐ Sadness
☐ Insecurity
☐ Confidence
☐ Confusion
☐ Loneliness
☐ Indifference
☐ Inspiration
☐ Connection with nature
☐ Connection with myself
☐ Other: ___________________
How often do you visit the sea or coastal areas in Mallorca?☐ Every day
☐ Once a week
☐ Every 15 days
☐ Once a month
☐ During holidays (especially summer)
☐ Weekends in general
☐ Weekends and holidays
☐ Almost never
☐ Never
12. Can you name at least five marine species you can see on the coasts of Mallorca?
(Avoid generic names like “fish”; if unsure, give as much detail as possible.)
13.
__________ 2. __________ 3. __________ 4. __________ 5. __________
14.
If you need to look up information about the sea, which source would you prefer?
☐ Books and magazines
☐ Internet search
☐ Social media
☐ Documentaries and films
☐ Personal experience
☐ Ask experts
☐ Ask family or teachers
☐ Talks and workshops
☐ Other: _____________________________
Do you usually talk about the sea with other people? If yes, with whom?
☐ Family
☐ Friends
☐ Teachers
☐ Neighbors
☐ I don’t usually talk about the sea
☐ I post on social media
☐ Other: _____________________________
15.
Do you practice any sea-related sport? If yes, which?
☐ Snorkeling
☐ Swimming
☐ Surf / Windsurf
☐ Paddleboarding
☐ Kayaking
☐ Rowing
☐ Sailing
☐ Scuba diving
☐ I do not practice sea sports
☐ Other: _____________________________What other activities do you usually do at the sea / beach? (e.g., photography, family picnic, etc.)
____________________________________________________________________________________
____________________________________________________________________________________
QUESTIONS ABOUT THE MARINE FORESTS WORKSHOP
Rate the following aspects of the workshop from 1 to 5 (1 = disliked it a lot; 5 = loved it):
  • Duration: ☐1 ☐2 ☐3 ☐4 ☐5
  • Materials used: ☐1 ☐2 ☐3 ☐4 ☐5
  • Explanations: ☐1 ☐2 ☐3 ☐4 ☐5
  • Interesting: ☐1 ☐2 ☐3 ☐4 ☐5
  • Surprising: ☐1 ☐2 ☐3 ☐4 ☐5
  • Boring: ☐1 ☐2 ☐3 ☐4 ☐5
  • Repetitive: ☐1 ☐2 ☐3 ☐4 ☐5
  • Useful for learning new things: ☐1 ☐2 ☐3 ☐4 ☐5
  • Would recommend it: ☐1 ☐2 ☐3 ☐4 ☐5
What is one thing you learned?
____________________________________________________________________________________
What did you like most?
____________________________________________________________________________________
What would you improve?
____________________________________________________________________________________
Before the workshop, did you know that... ? (Please answer honestly.)
  • There are forests in the sea. ☐ Yes ☐ No
  • There are many similarities between marine and terrestrial forests. ☐ Yes ☐ No
  • Most marine forests are composed of animals. ☐ Yes ☐ No
  • There is so much life in underwater darkness. ☐ Yes ☐ No
  • Corals and gorgonians are animals. ☐ Yes ☐ No
  • Posidonia is a plant, not an algae. ☐ Yes ☐ No
  • Marine forests act as nurseries for commercially valuable species. ☐ Yes ☐ No
  • Some animals live attached to the seafloor. ☐ Yes ☐ No
If you have any questions or comments after the workshop, write them here:
____________________________________________________________________________________
____________________________________________________________________________________
QUESTIONS ABOUT THE SUBMARINE WORKSHOP
Rate the following aspects of the workshop from 1 to 5 (1 = disliked it a lot; 5 = loved it):
  • Duration: ☐1 ☐2 ☐3 ☐4 ☐5
  • Materials used: ☐1 ☐2 ☐3 ☐4 ☐5
  • Explanations: ☐1 ☐2 ☐3 ☐4 ☐5
  • Interesting: ☐1 ☐2 ☐3 ☐4 ☐5
  • Surprising: ☐1 ☐2 ☐3 ☐4 ☐5
  • Boring: ☐1 ☐2 ☐3 ☐4 ☐5
  • Repetitive: ☐1 ☐2 ☐3 ☐4 ☐5
  • Useful for learning new things: ☐1 ☐2 ☐3 ☐4 ☐5
  • Would recommend it: ☐1 ☐2 ☐3 ☐4 ☐5
What is one thing you learned?
____________________________________________________________________________________
What did you like most?
____________________________________________________________________________________
What would you improve?
____________________________________________________________________________________
Before the workshop, did you know that... ? (Please answer honestly.)
  • Thanks to technological advances, there are now less harmful ways to study the ocean. ☐ Yes ☐ No
  • There are special robots for exploring the sea. ☐ Yes ☐ No
  • Seawater contains microscopic life that appears as “marine snow.” ☐ Yes ☐ No
  • Teamwork is essential to study the sea well. ☐ Yes ☐ No
  • There is high biodiversity in the Balearic Sea. ☐ Yes ☐ No
  • Some algae look like rocks (grapissar). ☐ Yes ☐ No
  • Did you know about trawling? ☐ Yes ☐ No
  • Marine forests are seriously threatened by trawling. ☐ Yes ☐ No
After completing these workshops, do you think...
  • When you return to the water, will you notice more than before? ☐ Yes, a lot ☐ Yes, a little ☐ No
  • Will you see the sea differently? ☐ Yes, a lot ☐ Yes, a little ☐ No
  • Do you want to learn more about the sea? ☐ Yes, a lot ☐ Yes, a little ☐ No
  • Would you like to tell others about the sea? ☐ Yes, a lot ☐ Yes, a little ☐ No
  • Did it help you learn about the sea? ☐ Yes, a lot ☐ Yes, a little ☐ No
If you have any questions or additional comments after the workshops, write here:
Many thanks!!

References

  1. J. Kiousopoulos, “Exploring Littoral Space by means of ‘Coastality,’” MarineScor Journal, http://www.marinescor-revue.org, vol. 1, pp. 30–39, Jan. 2014.
  2. C. Nuttall, “Backs to the sea? Least-cost paths and coastality in the Southern Early Bronze Age IIA Aegean.,” 2021, pp. 116–129.
  3. Food and Agriculture Organization, “Integrated Coastal Area Management and Agriculture, Forestry and Fisheries,” https://www.fao.org/4/a0266e/a0266e07.htm.
  4. E. and R. United States Commission on Marine Science, “Our Nation and the Sea A Plan for National Action,” 1969. Accessed: Oct. 22, 2025. [Online]. Available: https://www.coastalstates.org/wp-content/uploads/2018/05/Stratton-Comm-Report.pdf.
  5. Eurostat, “Coastal Area,” https://ec.europa.eu/eurostat/statistics-explained/index.php?title=Glossary:Coastal_area.
  6. Copernicus Land Monitoring Service, “Coastal Zones,” https://land.copernicus.eu/en/products/coastal-zones?tab=technical_summary.
  7. EU4Ocean Coalition, “EU Blue Schools Application Guidelines,” https://maritime-forum.ec.europa.eu/form/become-european-blue-school_en.
  8. Proshansky, H.M. The City and Self-Identity. Environ. Behav. 1978, 10, 147–169. [Google Scholar] [CrossRef]
  9. PBuchan, P.M.; Glithero, L.D.; McKinley, E.; Strand, M.; Champion, G.; Kochalski, S.; Velentza, K.; Praptiwi, R.A.; Jung, J.; Márquez, M.C.; et al. A transdisciplinary co-conceptualisation of marine identity. People Nat. 2024, 6, 2300–2324. [Google Scholar] [CrossRef]
  10. Y. F. Tuan, “Space and Place The Perspective of Experience,” 1977. Accessed: Oct. 22, 2025. [Online]. Available: https://www.academia.edu/19846369/Yi_Fu_Tuan_Space_and_Place. 1984.
  11. Jones, R. Political geography I: Blue geopolitics. Prog. Hum. Geogr. 2024, 48, 669–676. [Google Scholar] [CrossRef]
  12. Oishi, S.; Talhelm, T.; Lee, M. Personality and geography: Introverts prefer mountains. J. Res. Pers. 2015, 58, 55–68. [Google Scholar] [CrossRef]
  13. Terradas i Saborit, “LA CONTRADICCIÓN ENTRE IDENTIDAD VIVIDA E IDENTIFICACI~N JURÍDICO-POLITICA Ignasi Terradas Saborit,” 2004, Accessed: Oct. 22, 2025. [Online]. Available: https://raco.cat/index.php/QuadernsICA/article/view/95585/165160.
  14. Gómez, S.; Garriga, A.; Bosch, M.T.; Bosch, M.; Villasante, S.; Salazar, J. Ocean literacy in managing marine protected areas: bridging natural and cultural heritage. Front. Mar. Sci. 2025, 12, 1540163. [Google Scholar] [CrossRef]
  15. Institut Cartogràfic i Geogràfic de les Illes Balears, “Litoral de les Illes Balears,” https://ideib.caib.es/.
  16. Govern de les Illes Balears, “Anuari estadístic de les Illes Balears 2023 – Territori i Medi Ambient,” 2023. Accessed: Oct. 22, 2025. [Online]. Available: https://www.caib.es/sites/estadistiques/ca/anuari_territori_i_medi_ambient-21282/.
  17. Agència d’Estratègia Turística de les Illes Balears, “Lloret de Vistalegre,” https://www.illesbalears.travel/es/mallorca/municipios/lloret-de-vistalegre.
  18. United Nations, “United Nations Convention on the Law of the Sea,” 1982. Accessed: Oct. 22, 2025. [Online]. Available: https://www.un.org/depts/los/convention_agreements/texts/unclos/unclos_e.pdf.
  19. Govern de les Illes Balears, “LLEI 6/2013, DE 7 DE NOVEMBRE, DE PESCA MARÍTIMA, MARISQUEIG I AQÜICULTURA A LES ILLES BALEARS 1,” 2013.
  20. M. Goffriller, THE CASTRAL TERRITORY OF THE BALEARIC ISLANDS: THE EVOLUTION OF TERRITORIAL CONTROL IN MALLORCA DURING THE MIDDLE AGES. 2008.
  21. M. Goffriller, “The Castles of Mallorca: A diachronic perspective of the dynamics of territorial control on an Islamic island,” 2011.
  22. Armas-Díaz, A.; Murray, I.; Sabaté-Bel, F.; Blázquez-Salom, M. Environmental struggles and insularity: The right to nature in Mallorca and Tenerife. Environ. Plan. C: Politi- Space 2023, 42, 639–657. [Google Scholar] [CrossRef]
  23. Trias, M.C.; Molina, D.J.; Santacreu, D.A.; Rosselló, J.G. Enhancing “Places” Through Archaeological Heritage in Sun, Sand, and Sea Touristic Coastal Areas: A Case Study From Mallorca (Spain). J. Isl. Coast. Archaeol. 2014, 9, 341–363. [Google Scholar] [CrossRef]
  24. Picornell, M. Insular identity and urban contexts: representations of the local in the construction of an image of Palma (Mallorca, Balearic Islands). Isl. Stud. J. 2014, 9, 223–238. [Google Scholar] [CrossRef]
  25. Sebastián, J.B.; Garau, A.O. Alfabetización en Geografía y mapas mentales. Los conocimientos mínimos entre los estudiantes universitarios de Educación Primaria. Cuad. Geogr. 2018, 57, 330–351. [Google Scholar] [CrossRef]
  26. Sebastián, J.B.; Garau, A.O.; Pérez, M.R. Assessing geography knowledge in primary education with mental map analysis: a Balearic Islands case study. Educ. Stud. 2021, 50, 1–22. [Google Scholar] [CrossRef]
  27. Instituto Nacional de Estadística, “Cifras oficiales de población de los municipios españoles: Revisión del Padrón Municipal a 1 de enero de 2024,” https://www.ine.es/jaxiT3/Tabla.htm?L=0&t=2860.
  28. Can Picafort, “CA’N PICAFORT Revista Mensual-idfcló de 1.300 exemplars-Agost de 1991-Num. W7.Pieu: iOOptes,” 1991.
  29. European Commission, “Become a European Blue School,” https://maritime-forum.ec.europa.eu/theme/ocean-literacy-and-blue-skills/ocean-literacy/network-european-blue-schools/become-european-blue-school_en.
  30. EU4Ocean Coalition - European Commission, “Som Escoles Blaves – A Beacon for Ocean Literacy in the Balearic Islands,” https://maritime-forum.ec.europa.eu/som-escoles-blaves-beacon-ocean-literacy-balearic-islands_en.
  31. P. Sánchez-Cuenca, “Conducta Ètica / Bloc A BLOC A CONDUCTA ÈTICA CONTINGUTS 1.1. Imparcialitat 1.2. Integritat 1.3. Discreció 2. Conducta ètica relacional Autoria i llicència Autoria: Pilar Sánchez-Cuenca López Data d’elaboració: 2016 Aquesta obra es difon mitjançant la llicència Creative Commons Reconocimiento-NoComercial-CompartirIgual 4.0 Internacional License,” Maig, 2016.
  32. European Union, “I (Legislative acts) REGULATIONS REGULATION (EU) 2016/679 OF THE EUROPEAN PARLIAMENT AND OF THE COUNCIL of on the protection of natural persons with regard to the processing of personal data and on the free movement of such data, and repealing Directive 95/46/EC (General Data Protection Regulation) (Text with EEA relevance),” 2016. 27 April.
  33. BOE, “Ley Orgánica 3/2018, de 5 de diciembre, de Protección de Datos Personales y garantía de los derechos digitales.,” 2018.
  34. McKinley, E.; Burdon, D.; Shellock, R. The evolution of ocean literacy: A new framework for the United Nations Ocean Decade and beyond. Mar. Pollut. Bull. 2022, 186, 114467. [Google Scholar] [CrossRef] [PubMed]
  35. F. Cava, “Science Content and Standards for Ocean Literacy: A Report on Ocean Literacy,” 2005.
  36. S. Schoedinger, F. S. Schoedinger, F. Cava, C. Strang, and P. Tuddenham, “Ocean literacy through science standards,” in Proceedings of MTS/IEEE OCEANS, 2005, IEEE Computer Society, 2005, pp. 736–740. [CrossRef]
  37. United Nations, “Transforming Our World: The 2030 Agenda for Sustainable Development (A/RES/70/1),,” https://sdgs.un.org/2030agenda.
  38. United Nations, “United Nations Decade of Ocean Science for Sustainable Development 2021–2030 (A/RES/72/73),” https://www.unesco.org/en/decades/ocean-decade.
  39. United Nations, “United Nations Decade of Ocean Science for Sustainable Development Implementation Plan,” 2021. [Online]. Available: http://creativecommons.
  40. Fauville, G.; Strang, C.; Cannady, M.A.; Chen, Y.-F. Development of the International Ocean Literacy Survey: measuring knowledge across the world. Environ. Educ. Res. 2018, 25, 238–263. [Google Scholar] [CrossRef]
  41. Markos, A.; Boubonari, T.; Mogias, A.; Kevrekidis, T. Measuring ocean literacy in pre-service teachers: psychometric properties of the Greek version of the Survey of Ocean Literacy and Experience (SOLE). Environ. Educ. Res. 2015, 23, 231–251. [Google Scholar] [CrossRef]
  42. Paredes-Coral, E.; Deprez, T.; Mokos, M.; Vanreusel, A.; Roose, H. The Blue Survey: Validation of an instrument to measure ocean literacy among adults. Mediterr. Mar. Sci. 2021, 23, 321–326. [Google Scholar] [CrossRef]
  43. Spoors, F.; Leakey, C.D.B.; James, M.A. Piloting a Regional Scale Ocean Literacy Survey in Fife. Front. Mar. Sci. 2022, 9. [Google Scholar] [CrossRef]
  44. Deaprtment for environment Food & Rural affairs, “Ocean Literacy Headline Report,” 2022. [Online]. Available: www.gov.uk/defra.
  45. S. Macneil, “Canadian Journal of Environmental Education,” Yumagulova, 2019. [Online]. Available: http://www.colcoalition.ca.
  46. Ortanderl, F.; Bausch, T. Wish you were here? Tourists’ perceptions of nature-based destination photographs. J. Destin. Mark. Manag. 2023, 29. [Google Scholar] [CrossRef]
  47. J. Salazar, C. J. Salazar, C. Dominguez-Carrió, J.-M. Gili, S. Ambroso, J. Grinyó, and B. Vendrell-Simón, “Building a New Ocean Literacy Approach Based on a Simulated Dive in a Submarine: A Multisensory Workshop to Bring the Deep Sea Closer to People,” Front Mar Sci, vol. 6, Sep. 2019. [Google Scholar] [CrossRef]
  48. Nuttall, C. A GIS Analysis of Coastal Proximity with a Prehistoric Greek Case Study. J. Comput. Appl. Archaeol. 2024, 7, 170–184. [Google Scholar] [CrossRef]
  49. D. Bartlett and J. L. Smith, GIS for coastal zone management. 2004.
  50. Environmental Systems Research Institute, “Esri, ArcGIS Pro, version 3.4,” https://www.esri.com/en-us/arcgis/products/arcgis-pro/overview.
  51. Microsoft Corporation, “Microsoft Power BI,” https://powerbi.microsoft.com/.
  52. Swami, V.; White, M.P.; Voracek, M.; Tran, U.S.; Aavik, T.; Ranjbar, H.A.; Adebayo, S.O.; Afhami, R.; Ahmed, O.; Aimé, A.; et al. Exposure and connectedness to natural environments: An examination of the measurement invariance of the Nature Exposure Scale (NES) and Connectedness to Nature Scale (CNS) across 65 nations, 40 languages, gender identities, and age groups. J. Environ. Psychol. 2024, 99. [Google Scholar] [CrossRef]
  53. Geiger, S.J.; White, M.P.; Davison, S.M.C.; Zhang, L.; McMeel, O.; Kellett, P.; Fleming, L.E. Coastal proximity and visits are associated with better health but may not buffer health inequalities. Commun. Earth Environ. 2023, 4, 1–9. [Google Scholar] [CrossRef]
  54. Kals, E.; Schumacher, D.; Montada, L. Emotional Affinity toward Nature as a Motivational Basis to Protect Nature. Environ. Behav. 1999, 31, 178–202. [Google Scholar] [CrossRef]
  55. Mayer, F.S.; Frantz, C.M. The connectedness to nature scale: A measure of individuals’ feeling in community with nature. J. Environ. Psychol. 2004, 24, 503–515. [Google Scholar] [CrossRef]
  56. Tam, K.-P. Dispositional empathy with nature. J. Environ. Psychol. 2013, 35, 92–104. [Google Scholar] [CrossRef]
  57. E. Umargono, J. E. E. Umargono, J. E. Suseno, and S. K. Vincensius Gunawan, “K-Means Clustering Optimization Using the Elbow Method and Early Centroid Determination Based on Mean and Median Formula,” in Proceedings of the 2nd International Seminar on Science and Technology (ISSTEC 2019), Paris, France: Atlantis Press, 2020. [CrossRef]
  58. Scannell, L.; Gifford, R. Defining place attachment: A tripartite organizing framework. J. Environ. Psychol. 2010, 30, 1–10. [Google Scholar] [CrossRef]
  59. Henri. Lefebvre and Donald. Nicholson-Smith, The production of space. Blackwell Publishing, 1991.
  60. Yemini, M.; Engel, L.; Ben Simon, A. Place-based education – a systematic review of literature. Educ. Rev. 2023, 77, 640–660. [Google Scholar] [CrossRef]
Figure 1. Conceptual definitions of coastal zones across international and regional frameworks. The map includes population centres and municipal boundaries of Mallorca to contextualize these spatial classifications within an island setting. Source: FAO (1998); US Commission on Marine Science, Engineering and Resources (1969); Eurostat (1999); Copernicus Land Monitoring Service (2012); Copernicus Marine Service (2012); EU Blue Schools Programme (2022); INE (2025). Developed by the authors.
Preprints 182198 g001
Figure 2. Methodological Framework of the Study: Integrating Spatial and Perceptual Analyses of Youth Coastality in Mallorca.
Preprints 182198 g002
Figure 3. Physical map of Mallorca showing the selected municipalities for the workshops, main population centres, and their respective distances from the coast (in kilometres).
Preprints 182198 g003
Figure 11. Student profiles distribution in 8 towns. In blue Cluster 1, in red cluster 2, in green cluster 3, in yellow cluster 4, in purple cluster 5.
Preprints 182198 g011
Table 4. Island Gap Index Results.
Population centre Inland gap index Population centre Inland gap index
Son macià 0,717 Muro 0,167
Sa pobla 0,667 Sant llorenç des cardassar 0,159
Son carrió 0,639 Colònia de sant pere 0,105
Caimari 0,554 Cala rajada 0,089
Mancor de la vall 0,497 Portocolom 0
Selva 0,483 Cala mesquida 0
Manacor 0,411 Canyamel platja 0
Lloseta 0,383 Can picafort 0
Artà 0,338 Porto cristo 0
Inca 0,295 Port d'alcúdia / alcanada 0
Capdepera 0,267 Port de pollença 0
Son servera 0,260 Sa coma -0,010
Cala millor 0,25 S'illot -0,010
Vilafranca de bonany 0,215255439 Alcúdia -0,014
Pollença -0,071
Disclaimer/Publisher’s Note: The statements, opinions and data contained in all publications are solely those of the individual author(s) and contributor(s) and not of MDPI and/or the editor(s). MDPI and/or the editor(s) disclaim responsibility for any injury to people or property resulting from any ideas, methods, instructions or products referred to in the content.
Copyright: This open access article is published under a Creative Commons CC BY 4.0 license, which permit the free download, distribution, and reuse, provided that the author and preprint are cited in any reuse.
Prerpints.org logo

Preprints.org is a free preprint server supported by MDPI in Basel, Switzerland.

Subscribe

Disclaimer

Terms of Use

Privacy Policy

Privacy Settings

© 2025 MDPI (Basel, Switzerland) unless otherwise stated