
Submitted:
19 November 2025
Posted:
19 November 2025
You are already at the latest version
Abstract
This paper presents the design and implementation of a 12kW@2K supercritical helium cryogenic control system for the Shanghai Hard X-ray Free Electron Laser Facility (SHINE). The system provides a stable cryogenic environment for 56 standard 1.3 GHz superconducting modules, meeting the stringent temperature control requirements of the accelerator for high-precision operation of superconducting cavities. A distributed PLC architecture integrated with EPICS is adopted, comprising three refrigerators, four distribution valve boxes, and 39 module subsystems. Redundant network design ensures reliable data transmission. Core functionalities include a four-stage automated cooling process (from 300 K to 2 K), dynamic power compensation, and a safety interlock mechanism.Experiments show that the system can stabilize the liquid level of the helium tank within ±1% and maintain the pressure at 3100Pa ± 10Pa, effectively ensuring the smooth progress of low-level experiments. Dynamic power compensation adjusts heater power in real time based on a model correlating cavity pressure with heat load, ensuring stability during cryogenic operation. The system has been successfully applied in the commissioning of the injector section, validating its efficiency and safety in providing a cryogenic environment for superconducting accelerators, and serving as a key technical foundation for the SHINE project.
Keywords:
autonomous control
; cryogenic control
; PLC
; EPICS
; hard-X-ray free-electron laser
1. Introduction
The Shanghai Hard X-ray Free Electron Laser Facility (SHINE) is a high-repetition-rate hard X-ray free electron laser facility capable of producing X-ray pulses at a maximum repetition rate of 1 MHz. With a designed electron beam energy of 8 GeV, SHINE has extensive applications in physics, chemistry, materials science, life sciences, and other fields. The facility currently includes three undulator beamlines, with a total length of approximately 2 km from the injector to the end of the undulator. SHINE will utilize 400 superconducting cavities to provide energy for the electron beam, with a designed accelerating gradient of 20 MV/m and a quality factor of 2.7×10¹⁰ under continuous-wave operation. A total of 50 superconducting accelerating modules operating at 1.3 GHz are required, with two additional 3.9 GHz superconducting modules for bunch compression. These modules are connected in series to form four superconducting accelerator sections: L1, L2, L3, and L4. According to the latest design, L1 consists of 4 modules, L2 of 18 modules, L3 of 6 modules, and L4 of 24 modules. A schematic diagram of the SHINE device is shown in Figure 1. please refer to [1].
To meet the overall requirements of the accelerator, the SHINE 12 kW@2 K helium cryogenic system provides the necessary cryogenic environment for the superconducting linear accelerator. Two cryogenic plants are installed at both ends of the linear accelerator to address cooling, warm-up, rapid cooling, and operational needs under different circuit conditions. The SHINE cryogenic system includes a 12 kW@2 K refrigeration system, consisting of three helium refrigerators (4 kW@2 K each), four distribution valve boxes, 1.2 km of cryogenic transfer lines, a 64,000 m³ helium storage system, three purification and recovery systems, two liquid nitrogen systems, and supporting vacuum and control systems. The cryogenic plants provide three cooling capacities: 12 kW@2 K, 4.5 kW@4.5–8 K, and 45 kW@35–55 K,For 2K, a cold compressor needs to be used for extraction. These cooling capacities are generated by helium cryogenic refrigerators and delivered to the superconducting linear accelerator via the distribution and transfer system. The design indicators of a single cryogenic system are summarized in Table 1.
As the largest cryogenic superconductivity platform in China and even in Asia, based on the provision of sufficient cold sources by a large number of refrigeration-related equipment, the reliability and accuracy of its operation mainly rely on the low-temperature measurement and control system. Therefore, before the official project construction, a 1kW@2K low-temperature test platform was built for operation and maintenance, which was used to explore, evaluate and verify various key low-temperature measurement and control technologies. Through this process, the following main achievements were achieved:
- Precise and reliable measurement and control of various low-temperature-related sensors and actuators;
- The overall architecture of the measurement and control for the large low-temperature platform, such as communication, software and hardware, was determined;
- The core controllers and other components were determined through iterative evaluation. Compared with the 1kW@2K test platform, the 12kW@2K system has significantly improved in terms of volume, equipment distribution distance, liquid helium pressure, flow rate, automation of temperature rise and drop, and other core parameters. The following mainly conducts relevant research and discussions based on the current debugging and operation situation [2,3].
2. Design of SHINE Cryogenic Control System
2.1. Layout of Cryogenic System
The 12 kW@2 K cryogenic system is designed to meet the cooling requirements of superconducting cavity modules and superconducting undulators for the SHINE hard X-ray free electron laser facility. The system comprises refrigerators, distribution valve boxes, vacuum and liquid nitrogen subsystems, and module systems. Each subsystem has a dedicated control system to achieve its specific control objectives. The cryogenic control system includes three helium refrigerator control systems from Air Liquide, one VBx80000 injection valve box control system, one VBx81000 distribution valve box control system, one VBx82000 distribution valve box control system, one VBx83000 distribution valve box control system, two vacuum and liquid nitrogen control systems, and 69 cryogenic module control systems. These 46 PLC-based control subsystems are distributed across two shafts (referred to as Shaft 1 and Shaft 2) and the tunnel. The equipment layout is illustrated in Figure 2.
Considering the characteristics of low-temperature equipment and the independent control requirements of each subsystem, each subsystem in the equipment control layer is equipped with a set of PLC control system. The PLC programs and human-machine interface (HMI) are developed using the latest TIA Portal Unified. Unified is a modernized automation development platform that integrates PLC programming, HMI design, and network configuration. It has advantages such as efficiency, integration, standardization, and intelligence, making it suitable for the development of complex industrial automation systems in low-temperature factories. The specific implementation is as follows: The functions of each subsystem in the equipment control layer are independently connected through Ethernet and Profinet. The upper layer uses TIA Portal Unified to develop the WEB control interface for each subsystem to achieve the required human-machine interaction, debugging, and operation in the cryogenic factory. At the same time, it has a set of EPICS system to provide human-machine interface and other functions for the modules. The list of all subsystems is shown in Table 2:
2.2. Network Architecture of Cryogenic Control System
The overall control architecture diagram of the 12kW@2K low-temperature control system is shown in Figure 3. It is necessary to achieve the requirements of rapidity, stability and accuracy for data acquisition and control. Since the low-temperature debugging process is a slow process with low real-time requirements, the network design adopts a combination of mature and reliable commercial networks and PLC real-time networks. At the same time, in the network architecture, the core switch and access switch are set with redundancy at key positions based on actual location and layout characteristics. This can not only improve reliability but also simplify the network architecture. The specific implementation of the network is as follows: The access switch connected to the core switch of Shaft 1 and Shaft 2 connects the OPI/WinCC, Monitor PC, Archive Server, Alarm Server, Gateway Server, and remote online control center Central Control System for upper-level control equipment, responsible for data interconnection and communication between Shaft 1 and Shaft 2 and remote data acquisition, control and alarm of all low-temperature related equipment in the control room; The outdoor liquid nitrogen and helium gas storage tank station connected to the access switch 1 of Shaft 1, 2 pure purification recovery PLCs, 2 vacuum stations and touch screens form a system; The liquid nitrogen vacuum PLC, helium refrigeration PLC, 3 valve box control PLC, 2 vacuum stations and corresponding equipment touch screens connected to the access switch 2 of Shaft 1; One set of modular control PLC connected to the tunnel access switch 3; Three sets of modular control PLC connected to the tunnel access switch 4; Nine sets of modular control PLC connected to the tunnel access switch 5; Three sets of modular control PLC connected to the tunnel access switch 6; Twelve sets of modular control PLC connected to the tunnel access switch 7; One set of liquid nitrogen vacuum control PLC and one set of helium refrigeration control PLC connected to the access switch 8 of Shaft 2, and one valve box control PLC; One vacuum from station PLC, one recovery purification control PLC, one outdoor liquid nitrogen and helium gas storage tank PLC and corresponding touch screens connected to the access switch 9 of Shaft 2 form a system. These PLCs are responsible for data acquisition, local control, display of local human-machine interface and remote control of various on-site low-temperature equipment in different areas including Shaft 1, Shaft 2, tunnel, and outdoor tank area. At the same time, each PLC is connected to a set of IOC controller to complete functions such as EPICS control, data acquisition, storage, historical data acquisition and curve graph acquisition.
12kW@2K Schematic diagram of the overall control architecture of the low temperature control system Including the core layer switch 1 of Shaft 1, the core layer switch 2 of Shaft 2, the access switch 1 of Shaft 1, the access switch 2 of Shaft 1, the access switches 3 to 7 in the tunnel, the access switch 8 of Shaft 2, the access switch 9 of Shaft 2, as Shaft as the access switches 10 and 11 connected to the control console host of Shaft 1 and Shaft 2 respectively; Among them, the two cores configured are 10-gigabit switches that can be iStack stacked through 10GB 10-gigabit ports. When either core has a circuit failure or a link failure, it will not affect the interconnection and intercommunication of the services in the two Shafts. They are respectively placed in the cabinets of Shaft 1/2 and can be connected to both UPS and mains power in a dual power configuration, which maximizes their safety and reliability. The access layer is responsible for data exchange within the same Shaft. The access layer system enhances the reliability at the device level through redundant backup among multiple member devices. Through the cross-device link aggregation function, the reliability of the link is improved. When any access switch fails, it does not affect the service intercommunication of devices under other switches within the same Shaft. Different Shafts are divided into virtual local area networks, and different areas are divided into multiple logically independent parts to improve the security of the network. The creation of vlans in different areas, port division and intercommunication between vlans are achieved through VLAN configuration. Meanwhile, the corresponding spanning tree protocol (STP/RSTP/MSTP) configuration is carried out according to the network topology and requirements, which can avoid loops in the network and ensure the normal transmission of data in the network. And configure the DHCP Snooping function on the switch. Correspondingly, configure the legitimate DHCP server ports as trust interfaces to filter out illegal DHCP servers. Later, if the devices within the network need to be monitored, remote monitoring and management of the switch can be achieved by configuring the Simple Network Management Protocol (SNMP). Meanwhile, by taking advantage of the SNMP v1/v2/v3 functions of the switch and the rich Management Information Base (MIB), it is convenient to integrate into the network management system for monitoring and troubleshooting. 12kW@2K Schematic diagram of the overall network architecture of the low temperature control system is shown in Figure 4. Including the core layer switch 1 of Shaft 1, the core layer switch 2 of Shaft 2, the access switch 1 of Shaft 1, the access switch 2 of Shaft 1, the access switches 3 to 7 in the tunnel, the access switch 8 of Shaft 2, the access switch 9 of Shaft 2, as Shaft as the access switches 10 and 11 connected to the control console host of Shaft 1 and Shaft 2 respectively; Among them, the two cores configured are 10-gigabit switches that can be iStack stacked through 10GB 10-gigabit ports. When either core has a circuit failure or a link failure, it will not affect the interconnection and intercommunication of the services in the two Shafts. They are respectively placed in the cabinets of Shaft 1/2 and can be connected to both UPS and mains power in a dual power configuration, which maximizes their safety and reliability. The access layer is responsible for data exchange within the same Shaft. The access layer system enhances the reliability at the device level through redundant backup among multiple member devices. Through the cross-device link aggregation function, the reliability of the link is improved. When any access switch fails, it does not affect the service intercommunication of devices under other switches within the same Shaft. Different Shafts are divided into virtual local area networks, and different areas are divided into multiple logically independent parts to improve the security of the network. The creation of vlans in different areas, port division and intercommunication between vlans are achieved through VLAN configuration.
2.3. Automatic Cooling Process
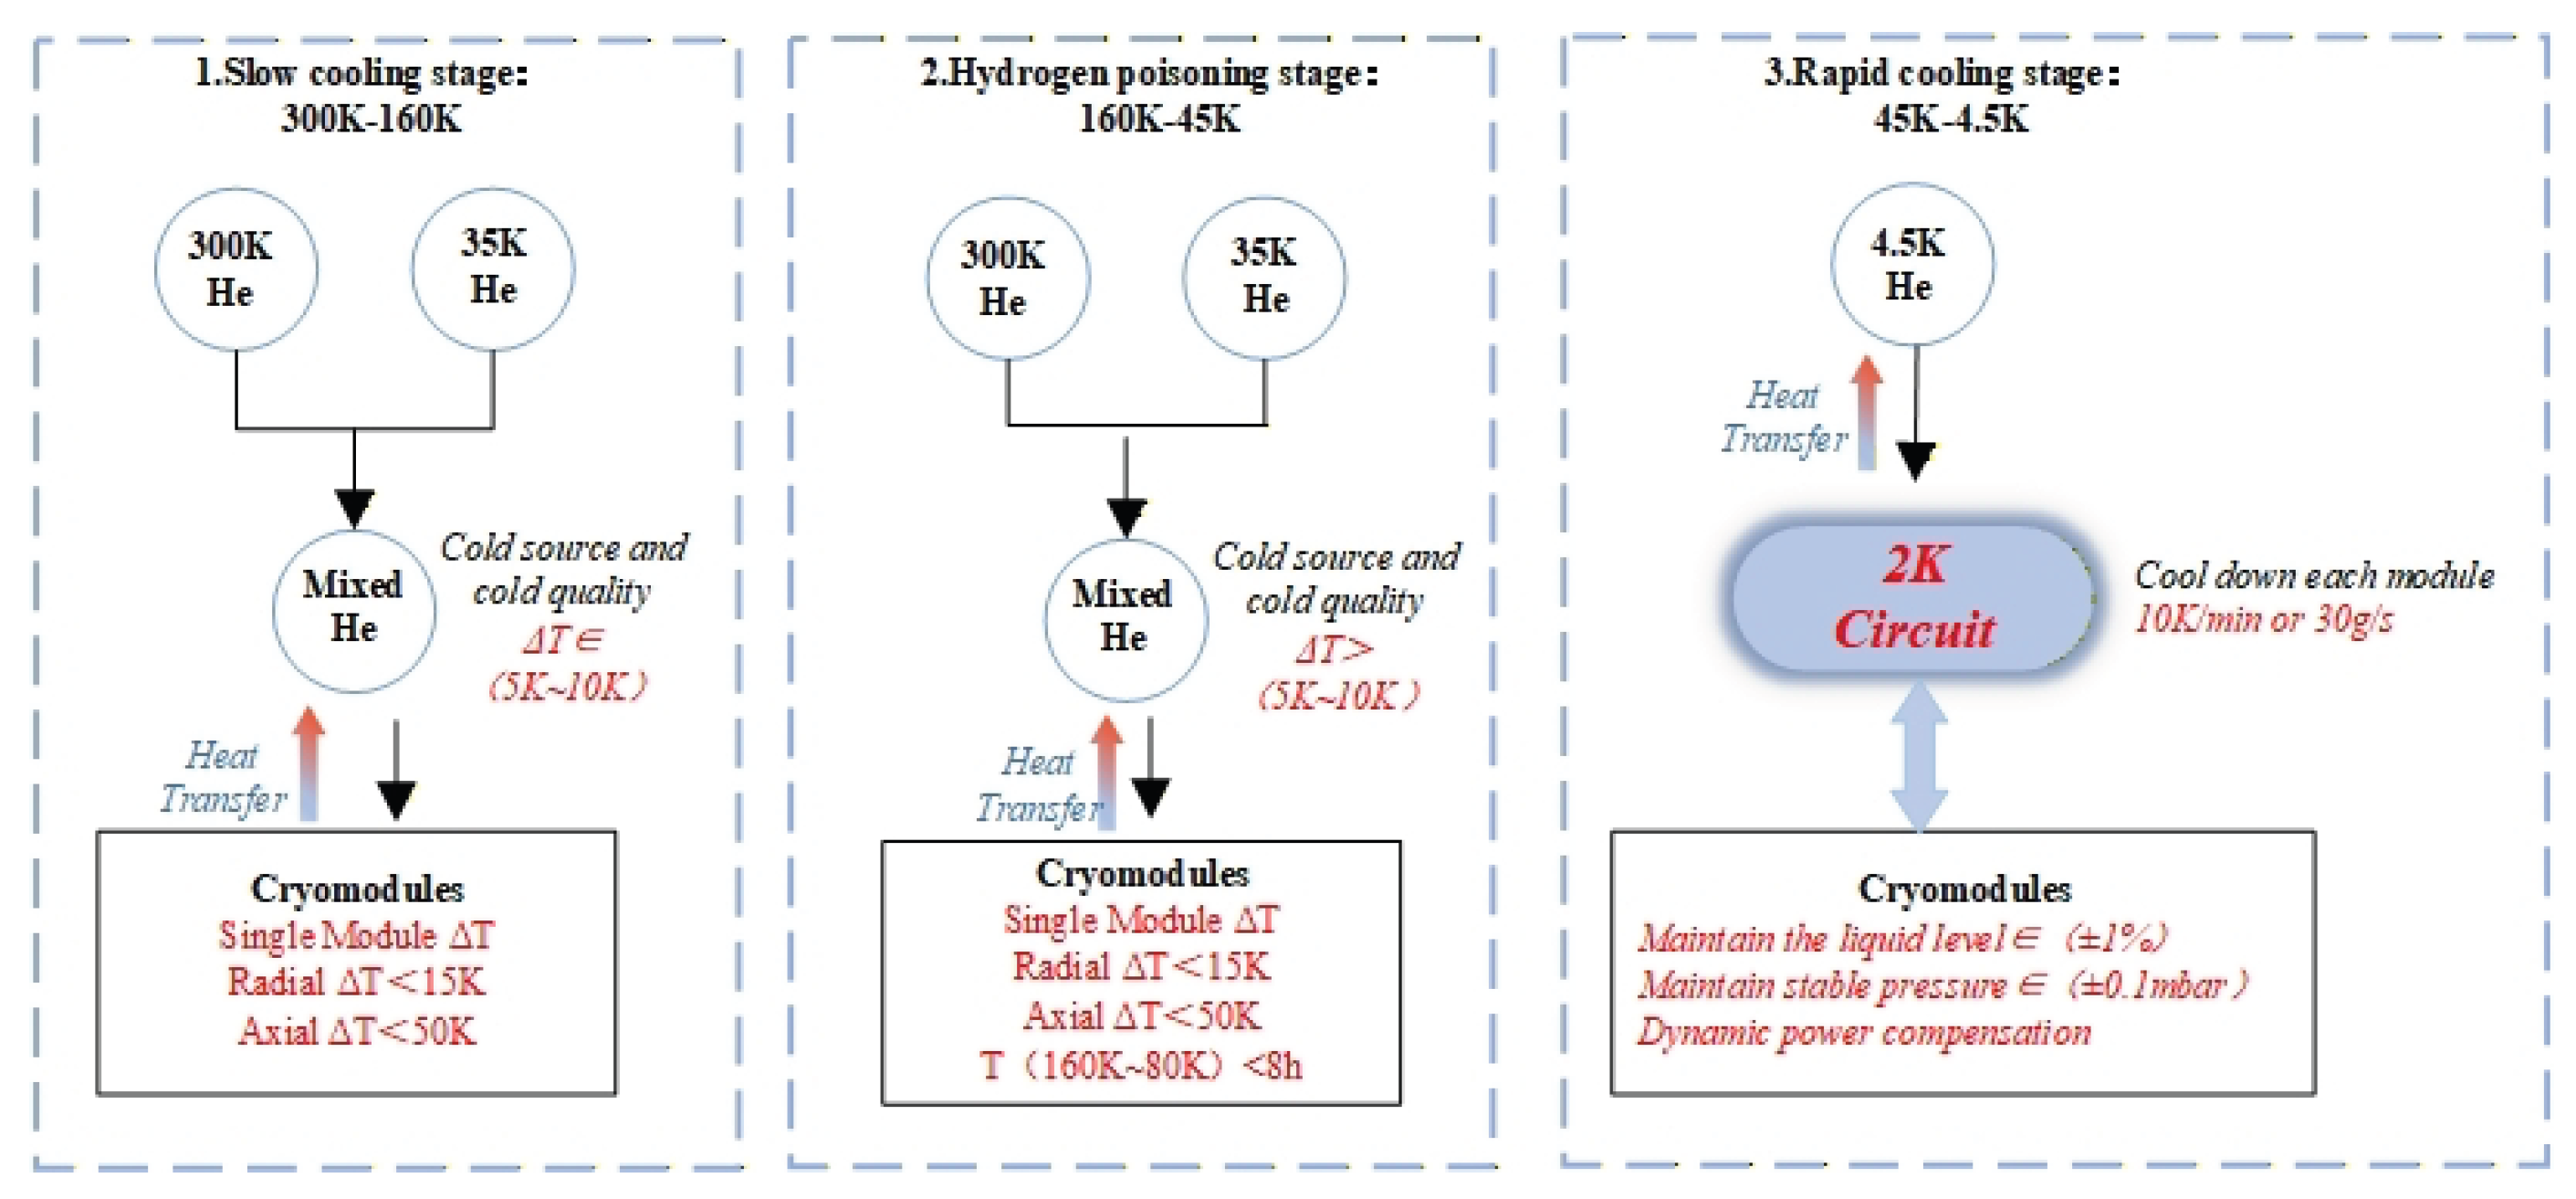
The cooling process for the superconducting modules is divided into four stages based on the accelerator’s requirements:
- Stage 1 (300 K–160 K): Conventional cooling using a mixture of 300 K and 35 K helium. Safety thresholds include a radial temperature difference K in Tank B and an axial temperature difference K in Tube B, with a vacuum level Pa and a thermal vacuum interlock at 10 Pa;
- Stage 2 (160 K–45 K): Hydrogen poisoning zone. The cooling rate is controlled at 10–20 K/h, preferably around 15 K/h, with a total duration h. During the hydrogen poisoning phase (150 K–70 K), the cooling duration is limited to 8 h, maintaining a radial temperature difference K and axial temperature difference K in Tube B;
- Stage 3 (45 K–4.5 K): Rapid cooling using 4.5 K helium. The cooling rate is controlled at 10 K/min or 30 g/s. After rapid cooling, each module is maintained at 1 g/s flow to stabilize at 4.5 K;
- Stage 4 (4.5 K–2 K): Pressure reduction cooling to achieve the 2 K superconducting state for experimental operation.
Figure 5.
Schematic diagram of cooling modes at each stage.
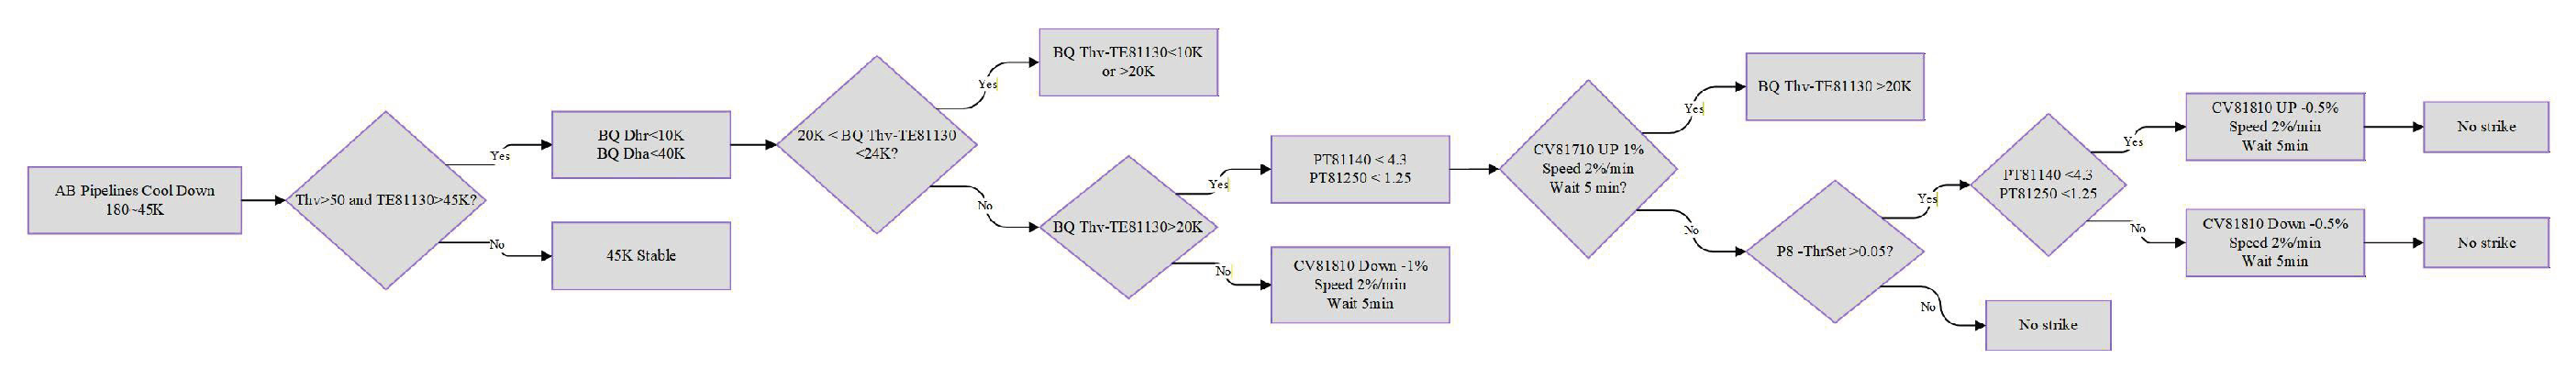
The SHINE cryogenic system successfully implements automatic cooling in all stages. For example, the AB line automatic cooling process from 160 K to 45 K in the injector section is described as follows. The injector section includes a single-cavity module and an eight-cavity module, supported by the first helium refrigerator (CP1), 2 K cold box (CB1), distribution valve box (DB1, VBx81000), and injection valve box (IB, VBx80000). The simplified flow diagram of the injector section is shown in Figure 6. Such as the superconducting cavity’s characteristic temperature (Thv, Tbr), radial and axial temperature differences (Tba), and the temperatures and pressures of the distribution valve box (TE81130, PT81140, PT81250) to control the mixing and uniformity of helium gas in the pipelines. This stage primarily involves adjusting the valves CV81810 (300 K helium line) and CV81710 (35 K helium line) in the injection valve box. After completing this stage, the system transitions to the 45 K stabilization phase and subsequent 45 K–2 K cooling stages.
Figure 7.
Schematic diagram of the automatic cooling process for the AB path in the injector section from 160K to 45K.
Figure 7.
Schematic diagram of the automatic cooling process for the AB path in the injector section from 160K to 45K.
2.4. Key Equipment and Technology
Dynamic power compensation is initiated after the superconducting cavity is cooled and the module’s liquid accumulation is complete. The process is illustrated in Figure 8. First, the valve box cools each pipeline to the target temperature. For example, the 2 K inlet and outlet pipes of the superconducting cavity are cooled to 2 K via valve adjustments. Once the 2 K liquid accumulation is complete and the temperature and pressure stabilize, the superconducting cavity is aged, with dynamic power compensation activated to prevent quenches. The formula for the cavity consumption calculation process is as follows:
The cavity loss calculation formula is as follows: To ensure accurate and stable operation of the superconducting cavity aging and module commissioning, data such as Eacc (accelerating energy), Qt, Pt, and calculated Q0 are used. Constants r/Q and Leff are applied. Taking the eighth cavity of the injected eight-cavity module as an example (Table 3), the cavity loss value Pdiss at different accelerating gradients is calculated. The cavity pressure values corresponding to these losses are measured by the cryogenic control system. The relationship between cavity pressure and cavity loss is fitted using Python, generating a specific curve for each superconducting cavity. The real-time cavity pressure is then mapped to the corresponding cavity loss, and the calculated value is written into the heater power control program to achieve dynamic power compensation for each superconducting cavity.

Table 3.
SHINE injected vertical measurement data from Cavity 8 of the eight chambers.
| Eacc(MV/m) | Q0 | Qt | Pt(W) | Pt-Meter(dBm) | Pdiss(W) | |
|---|---|---|---|---|---|---|
| 1 | 1.384955 | 25363638046 | 1.50706E+12 | 0.001324 | -29.6192 | 0.078649 |
| 3 | 2.006491 | 26298450221 | 1.50706E+12 | 0.002778 | -26.3992 | 0.159213 |
| 4 | 3.000685 | 27361875032 | 1.50706E+12 | 0.006214 | -22.9035 | 0.342239 |
| 5 | 4.008049 | 28180243289 | 1.50706E+12 | 0.011086 | -20.3892 | 0.592866 |
| 6 | 5.004257 | 29016579679 | 1.50706E+12 | 0.017282 | -18.4611 | 0.897569 |
| 7 | 6.000295 | 29876758664 | 1.50706E+12 | 0.024846 | -16.884 | 1.253276 |
| 8 | 6.999059 | 30701864352 | 1.50706E+12 | 0.033805 | -15.5471 | 1.659394 |
| 9 | 8.000774 | 31544720703 | 1.50706E+12 | 0.044174 | -14.3853 | 2.110436 |
| 10 | 9.003478 | 32355798141 | 1.50706E+12 | 0.055941 | -13.3597 | 2.605574 |
| 11 | 10.009006 | 33086399710 | 1.50706E+12 | 0.069133 | -12.4401 | 3.148962 |
| 12 | 11.005173 | 33727625355 | 1.50706E+12 | 0.083579 | -11.616 | 3.73459 |
| 13 | 11.994967 | 34279567253 | 1.50706E+12 | 0.09929 | -10.8679 | 4.365135 |
| 14 | 13.00749 | 34757612645 | 1.50706E+12 | 0.11676 | -10.164 | 5.062581 |
| 15 | 14.004966 | 35120670803 | 1.50706E+12 | 0.135354 | -9.5223 | 5.808129 |
| 16 | 15.007056 | 35382126640 | 1.50706E+12 | 0.155416 | -8.922 | 6.619757 |
| 17 | 16.019542 | 35559923862 | 1.50706E+12 | 0.177095 | -8.354 | 7.505408 |
| 18 | 17.025288 | 35566029956 | 1.50706E+12 | 0.20003 | -7.826 | 8.475952 |
| 19 | 18.006101 | 35515110821 | 1.50706E+12 | 0.223741 | -7.3395 | 9.494261 |
| 20 | 19.006043 | 35323662985 | 1.50706E+12 | 0.249281 | -6.8703 | 10.63537 |
| 21 | 20.005948 | 35059133994 | 1.50706E+12 | 0.2762 | -6.424 | 11.87277 |
Table 4.
Inject the cavity pressure and cavity consumption data of Cavity 8 of the eighth cavity.
| Cavity Voltage(V) | Pdiss(W) | |
|---|---|---|
| 1 | 1.023220486 | 0.342239325 |
| 2 | 1.334997106 | 0.592865608 |
| 3 | 1.664134838 | 0.897569204 |
| 4 | 1.984953704 | 1.25327587 |
| 5 | 2.334707755 | 1.659393987 |
| 6 | 2.662398727 | 2.110436411 |
| 7 | 2.98864294 | 2.605574227 |
| 8 | 3.331163194 | 3.147402664 |
| 9 | 3.698278356 | 3.148961412 |
| 10 | 4.067563657 | 3.734590039 |
| 11 | 4.425636574 | 4.365135565 |
| 12 | 4.839771412 | 5.06258134 |
The final curve graph obtained through the fitting of cavity pressure and cavity loss is shown in Figure 8:
The effective control of heater power plays a critical role in dynamic power compensation. The control flow diagram for the TDK heater power in the injector section is shown in Figure 9, with two modes: local control and remote control.
- Local Control Mode: When set to local control, power output is manually adjusted via the power supply’s control panel;
- Remote Control Mode: Primarily used during experiments, this mode requires inputting each heater’s resistance value. Power is enabled only if no interlocks are triggered. After enabling, the power control method is divided into three stages: heater normal operation mode, superconducting cavity heater auto-compensation mode, and liquid level heater PID mode.
3. Commissioning and Operation of Cryogenic System
3.1. Automatic Cooling Experiment
The module cooling process from 300 K to 2 K is divided into stages, with partial control interfaces shown :
- 300K–35K: Mixed helium cools the cold shield, helium container, and superconducting cavity to 80 K, ensuring uniform cooling;
- 45K–4.5K: Liquid helium flow >30 g/s for uniform cooling;
- 4.5K–2K: J-T valve and cryopump control rapid uniform cooling to 2 K, maintaining liquid level stability. From November 24 to December 20, 2024, the injector section underwent a new round of superconducting cavity cooling tests. Automatic valve adjustment based on pressure and temperature achieved reliable cooling. The 300–45 K automatic cooling process met module requirements, with the complete cooling curve shown in Figure 10. The entire process took approximately 42 hours, with a smooth curve validating the system’s effectiveness.
3.2. 2K liquid Level Stability
After automatic cooling and liquid accumulation, the module’s JT valve PID control and superconducting cavity dynamic power compensation were activated to stabilize the helium bath pressure and level. The PID control interfaces for the single-cavity INJ1_FCV2 and eight-cavity INJ8_FCV2 valves are shown in Figure 11.
Liquid level stability is achieved through real-time level meter data, with closed-loop feedback controlling multiple valves and heater power. The level meter signal is filtered to obtain accurate data, and multivariable coupled PID algorithms adjust valves and heaters to maintain a ±1% stability. High-frequency low-level system data can also be used as criteria. To prevent damage from low levels, interlock alarms are triggered when thresholds are exceeded. The liquid level for the single-cavity module was maintained at 72–74%, and the eight-cavity module at 70–72%, as shown in Figure 12.
Pressure stability is achieved through multiple precision temperature control units. High-frequency cavity pressure data is fitted to calculate cavity loss power (fitting time ms). PID regulation of high-precision power output maintains a constant total power load, achieving 3100 Pa ± 10 Pa stability. The single-cavity pressure fluctuation was maintained at 31.7–31.9 mbar, and the eight-cavity pressure at 31.6–31.8 mbar.
3.3. Dynamic Power Compensation Experiment
Dynamic power compensation converts cavity pressure signals into cavity loss data using a derived formula. The total dynamic load is set, and heater output power is adjusted in real time to maintain a constant module load. When the superconducting cavity dynamic power compensation mode is activated, the dynamic total load is set, cavity loss is calculated, and heater power is adjusted accordingly. The process is controlled via PLC, with feedback voltage, current, and power monitored. The single-cavity and eight-cavity module layouts are shown in Figure 13.
Figure 14.
Dynamic power compensation experimenta.
4. Conclusions
This paper elaborates on the overall design and implementation of the SHINE cryogenic control system. By integrating open-source EPICS control with PLC systems, the system efficiently achieves cryogenic network construction, automated cooling process control, cryogenic environment safety interlock alarms, and stability in 2 K liquid level, pressure, and dynamic power compensation. Multiple rounds of superconducting cavity cooling, aging, and commissioning experiments conducted in August and December 2024 validated the system’s ability to ensure stability, significantly reducing quench frequency during experiments and enhancing the stability and efficiency of accelerator operations.
The SHINE 12 kW@2 K cryogenic control system, through the integration of PLC and EPICS technologies, achieves high-precision management of the superconducting accelerator’s cryogenic environment. The four-stage automated cooling process and dynamic power compensation algorithm effectively address issues such as liquid level and pressure fluctuations and quenches at 2 K. Experimental data show a liquid level stability of ±1% and pressure fluctuations within 10 Pa, significantly improving accelerator efficiency. The safety interlock mechanism, incorporating leak, temperature, and oxygen concentration monitoring, ensures equipment and personnel safety. The successful implementation of this system not only meets the technical requirements of the SHINE project but also provides a reusable solution for large-scale scientific facilities, advancing the engineering application of superconducting accelerator cryogenic technology. Future work will focus on optimizing algorithm response speed and exploring more efficient energy-saving control strategies.
Author Contributions
Conceptualization, software, methodology, formal analysis, investigation, and validation, Y.W. and G.J.; resources, methodology, investigation, data curation, Y.W and G.J.; writing—original draft preparation, Y.W.; writing—review and editing, Y.W. and S.J.; visualization, Y.W.,L.Z.,Y.S.,X.Y.; supervision and funding acquisition, J.S.; funding acquisition, J.S. and Z.O.; All authors have read and agreed to the published version of the manuscript.
Funding
This research was funded by the Shanghai Advanced Research Institute, Chinese Academy of Sciences Major Project under grant number E56G691C01.
Data Availability Statement
The original contributions presented in this study are included in this article. Further inquiries can be directed to the corresponding author.
Acknowledgments
The authors would like to thank C.Y. for his valuable discussions on electrical circuit design and insightful contributions to system setup, and H.J. for providing technical support and troubleshooting
Conflicts of Interest
The authors declare no conflicts of interest.
References
- Jiang G, Ni Q , Wang S ,et al. The cryogenic control system of SHINE[J]. SpringerOpen 2021, 1. [CrossRef]
- Norihiro,Nishimoto,Nobuyuki,et al.Study of active controlled tocilizumab monotherapy for rheumatoid arthritis patients with an inadequate response to methotrexate (SATORI): significant reduction in disease activity and serum vascular endothelial growth factor by IL-6 receptor inhibition th[J].Modern Rheumatology, 2009. [CrossRef]
- Li S, Liu Y, Yuan Q.A System Control and Waveform Acquisition Framework for the Kicker System at SHINE[J].Electronics (2079-9292), 2025, 14(2). [CrossRef]
- Xiang Y, Wolff S, Petersen B,et al.Numerical simulation of two-phase Helium II stratified flow in cryogenic units of TESLA[J].Applied Superconductivity IEEE Transactions on, 2002, 12(1):1368-1373. [CrossRef]
- Xiang Y, Wolff S, Petersen B,et al.Numerical simulation of two-phase Helium II stratified flow in cryogenic units of TESLA[J].Applied Superconductivity IEEE Transactions on, 2002, 12(1):1368-1373. [CrossRef]
- Ishimoto J, Kamijo K.Numerical simulation of cavitating flow of liquid helium in venturi channel[J].Cryogenics, 2003, 43(1):9-17. [CrossRef]
- Yu,Xiang,Wolff,et al.Numerical Simulation of Two-Phase Helium II Stratified Flow in Cryogenic Units of TESLA.[J].IEEE Transactions on Applied Superconductivity, 2002.
Figure 1.
Overall schematic diagram of the SHINE device.
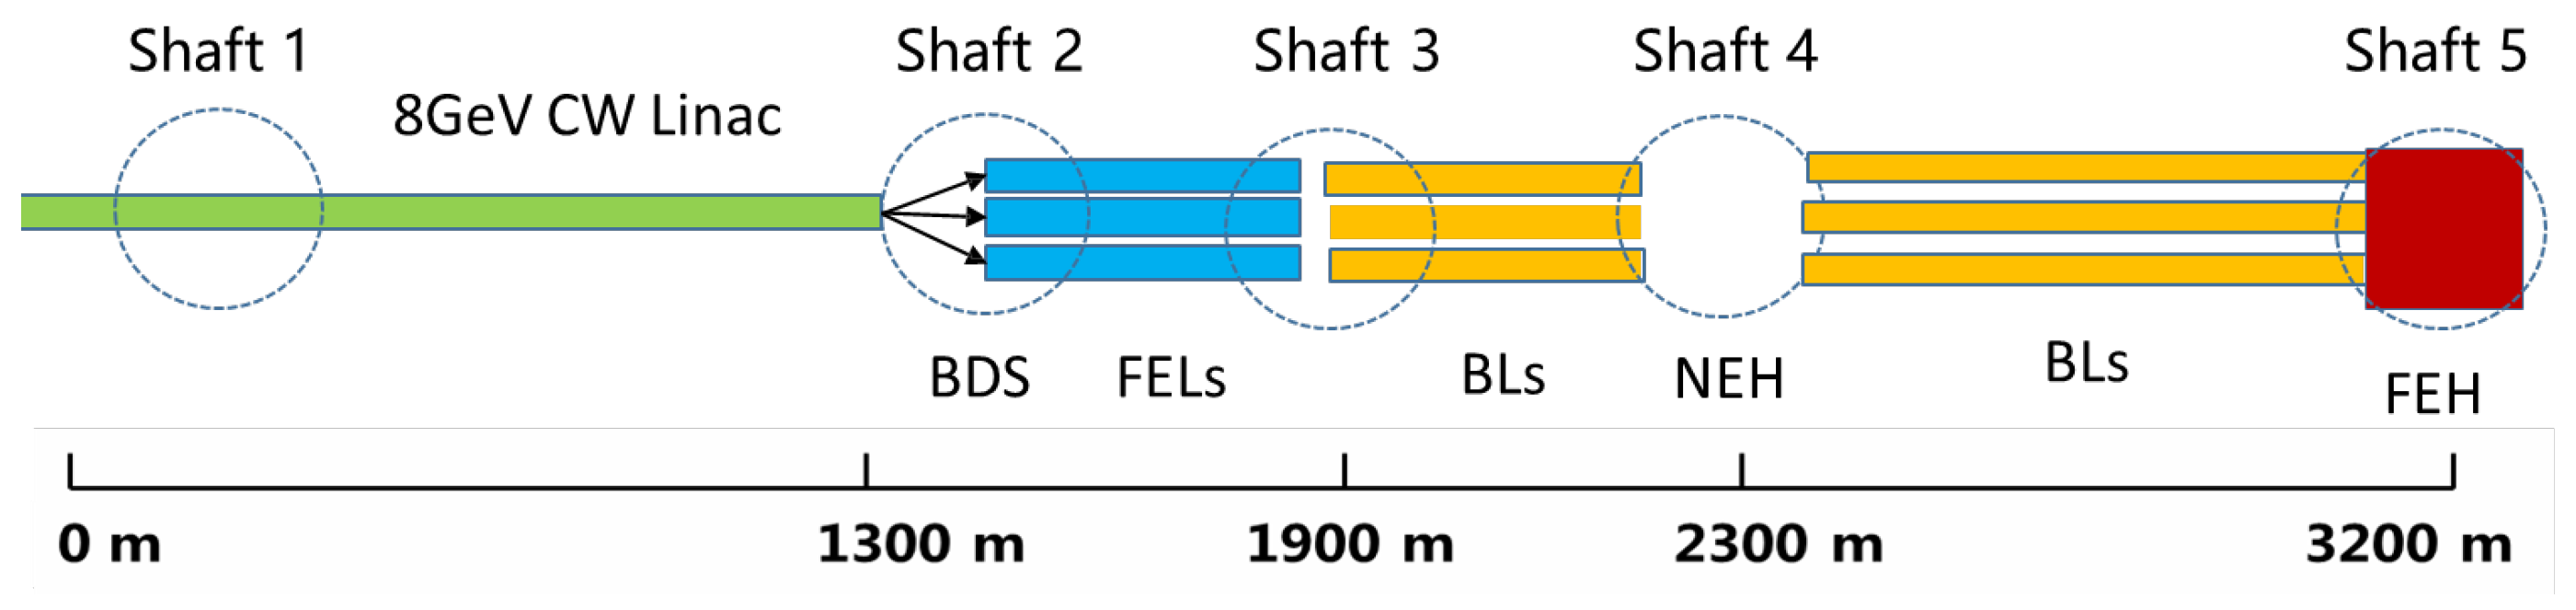
Figure 2.
SHINE 12kW@2K Schematic Diagram of the Helium Cryogenic System.
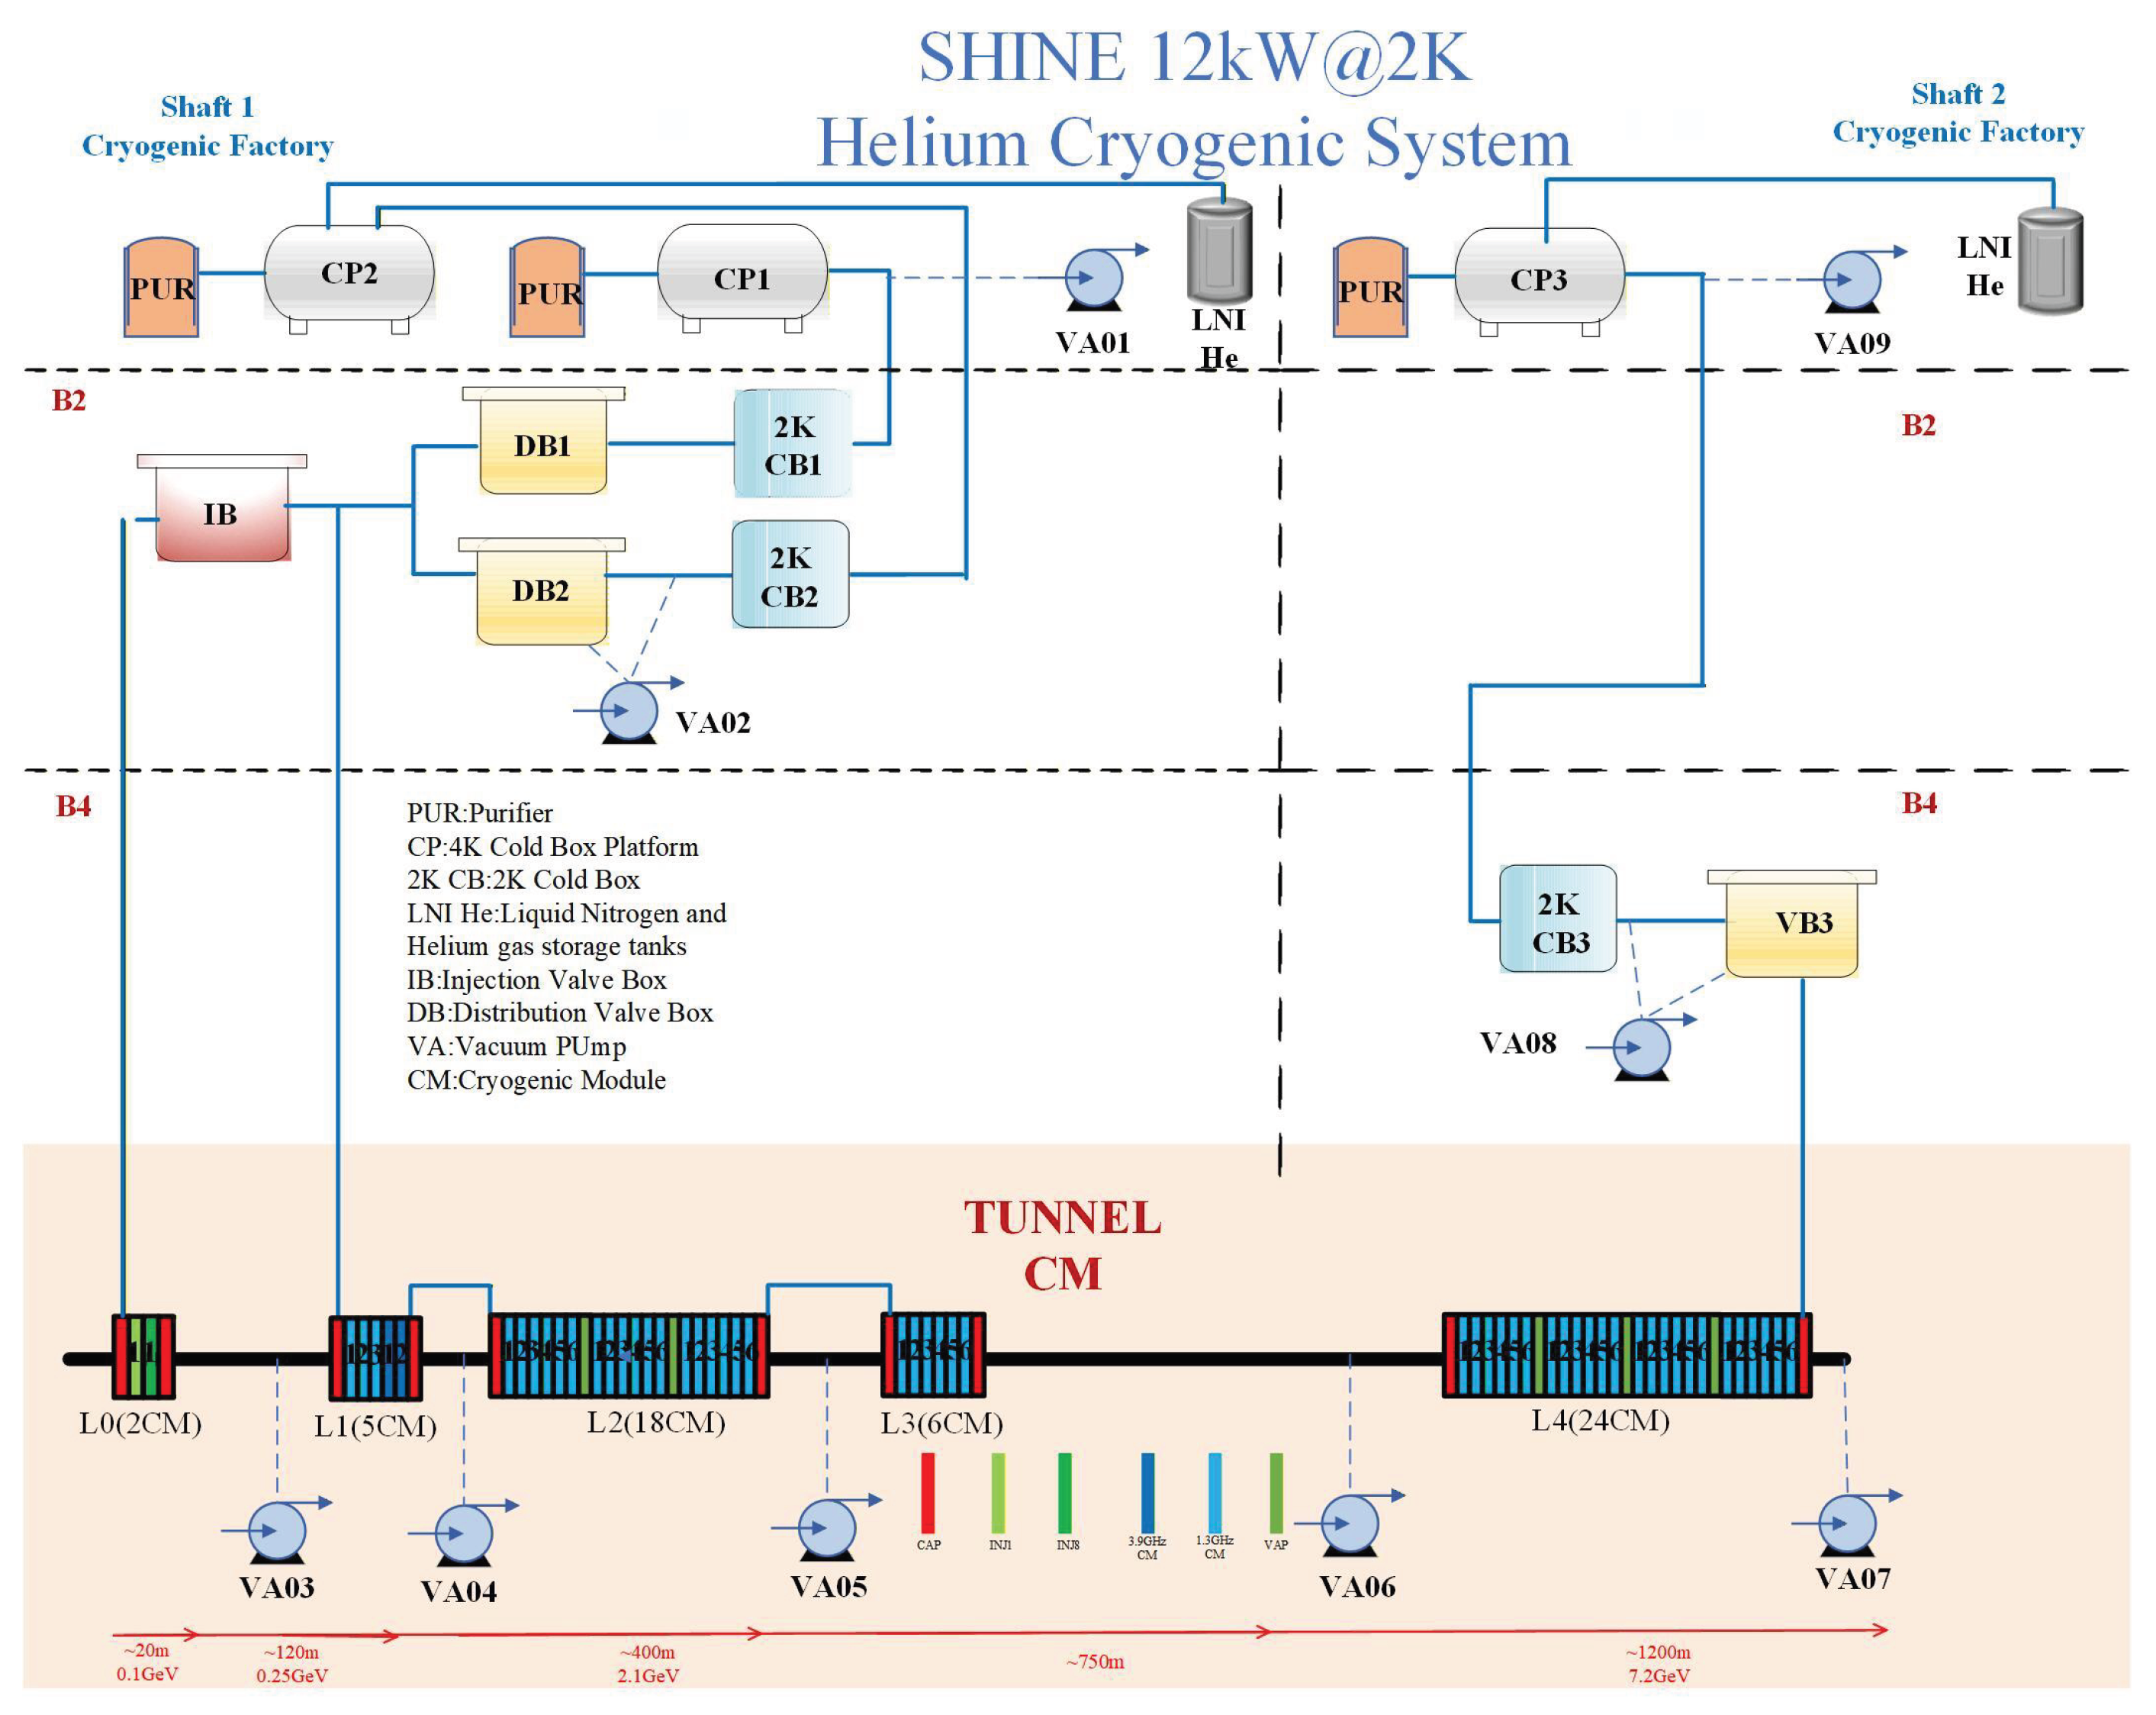
Figure 3.
12kW@2K Overall schematic diagram of the cryogenic control system.
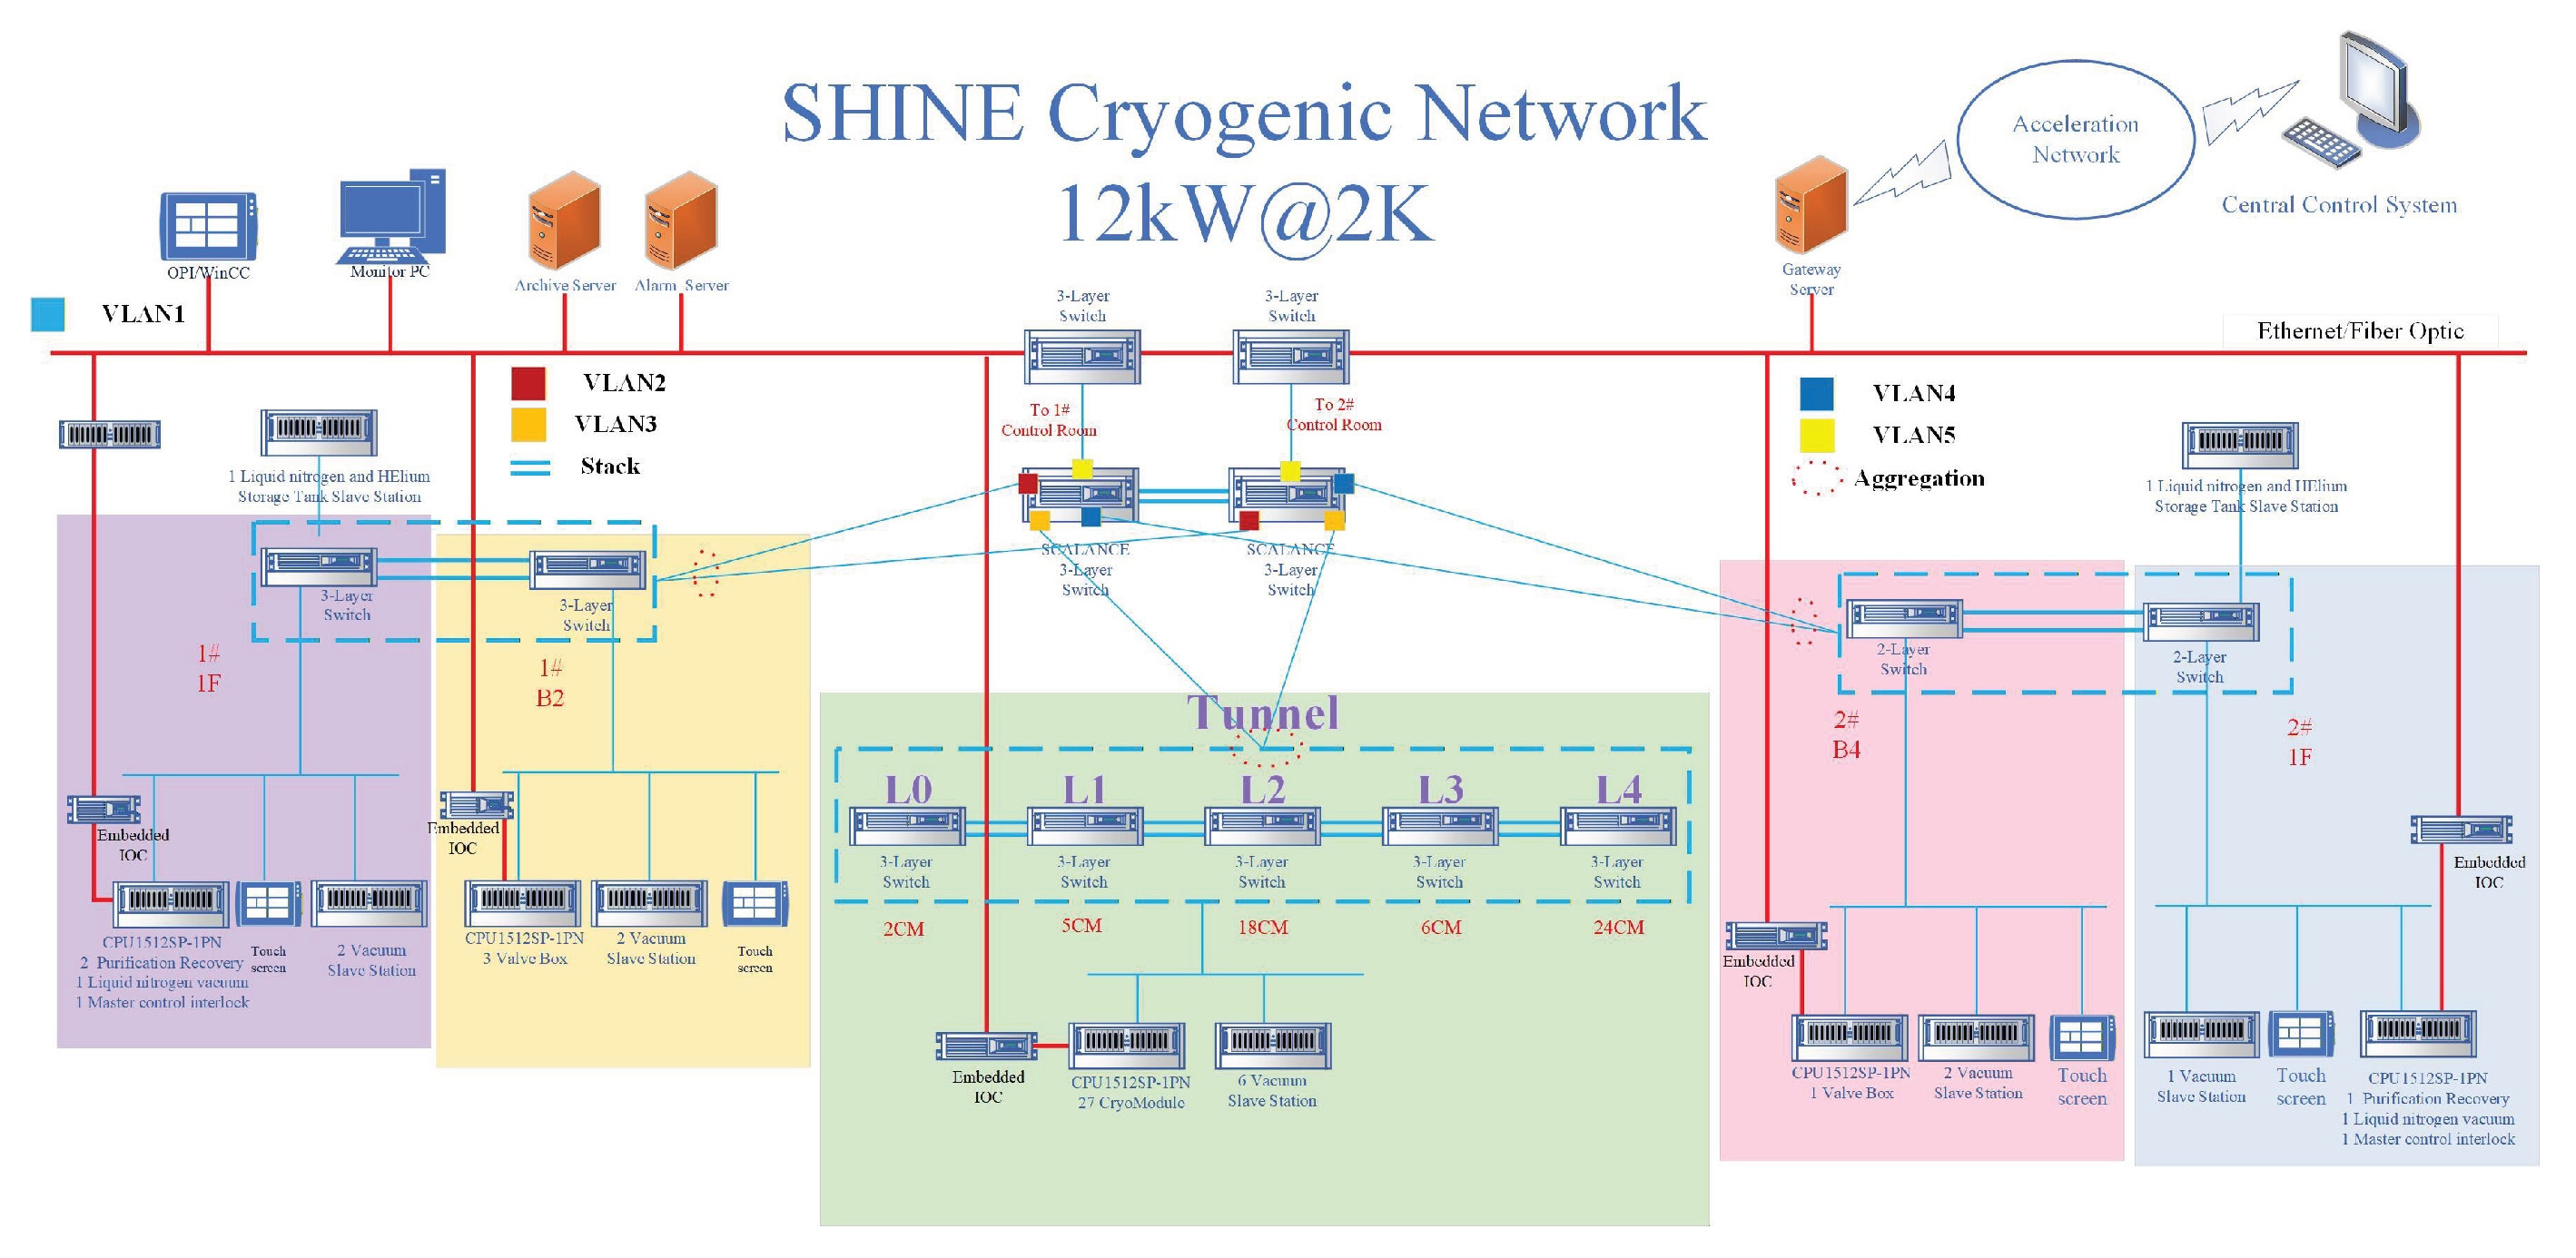
Figure 4.
12kW@2K cryogenic control system overall network architecture diagram.
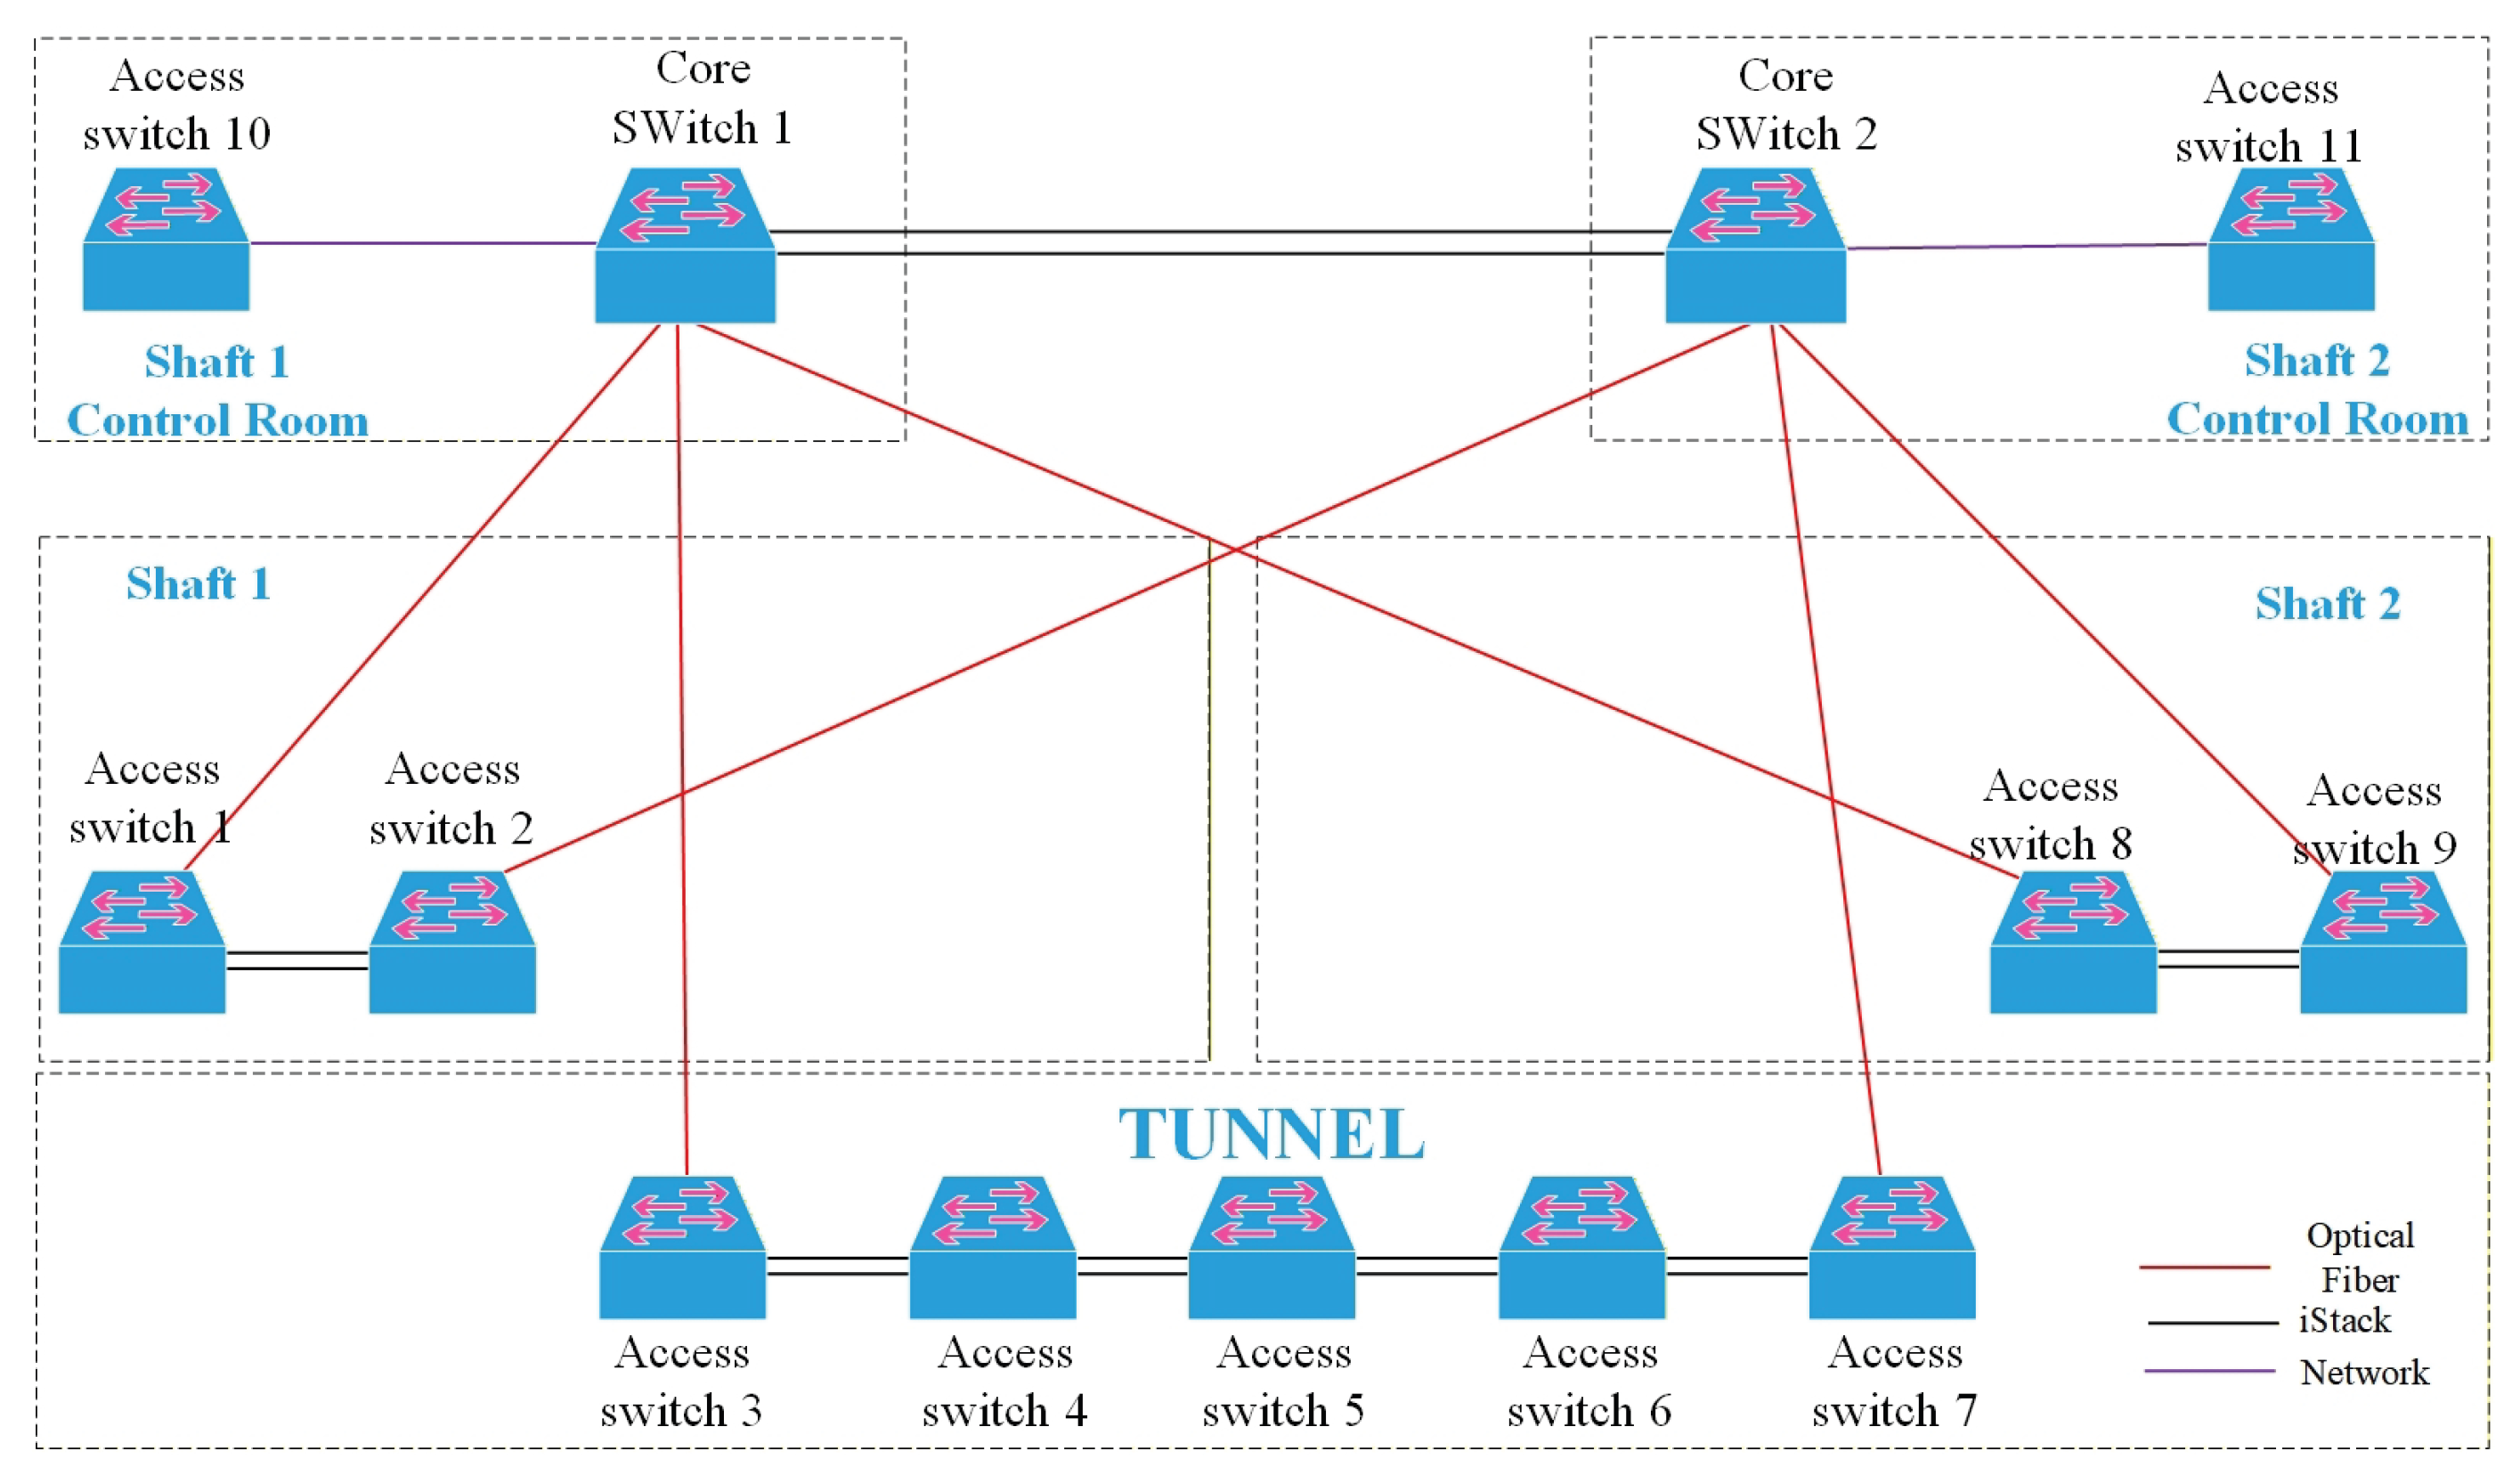
Figure 6.
Simple flow diagram of the injector section.
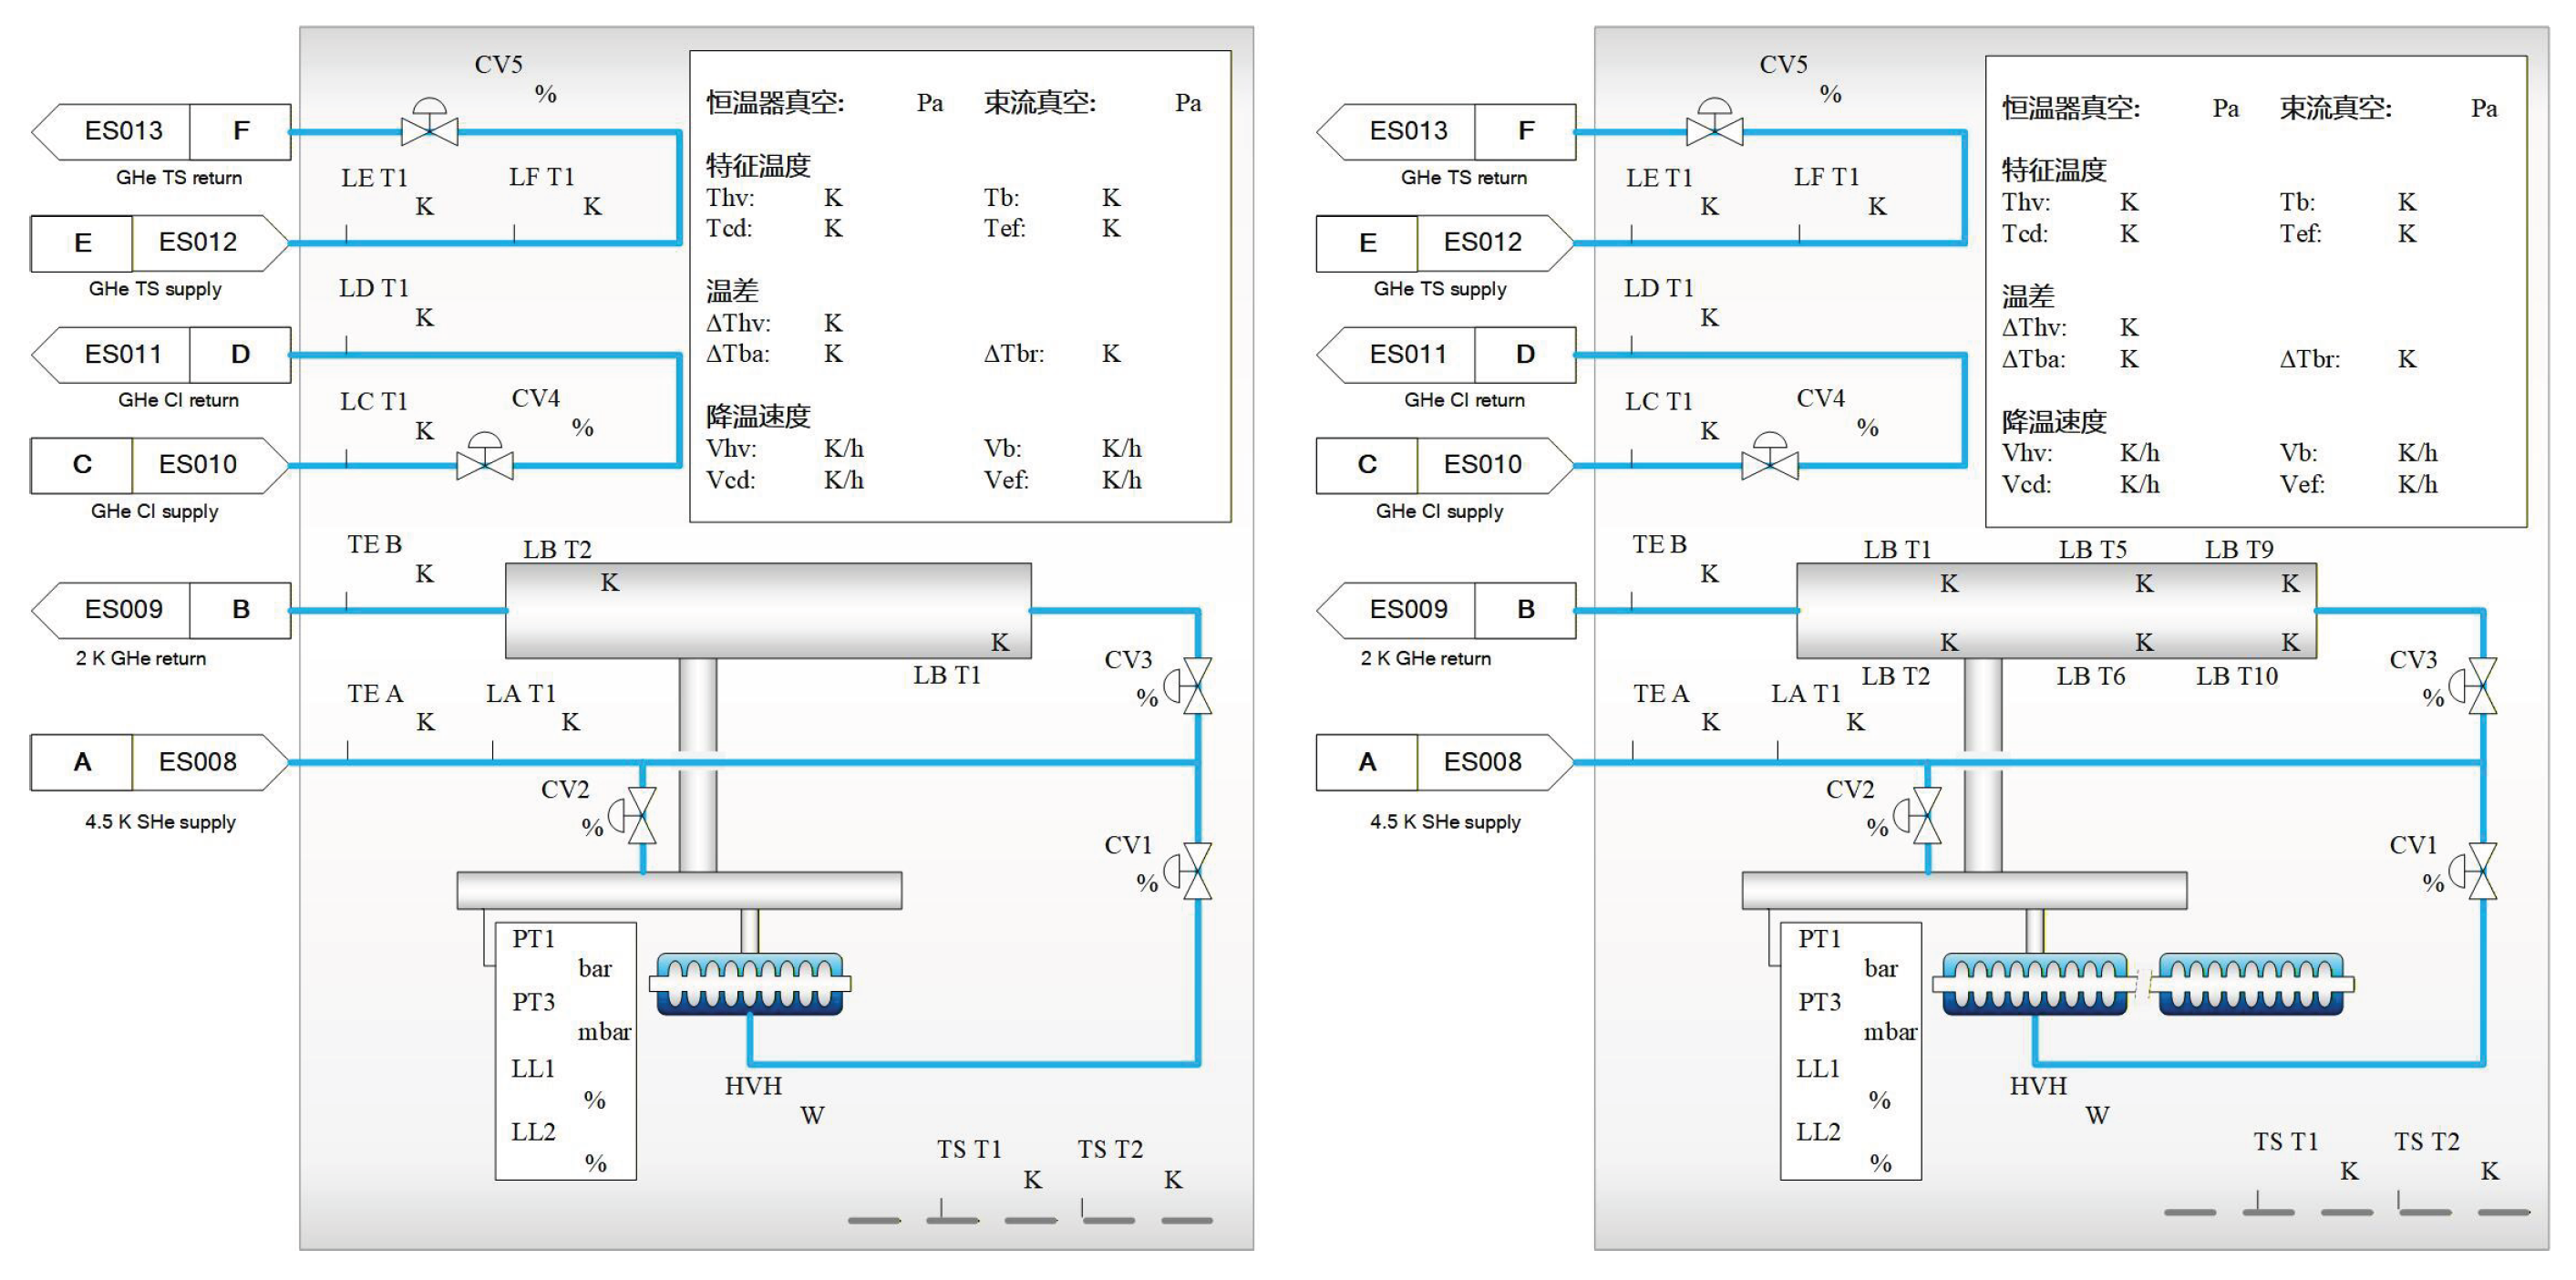
Figure 8.
Cavity loss curve graph.
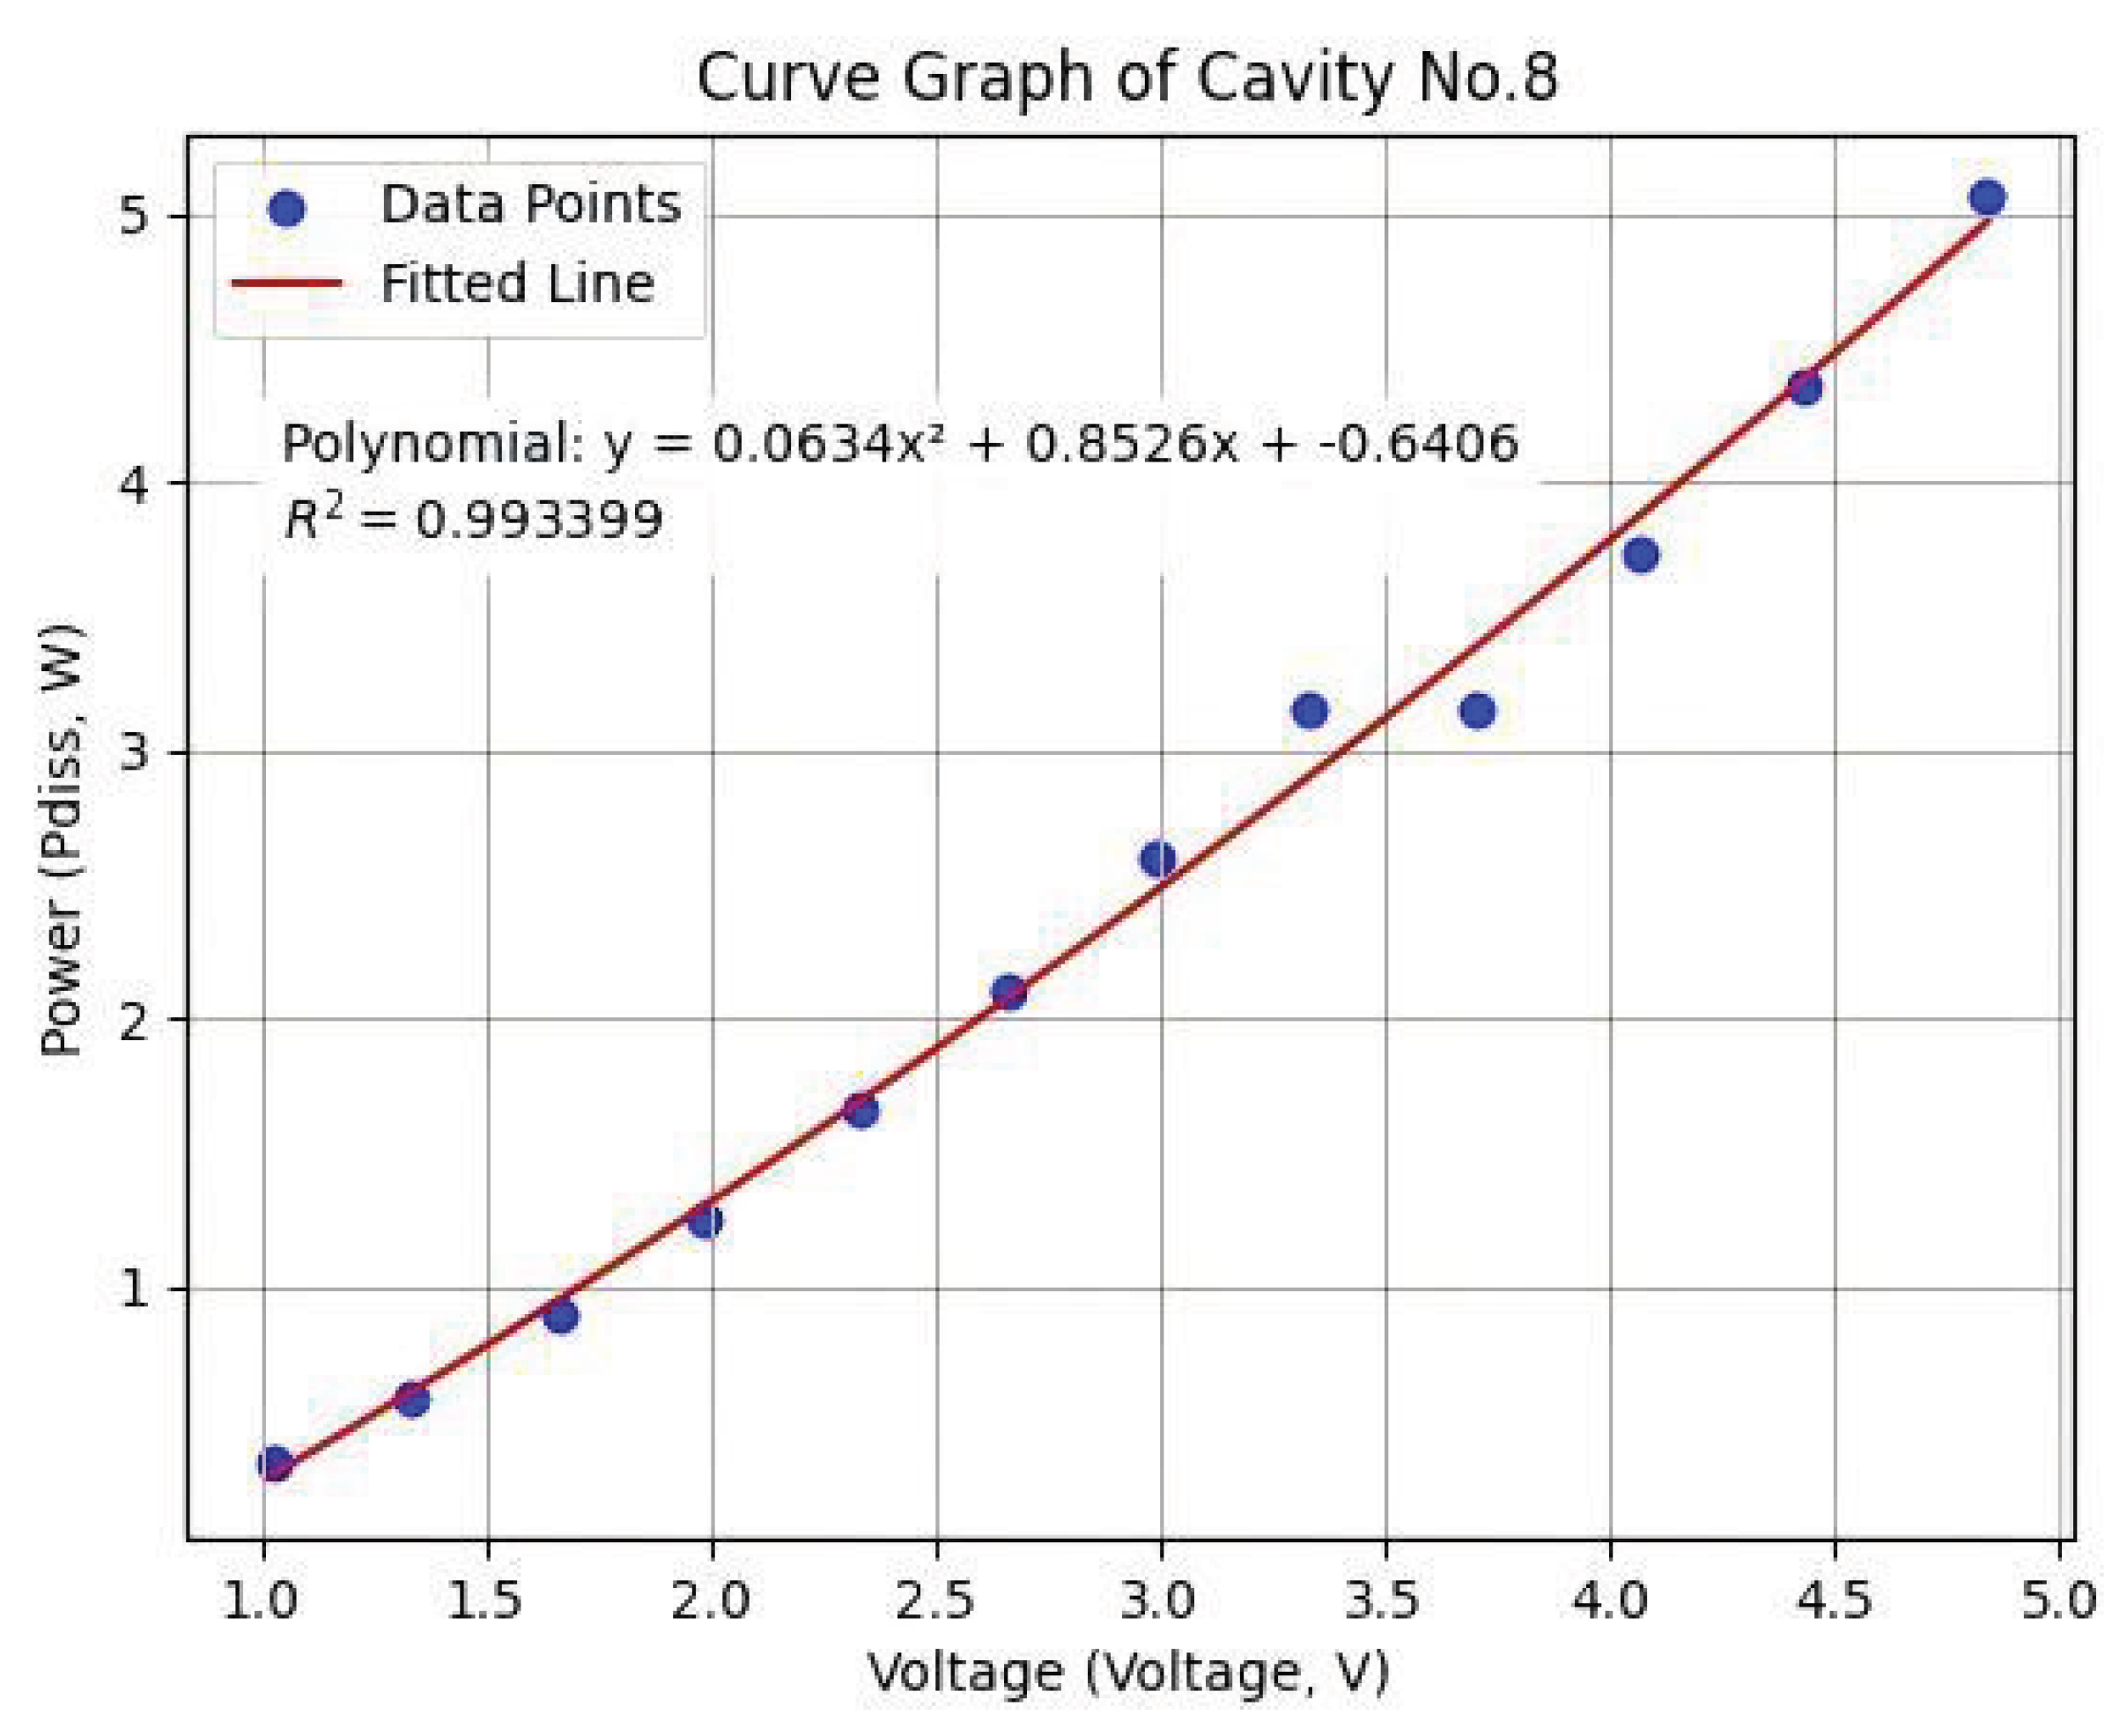
Figure 9.
Power control flow chart of TDK for injector section heater.
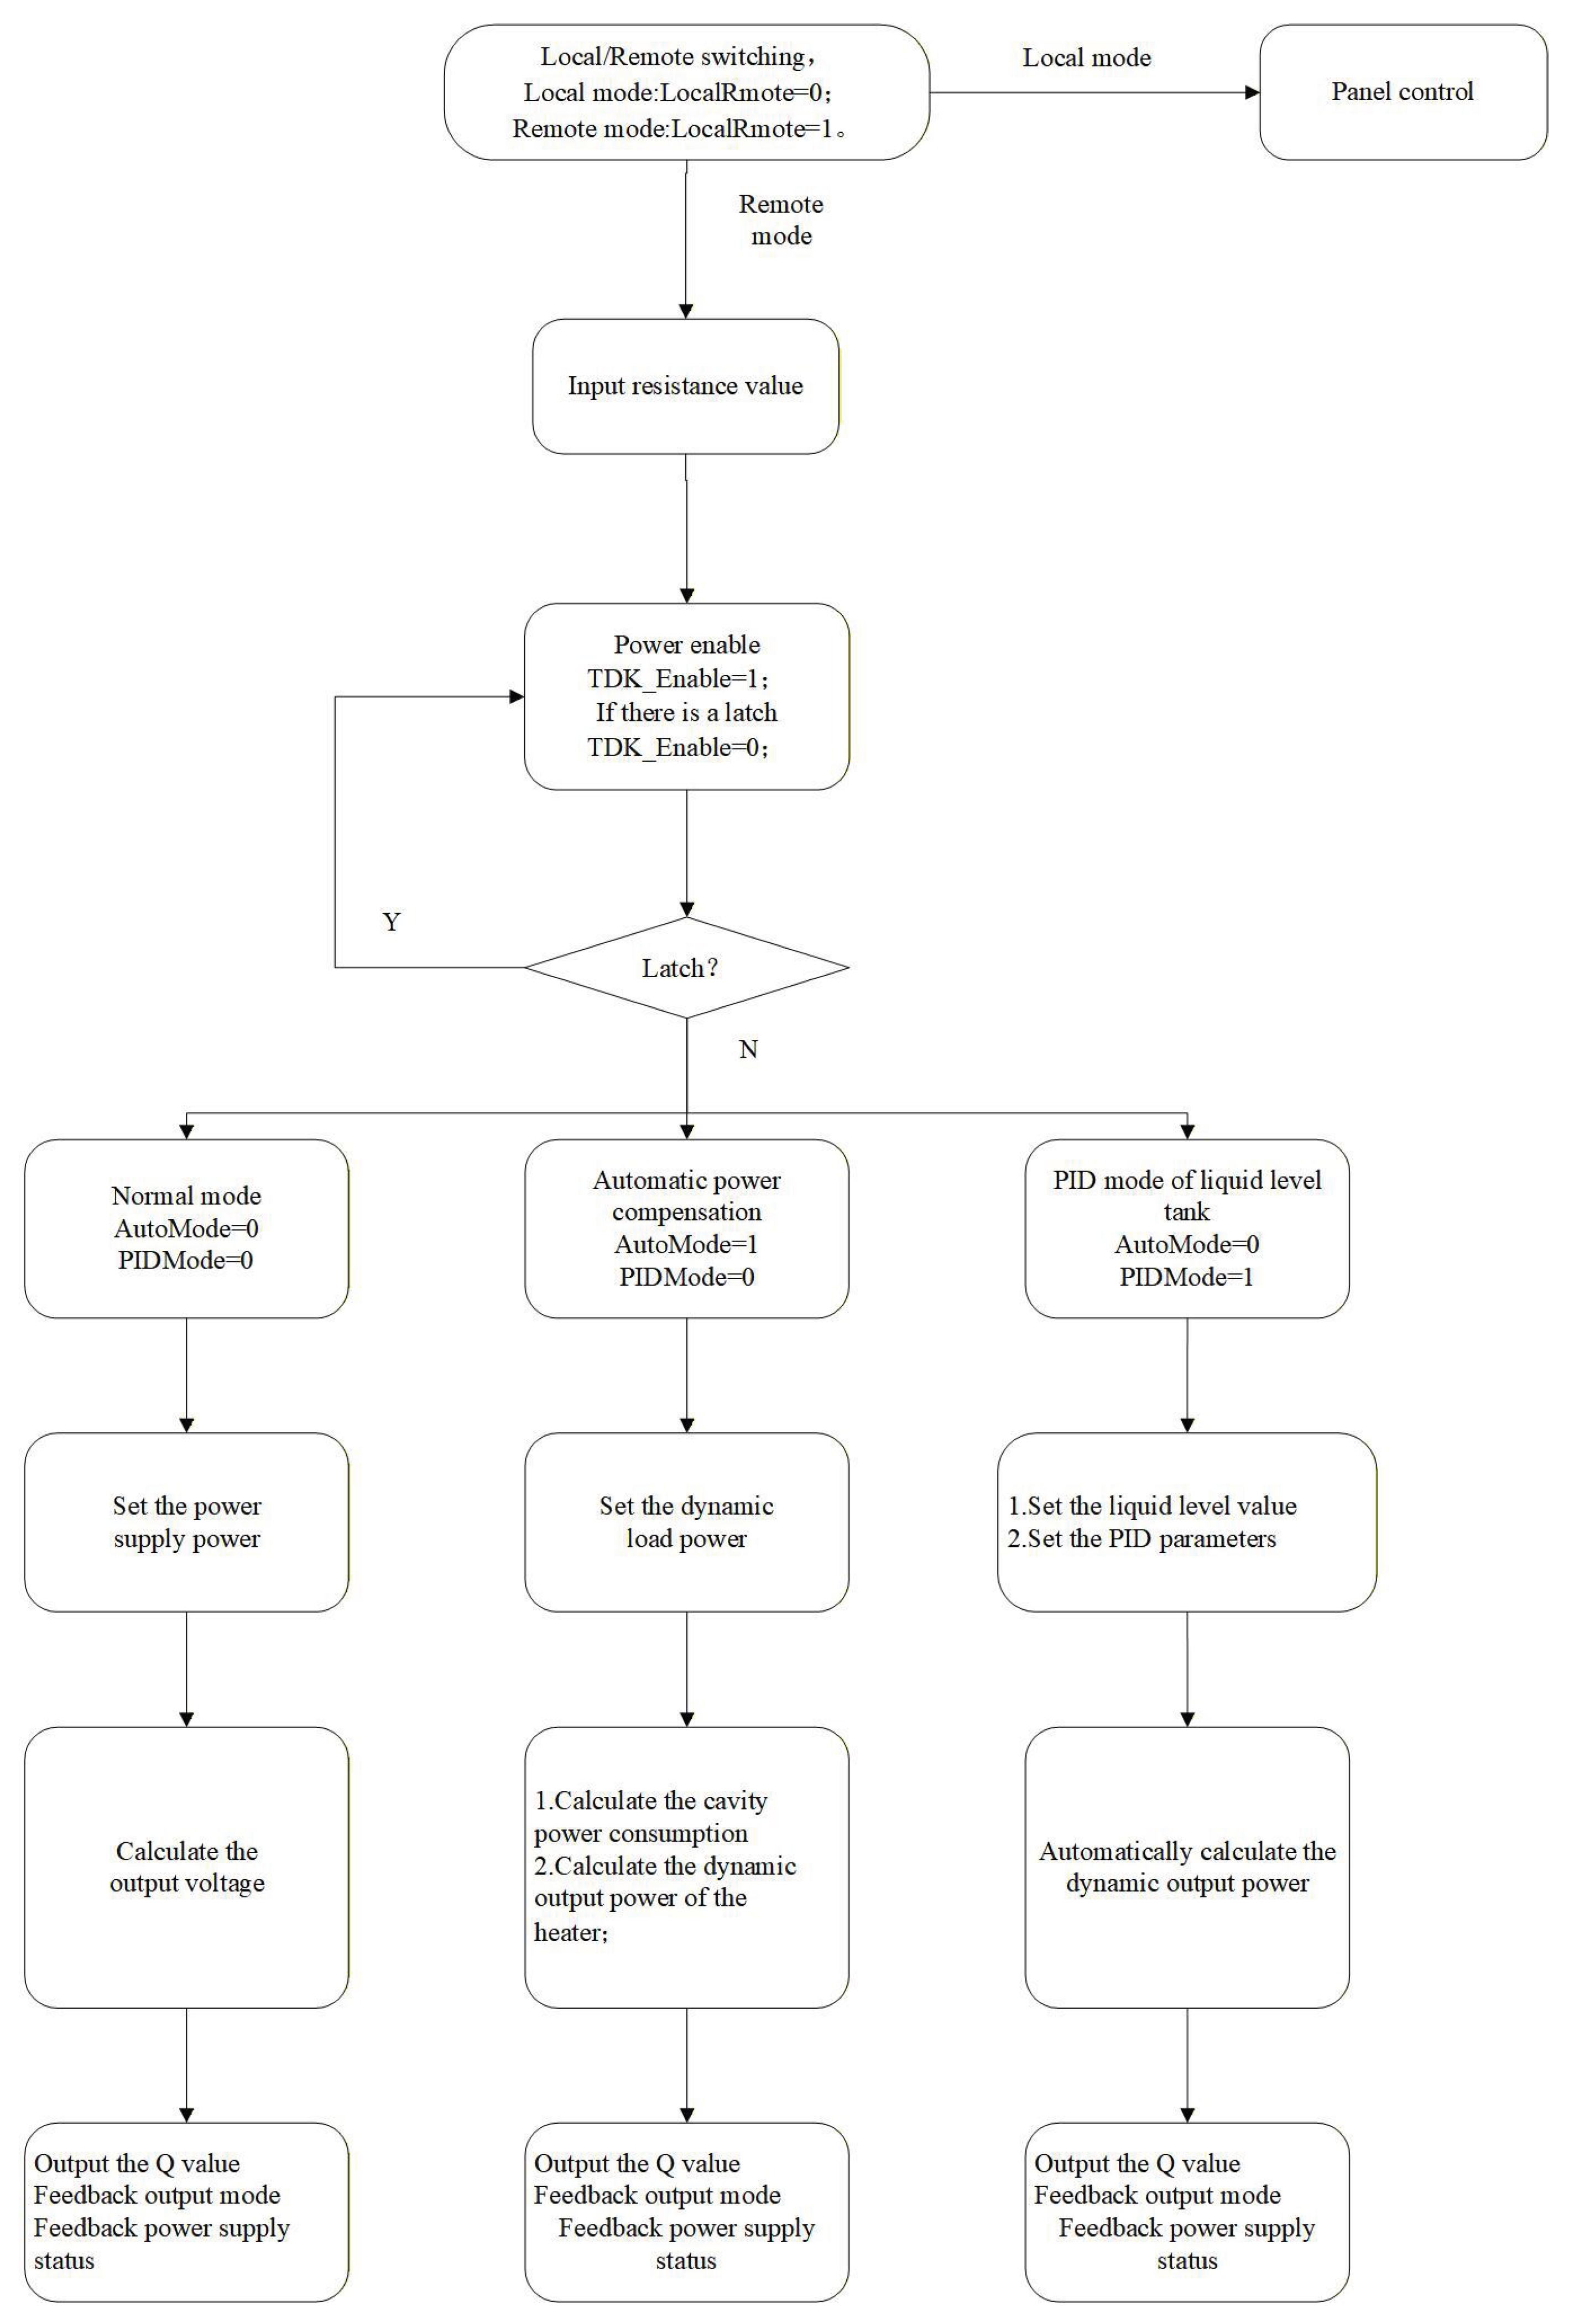
Figure 10.
The entire cooling and complete cooling curve.
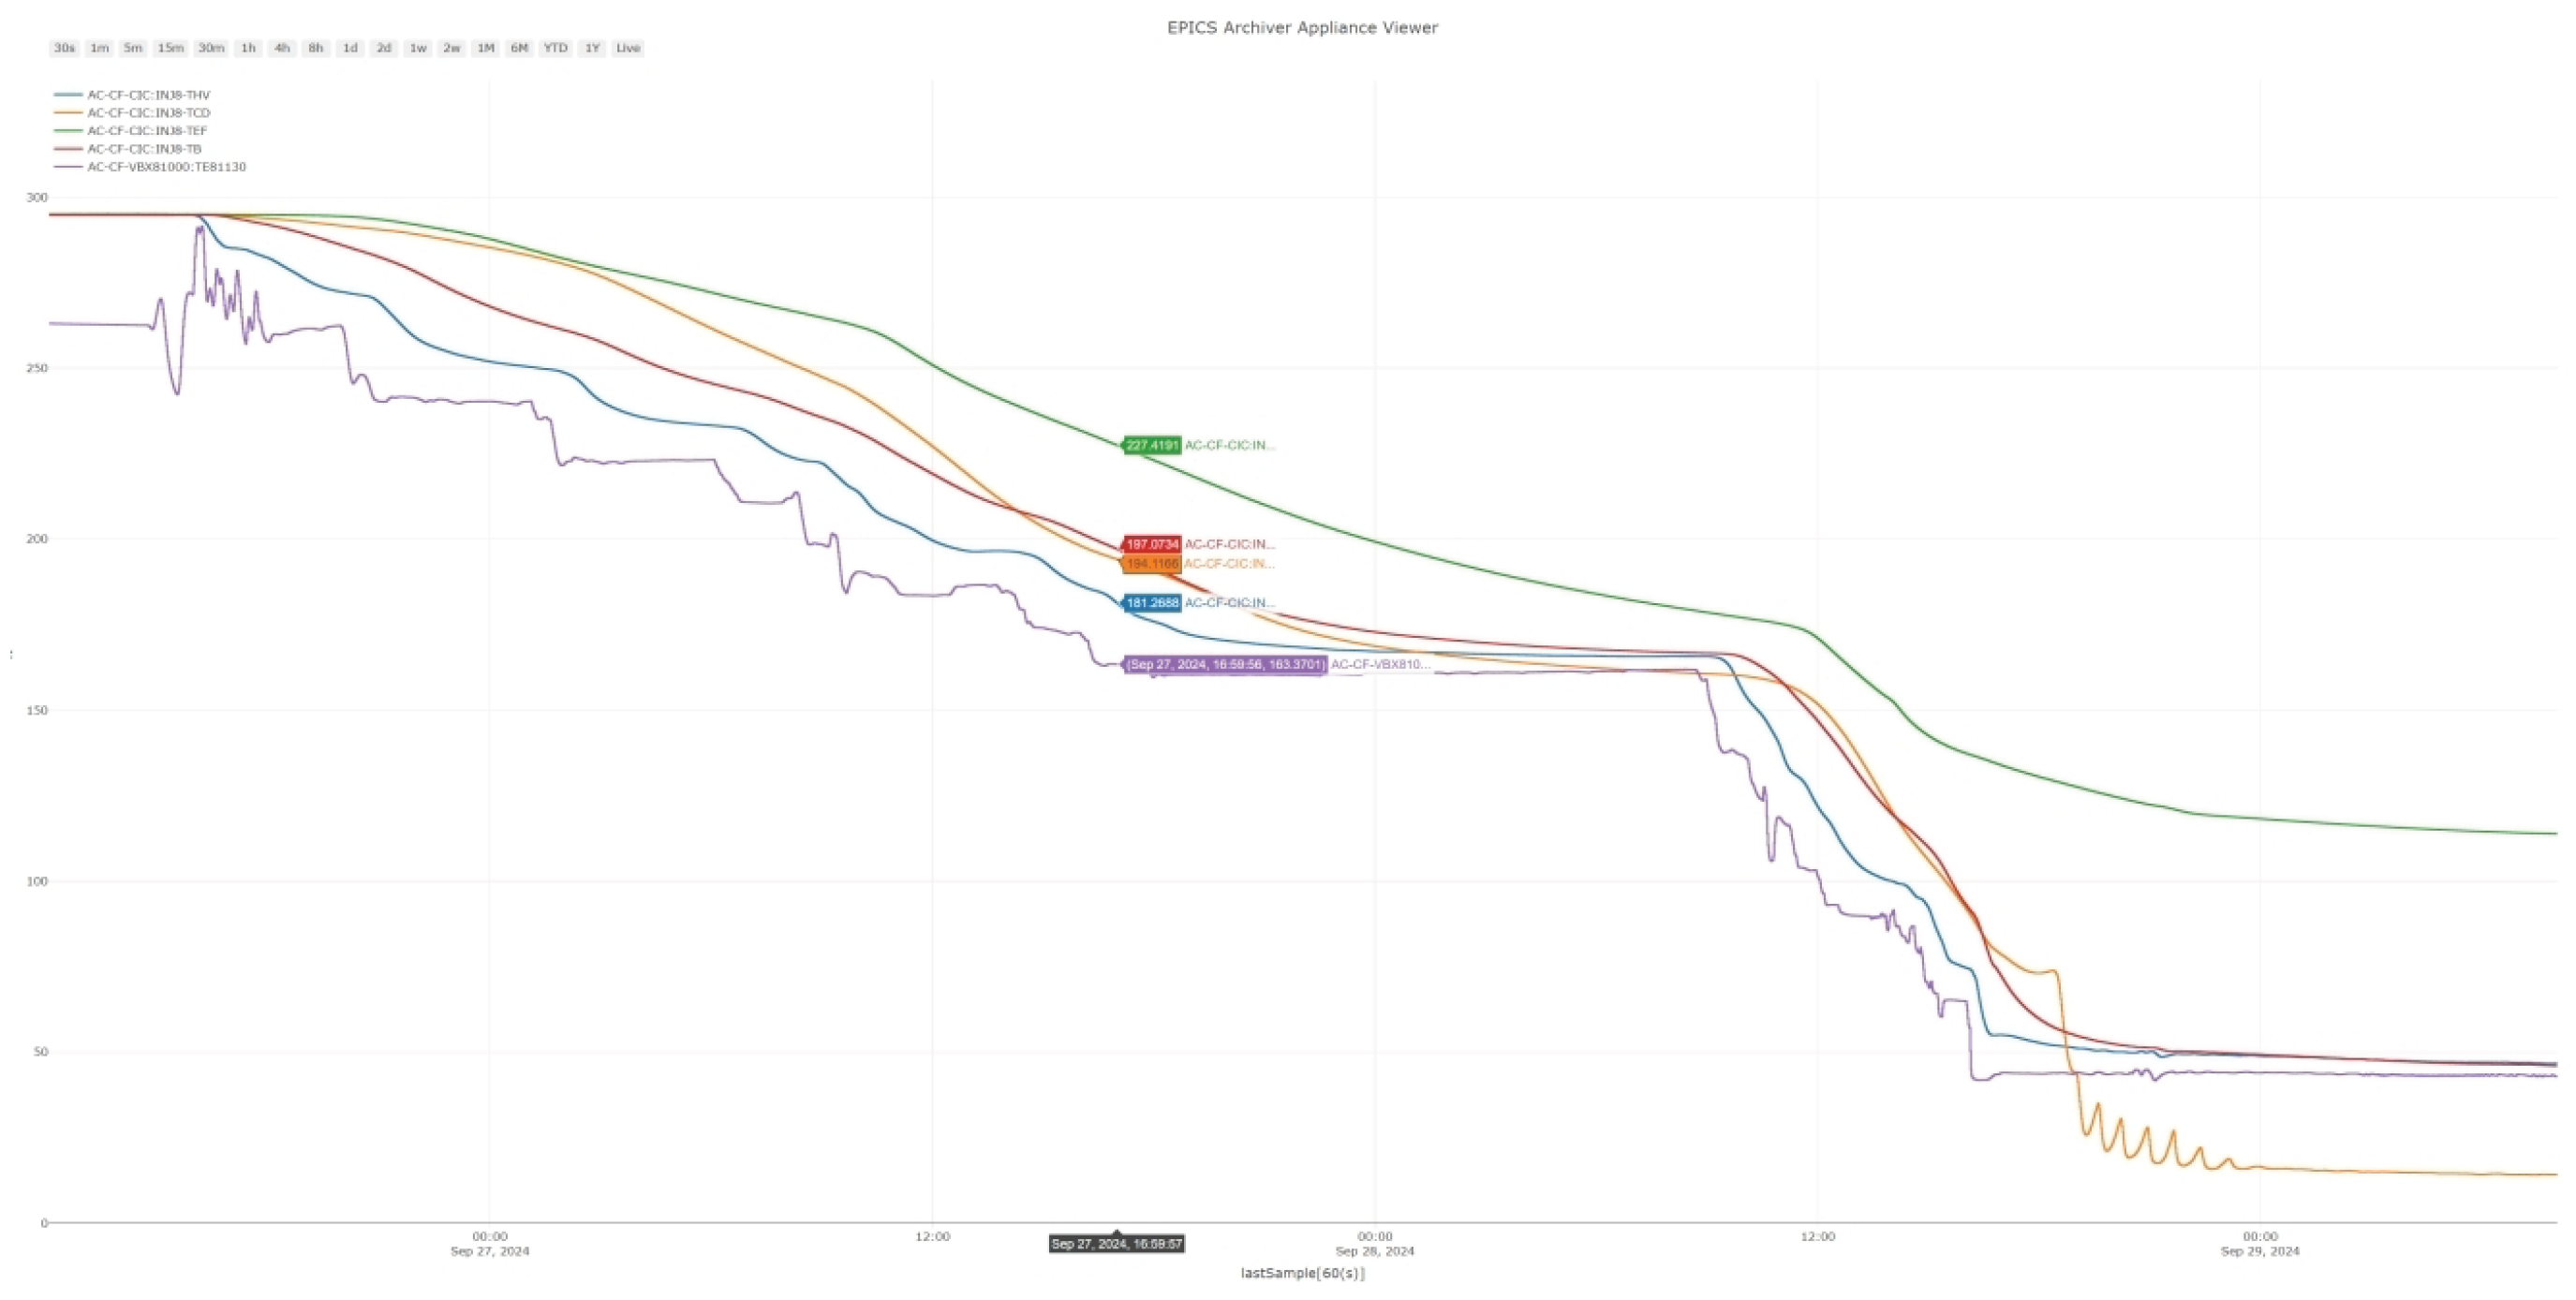
Figure 11.
Valve PID control interface.
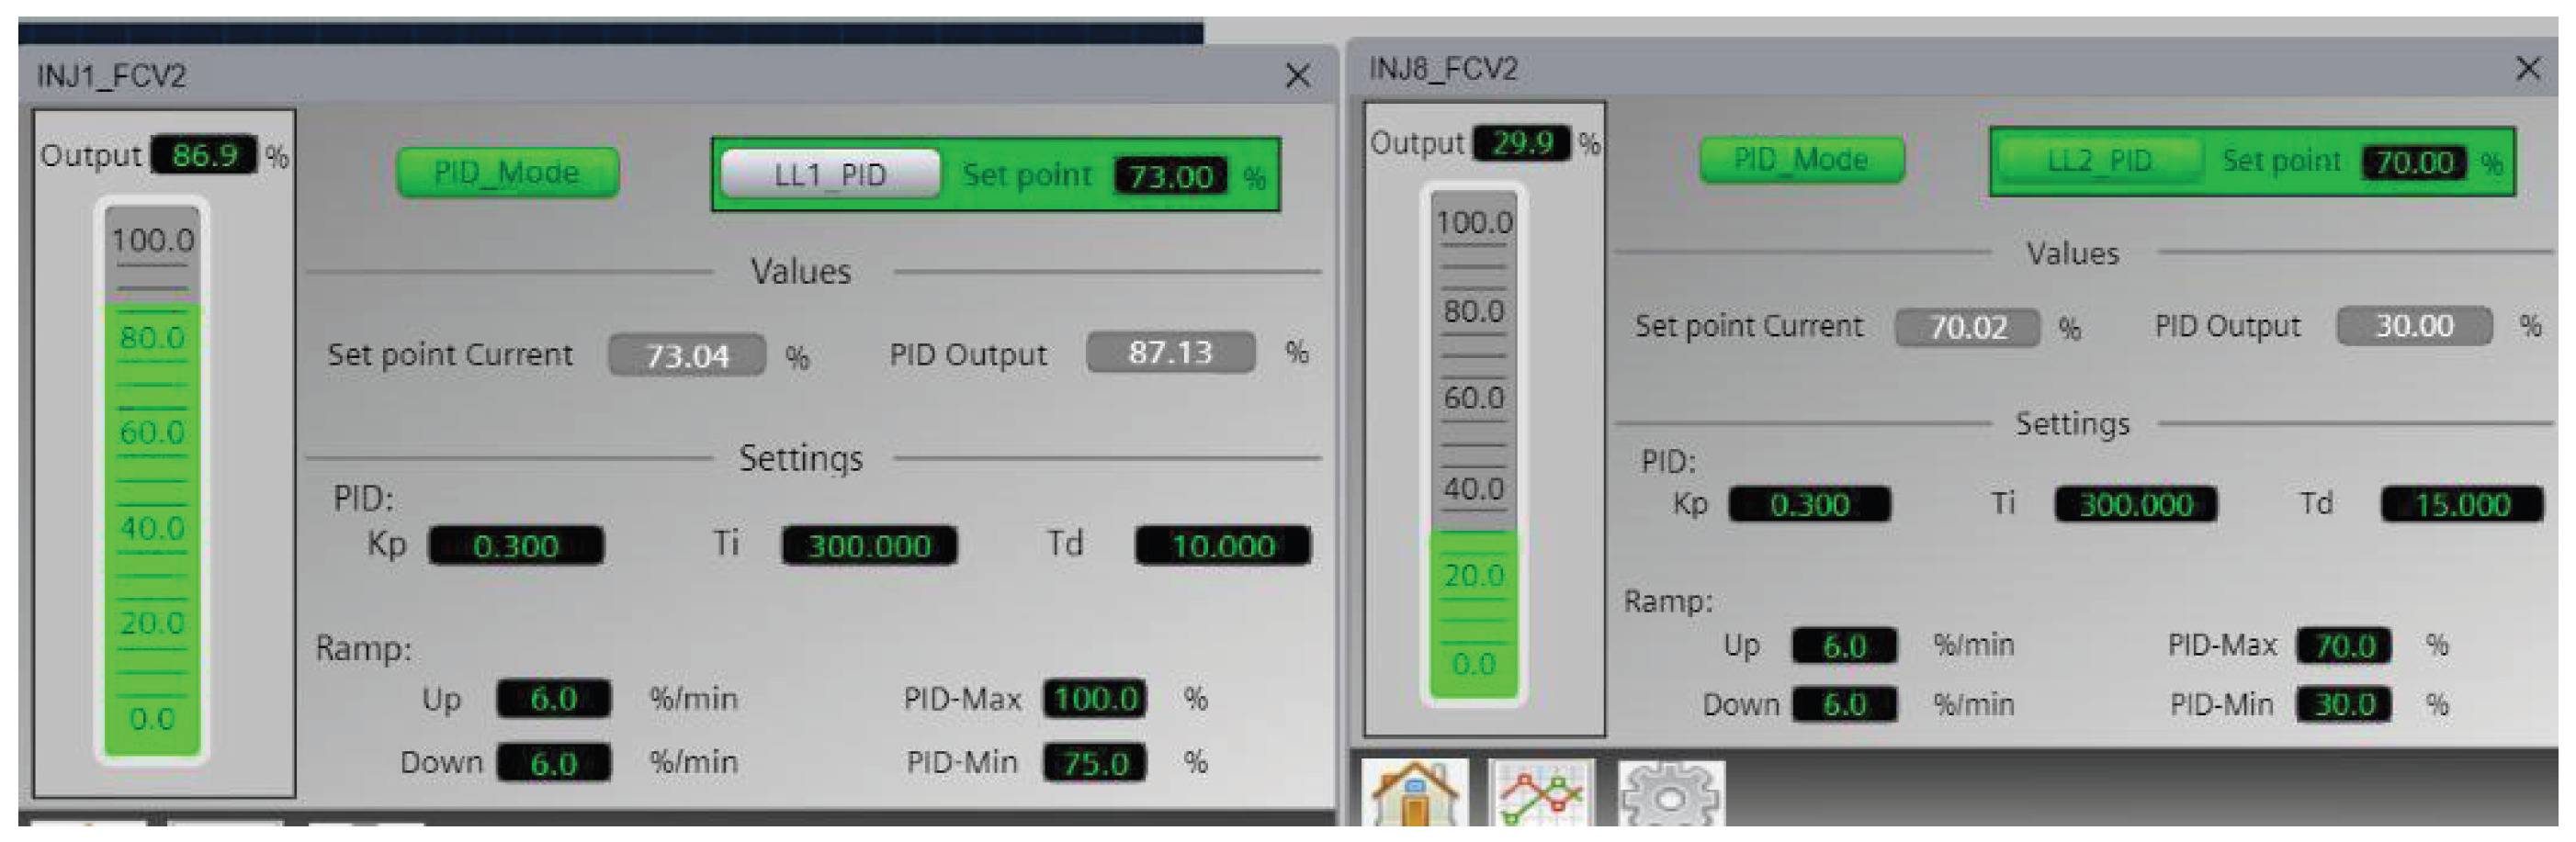
Figure 12.
Liquid level stability curve.
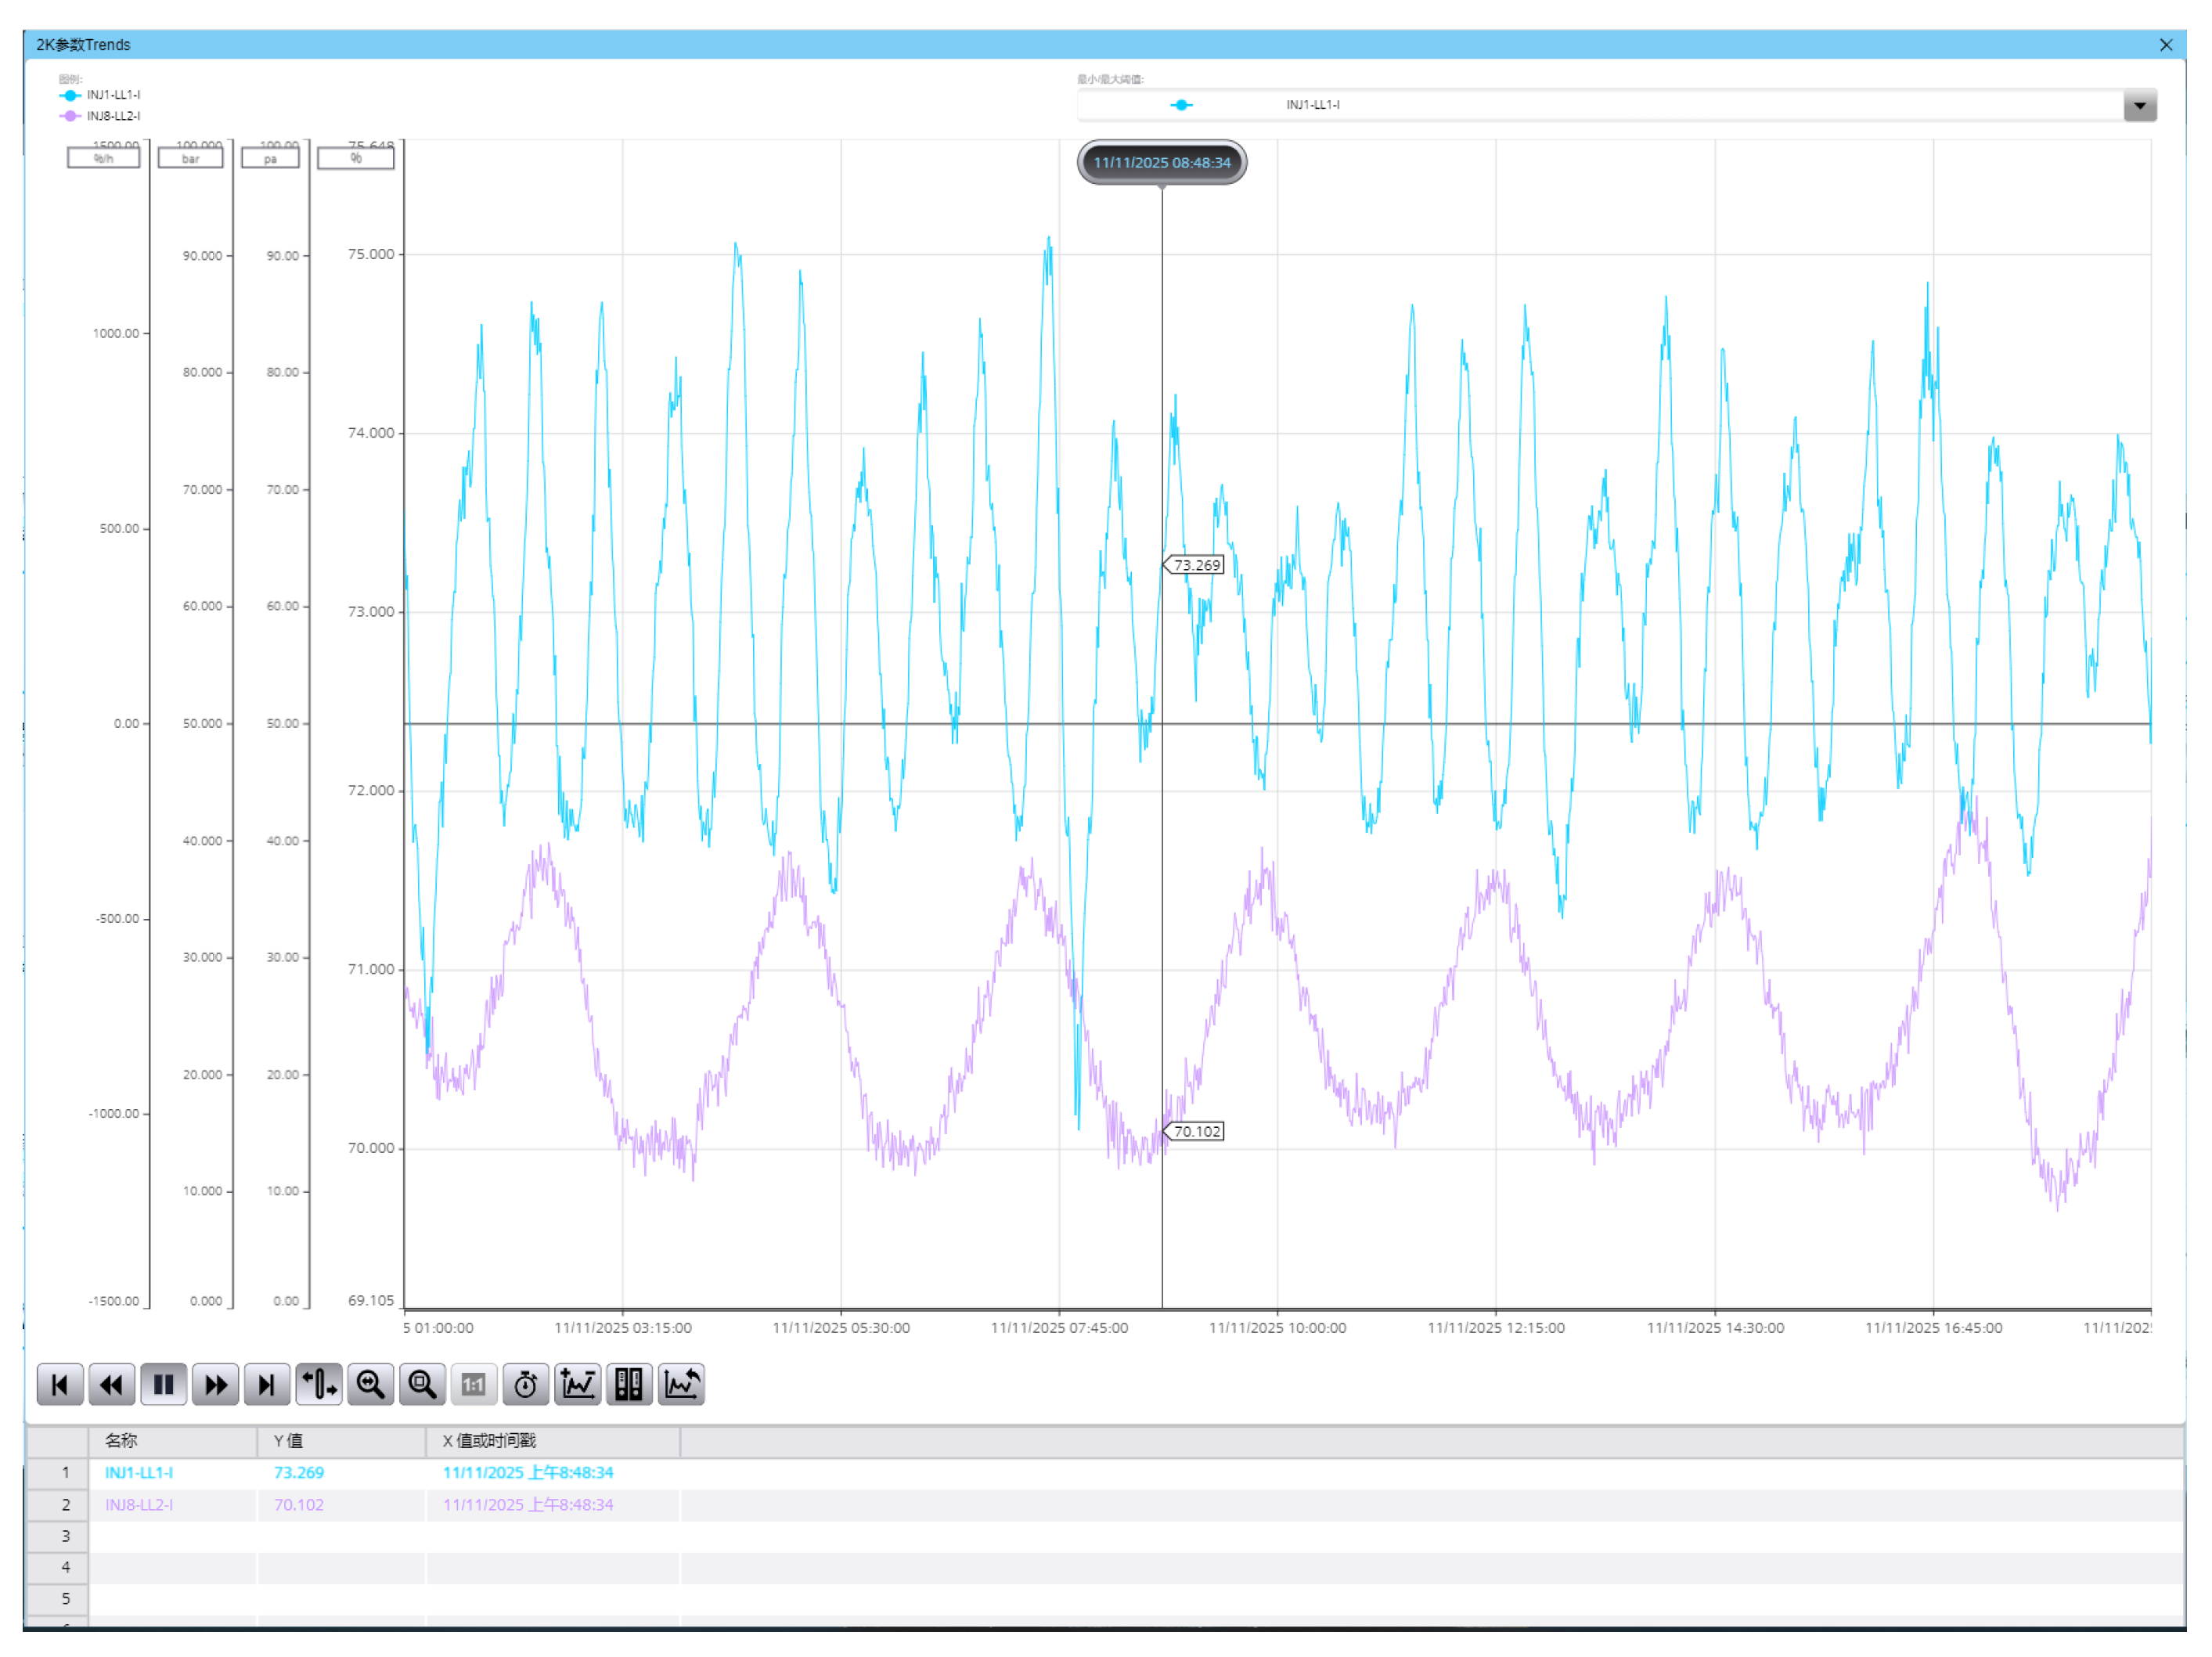
Figure 13.
Inject single-chamber and eight-chamber solid and cabinet layout diagrams.
Table 1.
Margin specifications.
| Parameter | Line | Pressure(bar) | Temperature(K) | Cooling Capacity(kW) | Flow Rate(g/s) |
|---|---|---|---|---|---|
| 2K Loop | A | 3 | 4.5 | 4kW@2K | 188 |
| B | 0.026 | 3.8 | |||
| Intermediate Shield Loop | C | 3 | 4.5 | 1.5kW4.52K | 37.2 |
| D | 2 | 8 | |||
| Thermal Shield Loop | E | 5.5 | 35 | 15kW@40K | 143.1 |
| F | 4.5 | 35 |
Table 2.
List of each subsystem for cryogenic control.
| Name | Location | PLC Quantity |
|---|---|---|
| VB80000 Injection Valve Box Control | Shaft 1 | 1 |
| VB81000 Distribution Valve Box Control | Shaft 1 | 1 |
| VB82000 Distribution Valve Box Control | Shaft 1 | 1 |
| VB83000 Distribution Valve Box Control | Shaft 2 | 1 |
| Interlock Control | Shaft 2 | 1 |
| Vacuum Liquid Nitrogen Control | Shaft 1 | 1 |
| Vacuum Liquid Nitrogen Control | Shaft 2 | 1 |
| Superconducting Module Control | Tunnel | 69 |
Disclaimer/Publisher’s Note: The statements, opinions and data contained in all publications are solely those of the individual author(s) and contributor(s) and not of MDPI and/or the editor(s). MDPI and/or the editor(s) disclaim responsibility for any injury to people or property resulting from any ideas, methods, instructions or products referred to in the content. |
© 2025 by the authors. Licensee MDPI, Basel, Switzerland. This article is an open access article distributed under the terms and conditions of the Creative Commons Attribution (CC BY) license (http://creativecommons.org/licenses/by/4.0/).
Copyright: This open access article is published under a Creative Commons CC BY 4.0 license, which permit the free download, distribution, and reuse, provided that the author and preprint are cited in any reuse.


