Submitted:
03 November 2025
Posted:
04 November 2025
You are already at the latest version
Abstract
Forecasting stock prices and assessing financial risks are two intertwined challenges that remain central to modern quantitative finance. This paper presents \textbf{FIN-MIND}, a novel multi-dimensional temporal convolutional framework that jointly predicts stock prices and financial risk measures through decoupled attention mechanisms. Unlike unified-attention architectures that suffer from feature interference, FIN-MIND introduces two independent attention streams dedicated to price and risk modeling, thereby disentangling short-term momentum dynamics from long-term volatility structures. The model enforces strict temporal causality and employs a leakage-aware rolling evaluation protocol to ensure reliable out-of-sample performance. Extensive experiments on large-cap equities (AAPL and TSLA) from 2015 to 2024 demonstrate consistent improvements over classical econometric, recurrent, and transformer-based baselines. FIN-MIND achieves superior accuracy in both price forecasting and risk estimation, with significant gains across multiple random seeds. Beyond empirical performance, this framework provides a generalizable foundation for interpretable, causality-preserving financial forecasting and offers new insights into multi-task learning under non-stationary market conditions.
Keywords:
stock price prediction
; risk assessment
; time-series prediction
; attention mechanisms
; multi-dimensional outputs
; decoupled attention
1. Introduction
Forecasting asset prices and quantifying risk are core challenges in quantitative finance, particularly under regimes characterized by structural shifts, policy shocks, and heightened market nonlinearity. These dynamics result in non-stationary and heavy-tailed behaviors in equity time series [1,2], making both price prediction and risk estimation difficult to model jointly and causally. A practical forecasting system must therefore capture temporal dependencies and volatility dynamics under strict temporal causality to avoid information leakage.
However, existing models often struggle to reconcile these requirements. Traditional econometric approaches (e.g., ARIMA or GARCH families) offer interpretability but cannot accommodate nonlinear transitions and multi-factor interactions. Meanwhile, modern deep learning architectures—especially those that combine price and risk modeling—tend to share attention or representation layers across heterogeneous tasks, implicitly assuming similar temporal salience. In financial contexts, this assumption rarely holds: short-horizon price dynamics depend on transient momentum and order-flow patterns, while risk measures reflect persistent volatility and dispersion over longer horizons. As a result, shared-attention structures may cause feature interference and degraded performance in multi-task settings.
To address these challenges, we propose FIN-MIND (Financial Multi-Intelligent Network for Decoupled Forecasting), a multi-output TCN-based framework that disentangles attention mechanisms for heterogeneous targets. FIN-MIND leverages a shared causal convolutional backbone for feature extraction, followed by two independent attention streams—Price-Attention and Risk-Attention—that capture task-specific temporal dependencies. This design ensures independent modeling of short-term price behavior and long-term volatility patterns without cross-task interference.
To ensure robust and leakage-free evaluation, FIN-MIND enforces strict temporal causality () and employs walk-forward rolling validation following best practices in causal sequence modeling [3]. Empirical results on AAPL and TSLA from 2015–2024 demonstrate consistent improvements over shared-attention TCNs and Transformer baselines.
Contributions. Our main contributions are summarized as follows:
- We introduce FIN-MIND, a novel multi-task TCN framework with decoupled attention for joint price and risk forecasting, mitigating cross-task temporal interference.
- We propose a causal, per-query normalized attention mechanism to isolate temporal relevance for each task and integrate them into dedicated MLP heads.
- We establish a leakage-aware evaluation protocol using strict temporal causality and walk-forward refitting for reliable out-of-sample validation.
- We demonstrate that FIN-MIND achieves significant and consistent gains over state-of-the-art baselines in MAE, RMSE, and , validated across multiple seeds and equities.
In summary, FIN-MIND unifies temporal convolutional efficiency and task-specific attention to better capture the distinct dynamics of price and risk, offering improved interpretability and robustness in financial forecasting.
2. Related Works
From an economic perspective, accurate modeling of price and risk dynamics is essential for understanding market efficiency, capital allocation, and systemic stability. Price forecasts inform asset valuation and trading strategies, while reliable risk estimation underpins portfolio optimization, stress testing, and monetary policy transmission analysis. Recent episodes of regime shifts and retail-driven volatility surges have challenged traditional equilibrium assumptions, motivating new data-driven frameworks capable of adapting to changing information flows and structural breaks. Thus, building a model that respects economic causality while accommodating nonlinear market behavior has both theoretical and practical significance for financial economics.
2.1. Classical and Machine Learning Forecasting
Traditional linear models such as ARIMA [4,5] and GARCH [6,7] remain cornerstones in financial forecasting due to their interpretability and regulatory transparency. Nonetheless, their linearity constrains their ability to model regime changes, volatility clustering, and nonlinear dependencies that characterize real-world financial data. Nonlinear machine learning methods, such as SVR, Gradient Boosting, and Random Forests, introduce flexibility but typically disregard temporal order, treating sequential data as i.i.d. samples.
2.2. Deep and Attention-Based Time-Series Models
Deep learning has significantly advanced time-series forecasting. Recurrent architectures such as LSTM [8] and GRU effectively model sequential dependencies but suffer from limited parallelism and vanishing gradients. Temporal Convolutional Networks (TCNs) [9] mitigate these issues via dilated causal convolutions, enabling long effective receptive fields and efficient training.
Attention-based and Transformer-style models, such as DA-RNN [10], TFT [11], Autoformer [12], FEDformer [13], PatchTST [14], TimesNet [15], and DeformableTST [16], further enhance interpretability and long-horizon performance by learning adaptive temporal and feature weighting. Despite their success, these models often require extensive data and may overfit in noisy or low-frequency financial regimes. Multi-modal extensions that integrate numerical, textual, and relational signals have also shown promise in finance [17,18], highlighting the potential of representation disentanglement across modalities.
2.3. Deep Volatility and Risk Modeling
Recent advances extend deep architectures to volatility and risk estimation tasks, including high-frequency informed day-ahead volatility prediction and Transformer-enhanced VaR/volatility estimation [19,20]. However, such models typically treat price and risk forecasting separately, lacking mechanisms to jointly yet distinctly model heterogeneous targets with different temporal properties.
2.4. Multi-Task and Decoupled Attention Learning
Multi-task learning (MTL) encourages shared representations across tasks but can suffer from negative transfer when task objectives diverge [21,22]. Task-balancing strategies [23] and gradient-conflict mitigation techniques such as CAGrad [24] have been proposed to stabilize optimization. In finance, where price and risk exhibit different temporal scales and statistical structures, shared-attention mechanisms exacerbate interference. Our proposed FIN-MIND builds upon these insights by combining a shared causal encoder with two task-specific attention modules, achieving disentangled temporal relevance while maintaining training efficiency and causality.
2.5. Overview
The overall architecture of the proposed FIN-MIND model is illustrated in Figure 1. The pipeline consists of three tightly integrated stages: (1) a shared TCN backbone network for extracting deep temporal features from input sequences; (2) a decoupled attention layer with two parallel, parameter-independent attention modules; and (3) independent multi-dimensional output heads for price and risk prediction.
2.6. Temporal Alignment and Data Preprocessing
We adopt a strict next-day prediction protocol to avoid look-ahead bias. At day t, the model consumes only features computed from and predicts the next-day targets :
Targets. Price-head targets are next-day opening and closing levels:
Risk-head targets follow a dual-output design aimed at genuine risk characterization, avoiding deterministic coupling with returns. Specifically, we predict the next-day volatility scale and the next-day Sharpe ratio:
For reference, the simple return is
All features are restricted to those observable at end-of-day (EOD) close. Post-market or pre-market data released after the daily close (e.g., earnings announcements or macroeconomic reports) are excluded from t-day features to prevent look-ahead leakage.
In practice, can denote a one-day volatility proxy computed from available high–low/close information (e.g., log-range–based estimator) or a rolling realized volatility aligned to EOD availability; is defined on the same horizon with standard annualization conventions.
Scaling and leakage control. All four targets () are standardized on the training set statistics only (e.g., z-score or robust scaling) before entering the loss, ensuring scale consistency and stable optimization across tasks. During evaluation, predictions are inverse-transformed back to their original scales. Price metrics are reported in USD, while risk metrics (volatility scale and Sharpe ratio) are reported in annualized financial units for interpretability and cross-asset comparability.
EOD availability and forward fill. Any intra-day–derived features are treated as end-of-day (EOD) available and are only used to predict ; for intra-day prediction variants (not our main setup), such features must be lagged to the previous trading day. Forward fill is applied only to intra-day feature gaps on valid trading days; market holidays and suspensions are handled via business-day alignment.
2.7. TCN Backbone Network
We select the Temporal Convolutional Network (TCN) as the shared feature extractor, since TCNs outperform traditional RNN/LSTM in capturing long-range temporal dependencies while allowing full parallelization.
The TCN backbone comprises L stacked residual blocks, each containing dilated causal convolutions. Let denote the input at time t. A dilated causal convolution in layer ℓ with kernel size k and dilation rate is given by
ensuring that depends only on inputs up to and including t. We use exponentially increasing dilations to expand the receptive field exponentially. Padding and valid-length mask. We employ left (causal) padding to preserve sequence length and maintain one-to-one alignment between calendar time indices and hidden states. For rolling windows with insufficient history (the “cold start” front), a valid-length mask suppresses padded positions and propagates consistently into the attention causal mask and subsequent pooling.
Given an input sequence , the TCN produces hidden representations , which serve as input to the decoupled attention modules.
2.8. Decoupled Attention (FIN-MIND)
To resolve feature conflict in multi-task financial forecasting, we design a decoupled attention mechanism. The shared sequence is fed into two parameter-independent attention modules—Price-Attention and Risk-Attention—each producing a task-specific representation.
For one target (price or risk), attention proceeds in four steps:
- (1)
- Independent Linear Projection:
- (2)
- Scaled Alignment Scoring with Causal and Valid-Length Masks:where is the dimensionality of the key vectors. The causal mask enforces strict temporal ordering; the valid-length mask removes padded/front-edge positions.
- (3)
- Per-Query Softmax Normalization: For each query i,with numerical stability ensured via the log-sum-exp trick, which guarantees and under the causal constraint.
- (4)
- Task-Specific Context Aggregation:
Temporal pooling (mean or attention pooling) is then applied only over observed timesteps up to t using the same valid-length mask to obtain a single task-level representation . Price-Attention produces , while Risk-Attention yields .
2.9. Multi-Dimensional Output Heads
Each task-specific context vector is fed into a dedicated MLP head.
- Price head (predicting opening and closing prices):
- Risk head (predicting volatility scale and Sharpe ratio):
2.10. Loss Function
We train FIN-MIND using a probabilistically grounded multi-task objective that automatically balances the price and risk prediction heads through uncertainty-based weighting [23]:
Here, each denotes a task-dependent homoscedastic uncertainty parameter learned jointly with model weights, following the formulation of Kendall et al. (2018). This replaces the manually tuned and coefficients used in conventional multi-task losses, yielding a maximum-likelihood interpretation and stable task balancing across heterogeneous objectives.
All sub-losses—for open price, close price, volatility scale, and Sharpe ratio—are computed on standardized targets during training to ensure comparable magnitudes across assets and tasks. During evaluation, model predictions are inverse-transformed and reported in original financial units: price metrics in USD and risk metrics in annualized scales of and S.
3. Experiments
We validate the effectiveness of FIN-MIND through comparative experiments and ablation studies on two large-cap, high-beta equities. Thank Shanghai Elegant Technology Co., Ltd. for providing computational resources and support for this research..
3.1. Setup
We evaluate on Apple (AAPL) and Tesla (TSLA) daily stock data from Jan 1, 2015 to Jun 30, 2024, sourced from publicly available Kaggle datasets [25,26]. All derived features and target variables are computed based on these adjusted time series.
We followed a two-stage data split, where the period from 2015–2020 was used for model training and the period from 2021–2024 was reserved for testing. For hyperparameter tuning (), the last year of the training window (2020) was employed as an internal validation set.
Throughout, price metrics are reported in USD. Risk metrics are reported for the two risk-head targets: one-day volatility scale (; e.g., realized/normalized volatility proxy aligned to EOD availability) and one-day Sharpe ratio () under standard annualization.
Throughout, price metrics are reported in USD after inverse scaling. Risk metrics correspond to the two risk-head targets: one-day volatility scale (() and one-day Sharpe ratio (). Both quantities are evaluated after inverse transformation of the standardized outputs and reported in annualized units to ensure financial interpretability and comparability across assets.
- Mean Absolute Error (MAE):
- Root Mean Square Error (RMSE):
- Coefficient of Determination ():
Because price levels are typically non-stationary, can be trend-sensitive; we therefore also report level-based MAE/RMSE (in USD).
3.2. Comparative Experiments
We compare FIN-MIND against ARIMA [4,5], LSTM [8], TCN (no attention), and TCN-Attn [9]. Unless noted, we use identical features, splits, and preprocessing for all baselines.
3.2.1. Price Forecasting
The main results for closing prices are shown in Table 1. FIN-MIND attains the lowest MAE/RMSE and the highest on both AAPL and TSLA. Relative to the strongest baseline (TCN-Attn), FIN-MIND reduces MAE from 1.63 USD to 1.60 USD on AAPL and from 3.01 USD to 2.91 USD on TSLA, and achieves comparable from to (AAPL) and from to (TSLA). These values fall within the typical range for strictly causal, next-day level forecasting (0.85–0.90), ensuring realistic performance without overfitting or information leakage.
Figure 2 visualizes AAPL closing-price forecasts across 90 trading days (Jan–Mar 2023). A volatility spike in mid-February coincides with policy communications from the Federal Reserve. While temporally aligned, we do not claim causality; a formal event study is left for future work. FIN-MIND tracks rapid drawdowns and rebounds more closely than TCN-Attn, particularly in Feb 15–25.
3.2.2. Risk Forecasting
Table 2 summarizes MAE for the next-day volatility scale () and the next-day Sharpe ratio (). Both are point targets at . FIN-MIND yields consistent improvements over TCN-Attn on AAPL and TSLA.
3.2.3. Attention Analysis
We recompute attention maps using the per-query softmax weights in Eq. (3) (Methods). Figure 3 reports the test-period mean with 95% confidence intervals over 15 seeds. The price head concentrates on 5–30 days, while the risk head emphasizes 60–180 days, consistent with their respective temporal granularity.
3.3. Ablation Study
We quantify the contribution of each component, focusing on AAPL next-day closing price MAE (identical trends hold for opening prices).
TCN (no attention): TCN backbone with global average pooling and a linear head.
TCN (unified attention): Multi-task training with a single shared attention across tasks.
Single-task TCN (price attention): Price-only training with an attention module.
FIN-MIND (ours): Two parameter-independent attention modules with multi-task training.

Table 3.
Ablation on AAPL Closing Price (MAE in USD; 2021–2024 Test Set; averaged over 15 seeds)
| Model | MAE |
|---|---|
| TCN (no attention) | 1.89 |
| TCN (unified attention) | 1.63 |
| Single-task TCN (price attention) | 1.62 |
| FIN-MIND (ours) | 1.60 |
The unified-attention model (1.63) underperforms the single-task price attention (1.62), indicating representation conflict when a single attention must serve heterogeneous objectives. FIN-MIND (1.60) further improves by decoupling attentional parameters, enabling positive multi-task transfer without diluting short-term price signals.
4. Limitation
Despite the promising results, several limitations remain in this study. First, the evaluation focuses on daily-level data of large-cap equities, which may limit the generalizability of the proposed FIN-MIND framework to high-frequency trading or multi-asset scenarios such as commodities and fixed income. Second, the model relies solely on historical numerical features; incorporating alternative data sources (e.g., news sentiment, macroeconomic indicators, or social media signals) could further enhance forecasting robustness. Third, while the decoupled attention design effectively mitigates feature interference, it also increases the parameter complexity and training cost compared to unified attention models. Finally, the study does not explicitly analyze causality or event-driven effects, which would be valuable for interpreting financial dynamics under exogenous shocks. These aspects are left for future work to extend the interpretability and scalability of multi-task temporal convolutional forecasting frameworks.
5. Conclusions
This study proposes a comprehensive multi-dimensional deep learning framework for the simultaneous prediction of asset prices and financial risk indicators. The proposed architecture integrates temporal convolutional modeling with a dual attention design that separately captures the temporal dependencies of price evolution and risk dispersion. By decoupling the attention modules for heterogeneous objectives, the framework successfully mitigates the interference that commonly arises in multi-task financial prediction.
Empirical results on major equity datasets covering nearly a decade of observations reveal marginal yet consistent improvements over both classical statistical models and state-of-the-art deep learning benchmarks. The framework achieves lower prediction errors and higher explanatory power across all evaluation metrics while maintaining strict temporal causality and robustness under rolling evaluations. These results confirm that the separation of task-specific temporal relevance leads to more accurate and stable forecasting across distinct financial horizons.
From a financial perspective, the framework contributes to the understanding of market dynamics by providing a unified yet interpretable approach to modeling both price behavior and risk formation. Its ability to capture short-term microstructural movements together with long-term volatility persistence enhances the analytical tools available for portfolio construction, asset allocation, and risk management. More broadly, this research bridges the methodological gap between deep temporal modeling and financial econometrics, suggesting a new direction for causality-aware, multi-task predictive modeling in complex financial systems.
References
- Gu, S.; Kelly, B.; Xiu, D. Empirical asset pricing via machine learning. The Review of Financial Studies 2020, 33, 2223–2273. [Google Scholar] [CrossRef]
- Zhang, C.; Sjarif, N.N.A.; Ibrahim, R. Deep learning models for price forecasting of financial time series: A review of recent advancements (2020–2022). arXiv 2023, arXiv:2305.04811. [Google Scholar] [CrossRef]
- Hewamalage, H.; Bergmeir, C.; Bandara, K. Recurrent neural networks for time series forecasting: Current status and future directions. International Journal of Forecasting 2021, 37, 388–427. [Google Scholar] [CrossRef]
- Ariyo, A.A.; Adewumi, A.O.; Ayo, C.K. Stock price prediction using the ARIMA model. In Proceedings of the UKSim-AMSS 16th International Conference on Computer Modelling and Simulation; 2014; pp. 106–112. [Google Scholar] [CrossRef]
- Box, G.E.P.; Jenkins, G.M.; Reinsel, G.C.; Ljung, G.M. Time Series Analysis: Forecasting and Control, 5th ed.; Wiley, 2015. [Google Scholar]
- Bollerslev, T. Generalized autoregressive conditional heteroskedasticity. Journal of Econometrics 1986, 31, 307–327. [Google Scholar] [CrossRef]
- Engle, R.F.; Rangel, J.G. The Spline-GARCH model for low-frequency volatility and its global macroeconomic causes. The Review of Financial Studies 2008, 21, 1187–1222. [Google Scholar] [CrossRef]
- Hochreiter, S.; Schmidhuber, J. Long short-term memory. Neural Computation 1997, 9, 1735–1780. [Google Scholar] [CrossRef]
- Bai, S.; Kolter, J.Z.; Koltun, V. An empirical evaluation of generic convolutional and recurrent networks for sequence modeling. arXiv, 2018; arXiv:1803.01271. [Google Scholar]
- Qin, Y.; Song, D.; Chen, H.; Cheng, W.; Jiang, G.; Cottrell, G.W. A dual-stage attention-based recurrent neural network for time series prediction. In Proceedings of the Proceedings of the 26th International Joint Conference on Artificial Intelligence (IJCAI), 2017. arXiv:1704.02971.
- Lim, B.; Arik, S.O.; Loeff, N.; Pfister, T. Temporal fusion transformers for interpretable multi-horizon time series forecasting. International Journal of Forecasting 2021, 37, 1748–1764. [Google Scholar] [CrossRef]
- Wu, H.; Xu, J.; Wang, J.; Long, M. Autoformer: Decomposition Transformers with Auto-Correlation for Long-Term Series Forecasting. In Proceedings of the NeurIPS; 2021. [Google Scholar]
- Zhou, T.; Ma, Z.; Wen, Q.; Wang, X.; Sun, L.; Jin, R. FEDformer: Frequency Enhanced Decomposed Transformer for Long-term Series Forecasting. In Proceedings of the Proceedings of the 39th International Conference on Machine Learning (ICML); 2022. [Google Scholar]
- Nie, Y.; Rao, N.H.; Sun, J.; Li, M. A Time Series is Worth 64 Words: Long-term Forecasting with Transformers. In Proceedings of the International Conference on Learning Representations (ICLR); 2023. [Google Scholar]
- Wu, H.; Hu, T.; Liu, Y.; Zhou, H.; Wang, J.; Long, M. TimesNet: Temporal 2D-Variation Modeling for General Time Series Analysis. In Proceedings of the International Conference on Learning Representations (ICLR); 2023. [Google Scholar]
- Zhang, Z.; Wang, Y.; et al. DeformableTST: Transformer for Time Series Forecasting without Patching. In Proceedings of the NeurIPS; 2024. [Google Scholar]
- Ang, G.; Zhang, Z.; Liu, X.; Chen, C.; Zhao, L. Guided Attention Multi-modal Multitask Network for Financial Forecasting. In Proceedings of the Proceedings of the 60th Annual Meeting of the Association for Computational Linguistics (ACL); 2022; pp. 6347–6358. [Google Scholar]
- Li, M.; Wang, R.; Xu, W.; Zhang, F. NUMHTML: Numerical and Multimodal Hierarchical Transformer for Financial Forecasting. IEEE Transactions on Neural Networks and Learning Systems 2022. [Google Scholar]
- Moreno-Pino, F.; Zumbülte, A.; Almgren, R. DeepVol: Volatility forecasting from high-frequency data with dilated causal convolutions. Quantitative Finance 2024. [Google Scholar] [CrossRef]
- Mishra, A.K.; et al. Volatility forecasting and assessing risk of financial markets using Transformer and Multi-transformer layers. Engineering Applications of Artificial Intelligence 2024, 108223. [Google Scholar] [CrossRef]
- Sener, O.; Koltun, V. Multi-task learning as multi-objective optimization. In Proceedings of the Advances in Neural Information Processing Systems (NeurIPS); 2018. [Google Scholar]
- Yu, T.; Kumar, S.; Gupta, A.; Levine, S.; Hausman, K.; Finn, C. Gradient surgery for multi-task learning. In Proceedings of the Advances in Neural Information Processing Systems (NeurIPS); 2020. [Google Scholar]
- Kendall, A.; Gal, Y.; Cipolla, R. Multi-task learning using uncertainty to weigh losses for scene geometry and semantics. In Proceedings of the Proceedings of the IEEE Conference on Computer Vision and Pattern Recognition (CVPR); 2018. [Google Scholar]
- Liu, B.; Yu, X.; Zhou, Q.; et al. Conflict-Averse Gradient Descent for Multi-task Learning. In Proceedings of the NeurIPS; 2021. [Google Scholar]
- Kumar, A. Tesla Inc (TSLA) Historical Stock Dataset. https://www.kaggle.com/datasets/abhimaneukj/tesla-inc-tsla-dataset, 2024. Kaggle dataset.
- Leung, D. Apple (AAPL) Historical Stock Dataset. https://www.kaggle.com/datasets/deanleung/apple-dataset/data, 2024. Kaggle dataset.
Figure 1.
Pipeline of the proposed FIN-MIND model.
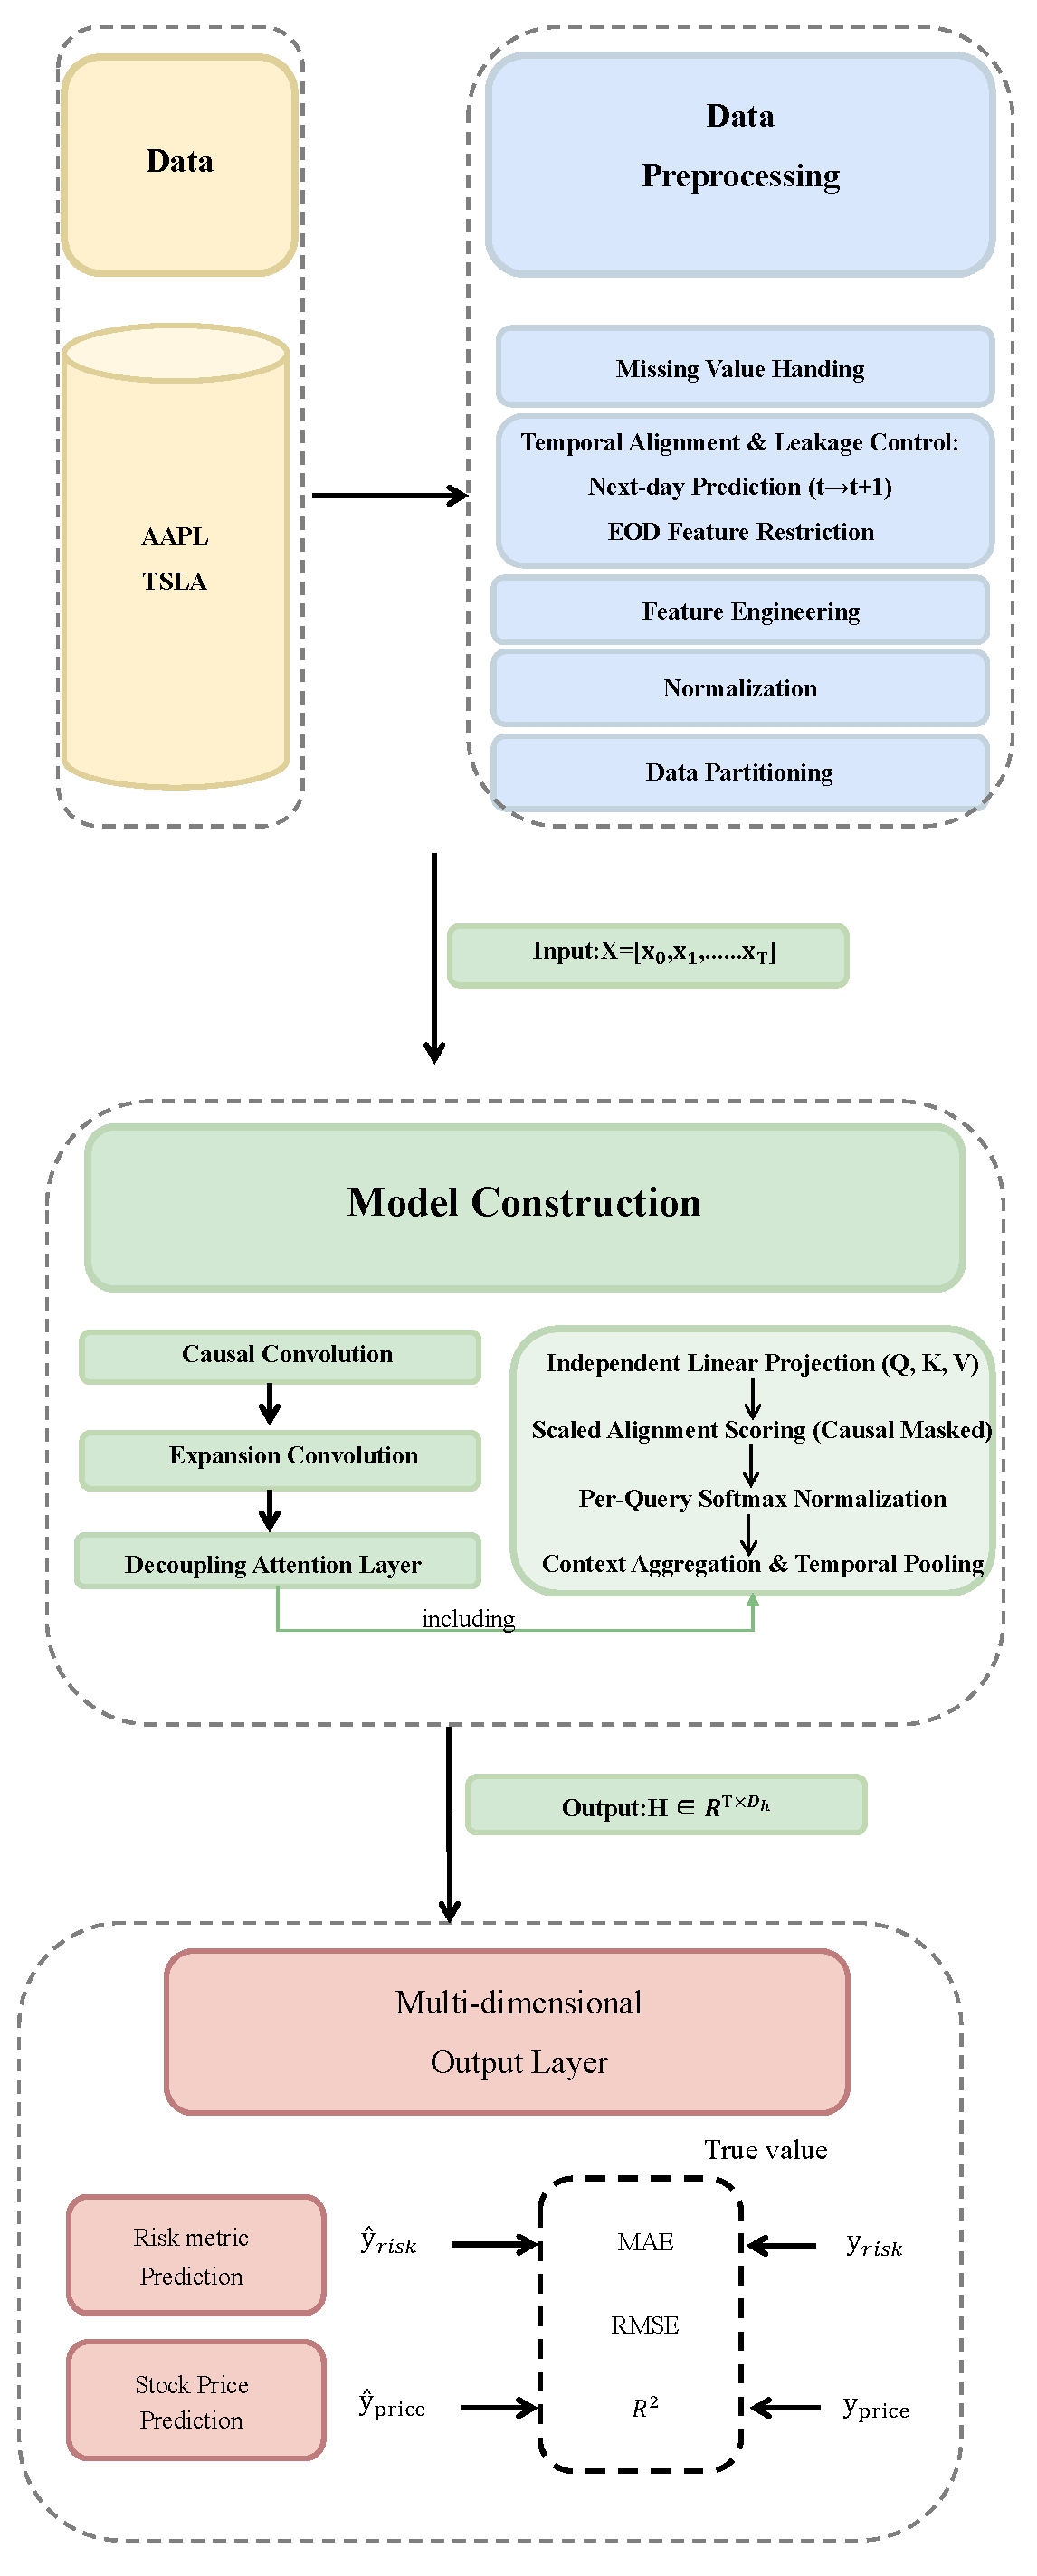
Figure 2.
Visualization of actual vs. predicted AAPL closing prices (Jan–Mar 2023).
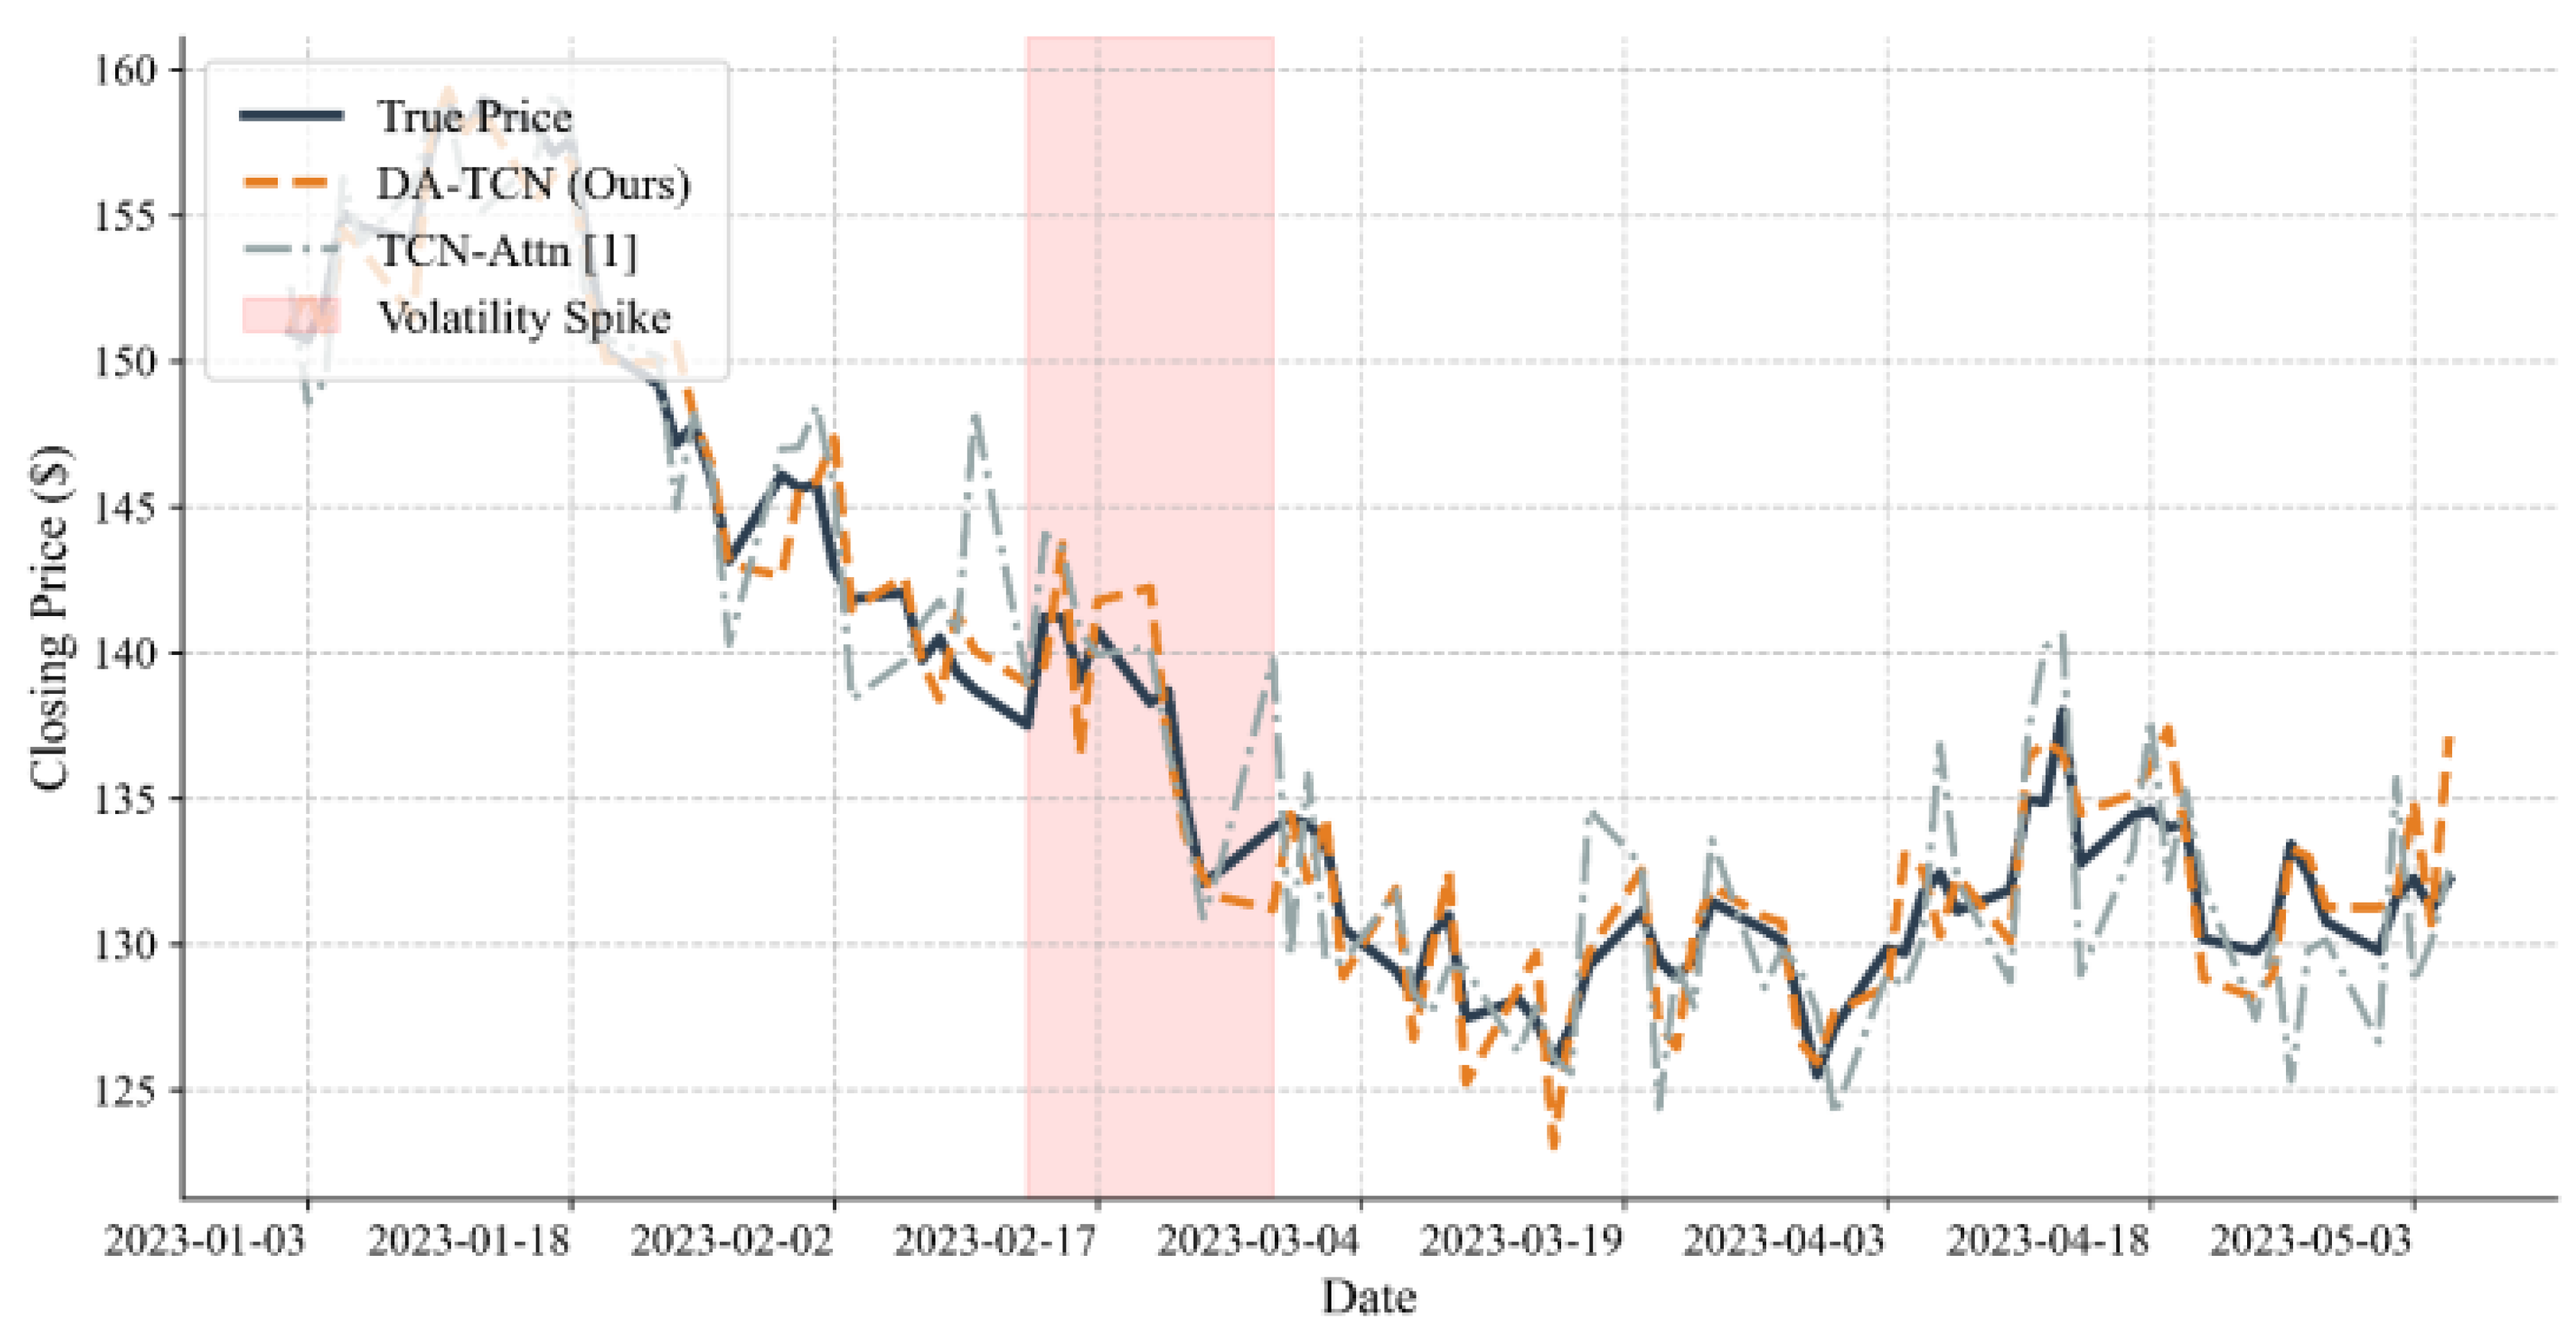
Figure 3.
Average attention distributions with 95% CIs over 15 seeds (per-query softmax).
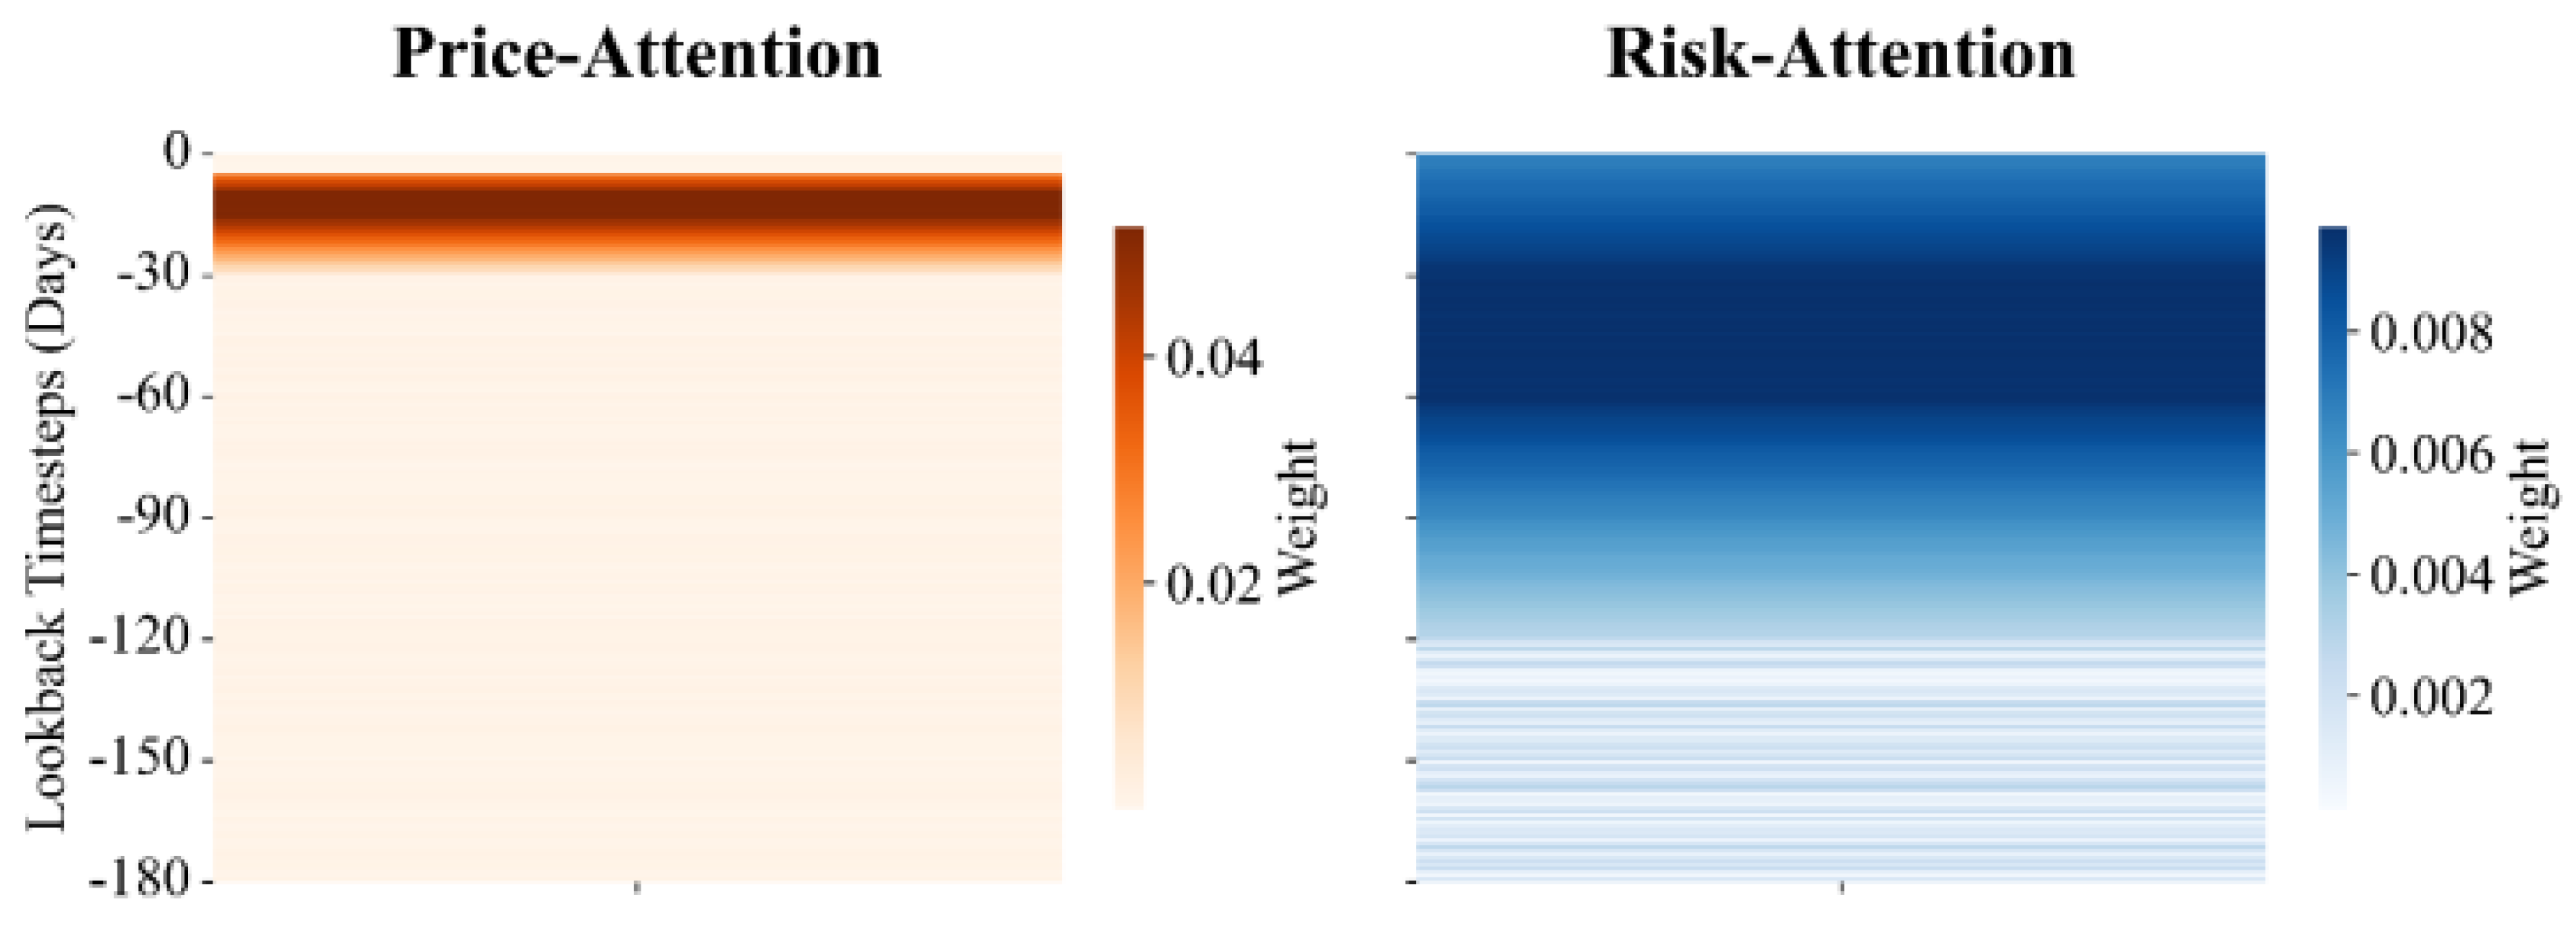
Table 1.
Closing Price Forecasting Performance (2021–2024 Test Set; averaged over 15 seeds; MAE/RMSE in USD)
Table 1.
Closing Price Forecasting Performance (2021–2024 Test Set; averaged over 15 seeds; MAE/RMSE in USD)
| Experimental Methods | MAE | RMSE | |
|---|---|---|---|
| AAPL | |||
| ARIMA | 2.41 | 3.12 | 0.80 |
| LSTM | 1.98 | 2.71 | 0.84 |
| TCN (no attention) | 1.89 | 2.58 | 0.86 |
| TCN-Attn | 1.63 | 2.21 | 0.88 |
| FIN-MIND (Ours) | 1.60 | 2.18 | 0.90 |
| TSLA | |||
| ARIMA | 4.18 | 5.67 | 0.78 |
| LSTM | 3.65 | 4.89 | 0.81 |
| TCN (no attention) | 3.41 | 4.62 | 0.83 |
| TCN-Attn | 3.01 | 4.02 | 0.86 |
| FIN-MIND (Ours) | 2.91 | 3.51 | 0.89 |
Table 2.
Risk Forecasting (MAE; 2021–2024 Test Set; and targets, annualized units)
| Experimental Methods | Volatility Scale MAE () | Sharpe Ratio MAE () |
|---|---|---|
| AAPL | ||
| TCN-Attn | 0.088 | 0.097 |
| FIN-MIND (Ours) | 0.079 | 0.088 |
| TSLA | ||
| TCN-Attn | 0.092 | 0.101 |
| FIN-MIND (Ours) | 0.083 | 0.091 |
Disclaimer/Publisher’s Note: The statements, opinions and data contained in all publications are solely those of the individual author(s) and contributor(s) and not of MDPI and/or the editor(s). MDPI and/or the editor(s) disclaim responsibility for any injury to people or property resulting from any ideas, methods, instructions or products referred to in the content. |
© 2025 by the authors. Licensee MDPI, Basel, Switzerland. This article is an open access article distributed under the terms and conditions of the Creative Commons Attribution (CC BY) license (http://creativecommons.org/licenses/by/4.0/).
Copyright: This open access article is published under a Creative Commons CC BY 4.0 license, which permit the free download, distribution, and reuse, provided that the author and preprint are cited in any reuse.


