Submitted:
22 April 2025
Posted:
23 April 2025
You are already at the latest version
Abstract
Due to the high volatility of financial markets and the prevalence of financial fraud, real-time stock market forecasting for listed companies remains a challenging task. To address these challenges, this study proposes TCNAttention-RAG, a hybrid deep learning framework integrating Temporal Convolutional Network (TCN), Multi-Layer Perceptron (MLP), Attention Mechanism, and Retrieval-Augmented Generation (RAG) for enhanced stock price forecasting. The model leverages TCN for temporal feature extraction, MLP for nonlinear representation, and Attention for feature weighting, while RAG dynamically retrieves key financial insights from corporate reports to improve predictive accuracy. Using NASDAQ-listed stock price data (2014–2020), combined with corporate financial reports, market transaction data, and macroeconomic indicators, a multi-dimensional dataset is constructed. Experimental results demonstrate that TCNAttention-RAG outperforms traditional models in accuracy and recall, effectively capturing stock price fluctuations. Despite its limitations in handling extreme market events, the model exhibits high reliability and predictive robustness. This study introduces a multi-modal data-driven approach to financial forecasting, offering insights into intelligent financial analysis and enhancing decision-making in volatile markets.
Keywords:
Stock Prediction
; TCN
; MLP
; Attention Mechanism
; RAG
1. Introduction
The stock market plays a pivotal role in the global financial system, with the New York stock exchange serving as a hub for technology and financial enterprises. Stock prices fluctuate in response to macroeconomic policies, corporate financial performance, and investor sentiment, creating substantial forecasting challenges due to the market’s inherent volatility and nonlinear dynamics.
Accurate stock price prediction is critical for investors, corporate managers, and financial institutions. Investors rely on predictive models to optimize trading strategies and mitigate risks, while financial institutions leverage forecasts for portfolio management. However, conventional time-series models struggle with the complexity of stock price movements, failing to effectively capture nonlinear dependencies and external financial influences. Financial fraud, such as misrepresentation of company performance or concealment of financial risks in corporate reports, can severely distort market information, mislead investors, and impact stock prices. Traditional financial analysis methods often fail to effectively identify these fraudulent activities, increasing investment risks.
To address these limitations, this study proposes TCNAttention-RAG, a hybrid deep learning framework that integrates Temporal Convolutional Networks (TCN) for time-series feature extraction, Multilayer Perceptron (MLP) for nonlinear representation, and Attention Mechanism for dynamic feature weighting. Additionally, Retrieval-Augmented Generation (RAG) is incorporated to enhance financial report analysis by retrieving and synthesizing key textual information, thereby enriching the model’s predictive insights.
Using historical stock price data (2014–2020) from New York stock exchange-listed companies, along with corporate financial reports, market transaction data, and macroeconomic indicators, this study constructs a multi-dimensional dataset to improve predictive accuracy. Experimental results confirm that TCNAttention-RAG surpasses traditional forecasting models across key performance metrics. By integrating structured financial indicators with unstructured text from financial disclosures, this research contributes a novel approach to stock prediction and intelligent financial analytics.
2. Literature Review
Stock price prediction has been extensively studied using machine learning and deep learning techniques. Prior research can be categorized into three main areas: traditional machine learning approaches, deep learning models, and retrieval-augmented methods for financial text analysis.
2.1. Traditional Machine Learning Approaches
Early studies leveraged classical machine learning models such as Support Vector Machines (SVM), Random Forest (RF), and LASSO regression to predict stock prices. Mintarya et al. [1] reviewed 30 studies on machine learning in stock market prediction, concluding that while neural networks were predominant, SVM and RF also demonstrated effectiveness in specific market conditions. Gao et al. [3] further explored feature selection techniques like LASSO and Principal Component Analysis (PCA), demonstrating that LASSO-based models outperformed PCA in reducing dimensionality while preserving predictive accuracy. However, these methods often struggled with nonlinear market dynamics and failed to incorporate unstructured financial data.
2.2. Deep Learning-Based Stock Prediction
The introduction of Recurrent Neural Networks (RNNs) and Long Short-Term Memory (LSTM) networks significantly enhanced stock prediction by capturing temporal dependencies. Lu et al. [2] proposed a CNN-BiLSTM-Attention (AM) model, where CNN extracted data features, BiLSTM processed sequential dependencies, and attention mechanisms emphasized critical historical patterns. Their model achieved superior performance in terms of Mean Absolute Error (MAE) and Root Mean Square Error (RMSE), demonstrating its effectiveness in complex time-series forecasting.
Recent research has explored advanced architectures such as Temporal Convolutional Networks. Wan et al. [4] developed a Multivariate TCN for financial time-series forecasting, proving its ability to handle multivariate interactions effectively. Similarly, Dudukcu et al. [5] combined TCN with RNNs to enhance chaotic time-series predictions, providing a methodological reference for capturing nonlinear and uncertain market fluctuations.
Feature engineering and hybrid models have also gained traction. Yun et al. [6] proposed a GA-XGBoost framework with an enhanced feature selection process, achieving improved accuracy by identifying optimal input variables. Meanwhile, Hu et al. [7] surveyed deep learning applications in financial forecasting, concluding that LSTM combined with reinforcement learning exhibited strong potential in adaptive financial modeling.
2.3. Retrieval-Augmented Approaches for Financial Analysis
The integration of text-based financial data into predictive models has been an emerging research direction. Zhang et al. [8] introduced a CoATSMP model, which adaptively fused numerical stock data with textual financial reports using attention-based fusion techniques. Their results highlighted that models incorporating both structured price data and textual financial insights outperformed traditional price-only models, with textual sentiment playing a crucial role in market movement predictions.
Further, Retrieval-Augmented Generation has been explored for financial text processing. Cuconasu et al. [9] demonstrated how RAG can enhance knowledge retrieval by extracting key financial insights from large-scale documents. Their research underscored the advantage of integrating domain-specific retrieval into deep learning models, significantly improving the interpretability of financial predictions. Fan et al. [10] investigated Parallel Spatio-Temporal Attention-based TCN, further extending the capabilities of retrieval-enhanced forecasting systems.
Building upon these prior works, this study integrates TCN, MLP, and attention mechanisms with RAG-based financial report retrieval to improve stock price prediction. By combining structured financial indicators with unstructured textual insights, our model aims to enhance predictive accuracy and interpretability, addressing limitations in existing methods.
3. Data Introduction
To construct a robust predictive framework, this study utilizes structured financial data and unstructured financial reports, integrating multiple data sources to enhance stock price forecasting.
3.1. Corporate Financial Report Data
We employ the New York stock exchange Financial Fundamentals dataset, which provides quarterly financial statements for New York stock exchange-listed firms from 2014 to 2020. This dataset includes key financial indicators such as revenue, earnings per share (EPS), debt-to-equity ratio, and net income, offering a comprehensive perspective on corporate financial performance. Each entry is timestamped, allowing the model to analyze temporal financial trends.
3.2. Stock Data
The AXA stock trading dataset (2014–2020) contains key market variables, including opening price, closing price, highest and lowest prices, and trading volume, providing insights into market dynamics. To ensure data integrity, this study applies the Three-Sigma Rule to eliminate outliers and mean imputation to handle missing values, preserving data consistency while maintaining model stability.
To extract meaningful patterns, this study incorporates 30-day moving averages to smooth short-term fluctuations and highlight long-term trends, while log returns are computed to capture relative price changes. Correlation analysis is performed to identify features strongly associated with closing prices, reducing noise and enhancing feature selection. To improve computational efficiency and mitigate overfitting risks, Principal Component Analysis (PCA) is applied for dimensionality reduction, ensuring an optimized feature set for stock price prediction.
3.3. Visualization of Stock Trends
Figure 1 illustrates the stock price trends of AXA from 2014 to 2020, reflecting the dynamic changes in the company’s stock price over time. The chart highlights the volatility patterns of the stock price, which may be attributed to factors such as seasonal market fluctuations, corporate performance, macroeconomic conditions, and shifts in investor sentiment. By analyzing this chart, we can gain a comprehensive understanding of the overall trajectory of AXA’s stock price during this period, offering valuable insights for market trend analysis and informed investment decision-making.
Figure 2 displays the closing prices and 30-day moving average of a target asset from 2014 to 2020. The blue curve represents daily closing prices, while the orange curve indicates the 30-day moving average, which smooths short-term fluctuations to highlight long-term price trends. During this period, closing prices fluctuated within a range of 16 to 28, peaking in mid-2015 before gradually declining, with the moving average lagging in reflecting trend shifts. These fluctuations may be linked to market cyclical adjustments, changes in corporate earnings, or macroeconomic policies (e.g., interest rate adjustments). By comparing the two curves, price breakout or pullback signals can be identified, such as the moving average acting as support or resistance levels. This analysis provides investors with quantitative insights into historical price patterns, risk assessment, and trading strategy formulation, while underscoring the utility of technical indicators in trend forecasting.
4. TCNAttention-RAG Model
The core module of this study is based on the TCNAttention-RAG framework, with the goal of predicting the stock prices of New York stock exchange AXA listed companies from 2014 to 2020. It combines structured financial indicators with multimodal data from unstructured financial report texts for analysis.
The TCNAttention-RAG model architecture mainly consists of the following three parts. Figure 3 shows the structural framework of this model.
4.1. Time Convolutional Network (TCN)
The TCN component serves as the primary temporal feature extractor, using dilated causal convolution to process sequence data. The TCN structure contains multiple convolutional blocks with exponentially increasing dilation rates [10]. For a given input sequence , the TCN operation can be expressed as , where represents the dilated convolution filter and is the activation function. The dilation factor grows exponentially with the network depth as (for the -th layer). This exponential dilation enables the effective receptive field to grow exponentially with network depth while maintaining computational efficiency of the model. Figure 4 illustrates the structure of TCN.
Figure 4 illustrates the structure of TCN. Figure (a) is an illustrative chart of a typical TCN layer. The 4 rows represent the input sequences being processed by dilated causal convolution layers at different dilation rates. The d = x means the X-step convolution, with d = 1 represents the standard 1-step convolution (looking at immediate past) and d = 2 represents skipping every other step (seeing input from 2 times steps apart) and so on and so forth. The top row represented by Y1 to Yt represent the final layer, a composite of all previous layers, which captures long-range dependencies.
Figure (b) illustrates the structure of the TCN. It demonstrates the TCN residual block and how the model processes time-series data at each layer. Each layer starts from the bottom with dilated causal convolution, which applies filters that only use past data to present causality. This layer uses dilation to skip inputs at regular intervals (as illustrated by Figure(a)), allowing the model to learn long-range dependencies without deeper stacks. The second layer is the weight normalization layer, which helps to stabilize training by reparametrizing the weights of different features. Doing so leads to faster convergence and more consistent outputs which is particularly crucial in deep networks. This is followed by the third layer of non-linear ReLU (Rectified Linear Unit) activation, which introduces non-linearity to help the network model complex patterns by only keeping positive values, improving model sparsity and speed. The final layer is the dropout layer which randomly disables neurons to help the model generalize better on unseen data, which is essential for volatile domains like stock prices. Following the 4 steps, the model undergoes a process called residual connection, as illustrated by the arrows connecting dropout layer to the next. Residual connection allows the network to preserve information from earlier layers and improves gradient flow and prevents issues like vanishing gradients in deep networks. The 1x1 convolution represented by the standalone green box on the right is used to project the output to the desired dimensionality and helps align the dimensions between input and output when necessary for residual addition.
Overall, the TCN design in this model ensures a large receptive field and stable gradient flow, making it particularly well-suited for modeling non-stationary patterns in financial time series, such as stock price fluctuations and trend shifts.
4.2. Attention Mechanism
The attention mechanism enhances the model’s ability to focus on relevant temporal patterns by assigning different weights to different time steps. The attention weights are calculated as , where represents the hidden state at time t, W is a learnable weight matrix, v is the context vector, and b is the bias term. The final context vector c is calculated as .
The complete forward propagation of the model can be expressed as:
where represents the final output layer that generates price predictions.
4.3. RAG Enhanced Processing and Querying of Financial Report Text
In addition, the Retrieval Augmented Generation technology is introduced to extract key paragraphs (such as “Management Discussion and Analysis” and “Risk Factors”) from AXA’s annual financial reports (such as 10-K and 10-Q reports) and construct a domain knowledge base. By pre training language models (such as BERT) to semantically encode text, generate context relevant vector representations, and combine similarity retrieval to match historical text fragments, qualitative information that is not explicitly included in structured data (such as financial report information, strategic adjustments, policy impacts) is supplemented, thereby enhancing the explanatory power and predictive robustness of the model.
5. Model Results Analysis
5.1. Analysis of Model Comparison Results
The integration of Retrieval-Augmented Generation significantly enhances the model’s ability to acquire domain-specific financial knowledge, thereby improving its capacity for financial data analysis and stock price prediction. Specifically, RAG enables a financial report information retrieval module, which dynamically integrates structured financial indicators (e.g., revenue, earnings per share (EPS), debt-to-equity ratio) with unstructured textual data (e.g., Management Discussion and Analysis (MD&A), company announcements). This hybrid approach allows the model to retrieve and incorporate relevant financial insights, reducing prediction errors caused by knowledge limitations [11].
Experimental results confirm that RAG consistently improves prediction accuracy and recall rates across various model configurations, reinforcing its essential role in financial forecasting. By enhancing the model’s comprehension of financial reports, RAG reduces predictive uncertainty and provides a robust foundation for stock price forecasting models.
Table 1 summarizes the experimental results of different model configurations, comparing the accuracy and recall rates among baseline models (gpt-3.5-turbo and gpt-4.0) and their RAG-enhanced variants, highlighting the significant performance improvements achieved through RAG technology integration.
5.2. Model Prediction Results
This study conducts an in-depth analysis of the performance of the TCNAttention-RAG model in the task of predicting the stock prices of AXA in the New York stock exchange market from 2014 to 2020. Through a comprehensive examination of visual representations and quantitative evaluation metrics, the robustness and predictive capabilities of the model under different market conditions are validated.
Figure 5 results illustrates the model’s effectiveness in capturing both macro-level trends and micro-level price movements. Particularly noteworthy is the model’s ability to track the complex price dynamics across different temporal phases of the test period. In the initial phase (0-20 time steps), the model accurately captures the downward trend, demonstrating its capability to identify and replicate clear directional movements. During the middle period (20-40 time steps), where prices showed relative stability, the model maintains consistent prediction accuracy with minimal deviation from actual values.
A significant strength of the model becomes apparent in its handling of the more volatile later period (40-60 time steps). During this phase, characterized by upward price movements and increased volatility, the model successfully tracks the general trend while maintaining reasonable prediction accuracy. The predicted values closely follow the actual price trajectory, though with some smoothing of extreme fluctuations, suggesting a balanced approach to volatility handling.
Figure 6 shows the prediction results of the stock price of AXA (2014-2020), a New York stock exchange listed company, based on the TCN-MLP Attention RAG framework. The blue curve in the figure represents the actual stock price trend, while the orange and green curves represent the predicted values of the model on the training and testing sets, respectively. The horizontal axis represents the time series (0-1400 units), and the vertical axis represents the stock price range (16-28 US dollars). The experimental results show that the predicted curve of the model is highly consistent with the actual price, especially during the fluctuation cycle from 2017 to 2019. The test set prediction (green) can accurately capture the periodic peaks and pullback trends of the stock price, indicating that the model has strong temporal pattern recognition ability.
The TCNAttention-RAG framework proposed in this study demonstrates strong performance in stock price prediction, particularly when integrating financial report analysis with historical price data. The framework incorporates Temporal Convolutional Networks, Multi-Layer Perceptron, Attention mechanisms, and Retrieval-Augmented Generation techniques, effectively balancing the capture of long-term trends with sensitivity to short-term price fluctuations. Specifically, the TCN component processes sequential price data, capturing long-term dependencies, while the MLP enhances the model’s expressive power through nonlinear transformations. This combination ensures robust and reliable stock price prediction, especially for companies listed on New York stock exchange, such as AXA.
6. Conclusions
This study proposes the TCN-MLP-Attention-RAG framework, which integrates Temporal Convolutional Networks for sequential modeling, Multilayer Perceptron for nonlinear feature transformation, and attention mechanisms for dynamic weighting, effectively capturing complex stock price fluctuations. Additionally, Retrieval-Augmented Generation enhances the model by extracting semantic insights from financial reports (e.g., 10-K and 10-Q filings), compensating for the limitations of structured financial indicators. Experimental results demonstrate that RAG-driven financial report analysis significantly reduces prediction errors, particularly during earnings release periods, validating the effectiveness of multimodal data fusion.
Despite its superior predictive performance, the framework has certain limitations: 1) Delayed response to extreme market events (e.g., black swan events) due to external knowledge base update latency; 2) Suboptimal prediction accuracy for peak-valley fluctuations in highly volatile short-term movements. Future research directions include:
- Dynamic Knowledge Base Optimization: Enhancing RAG retrieval with reinforcement learning for real-time integration of financial reports and market sentiment.
- Cross-Modal Enhancement: Incorporating social media sentiment analysis to capture real-time investor sentiment impacts.
- Interpretability Advancement: Developing attention-based attribution visualization tools to improve transparency and decision-making support.
By bridging structured financial data with unstructured textual insights, this study establishes an extensible framework for financial time-series prediction, providing investors with data-driven decision support tools. These findings underscore the potential of intelligent financial analysis systems in complex market environments, offering both theoretical foundations and practical applications for future research.
Acknowledgments
This work was supported by the Shaanxi Basic Science Research Institute Scientific Research Project (No. 22JSZ008).
References
- Mintarya, L. N., Halim, J. N., Angie, C., Achmad, S., & Kurniawan, A. (2023). Machine learning approaches in stock market prediction: A systematic literature review. Procedia Computer Science, 216, 96-102.
- Lu, W., Li, J., Wang, J., & Qin, L. (2021). A CNN-BiLSTM-AM method for stock price prediction. Neural Computing and Applications, 33(10), 4741-4753.
- Gao, Y., Wang, R., & Zhou, E. (2021). Stock prediction based on optimized LSTM and GRU models. Scientific Programming, 2021(1), 4055281.
- Wan R, Mei S, Wang J, et al. Multivariate temporal convolutional network: A deep neural networks approach for multivariate time series forecasting[J]. Electronics, 2019, 8(8): 876.
- Dudukcu H V, Taskiran M, Taskiran Z G C, et al. Temporal Convolutional Networks with RNN approach for chaotic time series prediction[J]. Applied soft computing, 2023, 133: 109945.
- Yun, K. K., Yoon, S. W., & Won, D. (2021). Prediction of stock price direction using a hybrid GA-XGBoost algorithm with a three-stage feature engineering process. Expert Systems with Applications, 186, 115716.
- Hu, Z., Zhao, Y., & Khushi, M. (2021). A survey of forex and stock price prediction using deep learning. Applied System Innovation, 4(1), 9.
- Zhang, Q., Zhang, Y., Bao, F., Liu, Y., Zhang, C., & Liu, P. (2024). Incorporating stock prices and text for stock movement prediction based on information fusion. Engineering Applications of Artificial Intelligence, 127, 107377.
- Cuconasu, F., Trappolini, G., Siciliano, F., Filice, S., Campagnano, C., Maarek, Y., ... & Silvestri, F. (2024, July). The power of noise: Redefining retrieval for rag systems. In Proceedings of the 47th International ACM SIGIR Conference on Research and Development in Information Retrieval (pp. 719-729).
- Fan, J., Zhang, K., Huang, Y., Zhu, Y., & Chen, B. (2023). Parallel spatio-temporal attention-based TCN for multivariate time series prediction. Neural Computing and Applications, 35(18), 13109-13118.
- Fan, W., Ding, Y., Ning, L., Wang, S., Li, H., Yin, D., ... & Li, Q. (2024, August). A survey on rag meeting llms: Towards retrieval-augmented large language models. In Proceedings of the 30th ACM SIGKDD Conference on Knowledge Discovery and Data Mining (pp. 6491-6501).
Figure 1.
Overall stock price changes of AXA company.
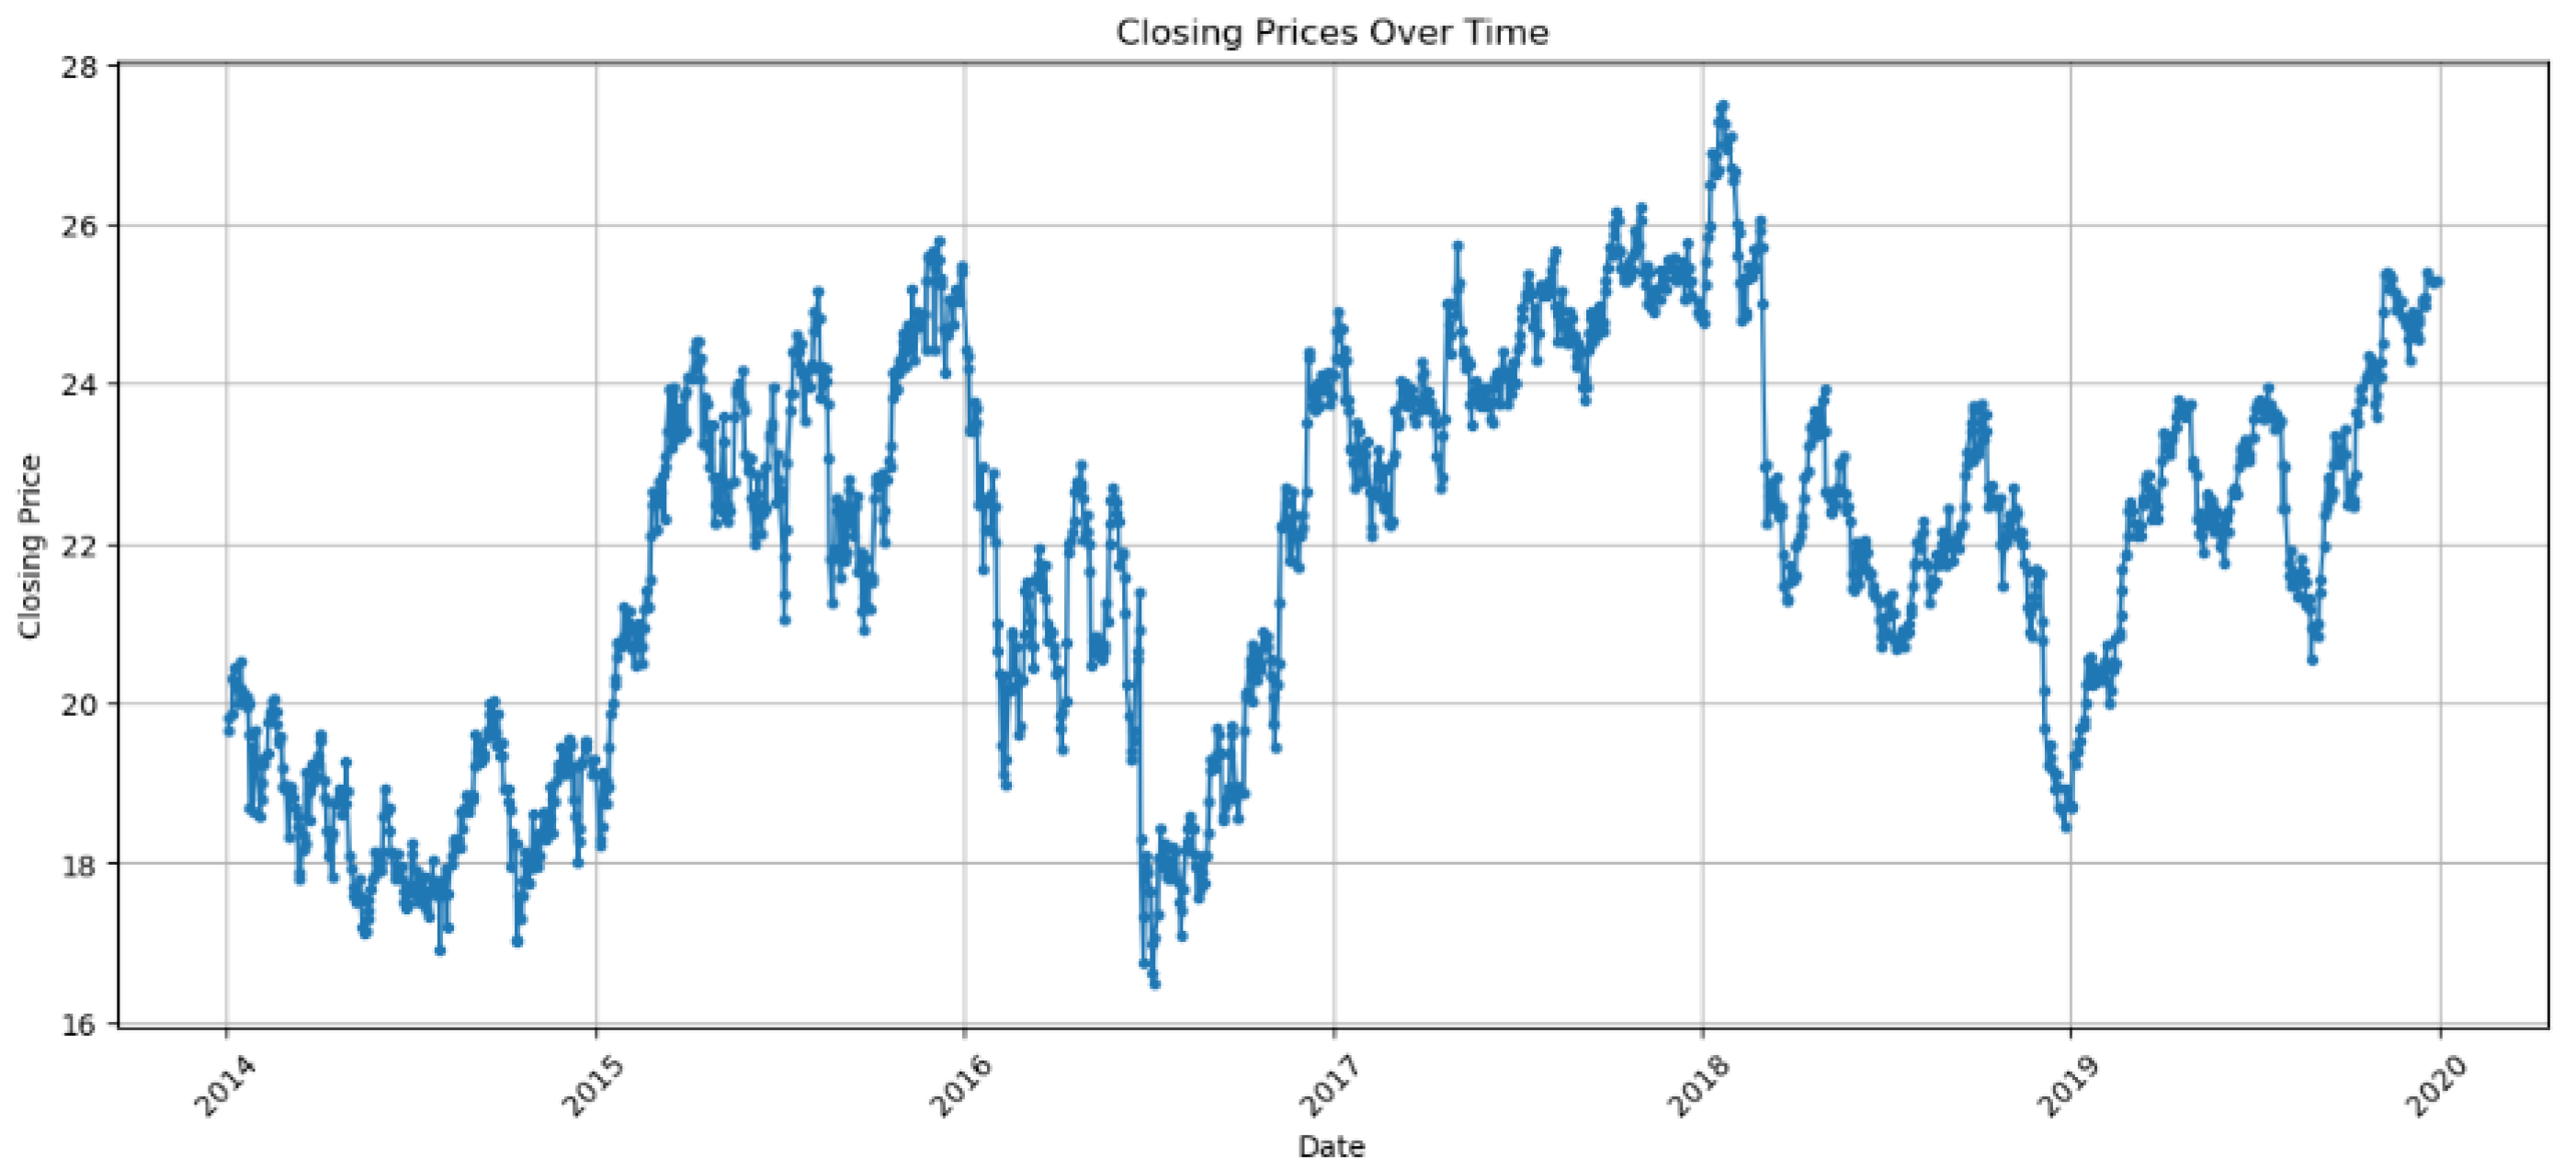
Figure 2.
AXA closing price and 30 day moving average.
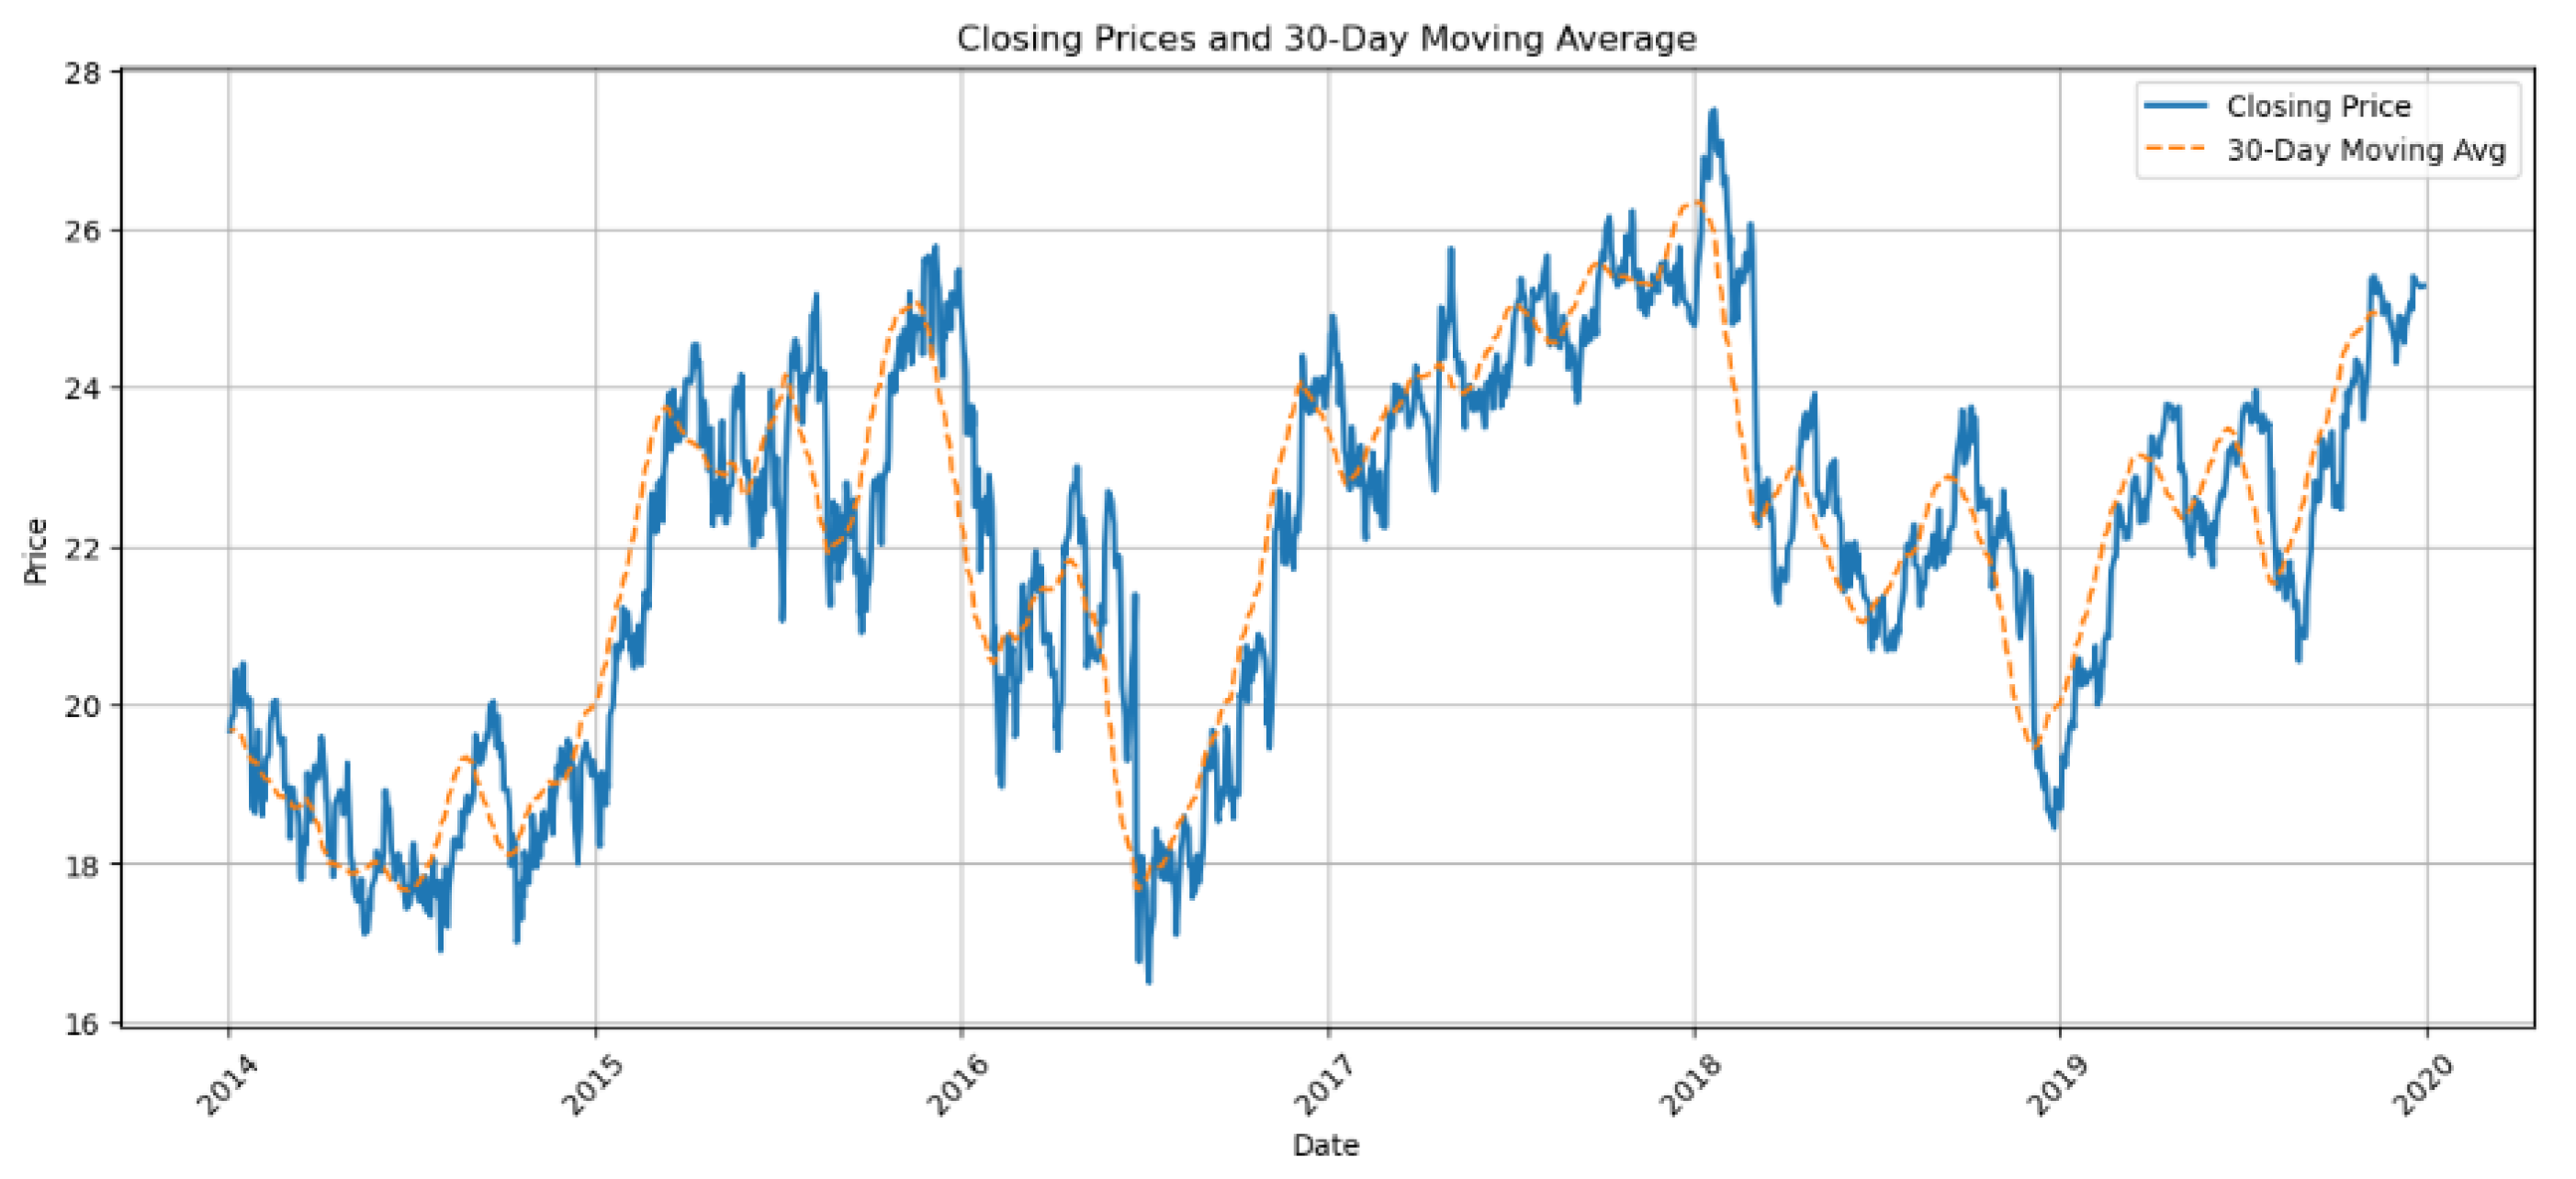
Figure 3.
Model Structure.
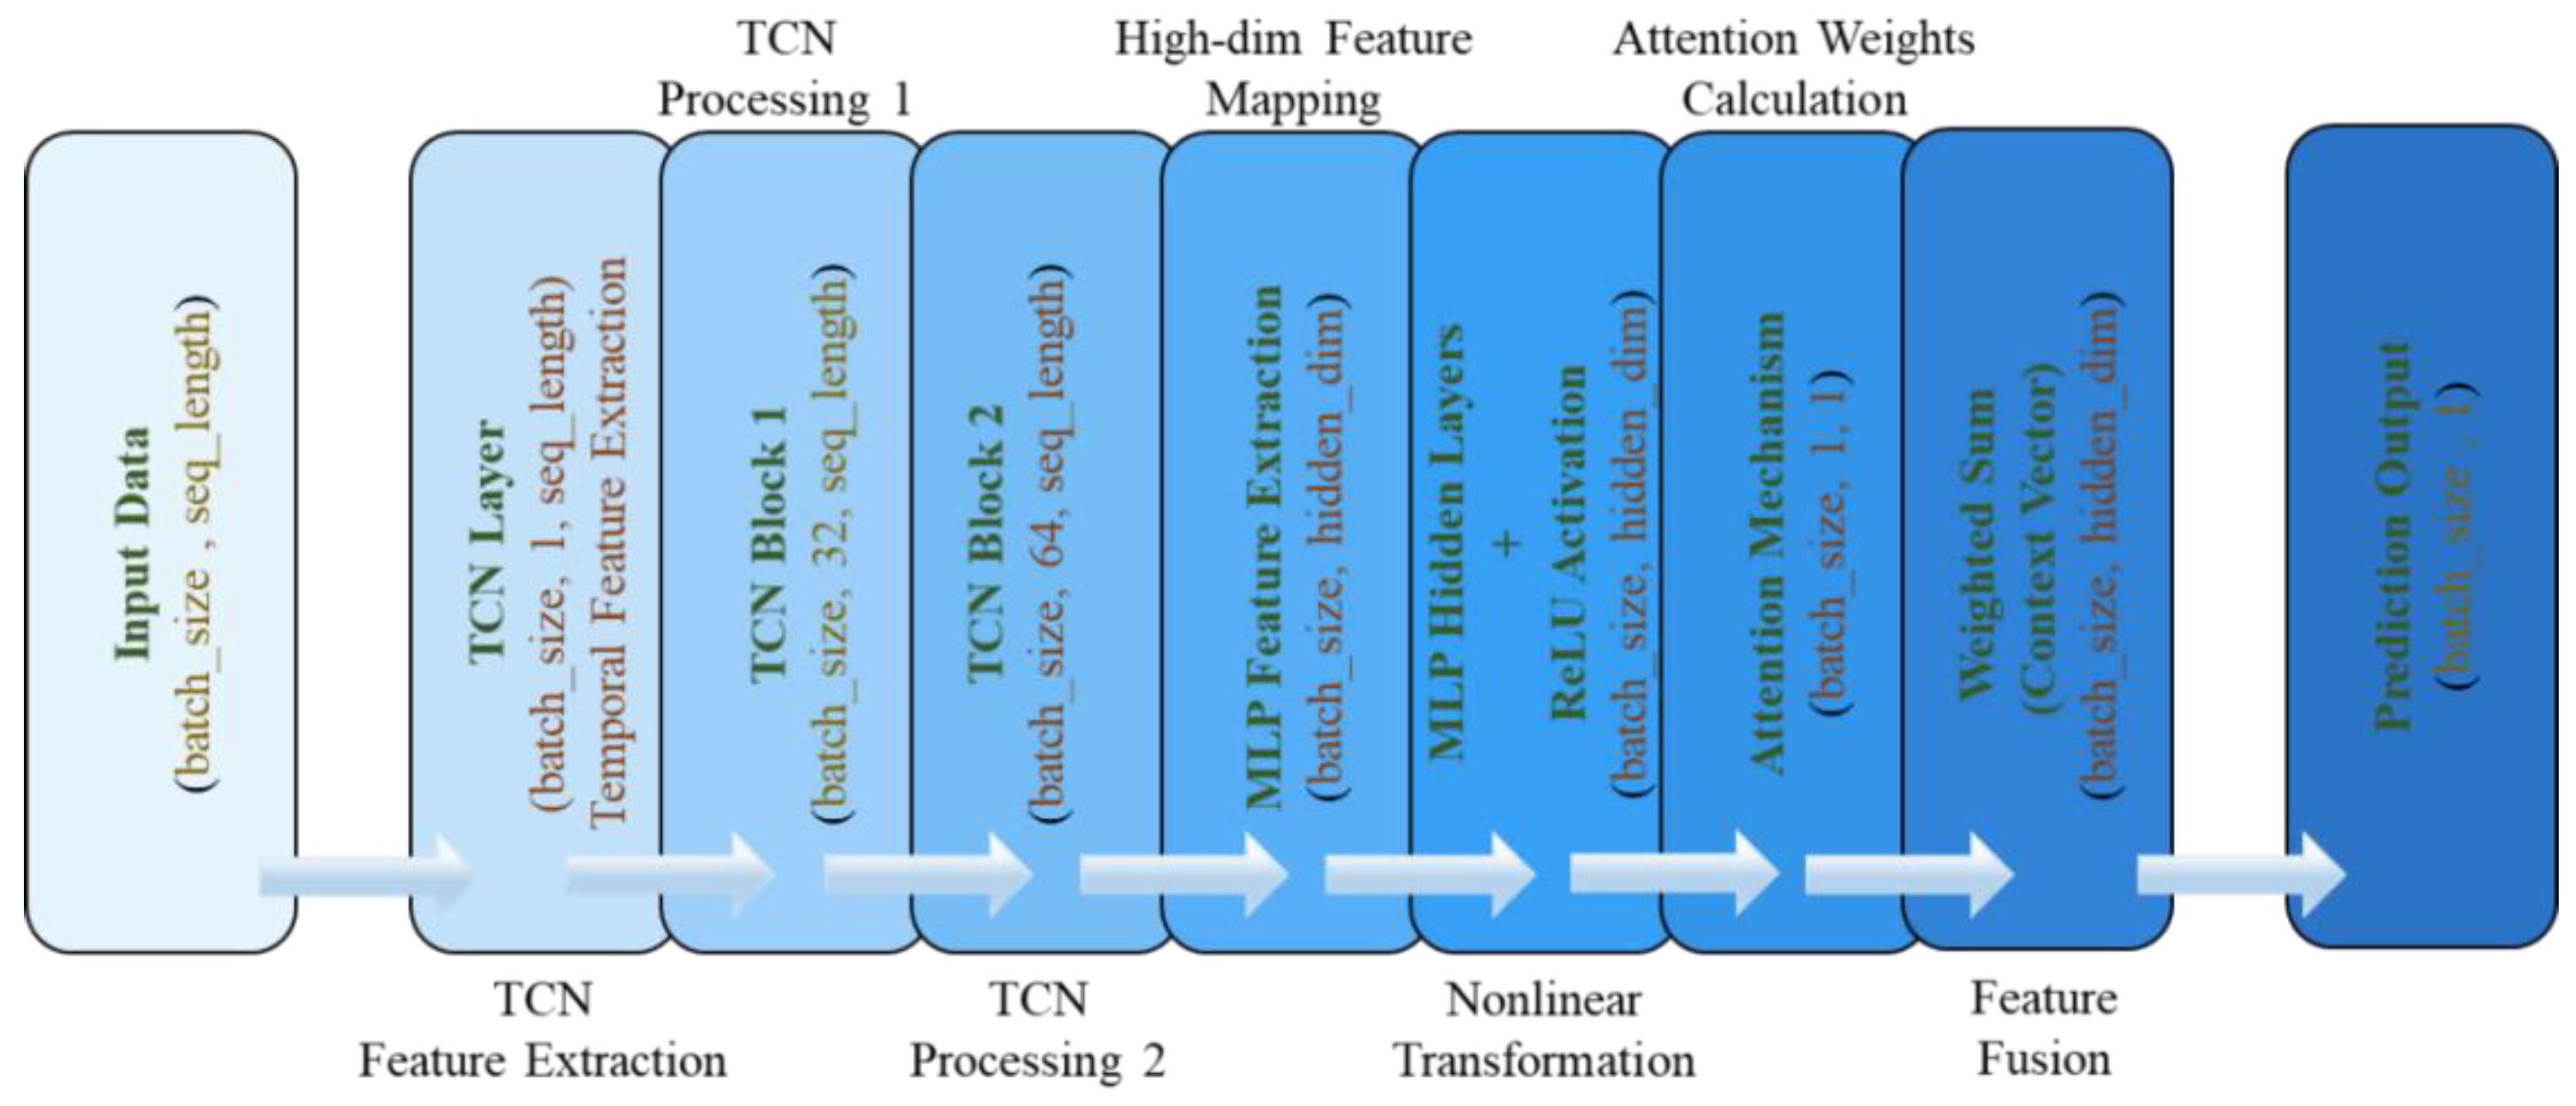
Figure 4.
Time Convolutional Network.
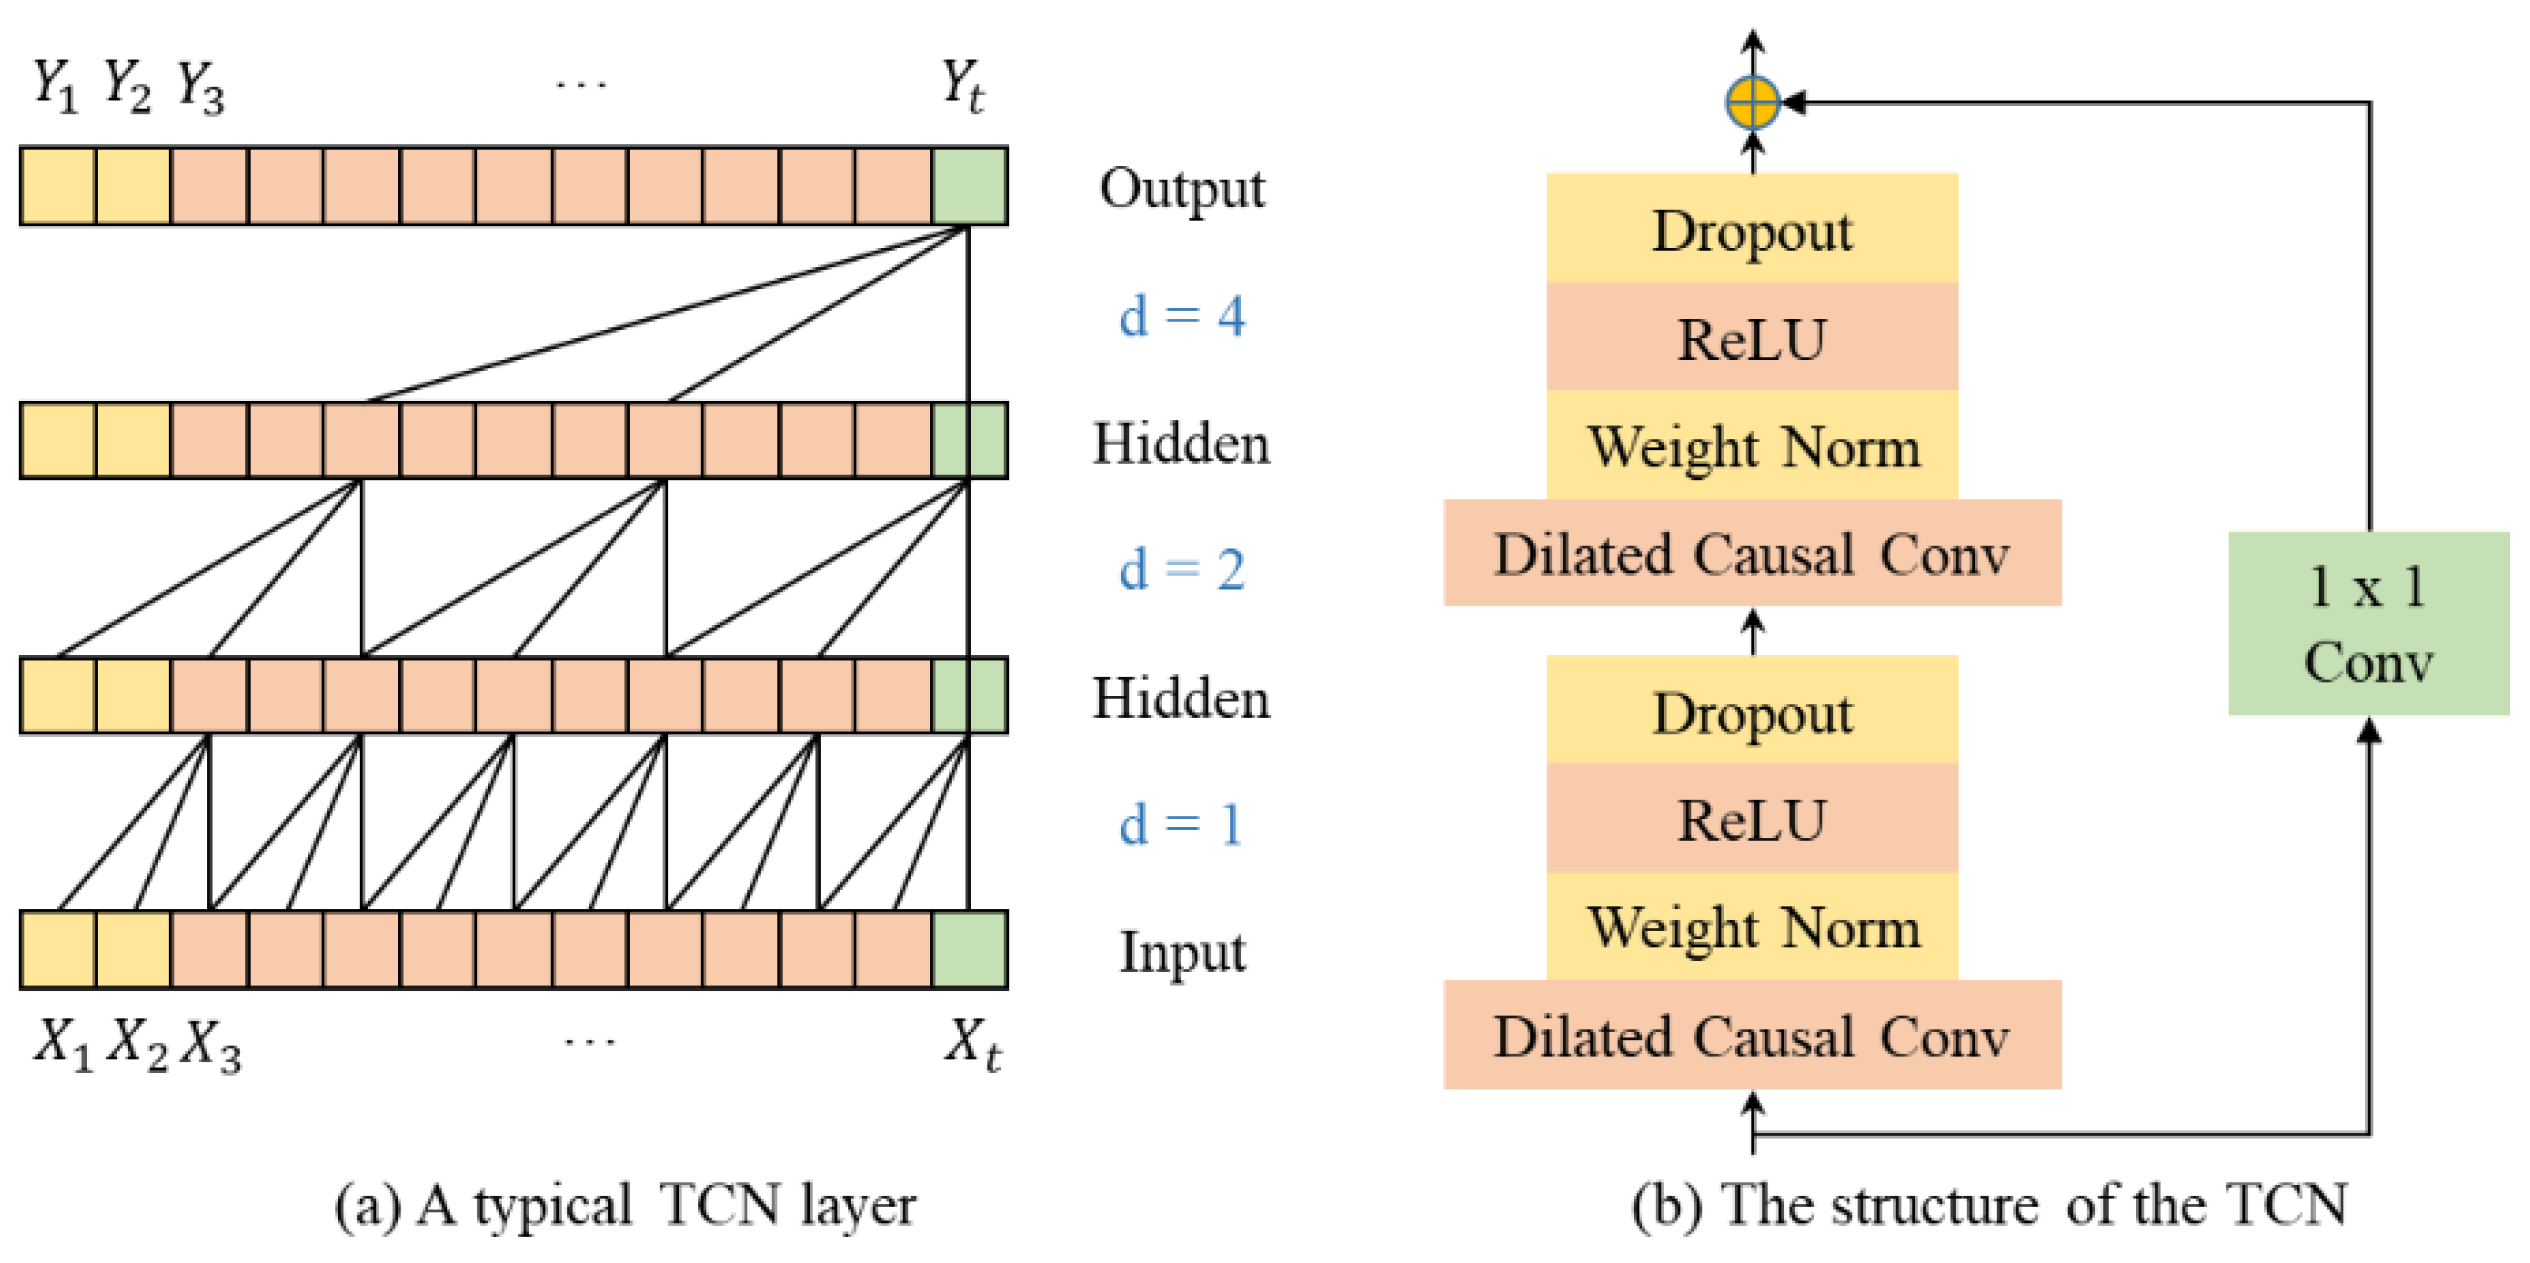
Figure 5.
Training Loss and Validation Loss.
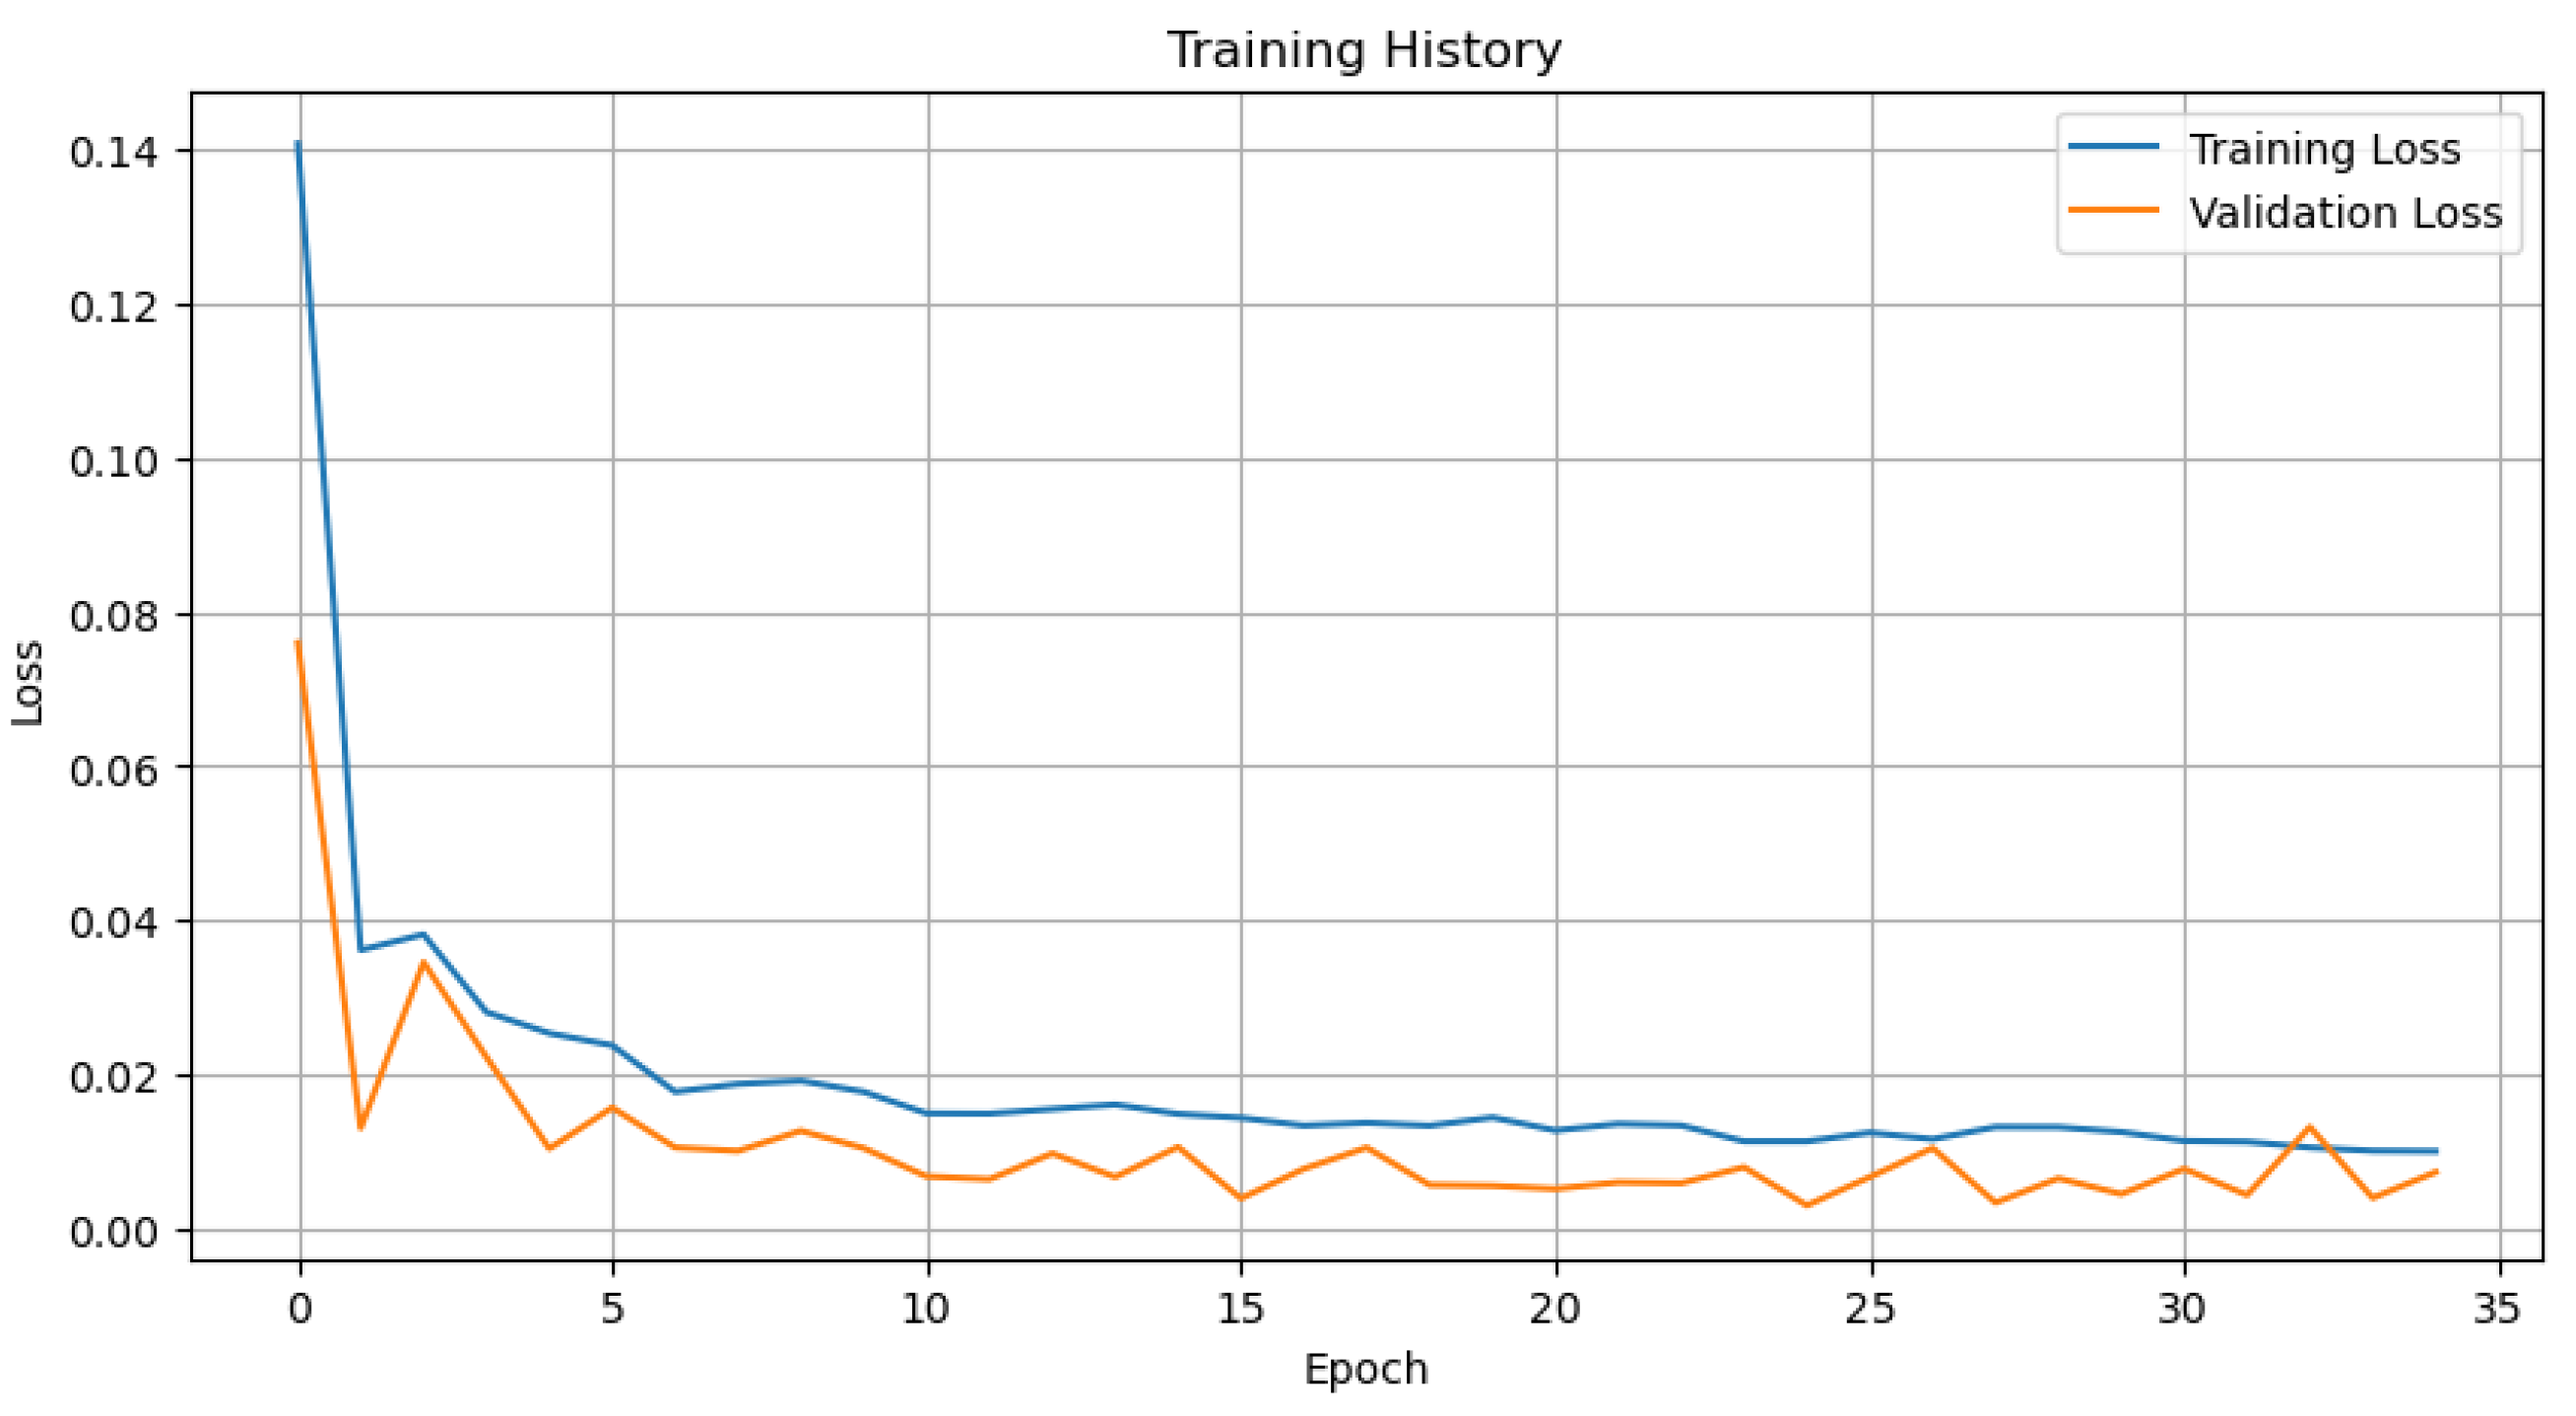
Figure 6.
AXA Stock Price Prediction Results.
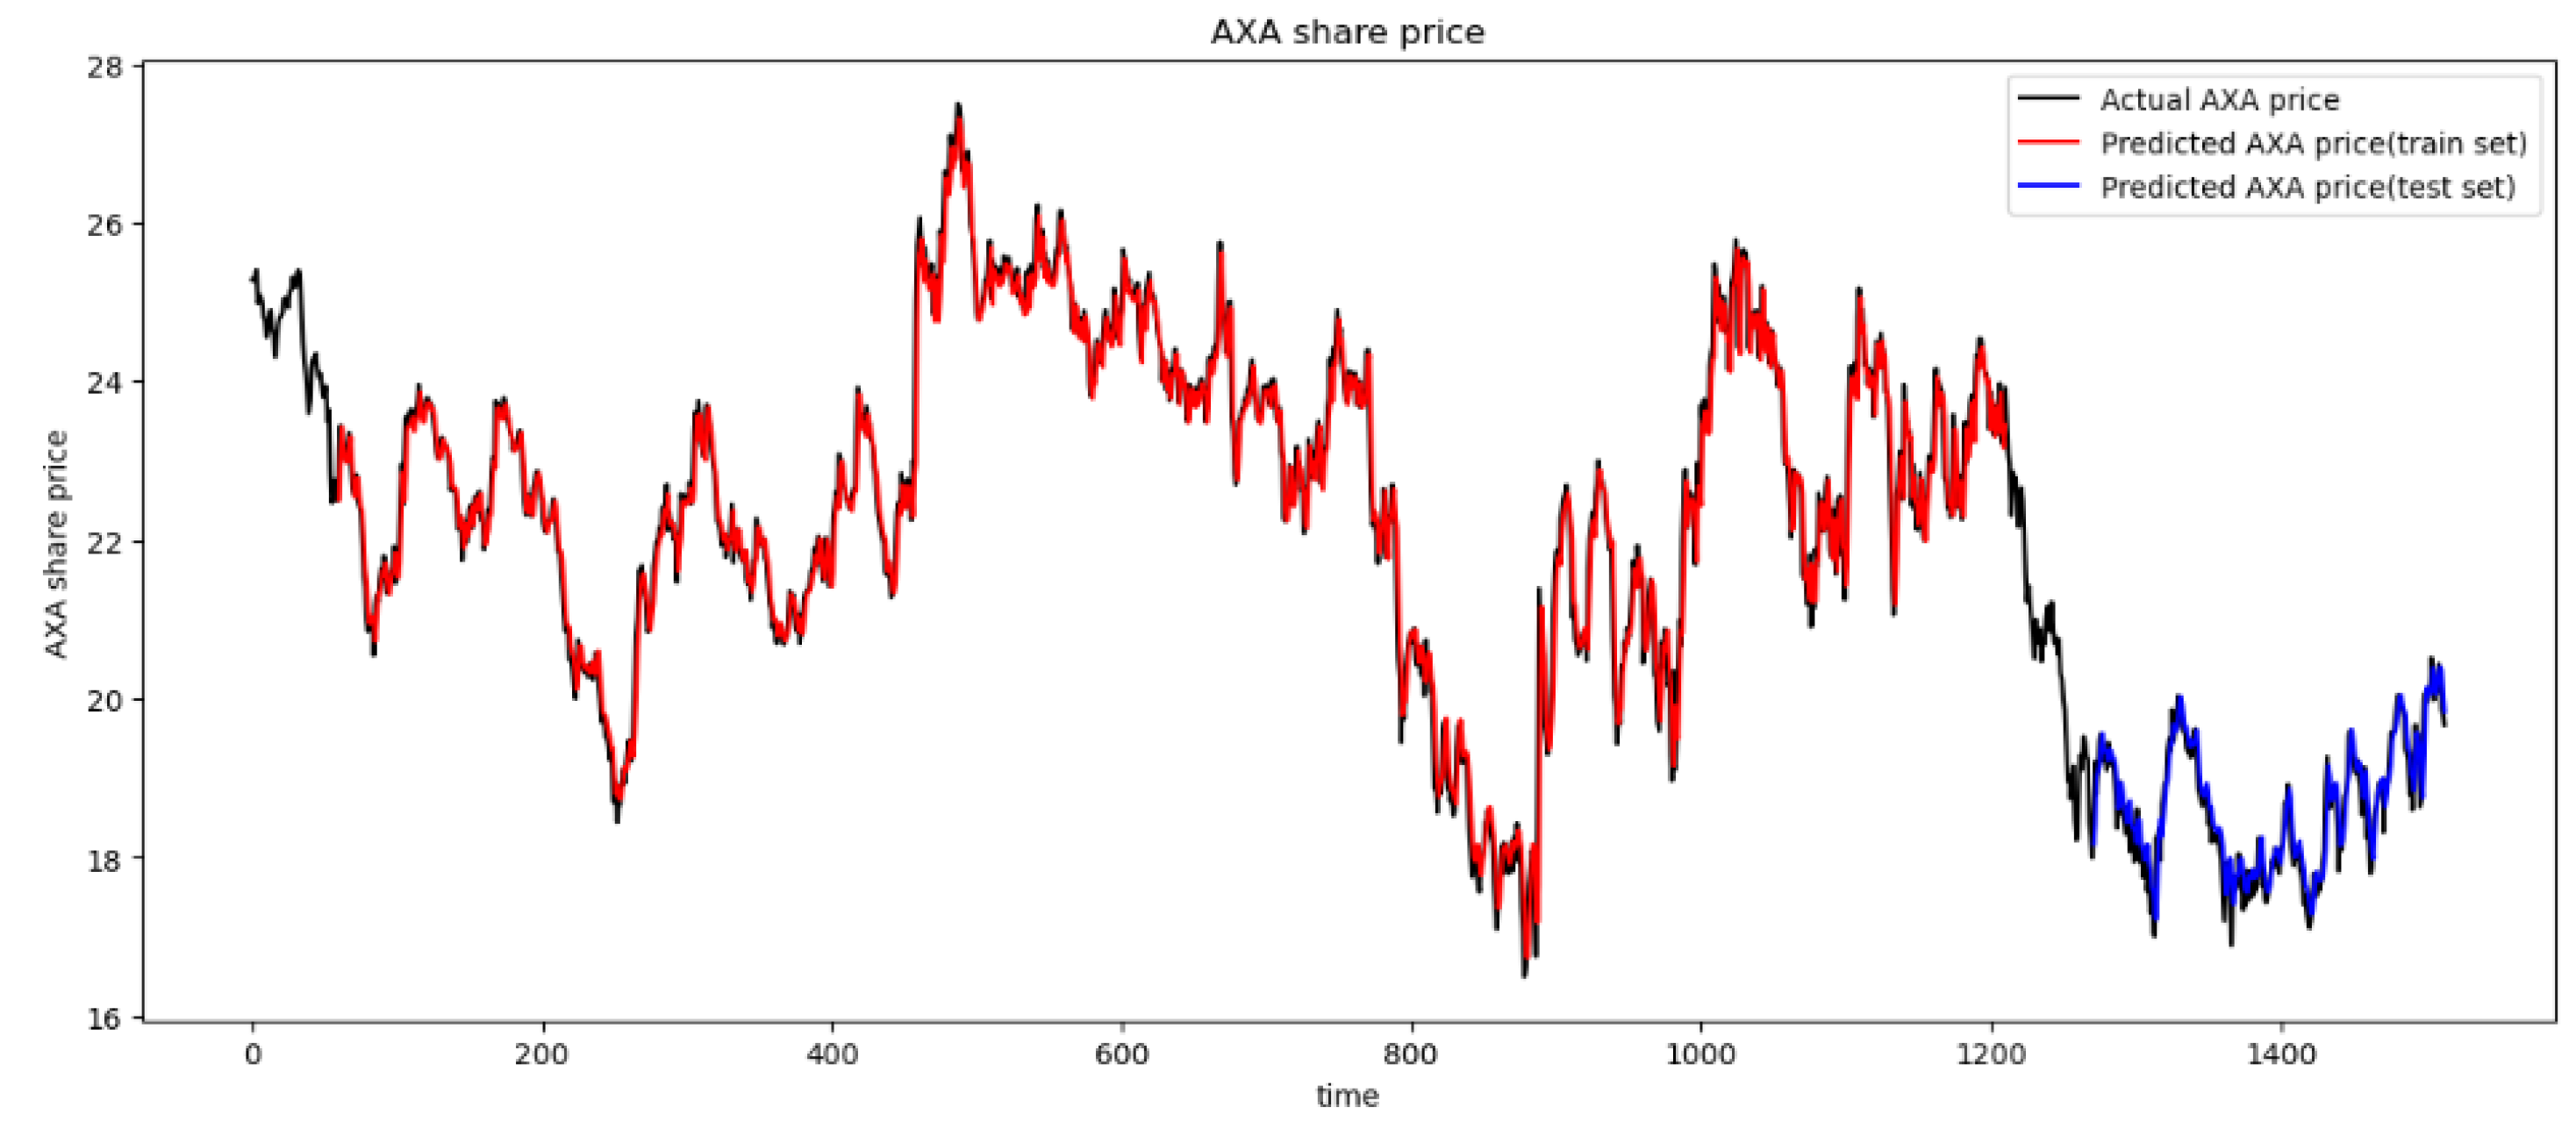

Table 1.
Model results.
| Model | Accuracy Rate | Recall |
|---|---|---|
| gpt-3.5-turbo | 50.7% | 73.3% |
| gpt-3.5-turbo+RAG | 65.8% | 89.2% |
| gpt-3.5-turbo-1106 | 60.4% | 82.3% |
| gpt-3.5-turbo-1106+RAG | 79.5% | 90.1% |
| gpt-4.0 | 80.2% | 92.7% |
Disclaimer/Publisher’s Note: The statements, opinions and data contained in all publications are solely those of the individual author(s) and contributor(s) and not of MDPI and/or the editor(s). MDPI and/or the editor(s) disclaim responsibility for any injury to people or property resulting from any ideas, methods, instructions or products referred to in the content. |
© 2025 by the authors. Licensee MDPI, Basel, Switzerland. This article is an open access article distributed under the terms and conditions of the Creative Commons Attribution (CC BY) license (http://creativecommons.org/licenses/by/4.0/).
Copyright: This open access article is published under a Creative Commons CC BY 4.0 license, which permit the free download, distribution, and reuse, provided that the author and preprint are cited in any reuse.


