Introduction
Jumping height is critical to many athletic activities and is a key factor in competitive success [
1,
2]. The force-velocity (F–V) relationship is one of the most popular methods for describing jump performance because it allows for the evaluation of maximal lower-limb force (
), velocity (
), and power (
) based solely on jump heights and simple anthropometric measurements of push-off distance (
) under different loading conditions (Morin & Samozino, 2016). This is because jumping performance is influenced by both the neuromuscular function and gravity [
3]. Therefore, the force plate analyzing force-time signal and the aforementioned simple method can both be used to measure force, velocity, and power output during squat jumps [
4,
5]. Linear regression is then performed on the force and velocity data from different unloaded and loaded squat jumps to obtain
and
[
6,
7]. Furthermore, due to the dual constraints, there exists an optimal ratio between
and
that maximizes jump height for the given
(defined as one-fourth of the product of
and
) [
8,
9]. This balance enables the full expression of
during unloaded jumps and forms the basis of individualized F–V relationship training [
9]. Accordingly, for populations characterized by either a velocity deficit or a force deficit, implementing velocity- or force-oriented training may lead to superior performance improvements compared to generalized training programs [
10,
11].
However, recent studies have increasingly questioned the feasibility and accuracy of the
model. For instance, Lindberg et al. [
12] and Zabaloy et al. [
13] did not observe superior performance improvements resulting from individualized training. Additionally, a few studies have reported discrepancies between the
obtained via the simple method and the force plate method, suggesting that the two approaches may not be equivalent [
14,
15,
16]. A possible explanation lies in the theoretical foundation established by Samozino et al., where the distance-averaged force was assumed to be equivalent to the time-averaged force [
4]. This assumption was then used to derive the relationship between time-averaged velocity and jump height, thereby constructing a simplified model that harmonizes the effects of gravity and neuromuscular function [
3]. Notably, the underlying assumption may not be valid for all athletes, thereby restricting the applicability of the time-averaged
across diverse populations. To overcome this limitation, we introduce a new
model grounded in distance-averaged force and velocity. The validity of these two different averaged level methods and the corresponding simple methods for estimating mean force, velocity, and predicting jump height was subsequently evaluated. We then compared the differences and correlations of the
variables between the distance-averaged method and the time-averaged method. Lastly, simulations were conducted to explore the effects of increasing
,
, and
on jump height and its growth rate in the distance-averaged method.
Method
Theoretical Approach and Error Analysis
For the calculation of time-averaged force (
) and velocity (
) during squats jump, Samozino assumed that the
is equal to that averaged in distance (
) [
4]. Hence, there is:
and
are normalized to body mass. Based on the principle that the work done during a vertical jump is equal to the change in gravitational potential energy of the system's center of mass and jump height (
), there is
Here,
represents the ratio of system mass to body mass, which equals 1 during unloaded squat jumps, and
denotes the gravitational acceleration. In the force plate method,
is obtained by integrating the displacement of the center of mass from onset to takeoff during the concentric phase in the squat jump. In the simple method,
was calculated as the difference in length between the squat position and the fully extended lower limb during maximal foot plantarflexion (measured from the greater trochanter to the tip of the toes). For the
, it can be defined that:
Here,
refers to the time elapsed from movement onset to take-off. According to the impulse–momentum relationship from onset to take-off, there is
refers to the instant velocity at take-off. According to the relationship between
and
[
4], there is
Substituting Equation (3) and Equation (4) into Equation (5), it can be obtained that:
The above formulae are commonly used in vertical jump analysis to calculate
and
, the main source of systematic error arises from assuming that the
equals
. To avoid this kind of error,
and distance-averaged velocity (
) can be applied instead. For
, equation (2) is used. For estimating
, jump height can be included in a linear regression using the following equation:
In this regression equation, α = 0.924 and β = 3.011. The coefficient of determination is R2 = 0.958, and the standard error of estimate is 0.057. This equation was derived from all unloaded and loaded jumps achieved by each participant in our experiment, totaling 385 attempts. For the time-averaged method, power () is calculated as the product of and . However, for the distance-averaged method, distance-averaged power () cannot be obtained simply by multiplying and , because the product of force and velocity equals power only under the time-averaged method. Nevertheless, we still calculated their product as an indicator of power. For ease of reading, the indicator of power uses the same notation as the distance-averaged power.
The F-V relationship generated during a human being’s vertical jump can be approximated using the following linear equation (8) [
3].
Based on equations (1), (2), (5), (6), and (8), the time-averaged predicted jump height is:
Equation (9) yields one positive and one negative solution. The positive solution corresponds to the predicted jump height we aim to calculate [
8]. Based on equations (2), (7), and (8), the distance-averaged predicted jump height is only one solution:
When using the same jump height, for the time-averaged method, equations (1), (2), and (6) may introduce errors including
being approximately 10% to 15% lower than
[
17], as well as discrepancies between the measured
and the displacement of the system's center of mass (integrated); for the distance-averaged method using equations (2) and (7), the error originates from the inaccurate estimation of
and the mentioned
. The estimation error of
is at most 5% when the jump height is 0.1 m, and it decreases to below 1% as the height increases to 0.5 m. For the error in
, a former study reported it to be approximately 4% [
16]. The difference between the time-averaged and distance-averaged methods lies solely in the magnitude of the discrepancy between
and
, as well as the difference between
from equation (7) and the integrated calculation. Since previous studies have reported that the former discrepancy is substantially larger than that observed in our model fitting. Hence, the distance-averaged method may yield smaller errors compared to the time-averaged method when predicting jump height and estimating with the simple method.
The following experiment investigated the differences in models between time-averaged and distance-averaged methods. Specifically, it examined: (1) the validity of the simple method within each average level separately; (2) the prediction errors of jump height derived from different models; and (3) whether the distance-averaged method retains information about individualized training adaptations comparable to that of the time-averaged method.
Participants and Procedure
Forty well-trained male participants were included in the study (mean ± SD = 22 ± 2 years; 1.77 ± 0.10 m; 72.9 ± 7.3 kg). All of the participants had professional sports training in the past, including in basketball, football, and field and track. They were capable of executing both unloaded and loaded squat jumps with the correct technique and reported no history of neuromuscular disorders or lower limb injuries within the past six months. All the participants were informed about the testing procedure and provided written informed consent prior to their participation in this study, which was approved by the Ethical Advisory Committee (Number: 2023142H) and performed in accordance with the Helsinki Declaration. Participants attended the laboratory on two occasions: one session for familiarization and one session for formal testing.
During the familiarization session, participants performed unloaded and loaded squat jumps with the investigator checking their technique. During the formal session, participants first completed a warm-up consisting of jogging, dynamic stretching, and several jumps, both without and with a light external load. Then, participants performed two trials of unloaded squat jumps, resting for one minute between each trial. If a trial was not performed well, a third trial was permitted. Three minutes later, participants performed an incremental load squat jump test until they reached around their body weight (±5 kg). Typically, they tested four different loads, performing each load at least twice. They rested for one minute between trials of the same load and for three minutes between different loads. For the squat jump technique, participants initiated the movement by performing a controlled downward motion to reach their starting position with a 90-degree knee angle. A small chair helped them maintain this position. After holding this position for at least one second, participants were instructed to jump as quickly as possible. Any countermovement was verbally prohibited and closely monitored to ensure compliance.
Measurement Equipment and Data Analysis
All squat jumps were performed on a force platform (Kistler Instrumente AG, Winterthur, Switzerland) with the vertical component of the ground reaction force sampled at 1000 Hz. The onset of the concentric phase was defined as the first instance 20 N above the baseline [
18], and the take-off phase was identified as the instant when the ground reaction force fell below 20 N [
19].
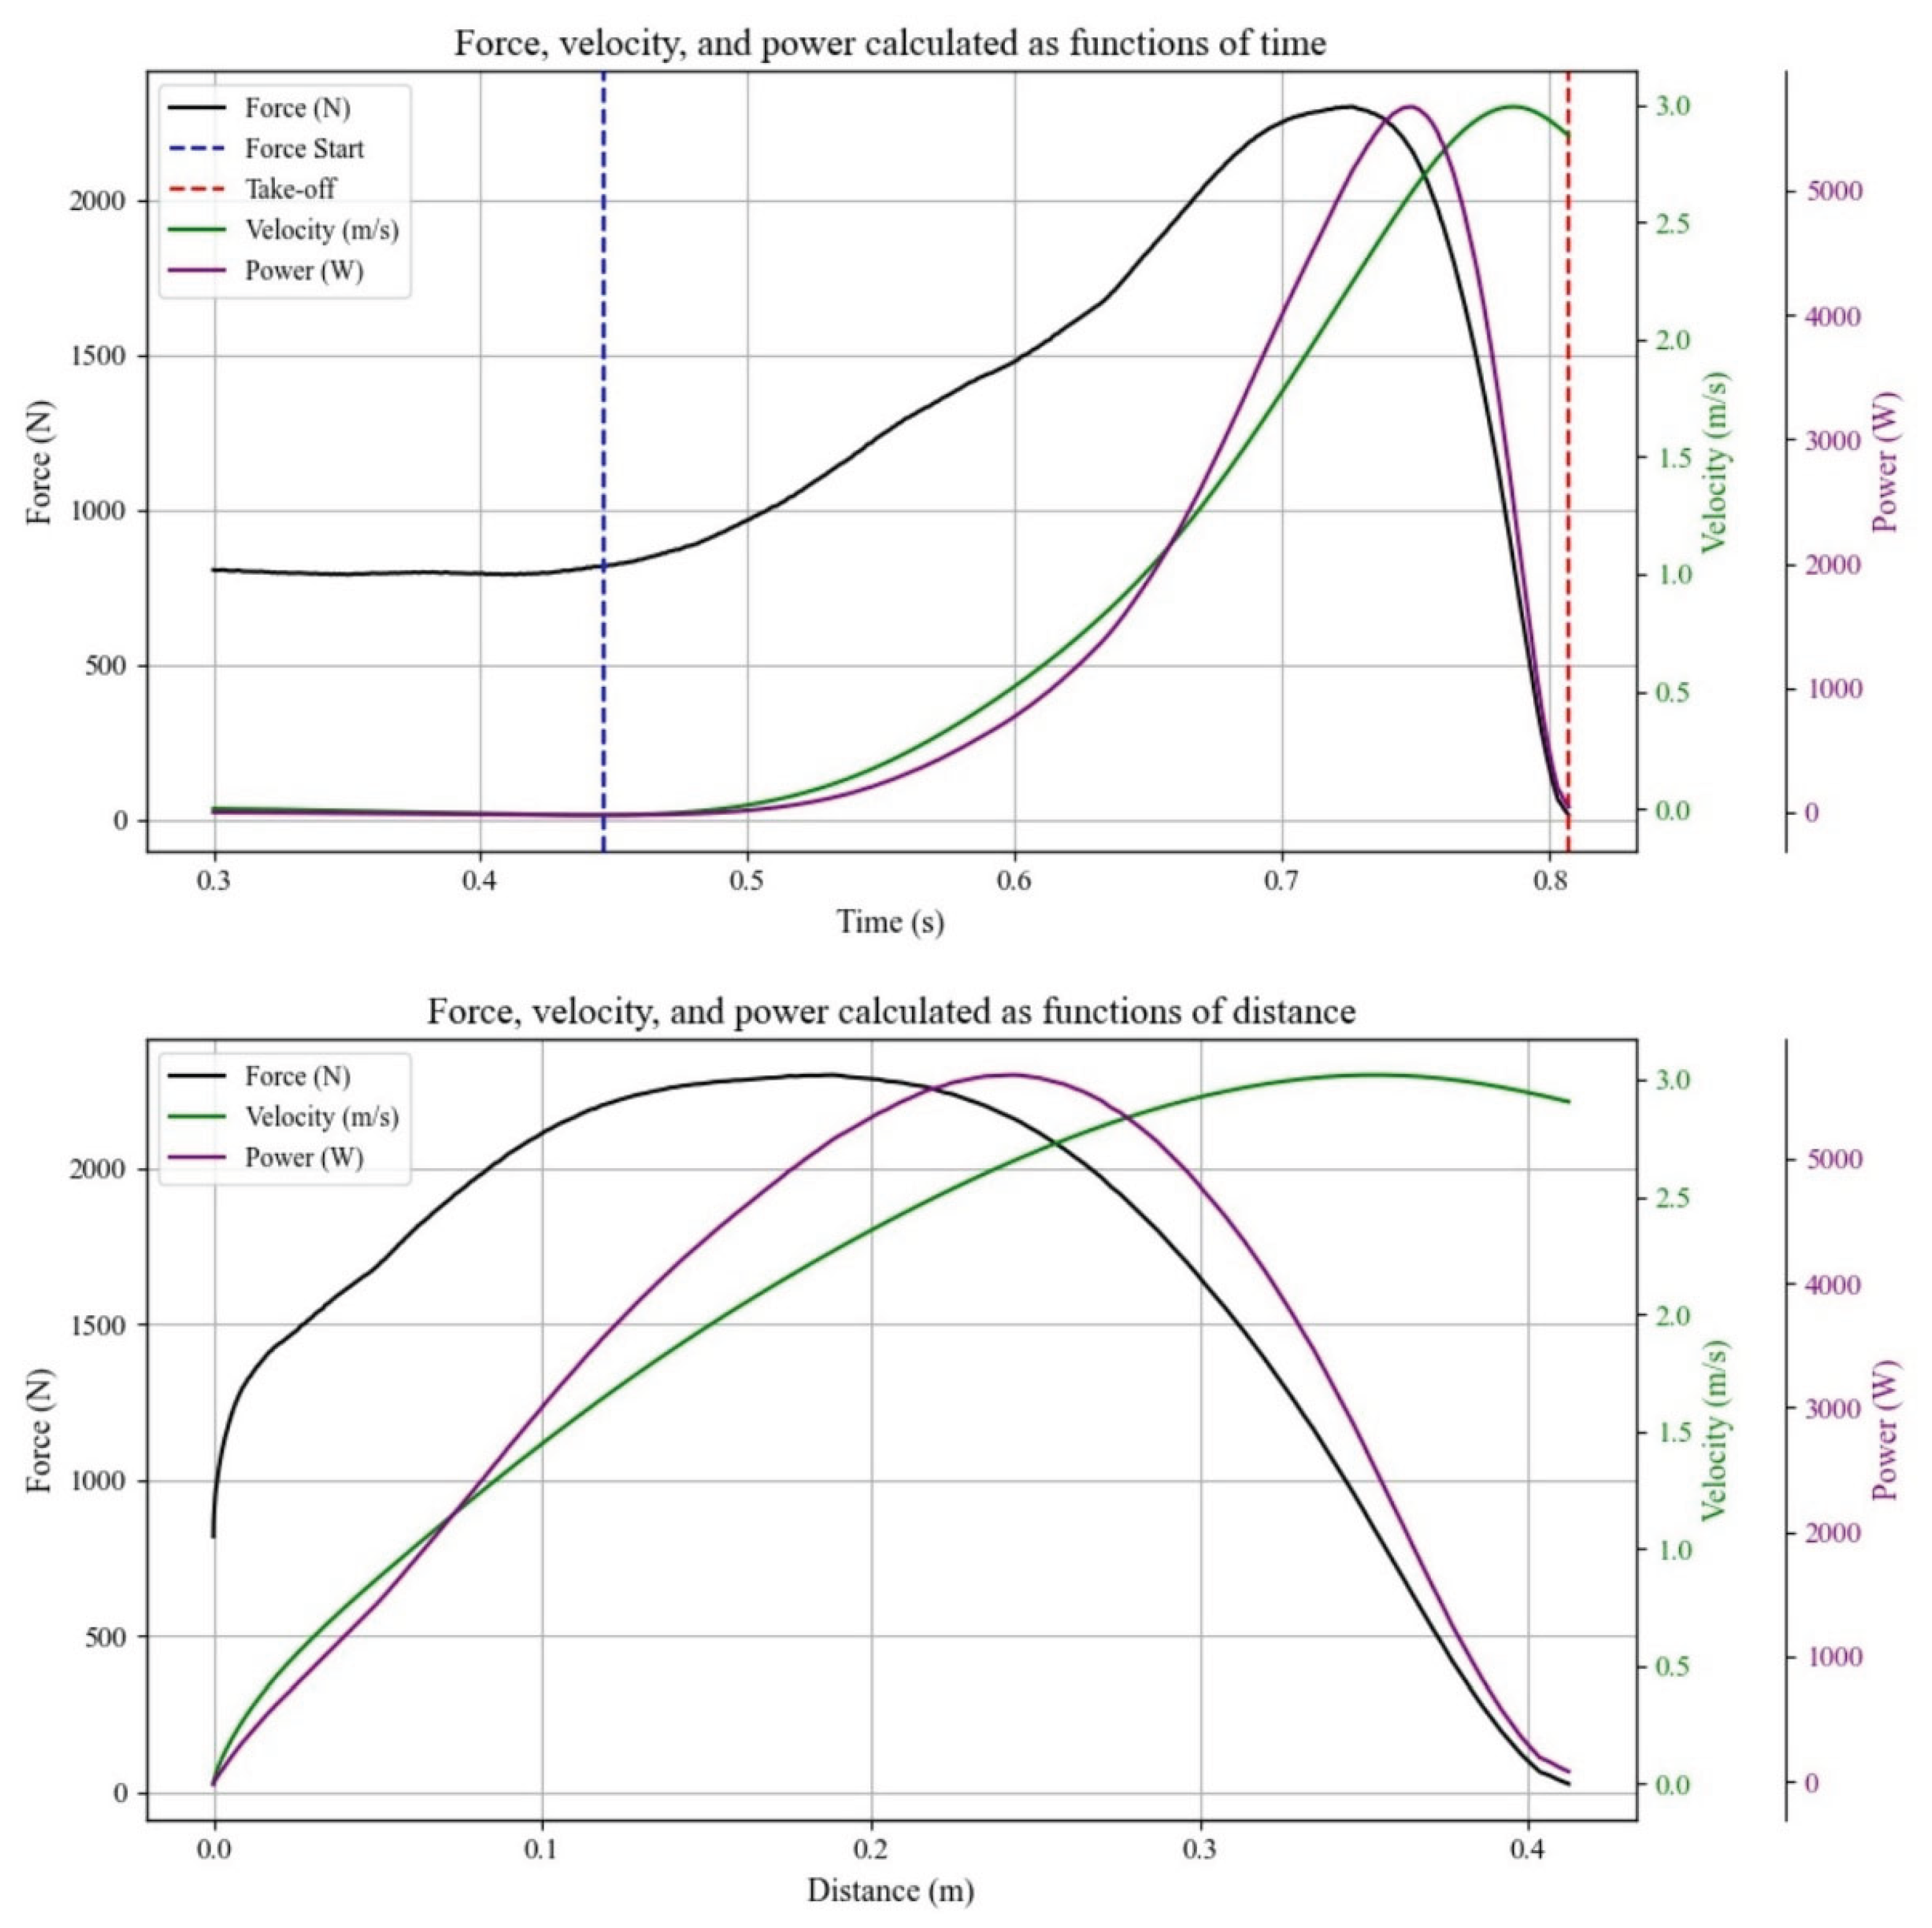
Jump height was calculated based on take-off velocity. Mean, force, and velocity were calculated using four different methods: (1) the time-averaged force plate method, based on the integration of the force–time signal (
Figure 1; upper panel); (2) the time-averaged simple method, using Equations (1), (2), (5), and (6); (3) the distance-averaged force plate method, based on integration of the transformed force–distance signal (
Figure 1; lower panel); and (4) the distance-averaged simple method, using Equations (2) and (7). For each participant, only the highest jump at each load was included in the F-V relationship modeling. To prevent overfitting, a leave-one-out approach was applied to the regression of Equation (7), whereby the linear model was recalibrated after excluding the tested participant to obtain the
. The least-squares method was then used to calculate
and the slope of the
, and
was calculated as the negative ratio between
and the slope of the
. In the time-averaged method,
was computed as one-fourth of the product of
and
. The distance-averaged simple method could only provide an indicator of the maximal power indicator, which was also denoted as
for simplicity of reading. Equations (9) and (10) were used to predict jump height for the time-averaged and distance-averaged methods, respectively. For the time-averaged method, the
was calculated as the ratio between the athlete's actual slope and the theoretical optimal slope that maximizes jump height at a given
[
20]. A value greater than 1 indicated that the athlete was velocity-deficit, while a value less than 1 suggested that the athlete was force-deficit. For the distance-averaged method, based on Equation (10), the partial derivatives of jump height with respect to the percentage change in
and
were calculated at each participant’s current
. The ratio of partial derivatives from equation (10) with respect to the percentage change in
and
was defined as
. A value greater than 1 indicated that improvements in jump height were more sensitive to increases in
, whereas a value less than 1 suggested that the increase in
led to greater improvements in jump height.
Statistical Analyzes
Descriptive statistics are presented as mean ± SD. Statistical analyses were performed using SPSS software version 22.0 (SPSS Inc., Chicago, IL, USA) and statistical significance was set at p < 0.05. The paired sample t-tests, correlation analyses, and absolute and relative errors were calculated in each jump to compare mean force, mean velocity, and mean power between the force plate method and the simple method across the two averaged methods except power in the distance-averaged methods, respectively. Because the simple method could not compute distance-averaged mean power, it was only used for correlation analysis with the force plate method. Two paired-sample t tests were also applied to compare the magnitude of absolute relative error in mean force and velocity from the force plate method and simple method between time-averaged and distance-averaged methods. To analyze the errors of
, separate paired-sample t-tests and correlation analyses were conducted for unloaded and all squat jumps respectively, comparing the force plate (integrated) and simple (anthropometric) methods. The intra-session reliability was evaluated for force, velocity, power, and jump height from different methods through the within-subject coefficient of variation (CV) and intraclass correlation coefficient (ICC), with good reliability set as CV ≤ 5% and ICC ≥ 0.900, as well as acceptable reliability set as CV ≤ 10% and ICC ≥ 0.700. The smallest important ratio between the 2 CVs was considered to be higher than 1.15 [
21].
Pearson correlation was used to assess the linearity of the F–V relationship across different methods. A one-way repeated measures ANOVA was conducted to compare the absolute prediction errors of jump height based on four different F–V relationship models. Because the time-averaged force plate method was not suitable for predicting jump height according to the results from the former ANOVA, Pearson correlations were applied between the other three methods separately in
,
, and
. Paired-sample t-tests were also calculated to compare the difference between the distance-averaged force plate method and the simple method of
,
, and
. Pearson correlations were ultimately performed to assess the correlations between
and
among the time-averaged simple method and the two distance-averaged methods. The magnitude of the r coefficient was interpreted according to the scale proposed by Hopkins et al.: trivial (< 0.10), small (0.10-0.29), moderate (0.30-0.49), large (0.50-0.69), very large (0.70-0.89), and nearly perfect (≥ 0.90) [
22].
Results
Validity of Simple Method in Different Averaged Method
A total of 385 unloaded and loaded squat jump trials were recorded for validity analysis. Of these trials, 187 paired trials were selected for reliability analysis. Using the time-averaged method, the simple method overestimated
,
, and
(t ≤ -19.646, p ≤ 0.001) and showed only large correlations with the force plate method for
(r = 0.512). In contrast, the distance-averaged simple method overestimated only
by a relative error of around 1% compared to the distance-averaged force plate method, but not in
. Furthermore, the measurement from the distance-averaged simple method demonstrated very large to nearly perfect correlations with the force plate method (0.826 ≤ r ≤0.978) (
Table 1). In estimating mean force and velocity, the absolute relative error between the force plate and simple methods was higher when using the time-averaged method compared to the distance-averaged method (mean force: t = 13.243, p < 0.001; mean velocity: t = 16.609, p < 0.001). For the
, the force plate method showed a large correlation with the anthropometric simple method for the unloaded squat jump (r = 0.588), with no significant differences between the two methods (t = -1.233, p = 0.225). However, when considering both unloaded and loaded conditions, the anthropometric simple method underestimated
by 1.5 cm (t = -7.434, p ≤ 0.001), and the correlation between the two methods was only moderate (r = 0.386).
The between-trial reliability of all kinetics was acceptable (CV ≤ 8.89, ICC ≥ 0.776). Considering that the CV for squat jump height in both unloaded and loaded conditions was 5.40%, the
calculated from the force plate showed comparable reliability (CV = 5.62%). Across all kinetics, the time-averaged method exhibited acceptable to good reliability in both the force plate and simple methods (CV ≤ 8.89, ICC ≥ 0.776). However, the
derived from the time-averaged force plate method exhibited poorer reliability compared to jump height (CV
ratio = 1.65). The distance-averaged method consistently demonstrated good reliability across all kinetics in both the force plate and the simple method (CV ≤ 4.12, ICC ≥ 0.916) (
Table 2).
Comparison of the Different F-V Relationship Models
The variables derived from the four models demonstrated a very large to nearly perfect linear relationship. The r was 0.85 ± 0.14, 0.91 ± 0.12, 0.95 ± 0.05, and 0.91 ± 0.12 for the time-averaged force plate and simple method, the distance-averaged force plate and simple method, respectively.
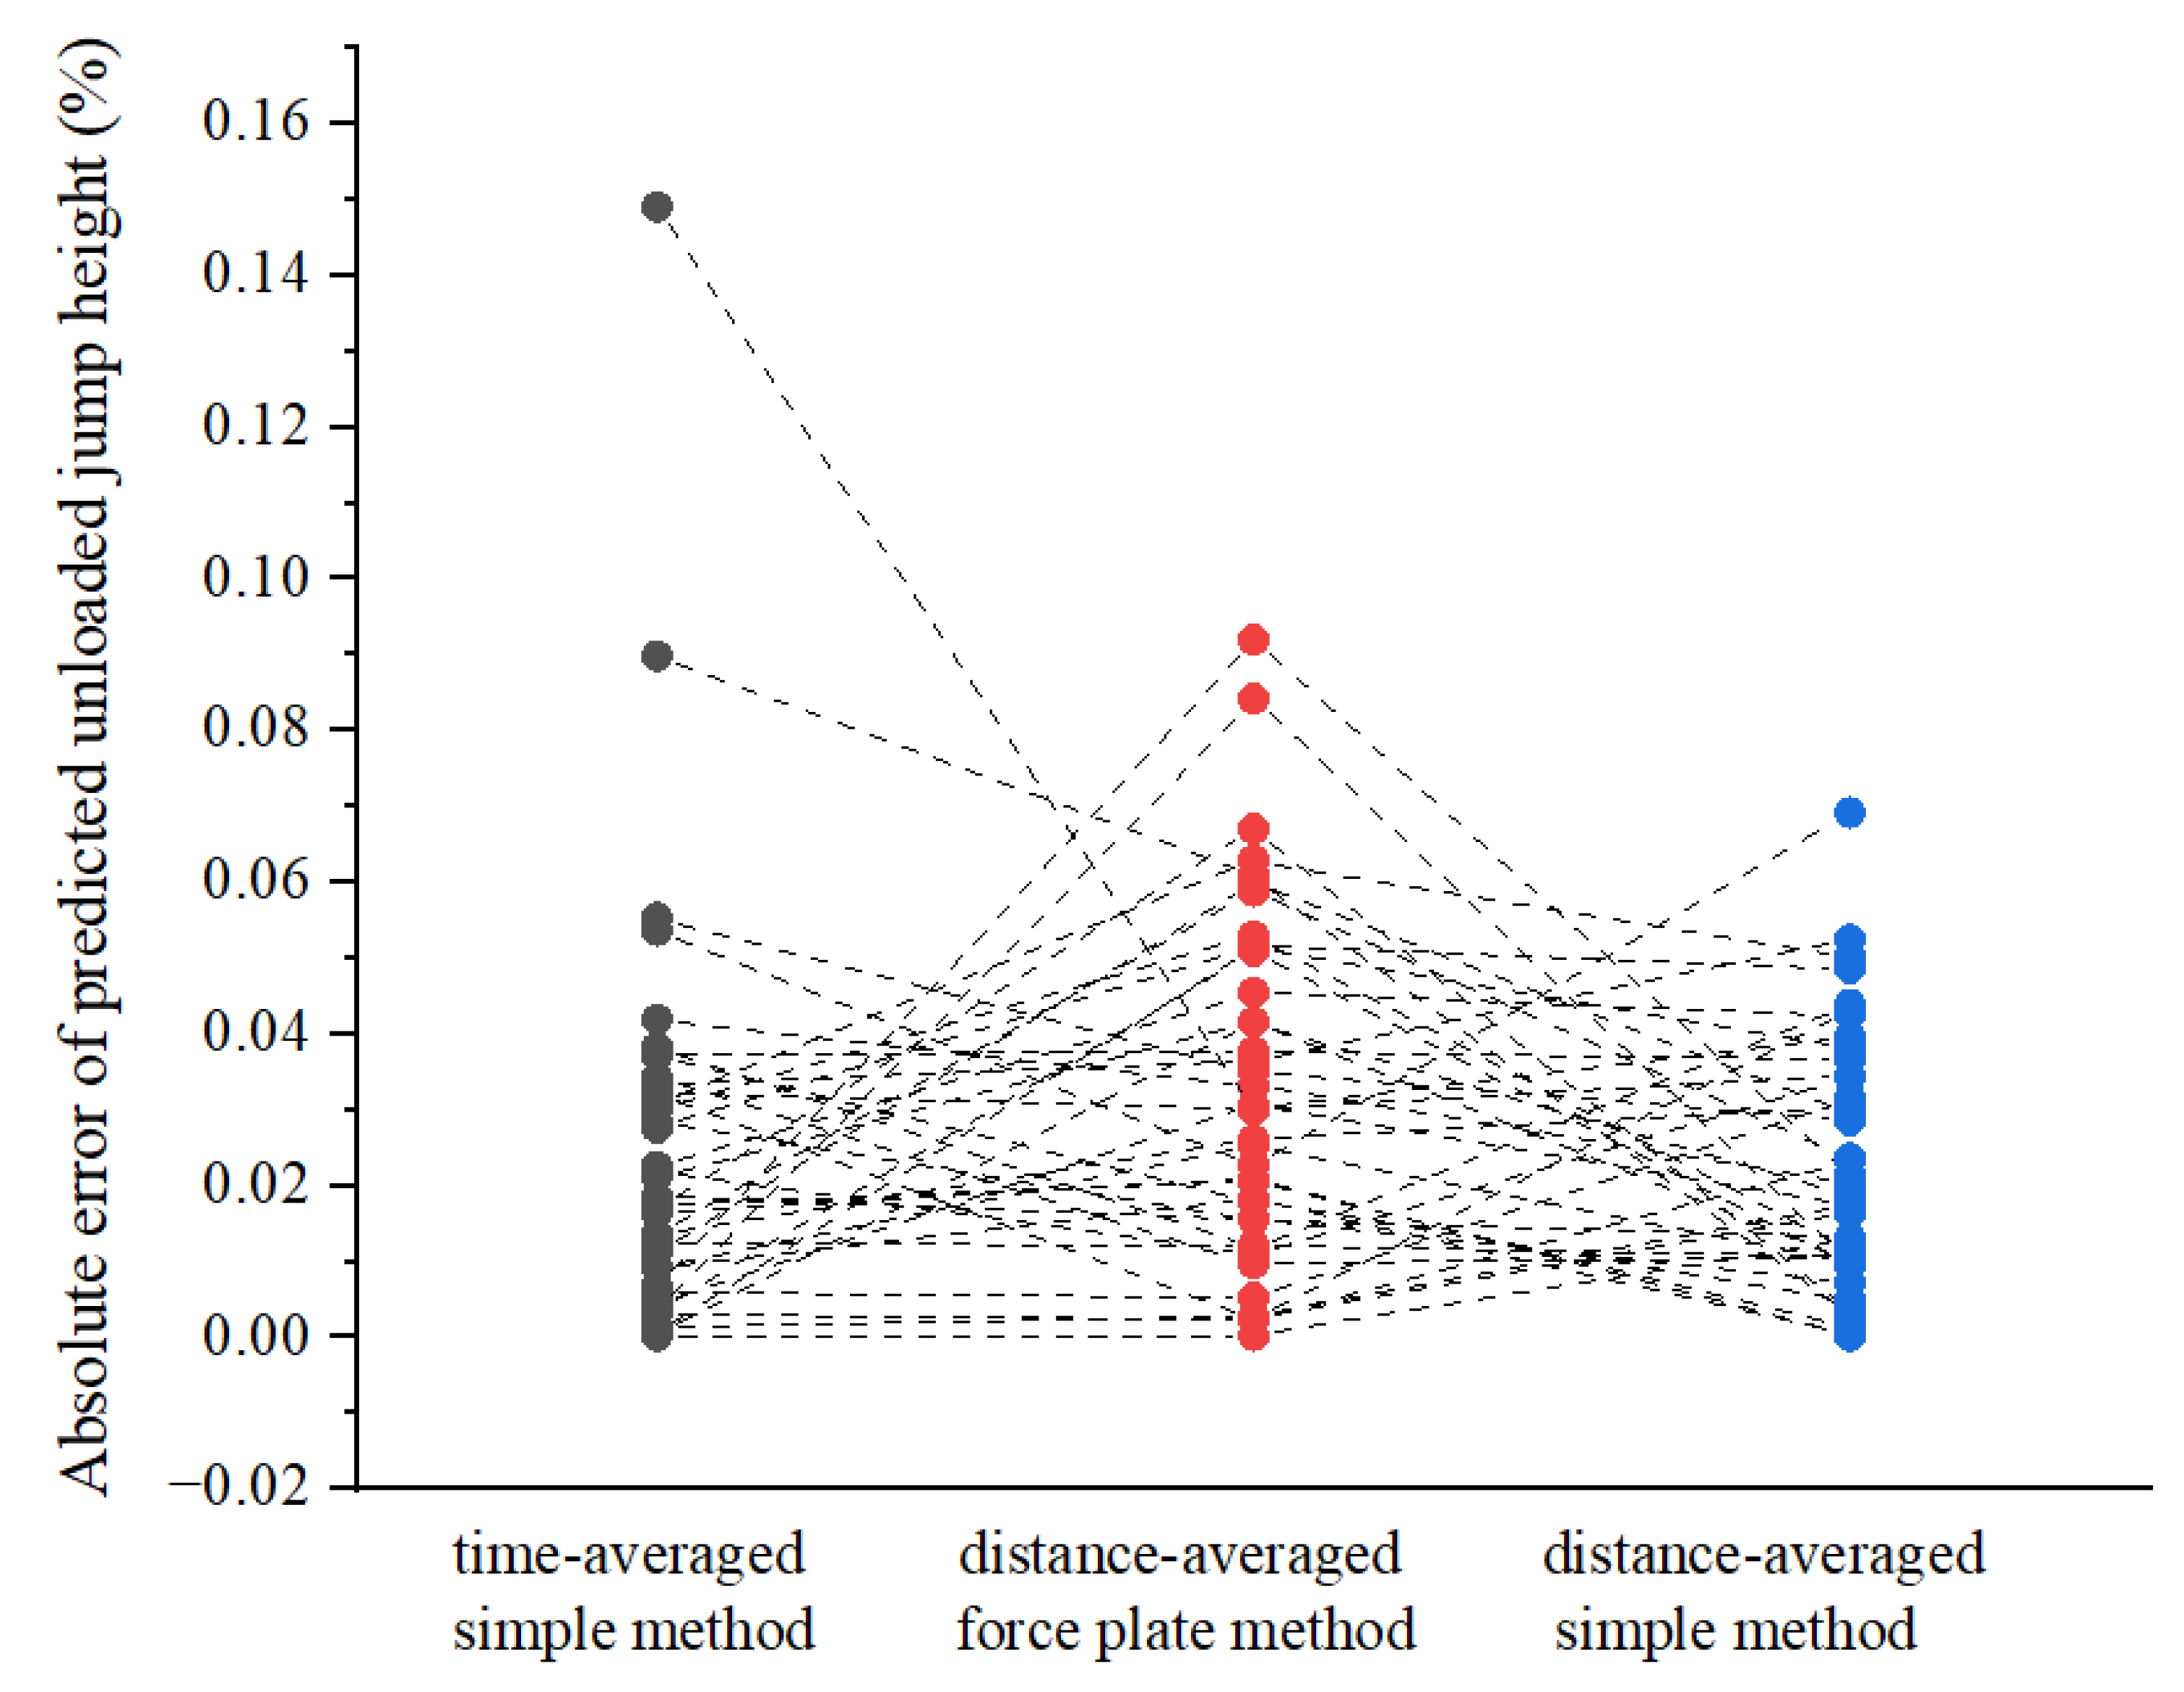
Significant differences were observed among the four models in the prediction of jump height (F 104.305, p < 0.001), with the time-averaged force plate method showing the greatest magnitude absolute errors (23.0% ± 12.0 %) compared to the other methods, while the distance-averaged simple method exhibited the lowest absolute error among the four method in around 2.3% ± 1.7%. The time-averaged simple method and the distance-averaged force plate method yielded absolute errors of 2.5% ± 2.7% and 3.2% ± 2.3%, respectively. Given that the magnitude of error in the time-averaged force plate method was substantially greater than that of the other three methods, individual error data for this method were not presented in
Figure 2.
The
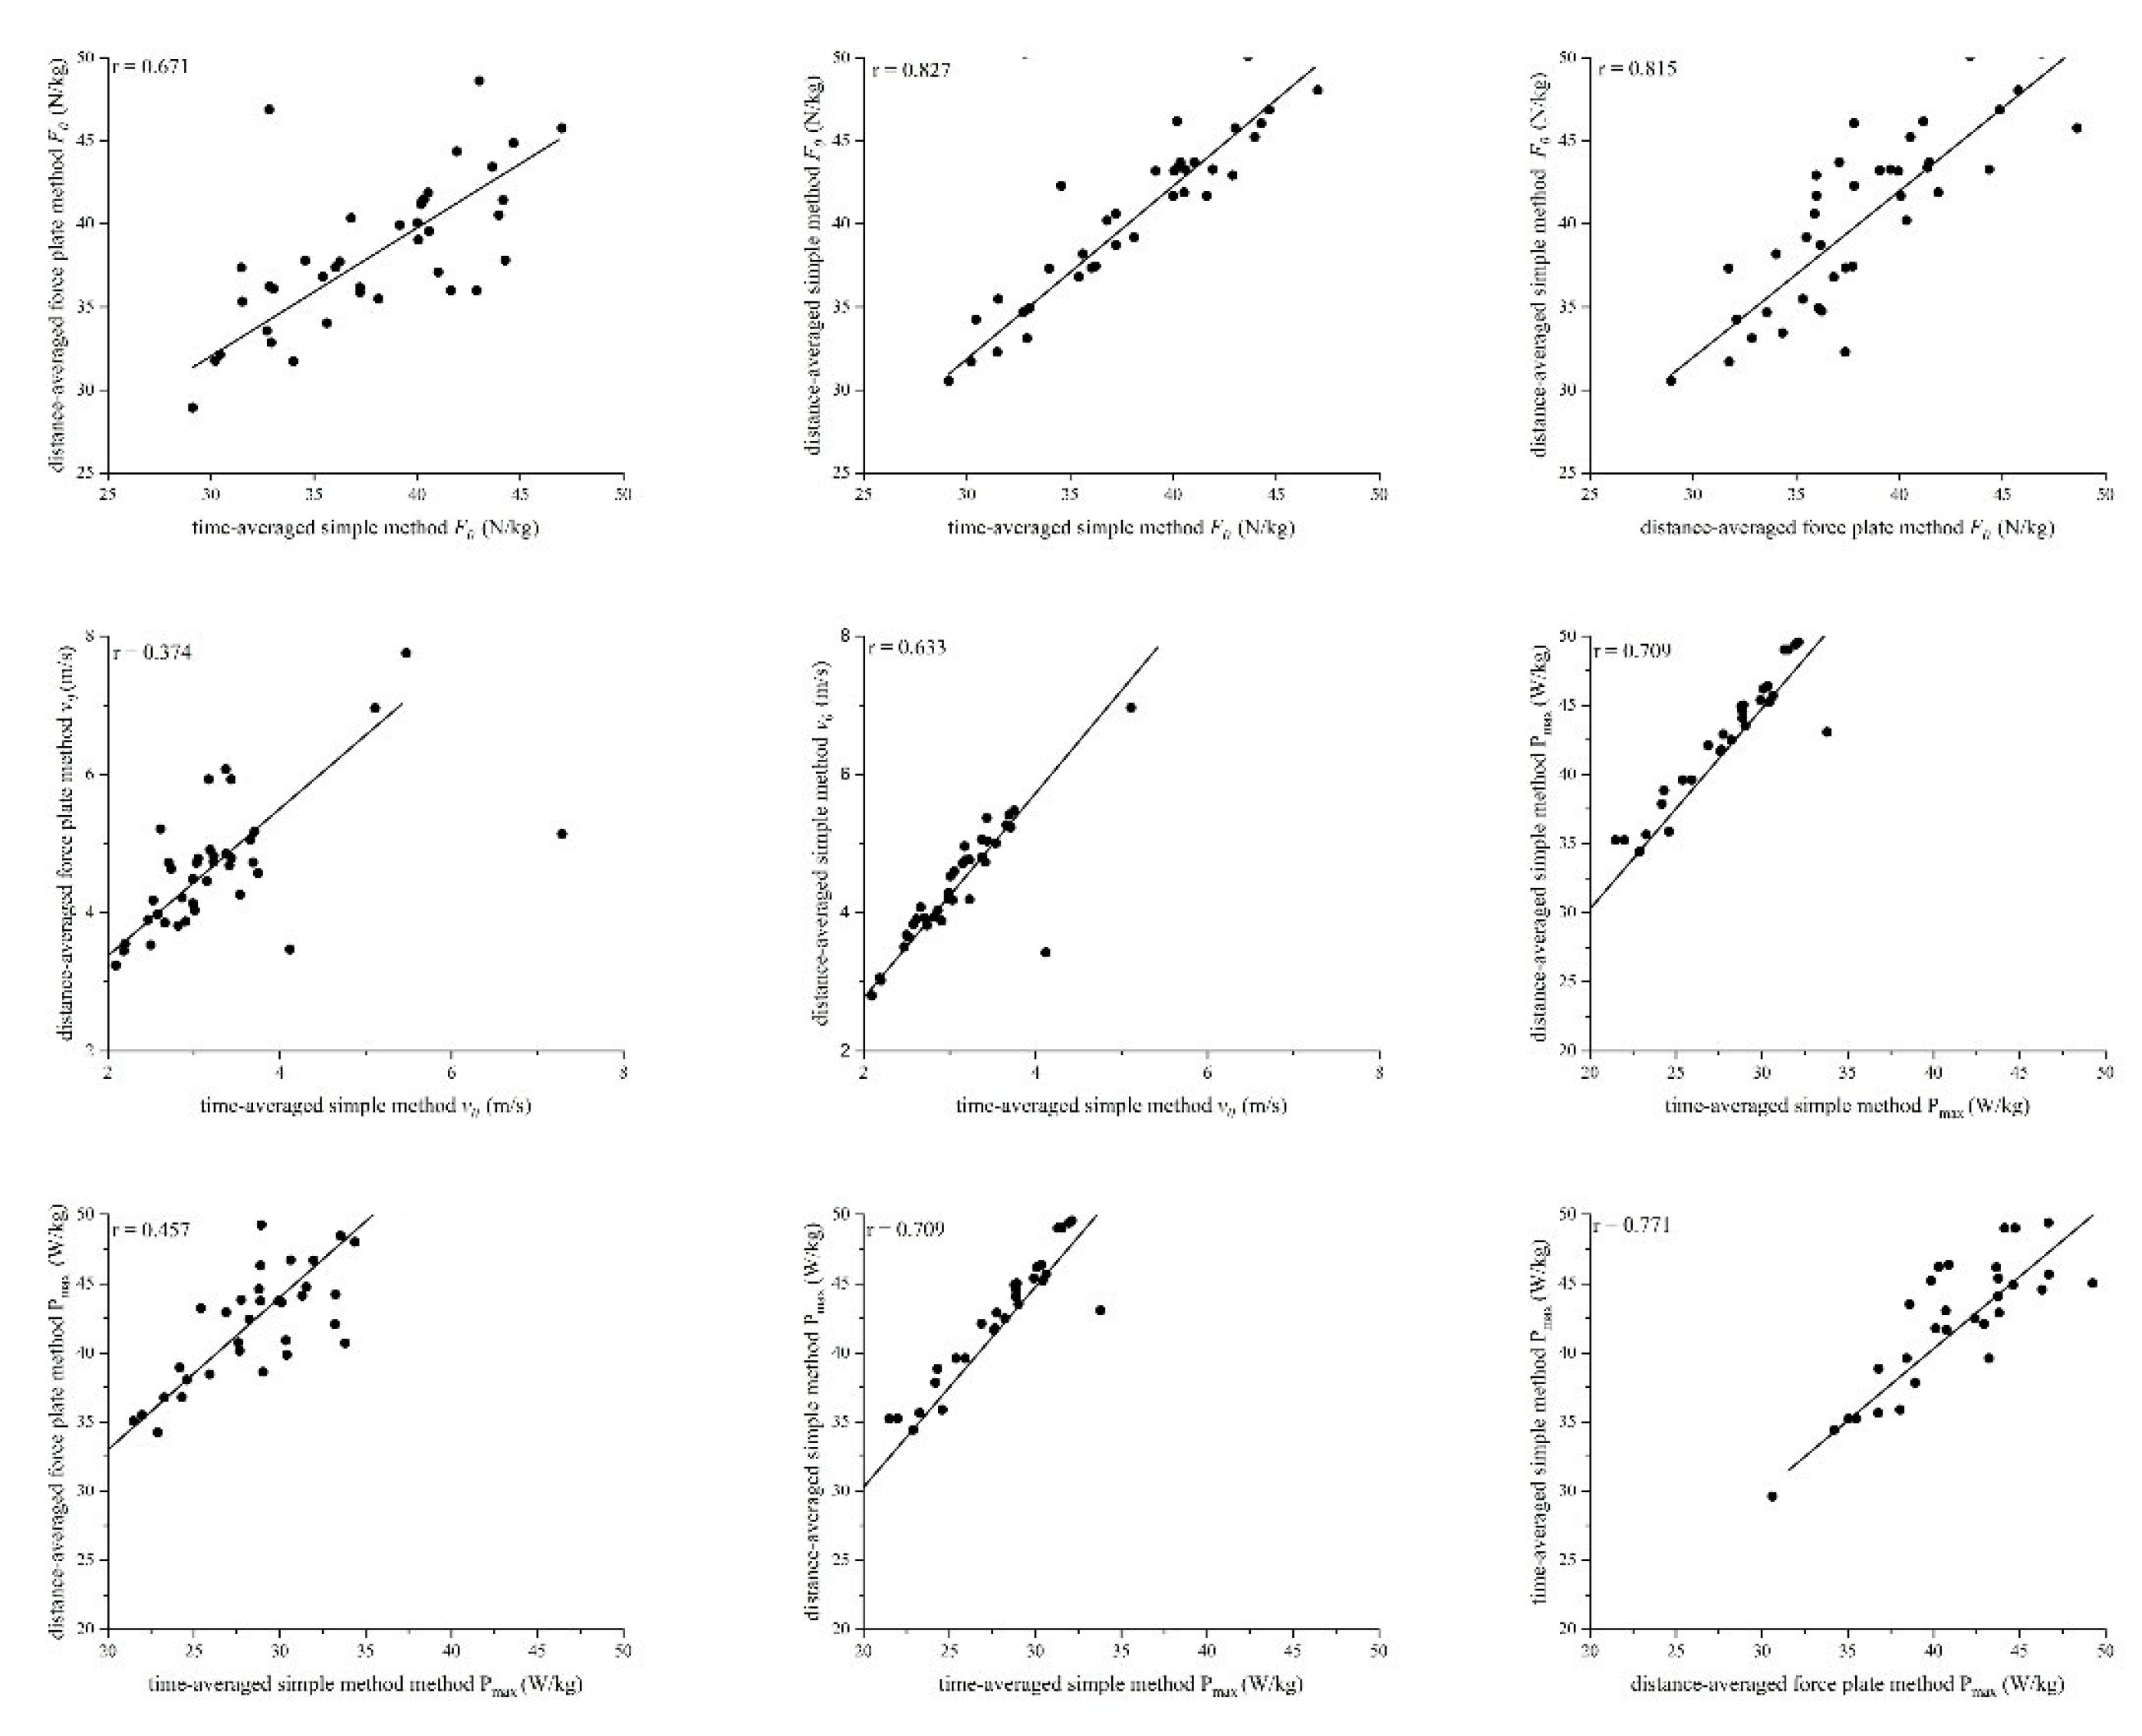
,
, and
showed moderate to very large correlated among the distance-averaged force plate method, simple method, and time-averaged simple methods (0.374 ≤ r ≤ 0.827)
(Figure 3). The two simple methods demonstrated large to very large correlations for all variables (0.633 ≤ r ≤ 0.827), and the two distance-averaged methods demonstrated very large correlations for all variables (0.724 ≤ r ≤ 0.815). The distance-averaged simple method significantly overestimated
by 6 % (40.63 ± 5.43 vs. 38.24 ± 4.42 N/kg, t = 4.008, p < 0.001) and
by 5% (45.78 ± 9.41 vs. 43.42 ± 6.25 W/kg, t = 2.445, p = 0.019) compared with the distance-averaged force plate method. However, no significant difference was found between
(4.63 ± 1.40 vs. 4.61 ± 0.95 m/s, t = 0.105, p = 0.917).
Theoretical Simulations and Potential Training Adaptation
Analyzing the monotonicity of Equation (10) reveals that the partial derivatives with respect to
,
, and
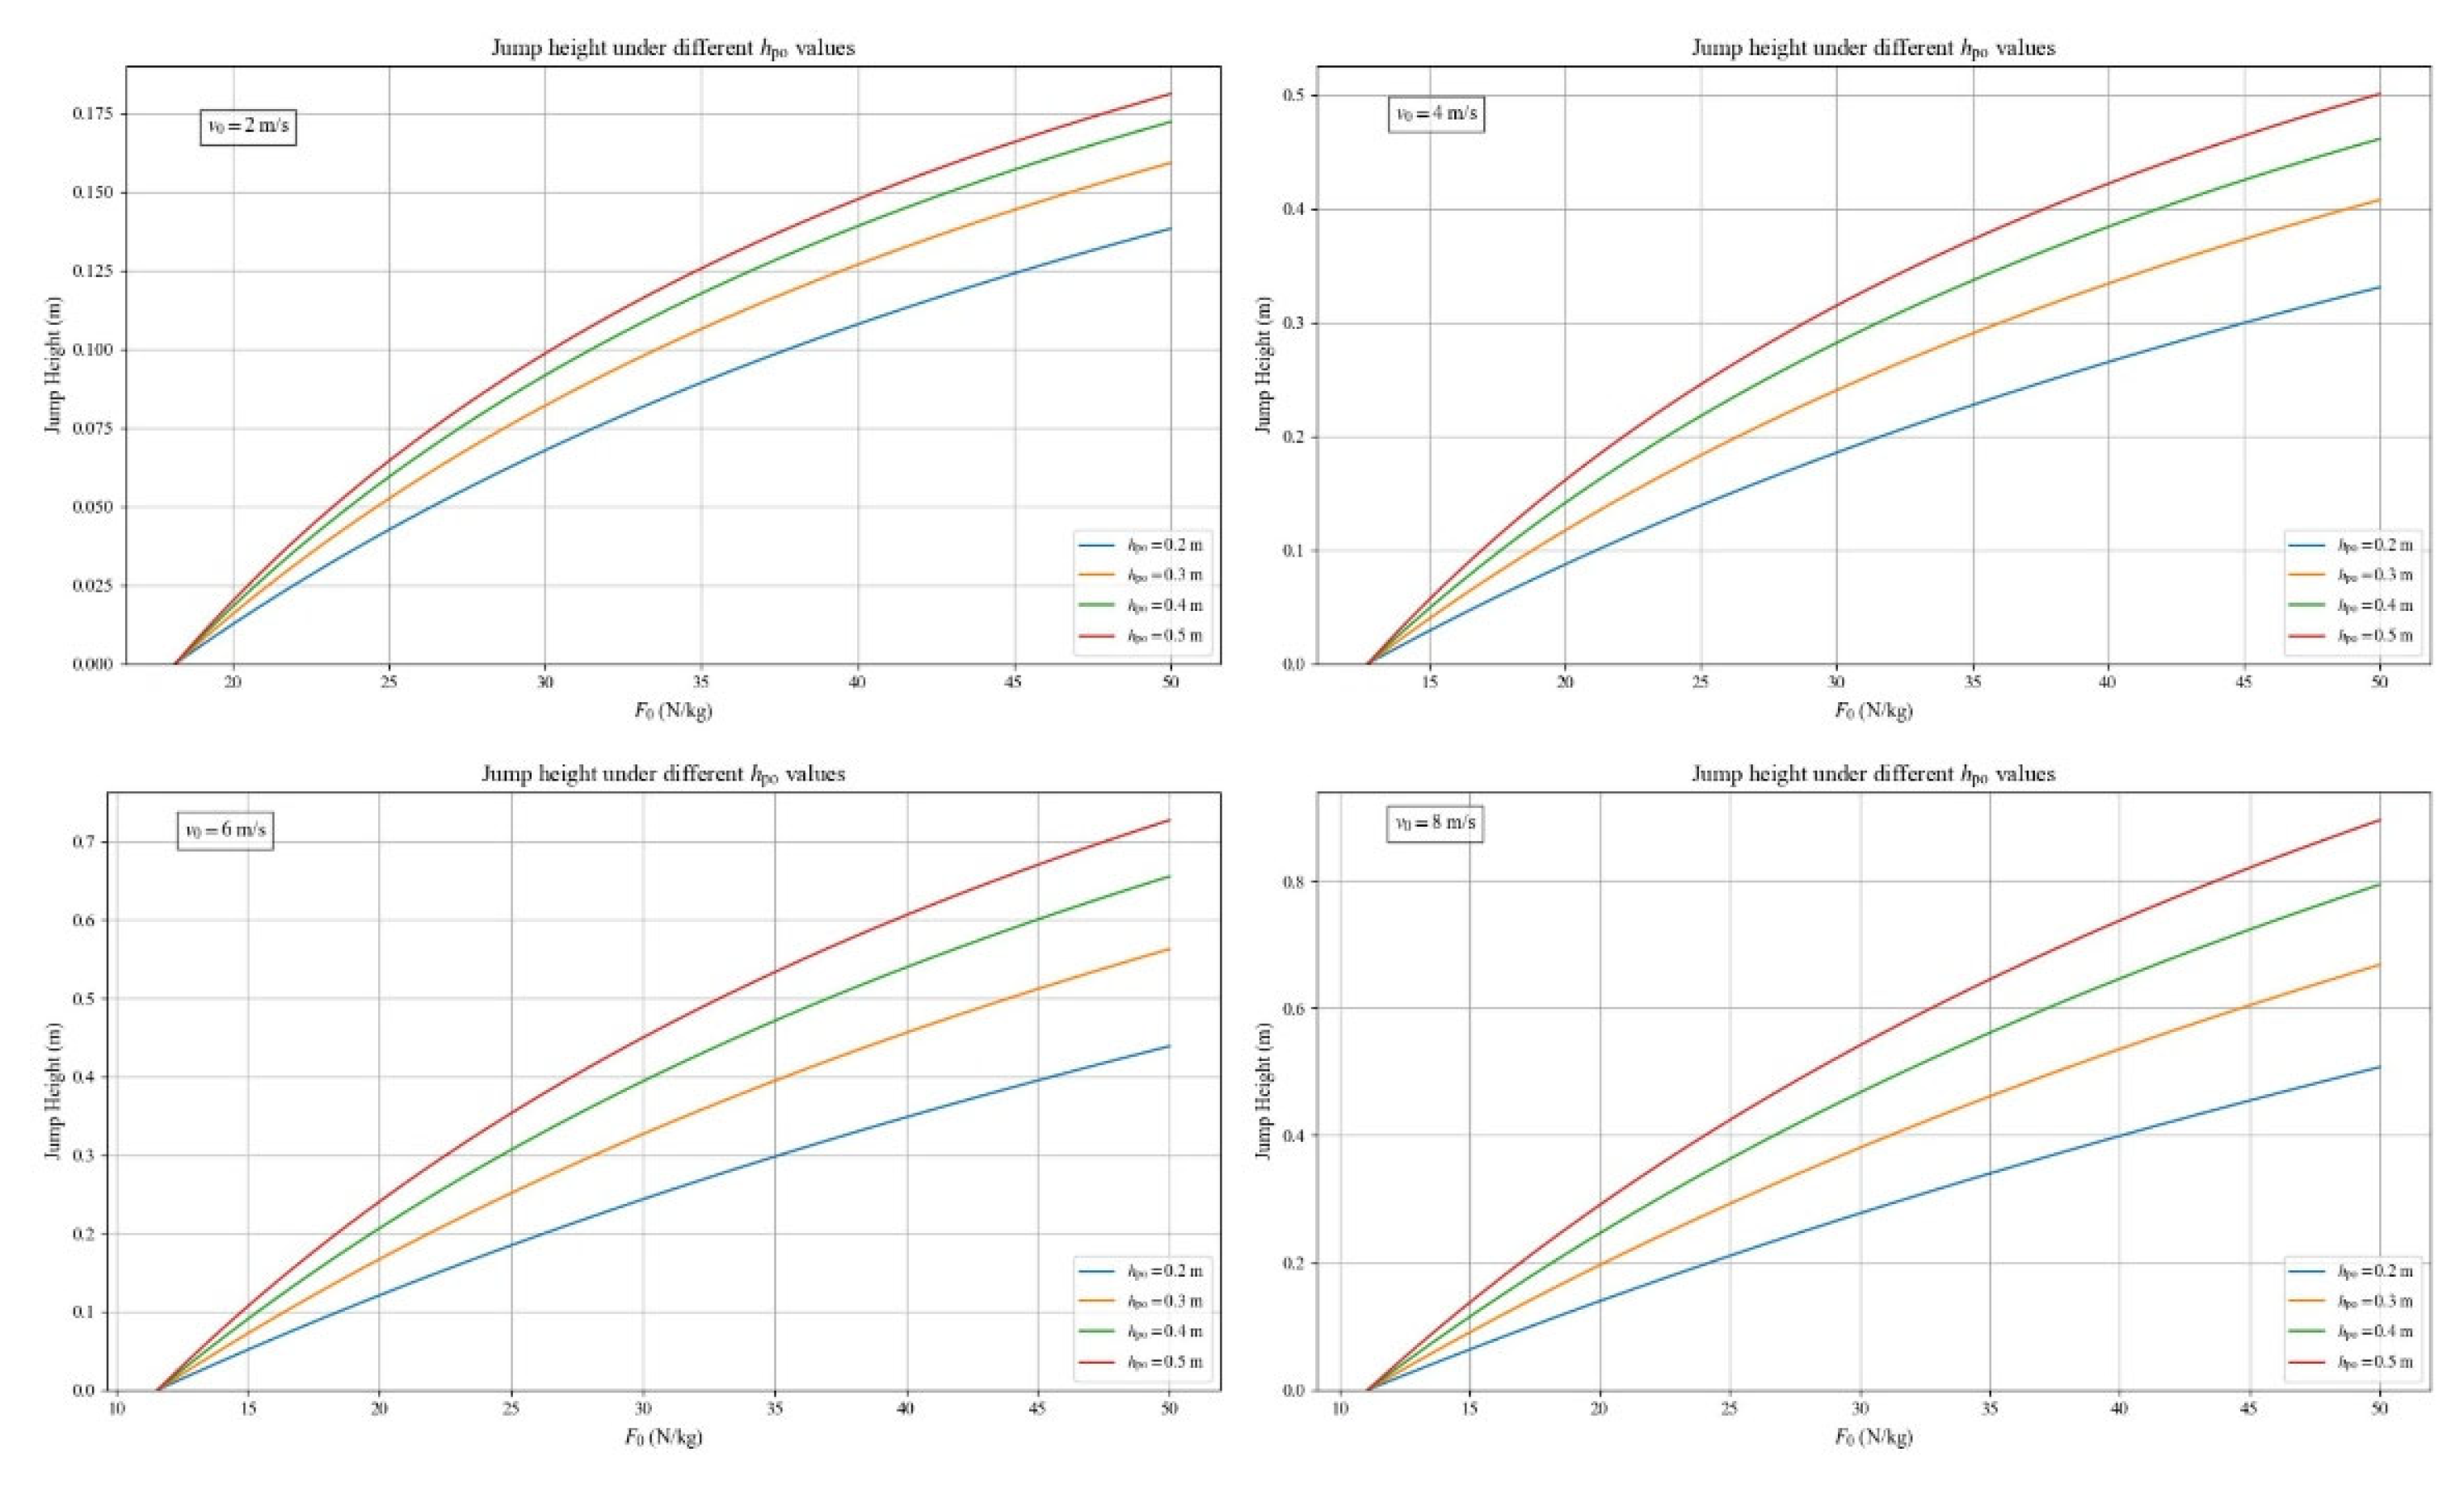
are all positive, as the numerator must remain greater than zero under conditions valid for jumping. Consequently, increases in any of these three variables lead to corresponding increases in jump height.
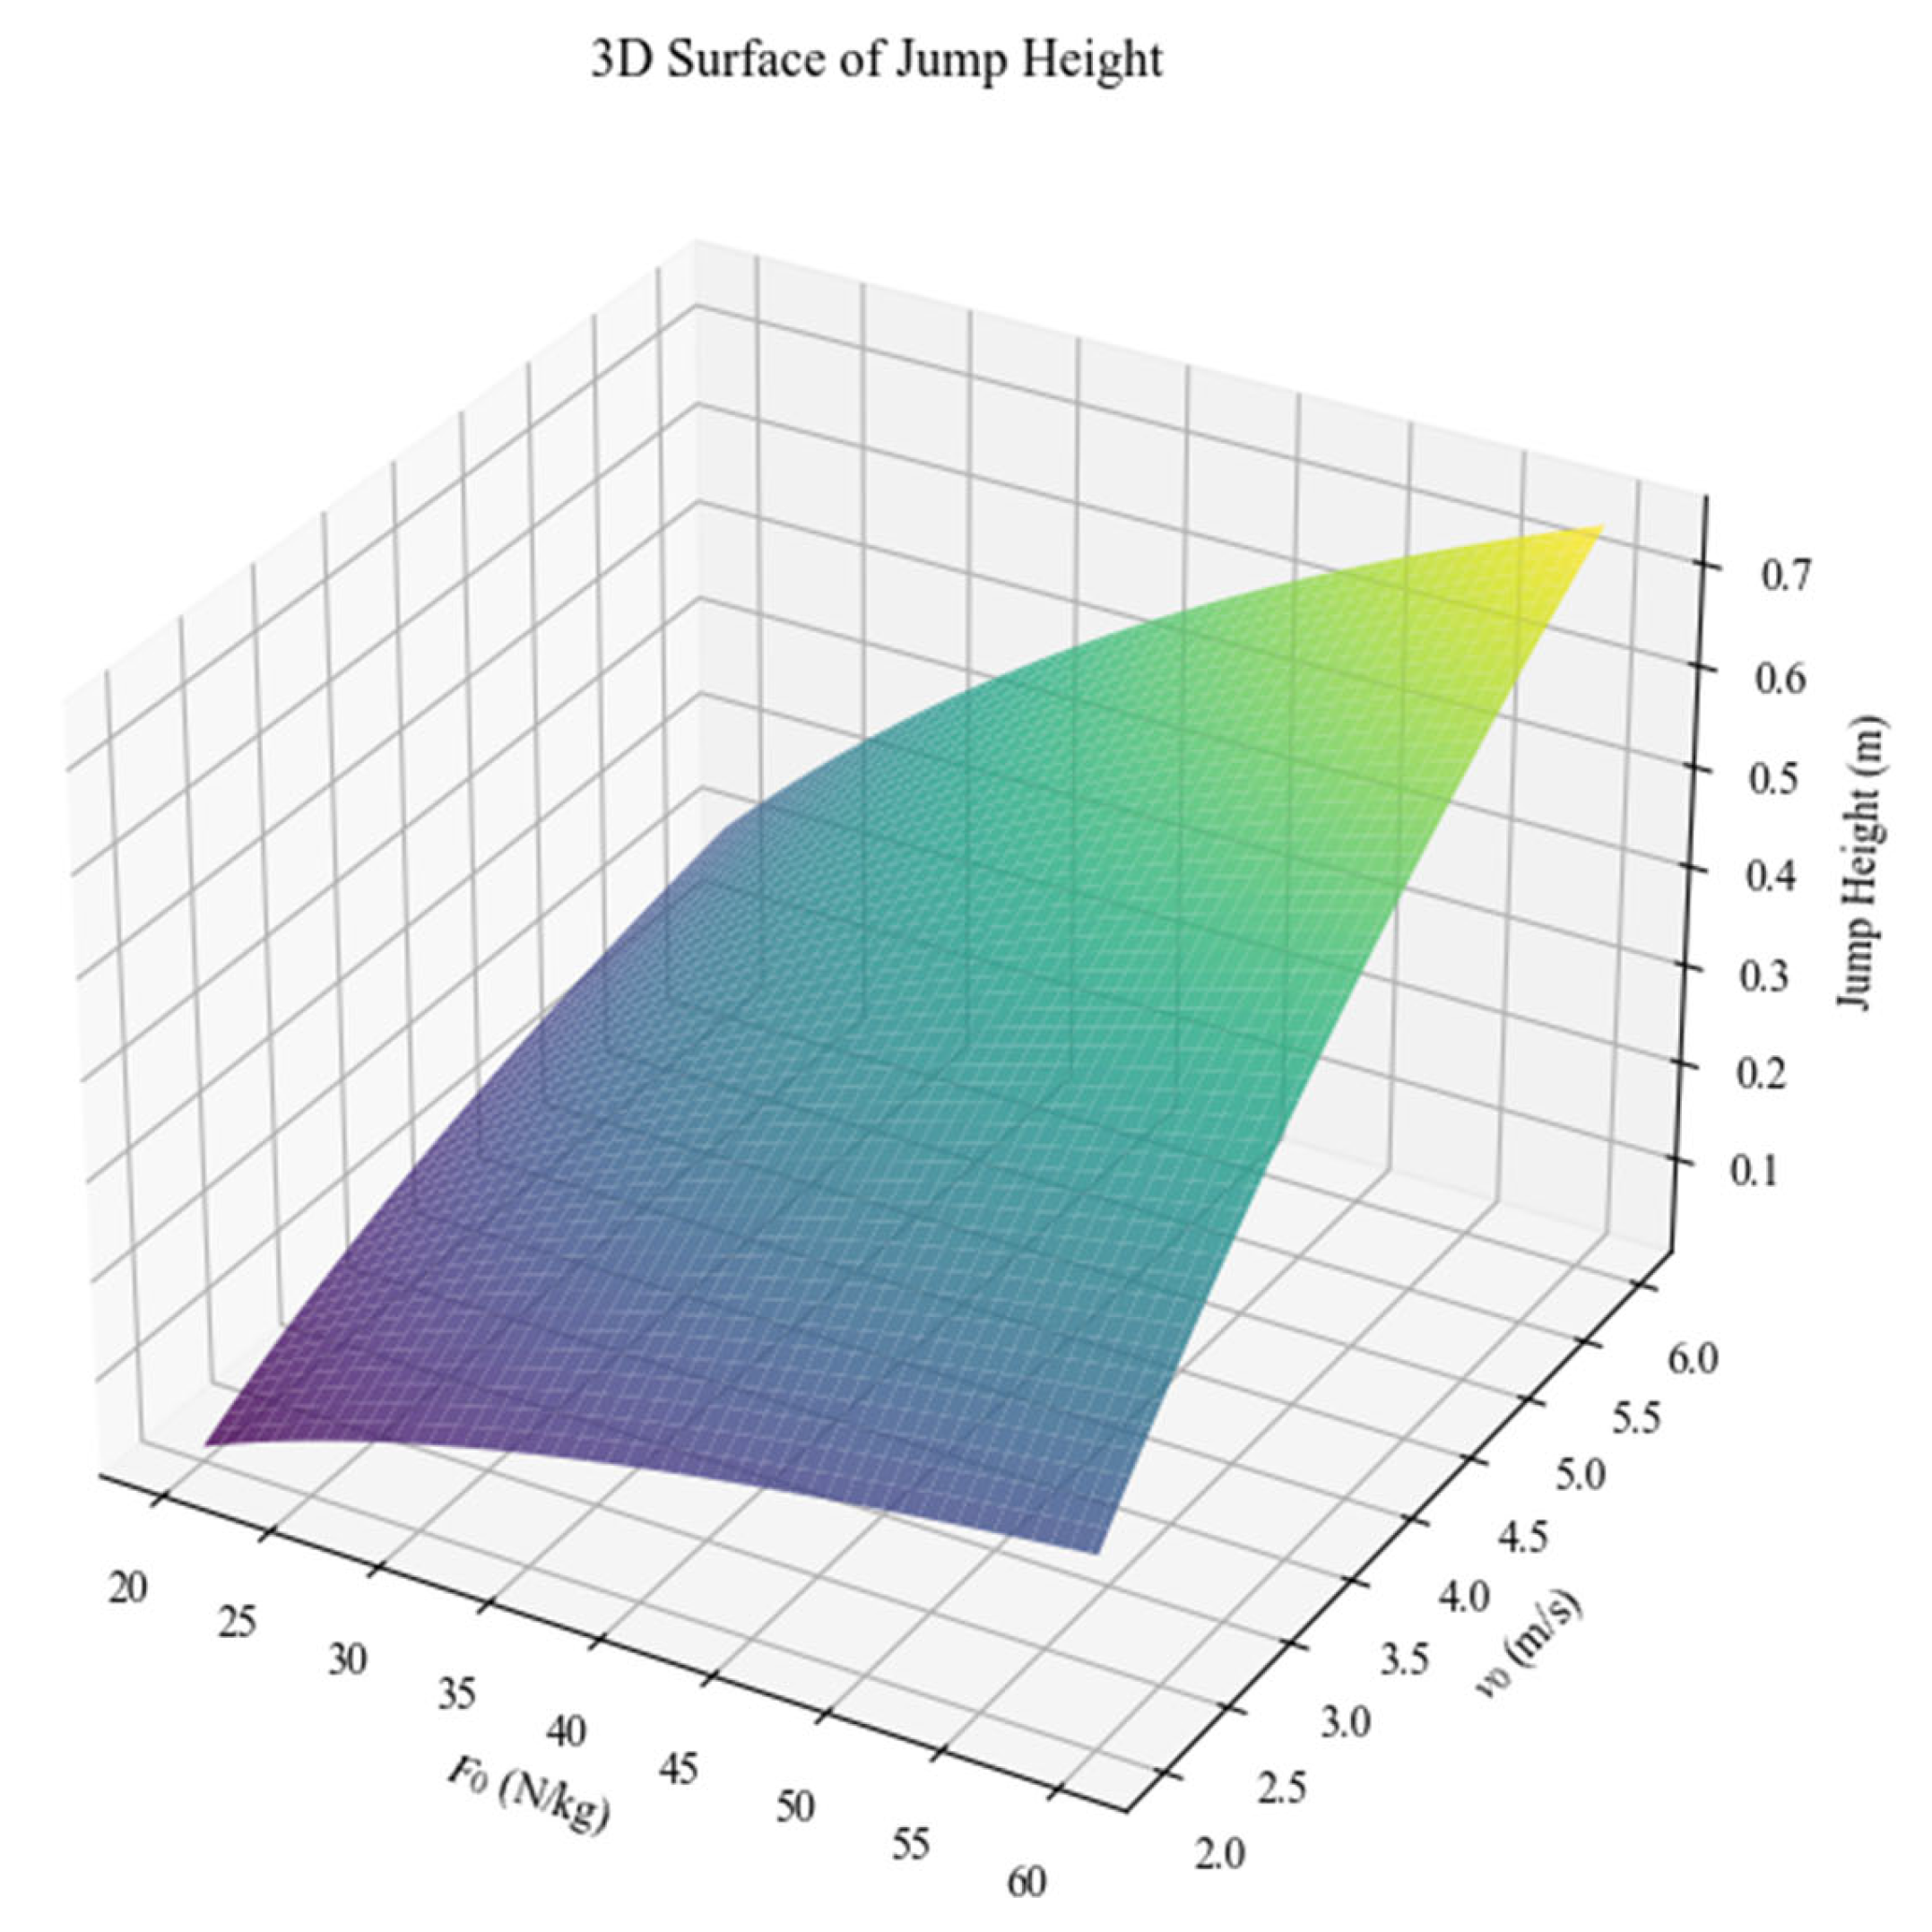
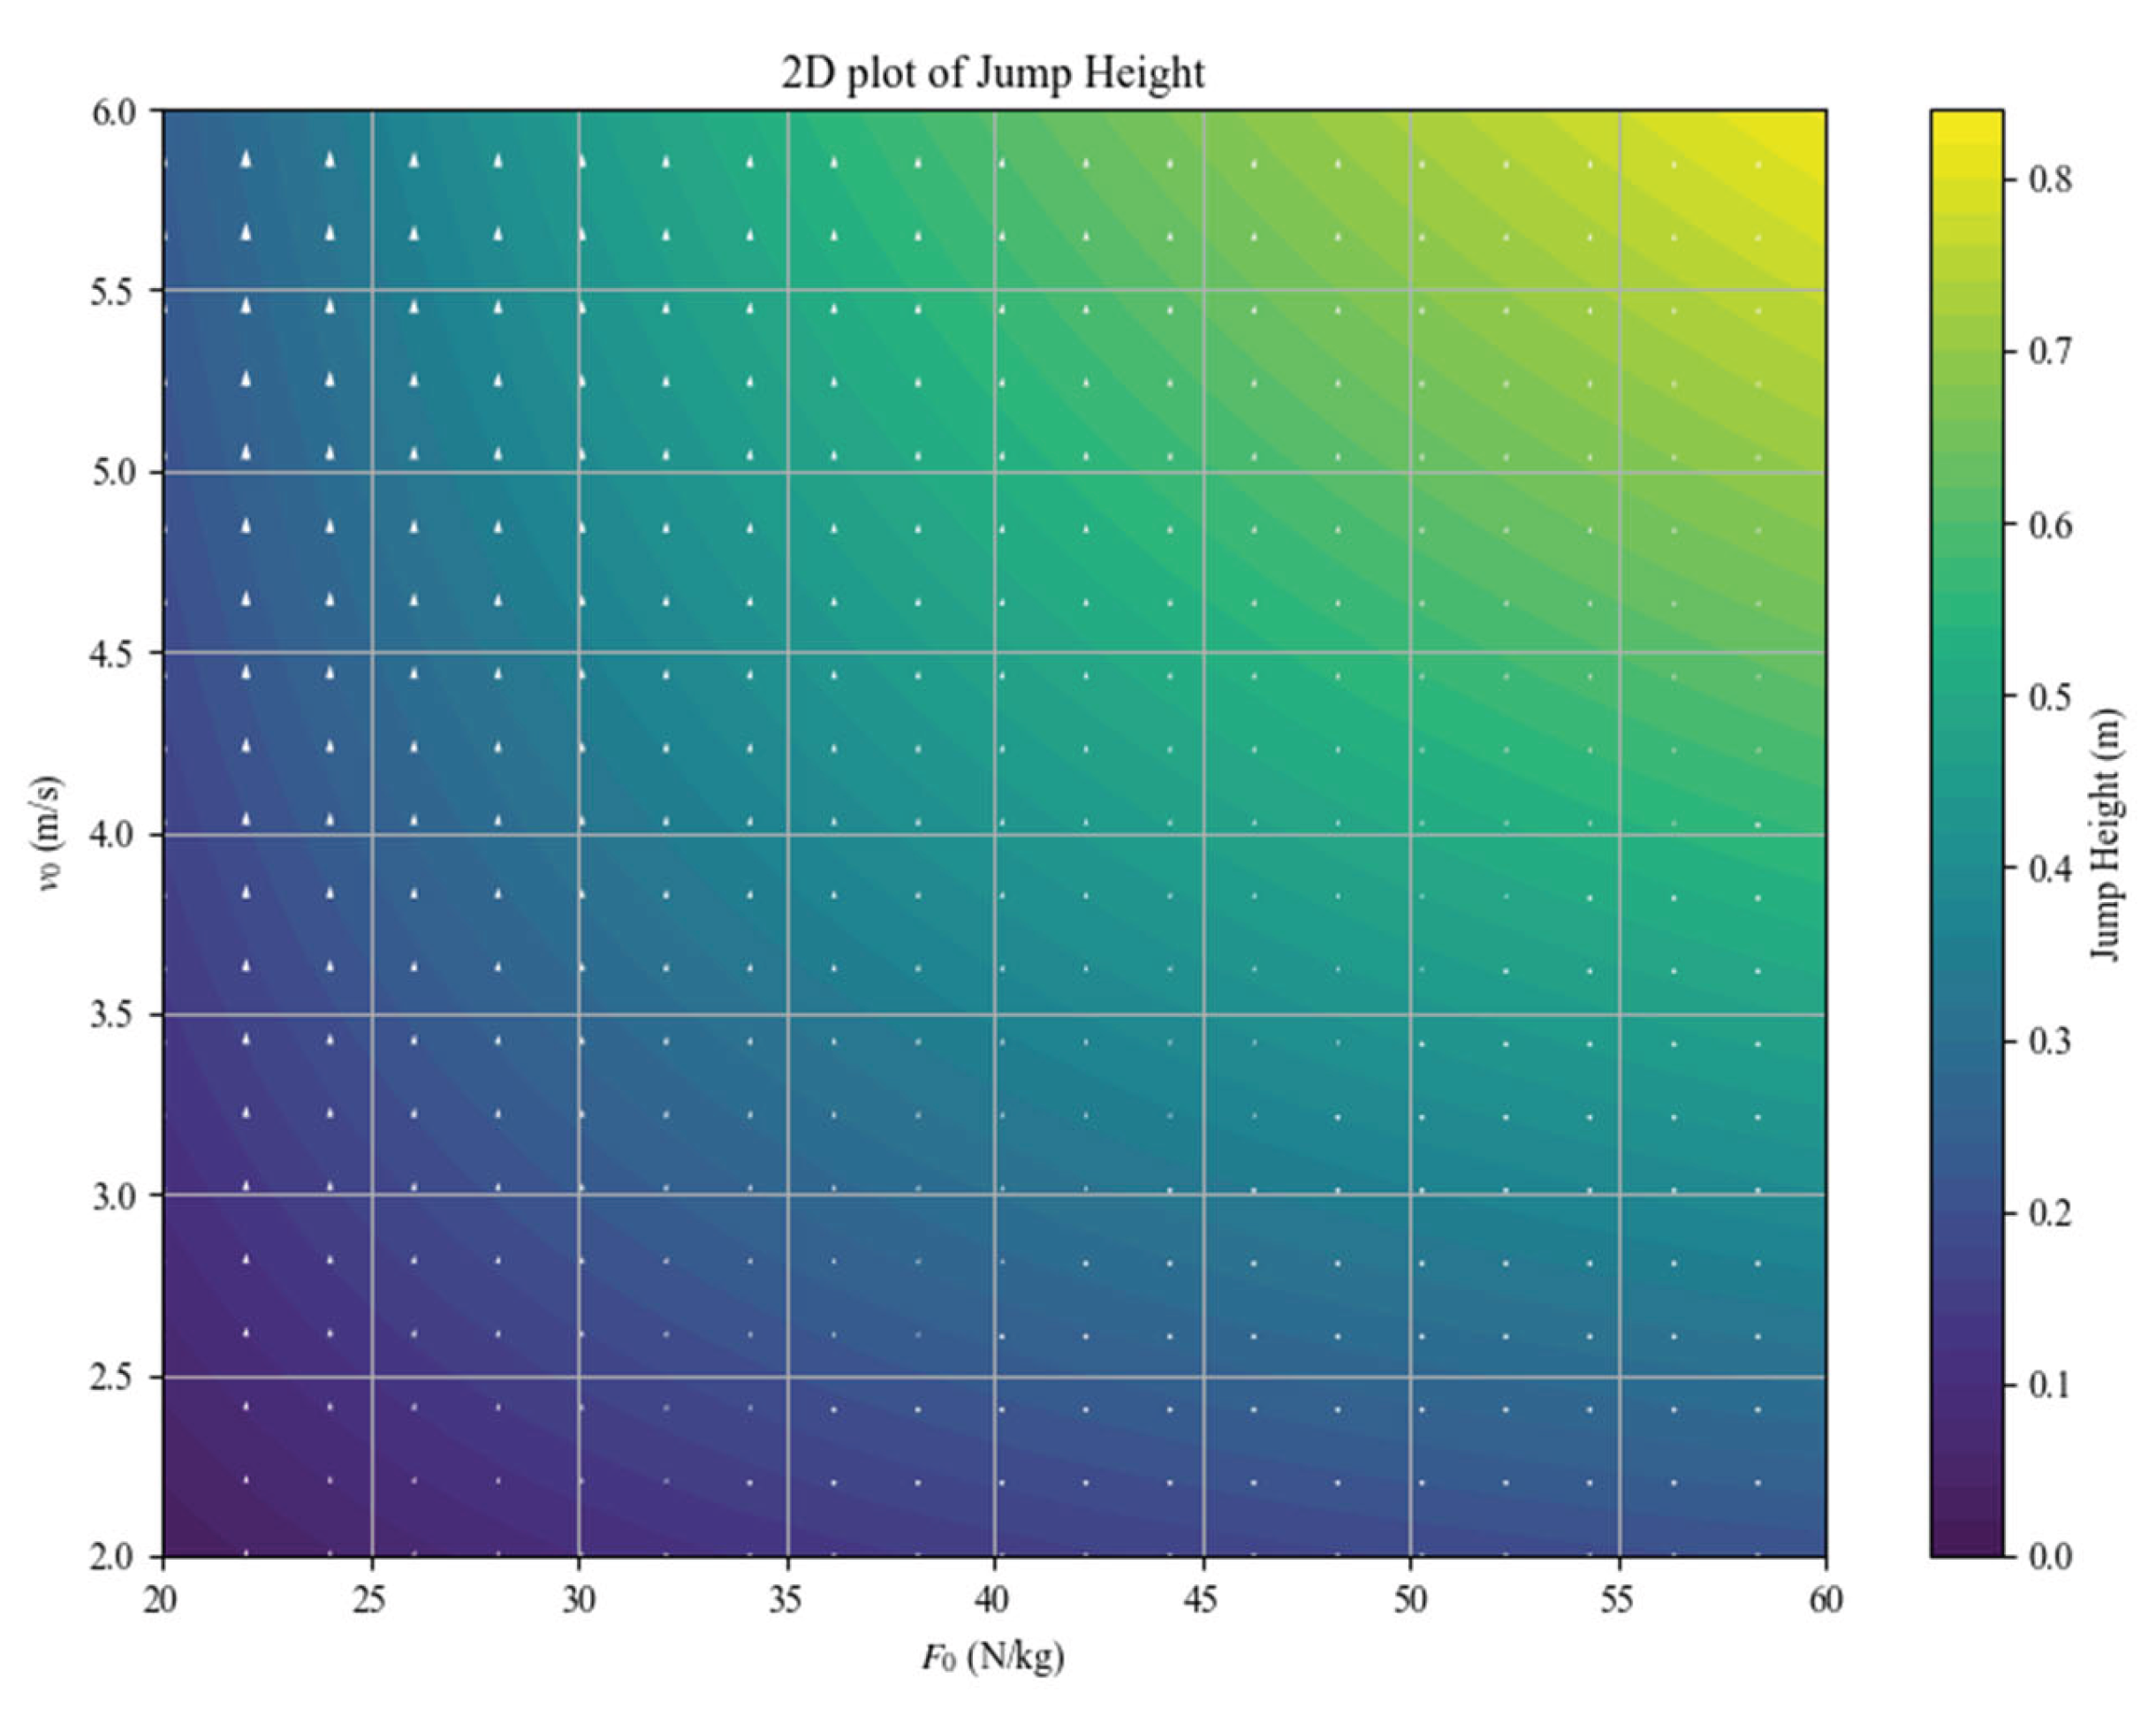
Figure 4 illustrates the effect of higher
on jump height across various combinations of
and
, while
Figure 5 depicts the influence of increasing
and
on jump height when
is fixed at 0.4m.
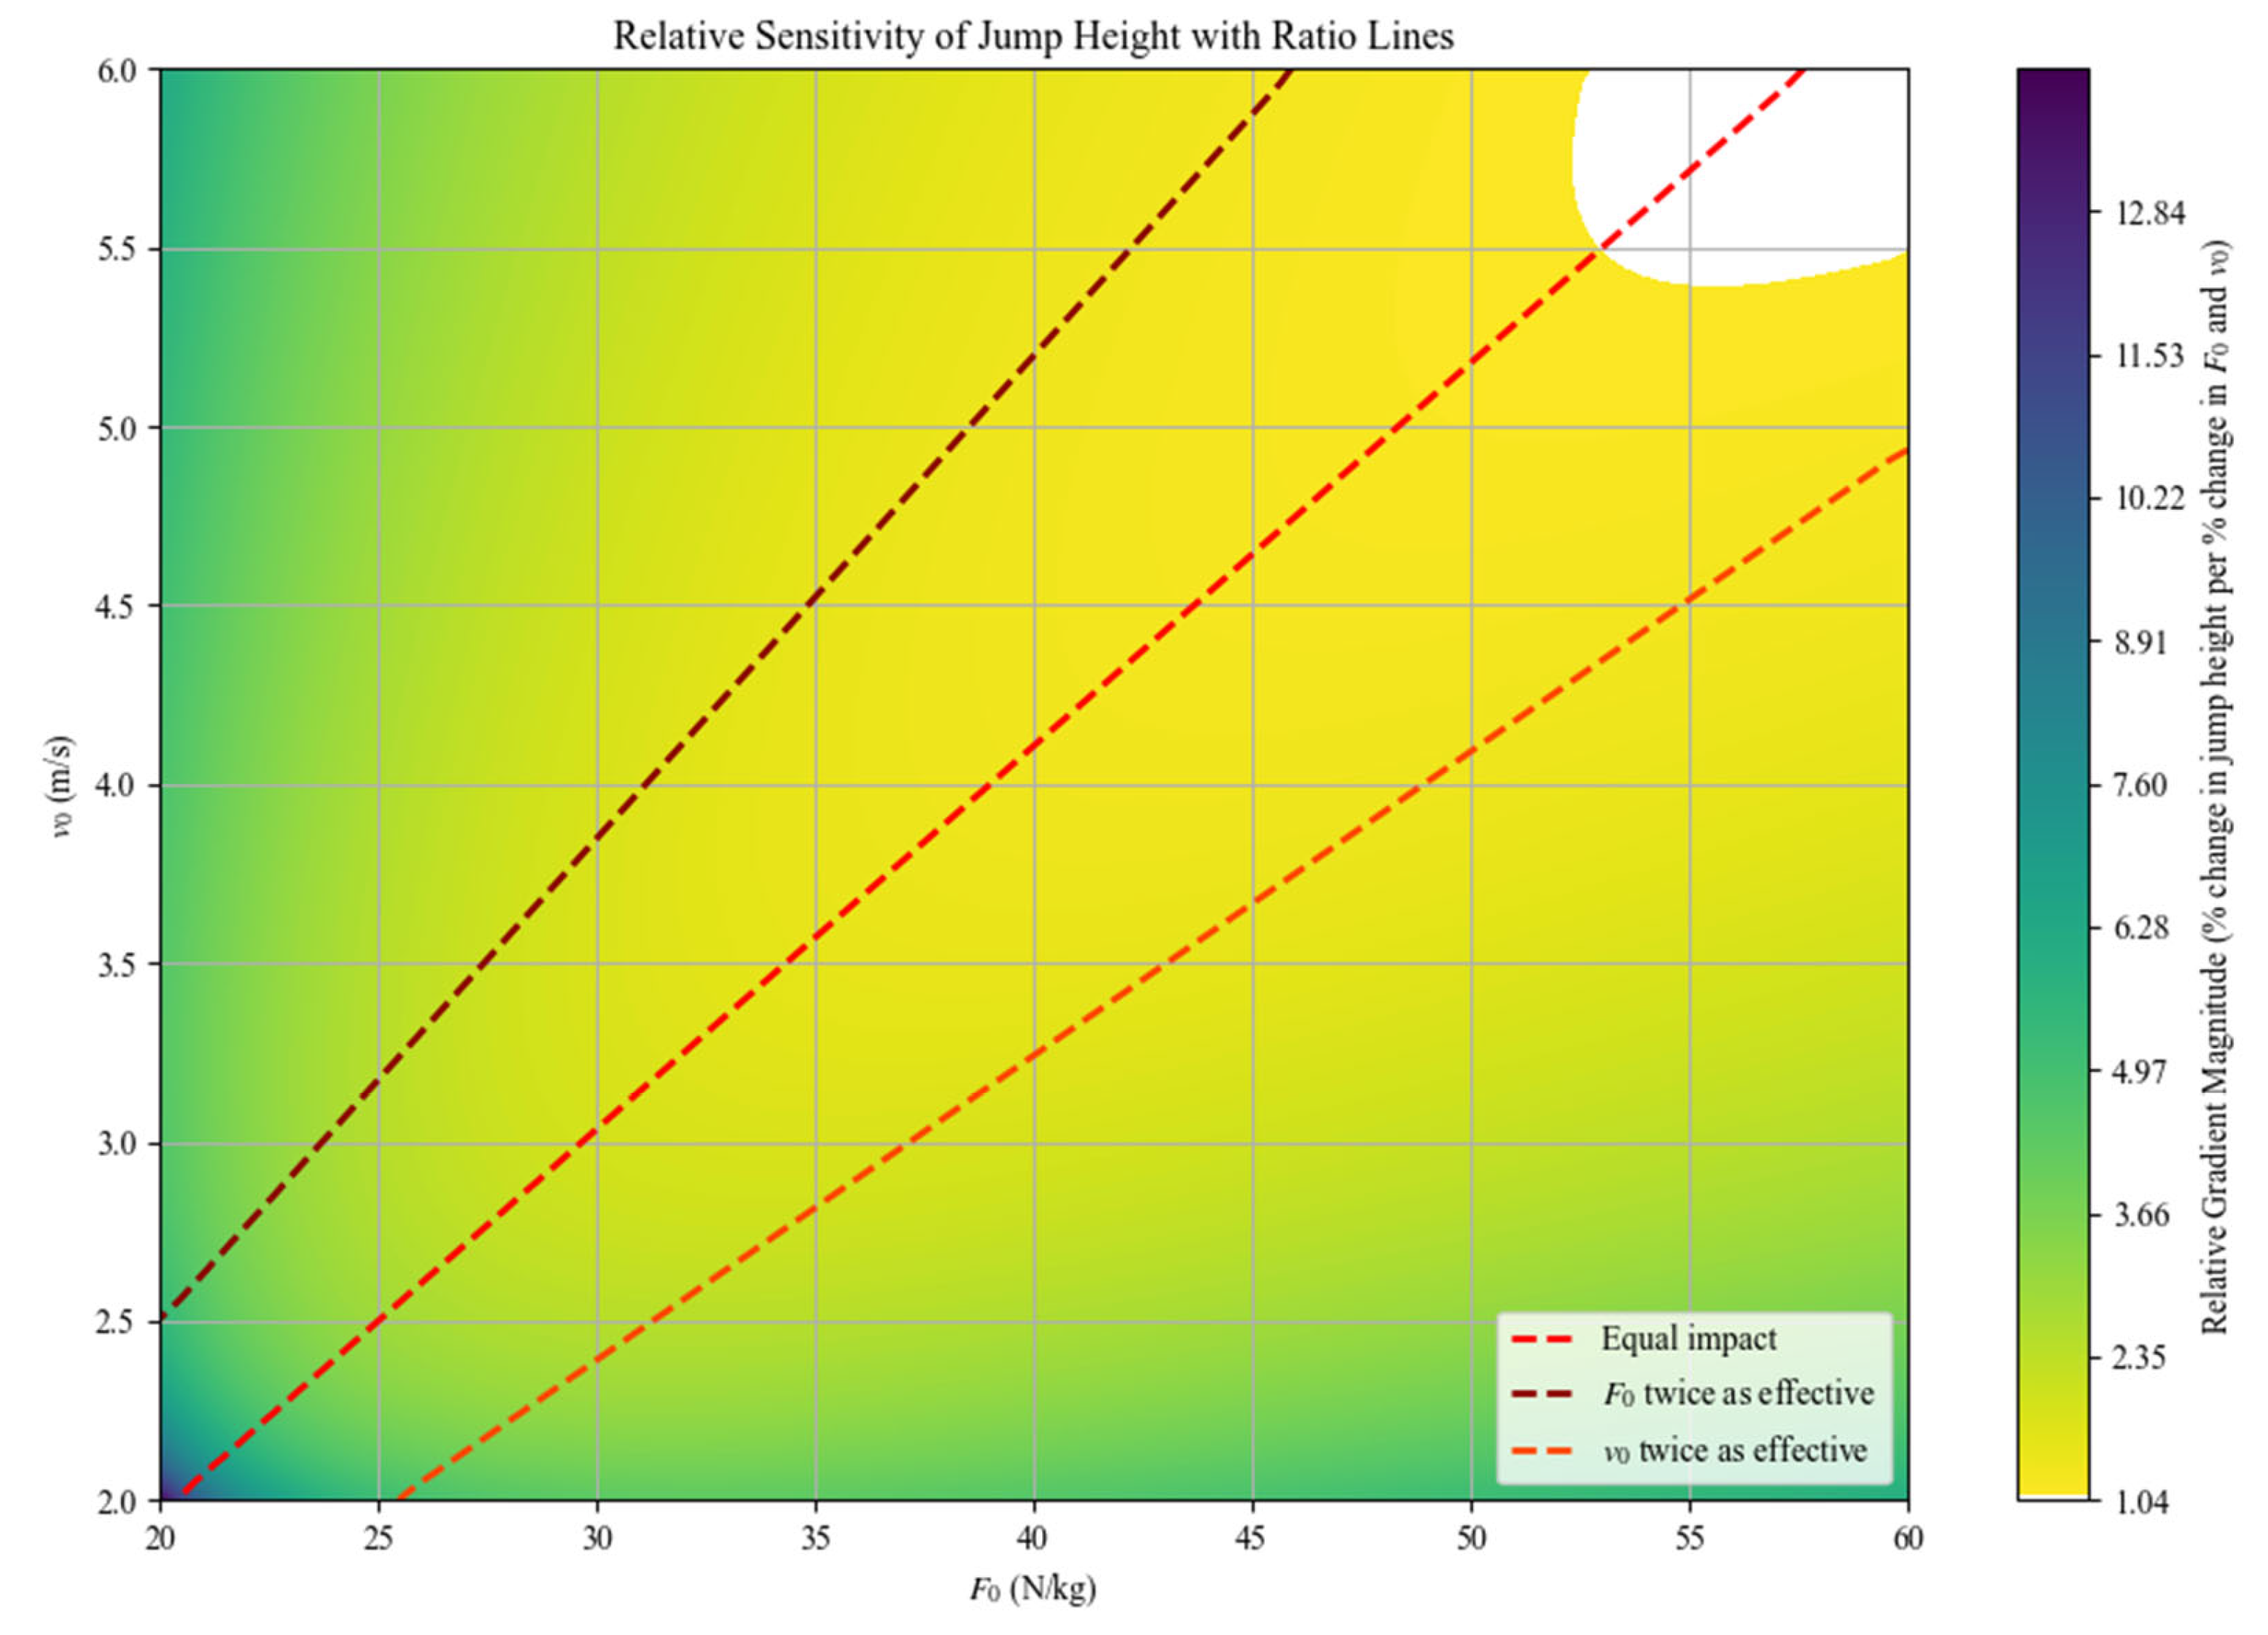
Figure 6 illustrates how the growth rate of jump height varies as a function of the percentage change in
and
, while
is held constant at 0.4m. Notably, the highest growth rates are observed in the lower-left region, where both
and
are low. Similarly, in the upper-left and lower-right corners, the growth rate of jump height remains high when either
or
is high and with the other intercept very low. Meanwhile, the three lines in the figure divide the plot into four regions, corresponding to where the effect of increasing percentage of
on jump height is greater than twice, between one and two times, between 0.5 and one times, and below 0.5 times that of
. Different regions may reflect the
with respect to the Samozino et al. method [
9]. Therefore, the more extreme the
deviates, the faster the rate of jump height improvement. Well-trained individuals tend to experience greater difficulty improving their jump height compared to populations exhibiting either force or velocity deficits.
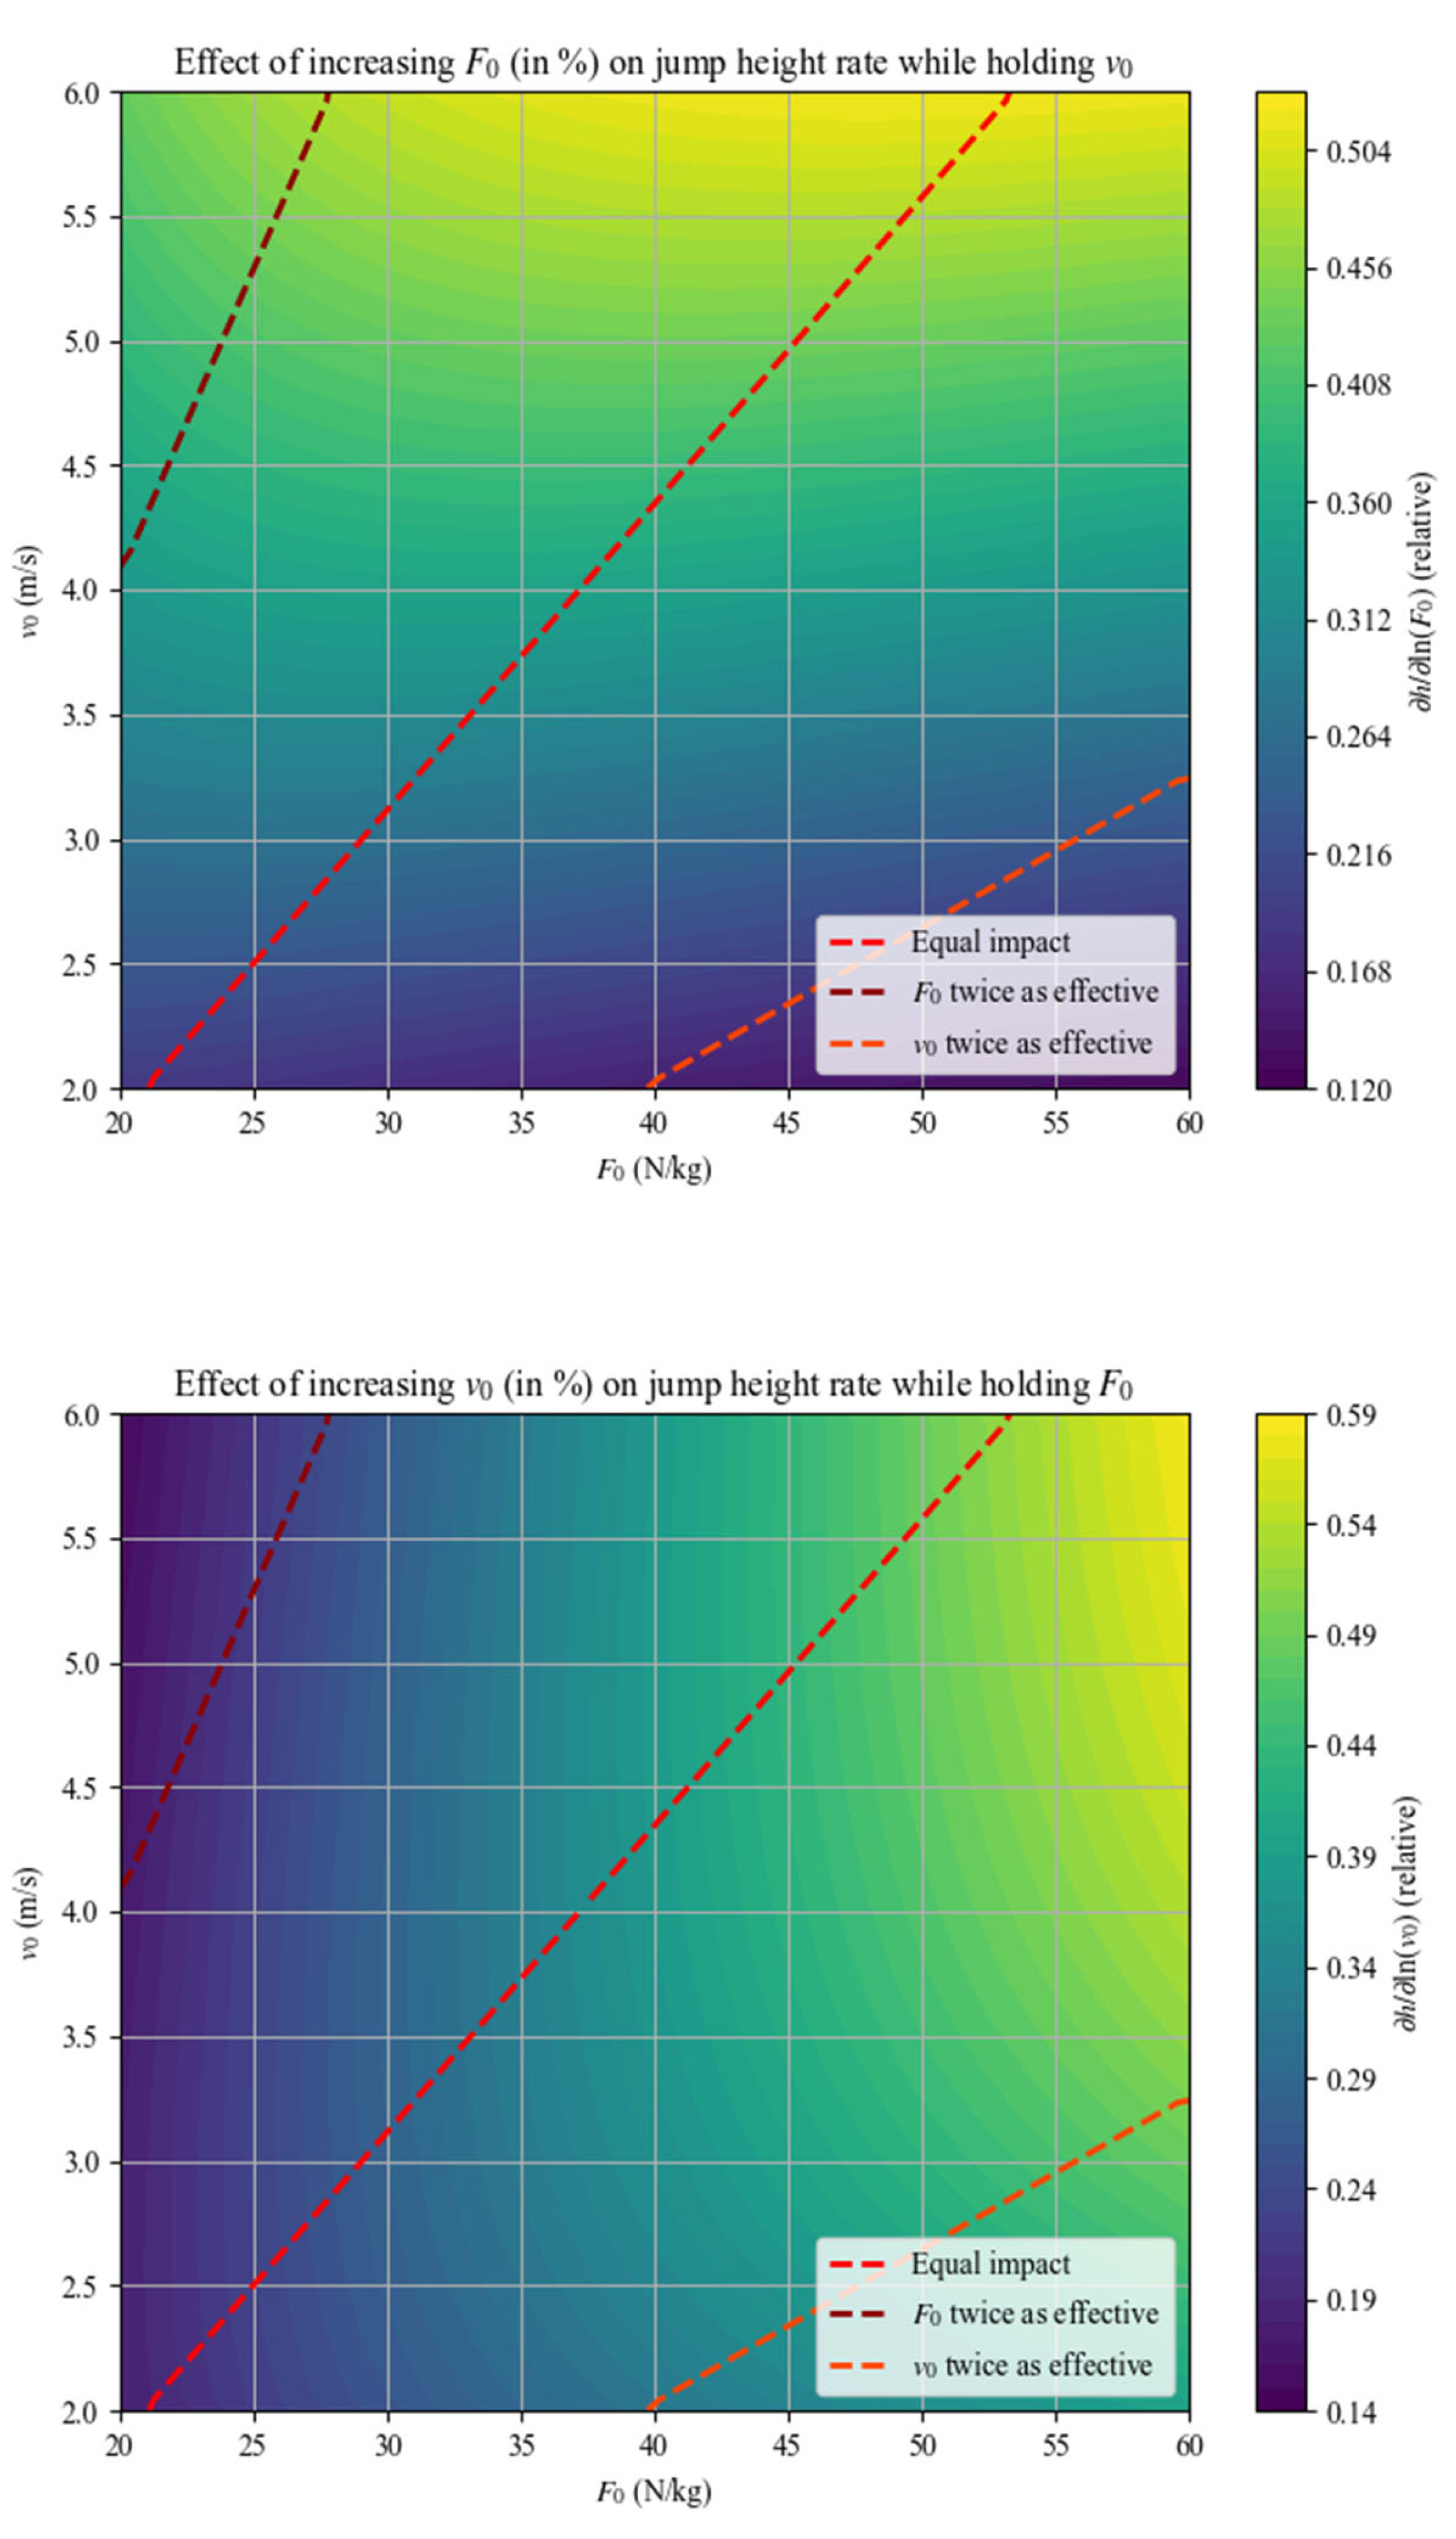
Figure 7 shows how the growth rate of jump height changes when the partial derivatives of equation (10) are taken with respect to the percentage change in
and
, respectively, while
is held constant at 0.4. As can be seen by comparing the upper and lower panels, individuals with large
and small
experience faster jump height growth when
increases, while those with small
and large
exhibit faster growth when
increases. The line segments in the figure show where increases in the percentage change of
have double, equal, or half the effect on jump height growth rate as that of
. This indicates that the benefits of increasing the percentage change of
and
on jump height are not consistent for all individuals, justifying the need for individualized training.
The
derived from the distance-averaged force plate method exhibited a nearly perfect correlation with that obtained from the distance-averaged simple method (r = 0.981). Furthermore, the
from the two distance-averaged methods showed a large to very large correlation with the
calculated using the time-averaged simple method. The ranges of the
and
are presented in
Table 3.
Discussion
This research was designed to prove the superiority of the distance-averaged model to predict jump height and guide individualized training. The three following findings support the superiority of the distance-averaged : (1) the difference between the force plate method and the simple method in calculating average force and velocity from squat jump was much lower for the distance-average method compared to the time-averaged method; (2) the distance-averaged model showed nearly perfect linearity and lower errors were observed in predicting jump height compared to the time-averaged method; (3) the simulation revealed that , , and all contributed to greater jump height. However, increasing and by the same percentage did not lead to the same growth rate in jump height; in some cases, the difference in their effects was around two and five tenths.
Validity of Simple Method in Different Averaged Method
Simple methods based on time- and distance-averaged used the same formula (1) to calculate mean force from work performed over displacement, yielding numerically identical results. However, the time-averaged force plate method derived
by integrating force over time and then averaging it. This method did not result in the same value as
. Our findings were consistent with previous studies showing that
was lower than
[
6,
17]. The magnitude of this underestimation, however, varied across studies and may be attributed to factors such as the presence or absence of the countermovements, differences in force onset detection, and variations in participants’ familiarity with the task [
23,
24,
25]. The divergence between
and
is attributable to the temporal and spatial weighting inherent in each method. During squat jumps, the athlete undergoes a phase of increasing acceleration followed by a phase of decreasing acceleration. The
metric assigns greater weight to the prolonged phase of increasing acceleration, during which the accumulated velocity and corresponding distance remain low [
26]. Consequently, this phase contributes minimally to the displacement-based average, resulting in a relatively shorter weighting in
. Conversely, phases with higher velocity contribute more substantially to the value of
. Therefore,
emphasizes the longer-lasting, low-velocity phase, yielding a lower value compared to
. The
obtained by integrating force over time, as well as the
, calculated by multiplying
by
, could further amplify the discrepancies between the two methods. The difference in
could be as much as around 30%, and the correlation between the two methods decreased to only a large level.
Although the
estimated by the simple method only differed slightly from integration in the force plate method, a significant difference was observed. One possible explanation was that the
calculated by the force plate method did not exactly match the value measured from the simple method. Furthermore, the discrepancy of
between the two methods increased with greater loading because increased load tended to alter the trunk angle during movement. Previous simulations have shown that changes in trunk angle during loaded jumps could result in discrepancies of up to 9 cm in
between the two methods under extreme conditions [
14]. Consistent with our regression analysis, the
from the simple method closely matched the value obtained from the force plate method, with an absolute error of less than 3%. Since it was not feasible to analytically derive
from the force as a function of displacement, we employed linear regression to address this limitation. Although the physical interpretation of the regression parameters α and β was unclear, this approach provided an effective and simple measurement for the distance-averaged method. Lastly, although the distance-averaged method did not allow for a direct calculation of
by multiplying
by
, the result was highly correlated with the actual
, suggesting that its potential as an indicator of
.
Regarding reliability, we found that the CV for the two distance-averaged methods and the time-averaged simple method was below 5%. The relatively lower CV observed for both simple methods compared to that of jump height might be attributed to the structure of the simple method formulae, in which jump height appeared only as a component of the numerator. As a result, its variability was diluted by the presence of fixed parameters, thereby enhancing the overall reliability of the derived kinetics. However, the time-averaged force plate method only showed acceptable reliability for
and
. The discrepancy may be attributed to the use of a particularly sensitive onset detection threshold (20N), which allowed minor fluctuations in the signal to trigger the start of integration prematurely [
23]. This could lead to the integration process beginning before the actual movement started, thereby introducing variability in the computed values. In contrast, such small fluctuations were unlikely to affect the distance-averaged force plate method, as it did not rely on precise onset identification.
Comparison of the Different F-V Relationship Models
We found that all four F–V relationship models exhibited very large to nearly perfect linearities. While previous studies have repeatedly demonstrated the strong linearity of the two time-averaged methods, our findings further extended this evidence to the two distance-averaged methods, which reinforced their applicability, particularly in time-constrained testing scenarios where the two-point method was employed [
27,
28].
The time-averaged force plate method was the only approach that exhibited a substantial prediction error, approximately 23%, which was considered entirely unacceptable. This large error was primarily attributed to the non-equivalence between and . Consequently, the and information obtained through the force plate method could not be reliably translated into calculating mechanical work, thereby preventing the establishment of an accurate relationship between the two. For the other three methods, the prediction errors between estimated and actual jump height were all within 5%. The consistency in and values derived from both the distance-averaged force plate and simple methods helped explain the validity of their predictions. Notably, the distance-averaged simple method showed the smallest error in number among the three, likely because the jump height was used directly as input during the modeling process. Interestingly, the time-averaged simple method accurately predicted jump height even though the estimated mean force and velocity did not correspond directly to those obtained from the force plate method. This may be because the time-averaged simple method actually used . Although could not be simply estimated with half , its variation across different loads closely paralleled that of and obtained from the distance-averaged method. As a result, it could still be effectively used to predict jump height. Furthermore, the , , and values derived from the time-averaged simple method demonstrated large to very large correlations with those obtained from the distance-averaged simple method. This further supported the notion that it might carry equivalent information to that of the distance-averaged simple method, suggesting its validity in predicting jump height.
Compared to the distance-averaged force plate method, the distance-averaged simple method slightly overestimated and , while no significant difference was observed for . A possible explanation was that the integrated from the force plate method was not entirely equivalent to the directly measured value in the simple method, which might lead to discrepancies between the two methods. However, since both methods accurately predicted jump height, both of them could effectively support individualized training, with the providing a reference for tailoring force- or velocity-oriented interventions. The from the two methods showed nearly perfect correlation with each other. Nonetheless, given the lower error margin in the distance-averaged simple method, it may represent the most advantageous option among all evaluated approaches.
Theoretical Simulations and Potential Training Adaptation
According to the simulation results, jump height increased monotonically with
,
, and
. Since
cannot be accurately computed using the distance-averaged method, this approach did not allow for determining an optimized performance under a given
. However, it still supported individualized training strategies. Specifically, the growth rate of jump height accelerated at the extremes of the
spectrum: when
was high and
was lower, increasing
led to greater improvements in jump height, and vice versa. This pattern aligned with the optimized F–V imbalance concept previously proposed by Samozino et al. [
29], which emphasized tailoring force- or velocity-oriented training to an individual’s profile. In this study, the
, calculated in the distance-averaged method, was found to be largely correlated with the
. This finding further supported the feasibility and validity of individualized training approaches. However, the advantage of the
over the
was that it directly provided the growth rate in jump height associated with a given percentage increase in either
or
. In contrast, the
only indicated whether force- or velocity-oriented training was needed to enhance power output during unloaded jumping, without offering a quantitative estimate of the benefit expected from improving each component. Considering the diminishing marginal returns of increases in
and
at higher levels, the efficiency of individualized training might surpass that suggested by the
[
12]. Therefore, the
represents a more precise tool for guiding individualized training compared to the
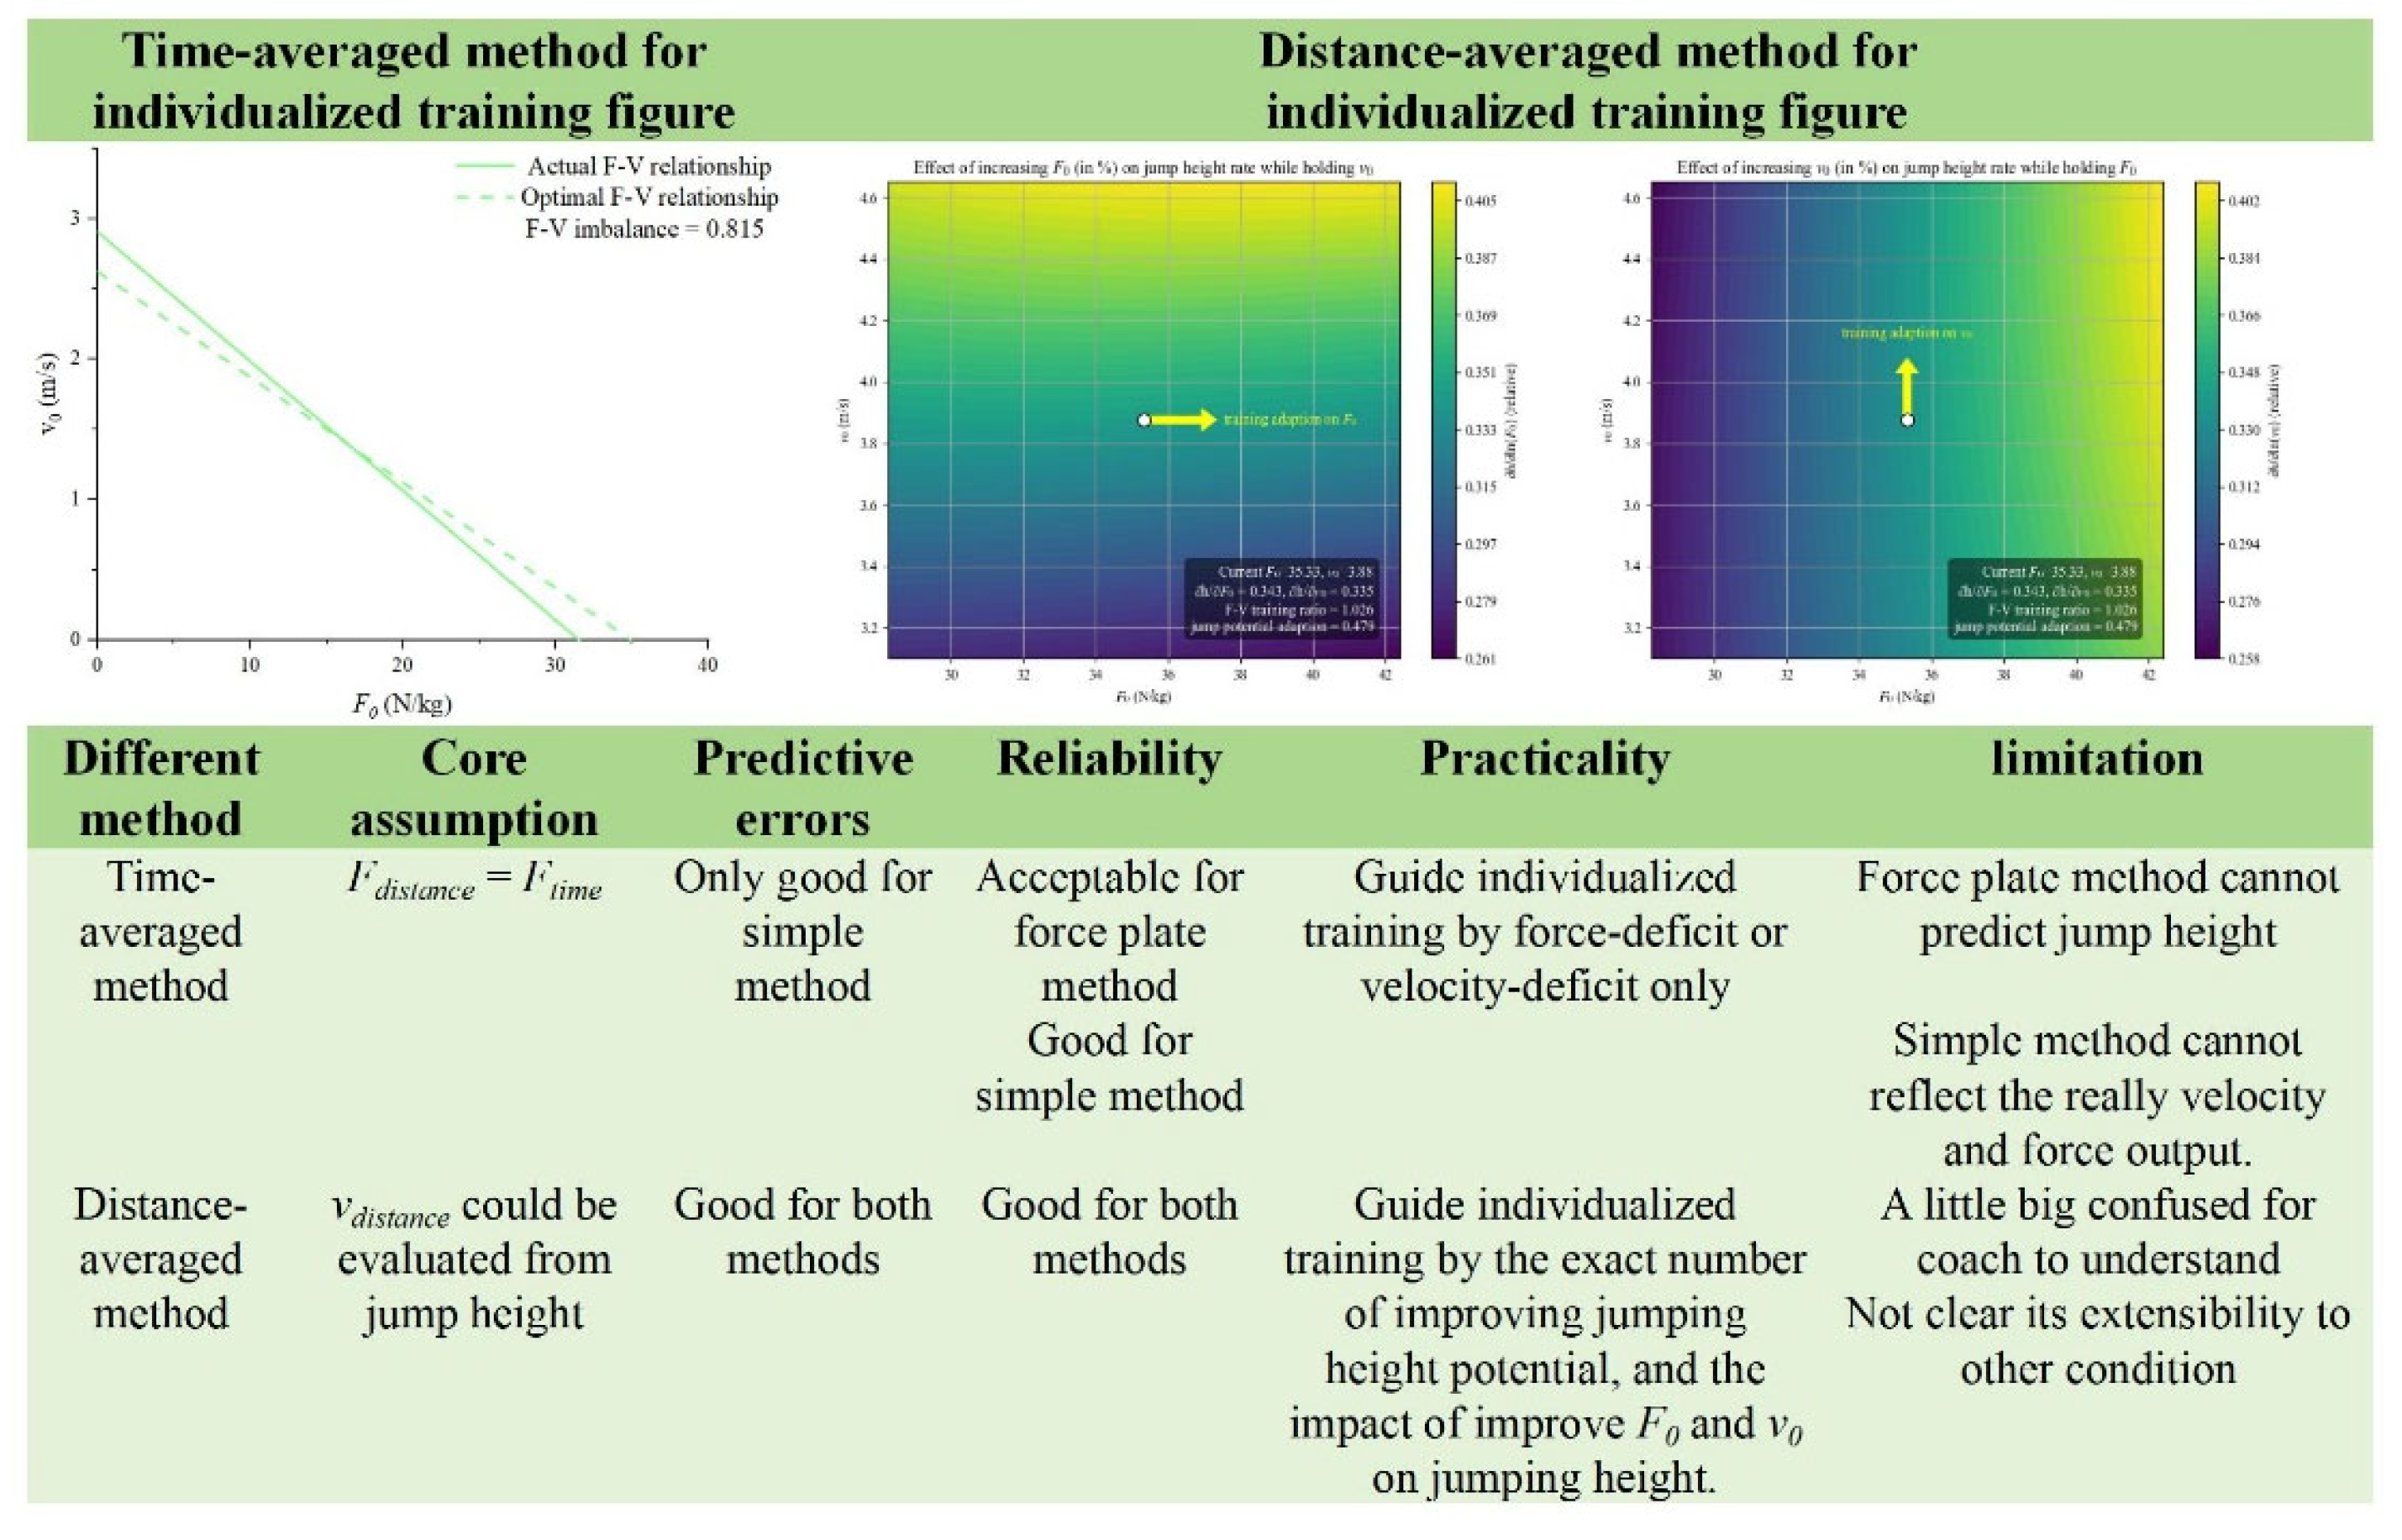
. The comparison between the time-averaged and distance-averaged methods, along with their application in guiding individualized training, was listed in
Figure 8.
Our simulations indicated that the superior benefits of individualized training over traditional programs originated from the varying potential for jump height improvement among athletes (
Figure 6). Specifically, athletes classified as the velocity-deficit or force-deficit exhibited greater potential to enhance jump performance compared to balanced individuals. However, targeted training addressing
achieved to balance within a period as short as one to three months [
10], which may imply a potential limitation for individualized approaches in long-term training periods due to the diminishing returns after initial adaptations. In longer-term training regimens, coaches and sport scientists were advised to prioritize strategies that most efficiently led to high levels of both
and
. Sequential development (
followed by
, or
followed by
) and concurrent development of
and
can be conceptualized as three distinct training strategies aimed at comprehensively improving the variables underlying the F-V relationship. However, there was currently no direct empirical evidence to determine which approach leads to the most rapid improvement. The conventional periodization approach emphasized extensive strength training during the preparatory phase, with a gradual shift toward velocity-oriented training closer to competition [
30]. This structure implicitly reflected a training philosophy that prioritizes the development of
first, followed by an emphasis on
. Furthermore, heavy-load training has also been shown to impair
, such as the relative rate of force development in the early phase [
31,
32]. This might suggest that prioritizing the development of
before
may not be an optimal strategy. Future studies should therefore aim to provide direct empirical evidence comparing the efficacy of different sequencing strategies for training prescription.
Different from the optimized training raised by Samozino et al. [
29] and its practical application [
33,
34], our simulation suggested that improvements in jump height should not come at the expense of reducing one of the intercepts. Instead, training should aim to enhance one maximal capacity (either
or
) while maintaining the other, thereby promoting balanced development without compromising existing capabilities. Nonetheless, we also observed that in their fixed
training framework, gains in either
or
typically came at the expense of the other intercept. Therefore, future efforted to develop optimized training strategies should be based on the current model to improve the intercept without compromising other aspects of performance. It was also observed that, even among individuals with a velocity deficit undergoing force-oriented training, Lindberg et al. [
12] found that
may decrease while their squat 1RM continues to improve. A similar phenomenon was observed in the study by Simpson et al., where participants in the general training group experienced a reduction in
, but their squat strength still showed gains [
20]. This suggested that changes in maximal dynamic strength did not always correspond to changes in
. Although some studies have proposed that high-load, force-oriented training may reduce the early rate of force development [
32,
35], which was considered an important determinant of the
[
31], no study has provided direct evidence to support the claim that force-oriented training led to reductions in both
and the early rate of force development. The importance of evaluating the validity of the
model intercepts under minimal and maximal force or velocity conditions was emphasized, excessive extrapolation of the
may compromise the validity of the intercept values.
Although human anatomical structure stops development after the mature, the
could still be modified by altering the squat depth [
36,
37,
38]. For instance, research has shown that a smaller
was associated with a higher
, while having minimal impact on the
in the same athletes. This may help to explain the optimal countermovement depth angle observed by Pommerell et al. who found that modifying
resulted in changes in
and achieved a locally optimal jump height (2024). Therefore, in the short term, there was potential to improve jump height by modifying the
.
Limitation
As the first study to focus on the distance-averaged , this investigation had several limitations. First, we used a regression-based approach to estimate the relationship between and jump height. However, this relationship might vary depending on the magnitude of the countermovement and might not apply to elite athletes. Future research should explore how this relationship differs across populations and movement strategies. Second, we did not examine the between-session reliability of the distance-averaged . It would be valuable for future studies to compare the reliability of this method to that of the more commonly used time-averaged . Lastly, the long-term validity and sensitivity of this method have not yet been evaluated. Longitudinal research or fatigue studies are needed to determine its effectiveness in tracking performance adaptations over extended periods.
Conclusions
This study introduced and validated a novel distance-averaged model, demonstrating superior accuracy over the traditional time-averaged method in estimating mean force, and velocity, and predicting jump height. Simulation results further revealed that increases in the same percentage and did not contribute equally to improvements in jump height; thus, athletes were encouraged to plot their jump height growth rate in response to percentage increases in or to guide individualized training strategies. These findings supported the distance-averaged as a valid and practical tool for individualized ballistic performance in both research and applied settings.
Ethics Approval and Consent to Participate
Participants gave their written informed consent to take part in this study, which was approved by the local ethics committee (2023142H)
Consent for publication
Not applicable.
Availability of Data and Materials
The datasets generated and analyzed during this study are available from the corresponding author upon reasonable request.
Competing interests
The authors report no conflict of interest.
Authors’ Contributions
ZL, MH conceived and designed the experiments. MH and HZ conducted the experiments. LZ, XZ, ZC and RW analyzed the data. ZL and HZ wrote the manuscript. All authors read and approved the final manuscript.
Funding
This work was supported by: the 2023 Shandong Provincial Teaching Reform Research Project Cultivation of Core Competencies in College Physical Education Curriculum and Pathways for High-Quality Development (Grant No. M2023130) and the 2024 Shandong University Research Project Key Teaching Reform Project "Digital Intelligence Empowering Reform of Public Physical Education in Universities (Grant No. 31130082037127), led by Zhang Hongzhen.
Acknowledgments
The authors would like to sincerely thank all the participants who volunteered their time and effort to take part in this study.
Abbreviation
, time-averaged mean force
, distance-averaged mean force
, the ratio between the athlete's actual slope and the theoretical optimal slope that maximizes jump height at a given maximal power output
, the ratio of partial derivatives with respect to percentage change in and , force-velocity relationship
, maximal force ability from force-velocity relationship
, gravitational acceleration
, jump height
, push-off distance
, ratio of system mass to body mass
, maximal power output
, time-averaged mean power
, distance-averaged mean power
, time elapsed from movement onset to take-off.
, time-averaged mean velocity
, distance-averaged mean velocity
, take-off velocity
, maximal velocity ability from force-velocity relationship
α, constant used to estimate distance-averaged velocity
β, coefficient used to estimate distance-averaged velocity.
References
- Coratella G, Beato M, Milanese C, Longo S, Limonta E, Rampichini S, et al. Specific adaptations in performance and muscle architecture after weighted jumpsquat vs. body mass squat jump training in recreational soccer players. J Strength Cond Res [Internet]. 2018 [cited 2023 Jan 8];32:921–9. Available from: https://journals.lww.com/nsca-jscr/Fulltext/2018/04000/Specific_Adaptations_in_Performance_and_Muscle.5.aspx.
- Xu J, Turner A, Comfort P, Harry JR, McMahon JJ, Chavda S, et al. A Systematic Review of the Different Calculation Methods for Measuring Jump Height During the Countermovement and Drop Jump Tests. Sports Medicine. 2023;53:1055–72.
- Samozino P, Morin J-B, Hintzy F, Belli A. Jumping ability: A theoretical integrative approach. J Theor Biol. 2010;264:11–8.
- Samozino P, Morin JB, Hintzy F, Belli A. A simple method for measuring force, velocity and power output during squat jump. J Biomech. 2008;41:2940–5.
- Jiménez-Reyes P, Samozino P, Pareja-Blanco F, Conceição F, Cuadrado-Peñafiel V, González-Badillo JJ, et al. Validity of a Simple Method for Measuring Force-Velocity-Power Profile in Countermovement Jump. Int J Sports Physiol Perform [Internet]. 2017 [cited 2022 Dec 4];12:36–43. Available from: https://journals.humankinetics.com/view/journals/ijspp/12/1/article-p36.xml.
- García-Ramos A, Pérez-Castilla A, Morales-Artacho AJ, Almeida F, Padial P, Bonitch-Góngora J, et al. Force-Velocity Relationship in the Countermovement Jump Exercise Assessed by Different Measurement Methods. J Hum Kinet [Internet]. 2019 [cited 2024 May 13];67:37. Available from: /pmc/articles/PMC6714365/.
- Li Z, Zhi P, Yuan Z, García-Ramos A, King M. Feasibility of vertical force-velocity profiles to monitor changes in muscle function following different fatigue protocols. Eur J Appl Physiol [Internet]. 2023 [cited 2023 Aug 17]; Available from: https://pubmed.ncbi.nlm.nih.gov/37535143/.
- Samozino Pierre, Rejc E, Di Prampero, Pietro Enrico, Belli A, Morin J-B. Optimal Force–Velocity Profile in Ballistic Movements—Altius. Med Sci Sports Exerc. 2012;44:313–22.
- Samozino P, Edouard P, Sangnier S, Brughelli M, Gimenez P, Morin JB. Force-velocity profile: Imbalance determination and effect on lower limb ballistic performance. Int J Sports Med [Internet]. 2014 [cited 2022 Dec 3];35:505–10. Available from: http://www.thieme-connect.com/products/ejournals/html/10.1055/s-0033-1354382.
- Jiménez-Reyes P, Samozino P, Morin JB. Optimized training for jumping performance using the force-velocity imbalance: Individual adaptation kinetics. PLoS One [Internet]. 2019 [cited 2024 Apr 24];14. Available from: https://pubmed.ncbi.nlm.nih.gov/31091259/.
- Jiménez-Reyes P, Samozino P, Brughelli M, Morin JB. Effectiveness of an individualized training based on force-velocity profiling during jumping. Front Physiol. 2017;7:677.
- Lindberg K, Solberg P, Rønnestad BR, Frank MT, Larsen T, Abusdal G, et al. Should we individualize training based on force-velocity profiling to improve physical performance in athletes? Scand J Med Sci Sports [Internet]. 2021 [cited 2024 Apr 24];31:2198–210. Available from: https://pubmed.ncbi.nlm.nih.gov/34473848/.
- Zabaloy S, Pareja-Blanco F, Giráldez JC, Rasmussen JI, González JG. Effects of individualised training programmes based on the force-velocity imbalance on physical performance in rugby players. Isokinet Exerc Sci. 2020;28:181–90.
- BOBBERT MF, LINDBERG K, PAULSEN G. Is the Force–Velocity Profile for Free Jumping a Sound Basis for Individualized Jump Training Prescriptions? Med Sci Sports Exerc. 2025;57:727–37.
- Paulsen G, Lindberg K, Eriksrud O, Solberg P, Bjørnsen T, Seynnes O, et al. Is the Classification of Athletes Based on Force-Velocity Profiling from Countermovement Jumps Influenced by the Choice of Method? Med Sci Sports Exerc. 2025;
- Vieira A, Ugliara L, Kons R, Boullosa D, Dal Pupo J, Bottaro M. Categorical agreement between measured and estimated force–velocity–power profiles in free-weight squat jumps among combat athletes. Sport Sci Health. 2025;
- Linthorne NP. The correlation between jump height and mechanical power in a countermovement jump is artificially inflated. Sports Biomech. 2021;20:3–21.
- Oliver JM, Kreutzer A, Jenke SC, Phillips MD, Mitchell JB, Jones MT. Velocity Drives Greater Power Observed During Back Squat Using Cluster Sets. J Strength Cond Res. 2016;30:235–43.
- Mora-Custodio R, Rodríguez-Rosell D, Yáñez-García JM, Sánchez-Moreno M, Pareja-Blanco F, González-Badillo JJ. Effect of different inter-repetition rest intervals across four load intensities on velocity loss and blood lactate concentration during full squat exercise. J Sports Sci. 2018;36:2856–64.
- Simpson A, Waldron M, Cushion E, Tallent J. Optimised force-velocity training during pre-season enhances physical performance in professional rugby league players. J Sports Sci [Internet]. 2021 [cited 2024 Apr 24];39:91–100. Available from: https://pubmed.ncbi.nlm.nih.gov/32799729/.
- Miras-Moreno S, García-Ramos A, Jukic I, Pérez-Castilla A. Two-point Method Applied in Field Conditions: A Feasible Approach to Assess the Load-Velocity Relationship Variables During the Bench Pull Exercise. J Strength Cond Res. 2023;37:1367–74.
- Hopkins WG, Marshall SW, Batterham AM, Hanin J. Progressive statistics for studies in sports medicine and exercise science. Med Sci Sports Exerc [Internet]. 2009 [cited 2022 Dec 7];41:3–12. Available from: https://pubmed.ncbi.nlm.nih.gov/19092709/.
- Pérez-Castilla A, Rojas FJ, García-Ramos A. Assessment of unloaded and loaded squat jump performance with a force platform: Which jump starting threshold provides more reliable outcomes? J Biomech. 2019;92:19–28.
- Lindberg K, Solberg P, Bjørnsen T, Helland C, Rønnestad B, Frank MT, et al. Force-velocity profiling in athletes: Reliability and agreement across methods. PLoS One [Internet]. 2021 [cited 2022 Dec 3];16:e0245791. Available from: https://journals.plos.org/plosone/article?id=10.1371/journal.pone.0245791.
- Valenzuela PL, Sánchez-Martínez G, Torrontegi E, Vázquez-Carrión J, Montalvo Z, Haff GG. Should We Base Training Prescription on the Force–Velocity Profile? Exploratory Study of Its Between-Day Reliability and Differences Between Methods. Int J Sports Physiol Perform. 2021;16:1001–7.
- Hughes S, Warmenhoven J, Haff GG, Chapman DW, Nimphius S. Countermovement Jump and Squat Jump Force-Time Curve Analysis in Control and Fatigue Conditions. J Strength Cond Res. 2022;36:2752–61.
- García-Ramos A. The 2-Point Method: Theoretical Basis, Methodological Considerations, Experimental Support, and Its Application Under Field Conditions. Int J Sports Physiol Perform. 2023;18:1092–100.
- Zhaoqian Li, Linna Gao, Xing Zhang, Kuiying Deng, Yaodong Gu, Danica Janicijevic, et al. Vertical or horizontal force-velocity profile: which one is more sensitive to detect the fatigue induced by a basketball-specific protocol? 2025;57:64–73.
- Samozino P, Rejc E, Di Prampero PE, Belli A, Morin JB. Force-velocity properties’ contribution to bilateral deficit during ballistic push-off. Med Sci Sports Exerc [Internet]. 2014 [cited 2024 May 14];46:107–14. Available from: https://pubmed.ncbi.nlm.nih.gov/24346189/.
- Stone MH, Hornsby WG, Haff GG, Fry AC, Suarez DG, Liu J, et al. Periodization and Block Periodization in Sports: Emphasis on Strength-Power Training—A Provocative and Challenging Narrative. J Strength Cond Res. 2021;35:2351–71.
- Boccia G, Brustio PR, Salvaggio F, Grossio L, Calcagno E, Pintore A, et al. The Rate of Torque Development as a Determinant of the Torque–Velocity Relationship. Scand J Med Sci Sports. 2025;35.
- Andersen LL, Andersen JL, Zebis MK, Aagaard P. Early and late rate of force development: differential adaptive responses to resistance training? Scand J Med Sci Sports. 2010;20.
- Escobar Álvarez JA, Fuentes García JP, Da Conceição FA, Jiménez-Reyes P. Individualized Training Based on Force-Velocity Profiling During Jumping in Ballet Dancers. Int J Sports Physiol Perform [Internet]. 2020 [cited 2024 Apr 24];15:788–94. Available from: https://pubmed.ncbi.nlm.nih.gov/31715582/.
- Barrera-Domínguez FJ, Almagro BJ, Sáez de Villarreal E, Molina-López J. Effect of individualised strength and plyometric training on the physical performance of basketball players. Eur J Sport Sci [Internet]. 2023 [cited 2024 Apr 24];23:2379–88. Available from: https://www.tandfonline.com/doi/abs/10.1080/17461391.2023.2238690.
- de Oliveira FBD, Rizatto GF, Denadai BS. Are early and late rate of force development differently influenced by fast-velocity resistance training? Clin Physiol Funct Imaging. 2013;33:282–7.
- Qin X, Liu B, Tang R, Liu Y, García-Ramos A. The role of starting knee angle in squat jump force-velocity profiles: interactions with subjects’ strength levels and imputed push-off distance. Front Physiol. 2025;16.
- Pommerell F, Boyas S, Samozino P, Morel B, Begue J, Rahmani A, et al. How Does Push-Off Distance Influence Force–Velocity Profile and Performance During Vertical Jumping? J Appl Biomech. 2025;41:161–6.
- Janicijevic DN, Knezevic OM, Mirkov DM, Pérez-Castilla A, Petrovic MR, García-Ramos A. Magnitude and reliability of mechanical outputs obtained during loaded squat jumps performed from different knee angles. Sports Biomech. 2021;20:925–37.
- Pommerell F, Boyas S, Samozino P, Morel B, Begue J, Rahmani A, et al. Influence of countermovement depth on net force, push-off time, vertical impulse and performance during jumping. Journal of Electromyography and Kinesiology. 2024;79:102945.
Figure 1.
Force, velocity, and power calculated as functions of time and displacement from a representative subject performing unloaded squat jumps.
Figure 1.
Force, velocity, and power calculated as functions of time and displacement from a representative subject performing unloaded squat jumps.
Figure 2.
Comparison of individual absolute errors in squat jump height predicted by different models.
Figure 2.
Comparison of individual absolute errors in squat jump height predicted by different models.
Figure 3.
Correlations of force–velocity relationship variables derived from different models. From top to bottom: maximal force (, upper panel), maximal velocity (, middle panel), and maximal power (, lower panel). From left to right: time-averaged simple method vs. distance-averaged force-plate method; time-averaged simple method vs. distance-averaged simple method; distance-averaged force-plate method vs. distance-averaged simple method.
Figure 4.
Different effects of on jump height across various and combinations. is set to four representative values (0.2, 0.3, 0.4, and 0.5m). (maximal velocity) is fixed at 2, 4, 6, and 8 m/s in the upper-left, upper-right, lower-left, and lower-right panels, respectively. (maximal force) is shown on the x-axis and jump height on the y-axis.
Figure 5.
Effect of increasing and on jump height. The upper panel presents a 3D surface illustrating jump height as a function of and . The lower panel shows a 2D plot depicting jump height as a function of and .
Figure 5.
Effect of increasing and on jump height. The upper panel presents a 3D surface illustrating jump height as a function of and . The lower panel shows a 2D plot depicting jump height as a function of and .
Figure 6.
Combined partial derivatives of jump height with respect to the percentage change in and at each point. The line segments indicate where the partial derivative with respect to the percentage change in is twice , equal to , or half that of .
Figure 6.
Combined partial derivatives of jump height with respect to the percentage change in and at each point. The line segments indicate where the partial derivative with respect to the percentage change in is twice , equal to , or half that of .
Figure 7.
Partial derivatives of jump height with respect to the percentage change of or at each point (: upper panel; : lower panel). The line segments indicate where the partial derivative with respect to the percentage change of is twice, equal to, or half that of .
Figure 7.
Partial derivatives of jump height with respect to the percentage change of or at each point (: upper panel; : lower panel). The line segments indicate where the partial derivative with respect to the percentage change of is twice, equal to, or half that of .
Figure 8.
General comparison of the time-averaged method and distance-averaged method.
Figure 8.
General comparison of the time-averaged method and distance-averaged method.
Table 1.
Force, velocity, and power calculated between force plate and simple method across time-averaged and distance averaged method.
Table 1.
Force, velocity, and power calculated between force plate and simple method across time-averaged and distance averaged method.
| |
Kinetics |
Error |
| |
force plate |
simple |
t-test |
correlation |
absolute (%) |
relative (%) |
|
(N/kg) |
22.33 ± 3.01 |
24.04 ± 3.00 |
-19.646 |
0.840 |
9.03 ± 7.90 |
-8.13 ± 8.83 |
|
(m/s) |
0.906 ± 0.173 |
1.050 ± 0.216 |
-20.480 |
0.762 |
18.34 ± 18.01 |
-17.04 ± 19.31 |
|
(W/kg) |
20.34 ± 4.13 |
25.01 ± 4.74 |
-20.758 |
0.512 |
34.74 ± 100.42 |
-32.89 ± 101.38 |
|
(N/kg) |
23.78 ± 2.61 |
24.04 ± 3.03 |
-4.091 |
0.909 |
4.19 ± 3.7 |
-1.05 ± 5.50 |
|
(m/s) |
1.635 ± 0.283 |
1.635 ± 0.278 |
-0.029 |
0.978 |
2.90 ± 2.3 |
-0.17 ± 3.72 |
|
(W/kg) |
35.52 ± 5.29 |
38.93 ± 6.18 |
|
0.826 |
|
|
Table 2.
Reliability of force, velocity and power calculated from different methods.
Table 2.
Reliability of force, velocity and power calculated from different methods.
| Kinetics |
Force plate method |
Simple method |
| |
CV (95% CI) (%) |
ICC (95% CI) |
CV (95% CI) (%) |
ICC (95% CI) |
|
(N/kg) |
2.45 (2.06, 2.92) |
0.960 (0.947, 0.970) |
2.01 (1.68,2.39) |
0.971 (0.961, 0.978) |
|
(m/s) |
6.05 (5.08,7.21) |
0.783 (0.720, 0.833) |
4.22 (3.54, 5.03) |
0.896 (0.864, 0.921) |
|
(W/kg) |
8.89 (7.46, 10.60) |
0.776 (0.712, 0.827) |
3.65 (3.06, 4.34) |
0.845 (0.798, 0.882) |
|
(N/kg) |
1.23 (1.03, 1.47) |
0.989 (0.985, 0.992) |
2.01 (1.68, 2.39) |
0.971 (0.961, 0.978) |
|
(m/s) |
2.16 (1.81, 2.57) |
0.970 (0.960, 0.977) |
2.14 (1.80, 2.55) |
0.969 (0.959, 0.977) |
|
(W/kg) |
3.77 (3.16, 4.49) |
0.932 (0.910, 0.950) |
4.12 (3.46, 4.91) |
0.916 (0.889, 0.936) |
Table 3.
Ranges of F–V imbalance and F–V training ratio and their correlations.
Table 3.
Ranges of F–V imbalance and F–V training ratio and their correlations.
| |
Method |
Mean ±SD |
Max |
Min |
Correlation |
|
Simple method |
0.94 ± 0.31 |
1.58 |
0.23 |
|
|
Force plate method |
1.23 ± 0.39 |
2.46 |
0.69 |
-0.542 |
| Simple method |
1.25 ± 0.40 |
2.58 |
0.67 |
-0.628 |
|
Disclaimer/Publisher’s Note: The statements, opinions and data contained in all publications are solely those of the individual author(s) and contributor(s) and not of MDPI and/or the editor(s). MDPI and/or the editor(s) disclaim responsibility for any injury to people or property resulting from any ideas, methods, instructions or products referred to in the content. |
© 2025 by the authors. Licensee MDPI, Basel, Switzerland. This article is an open access article distributed under the terms and conditions of the Creative Commons Attribution (CC BY) license (http://creativecommons.org/licenses/by/4.0/).