
Submitted:
22 October 2025
Posted:
22 October 2025
You are already at the latest version
Abstract
Humic substances (HSs) are naturally occurring macromolecular organic acids derived from plant residues, with structural properties that vary depending on their origin and environmental conditions. These substances influence the solubility and toxicity of environmental pollutants, making their chemical characterization essential. Charge-transfer-type fluorochromes, which exhibit shifts in fluorescence intensity and emission wavelength in response to solvent polarity changes, have been widely employed to investigate solute–solvent interactions. In this study, we developed a rapid and straightforward method to characterize HS polarity using fluorescent solvatochromism. The fluorescence peak shifts of four dyes—8-anilino-1-naphthalenesulfonic acid (ANS), acridine orange (AO), methylene blue (MB), and Rhodamine B (RhB)—were evaluated in the presence of humic acids (HAs), a major component of HSs. To assess environmental variability, HAs from seven different sources were tested. Among these, AO and MB exhibited distinct spectral shifts without overlapping with the intrinsic fluorescence of HAs. Notably, MB displayed a consistent blue shift dependent on HA concentration, with the most stable response observed at 5 mg/L. The magnitude of this shift was significantly correlated with HA aromaticity, molecular weight, and polarity index. Additionally, the peak shifts were positively correlated with log KOM (anthracene) and negatively correlated with log KML (mercury), suggesting that the method reflects HA–pollutant interaction characteristics. Overall, this study demonstrates that fluorescent solvatochromic dyes can serve as polarity-sensitive probes for HS characterization, offering a practical tool for environmental monitoring and risk assessment.
Keywords:
humic substances
; polarity
; solvatochromism
; fluorescent probes
1. Introduction
Humic substances (HSs) are naturally occurring, ubiquitous high-molecular-weight organic acids widely distributed in soil alongside rivers, lakes, and other freshwater environments [1]. Among these substances, humic acids (HAs) constitute a major fraction. Both HAs and fulvic acids (FAs) are soluble at pH values above two. Moreover, HAs exhibit a range of properties—including persistence, redox capacity, surface activity, complexation with metal ions, and both hydrophobic and hydrophilic characteristics—that are shaped by their environmental formation conditions and origin. These properties, in turn, influence the transport of nutrients and the solubility of hydrophobic organic pollutants (HOPs) and metals [2,3,4,5,6,7]. Accordingly, evaluating the chemical characteristics of HAs is essential. However, the structural complexity and diversity of these acids necessitate the use of multiple characterization techniques, including functional group analysis, elemental analysis, ultraviolet–visible (UV-Vis) spectroscopy, fluorescence spectroscopy, and size exclusion chromatography [7,8,9,10,11,12,13,14,15,16]. These methods are often indirect or time-consuming, and few assess HA polarity directly. Solvatochromic dyes, though sensitive to polarity, have rarely been applied to HAs due to spectral overlap and structural complexity.
Chromism refers to a reversible color change triggered by external stimuli such as light, temperature, solvent polarity, or pH variation [17,18,19]. Among its various forms, fluorescence solvatochromism is a phenomenon wherein the fluorescence wavelength of a molecule shifts in response to changes in the surrounding polarity, even in dilute solutions where interactions between dye molecules are negligible [19,20,21,22,23,24]. Leveraging this property, fluorescent solvatochromic dyes, such as 6-dodecanoyl-2-(dimethylaminonaphthalene) (LAURDAN) and 6-propionyl-2-dimethylaminonaphthalene (PRODAN), are commonly used to monitor intracellular polarity in real time [20]. LAURDAN, for instance, exhibits a pronounced red shift in its fluorescence emission during lipid membrane phase transitions from the gel phase to the liquid crystalline phase, enabling sensitive detection of changes in membrane order and organization [21]. Its fluorescence properties are particularly responsive to polarity changes near the membrane surface, making it a widely preferred probe for assessing the phase state of lipid bilayers [22]. In contrast, PRODA, which shares a similar molecular backbone with LAURDAN, preferentially partitions in the fluid regions of lipid membranes and demonstrates high sensitivity to membrane polarity and molecular packing [23]. It is particularly useful for characterizing cholesterol-containing membranes, where it serves as an effective indicator of membrane fluidity and order. In addition to these applications, both dyes are also effective in detecting membrane structural changes induced by external stressors, such as oxidative stress, as their fluorescence responses reflect local polarity variations under such conditions [24].
In this study, we hypothesized that fluorescent solvatochromism—reflecting the chemical properties of HSs, particularly their polarity—can be detected through the appropriate selection of fluorescent dyes and optimization of measurement conditions. Because the polarity of HSs is closely associated with the mobility and toxicity of environmental pollutants [2,3,4,5,6,7], establishing a simple and reliable method for its evaluation is of great importance. Accordingly, this study aimed to develop a new characterization method for HSs using fluorescent solvatochromism. To our knowledge, this is the first study to apply solvatochromic dyes for direct polarity-based characterization of humic acids. To this end, we employed four fluorescent dyes—8-anilino-1-naphthalenesulfonic acid (ANS), known for its solvatochromic properties [25,26,27]; acridine orange (AO) [28,29]; methylene blue (MB) [30,31]; and rhodamine B (RhB) [32,33]—as fluorescent probes. We first examined shifts in their emission wavelengths in solvents of varying polarity, including tetrahydrofuran (THF), acetone (ACTN), dimethyl sulfoxide (DMSO), and ethanol (EtOH). To evaluate their responses to natural materials, five types of HAs extracted from soils of different origins (peatlands, compost, and forest soils), along with two commercial reagents, were tested. By comparing the emission peak positions of the dyes in the presence of HAs, we determined the optimal dye and HA concentrations for evaluation based on the observed peak shifts and fluorescence quenching. Additionally, we assessed the relationships between the peak shift magnitudes and various chemical parameters of HSs, including aromaticity, degree of humification, functional group content, molecular weight and polarity based on elemental ratios. The findings ultimately enabled the development of a novel fluorescence-based method for the chemical characterization of HAs.
2. Results and Discussion
2.1. Fluorescence Characteristics and Peak Shifts of the Dyes in Various Solvents
Figure 1 presents the three-dimensional excitation–emission matrix (3DEEM) fluorescence spectra of the fluorescent dyes at a concentration of 10 μM. Notably, fluorescence peaks were observed at Ex/Em = 350 nm/531 nm for ANS, 490 nm/533 nm for AO, 665 nm/690 nm for MB, and 560 nm/582 nm for RhB.
Figure 2 displays the fluorescence peak shifts of each dye in solvents of varying polarity, including THF, ACTN, DMSO, EtOH, and water. In all cases, distinct solvent-dependent peak shifts were observed. Notably, the fluorescence quantum yield of ANS in water has been reported to be 0.003 ± 0.001, whereas it is known to increase markedly to 0.71 ± 0.07 in DMSO [27]. This enhancement is attributed to the quenching effect of water molecules on ANS fluorescence [27]. In hydrophilic solvents such as DMSO, fluorescence enhancement occurs because these solvents displace water molecules from the vicinity of excited ANS molecules, thereby reducing quenching by water. Figure S1 illustrates the fluorescence spectra of each dye in different solvents. Relative to water, the fluorescence intensity of ANS increased approximately 140–350 fold in THF, ACTN, DMSO, and EtOH. The maximum emission wavelength (λem) of ANS was 531 nm in water and 475.5 nm in DMSO, consistent with previous reports [27].
Table S2 presents the dielectric constant, molecular dipole moment, refractive index, and ET(30) value of each solvent [18]. The maximum λem of ANS was highest in water and decreased progressively in EtOH, DMSO, ACTN, and THF, indicating a clear blue shift in solvents with lower ET(30) values (Figure 2a). Excluding water, a strong correlation was observed between the λem value of ANS and the ET(30) values of the solvents (r = 0.978, p < 0.05). For AO, MB, and RhB, the λem values in the tested solvents were ranked as follows: DMSO > water > THF > ACTN > EtOH for AO (Figure 2b); DMSO > water > EtOH > THF = ACTN for MB (Figure 2c); and DMSO > THF > water > ACTN > EtOH for RhB (Figure 2d). Although these solvent-dependent shifts were less distinct than those observed for ANS, AO and MB also exhibited noticeable blue shifts in low-polarity solvents, such as THF and ACTN.
2.2. Fluorescence Properties of the HAs Used in This Study
The HAs examined in this study included two commercial reagents (AHA and WHA) and five samples extracted from natural sources: peat (APHA, KPHA, and SPHA), forest soil (FSHA), and compost (CHA). The chemical characteristics of these HAs—including humification degree, aromaticity, functional group content, molecular weight, elemental ratios, and structural type—had been previously analyzed and are summarized in Table S1 [7,13,14]. Figure 3 presents the 3DEEM fluorescence spectra of each HA sample at a concentration of 10 mg/L in PBS (pH 7). All samples exhibited two prominent fluorescence peaks: Peak C1 (Ex/Em = 280–315/479–502 nm) and Peak C2 (Ex/Em = 425–450/513–521 nm), both of which are commonly observed in HAs [16]. In addition, the IHSS website provides the 3DEEM fluorescence spectra for PPHA (1S103H), LHA (1S104H), and PPFA (2S103F), showing that the HAs exhibit peaks around Ex 260 nm/Em 460 nm and Ex 450 nm/Em 500 nm, while the FA shows peaks at Ex 320 nm/Em 420 nm and around Ex 220 nm/Em 420 nm (https://humic-substances.org/ftir-13c-nmr-and-fluorescence-spectra/). Fluorescence indices are widely recognized as effective indicators for assessing the sources and properties of fluorescent components. In particular, the fluorescence index (FI) and biological index (BIX) provide insight into the origins of fluorescent matter, while the humification index (HIX) shows a positive correlation with the degree of humification [34,35]. Table 1 summarizes the positions and intensities of Peak C1 obtained from the 3DEEM fluorescence spectra, along with the corresponding fluorescence indicator values.
The HIX value of AHA aligns with that reported in a previous study [35]. To further evaluate spectral characteristics, we compared the fluorescence peak positions of the HAs with those of the fluorescent dyes used in this study. This comparison revealed that Peak C1 was positioned near the fluorescence peak of ANS, making it difficult to assess peak shifts of ANS in the presence of HAs due to spectral overlap. In contrast, the fluorescence peaks of AO, MB, and RhB were well separated from those of the HAs, indicating their suitability for fluorescence-based interaction studies with HAs.
2.3. Fluorescence Peak Shifts of AO and MB in the Presence of HAs
AO and MB, which exhibited distinct shifts in their maximum emission wavelengths depending on solvent polarity and whose fluorescence peaks did not overlap with those of the HAs, were selected for further analysis. Specifically, changes in the fluorescence peak positions and intensities of AO and MB were evaluated in the presence of varying concentrations of AHA and WHA and compared to those under HA-free conditions (Table 2). Both dyes exhibited increased fluorescence quenching with rising HA concentrations. Notably, AO displayed a high quenching rate, making it difficult to clearly detect peak shifts in the presence of HAs. In contrast, MB exhibited a blue shift in its fluorescence peak position with increasing HA concentration. In the concentration range where a blue shift of the MB peak was observed (0.5–10 mg/L), strong correlations were found between AHA concentration and both the MB peak shift (r = −0.930) and the quenching ratio (r = 0.976), indicating the potential applicability of this method for quantitative analysis of HAs. At an HA concentration of 5 mg/L, the WHA sample, which exhibited a higher E280 (an indicator of aromaticity) than AHA, was found to show a greater MB peak shift and quenching rate (Table S1 and Table 2). This shift is likely attributed not only to a decrease in local polarity but also to specific interactions such as electrostatic binding or π–π stacking between MB and the aromatic moieties of HAs. Based on these observations, MB was identified as the most suitable dye among those tested. However, at HA concentrations exceeding 10 mg/L, over 90% quenching of MB fluorescence was observed, which in some cases hindered accurate evaluation of peak shifts. Consequently, an HA concentration of 5 mg/L was adopted as optimal for use with MB in subsequent experiments.
The fluorescence spectrum of MB (10 µM) in the presence of each HA at a concentration of 5 mg/L was recorded. The spectra were smoothed using the Savitzky–Golay filter, and the original spectra before smoothing are shown in Figure S2. The results displayed a clear blue shift in the fluorescence peak of MB (Figure 4a‒f), indicating that peak shifts can be reliably evaluated at this HA concentration. The corresponding emission wavelength shifts and fluorescence quenching rates of MB in the presence of various HAs and FAs are summarized in Figure 4g. A strong positive correlation was observed between the absolute peak shift and fluorescence quenching rate of MB (r = 0.910 p < 0.001) (Figure S3).
2.4. Fluorescence Peak Shift of MB as an Indicator of HA Characteristics
Figure 5 displays a heatmap of Spearman’s correlations between the fluorescence peak shift of MB in the presence of HSs and various chemical properties of the HSs. Notably, significant correlations (p < 0.05) were observed between the MB peak shift and A400/A600, E280, E2/E3, and PI. In contrast, no significant correlations were found with functional group content, Mn, and Mw (p = 0.38–0.98). The MB fluorescence peak shift was positively correlated with E280 (r = 0.762) and negatively correlated with A400/A600, E2/E3, and PI (r = -0.685−-0.926). Previous studies have reported strong correlations between E280 and E2/E3 and the total aromaticity and Mw of HSs [10]. These findings indicate that the fluorescence peak shift of MB can serve as a simple yet effective indicator of the polarity-dependent chemical characteristics of HAs.
Although no statistically significant correlations were obtained, the MB peak shift in the presence of the HAs other than the IHSS standards exhibited a positive trend with the log KOM of Ant (r = 0.550) and a negative trend with the log KML of Hg (r = -0.471) (Figure S4), suggesting that the solvatochromic response of MB may reflect the hydrophobic and complexation tendencies of HAs. These results align with previous findings indicating that HAs with lower polarity parameters—such as (N+O)/C and O/C atomic ratios—and lower carboxyl group content tend to partition more readily with HOPs, including PAHs and dioxins [2,3,4,5,6]. Additionally, our findings indicate that HAs with higher carboxyl group content and greater polarity exhibit higher KML values and effectively mitigate algal toxicity [7]. It should be noted that this evaluation was conducted using purified HAs under controlled pH conditions; while the applicability to complex environmental samples has not yet been tested, future studies may extend this approach to such matrices. Collectively, these results demonstrate the potential of MB as a solvatochromic dye to support the development of a novel and convenient method for evaluating HA characteristics. Thus, the proposed method may serve as a rapid screening tool to predict the environmental interactions and toxicological behavior of HAs with HOPs and heavy metals.
3. Materials and Methods
3.1. Chemicals
ANS was purchased from Tokyo Chemical Industry Co., Ltd. (Tokyo, Japan). ACTN, AO, MB, RhB, THF, DMSO, and EtOH were obtained from Fujifilm Wako Pure Chemical Industries, Ltd. (Osaka, Japan). A 0.1 M phosphate buffer solution (PBS, pH 7.0) was prepared using NaH2PO4 and Na2HPO4. All reagents were of analytical grade, and sterile deionized water was used throughout. Stock solutions of each dye (ANS, AO, MB, and RhB) were prepared at 200 µM. Working solutions were then diluted to 10 µM in various solvents. Five distinct standard humic acid (HA) and fulvic acid (FA) reference materials were obtained from the International Humic Substances Society (IHSS), namely Elliott Soil IV HA (ESHA), Pahokee Peat I HA (PPHA), Leonardite HA (LHA), Suwannee River I FA (SRFA), and Pahokee Peat II FA (PPFA). Prior to experimentation, purified HA and FA were dissolved in 1 M NaOH (pH > 10) and stirred for 30 min [7,13,14]. The pH was then adjusted to 8.0 using 1 M HCl. A stock solution was prepared at 100 mg/L.
3.2. Characterization of HAs
The UV-Vis parameters (A400/A600, E280, E2/E3), functional group content, elemental composition, molecular weight, log KOM of Ant, and log KML of Hg for the HAs (APHA, CHA, FSHA, KPHA, SPHA, AHA and WHA) were obtained from our previously reported analytical results. A400/A600 is known to correlate with the E4/E6 parameter (the ratio of absorbance at 465 and 665 nm), which is an established index of the degree of humification [12]. These values are summarized in Table S1 [7,13,14]. The UV-Vis parameters and molecular weights of the IHSS standard HAs and FAs were determined using established methods [13]. Acidic functional groups and elemental compositions were referenced from the IHSS website (https://humic-substances.org/). In addition, the polarity index (PI) was calculated based on the elemental composition data provided by IHSS (Table S2).
3.3. Fluorescence Analysis of the Dyes and HAs
The 3DEEM fluorescence spectral profiles of the dyes and HAs (APHA, CHA, FSHA, KPHA, SPHA, AHA and WHA) were recorded using a fluorescence spectrophotometer (RF-6000; Shimadzu, Kyoto, Japan). The measurements were performed at room temperature. The scanned wavelength ranges were Ex./Em. = 200–600 nm / 300–600 nm for HAs and Ex./Em. = 300–700 nm / 300–700 nm for dyes. The scan speed was 2000 nm/min, and both the excitation and emission slit widths were set to 5 nm. The relative fluorescence intensity was calibrated in quinine sulfate units (QSU), where 1 QSU corresponds to 1 μg/L of quinine sulfate monohydrate in 0.05 M H2SO4 at Ex. /Em. = 355/450. Milli-Q water (Millipore Co. Ltd.) was used as a blank in all measurements.
3.4. Fluorescence Spectral Analysis of Dyes in the Presence of HA
In a 20 mL volumetric flask, 2 mL of HA solution and 1 mL of 200 µM dye solution were mixed. The mixture was diluted to 20 mL with PBS (pH 7), yielding a final dye concentration of 10 µM. The fluorescence spectra were then recorded using the RF-6000 spectrophotometer. The fluorescence spectra of MB in the presence of each HS were measured at 0.1 nm wavelength intervals.
3.5. Data Analysis
The spectral peaks of MB in the presence and absence of HA were analyzed using Origin software by applying the two-point baseline method combined with the Savitzky–Golay smoothing filter and first-derivative processing. The Savitzky–Golay smoothing was performed with a window size of 31. Linear regression and Spearman correlation analyses were performed using JMP Pro version 18.0.0 (SAS Institute, Inc., Cary, NC, USA). Heatmaps of Spearman’s correlation was created using the “corrplot” and “ggplot2” packages in R (version 4.0.4; R Core Team, 2021, http://www.r-project.org).
4. Conclusions
This study introduced a novel method for characterizing the chemical properties of HAs using solvatochromic fluorescence. By comparing the fluorescence peak positions of various dyes in the presence of HAs, we found that AO, MB, and RhB exhibited non-overlapping emissions, whereas ANS exhibited spectral overlap. AO and MB exhibited blue shifts in response to polarity changes, suggesting their suitability as solvatochromic probes for HA analysis. At an HA concentration of 5 mg/L, MB was identified as the most suitable probe dye, exhibiting stable and quantifiable peak shifts. Further analysis of MB’s spectral behavior in the presence of chemically distinct HAs revealed significant correlations between the magnitude of the peak shift and parameters such as aromaticity (E280), Mn, and PI. Moreover, the peak shift exhibited a positive correlation with the log KOM of Ant and a negative correlation with the log KML of Hg, indicating the potential of this method to reflect HA–pollutant interaction characteristics.
Although the method is rapid and straightforward, it is still semi-quantitative. It is affected by fluorescence quenching at high HA concentrations and may have limited applicability due to the structural variability of humic substances.
Overall, the proposed technique enables rapid and straightforward assessment of HA polarity by simply mixing HAs with a fluorescent dye, offering a practical tool for evaluating the environmental behavior and toxicological relevance of HSs. This approach is particularly promising for the rapid screening of HAs in aquatic settings and for assessing their interactions with environmental pollutants This study demonstrates that the proposed method is highly effective for characterizing purified HAs. Although it has not yet been validated for HAs in complex environmental matrices containing coexisting constituents, its adaptability suggests considerable potential for future application to such natural systems.
Supplementary Materials
The following supporting information can be downloaded at the website of this paper posted on Preprints.org, Table S1: Chemical properties of each humic acid (HA) used in this study; Table S2: Chemical properties of the IHSS standard humic substances (HSs) used in this study; Table S3: The physicochemical properties of the solvents used in this study; Figure S1: Fluorescence spectra of each dye in different solvents; Figure S2: Fluorescence spectrum and normalized spectrum of methylene blue (MB) under each 5 mg/L HSs before smoothing; Figure S3: Relationship between the absolute fluorescence peak shift of MB and quenching rates in the presence of different HSs; Figure S4: Relationships between the absolute fluorescence peak shift of MB in the presence of different HAs and the log KOM of Ant and the log KML of Hg.
Author Contributions
Conceptualization, investigation, visualization, supervision, writing—review and editing, K.S.; visualization, investigation, H.K.; visualization, investigation, Y.Y.; visualization, investigation, Y.K.; visualization, investigation, N.K.; visualization, investigation, Y.Y.; conceptualization, methodology, supervision, project administration, funding acquisition, writing—review and editing, H.K. All the authors have read and agreed to the published version of the manuscript.
Institutional Review Board Statement
Not applicable.
Informed Consent Statement
Not applicable.
Data Availability Statement
The data are contained within the article and its supporting information.
Conflicts of Interest
The authors declare no conflicts of interest.
Abbreviations
The following abbreviations are used in this manuscript:
| ACTN | Acetone |
| AHA | Sigma-Aldrich humic acid |
| ANS | 8-Aniline 1-naphtharene sulfonic acid |
| Ant | Anthracene |
| AO | Acridine orange |
| APHA | Amou peat humic acid |
| CHA | Compost humic acid |
| DMSO | Dimethyl sulfoxide |
| EtOH | Ethanol |
| FSHA | Forest soil humic acid |
| HA | Humic acid |
| HOPs | Hydrophobic organic pollutants |
| HS | Humic substance |
| KPHA | Kalimantan peat humic acid |
| MB | Methylene blue |
| QSU | Quinine sulfate units |
| RhB | Rhodamine B |
| SHA | Shinshinotsu peat humic acid |
| THF | Tetrahydrofuran |
| 3DEEM | Three-dimensional excitation–emission matrix |
| WHA | Wako humic acid |
References
- McDonald, S.; Bishop, A.G.; Prenzler, P.D.; Robards, K. Analyticalchemistry of freshwater humic substances. Anal. Chim. Acta 2004, 527, 105‒124. [CrossRef]
- Chin, Y.P.; Aiken, G.R.; Danielsen, K.M. Binding of pyrene to aquatic and commercial humic substances: the role of molecular weight and aromaticity. Environ. Sci. Technol. 1997, 31, 1630‒1635. [CrossRef]
- Chiou, C.T.; Kile, D.E.; Brinton, T.I.; Malcolm, R.L.; Leenheer, J.A.; MacCarthy, P. A comparison of water solubility enhancements of organic solutes by aquatic humic materials and commercial humic acids. Environ. Sci. Technol. 1987, 21, 1231‒1234. [CrossRef]
- Danielsen, K.M.; Chin, Y.P.; Buterbaugh, J.S.; Gautafson, T.L.; Traina, S.J. Solubility enhancement and fluorescence quenching of Pyrene by humic Substances: the effect of dissolved oxygen on quenching processes. Environ. Sci. Technol. 1995, 29, 2162‒2165. [CrossRef]
- Plaza, C.; Brunetti, G.; Senesi, N.; Polo, A. Molecular and quantitative analysis of metal ion binding to humic acids from sewage sludge and sludge-amended soils by fluorescence spectroscopy. Environ. Sci. Technol. 2006, 40, 917‒923. [CrossRef]
- Tanaka, S.; Oba, K.; Fukushima, M.; Nakayasu, K.; Hasebe, K. Water solubility enhancement of pyrene in the presence of humic substances. Anal. Chim. Acta 1997, 337, 351‒357. [CrossRef]
- Nanayama, Y.; Sazawa K.; Yustiawati, Y.; Syawal, M.S.; Fukushima, M.; Kuramitz, H. Effect of humic acids on the toxicity of pollutants to Chlamydomonas reinhardtii: Investigation by a microscale algal growth inhibition test. Environ. Sci. Pollut. Res. 2021, 28, 211–219. [CrossRef]
- Schnitzer, M.; Khan, S.U. Humic substances in the environment; Marcel Dekker. Inc, New York, 1972.
- Stevenson, F.J. Humus chemistry: genesis, composition, reaction, 2nd edn. Wiley, New York, 1994.
- Peuravuori, J.; Pihlaja, K. Molecular size distribution and spectroscopic properties of aquatic humic substances. Anal. Chim. Acta 1997, 337, 133–149. [CrossRef]
- Kumada, K.; Sato, O.; Ohsumi, Y.; Ohta, S. Humus composition of mountain soils in Central Japan with special reference to the distribution of P type humic acid. Soil Sci. Plant. Nutr. 1967, 13, 151−158. [CrossRef]
- Ikeya, K.; Watanabe, A. Direct expression of an index for the degree of humification of humic acids using organic carbon concentration. Soil Sci. Plant. Nutr. 2003, 49, 47−53. [CrossRef]
- Kuramitz, H.; Sazawa, K.; Nanayama, Y.; Hata, N.; Taguchi, S.; Sugawara, K.; Fukushima, M. Electrochemical genotoxicity assay based on a SOS/umu test using hydrodynamic voltammetry in a droplet. Sensors 2012, 12, 17414‒17432. [CrossRef]
- Sazawa, K.; Furuhashi, Y.; Hata, N.; Taguchi, S.; Fukushima, M.; Kuramitz, H. Evaluation of the toxicity of tetrabromobisphenol A and some of its oxidation products using a micro-scale algal growth inhibition test. Toxicol. Environ. Chem. 2013, 95, 472‒482. [CrossRef]
- Yustiawati, Y.; Kihara, Y.; Sazawa, K.; Kuramitz, H.; Kurasaki, M.; Saito, T.; Hosokawa, T.; Syawal, M.S.; Wulandari, L.; Hendri, I.; Tanaka, S. Effects of peat fires on the characteristics of humic acid extracted from peat soil in Central Kalimantan, Indonesia. Environ. Sci. Pollut. Res. 2015, 22, 2384−2395. [CrossRef]
- Sazawa, K.; Yoshida, H.; Okusu, K.; Hata, N.; Kuramitz, H. Effects of forest fire on the properties of soil and humic substances extracted from forest soil in Gunma, Japan. Environ. Sci. Pollut. Res. 2018, 25, 30325−30338. [CrossRef]
- Bamfield, P. Chromic phenomena-Technological applications of colour chemistry, Royal Society of Chemistry, 2001.
- Reichardt, D. Solvents and solvent effects in organic chemistry, 3rd ed., Wiley-VCH, Weinheim, Germany, 2003.
- Homocianu, M. Exploring solvatochromism: A comprehensive analysis of research data. Microchem. J. 2024, 198, 110166. [CrossRef]
- Bagatolli, L.A. To see or not to see: Lateral organization of biological membranes and fluorescence microscopy. Biochim. Biophys. Acta 2006, 1758, 1541−1556. [CrossRef]
- Parasassi, T.; Stefano, M.D.; Ravagnan, G.; Sapora, O.; Gratton, E. Membrane aging during cell growth ascertained by laurdan generated polarization. Exp. Cell Res. 1992, 202, 432‒439. [CrossRef]
- Lúcio, A.D.; Vequi-Suplicy, C.C., Fernandez, R.M.; Lamy, M.T. Laurdan spectrum decomposition as a tool for the analysis of surface bilayer structure and polarity: a study with DMPG, peptides and cholesterol. J. Fluoresc. 2010, 20, 473‒482. [CrossRef]
- Krasnowska, E.K.; Bagatolli, L.A.; Gratton, E.; Parasassi, T. Surface properties of cholesterol-containing membranes detected by Prodan fluorescence. Biochim. Biophys. Acta-Biomembr. 2001, 1511, 330‒340. [CrossRef]
- Ashoka, A.H.; Ashokkumar, P.; Kovtun, Y.P.; Klymchenko, A.S. Solvatochromic near-infrared probe for polarity mapping of biomembranes and lipid droplets in cells under stress. J. Phys. Chem. Lett. 2019, 10, 2414‒2421. [CrossRef]
- Islam, M.R.; Shakya, S.; Selim, A.; Alam, M.S.; Ali, M. Solvatochromic absorbance and fluorescence probe behavior within ionic liquid + γ-butyrolactone mixture. J. Chem. Eng. Data 2019, 64, 4169−4180. [CrossRef]
- Ota, C.; Tanaka, S.; Takano, K. Revisiting the rate-limiting step of the ANS–protein binding at the protein surface and inside the hydrophobic cavity. Molecules 2021, 26, 420. [CrossRef]
- Tsaplev, Y.B.; Semenova, M.G.; Trofimov, A.V. Macro and micro enhancers of the 8-anilino-1-naphthalenesulfonate (ANS) fluorescence. Is ANS indeed a hydrophobic probe? Spectrochim. Acta A 2024, 323, 124941. [CrossRef]
- Thomé, M.P.; Filippi-Chiela, E.C.; Villodre, E.S.; Migliavaca, C.B.; Onzi, G.R.; Felipe, K.B.; Lenz, G. Ratiometric analysis of Acridine Orange staining in the study of acidic organelles and autophagy. J. Cell Sci. 2016, 129, 4622–4632. [CrossRef]
- Iessi, E.; Logozzi, M.; Lugini, L.; Azzarito, T.; Federici, C.; Spugnini, E.P.; Mizzoni, D.; Raimo, R.D.; Angelini, D.F.; Battistini, L.; Cecchetti, S.; Fais, S. Acridine Orange/exosomes increase the delivery and the effectiveness of Acridine Orange in human melanoma cells: A new prototype for theranostics of tumors. J. Enzyme Inhib. Med. Chem. 2017, 32, 648–657. [CrossRef]
- Soedjak, H.S. Colorimetric determination of carrageenans and other anionic hydrocolloids with methylene blue. Anal. Chem. 1994, 66, 4514−4518. [CrossRef]
- Ziółkowska, D.; Kaniewska, A.; Lamkiewicz, J.; Shyichuk, A. Determination of carrageenan by means of photometric titration with Methylene Blue and Toluidine Blue dyes. Carbohydr. Polym. 2017, 165, 1‒6. [CrossRef]
- Gutiérrez, M.C.; Hortigüela, M.J.; Ferrer, M.L.; del Monte, F. Highly fluorescent rhodamine B nanoparticles entrapped in hybrid glasses. Langmuir 2006, 23, 2175–2179. [CrossRef]
- Khubiev, O.M.; Egorov, A.R.; Semenkova, D.I.; Salokho, D.S.; Golubev, R.A.; Sikaona, N.D.; Lobanov, N.N.; Kritchenkov, I.S.; Tskhovrebov, A.G.; Kirichuk, A.A.; Khrustalev, V.N.; Kritchenkov, A.S. Rhodamine B-containing chitosan-based films: preparation, luminescent, antibacterial, and antioxidant properties. Polymers, 2024, 16, 755. [CrossRef]
- Birdwell, J.E.; Engel, A.S. Characterization of dissolved organic matter in cave and spring water using UV-Vis absorbance and fluorescence spectroscopy. Org. Geochem. 2010, 41, 270‒280. [CrossRef]
- Rodríguez-Vidal, F.J.; García-Valverde, M.; Ortega-Azabache, B.; González-Martínez, Á.; Bellido-Fernández, A. Characterization of urban and industrial wastewaters using excitation-emission matrix (EEM) fluorescence: Searching for specific fingerprints. J. Environ. Manag. 2020, 263, 110396. [CrossRef]
Figure 1.
Chemical structures and corresponding three-dimensional excitation–emission matrix (3DEEM) fluorescence spectra of the fluorescent dyes used in this study: 8-anilino-1-naphthalenesulfonic acid (ANS), acridine orange (AO), methylene blue (MB), and rhodamine B (RhB).
Figure 1.
Chemical structures and corresponding three-dimensional excitation–emission matrix (3DEEM) fluorescence spectra of the fluorescent dyes used in this study: 8-anilino-1-naphthalenesulfonic acid (ANS), acridine orange (AO), methylene blue (MB), and rhodamine B (RhB).
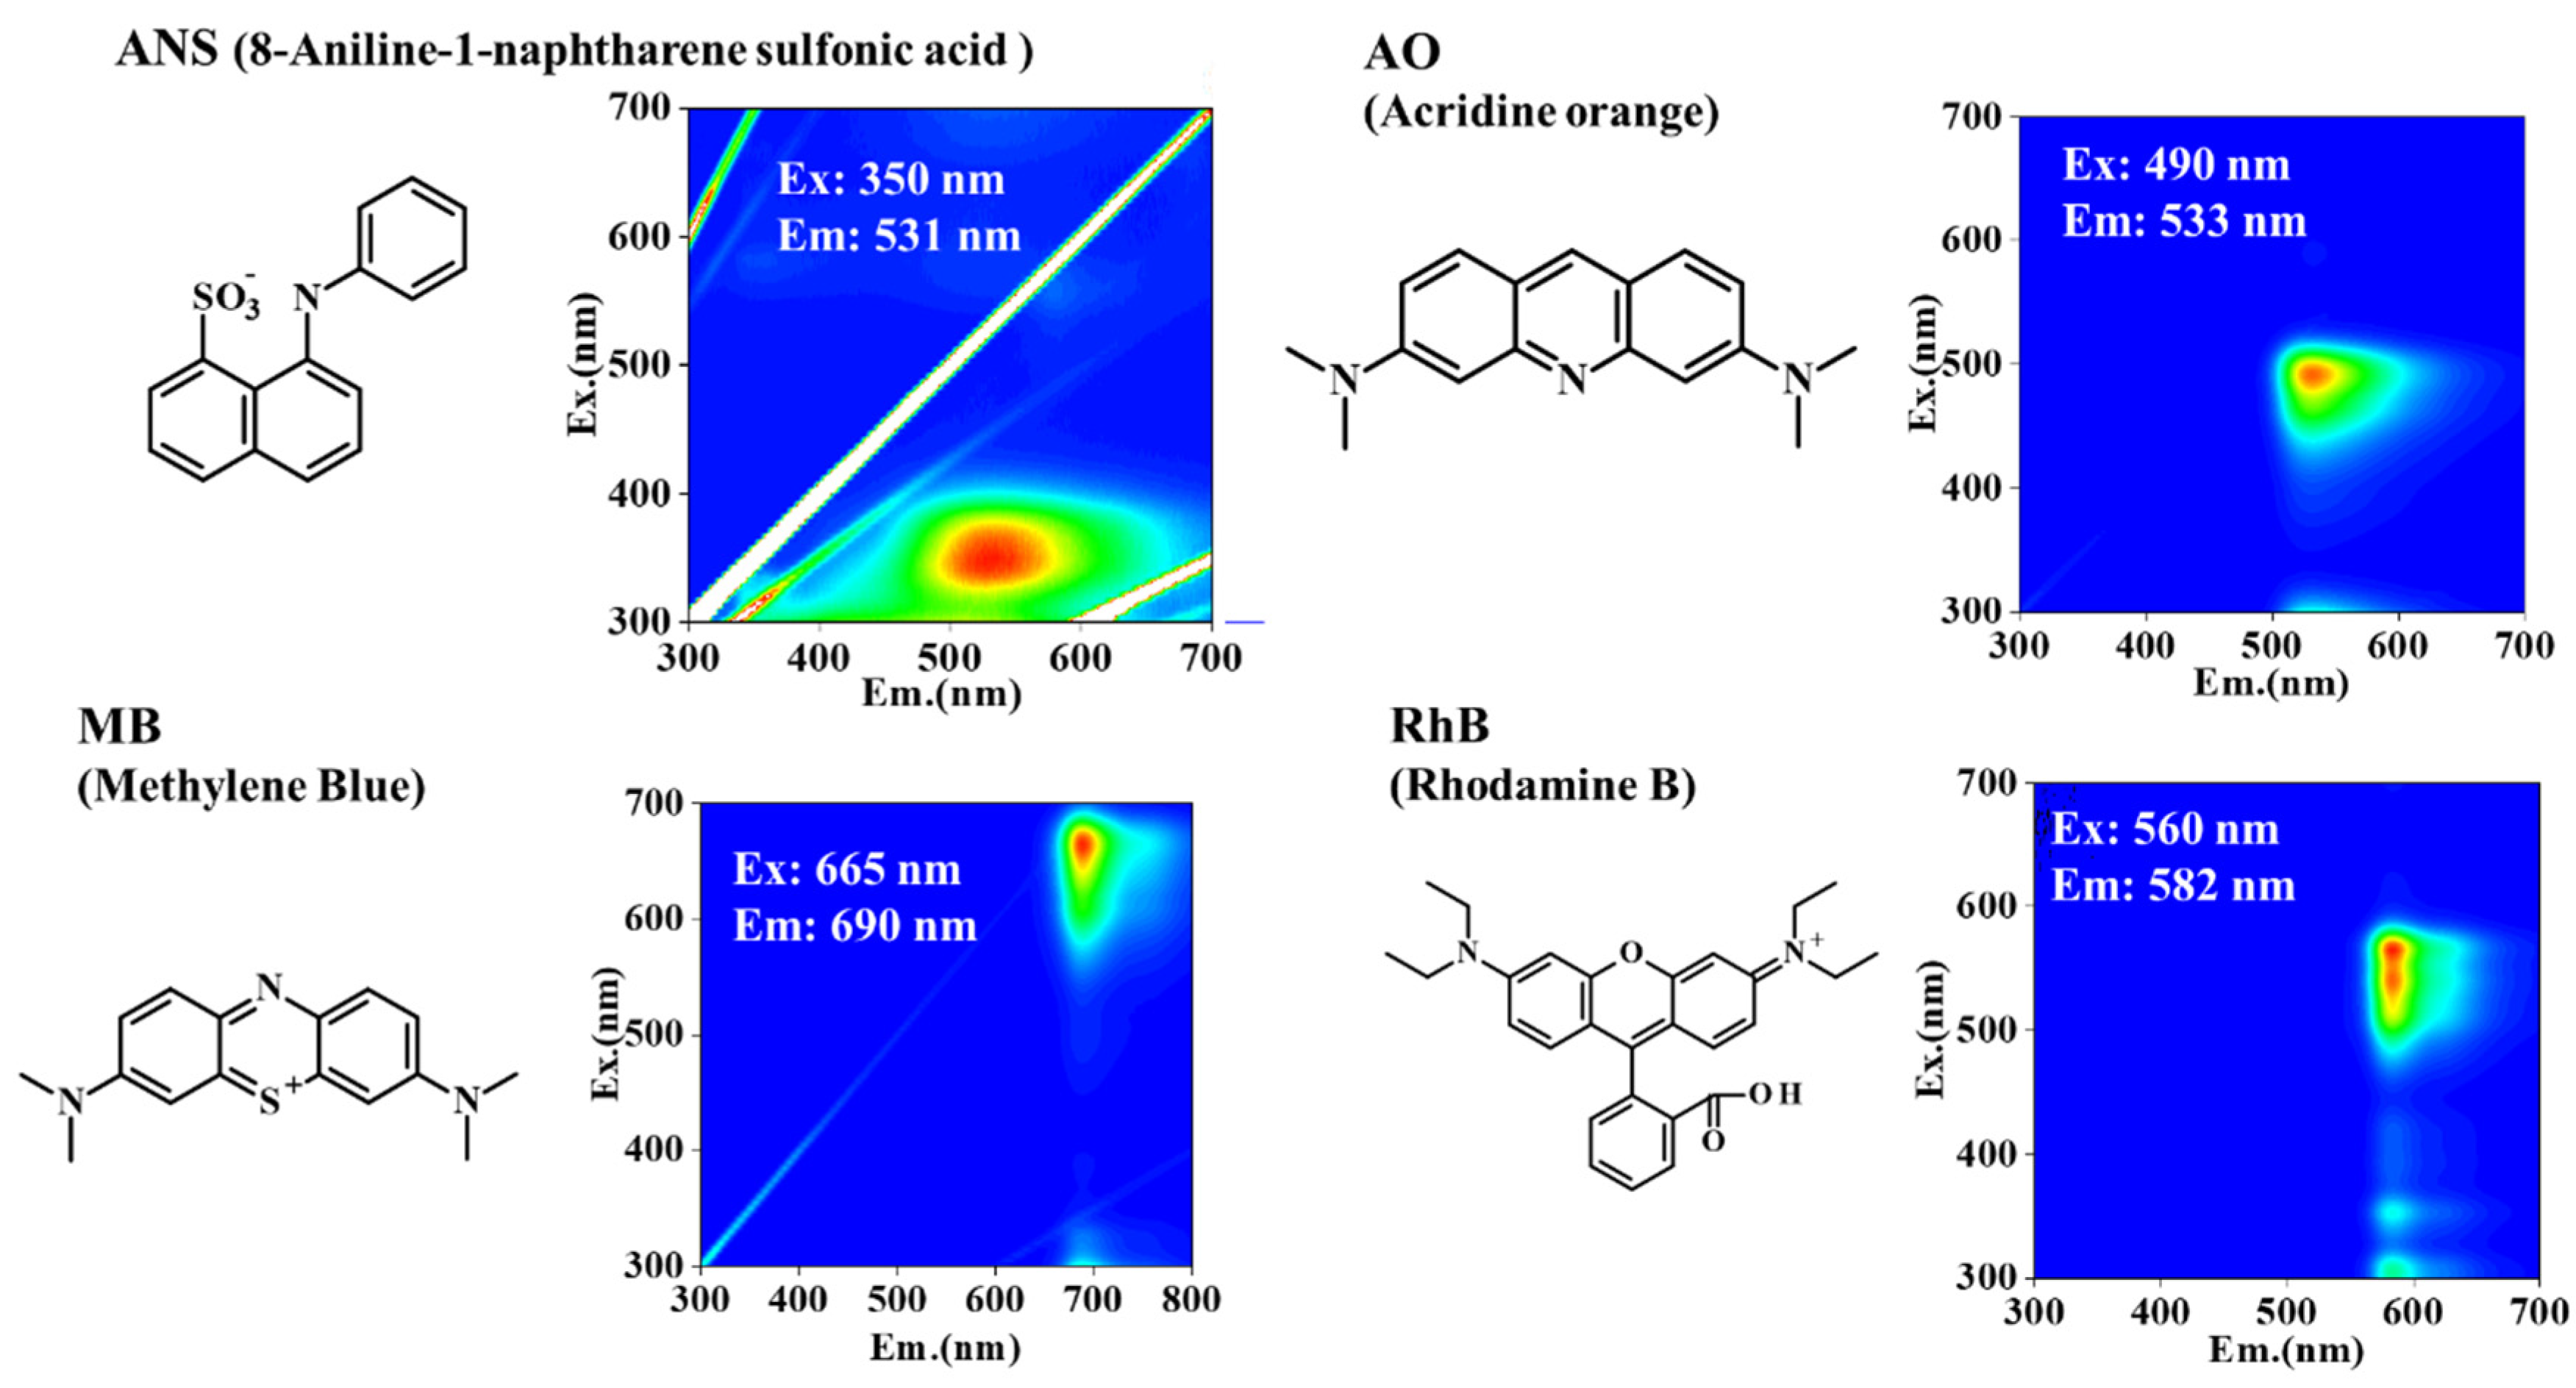
Figure 2.
Fluorescence peak shifts of each dye in solvents of varying polarity: (a) ANS, (b) AO, (c) MB, and (d) RhB. Solvents include tetrahydrofuran (THF), dimethyl sulfoxide (DMSO), acetone (ACTN), ethanol (EtOH), and water.
Figure 2.
Fluorescence peak shifts of each dye in solvents of varying polarity: (a) ANS, (b) AO, (c) MB, and (d) RhB. Solvents include tetrahydrofuran (THF), dimethyl sulfoxide (DMSO), acetone (ACTN), ethanol (EtOH), and water.
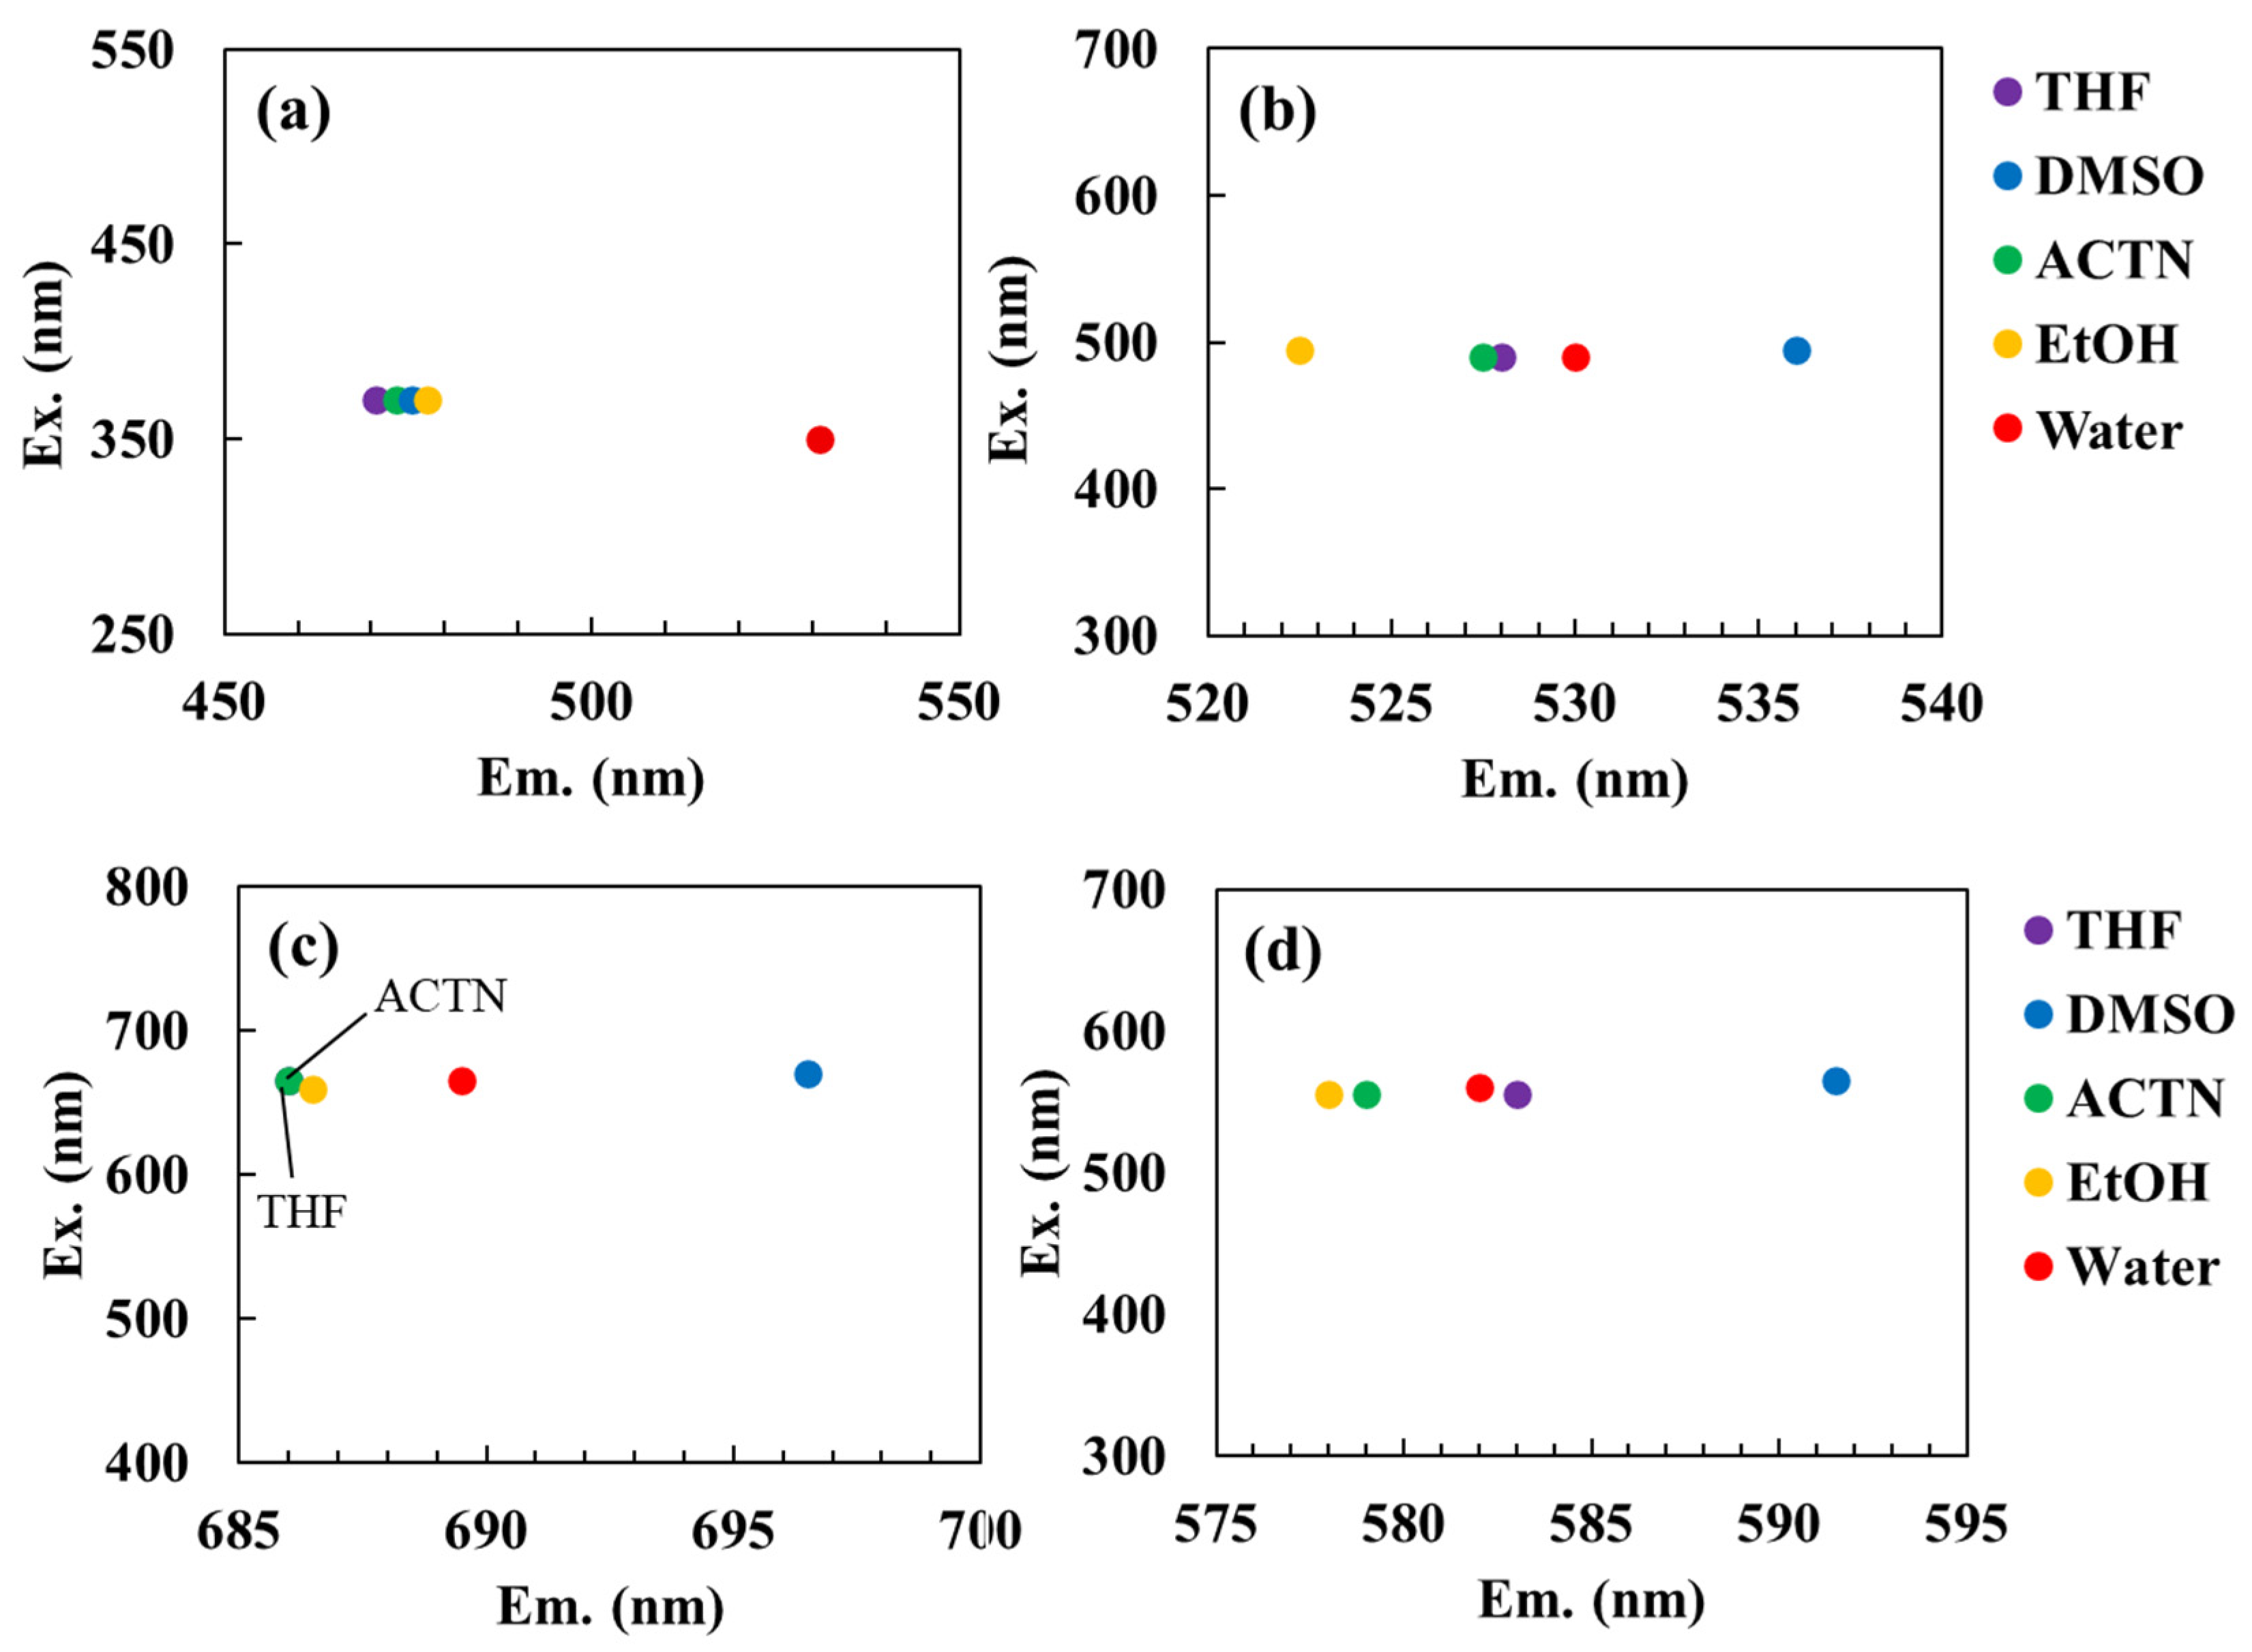
Figure 3.
Three-dimensional EEM fluorescence spectra of 10 mg/L humic acids (HAs) extracted from five soil types (a: APHA, b: CHA, c: FSHA, d: KPHA, e: SPHA) and two commercial sources (f: AHA, g: WHA). The bar charts adjacent to each spectrum indicate the contour intervals.
Figure 3.
Three-dimensional EEM fluorescence spectra of 10 mg/L humic acids (HAs) extracted from five soil types (a: APHA, b: CHA, c: FSHA, d: KPHA, e: SPHA) and two commercial sources (f: AHA, g: WHA). The bar charts adjacent to each spectrum indicate the contour intervals.
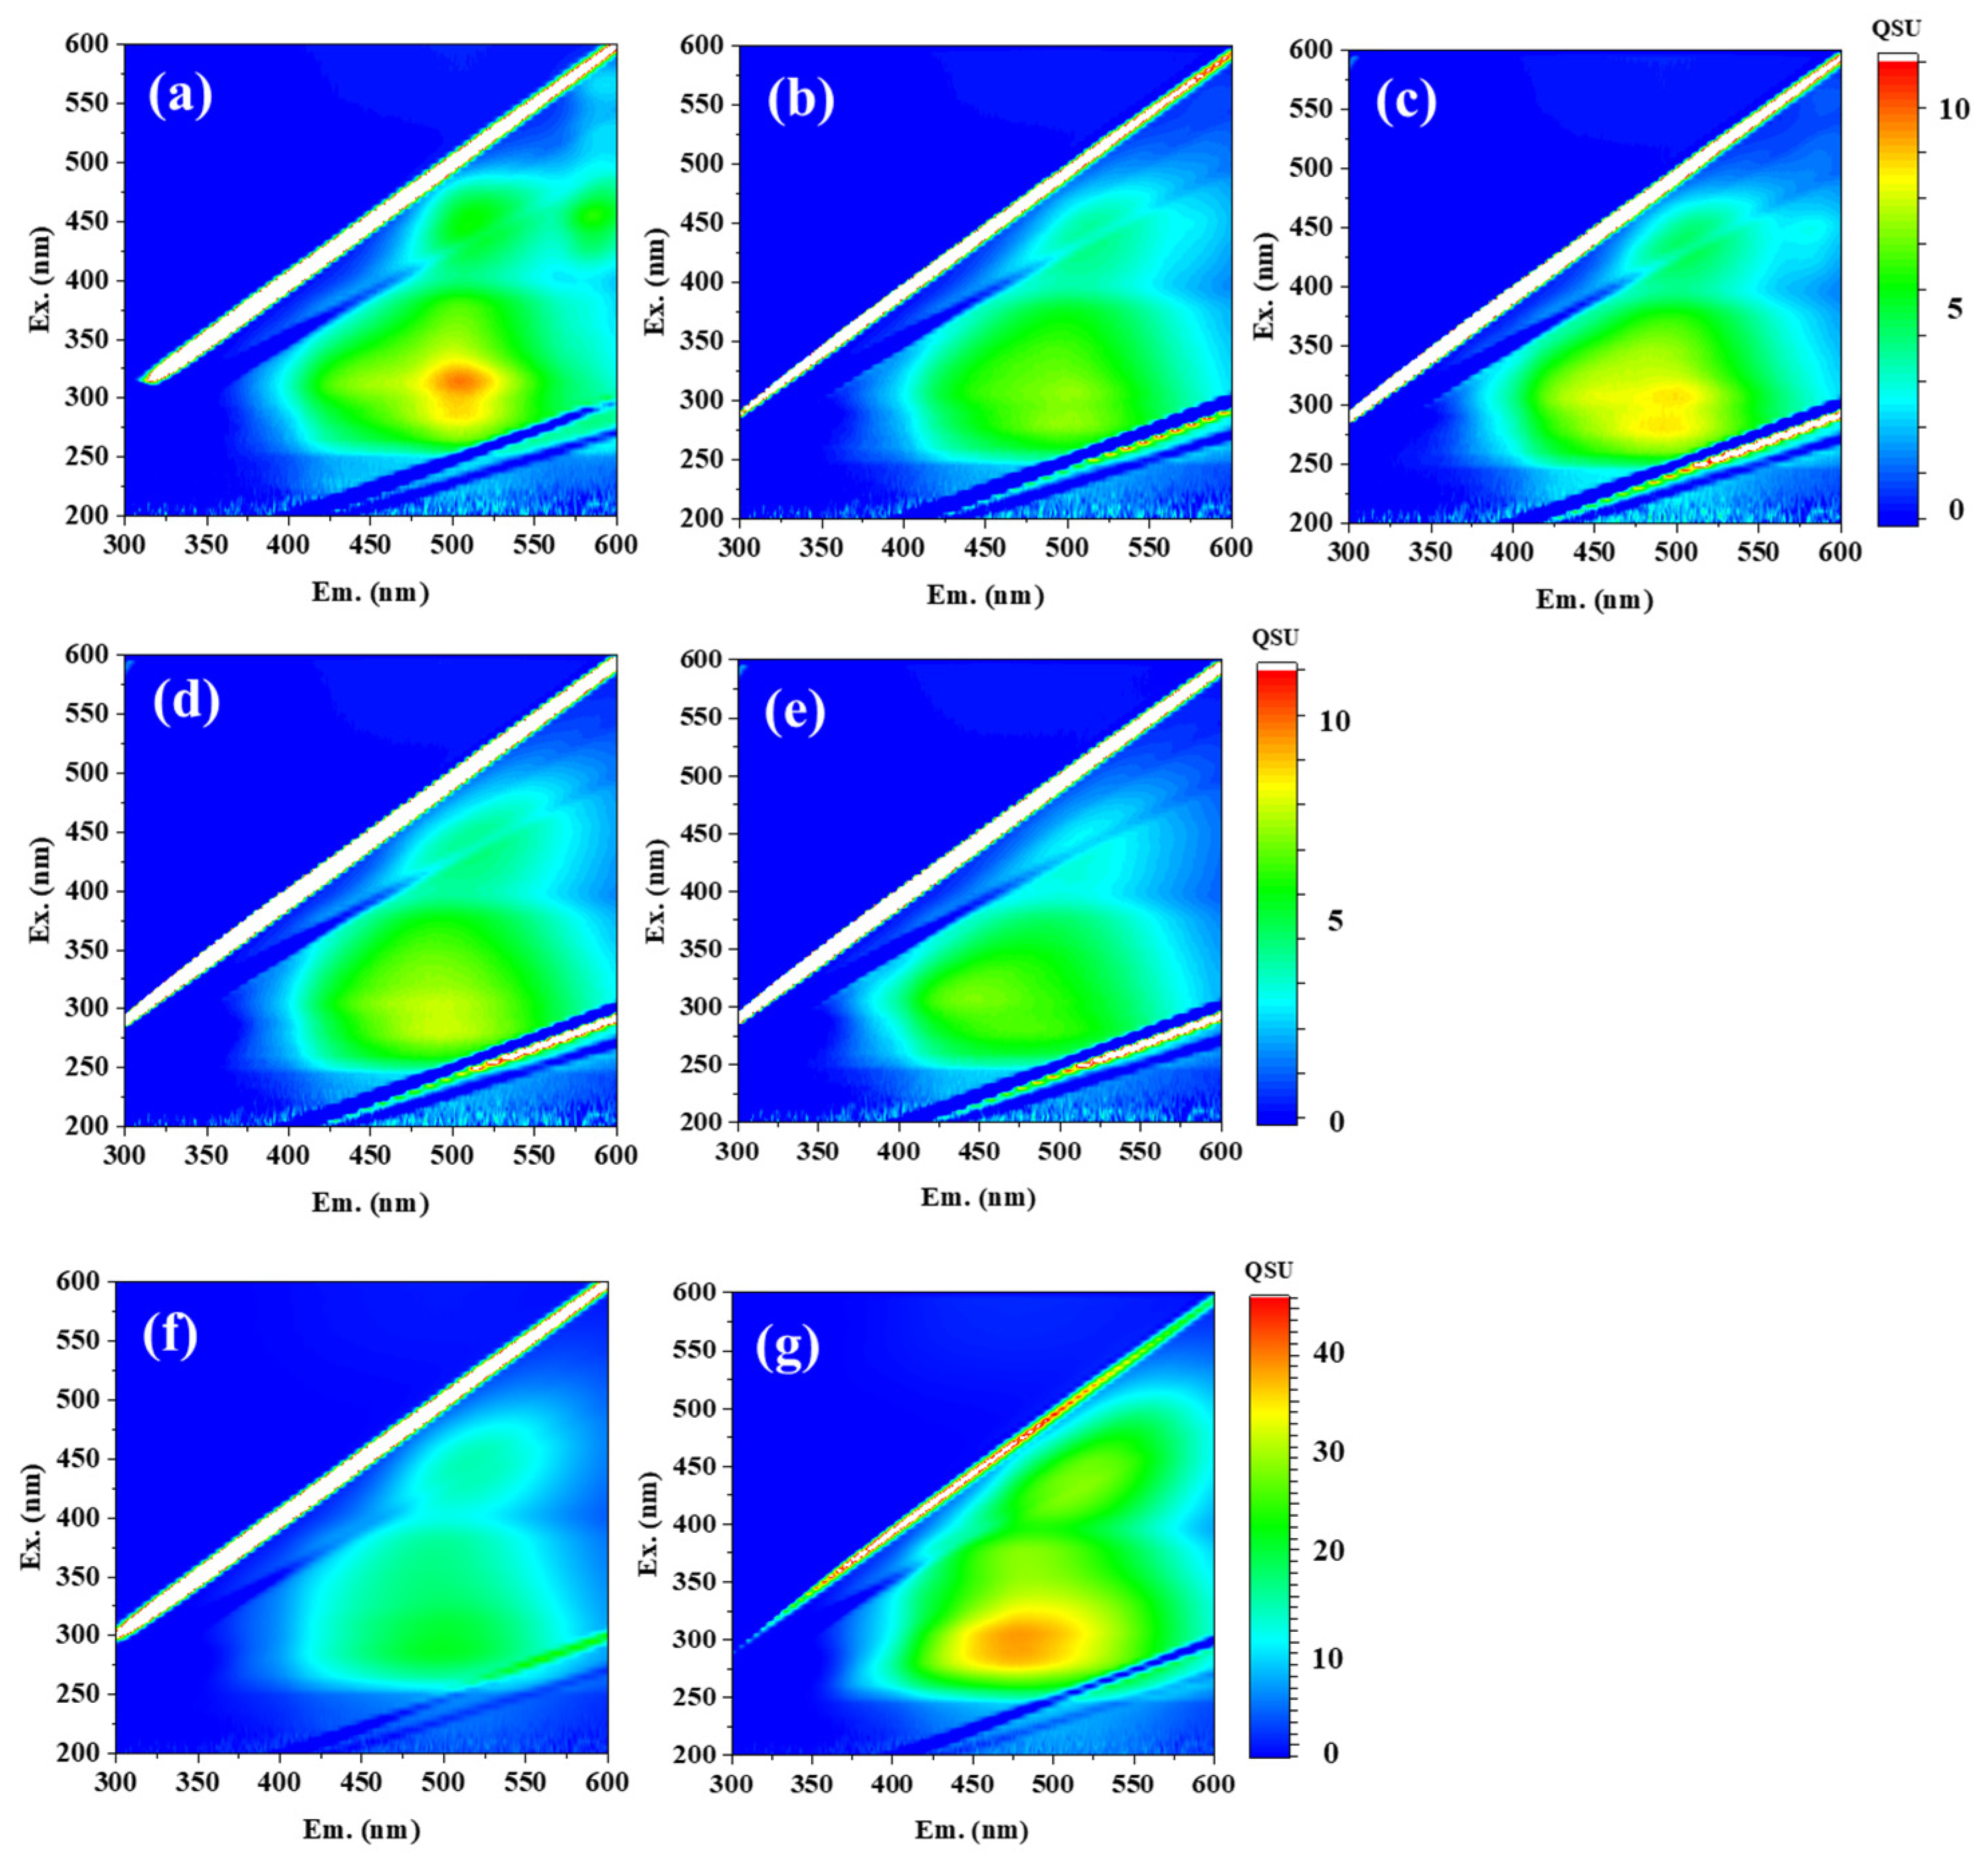
Figure 4.
Fluorescence spectrum and normalized spectrum of MB (10µM) under each 5 mg/L humic acids (HAs) and fluvic acids (FAs) extracted from five soil types (a and b: APHA, CHA, FSHA, KPHA, SPHA), two commercial sources (c and d: AHA and WHA) and IHSS standards (e and f: ESHA, PPHA, LHA, SRFA, PPFA). The spectra were processed using the Savitzky–Golay smoothing (window size of 31). Normalized fluorescence intensity was calculated by dividing the fluorescence intensity at each wavelength by the peak fluorescence intensity. (g) The fluorescence peak shift (black bars) and fluorescence quenching ratio (white triangles) of MB in the presence of each HA and FA at a concentration of 5 mg/L.
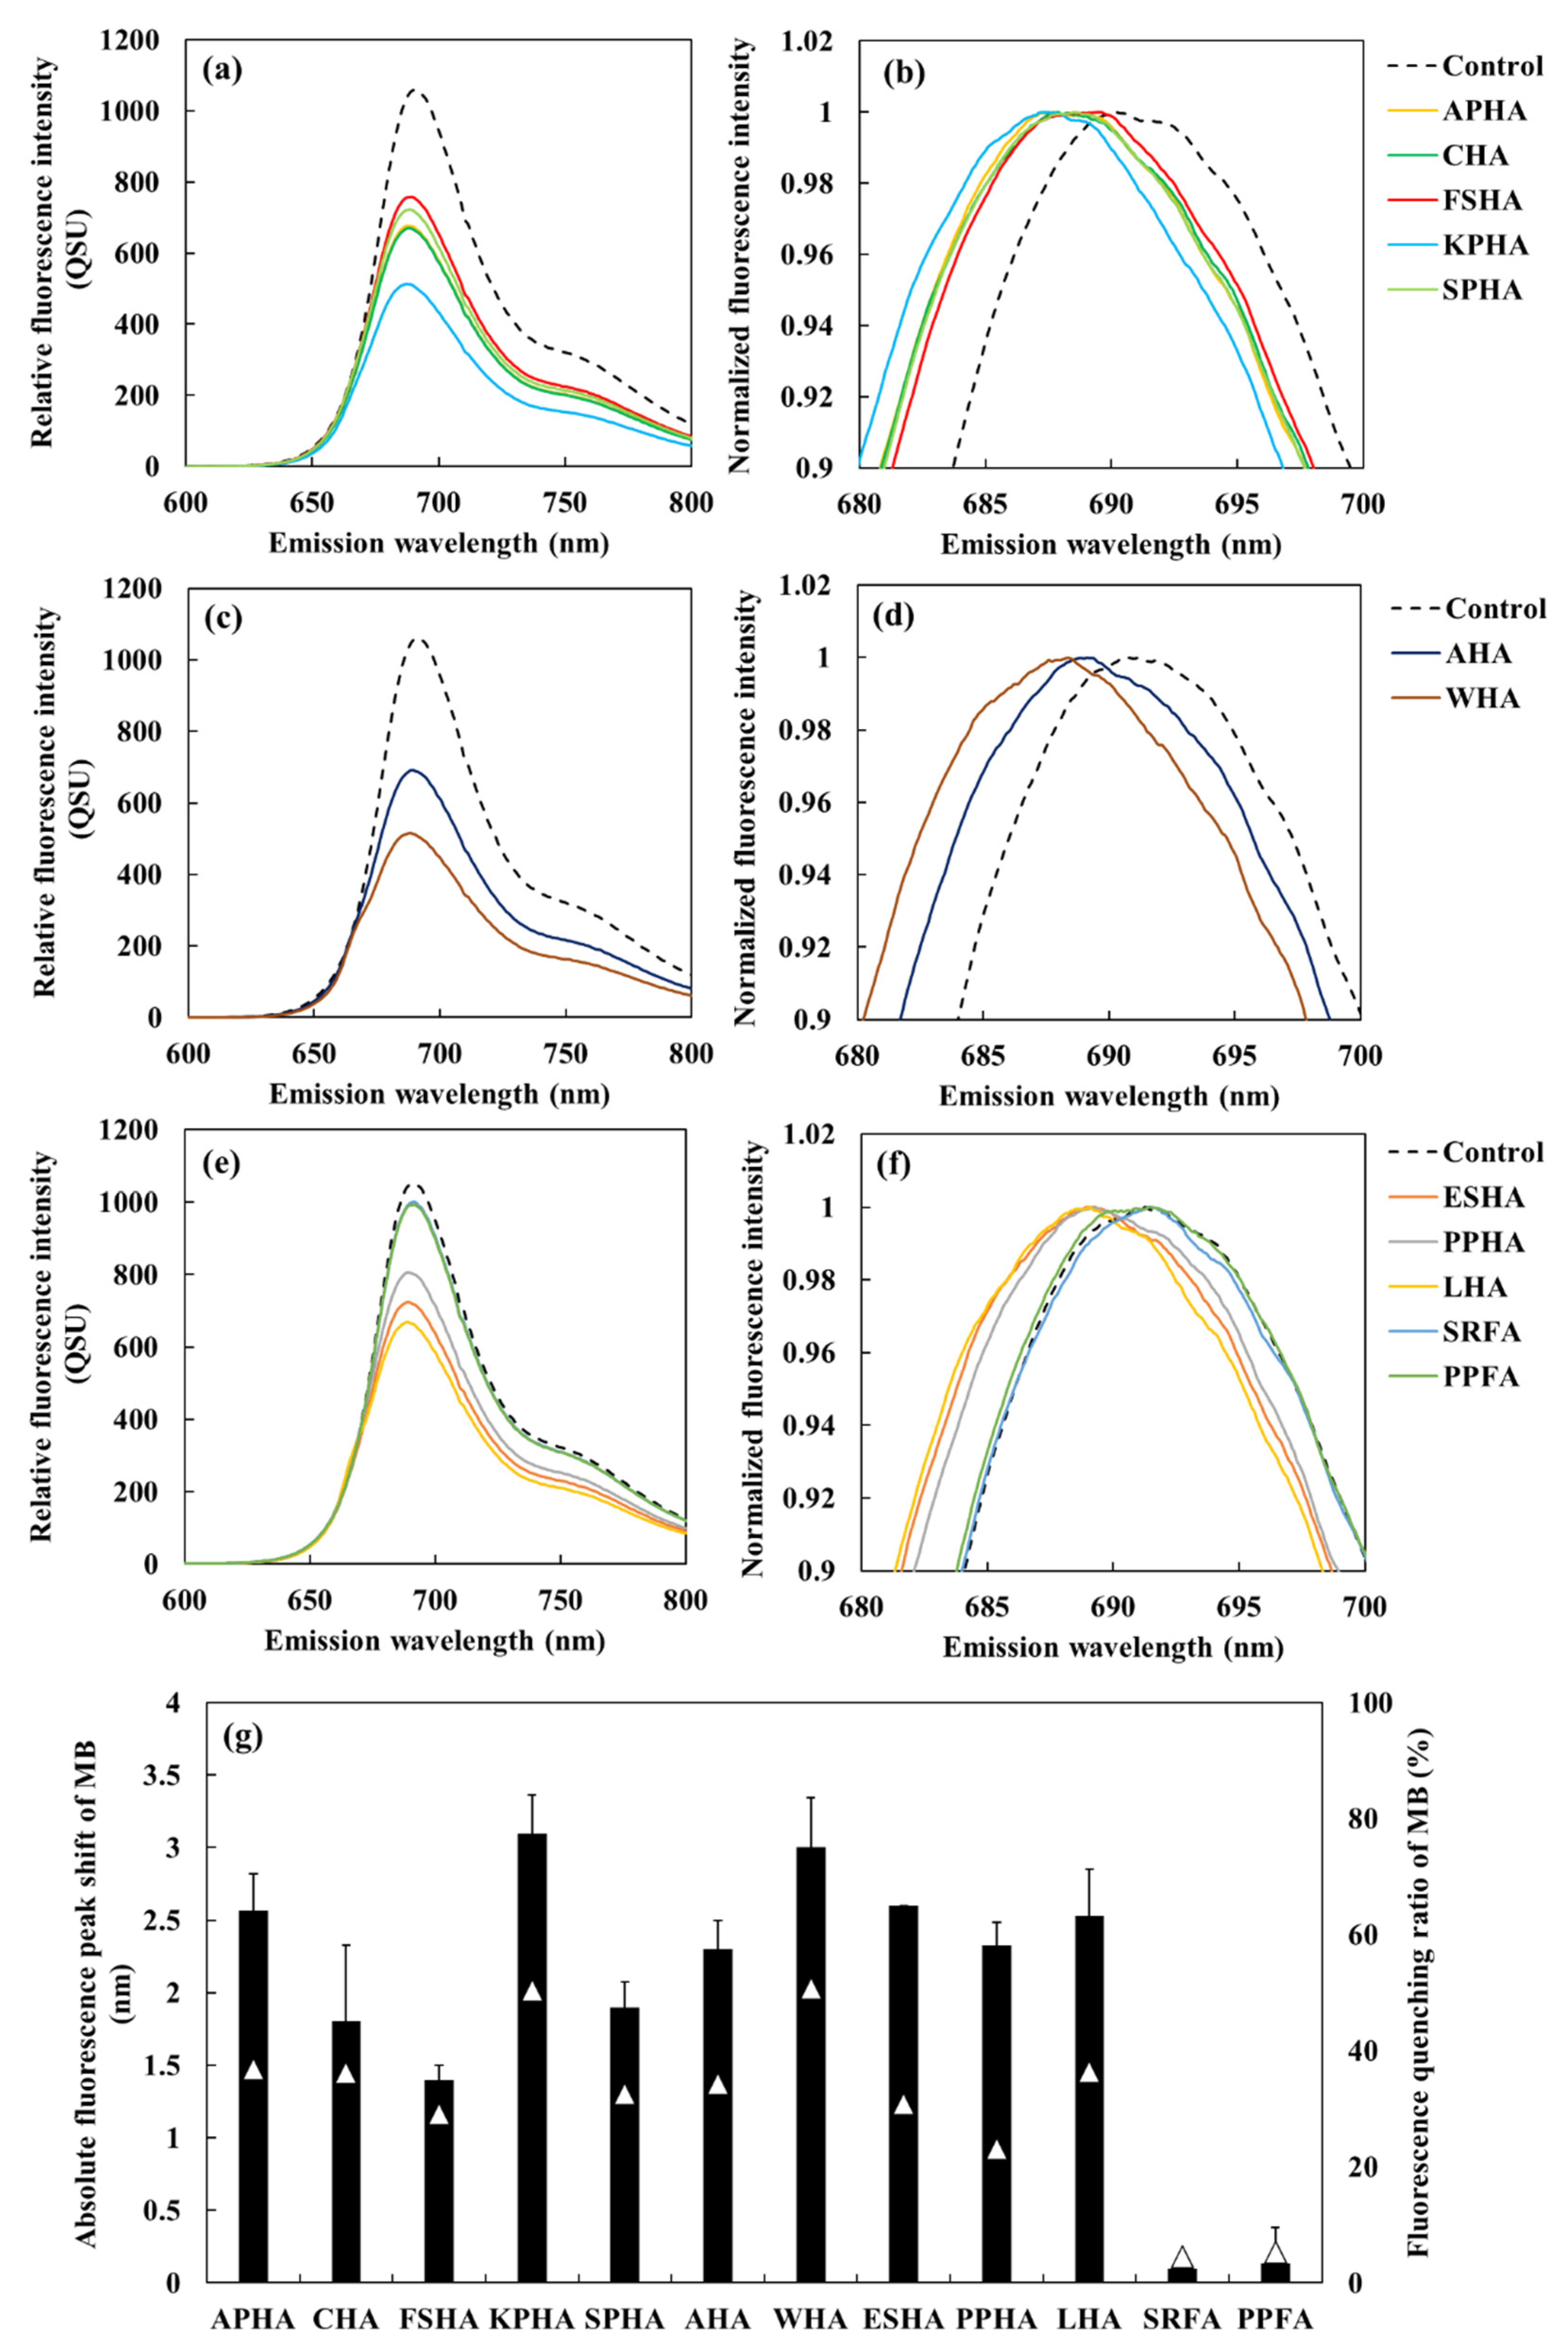
Figure 5.
Heatmap of Spearman’s correlation between the absolute fluorescence peak shift of MB in the presence of HAs (Shifts of λem, MB) and various chemical parameters of the HAs and FAs. R-values are represented by colors, while circle diameter indicates the magnitude of the correlation coefficient. A single asterisk (*) denotes a p-value < 0.05, and a double asterisk (**) denotes a p-value < 0.01. CA: carboxylic acid content; PH: phenolic hydroxyl group content. Samples with no data (ESHA and PPFA) were excluded from the correlation analysis between MB shift and acidic functional groups (CA and PH).
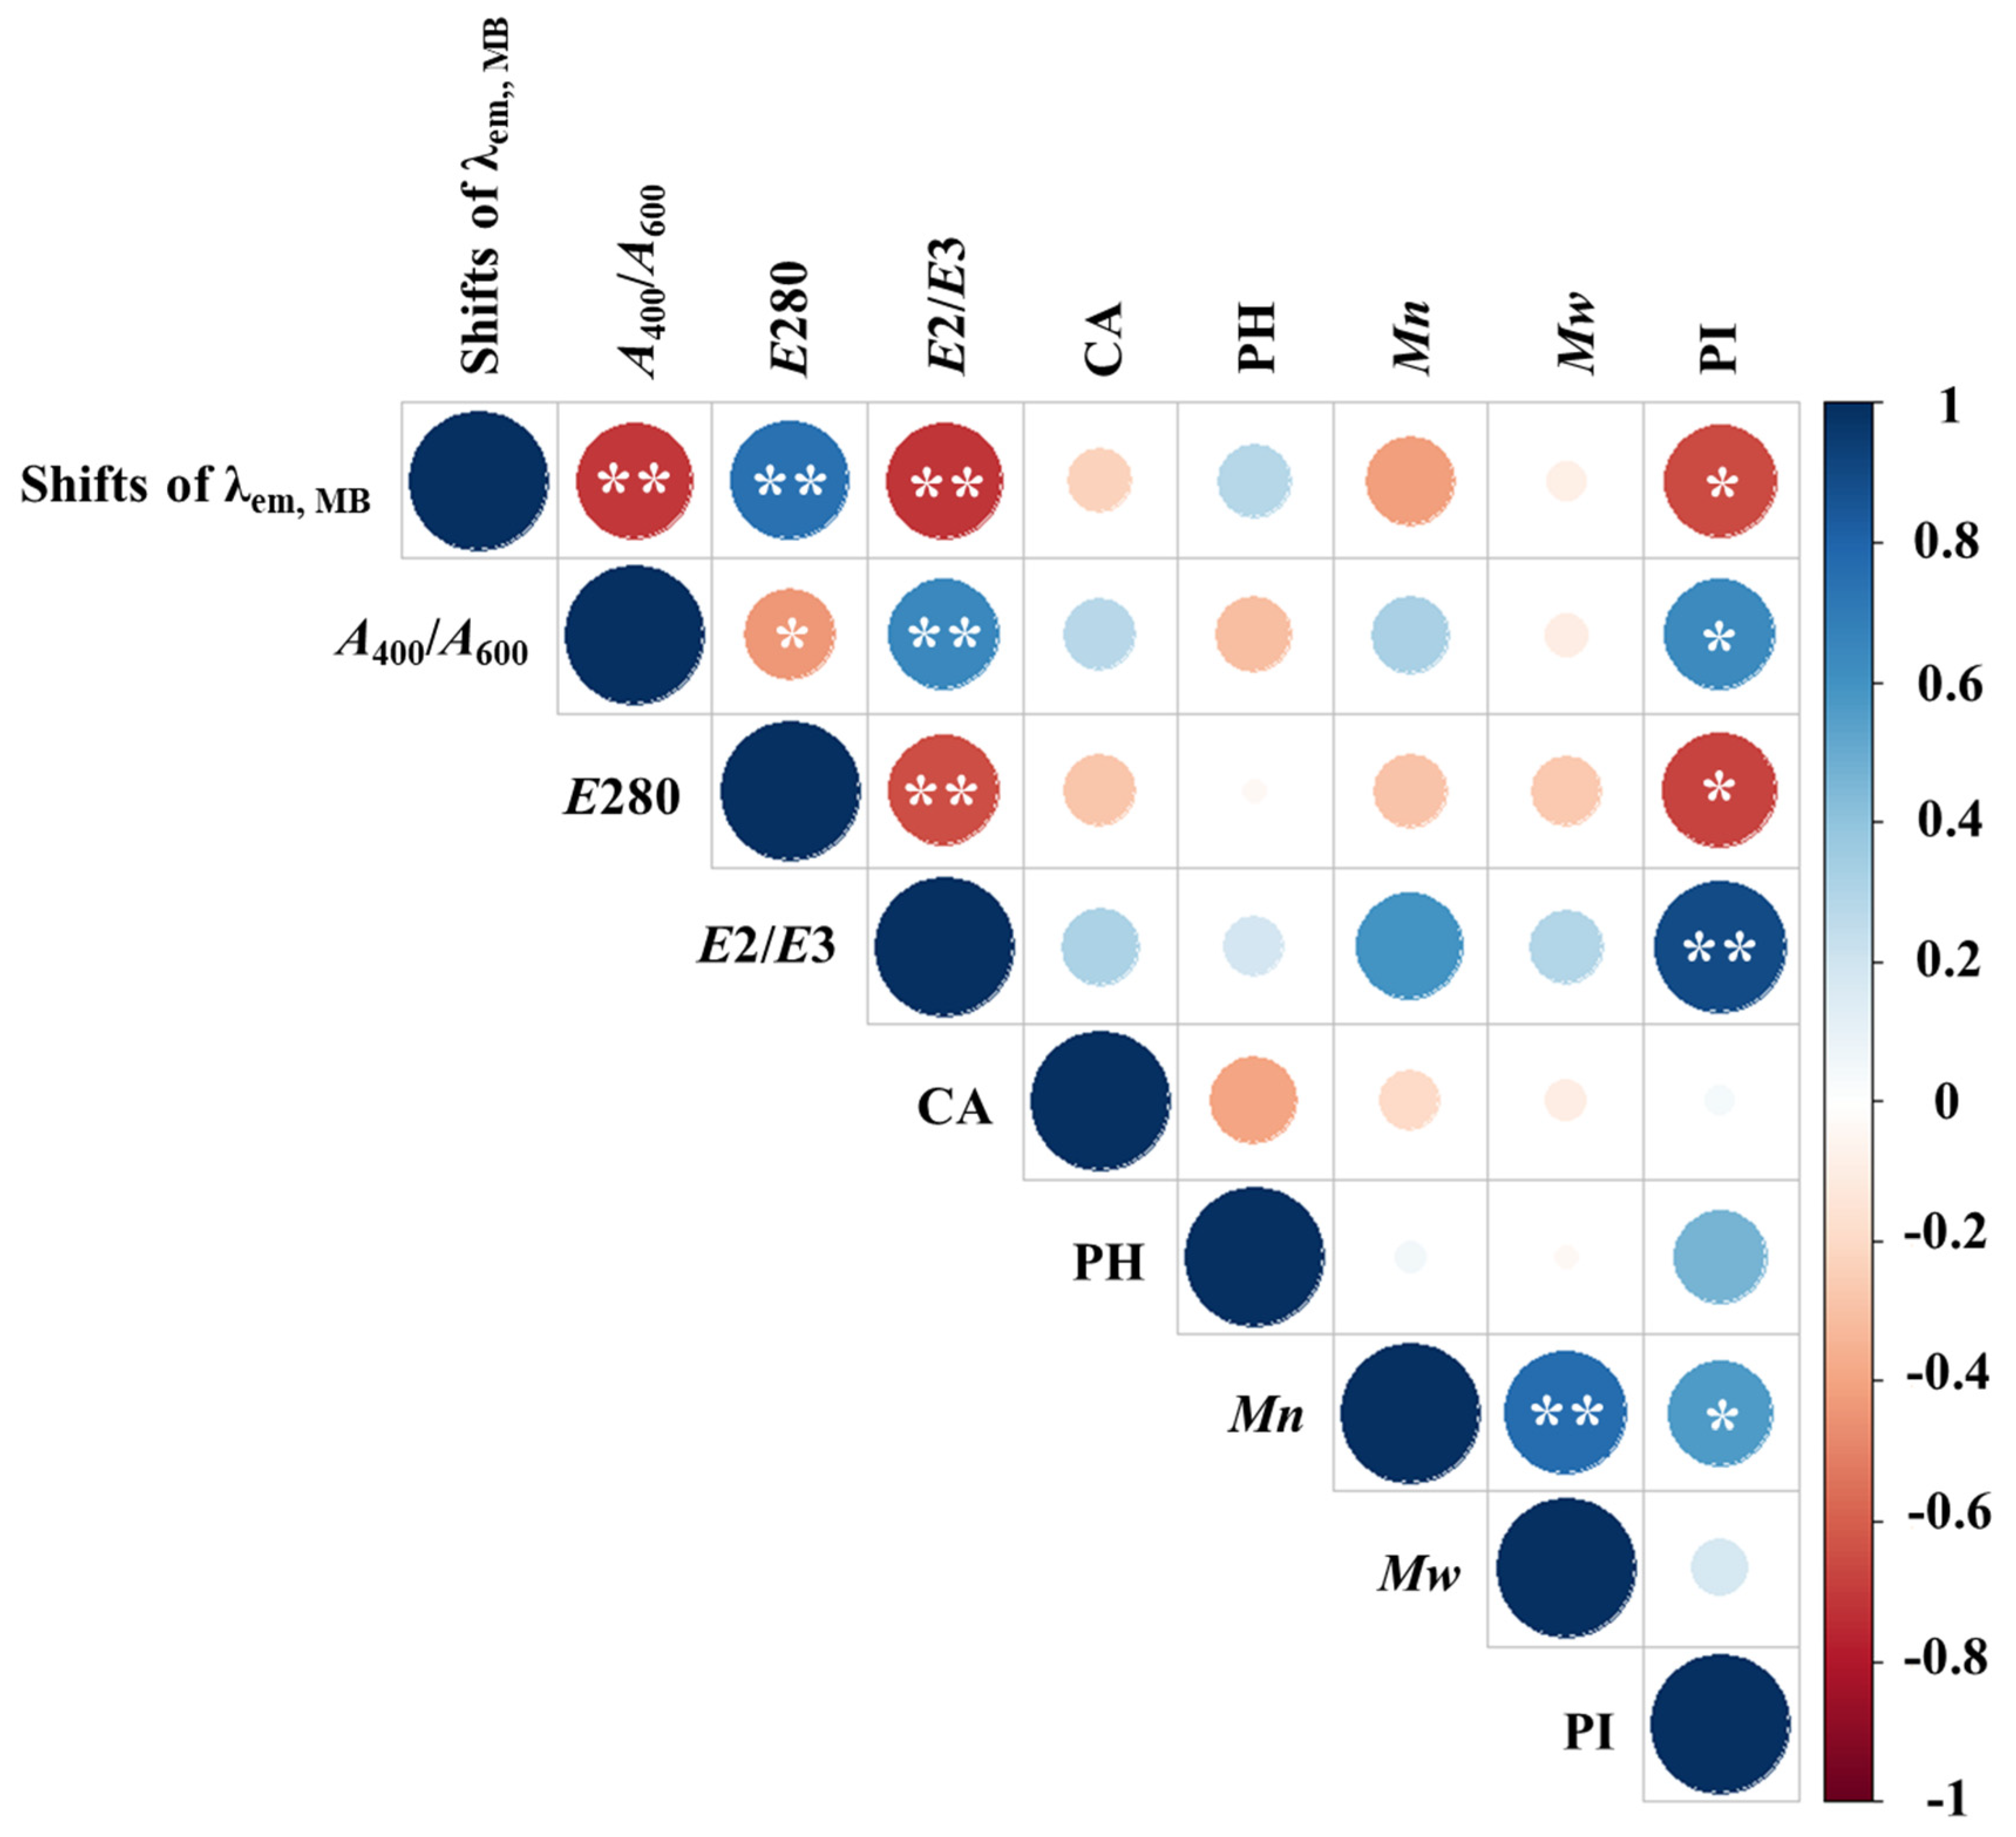

Table 1.
Peak position and relative fluorescence intensity (RFI) of Peak C1, along with the fluorescence index values (FI, BIX, and HIX) for each HA sample.
Table 1.
Peak position and relative fluorescence intensity (RFI) of Peak C1, along with the fluorescence index values (FI, BIX, and HIX) for each HA sample.
| Peak C1 | Index | ||||
|
Peak position (Ex./Em. nm) |
RFI (QSU) |
FI 1 | BIX 2 | HIX 3 | |
| APHA | 315/502 | 10.1 | 0.61 | 0.25 | 13.9 |
| CHA | 280/502 | 7.44 | 0.71 | 0.28 | 14.0 |
| FSHA | 280/491 | 8.90 | 0.72 | 0.33 | 11.6 |
| KPHA | 285/496 | 8.07 | 0.75 | 0.23 | 33.5 |
| SPHA | 280/490 | 6.59 | 0.83 | 0.37 | 12.6 |
| AHA | 290/498 | 21.7 | 0.76 | 0.30 | 59.4 |
| WHA | 305/479 | 39.2 | 0.87 | 0.26 | 155 |
1 FI was calculated as the ratio of emission intensity at 450 nm to that at 500 nm following excitation at 370 nm. 2 BIX was determined as the ratio of emission intensities at 380 nm and 430 nm upon excitation at 310 nm. 3 HIX was calculated as the ratio of the sum of fluorescence intensities at 435–480 nm to that at 300–345 nm under an excitation wavelength of 254 nm.
Table 2.
Emission wavelength shifts (λem) and fluorescence quenching ratios of AO and MB in the presence of varying concentrations (0.5–20 mg/L) of AHA and WHA.
Table 2.
Emission wavelength shifts (λem) and fluorescence quenching ratios of AO and MB in the presence of varying concentrations (0.5–20 mg/L) of AHA and WHA.
| AO | MB | ||||||
| Concentration of HAs (mg/L) |
Peak position (Ex./Em. nm) |
Peak shift of λem (nm) | Quenching ratio (%) |
Peak position (Ex./Em. nm) |
Peak shift of λem (nm) | Quenching ratio (%) | |
| AHA | 0.5 | 530.0/490 | 0 | 61 | 689.0/665 | −1.5 | 5 |
| 1 | 530.5/490 | +0.5 | 78 | 689.5/665 | −1.0 | 13 | |
| 5 | 531.0/490 | +1.0 | 98 | 687.5/665 | −3.0 | 64 | |
| 10 | 540.0/490 | +10 | 99 | 687.0/665 | −3.5 | 90 | |
| 20 | − | − | − | 695.0/665 | +4.5 | 97 | |
| WHA | 0.5 | 529.5/490 | −0.5 | 46 | 689.5/665 | −1.0 | 8 |
| 1 | 530.0/490 | 0 | 74 | 688.0/665 | −2.5 | 20 | |
| 5 | 536.5/490 | +6.5 | 98 | 686.0/665 | −4.5 | 86 | |
| 10 | − | − | − | 699.5/665 | +9.0 | 97 | |
| 20 | − | − | − | 708.5/665 | +18 | 99 | |
Disclaimer/Publisher’s Note: The statements, opinions and data contained in all publications are solely those of the individual author(s) and contributor(s) and not of MDPI and/or the editor(s). MDPI and/or the editor(s) disclaim responsibility for any injury to people or property resulting from any ideas, methods, instructions or products referred to in the content. |
© 2025 by the authors. Licensee MDPI, Basel, Switzerland. This article is an open access article distributed under the terms and conditions of the Creative Commons Attribution (CC BY) license (http://creativecommons.org/licenses/by/4.0/).
Copyright: This open access article is published under a Creative Commons CC BY 4.0 license, which permit the free download, distribution, and reuse, provided that the author and preprint are cited in any reuse.


