
Submitted:
21 October 2025
Posted:
22 October 2025
You are already at the latest version
Abstract
This paper investigates the performance degradation of lithiumion cells, with a specific focus on energy efficiency throughout their operational life. A novel metric, termed State of Efficiency (SOE), is introduced to quantify energy losses during charge-discharge cycles. Utilizing empirical battery aging data, the evolution of SOE is analyzed, revealing a linear decay trend. Furthermore, the influence of operational variables, including temperature and discharge rates, on SOE is examined. The findings contribute to a refined understanding of efficiency dynamics in lithium-ion cells, providing insights for enhanced battery management strategies.
Keywords:
lithium-ion batteries
; performance degradation
; energy efficiency
; State of Efficiency (SOE)
; battery aging
; thermal effects
; discharge rate
; battery management
1. Introduction
The incorporation of renewable resources, such as solar and wind, into modern power grids necessitates dependable energy storage mechanisms capable of responding to demand fluctuations. Lithium-ion batteries (LIBs), known for their compactness and high energy capacity, are prominently utilized in battery energy storage systems (BESS). The overall performance of such systems hinges on the reliability and efficiency of the underlying batteries.
Although significant research has focused on capacity-related indicators like State of Charge (SOC) and State of Health (SOH), the dimension of energy efficiency degradation has received relatively less attention. Batteries experience capacity fade due to environmental exposure and cycling, leading to suboptimal energy retention and delivery [1]. Therefore, this study introduces the State of Efficiency (SOE) [2], a metric dedicated to quantifying the effectiveness of energy conversion in lithium-ion cells over time.
The investigation involves assessing Nickel-Cobalt-Aluminum (NCA) based LIBs using a NASA-provided dataset. A linear decline in SOE is observed and modeled accordingly. Additionally, the influences of temperature, discharge rate, and voltage thresholds on energy performance are explored[3]. This work aims to enhance energy management strategies and extend usable battery life through efficiency-aware design.
Related Work
Mehul Patel[4] has made notable contributions to machine learning and surveillance technologies. Mehul Patel’s[5] work on robust background subtraction provides a method for 24-hour video surveillance under varying weather conditions, leveraging the Pixel-Based Adaptive Segmenter (PBAS). Additionally, Mehul Patel’s study on predicting water potability applies advanced algorithms like XGBoost, achieving significant improvements in water quality monitoring systems. Sandeep Malipeddi[6] has explored hybrid IT security solutions, utilizing passive honeypot sensors and Self-Organizing Maps (SOM) for detecting Advanced Persistent Threats (APTs) and visualizing cyber threats.
Akshar Patel[7] has extensively advanced blockchain research, particularly in analyzing attack thresholds in Proof of Stake (PoS) consensus protocols. Akshar Patel’s[8] investigation into robustness in neural networks like ICNet and U-Net under rotationally disrupted datasets highlights challenges in generalization. Furthermore, Akshar Patel’s[9] exploration of decentralized computing through meritocratic economic incentives bridges the gap between computational integrity and resource optimization. Anuj Kabra[10] has significantly contributed to gait recognition technologies, including the GLGait framework for real-world scenarios and the use of diffusion models for self-supervised pretraining. Kabra’s[11] work enhances human identification systems under unconstrained conditions. Additionally, Anuj Kabra’s[12] innovations in global-local temporal receptive fields improve gait recognition, and Kabra’s[13] approaches to handling occlusions further refine these systems. Rakesh Recharla[14] has made impactful advancements in distributed systems. Recharla’s[15] work includes fault tolerance in Hadoop MapReduce, dynamic memory partitioning with FlexAlloc for SeKVM, and scalable decentralized file exchange hubs. Furthermore, Recharla’s[16] research into parallel sparse matrix algorithms emphasizes his contributions to computational efficiency. Rakesh Recharla’s[17] work has also extended to improving the reliability of cloud-based data exchange systems. Lastly, Deepak Talwar’s[18] RedTeamAI framework rigorously evaluates autonomous cybersecurity agents, while Talwar’s[19] language model-based analysis advances the evaluation of instructional quality, showcasing the transformative potential of AI.
2. Energy Transfer Efficiency Metrics
2.1. Experimental Dataset
The analysis is grounded on experimental cycles conducted by NASA’s Prognostics Center of Excellence, which feature commercial NCA-based 18650 cylindrical cells. The testing scenarios incorporate diverse ambient temperatures, discharge rates, and cutoff voltages. These settings are summarized in Table 1 and Table 2.
Each battery cycle entails full charging in CC-CV mode and discharging in constant current (CC) mode until a defined voltage threshold. Voltage and current data are collected throughout for energy analysis[20].
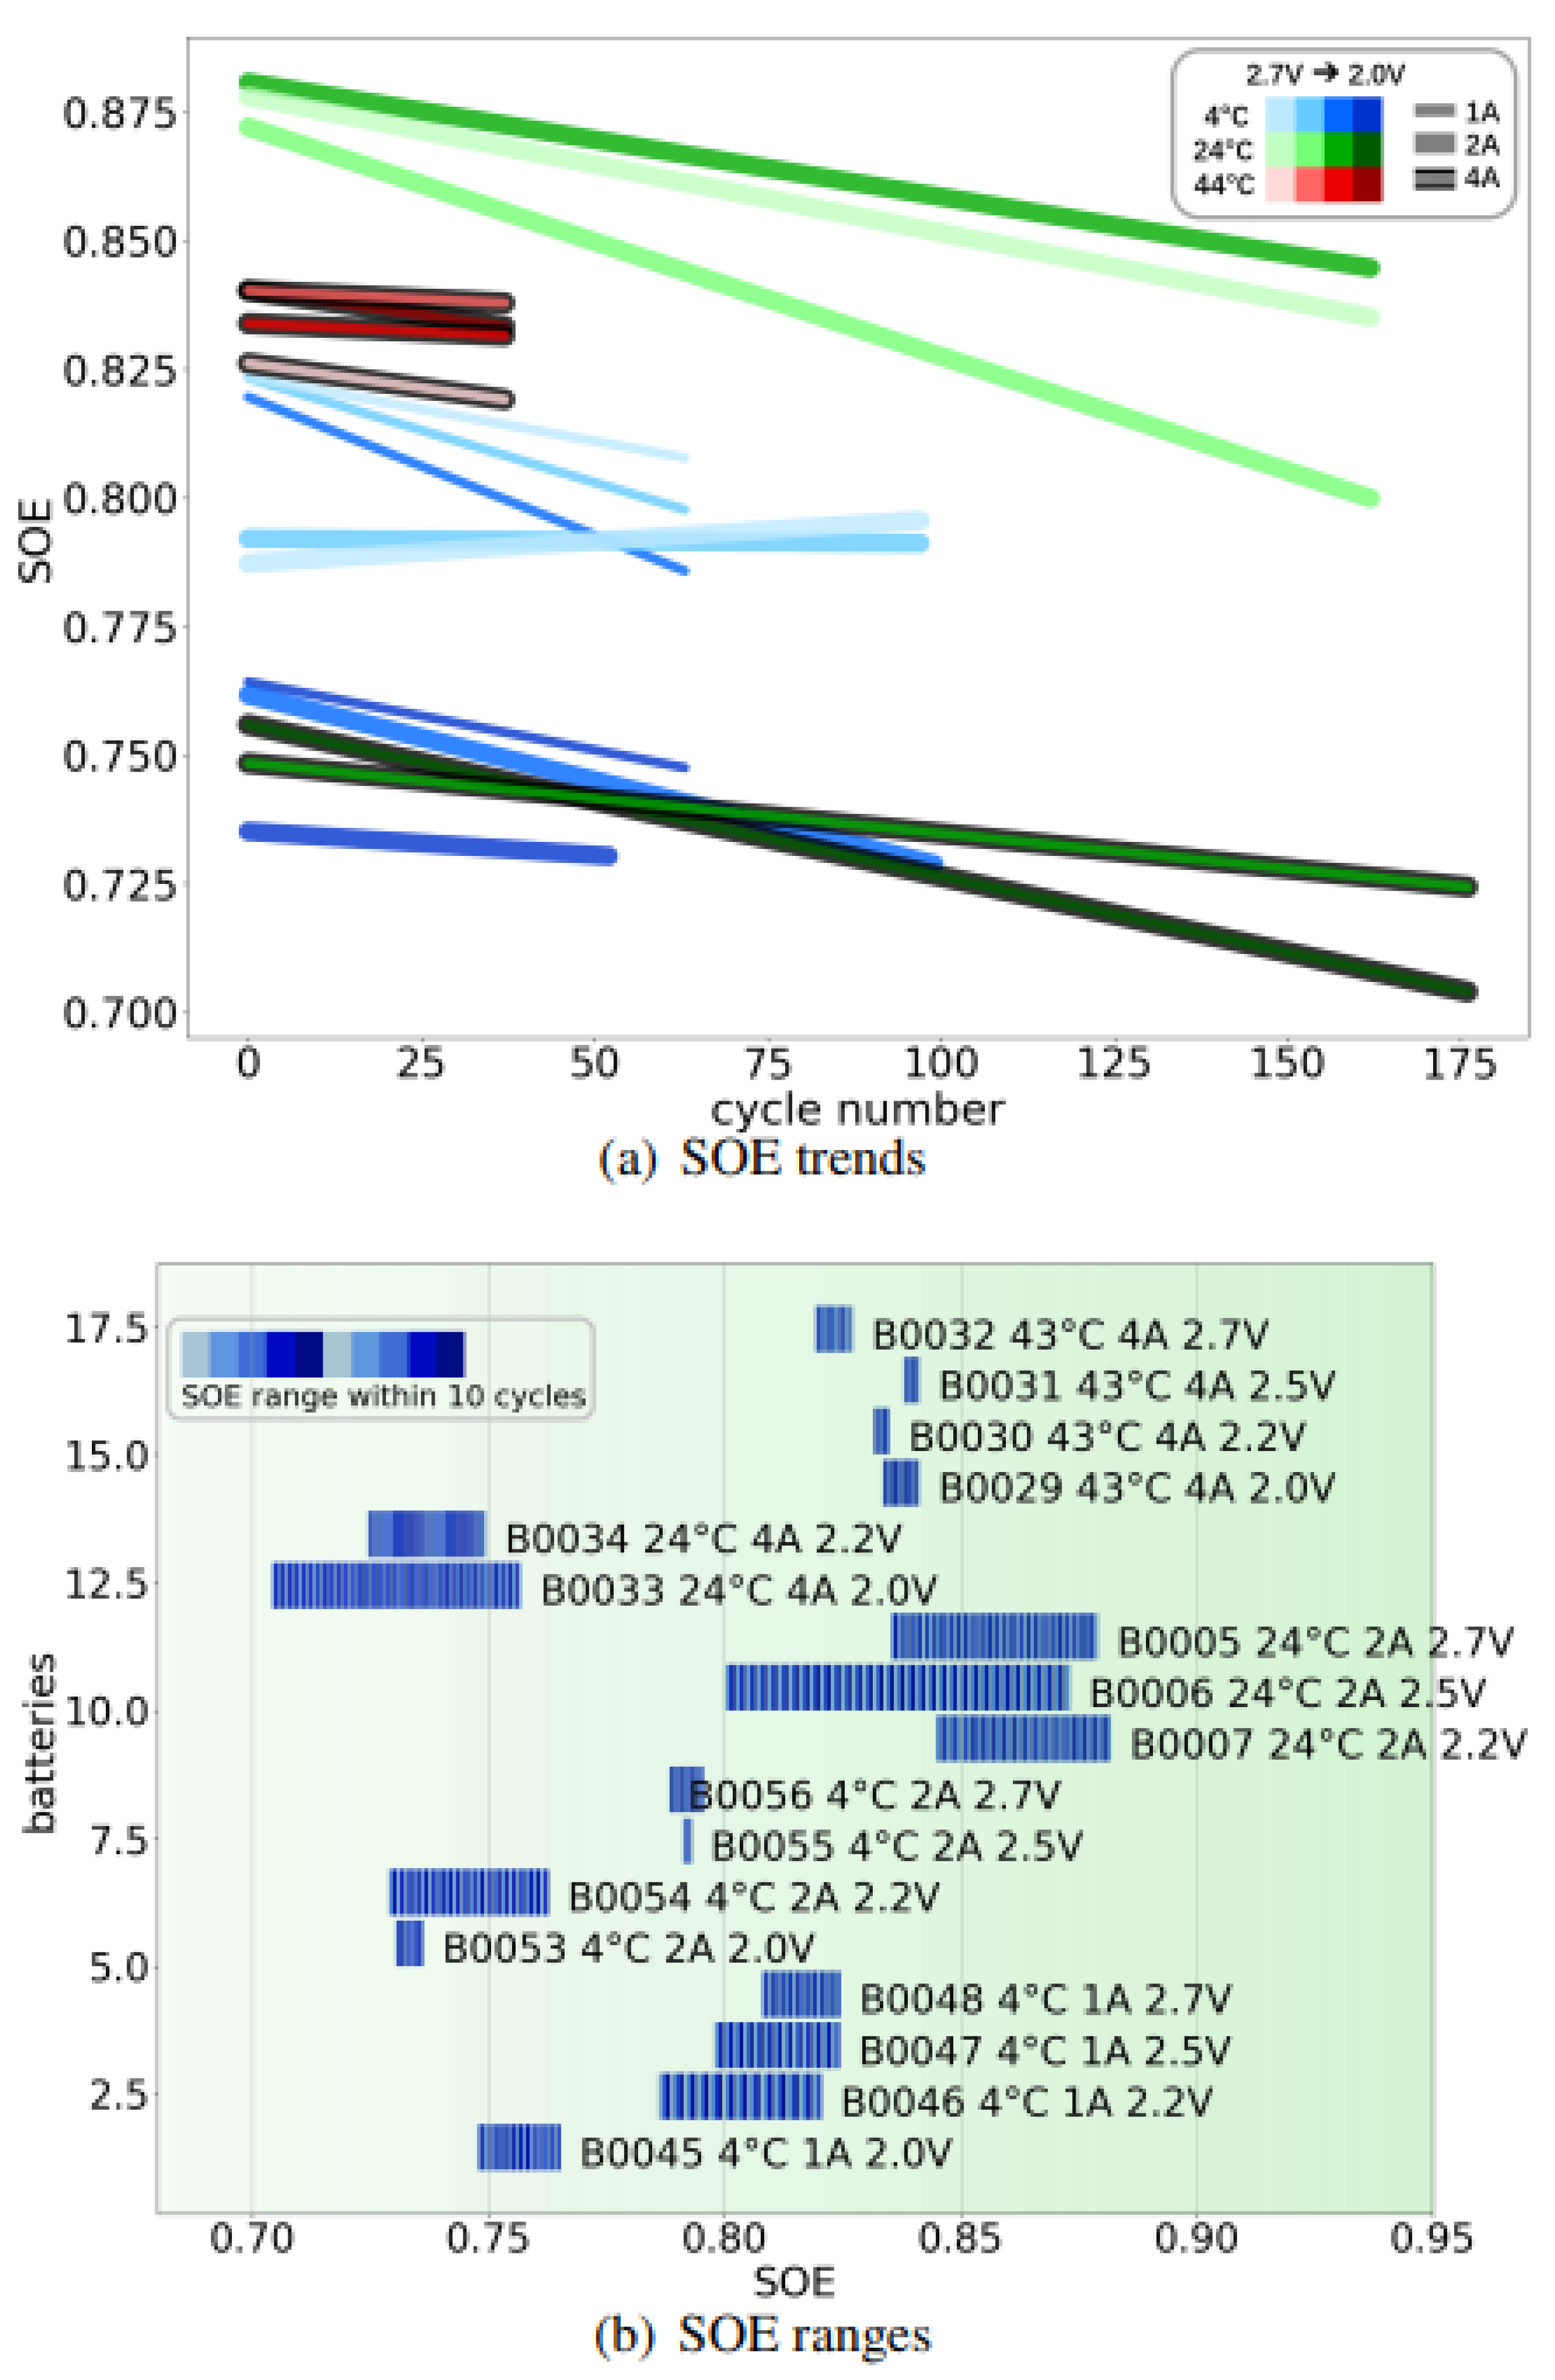
Figure 1.
(a) Linear degradation lines under varied test conditions. (b) SOE ranges indicating efficiency spread.
Figure 1.
(a) Linear degradation lines under varied test conditions. (b) SOE ranges indicating efficiency spread.
2.2. Energy Balance and SOE Definition
A typical energy cycle involves losses during both charging and discharging:
Here, and represent losses due to electrochemical cycling and aging over time, respectively.
Thus, the State of Efficiency (SOE) is defined as:
and calculated [21] using discrete time samples as:
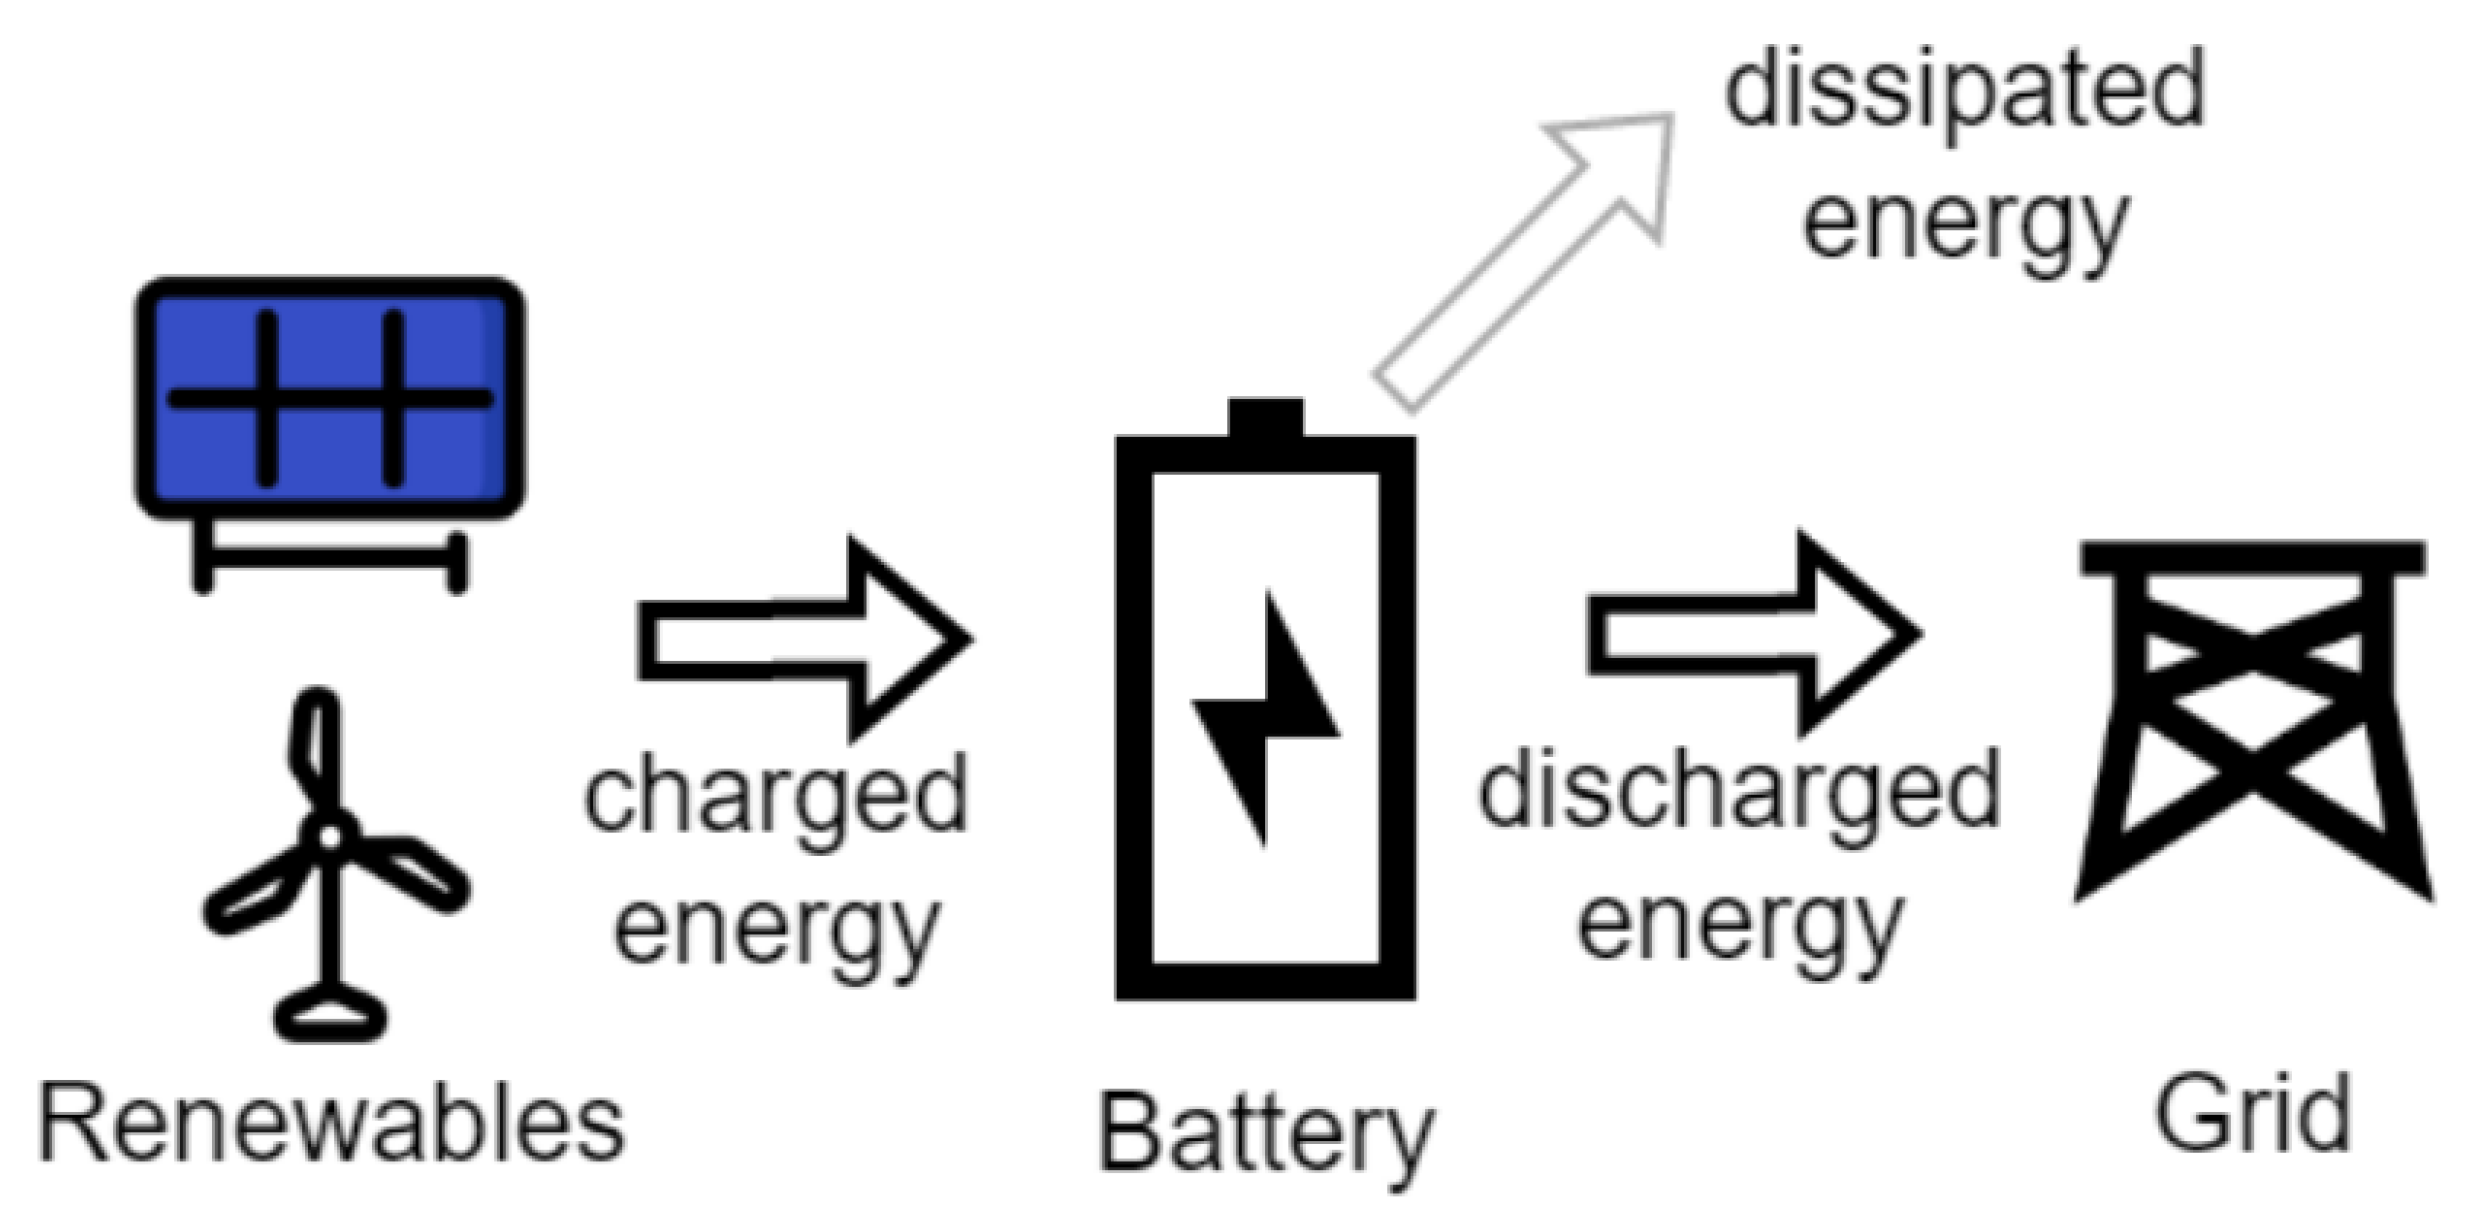
Figure 2.
Illustration of energy flow and dissipation during charging and discharging.
2.3. Distinction from Coulombic Efficiency
While Coulombic Efficiency (CE) [22] evaluates the ratio of charge delivered versus absorbed:
it neglects voltage-level differences and power losses during conversion. As illustrated in Figure 3, SOE offers a more comprehensive reflection of usable energy by incorporating both current and voltage data.
2.4. Efficiency vs Capacity Degradation
SOH is computed using:
and focuses on remaining capacity, whereas SOE measures energy utilization effectiveness. As shown in Figure 4, batteries with similar SOH may exhibit diverse SOE trends depending on usage patterns.
These variations emphasize the necessity of assessing SOE independently from SOH for comprehensive performance evaluation.

Table 3.
Representative SOH and SOE Values.
| Battery ID | SOH (%) | SOE (%) |
|---|---|---|
| B0005 | 90.2 | 87.6 |
| B0039 | 88.6 | 90.5 |
| B0033 | 81.3 | 73.7 |
| B0045 | 46.4 | 77.6 |
Table 4.
Correlation Coefficient Between SOH and SOE.
| B0045 | B0046 | B0047 | B0048 |
| 0.54 | 0.92 | 0.77 | 0.65 |
| B0053 | B0054 | B0055 | B0056 |
| 0.03 | 0.05 | 0.03 | 0.13 |
3. Modeling State of Efficiency
3.1. Observed SOE Behavior Over Time
During repetitive charging and discharging, batteries display a gradual decline in energy efficiency. This trend was quantified using the SOE metric for each cycle. The graphical representation in Figure 5 shows a relatively consistent linear reduction in SOE, albeit with minor oscillations depending on test parameters.
3.2. Linearity Validation via Statistical Test
To confirm linear degradation, first-order differences of the SOE series were computed:
The Mann-Kendall (MK) statistical test was applied to identify any monotonic trends. The null hypothesis assumes randomness, while the alternate suggests a trend. Given n cycles, the MK statistic S is computed as:
The variance of S is:
The standard score is derived as:
The p-values in Table 5 exceed 0.10, validating the absence of higher-order trends and affirming a linear model fit.
3.3. Proposed Linear Model
Given the linear behavior, a first-order model is employed:
where is the degradation slope, the initial efficiency, and a stochastic term. In practice, the model simplifies to:
The regression lines fitted for samples B0005, B00029, B00033, and B0045 are depicted in Figure 6.
3.4. Efficiency Trends and Ranges
The slopes and intercepts from the regression are plotted in Figure 1. Differences in SOE range are attributed to cycle counts and degradation rate.
4. Analysis and Discussion
4.1. SOE Pattern Variations
Battery lifespan varies with environmental and operational settings. At 24°C, samples displayed the longest life and moderate SOE reduction. Contrastingly, high-temperature (43°C) samples showed short SOH but sustained SOE, especially under 1A current. At 4°C, a higher current and deeper discharge reduced SOE significantly.
4.2. Factor-Specific Observations
To examine how key variables affect SOE, selected samples were tested with modified temperature, current, and cutoff voltage during aging. Results confirm immediate SOE adaptation to new conditions without memory effects (Figure 7).
4.3. Variable-Level Impacts
The impact of three primary variables is visualized in Figure 8:
- –
- Discharge current: Lower currents favor higher SOE.
- –
- Ambient temperature: Higher temperatures enhance SOE.
- –
- Cutoff voltage: At lower temperatures, deeper discharge notably suppresses SOE.
4.4. Design Insights
The data-driven findings imply that even batteries with low SOH may retain sufficient SOE for specific applications. Therefore, retired cells could serve cost-effective roles in energy buffering. Furthermore, efficient BESS operation should implement load balancing and ambient control to optimize performance.
SOE’s insensitivity to historical usage opens avenues for more flexible battery management algorithms that can temporarily allow high-drain or suboptimal conditions without long-term penalty.
5. Conclusions
The efficiency of lithium-ion batteries plays a crucial role in the viability and sustainability of energy storage systems, especially those integrated with renewable sources. This work introduces the State of Efficiency (SOE) as a distinctive performance metric focused on energy conversion effectiveness rather than capacity retention.
Utilizing empirical data from NASA’s test archive, the study established that SOE consistently demonstrates a linear degradation pattern over the lifecycle of NCA-based 18650 lithium-ion batteries. A statistical validation using the Mann-Kendall test affirmed the absence of nonlinear or irregular drift in the SOE trajectory, enabling the adoption of a simple linear model to forecast efficiency behavior.
Analysis of environmental and operational variables revealed that ambient temperature, discharge current, and cutoff voltage significantly affect SOE. In particular, high discharge rates and low temperatures with deep discharge cycles tend to reduce energy efficiency. Conversely, batteries operated at moderate conditions—such as 24°C and 2A discharge—exhibited both prolonged lifespan and higher SOE.
An important finding of the investigation is the minimal memory effect observed in SOE: when a battery undergoes changes in operational settings, the efficiency rapidly adjusts to the new condition, without persistent degradation from prior states. This property provides added flexibility for battery management systems (BMS) to temporarily adapt to less-than-ideal scenarios, such as grid surges or environmental extremes.
The implications of these insights are twofold. Firstly, batteries with diminished SOH might still be viable for energy applications focused on efficient charge-discharge cycles, particularly in stationary systems like BESS. Secondly, advanced BMS algorithms could leverage real-time SOE tracking to optimize performance across cells with heterogeneous wear levels.
Future work will aim to generalize these findings across broader battery chemistries and configurations. Expanding the data set and extending the analysis to include second-life applications and thermal stress scenarios may further improve energy storage design and deployment strategies.
References
- A., A.; B., A. Advanced Modeling of Lithium-Ion Battery Efficiency Under Operational Stress. IEEE Transactions on Energy Conversion 2023, 39, 101–111.
- A., A.; B., A. Advanced Modeling of Lithium-Ion Battery Efficiency Under Operational Stress. IEEE Transactions on Energy Conversion 2024, 39, 104–114.
- A., A.; B., A. Advanced Modeling of Lithium-Ion Battery Efficiency Under Operational Stress. IEEE Transactions on Energy Conversion 2024, 39, 102–112.
- Patel, M. Robust Background Subtraction for 24-Hour Video Surveillance in Traffic Environments. TIUTIC 2025.
- Patel, M. Predicting Water Potability Using Machine Learning: A Comparative Analysis of Classification Algorithms. In Proceedings of the 2024 IEEE International Conference on Energy Internet (ICEI). IEEE, 2024, pp. 631–639.
- Malipeddi, S. Analyzing Advanced Persistent Threats (APTs) Using Passive Honeypot Sensors and Self-Organizing Maps. In Proceedings of the 2025 International Conference on Emerging Smart Computing and Informatics (ESCI). IEEE, 2025, pp. 1–7.
- Patel, A. Empowering Scalable and Trustworthy Decentralized Computing through Meritocratic Economic Incentives. In Proceedings of the 2024 4th Intelligent Cybersecurity Conference (ICSC). IEEE, 2024, pp. 58–64.
- Patel, A. Evaluating Robustness of Neural Networks on Rotationally Disrupted Datasets for Semantic Segmentation. In Proceedings of the 2024 2nd International Conference on Foundation and Large Language Models (FLLM). IEEE, 2024, pp. 553–560.
- Patel, A. Evaluating Attack Thresholds in Proof of Stake Blockchain Consensus Protocols. In Proceedings of the 2024 4th Intelligent Cybersecurity Conference (ICSC). IEEE, 2024, pp. 87–94.
- Kabra, A. Self-Supervised Gait Recognition with Diffusion Model Pretraining. International Journal of Scientific Research 2025, pp. 5–9.
- Anonymous. Evaluating Pitcher Fatigue Through Spin Rate Decline: A Statcast Data Analysis. Paripax Indian Journal of Research 2025, pp. 4–9.
- Anonymous. Music-Driven Biofeedback for Enhancing Deadlift Technique. International Journal of Scientific Research 2025, pp. 1–4.
- Kabra, A. GLGait: Enhancing Gait Recognition with Global-Local Temporal Receptive Fields for In-The-Wild Scenarios. Paripax Indian Journal of Research 2025, pp. 114–122.
- Recharla, R. Benchmarking Fault Tolerance in Hadoop MapReduce with Enhanced Data Replication. In Proceedings of the 2025 International Conference on Wireless Communications Signal Processing and Networking (WiSPNET). IEEE, 2025, pp. 1–6.
- Recharla, R. Building a Scalable Decentralized File Exchange Hub Using Google Cloud Platform and MongoDB Atlas. In Proceedings of the 2025 International Conference on Wireless Communications Signal Processing and Networking (WiSPNET). IEEE, 2025, pp. 1–7.
- Recharla, R. Parallel Sparse Matrix Algorithms in OCaml v5: Implementation, Performance, and Case Studies. In Proceedings of the 2025 International Conference on Wireless Communications Signal Processing and Networking (WiSPNET). IEEE, 2025, pp. 1–9.
- Recharla, R. FlexAlloc: Dynamic Memory Partitioning for SeKVM. In Proceedings of the 2025 International Conference on Wireless Communications Signal Processing and Networking (WiSPNET). IEEE, 2025, pp. 1–9.
- Deepak. RedTeamAI: A Benchmark for Assessing Autonomous Cybersecurity Agents. OSF Preprints, 2025. Accessed: 2025-05-16.
- Deepak. Language Model-based Analysis of Teaching: Potential and Limitations in Evaluating High-level Instructional Skills. OSF Preprints, 2025. Accessed: 2025-05-16.
- A., A.; B., A. Advanced Modeling of Lithium-Ion Battery Efficiency Under Operational Stress. IEEE Transactions on Energy Conversion 2023, 39, 105–115.
- A., A.; B., A. Advanced Modeling of Lithium-Ion Battery Efficiency Under Operational Stress. IEEE Transactions on Energy Conversion 2024, 39, 106–116.
- A., A.; B., A. Advanced Modeling of Lithium-Ion Battery Efficiency Under Operational Stress. IEEE Transactions on Energy Conversion 2023, 39, 113–123.
Figure 3.
Various CE scenarios with corresponding SOE values: (a) Ideal, (b) Mild loss, (c) Severe loss.
Figure 3.
Various CE scenarios with corresponding SOE values: (a) Ideal, (b) Mild loss, (c) Severe loss.
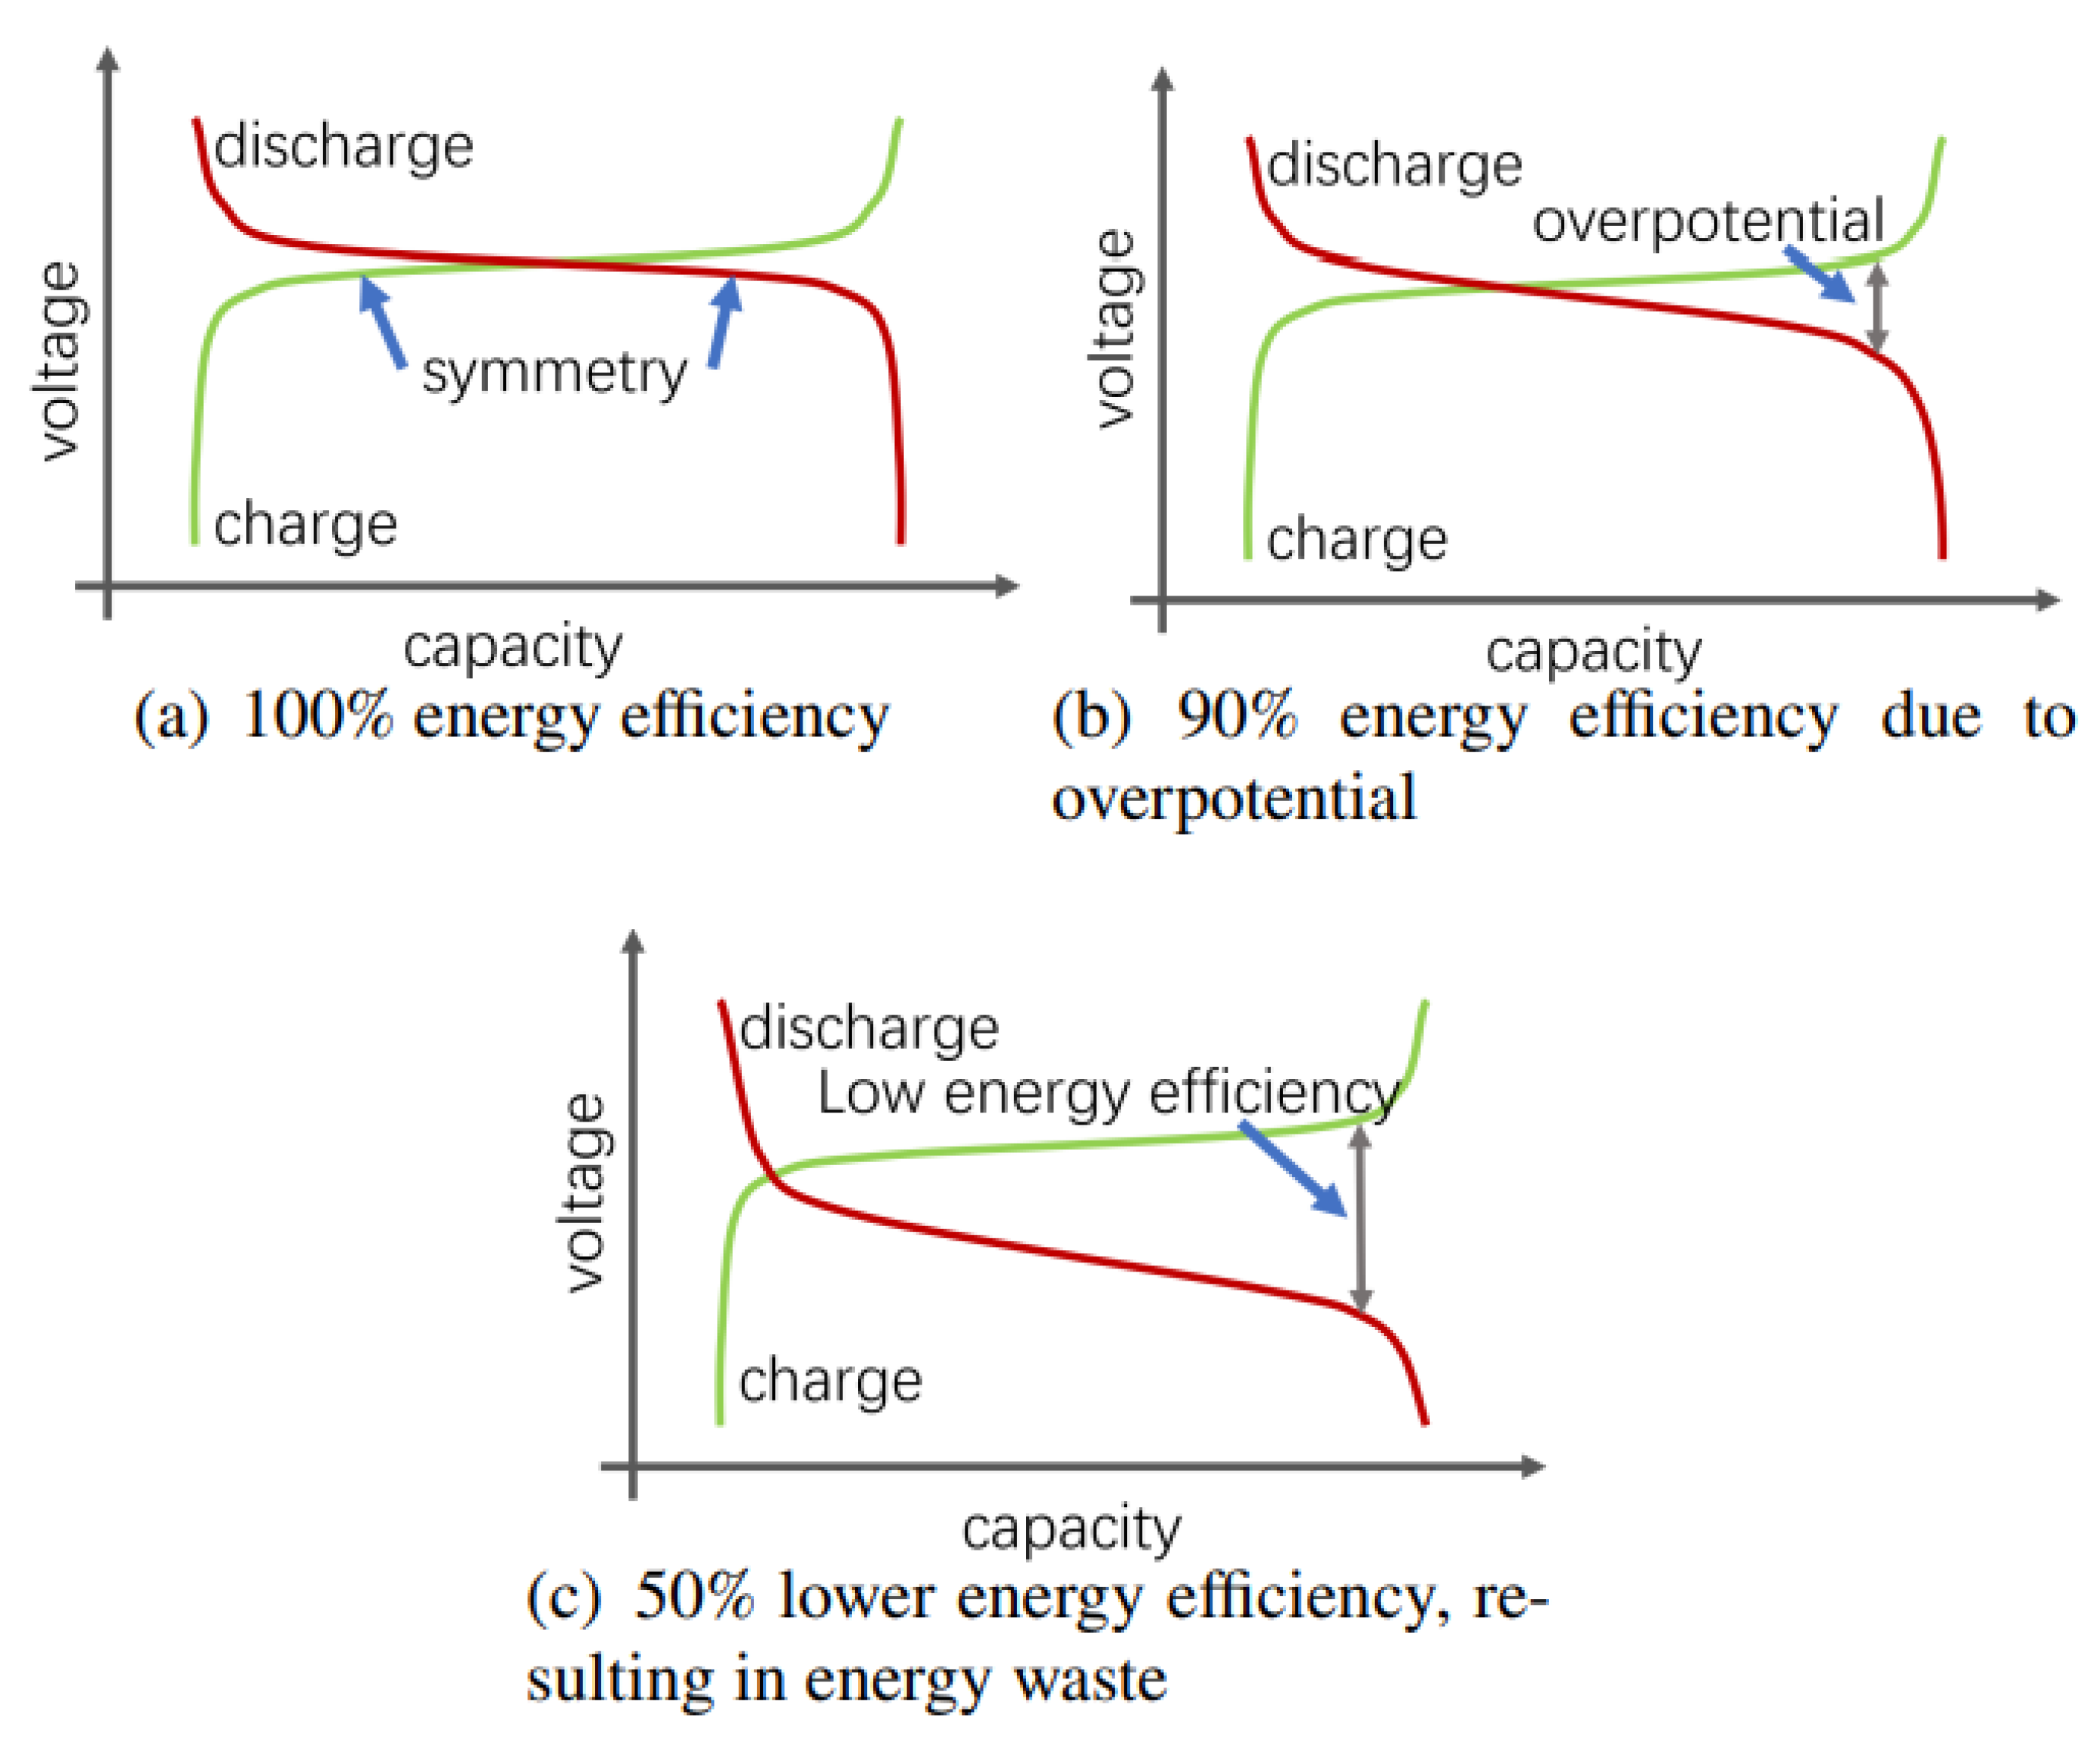
Figure 4.
Comparison of SOH and SOE degradation across different samples.
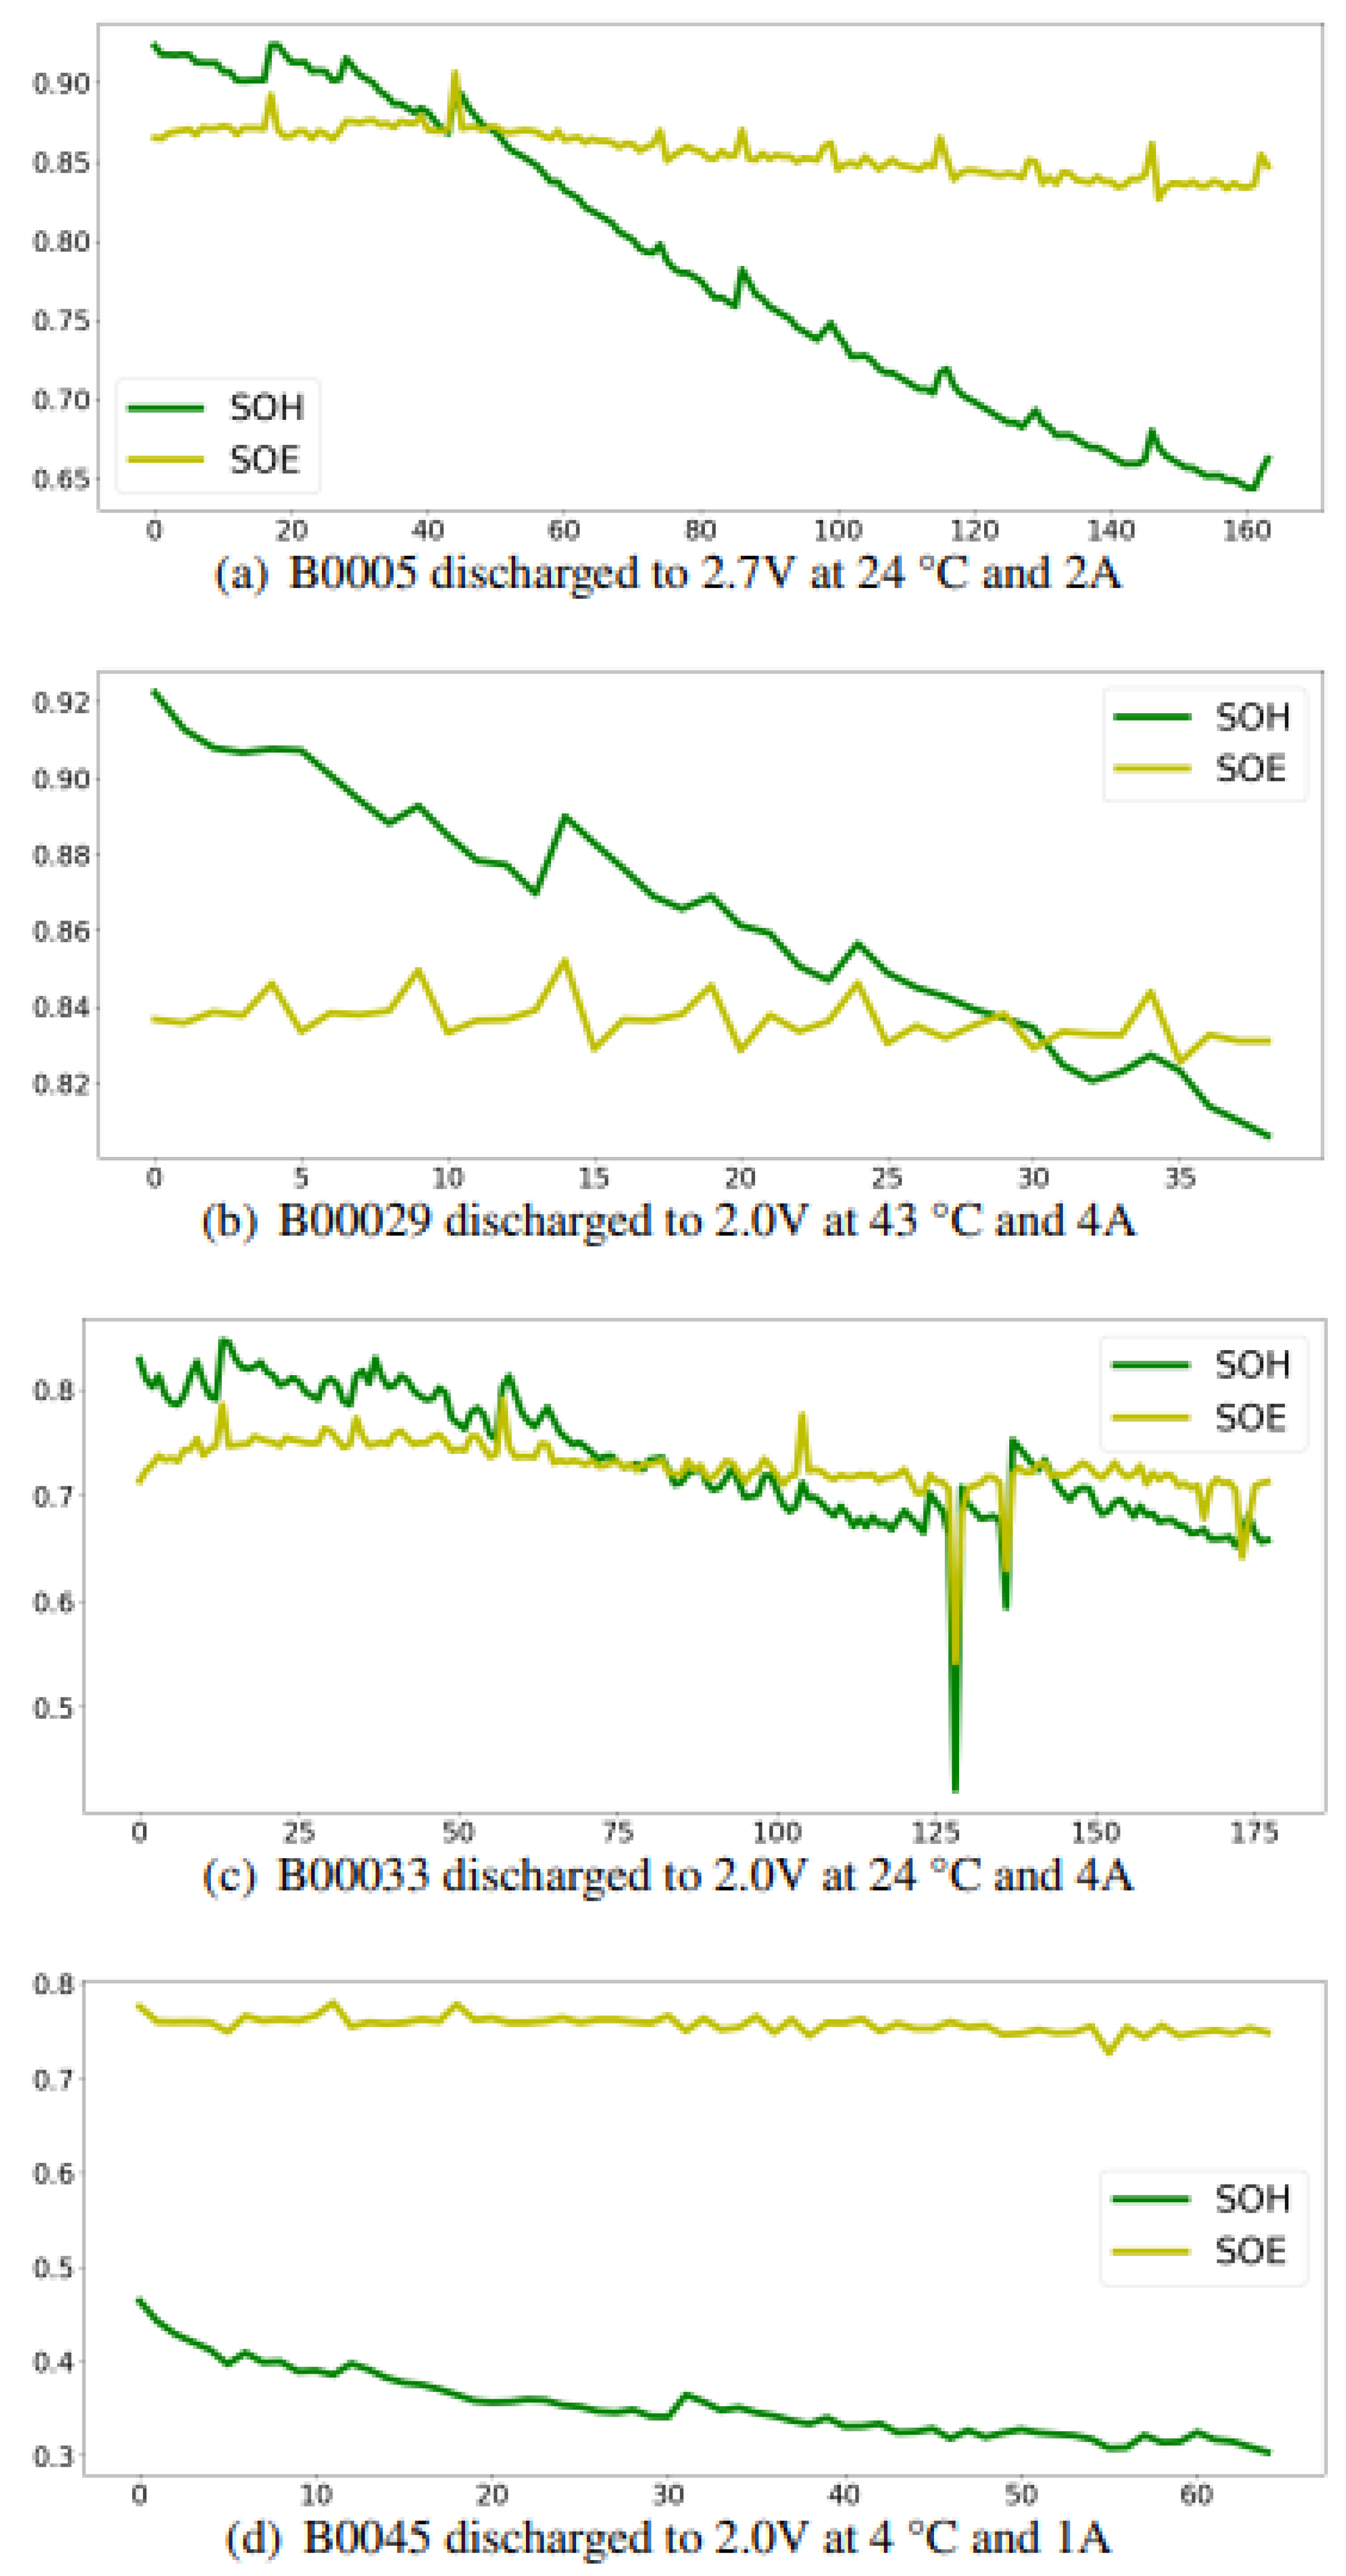
Figure 5.
SOE progression for multiple battery samples across cycles under varying conditions.
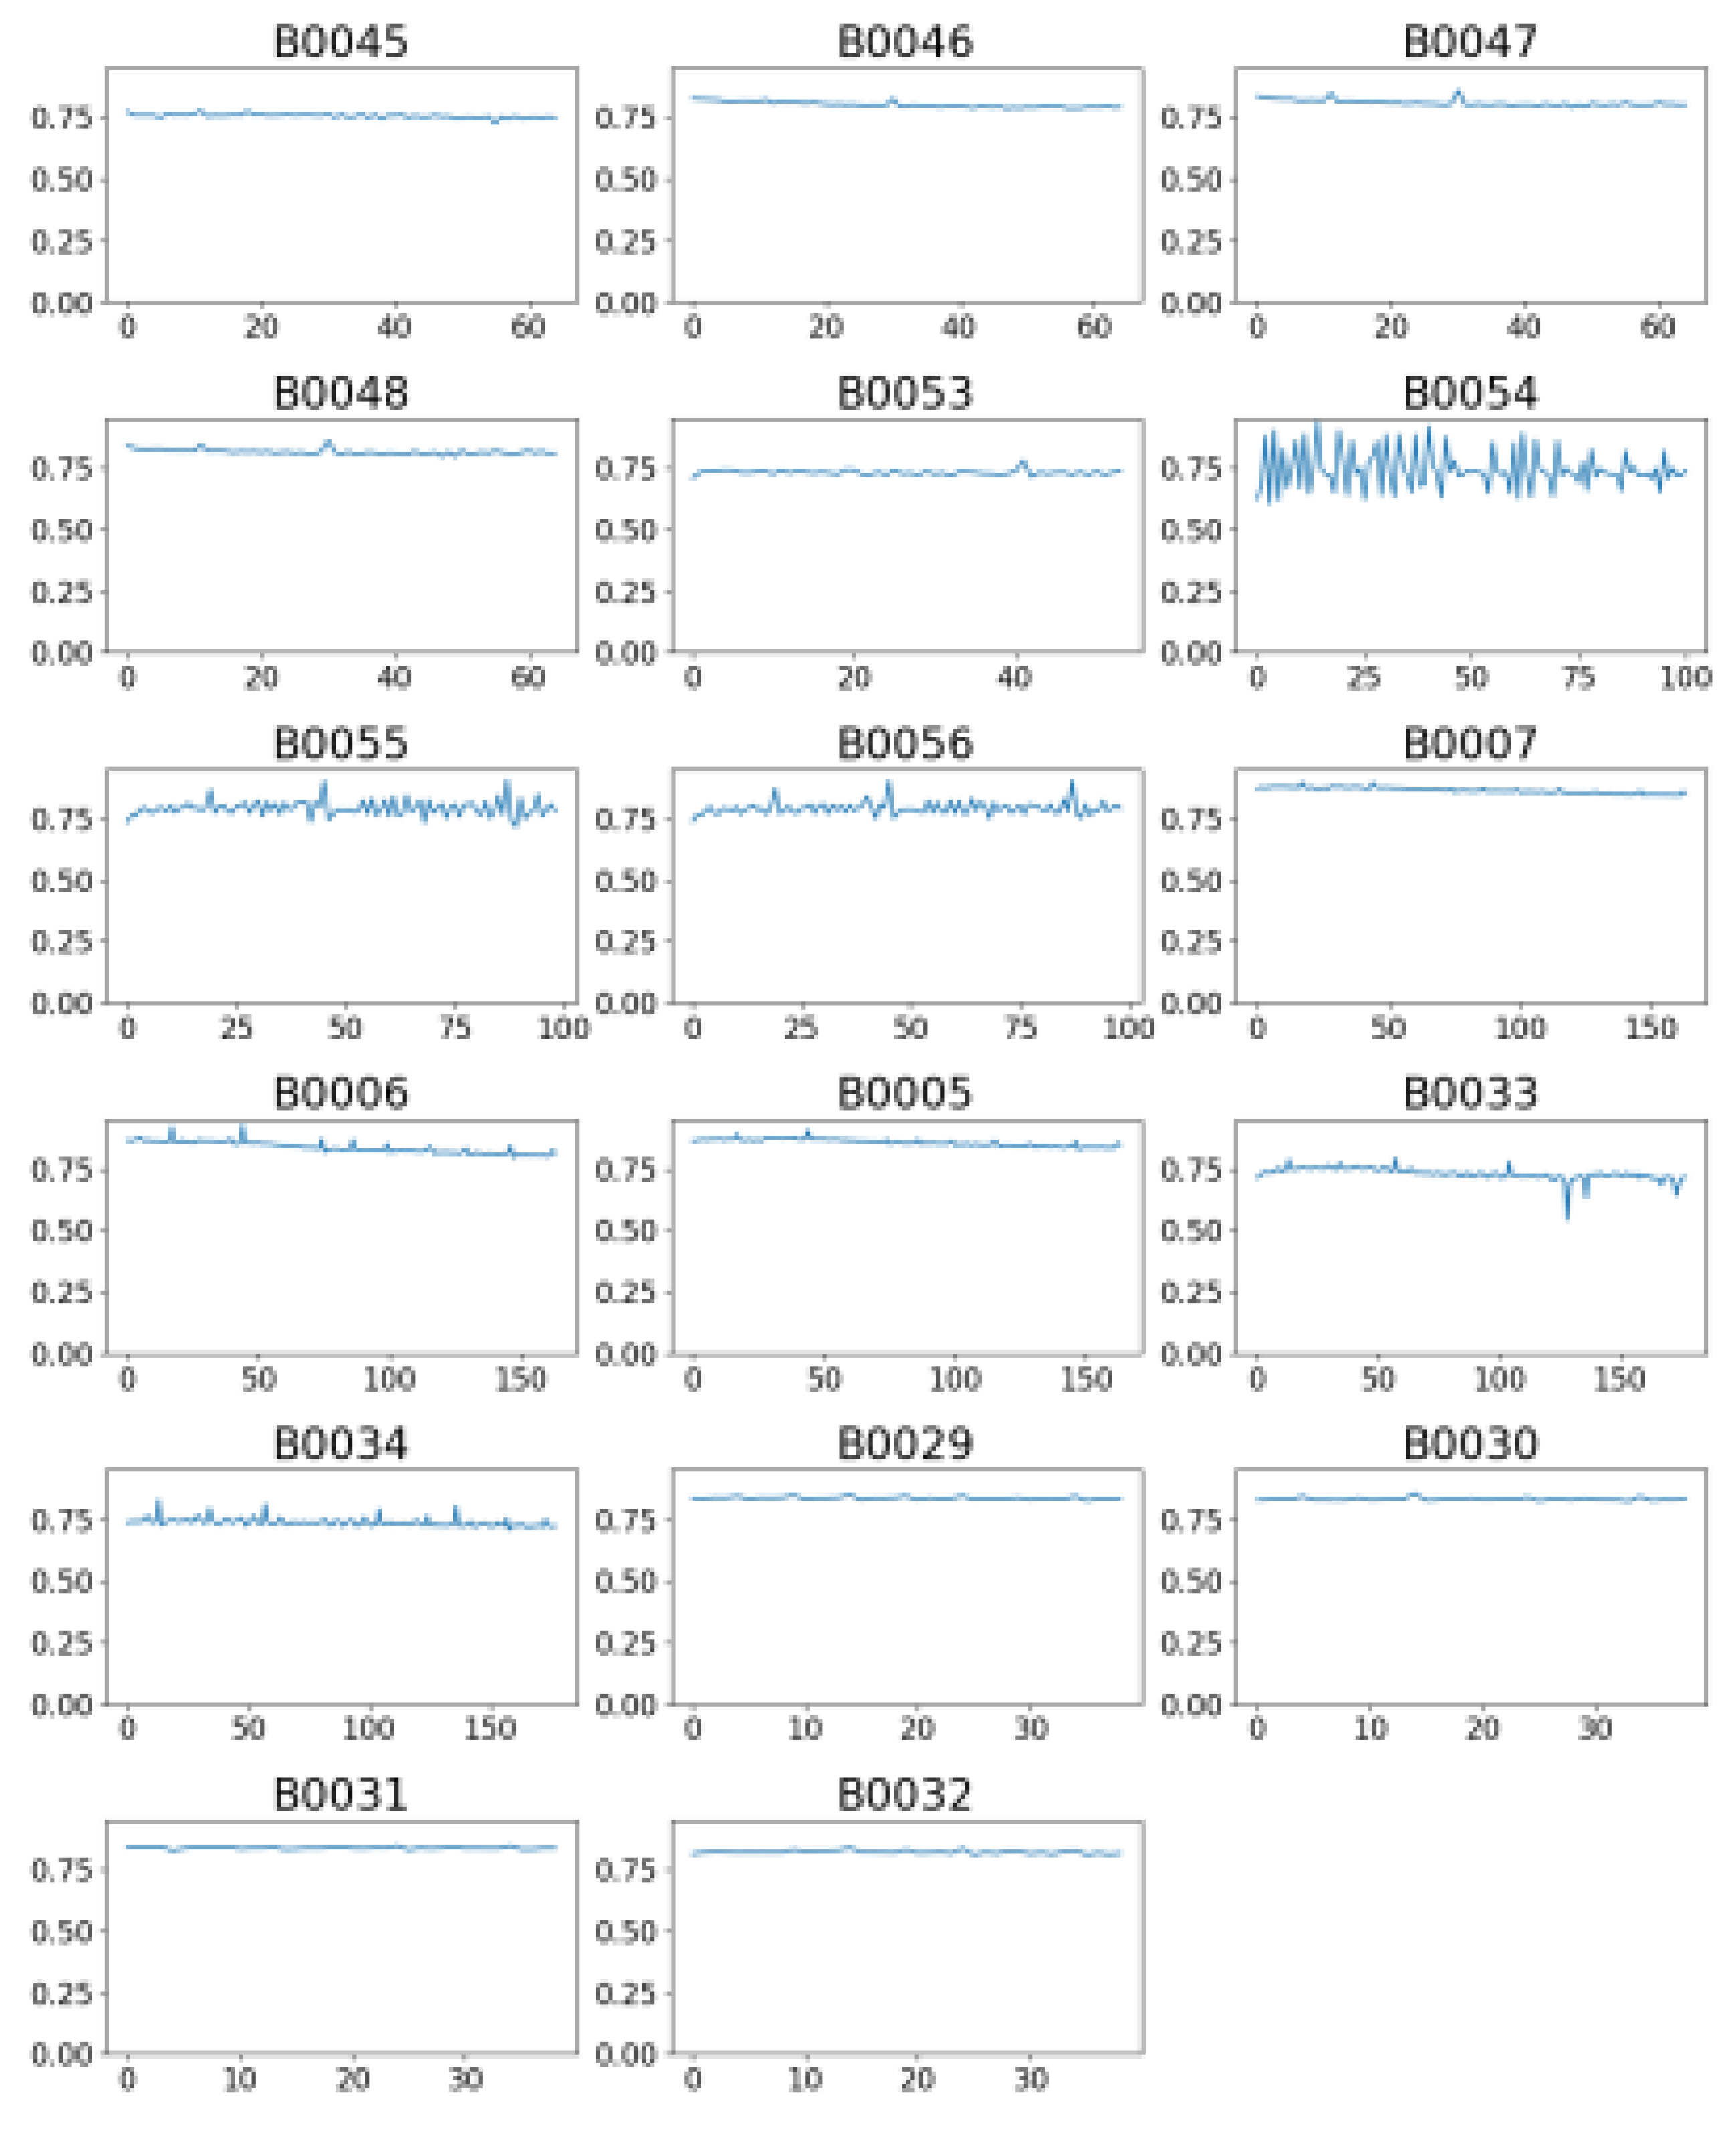
Figure 6.
Fitted SOE linear degradation curves across selected battery samples.
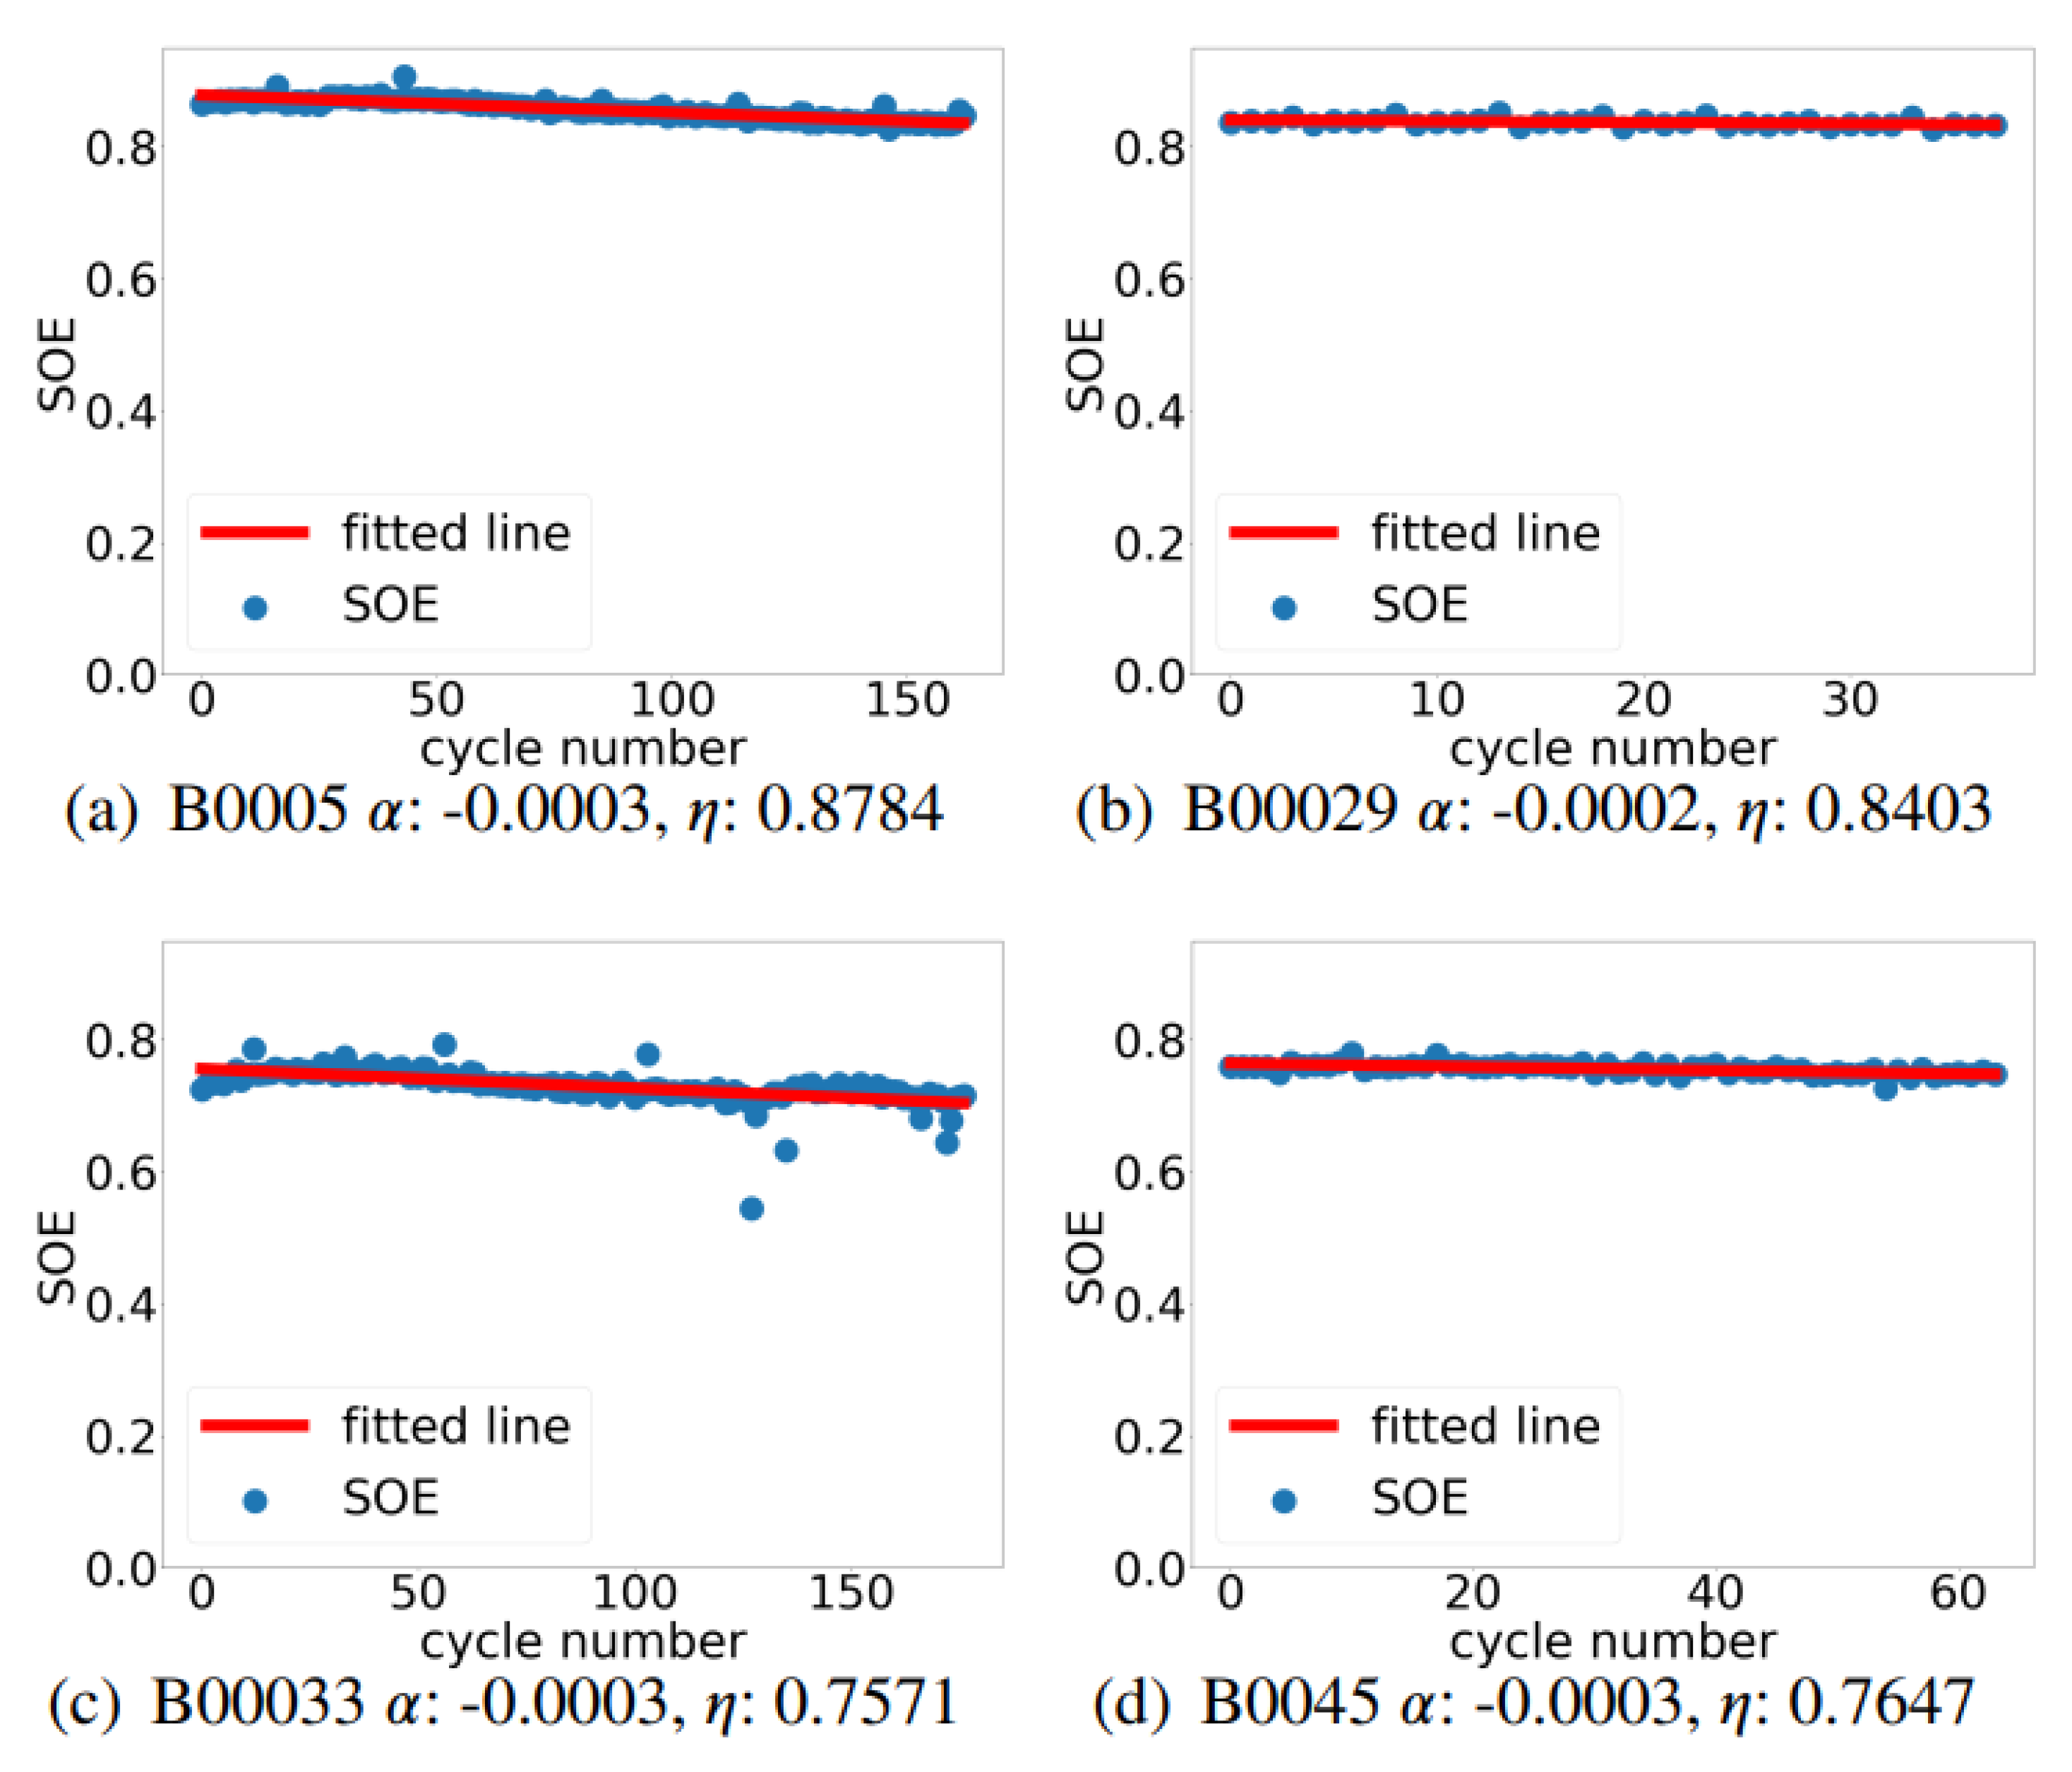
Figure 7.
SOE behavior of battery group under sequentially varying conditions.
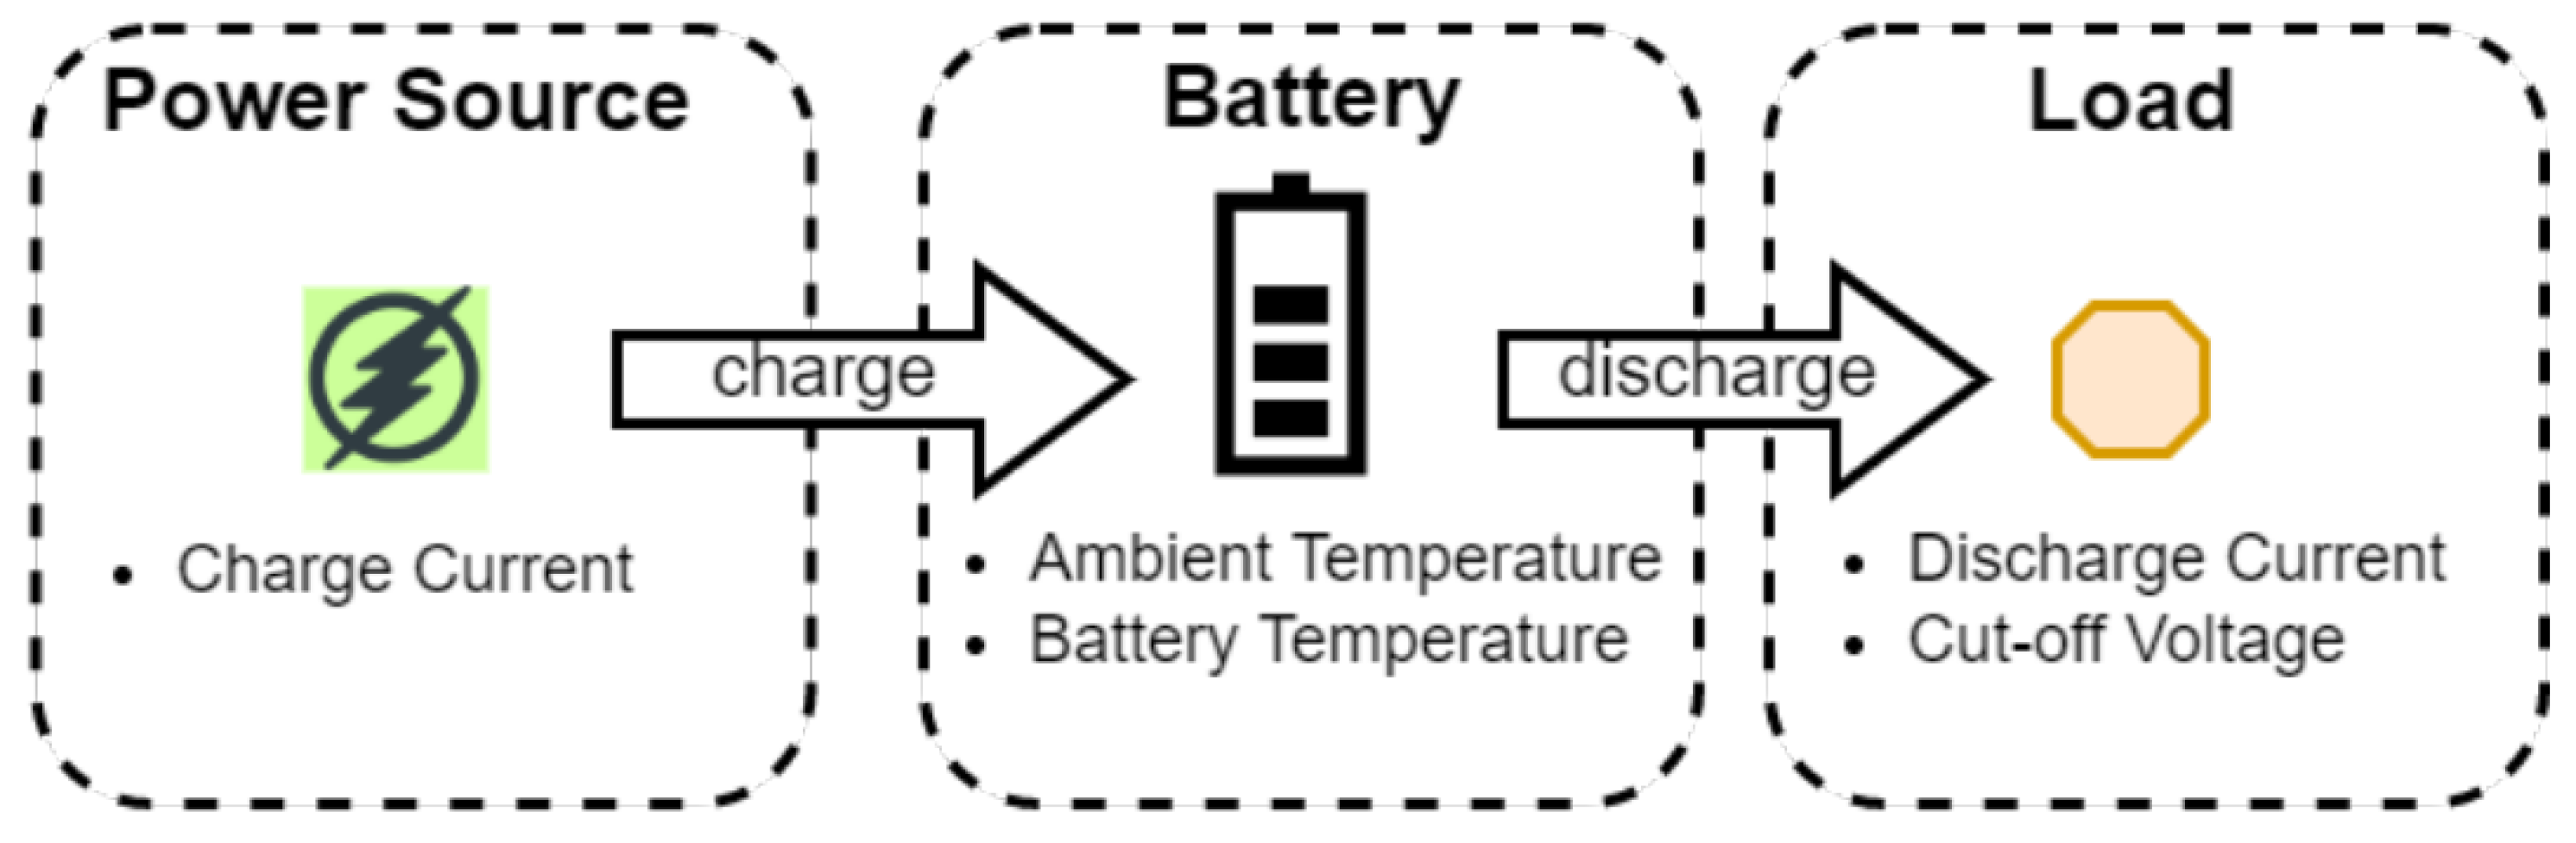
Figure 8.
(a) Effect of discharge current, (b) ambient temperature, (c) cutoff voltage on SOE.
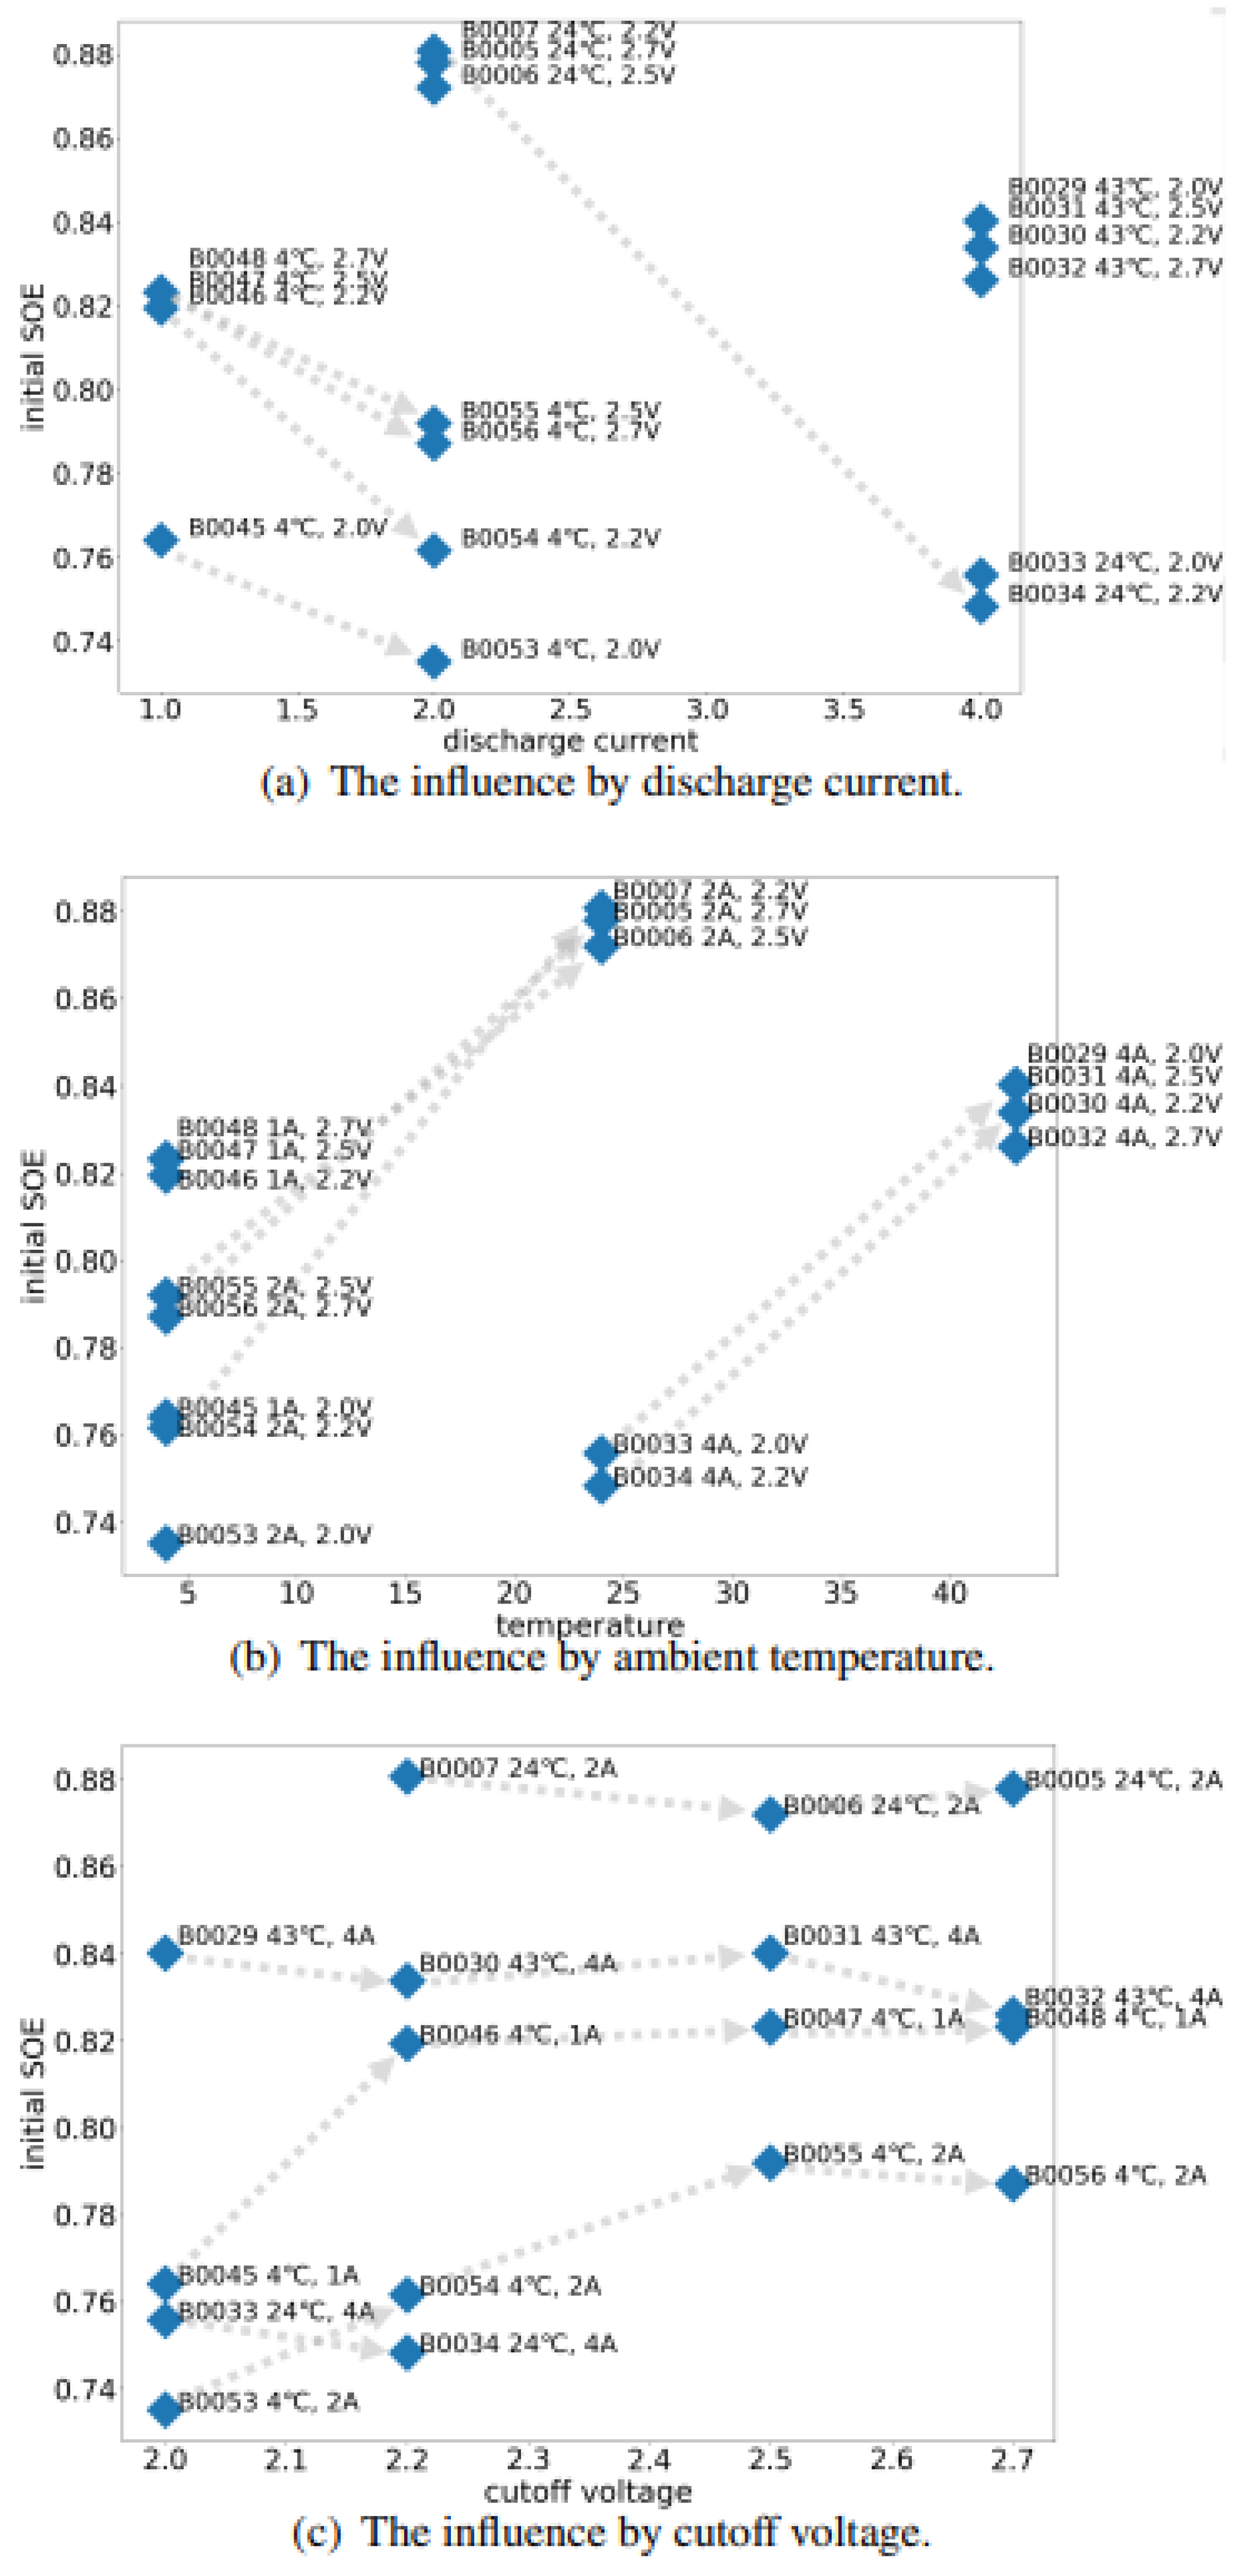
Table 1.
Specifications of Experimental Lithium-Ion Cells.
| Manufacturer | Idaho National Laboratory |
| Form Factor | 18650 |
| Electrochemistry | NCA / Graphite |
| Nominal Capacity | 2 Ah |
| Rated Voltage | 3.7 V |
| Charge Method | CC-CV (1A) |
| Discharge Currents | 1A, 2A, 4A |
| Temperature Levels | 4°C, 24°C, 43°C |
| Cutoff Voltages | 2.0V, 2.2V, 2.5V, 2.7V |
| Termination Criteria | 20% / 30% capacity loss |
Table 2.
Battery Test Matrix.
| Conditions | Battery Samples |
|---|---|
| 4°C, 1A, 2.0V–2.7V | B0045–B0048 |
| 24°C, 2A, 2.0V–2.7V | B0053–B0056 |
| 43°C, 2A, 4A, 2.0V–2.7V | B0005–B0034 |
| Mixed (24–43°C), Varying Current | B0038–B0040 |
Table 5.
Mann-Kendall Trend Test: p-values.
| B0045 | B0046 | B0047 | B0048 | B0053 |
| 0.77 | 0.43 | 0.69 | 0.66 | 0.96 |
| B0054 | B0055 | B0056 | B0005 | B0006 |
| 0.70 | 0.88 | 0.66 | 0.87 | 0.58 |
Disclaimer/Publisher’s Note: The statements, opinions and data contained in all publications are solely those of the individual author(s) and contributor(s) and not of MDPI and/or the editor(s). MDPI and/or the editor(s) disclaim responsibility for any injury to people or property resulting from any ideas, methods, instructions or products referred to in the content. |
© 2025 by the authors. Licensee MDPI, Basel, Switzerland. This article is an open access article distributed under the terms and conditions of the Creative Commons Attribution (CC BY) license (http://creativecommons.org/licenses/by/4.0/).
Copyright: This open access article is published under a Creative Commons CC BY 4.0 license, which permit the free download, distribution, and reuse, provided that the author and preprint are cited in any reuse.


