
Submitted:
18 April 2025
Posted:
18 April 2025
You are already at the latest version
Abstract
Accurate prediction of lithium-ion battery capacity degradation is essential for reliable state of health (SOH) estimation and long-term performance assessment in battery management systems. This study presents an empirical modeling approach for capacity degradation using experimental data collected from four lithium iron phosphate (LFP) battery packs over 75 to 100 charge–discharge cycles. Several mathematical models, including linear, quadratic, single-exponential, and double-exponential functions, were evaluated for their predictive accuracy. The linear and single-exponential models demonstrated superior robustness for early-cycle prediction, while a novel modified-linear model, incorporating an exponentially decaying slope, was proposed to capture nonlinear degradation trends beyond the initial aging phase. The study further investigates the minimum number of data points required for reliable long-term prediction and finds that approximately 30 to 40 cycles are sufficient to achieve high accuracy, with mean absolute error reduced by over 80% compared to early-cycle prediction alone. The modified-linear model outperforms traditional approaches in forecasting SOH and end-of-life (EOL), particularly under extended cycling conditions, providing a practical balance between computational simplicity and predictive fidelity.
Keywords:
capacity forecasting
; empirical model
; modified-linear model
; battery pack aging
1. Introduction
Lithium-ion batteries have emerged as indispensable components in modern energy systems due to their high energy density, long cycle life, and efficiency across a range of applications, including electric vehicles, consumer electronics, and stationary energy storage systems. Despite these advantages, lithium-ion batteries are subject to progressive degradation in performance over time, primarily due to electrochemical aging phenomena such as solid electrolyte interphase (SEI) formation, loss of active materials, lithium plating, and increased internal resistance. These mechanisms contribute to capacity fade and impedance rise, ultimately limiting the battery’s service life and reliability [1,2,3].
A key parameter for quantifying the degradation state of a lithium-ion battery is the state of health (SOH), commonly defined as the ratio of the battery’s current capacity to its nominal rated capacity. Accurate estimation and prediction of SOH are crucial for ensuring safe operation, optimizing usage, and planning maintenance within battery management systems (BMS). However, SOH cannot be measured directly during normal operation, necessitating indirect estimation methods based on measurable quantities such as voltage, current, temperature, and impedance. Various SOH estimation methodologies have been proposed in the literature, which can broadly be categorized into empirical, model-based, and data-driven approaches [4,5,6,7,8]. Empirical methods directly measure specific battery parameters like internal resistance, fully discharged voltage, or impedance characteristics to estimate SOH. For instance, Electrochemical Impedance Spectroscopy (EIS) methods allow rapid and non-invasive estimation of battery health based on impedance profiles [9]. Regression methods utilizing measurable aging parameters have also been applied to predict battery life efficiently [10].
Model-based approaches utilize physical representations of the battery system, including equivalent circuit models (ECMs) and electrochemical models, to capture the underlying degradation processes. These methods often integrate mathematical representations of battery dynamics with state estimation techniques, such as Extended Kalman Filters (EKF) and recursive algorithms. The RC equivalent circuit model with EKF has demonstrated robust performance in combined state-of-charge (SOC) and SOH estimations [11]. Additionally, simplified methods based on open circuit voltage characteristics have shown practicality for online estimation in dynamic environments [12]. While these models offer valuable insights into the internal state dynamics, they often require complex parameter identification and may be sensitive to external operating conditions. More recently, data-driven techniques have gained significant attention, leveraging machine learning algorithms such as neural networks [13,14], support vector machines [15,16], and Gaussian process regression [17,18,19], and deep learning method [20] to map relationships between operational features and battery health. Although data-driven methods can achieve high predictive accuracy, their dependence on large datasets and computational complexity may hinder practical deployment in embedded systems.
This study proposes an empirical approach for predicting the capacity degradation and state of health (SOH). Experimental data were collected from four lithium-ion battery packs subjected to repeated charge–discharge cycles. The battery capacities were computed using the Coulomb Counting method, and the resulting degradation profiles were fitted using multiple mathematical models, including linear, quadratic, single-exponential, and double-exponential equations. To address nonlinear degradation at extended cycles, a modified-linear model incorporating an exponential decay in its slope was introduced. The structure of the paper is organized as follows: Section 2 describes the experimental setup, data collection from LFP batteries, and the mathematical models evaluated. Section 3 present and analyze the empirical modeling outcomes, compare model performances, and introduce a modified-linear model for improved long-term predictions. Finally, the conclusion summarizes key findings, emphasizing the advantages of the modified-linear model and recommending optimal data requirements for accurate predictions in section 4.
2. Materials and Methods
This study examined four packs of 48V 100Ah LFP batteries. The batteries were charged with a constant current until the terminal voltage reached the cut-off voltage, then, the batteries were rested for a while to reduce the internal temperature of the battery. The battery is then continued to discharge with a constant current of 100 A (1C rate). The discharge operation was terminated once the discharge cut-off voltage was reached. The batteries were rested again before beginning the next charge cycle. The experimental setup is shown in Figure 1.
The charge and discharge processes were repeated using a set of parameters listed in Table 1. The capacity of the battery can be calculated from the Coulomb Counting formula as
3. Results and Discussion
Experimental data, including discharge current, terminal voltage, and temperature, were obtained from the battery testing process. These data were subsequently used to calculate the battery capacity through the Coulomb Counting method. To model the degradation of battery capacity over time, this study proposes four mathematical formulations: linear, quadratic, single-exponential, and double-exponential models, expressed respectively as follows:
where denotes the battery capacity, represents the number of discharge cycles, and are the respective model coefficients.
Figure 2 illustrates the capacity degradation profile of the LFP battery pack (Pack 1), with distinct data sets (represented by different colors) employed as input for each of the four models. While the linear and single-exponential models yield consistent trendlines across all data sets (Figure 3(a)-(b)), the quadratic and double-exponential models deviate notably from the observed degradation pattern. As shown in Figure 3(c)-(d), these deviations are particularly evident unless a greater number of data points are incorporated, which improves the fit but limits the model’s utility for long-term capacity prediction due to unstable trends at higher cycle numbers. Therefore, in this study, further analysis is focused solely on the linear and single-exponential models due to their robustness and suitability for capacity prediction with limited data.
3.1. Evaluation of Data Point Requirements for Reliable Linear Capacity Prediction
To ensure the reliability of capacity prediction using a linear model, an adequate number of data points must be considered. As illustrated in Figure 2, four distinct data sets were employed in the modeling process. To assess the effect of data quantity on prediction accuracy, the number of points used for linear fitting was progressively increased by combining additional data sets into set1 (represented by blue dots in Figure 2). These combined sets are denoted as set12, set123, and set1234 in Figure 4. While set1, which spans cycles 2 to 9, initially exhibits a satisfactory fit, the associated prediction error increases significantly with higher cycle numbers, suggesting that the initial ten cycles alone are insufficient for accurate prediction.
Nevertheless, the linear fits derived from the combined data sets differ from the experimental values by less than 0.1 in all cases, as shown in Figure 4(b). The prediction errors were quantitatively assessed using the mean absolute error (MAE) and root mean square error (RMSE), defined as:
For data set1, the MAE and RMSE values were calculated to be 0.171 and 0.211, respectively. In contrast, the combined set12, which includes 28 data points from the first 36 cycles, yielded significantly reduced MAE and RMSE values of 0.034 and 0.046, respectively. Further improvement was observed with set123 (38 data points from the first 57 cycles) and set1234 (55 data points from the first 74 cycles), achieving MAE (RMSE) values of 0.020 (0.025) and 0.016 (0.021), respectively. These results confirm that increasing the number of data points enhances prediction accuracy. Notably, using the first 36 cycles (combined set12) reduces the prediction error by approximately a factor of five compared to set1, indicating that this subset may be sufficient for reliable modeling.
To further investigate the number of data points required for capacity prediction within a 100-cycle aging range, linear fits were performed using the first 20, 30, 40, and 80 cycles in three battery cases (two with 100 cycles and one with 150 cycles). The outcomes, presented in Figure 5, reveal that increasing the number of data points from 20 to 30 cycles substantially reduces the prediction error by half. Additional improvements were noted when using 40 cycles; however, the increase from 40 to 80 cycles did not yield a significant reduction in error. These findings suggest that approximately 30 to 40 discharge cycles are adequate for accurate capacity prediction within the first 100 cycles of battery aging.
3.2. Estimation of Capacity Degradation Slopes Through Curve Fitting
As shown in the capacity fitting results in Figure 4, the rate of battery degradation appears to decrease with increasing cycle number. Consequently, the linear model with a constant slope becomes inadequate for long-term predictions, as demonstrated in Figure 5(a)–(c). In these cases, data points from around the 80th cycle deviate significantly from the linear trendline, resulting in increased prediction errors, as illustrated in Figure 5(d)–(f).
To address this limitation, the linear equation was modified by incorporating an exponential decay factor into the slope term, yielding the following expression:
In this model, the term introduces a decreasing slope with the decay rate governed by the parameter , capturing a rapid initial decline in capacity followed by a more gradual degradation. However, this modified equation exhibits a turning point at , beyond which the capacity function increases, leading to an unphysical prediction. Furthermore, as asymptotically approaches zero for large values of , the capacity function converges to the constant . To mitigate this, the exponential term is omitted beyond a specific cycle number, and the model reverts to a linear form with constant slope.
In the present study, as illustrated in Figure 6, transition points at which the exponential term decays to 0.6 (red line) and 0.5 (green line) were selected to apply the constant-slope linear model. Figure 7a–c presents a comparison of three fitting approaches: linear, exponential, and the proposed modified-linear model. The linear and exponential are fitted using 40 data points, while only 20 data points are used in the modified-linear fit. Among these, the modified-linear model demonstrates superior agreement with the experimental data, as evidenced by the lowest mean absolute error (MAE) and root mean square error (RMSE) values reported in Table 2. An exception is observed in Battery Pack 1, which contains only 75 cycles—insufficient to reach the critical transition point—where a constant degradation rate remains applicable. Therefore, the errors from three models are comparable.
The state of health (SOH) of the battery was subsequently calculated using the Coulomb Counting method, as defined by:
where is the current capacity and is initial capacity. The SOH values were predicted using the capacities fitted from the three models. The results indicate that during the first 500 cycles, the linear and single-exponential fits yield similar SOH predictions. However, as the cycle number increases, their predictions begin to diverge. The linear model produces the most rapid decline, while the modified-linear model exhibits the slowest degradation trend. The end of battery life is typically defined as the point at which SOH reaches 80%. As shown in Table 3, the predicted end-of-life (EOL) based on the linear and exponential models occurs nearly twice as early as that estimated by the modified-linear model, highlighting its advantage for long-term battery performance forecasting.
4. Conclusions
This work proposes and evaluates empirical mathematical models for the prediction of lithium-ion battery capacity degradation and state of health (SOH) estimation. Through controlled experiments on four LFP battery packs, it was shown that linear and single-exponential models offer reliable short-term predictions, while a newly introduced modified-linear model effectively captures the nonlinearity of degradation over extended cycles. A critical contribution of this study is the determination of the minimum number of data points necessary for accurate modeling; it was found that using capacity data from approximately the first 30 to 40 cycles yields sufficiently accurate long-term predictions, minimizing prediction errors without excessive data collection. Furthermore, the modified-linear model consistently provided the most conservative and realistic SOH trajectory, predicting significantly longer end-of-life cycles compared to conventional linear and exponential models. These findings underscore the potential of combining simple mathematical models with strategically selected datasets to enhance the efficiency and accuracy of battery health diagnostics.
Author Contributions
Conceptualization, K.S. and T.P.; methodology, P.P. and T.P.; validation, K.S. and T.P.; formal analysis, K.S., P.P. and T.P.; writing—original draft preparation, K.S. and P.P.; writing—review and editing, K.S. and T.P; All authors have read and agreed to the published version of the manuscript.”
Funding
This research was funded by Fundamental Funding (FF67)— King Mongkut’s Institute of Technology Ladkrabang.
Data Availability Statement
Data are included in the article.
Conflicts of Interest
The authors declare no conflicts of interest.
References
- Li, J.; Adewuyi, K.; Lotfi, N.; Landers, R.G.; Park, J. A Single Particle Model with Chemical/Mechanical Degradation Physics for Lithium Ion Battery State of Health (SOH) Estimation. Appl. Energy 2018, 212, 1178–1190. [Google Scholar] [CrossRef]
- Cheng, L.; Wan, Y.; Zhou, Y.; Wenzhong Gao, D. Operational Reliability Modeling and Assessment of Battery Energy Storage Based on Lithium-Ion Battery Lifetime Degradation. J. Mod. Power Syst. Clean Energy 2022, 10, 1738–1749. [Google Scholar] [CrossRef]
- Iurilli, P.; Brivio, C.; Carrillo, R.E.; Wood, V. Physics-Based SoH Estimation for Li-Ion Cells. Batteries 2022, 8, 204. [Google Scholar] [CrossRef]
- Berecibar, M.; Gandiaga, I.; Villarreal, I.; Omar, N.; Van Mierlo, J.; Van den Bossche, P. Critical Review of State of Health Estimation Methods of Li-Ion Batteries for Real Applications. Renew. Sustain. Energy Rev. 2016, 56, 572–587. [Google Scholar] [CrossRef]
- Yao, L.; Xu, S.; Tang, A.; Zhou, F.; Hou, J.; Xiao, Y.; Fu, Z. A Review of Lithium-Ion Battery State of Health Estimation and Prediction Methods. World Electric Veh. J. 2021, 12, 113. [Google Scholar] [CrossRef]
- Nuroldayeva, G.; Serik, Y.; Adair, D.; Uzakbaiuly, B.; Bakenov, Z. State of Health Estimation Methods for Lithium-Ion Batteries. Int. J. Energy Res. 2023, 2023, 1–21. [Google Scholar] [CrossRef]
- Zhao, J.; Zhu, Y.; Zhang, B.; Liu, M.; Wang, J.; Liu, C.; Hao, X. Review of State Estimation and Remaining Useful Life Prediction Methods for Lithium–Ion Batteries. Sustainability 2023, 15, 5014. [Google Scholar] [CrossRef]
- Dini, P.; Colicelli, A.; Saponara, S. Review on Modeling and SOC/SOH Estimation of Batteries for Automotive Applications. Batteries 2024, 10, 34. [Google Scholar] [CrossRef]
- Luo, F.; Huang, H.; Ni, L.; Li, T. Rapid Prediction of the State of Health of Retired Power Batteries Based on Electrochemical Impedance Spectroscopy. J. Energy Storage 2021, 41, 102866. [Google Scholar] [CrossRef]
- Tseng, K.-H.; Liang, J.-W.; Chang, W.; Huang, S.-C. Regression Models Using Fully Discharged Voltage and Internal Resistance for State of Health Estimation of Lithium-Ion Batteries. Energies 2015, 8, 2889–2907. [Google Scholar] [CrossRef]
- Zou, Y.; Hu, X.; Ma, H.; Li, S.E. Combined State of Charge and State of Health Estimation over Lithium-Ion Battery Cell Cycle Lifespan for Electric Vehicles. J. Power Sources 2015, 273, 793–803. [Google Scholar] [CrossRef]
- Noh, T.-W.; Kim, D.H.; Lee, B.K. Online State-of-Health Estimation Algorithm for Lithium-Ion Batteries in Electric Vehicles Based on Compression Ratio of Open Circuit Voltage. J. Energy Storage 2023, 57, 106258. [Google Scholar] [CrossRef]
- Fan, Z.; Zi-xuan, X.; Ming-hu, W. State of Health Estimation for Li-Ion Battery Using Characteristic Voltage Intervals and Genetic Algorithm Optimized Back Propagation Neural Network. J. Energy Storage 2023, 57, 106277. [Google Scholar] [CrossRef]
- Zhang, L.; Ji, T.; Yu, S.; Liu, G. Accurate Prediction Approach of SOH for Lithium-Ion Batteries Based on LSTM Method. Batteries 2023, 9, 177. [Google Scholar] [CrossRef]
- Andre, D.; Appel, C.; Soczka-Guth, T.; Sauer, D.U. Advanced Mathematical Methods of SOC and SOH Estimation for Lithium-Ion Batteries. J. Power Sources 2013, 224, 20–27. [Google Scholar] [CrossRef]
- Yang, D.; Wang, Y.; Pan, R.; Chen, R.; Chen, Z. State-of-Health Estimation for the Lithium-Ion Battery Based on Support Vector Regression. Appl. Energy 2018, 227, 273–283. [Google Scholar] [CrossRef]
- Yin, A.; Tan, Z.; Tan, J. Life Prediction of Battery Using a Neural Gaussian Process with Early Discharge Characteristics. Sensors (Basel) 2021, 21, 1087. [Google Scholar] [CrossRef] [PubMed]
- de la Vega, J.; Riba, J.-R.; Ortega-Redondo, J.A. Real-Time Lithium Battery Aging Prediction Based on Capacity Estimation and Deep Learning Methods. Batteries 2023, 10, 10. [Google Scholar] [CrossRef]
- Yang, D.; Zhang, X.; Pan, R.; Wang, Y.; Chen, Z. A Novel Gaussian Process Regression Model for State-of-Health Estimation of Lithium-Ion Battery Using Charging Curve. J. Power Sources 2018, 384, 387–395. [Google Scholar] [CrossRef]
- Li, D.; Liu, X.; Cheng, Z. The Co-Estimation of States for Lithium-Ion Batteries Based on Segment Data. J. Energy Storage 2023, 62, 106787. [Google Scholar] [CrossRef]
Figure 1.
Experimental setup.
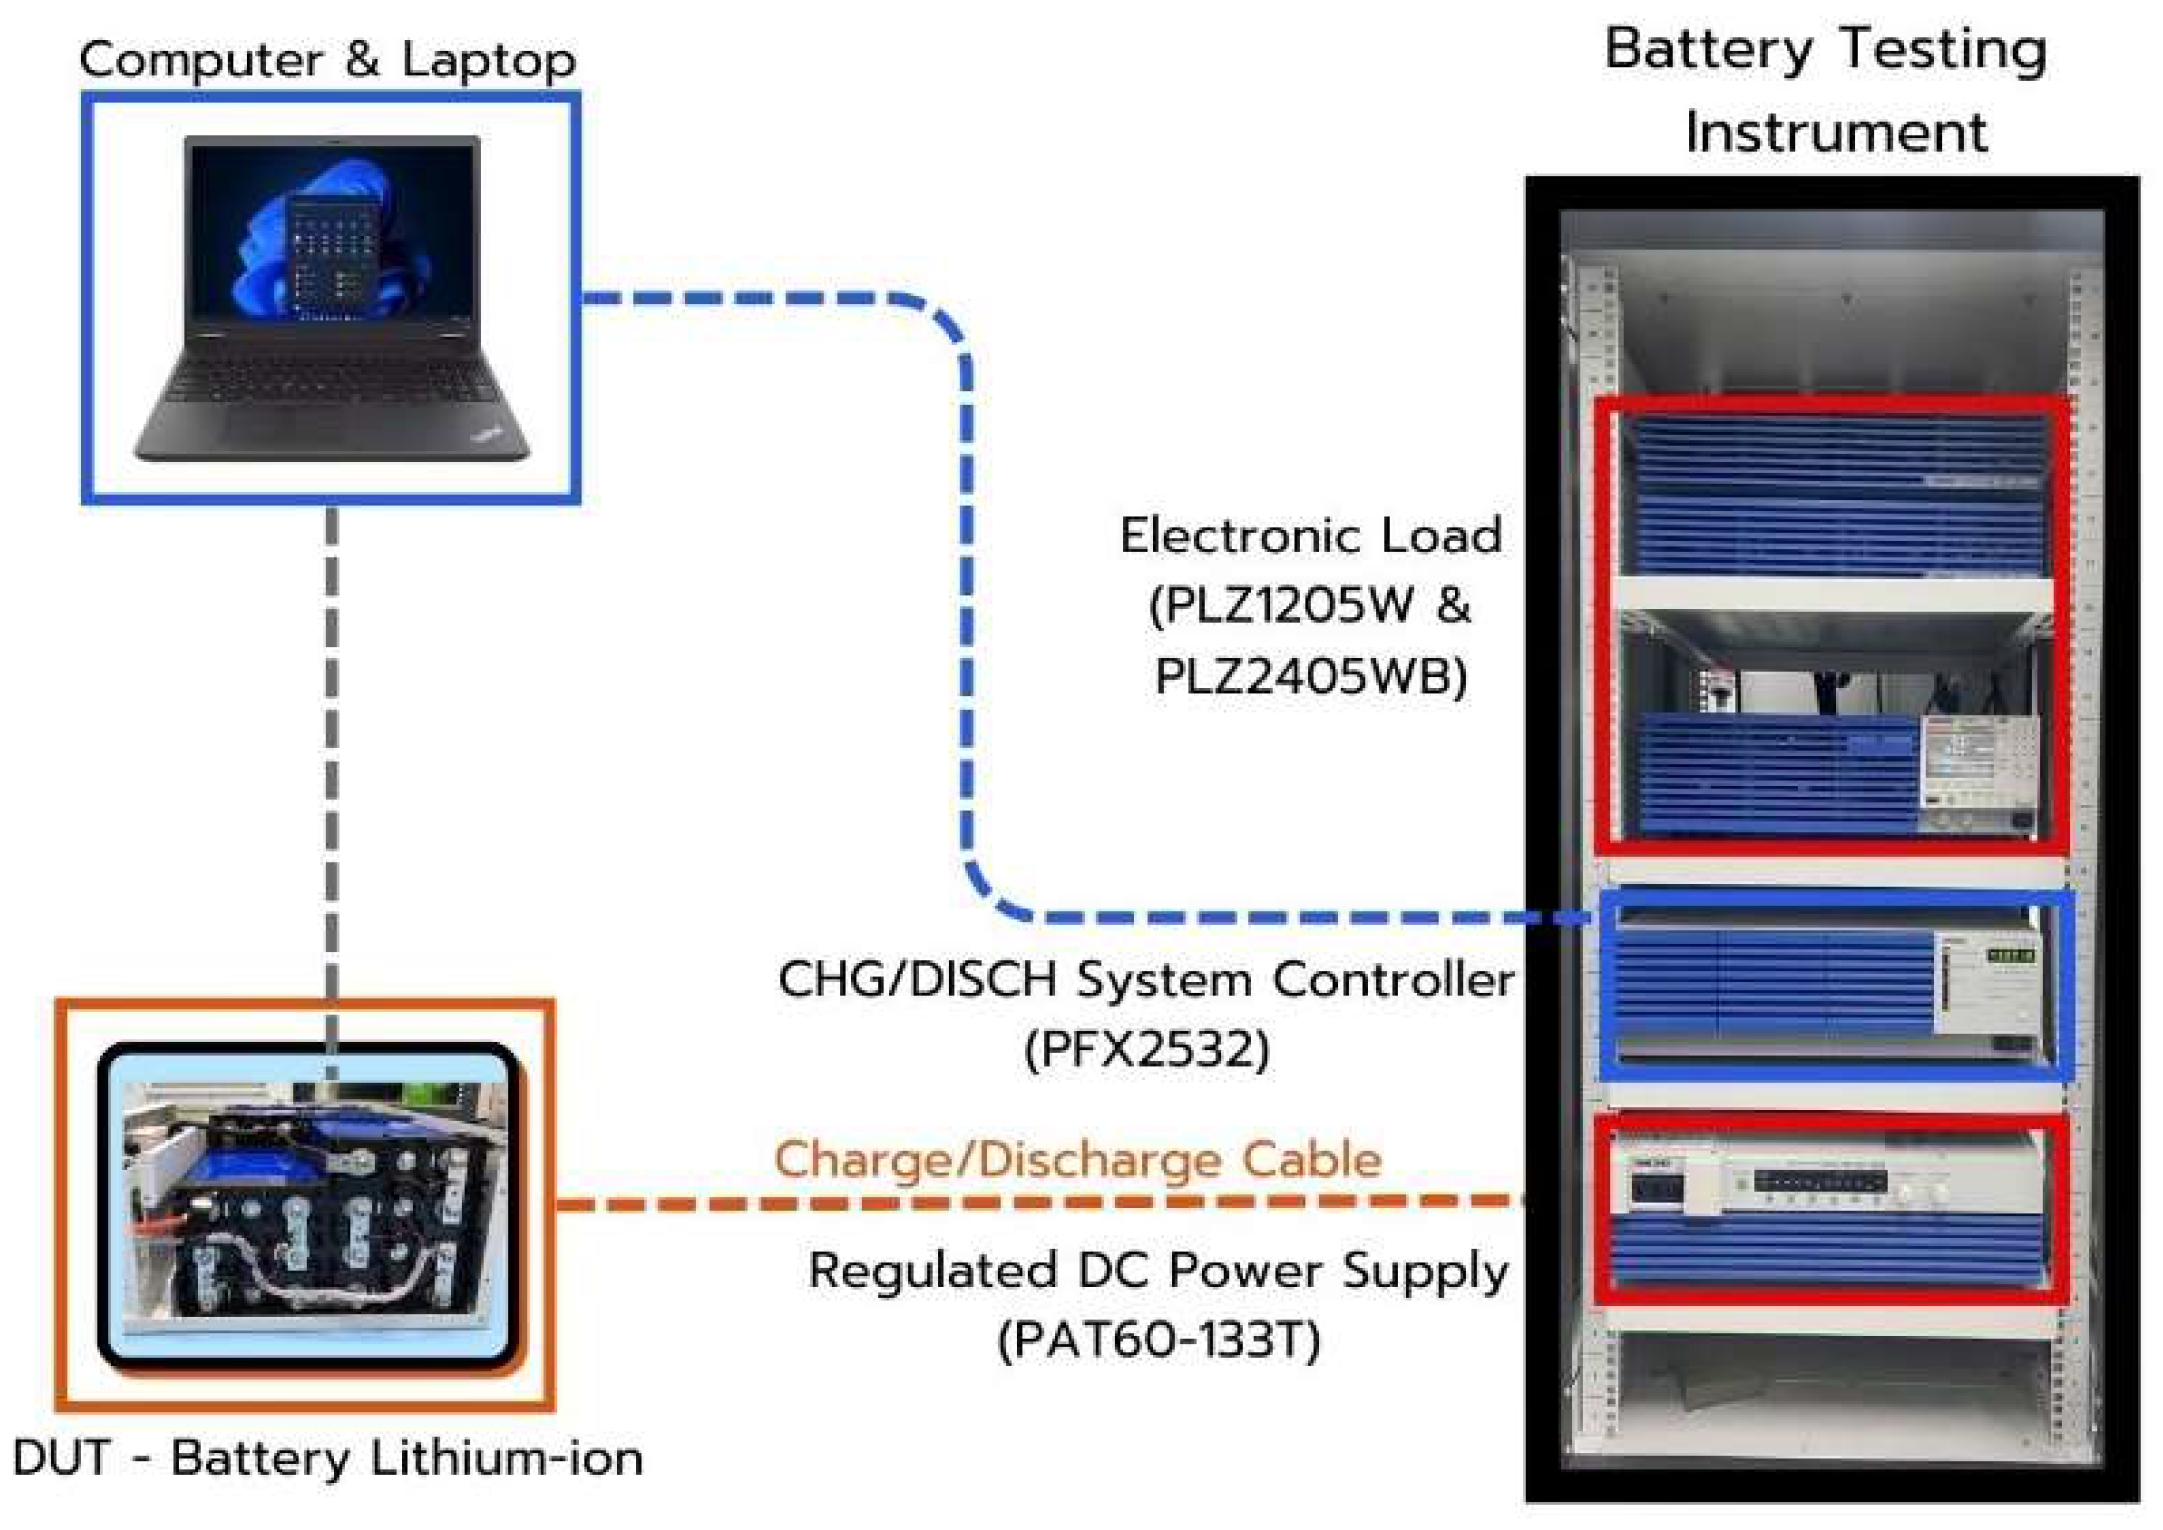
Figure 2.
Capacity degradation of LFP battery pack1.
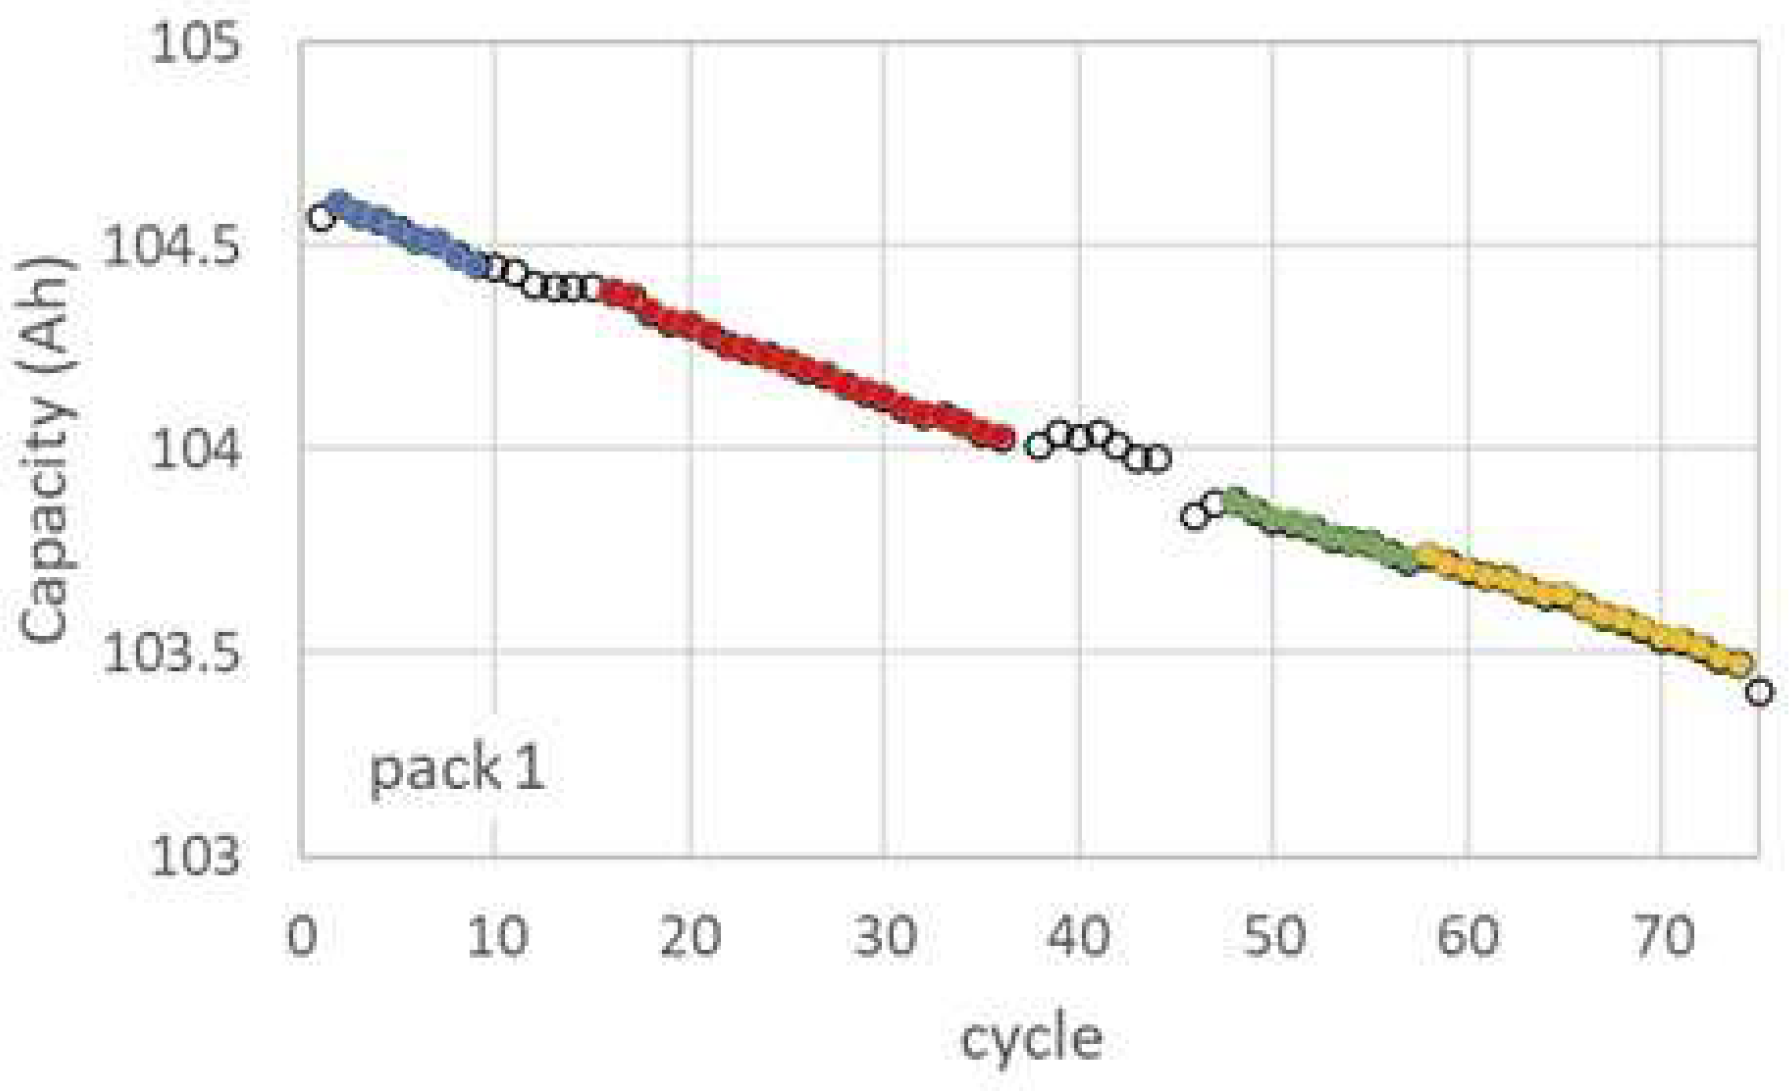
Figure 3.
Capacity prediction of LFP battery pack1 obtained from different data sets using (a) linear, (b) single-exponential, (c) quadratic, and (d) double-exponential mathematical models.
Figure 3.
Capacity prediction of LFP battery pack1 obtained from different data sets using (a) linear, (b) single-exponential, (c) quadratic, and (d) double-exponential mathematical models.
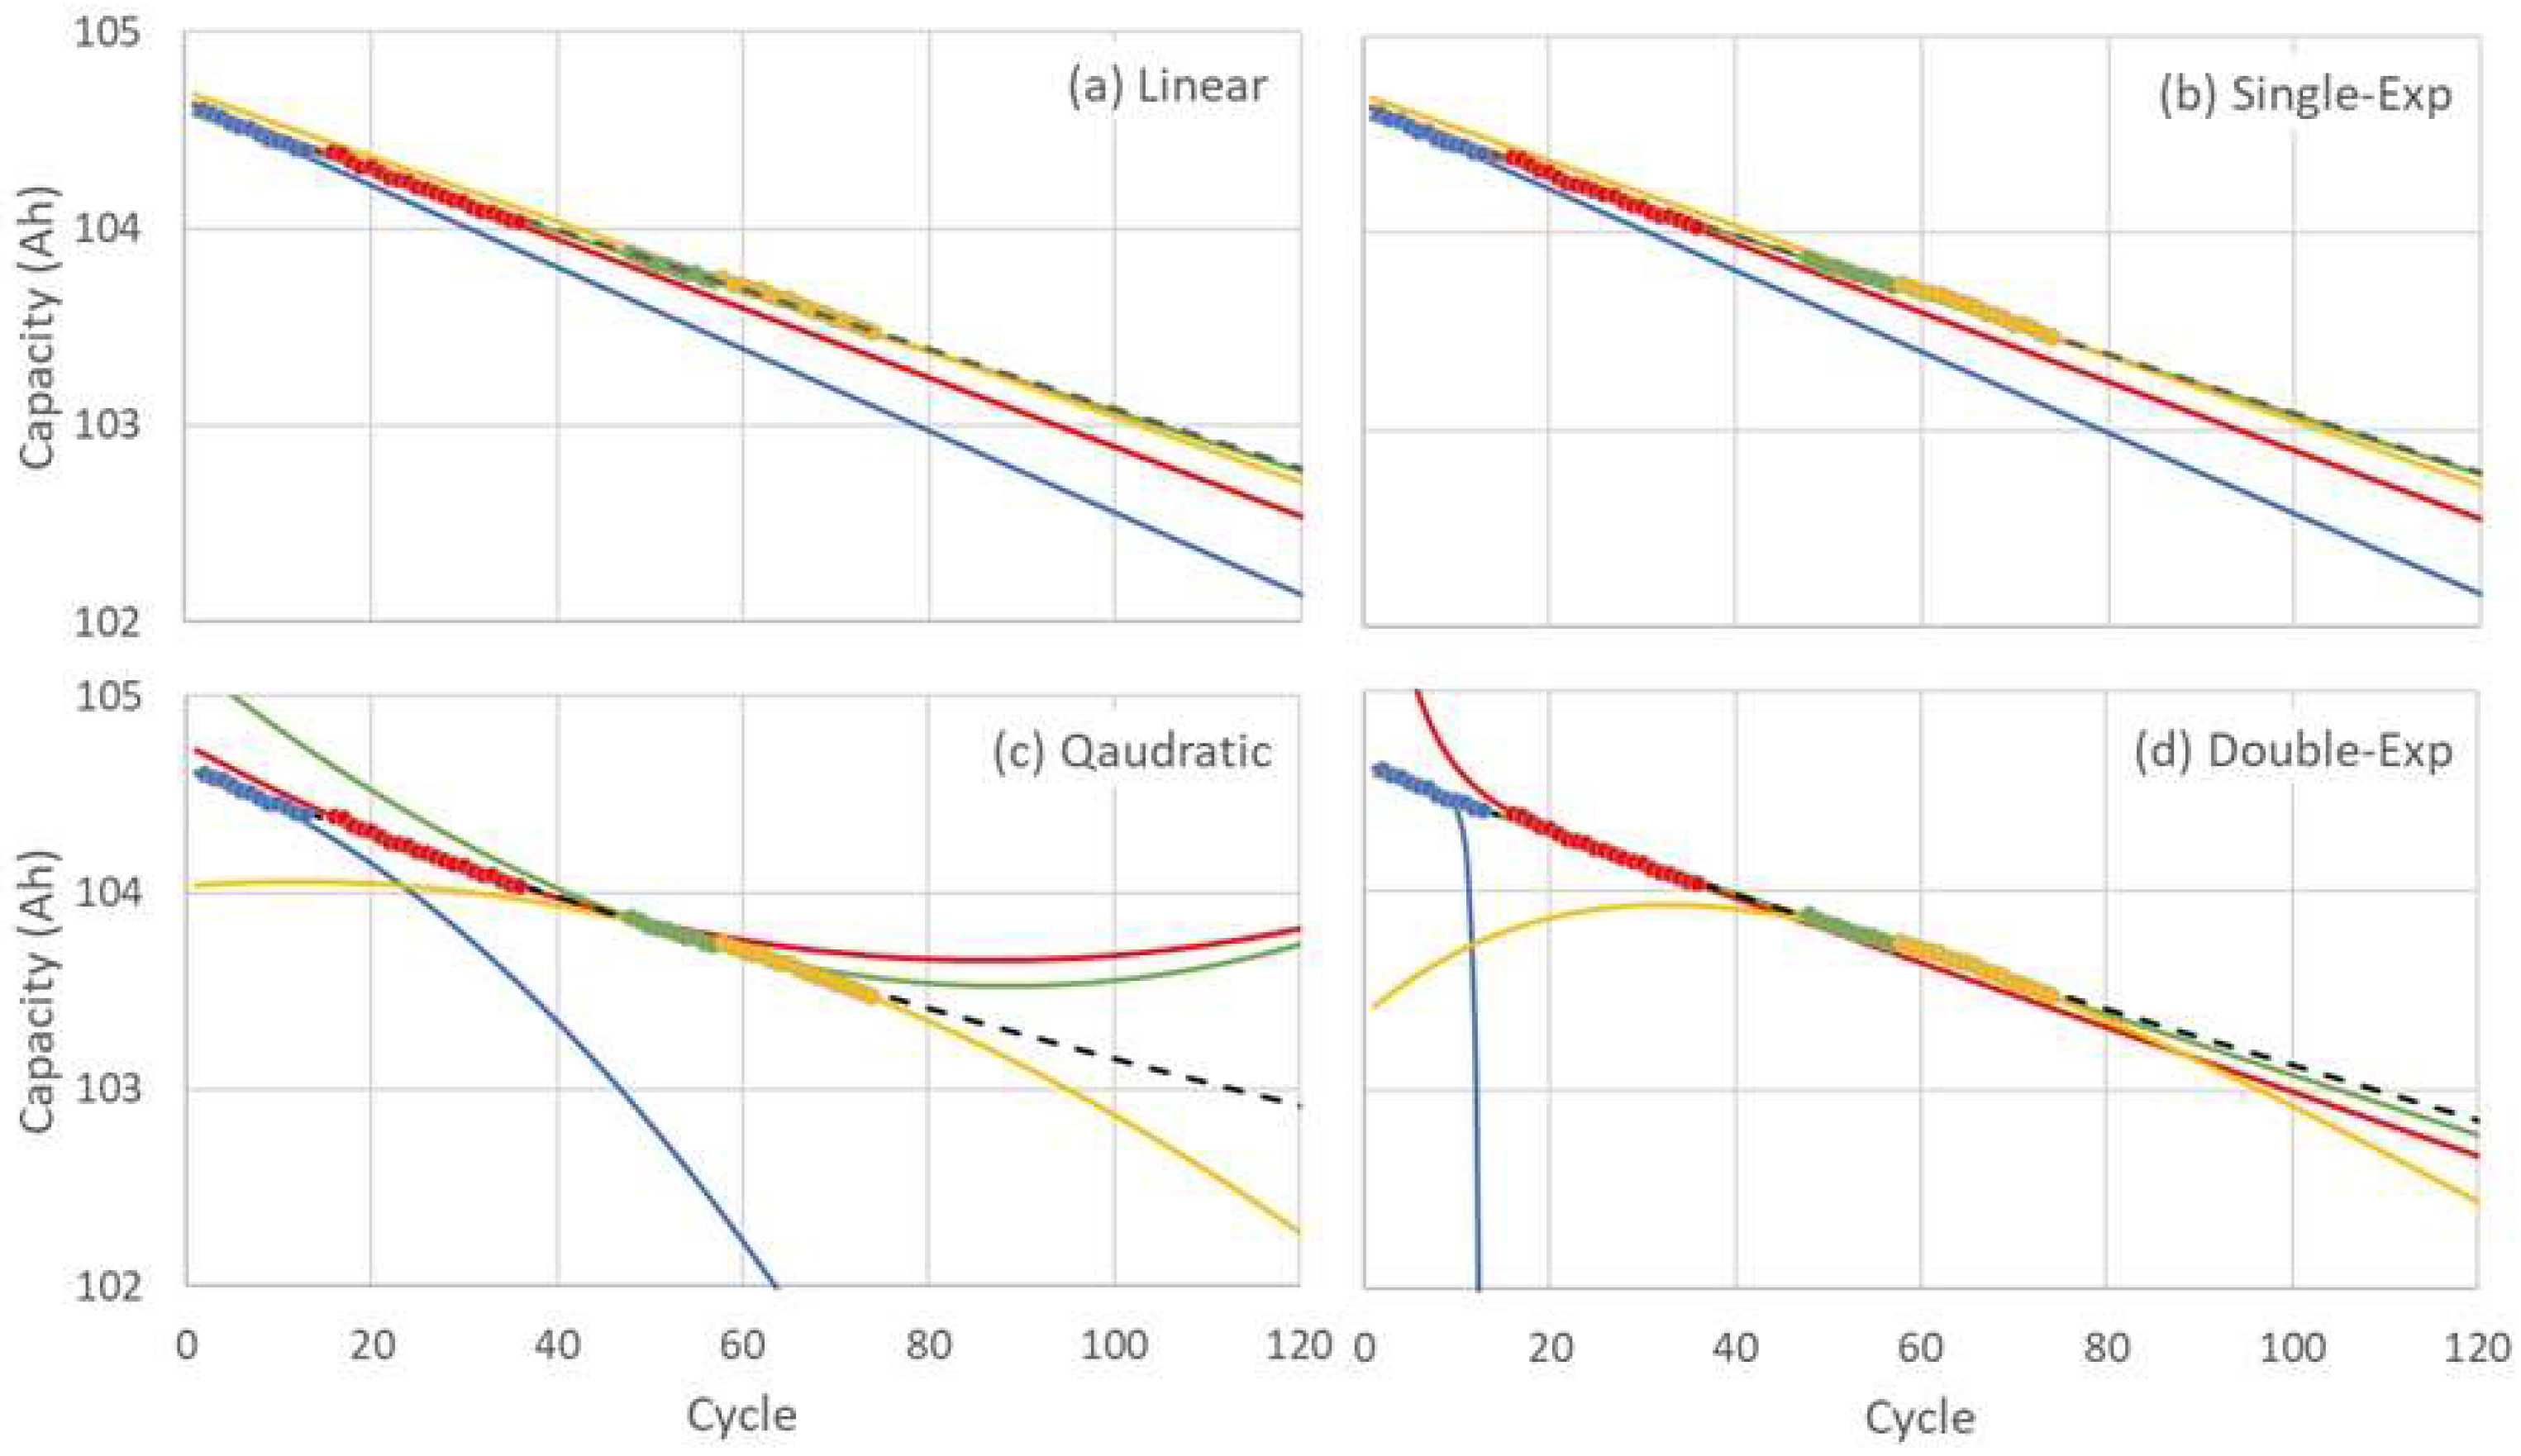
Figure 4.
Fitting capacity of LFP battery pack1 and its absolute error for different combined data sets.
Figure 4.
Fitting capacity of LFP battery pack1 and its absolute error for different combined data sets.
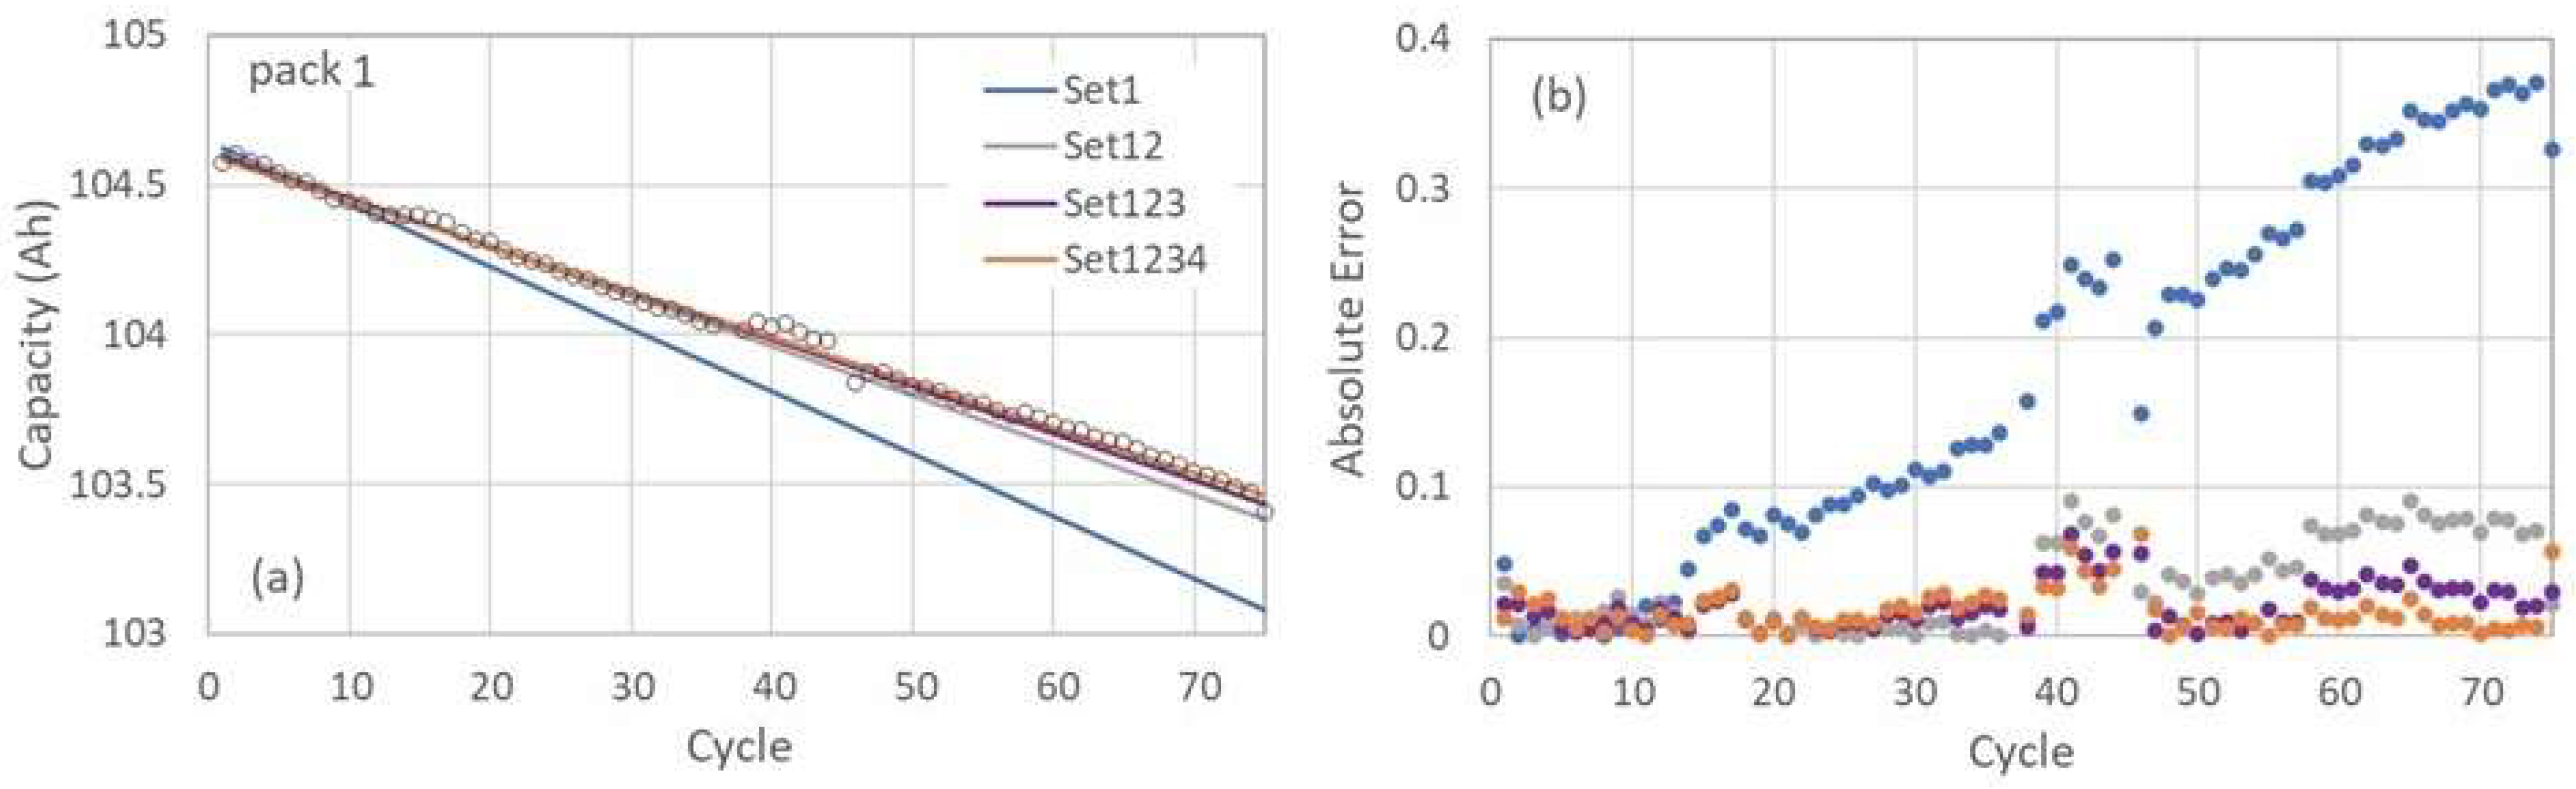
Figure 5.
Fitting capacity of LFP battery pack2-4 and their absolute error for different number of data points.
Figure 5.
Fitting capacity of LFP battery pack2-4 and their absolute error for different number of data points.
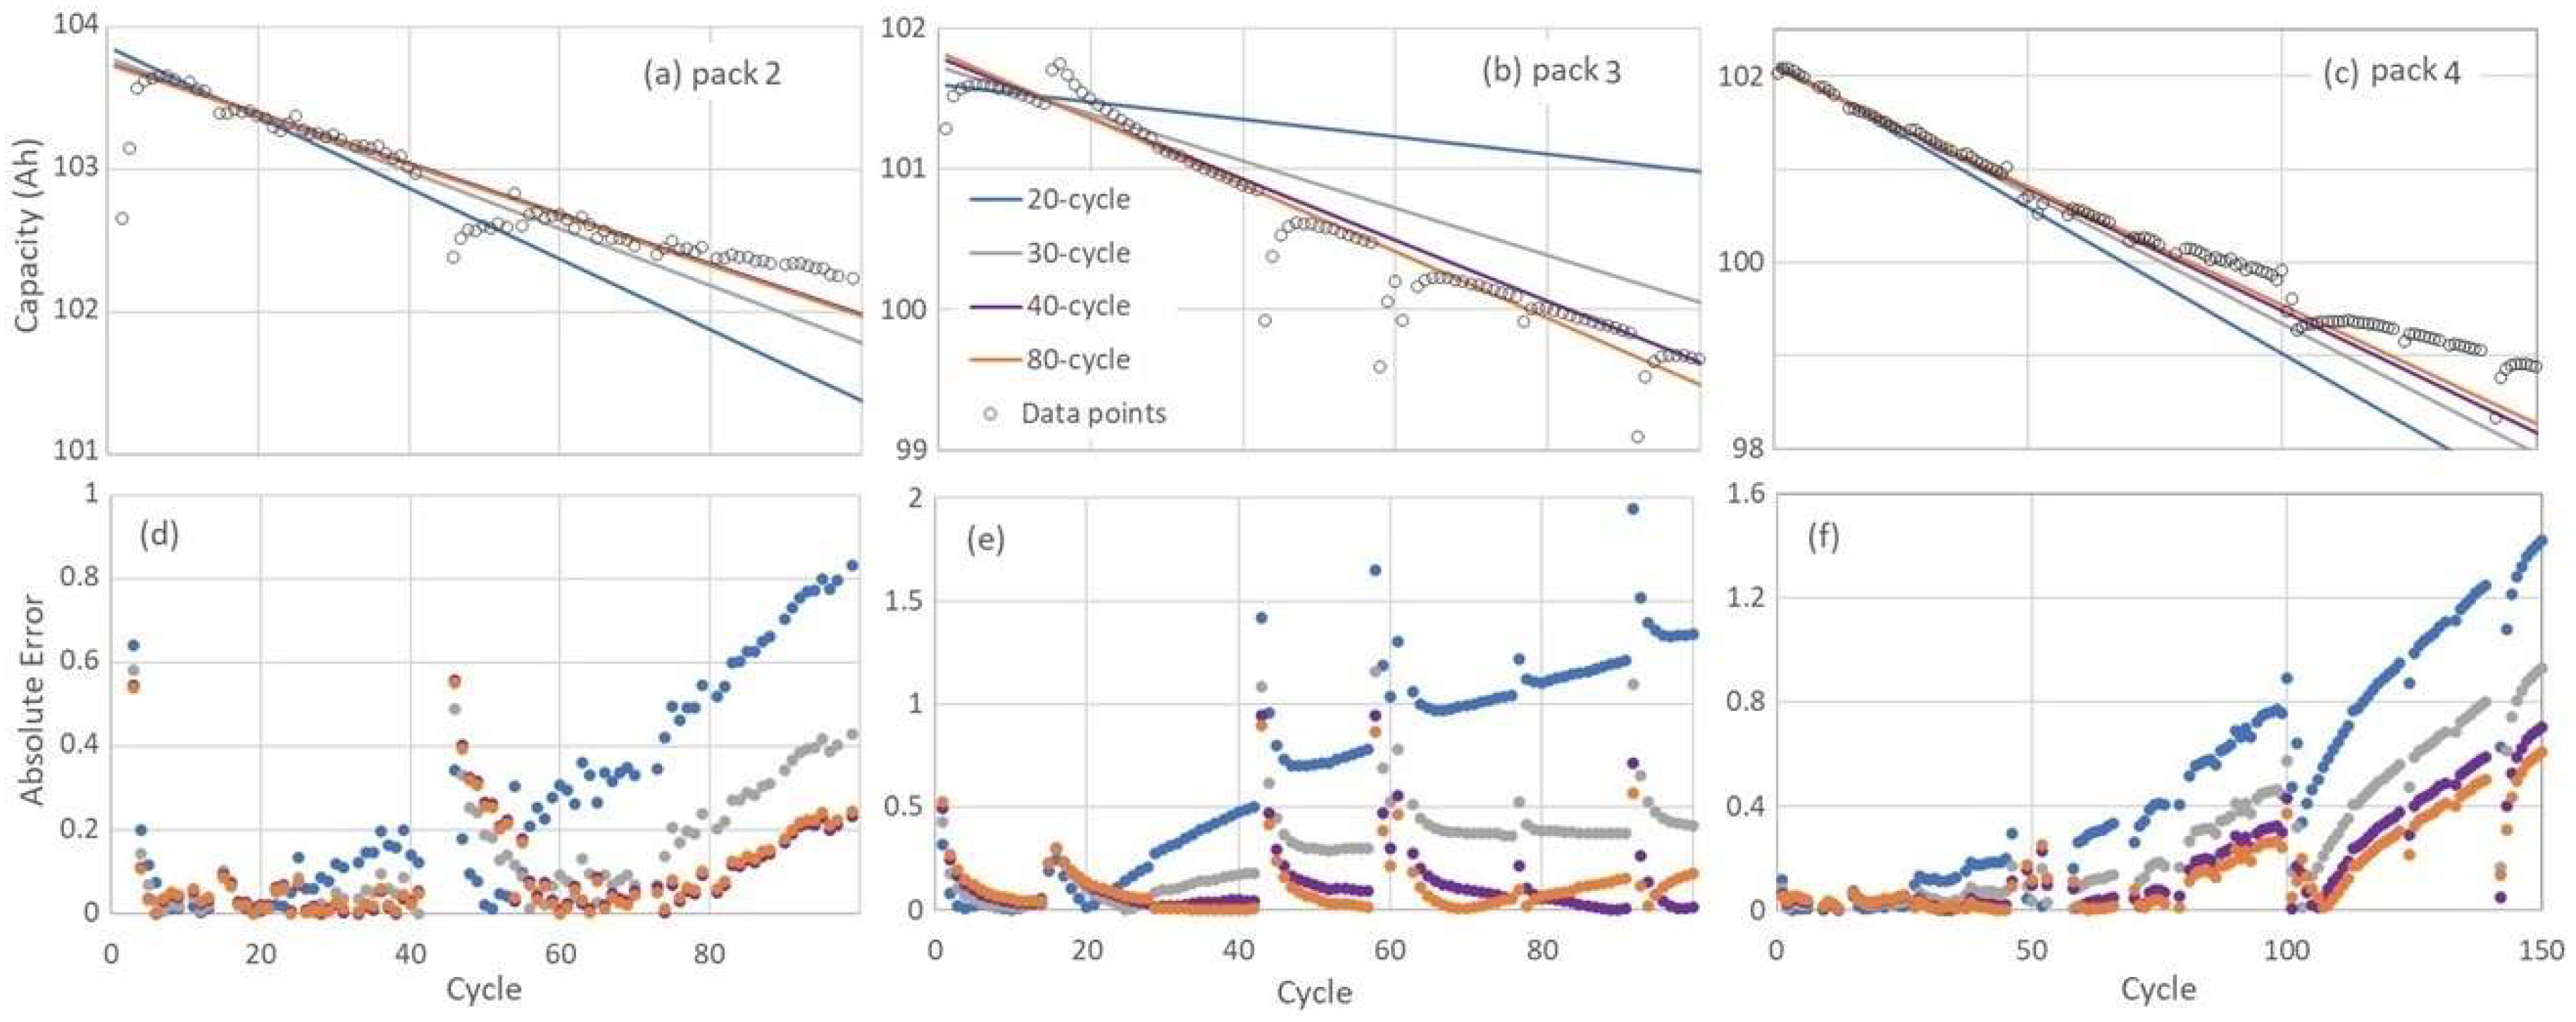
Figure 6.
Predicted capacity obtained from a modified-linear equation (Equation (8)) with the decay term of 0.6 (red) and 0.5 (green), the dashed line indicates the decay term .
Figure 6.
Predicted capacity obtained from a modified-linear equation (Equation (8)) with the decay term of 0.6 (red) and 0.5 (green), the dashed line indicates the decay term .
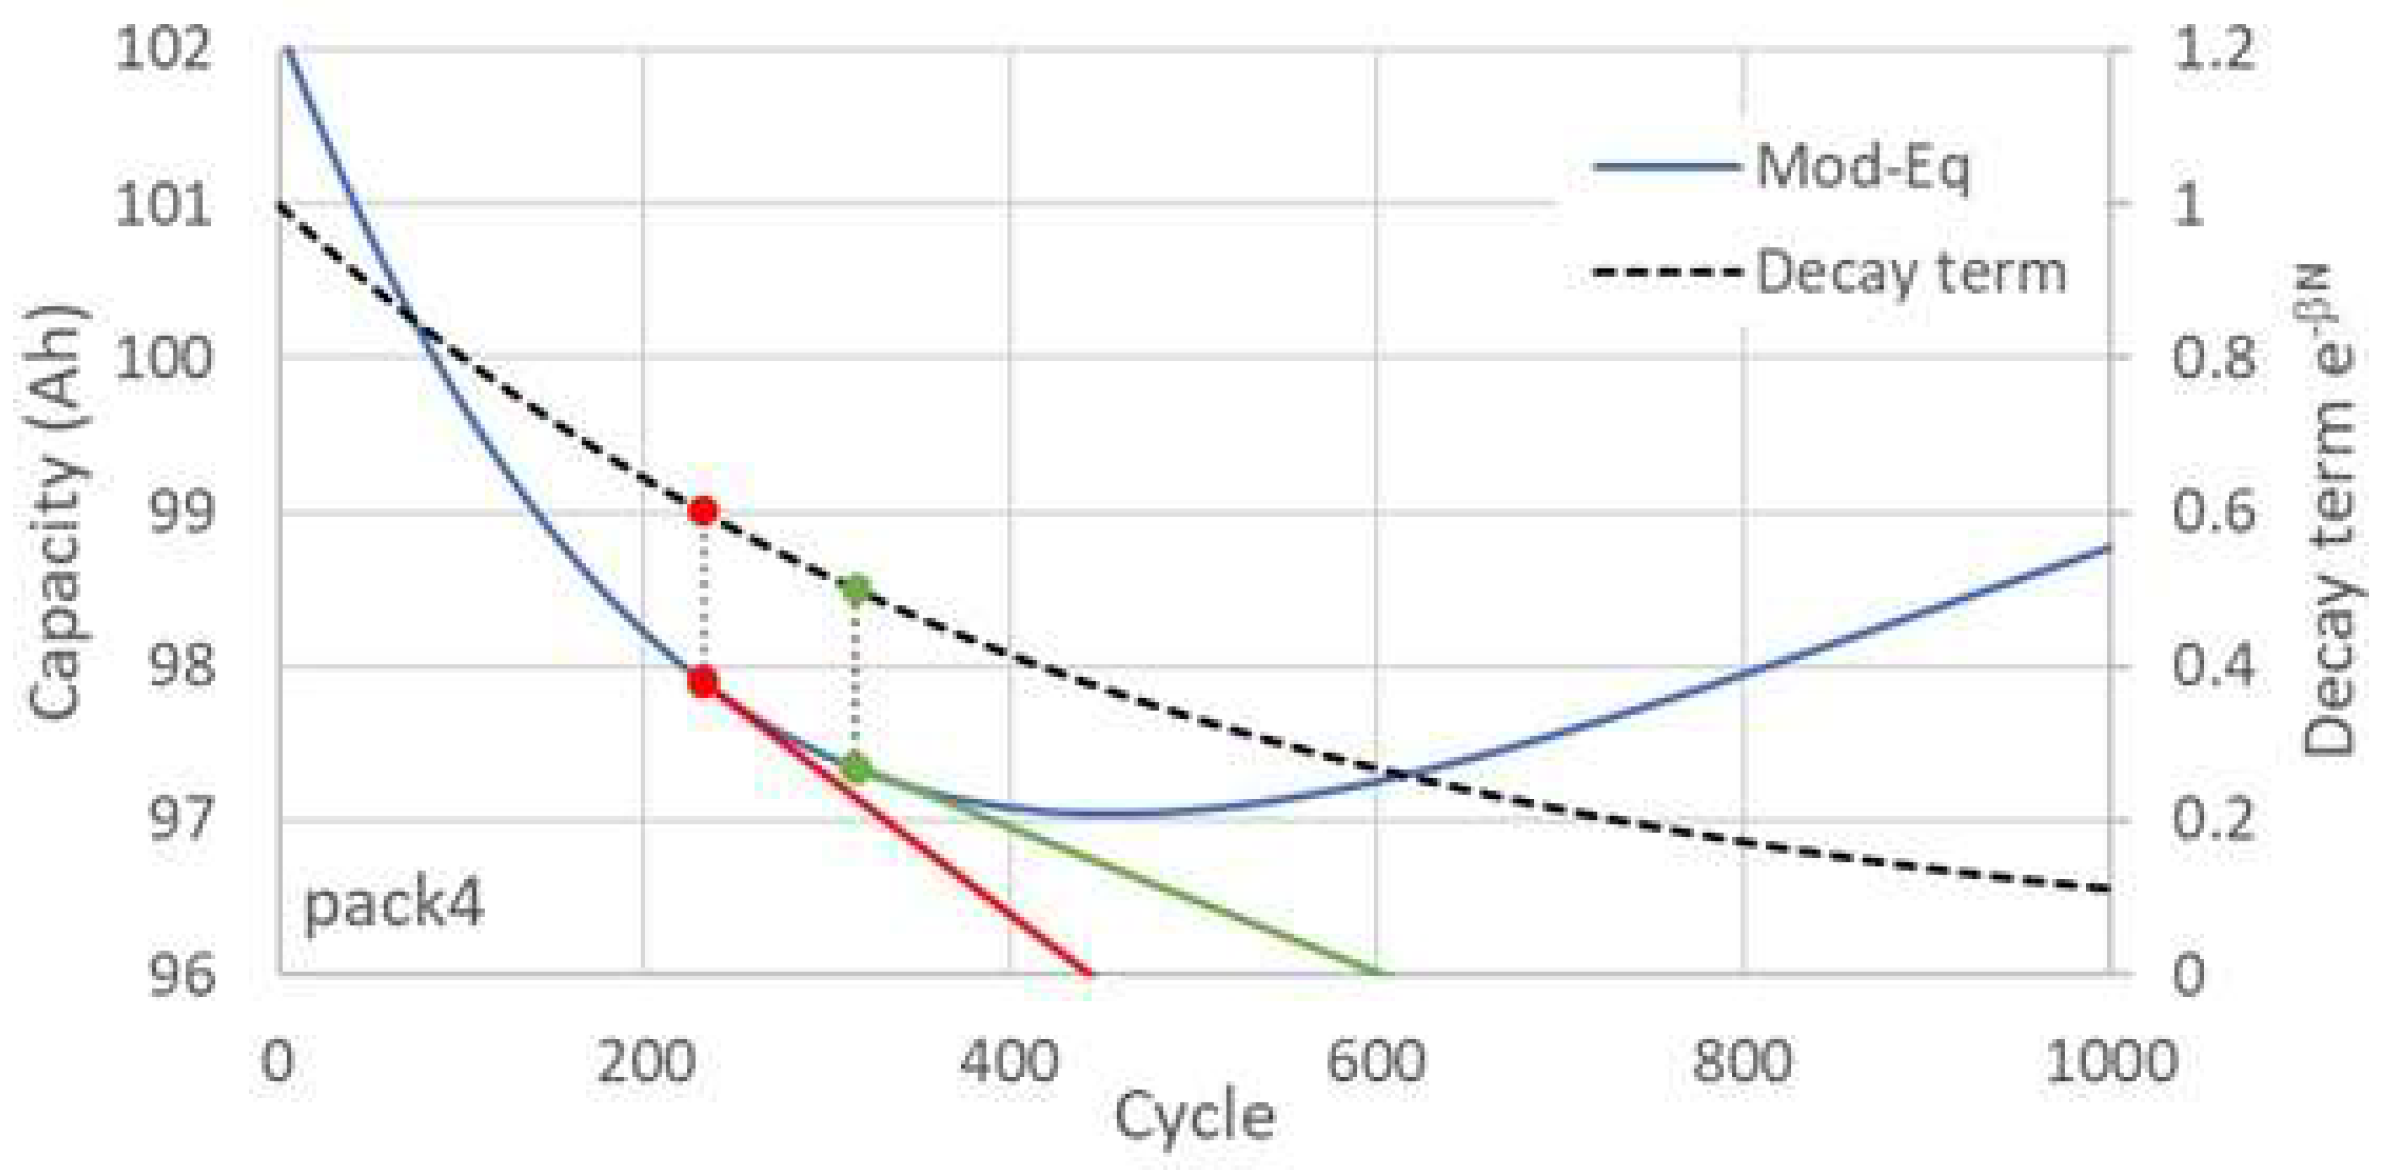
Figure 7.
Predicted capacity and SOH of LFP battery pack2-4 obtained from linear, single-exponential, and modified-linear equations.
Figure 7.
Predicted capacity and SOH of LFP battery pack2-4 obtained from linear, single-exponential, and modified-linear equations.
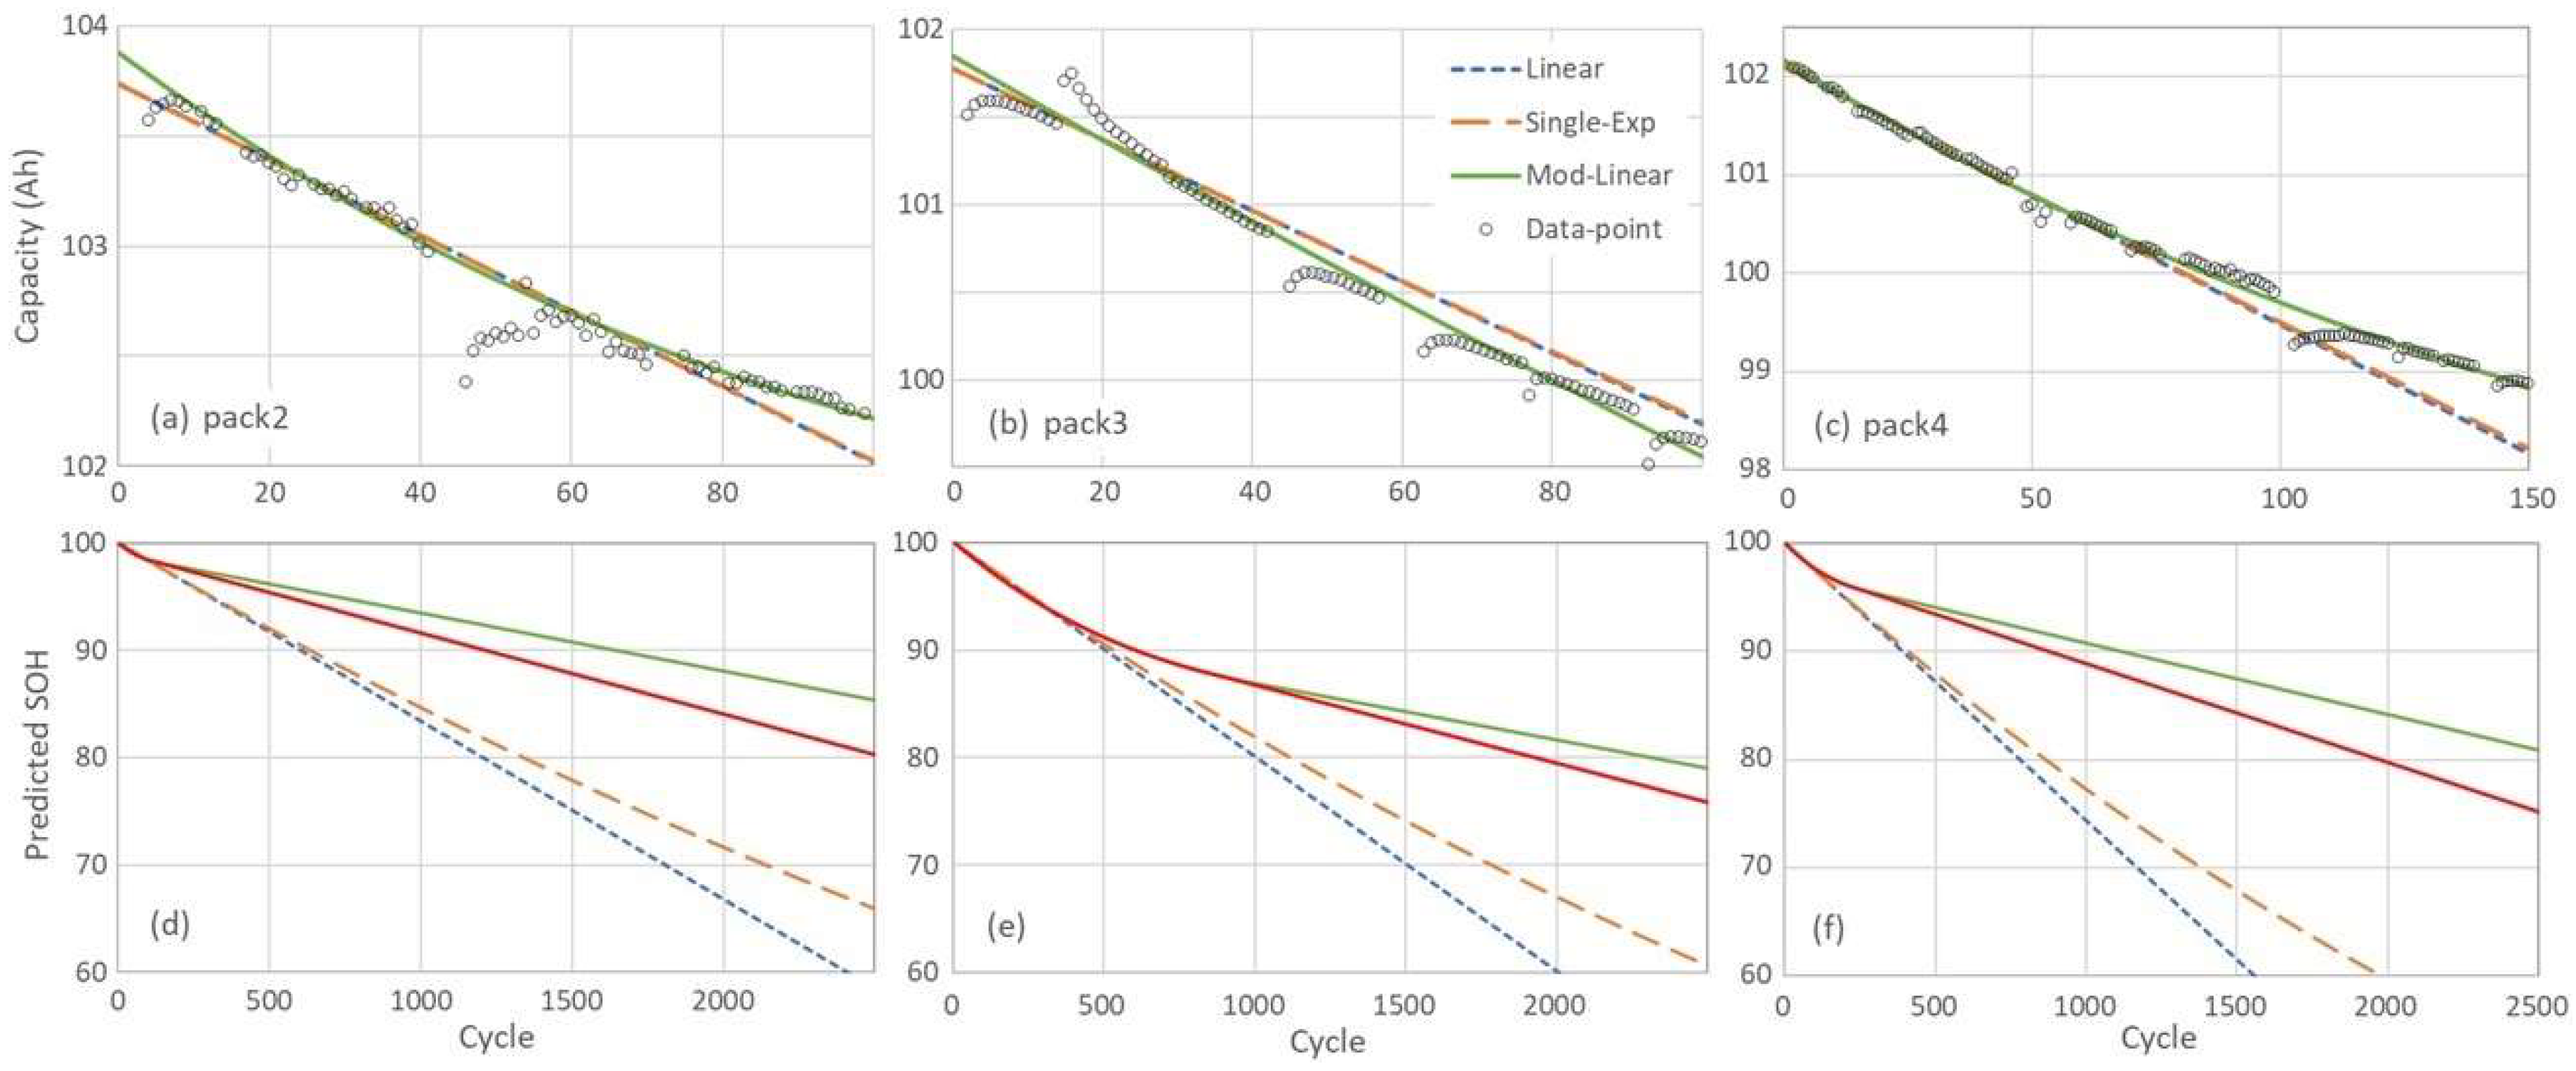

Table 1.
Battery charging and discharging parameters.
| LFP Battery | Charge | Discharge |
Max. cycle |
||||
|
Vcut-off (V) |
Current (A) |
rest time (min) |
Vcut-off (V) |
Current (A) |
rest time (min) |
||
| pack1 | 52 | 20 (0.2C) | 30 | 40 | 100 (1C) | 30 | 75 |
| pack2 | 53 | 20 (0.2C) | 30 | 39 | 100 (1C) | 60 | 100 |
| pack3 | 54 | 50 (0.5C) | 60 | 41 | 100 (1C) | 60 | 100 |
| pack4 | 52 | 50 (0.5C) | 90 | 40 | 100 (1C) | 90 | 100 |
Table 2.
MAE and RMSE of the linear, single-exponential, and modified linear equations.
| LFP Battery |
Parameter |
MAE | RMSE | ||||
| Linear | Single-Exp | Mod-linear | Linear | Single-Exp | Mod-linear | ||
| pack1 | 0.0038 | 0.0240 | 0.0232 | 0.0260 | 0.0303 | 0.0294 | 0.0333 |
| pack2 | 0.0043 | 0.0902 | 0.0890 | 0.0659 | 0.1366 | 0.1355 | 0.1136 |
| pack3 | 0.0006 | 0.1335 | 0.1372 | 0.0738 | 0.1546 | 0.1585 | 0.0990 |
| pack4 | 0.0022 | 0.1909 | 0.1764 | 0.0602 | 0.2726 | 0.2510 | 0.0900 |
Table 3.
End of battery life (SOH=80%) predicted from the linear, single-exponential, and modified-linear equations.
Table 3.
End of battery life (SOH=80%) predicted from the linear, single-exponential, and modified-linear equations.
| LFP Battery | Linear | Single-Exp |
Mod-Linear (factor=0.5) |
Mod-Linear (factor=0.6) |
Specification |
| pack2 | 1005 | 1117 | 1932 | 2320 | 4000 (0.2C) |
| pack3 | 1207 | 1342 | 2538 | 3488 | 3500 (1C) |
| pack4 | 780 | 865 | 1968 | 2631 | 3500 (1C) |
Disclaimer/Publisher’s Note: The statements, opinions and data contained in all publications are solely those of the individual author(s) and contributor(s) and not of MDPI and/or the editor(s). MDPI and/or the editor(s) disclaim responsibility for any injury to people or property resulting from any ideas, methods, instructions or products referred to in the content. |
© 2025 by the authors. Licensee MDPI, Basel, Switzerland. This article is an open access article distributed under the terms and conditions of the Creative Commons Attribution (CC BY) license (http://creativecommons.org/licenses/by/4.0/).
Copyright: This open access article is published under a Creative Commons CC BY 4.0 license, which permit the free download, distribution, and reuse, provided that the author and preprint are cited in any reuse.


