Submitted:
21 October 2025
Posted:
23 October 2025
You are already at the latest version
Abstract
This paper proposes an adaptive explainable artificial intelligence framework designed to enable proactive tax risk prevention and control for small and medium-sized enterprises (SMEs). Traditional tax risk detection models suffer from issues such as lagging performance and black-box decision-making, making them ill-suited to dynamic tax policies and the fluctuating operations of SMEs. By integrating a policy-aware module, a few-shot incremental learning mechanism, and a dynamic feature iteration strategy, this study constructs a risk prediction system capable of real-time response to policy changes, continuous learning, and high interpretability. Experimental results demonstrate that the framework maintains high accuracy (>0.8) and AUC (>0.8) in dynamic tax environments while precisely pinpointing risk sources through interpretability techniques like SHAP. Case studies further validate its capability to provide visual risk explanations and targeted corrective recommendations in real-world scenarios. This paper charts a technical pathway for SMEs to transition from “passive auditing” to “proactive prevention” in tax compliance.
Keywords:
explainable artificial intelligence (XAI)
; tax risk detection
; small and medium-sized enterprises (SMEs)
; adaptive learning
; continuous learning
; SHAP
; policy awareness
1. Introduction
The persistent
widening of the tax gap poses a severe challenge to national finances.
Concurrently, tax regulatory bodies like the Internal Revenue Service (IRS)
have intensified audits of businesses, particularly small and medium-sized
enterprises (SMEs). Against this backdrop, SMEs face significant pain points
during tax filing due to their limited tax expertise and insufficient
understanding of complex tax regulations. Existing tax risk detection
technologies, largely based on traditional statistical models or machine
learning “black box” models, exhibit clear limitations: These models often rely
on historical data and fixed rules, failing to respond in real-time to dynamic
changes in tax policies (e.g., annual adjustments to R&D expense deduction
rates by the IRS) or rapid fluctuations in business operations (e.g., temporary
workforce expansion, seasonal income variations). This results in delayed decision-making,
high misclassification rates, and a lack of clear interpretability, making it
difficult for SMEs to understand and trust the warning results generated by
these models. Addressing these issues, this study aims to answer a core
research question: How can an explainable AI system be built for SMEs that can
identify high-risk tax filing items in real time and provide concrete guidance
for correction? To this end, this paper proposes an adaptive explainable
artificial intelligence framework for proactive tax risk prevention and control
in SMEs. Key contributions include: 1. A model integrating policy awareness,
few-shot incremental learning, and dynamic feature iteration to adapt to
evolving tax policies and operational changes, fundamentally resolving model
lag. 2. Deep integration of explainability techniques like SHAP, transforming
black-box predictions into actionable insights that not only flag risks but
explain their origins and provide corrective guidance. An interactive interface
integrating risk prediction, visual explanations (e.g., radar charts, waterfall
charts), and corrective recommendations was developed to lower the adoption
barrier for SMEs. Through experiments simulating dynamic tax filing scenarios
and detailed case studies, the framework demonstrated outstanding performance
in accuracy, robustness, and practicality.
2. Related Work
2.1. Tax Risk Detection Model
Traditional
statistical methods were the early mainstream techniques for tax risk
detection, with commonly used approaches including linear/logistic regression,
decision trees, and clustering algorithms. However, these models rely on fixed
rules or historical data, making them unable to respond in real time to changes
in tax policies (e.g., the 2023 IRS adjustment to R&D expense deduction
rates for SMEs) or dynamic business conditions (e.g., temporary hiring surges,
revenue fluctuations). This leads to “rule obsolescence”—for instance, a model
still using 2021 deduction thresholds to screen 2024 tax filings would see a
significant increase in misclassification rates. Tax risks for SMEs often stem
from multi-feature interactions (e.g., “business duration < 3 years +
employees < 5 + deduction ratio > 40%”). Traditional statistical methods
struggle to capture such nonlinear relationships, performing only
one-dimensional detection and resulting in high false-negative rates. This
deficiency is directly linked to the absence of feature localization
technology: [1] Jin et al. (2022) in “Review of Methods Applying on Facial Alignment”
noted that the core value of facial alignment technology lies in achieving
multi-feature collaborative matching through precise localization of key
features (e.g., facial landmarks). Traditional tax statistical models lack
precisely this “feature localization mechanism,” - interaction analysis"
mechanism, failing to recognize risk patterns involving multiple feature
couplings (e.g., focusing solely on the proportion of deductions while ignoring
the synergistic impact of business tenure and employee count); Existing
traditional models are predominantly designed for large enterprise data (e.g.,
considering multinational revenues and complex tax types), failing to optimize
for the characteristics of SMEs—which feature “simple tax types and concentrated
risk points (e.g., underreported income, non-compliant deductions)”—resulting
in redundant detection dimensions and incomplete coverage of critical risk
factors.
In recent
years, machine learning has gained traction in tax risk detection due to its
superior complex data processing capabilities. Mainstream models include
ensemble learning and deep learning approaches. Some studies employ neural
networks (e.g., LSTM) to process time-series tax filing data (e.g., monthly
declarations over the past three years) to capture long-term risk trends. The
feasibility of this approach has been validated in other time-series anomaly
detection scenarios:
[2]
Huang and Qiu (2025) in “LSTM-Based Time Series
Detection of Abnormal Electricity Usage in Smart Meters” employed LSTM models
to capture temporal fluctuation patterns in smart meter electricity consumption
(e.g., seasonal usage peaks, daily consumption stability), enabling real-time
identification of abnormal usage behavior with an accuracy improvement of 18%
over traditional statistical methods. However, the application of LSTM in tax
risk detection remains significantly underdeveloped. Monthly tax filing data
from small and medium-sized enterprises similarly exhibit temporal patterns
such as “seasonal revenue fluctuations” and “quarterly deduction patterns”
(e.g., retail enterprises typically report higher fourth-quarter revenues than
other quarters). Yet existing models fail to adopt Huang et al.'s temporal
quarterly deduction patterns“ (e.g., retail enterprises typically reporting
higher fourth-quarter revenues than other quarters). Existing models, however,
have not adopted Huang et al.'s time-series analysis approach, failing to
uncover sequential correlation risks such as ”three consecutive months of
sequential revenue decline with unchanged deductions." Consequently,
numerous risk indicators within the time-series dimension remain largely
overlooked.
2.2. Applications of Explainable AI (XAI) in Finance
SHAP (SHapley
Additive exPlanations) leverages Shapley values from game theory to calculate
the “marginal contribution” of each feature to the decision outcome, enabling
dual explanations at both global (all samples) and local (individual samples)
levels. Its application in finance has expanded from “risk attribution” to
“optimization guidance.” In credit risk assessment, banks use SHAP to explain
“why a company's loan application was rejected,” such as outputting “the
company's debt-to-asset ratio (contribution value -0.8) and overdue payment
frequency in the past three years (contribution value -0.5) are the primary
negative factors,” helping businesses identify areas for improvement.
[3]
Qi (2025) in
“Enterprise Financial Distress Prediction Based on Machine Learning and SHAP
Interpretability Analysis” built a financial distress prediction model using
XGBoost. By quantifying the contribution of key features like “debt-to-asset
ratio” and " Operating Cash Flow Ratio.“ This approach not only achieved
an 89% prediction accuracy but also provided concrete optimization recommendations
such as ”reducing the debt-to-asset ratio below 50% can significantly alleviate
distress,“ forming a closed-loop of ”prediction-explanation-guidance."
2.3. Research on Continuous Learning in Dynamic Environments
Cross-domain
continuous learning research has established a mature “dynamic feature
adaptation” approach, offering valuable insights for tax scenarios.
[4]
Yi et al.
(2021) in “DDR-Net: Learning multi-stage multi-view stereo with dynamic depth
range” proposed a multi-stage dynamic depth range learning mechanism — — where
the model dynamically adjusts the “precision level” of feature extraction
(e.g., emphasizing fine-grained features in close-up scenes and global features
in distant scenes) based on depth variations across different scenarios. This
enables real-time adaptation to dynamic visual environments, preventing
performance degradation due to scene changes. This “on-demand feature precision
adjustment” approach aligns closely with the need for dynamic adaptation in tax
policy. Forgetting is mitigated through regularization (e.g., EWC, Elastic
Weight Consolidation) and replay mechanisms (e.g., storing historical key
samples). For instance, in credit card fraud detection, the model undergoes
incremental updates after processing every 1,000 new transaction records.
Concurrently, EWC safeguards the weights of “traditional fraud features (e.g.,
overseas transactions)” to prevent the learning of new data from invalidating
established patterns.
3. Methodology
3.1. Adaptive Learning Model
To more clearly
illustrate the actual interaction process between adaptive learning mechanisms
and policy changes/feature updates, this paper uses the IRS's 2024 adjustment
to the “Additional Deduction for Digital Investments” policy as an example to
explain the model's real-time response workflow: Upon the IRS's release of the
“Additional 10% Tax Deduction for Small Business Digital Investments in 2024”
policy, the system retrieves the policy text in real-time via API. Error!
Reference source not found. The NLP module parses key elements: “policy
impact dimension” (e.g., “Deduction Category - Digital Investment”),
“adjustment value” (10%), and “effective date” (January 1, 2024). The system
automatically updates the “Policy-Feature Mapping Table,” associating the
“Digital Investment Deduction Rate” with features like “Deduction-to-Revenue
Ratio” and “Digital Investment Amount” within the model. For example, after the
policy takes effect, the system automatically increases the feature weight of
“Digital Investment Amount” from 0.2 to 0.4 while simultaneously reducing the
weight of “Traditional Equipment Investment Deduction” (e.g., from 0.3 to 0.1).
Incremental training is initiated every 30-50 new SME tax filing records
collected. If an enterprise's “deduction ratio exceeds the industry average by
20%,” that sample is flagged as high-risk and prioritized for model updates.
Concurrently, the system applies weight protection to key features (e.g., “industry
code match”) based on industry benchmarks Error! Reference source not found.
(e.g., Industry 7's average risk rate of 6.8%) to prevent model forgetting of common
industry risk patterns. Furthermore, the system evaluates feature-risk label
correlations every three months using a sliding time window. If the “temporary
worker expenditure ratio” maintains a correlation above 0.25 across two
consecutive windows, it is automatically added to the core feature set.
Conversely, if the “fixed asset depreciation period” falls below a 0.1
correlation in two windows, it is removed.
3.2. Risk Prediction Model
The dynamic
feature input layer incorporates fine-grained tax filing features optimized by
the adaptive module (e.g., “employee wage deductions,” “R&D investment
deductions,” “digital investment deductions”—derived from the original “total
deductions”), alongside industry-related features (e.g., “deviation of deductions
from industry average,” “alignment of revenue volatility with industry
trends”). Feature dynamic weights leverage those generated by the adaptive
module based on policy updates (e.g., IRS deduction adjustments) and risk
relevance assessments (e.g., the weight for “digital investment deductions”
increased from 0.2 to 0.4 after policy implementation), ensuring the model
prioritizes high-value risk features. It incorporates compliance benchmarks
stored in the adaptive module as core references for risk assessment,
preventing one-size-fits-all predictions detached from industry
characteristics.
To address the
small sample size and real-time requirements of SMEs, a lightweight
architecture combining “Enhanced LightGBM + Feature Interaction Boosting” is
adopted. LightGBM serves as the core predictor, assigning higher sample weights
(1.2–1.5 times) to “high-risk-correlated samples” (e.g., enterprises with
historical deduction violations) selected by the adaptive module, thereby
boosting the model's learning priority for high-risk patterns. L1
regularization suppresses redundant features (e.g., “fixed asset depreciation
period” with low SME risk relevance) to mitigate overfitting in small samples.
Experiments confirm this optimization reduces overfitting rates by 15%-20% in
SME datasets below 50 samples.
For SME
“multi-feature coupled risks” Error! Reference source not found. (e.g.,
“business duration < 3 years + deductions ratio > 40% + zero-declaration
frequency > 2 times”), generate interaction features through a combination
of manual design and automated mining. Based on core SME risk points, design
interaction features such as “deduction ratio × industry deviation coefficient”
and “zero-declaration frequency × number of employees.” Utilize LightGBM's
feature importance feedback to dynamically retain second-order interactions
among the “Top 10 most important single features,” such as “revenue declaration
stability × business frequency × number of zero-declarations × number of
employees.” Number of Zero-Declaration Periods × Number of Employees.“ Using
LightGBM's feature importance feedback, we dynamically retained second-order
interactions among the ”Top 10 Single Feature Importances“ (e.g., ”Income
Declaration Stability × Business Duration") to ensure the model captures
non-linear risk correlations.
3.3. Explainability Module
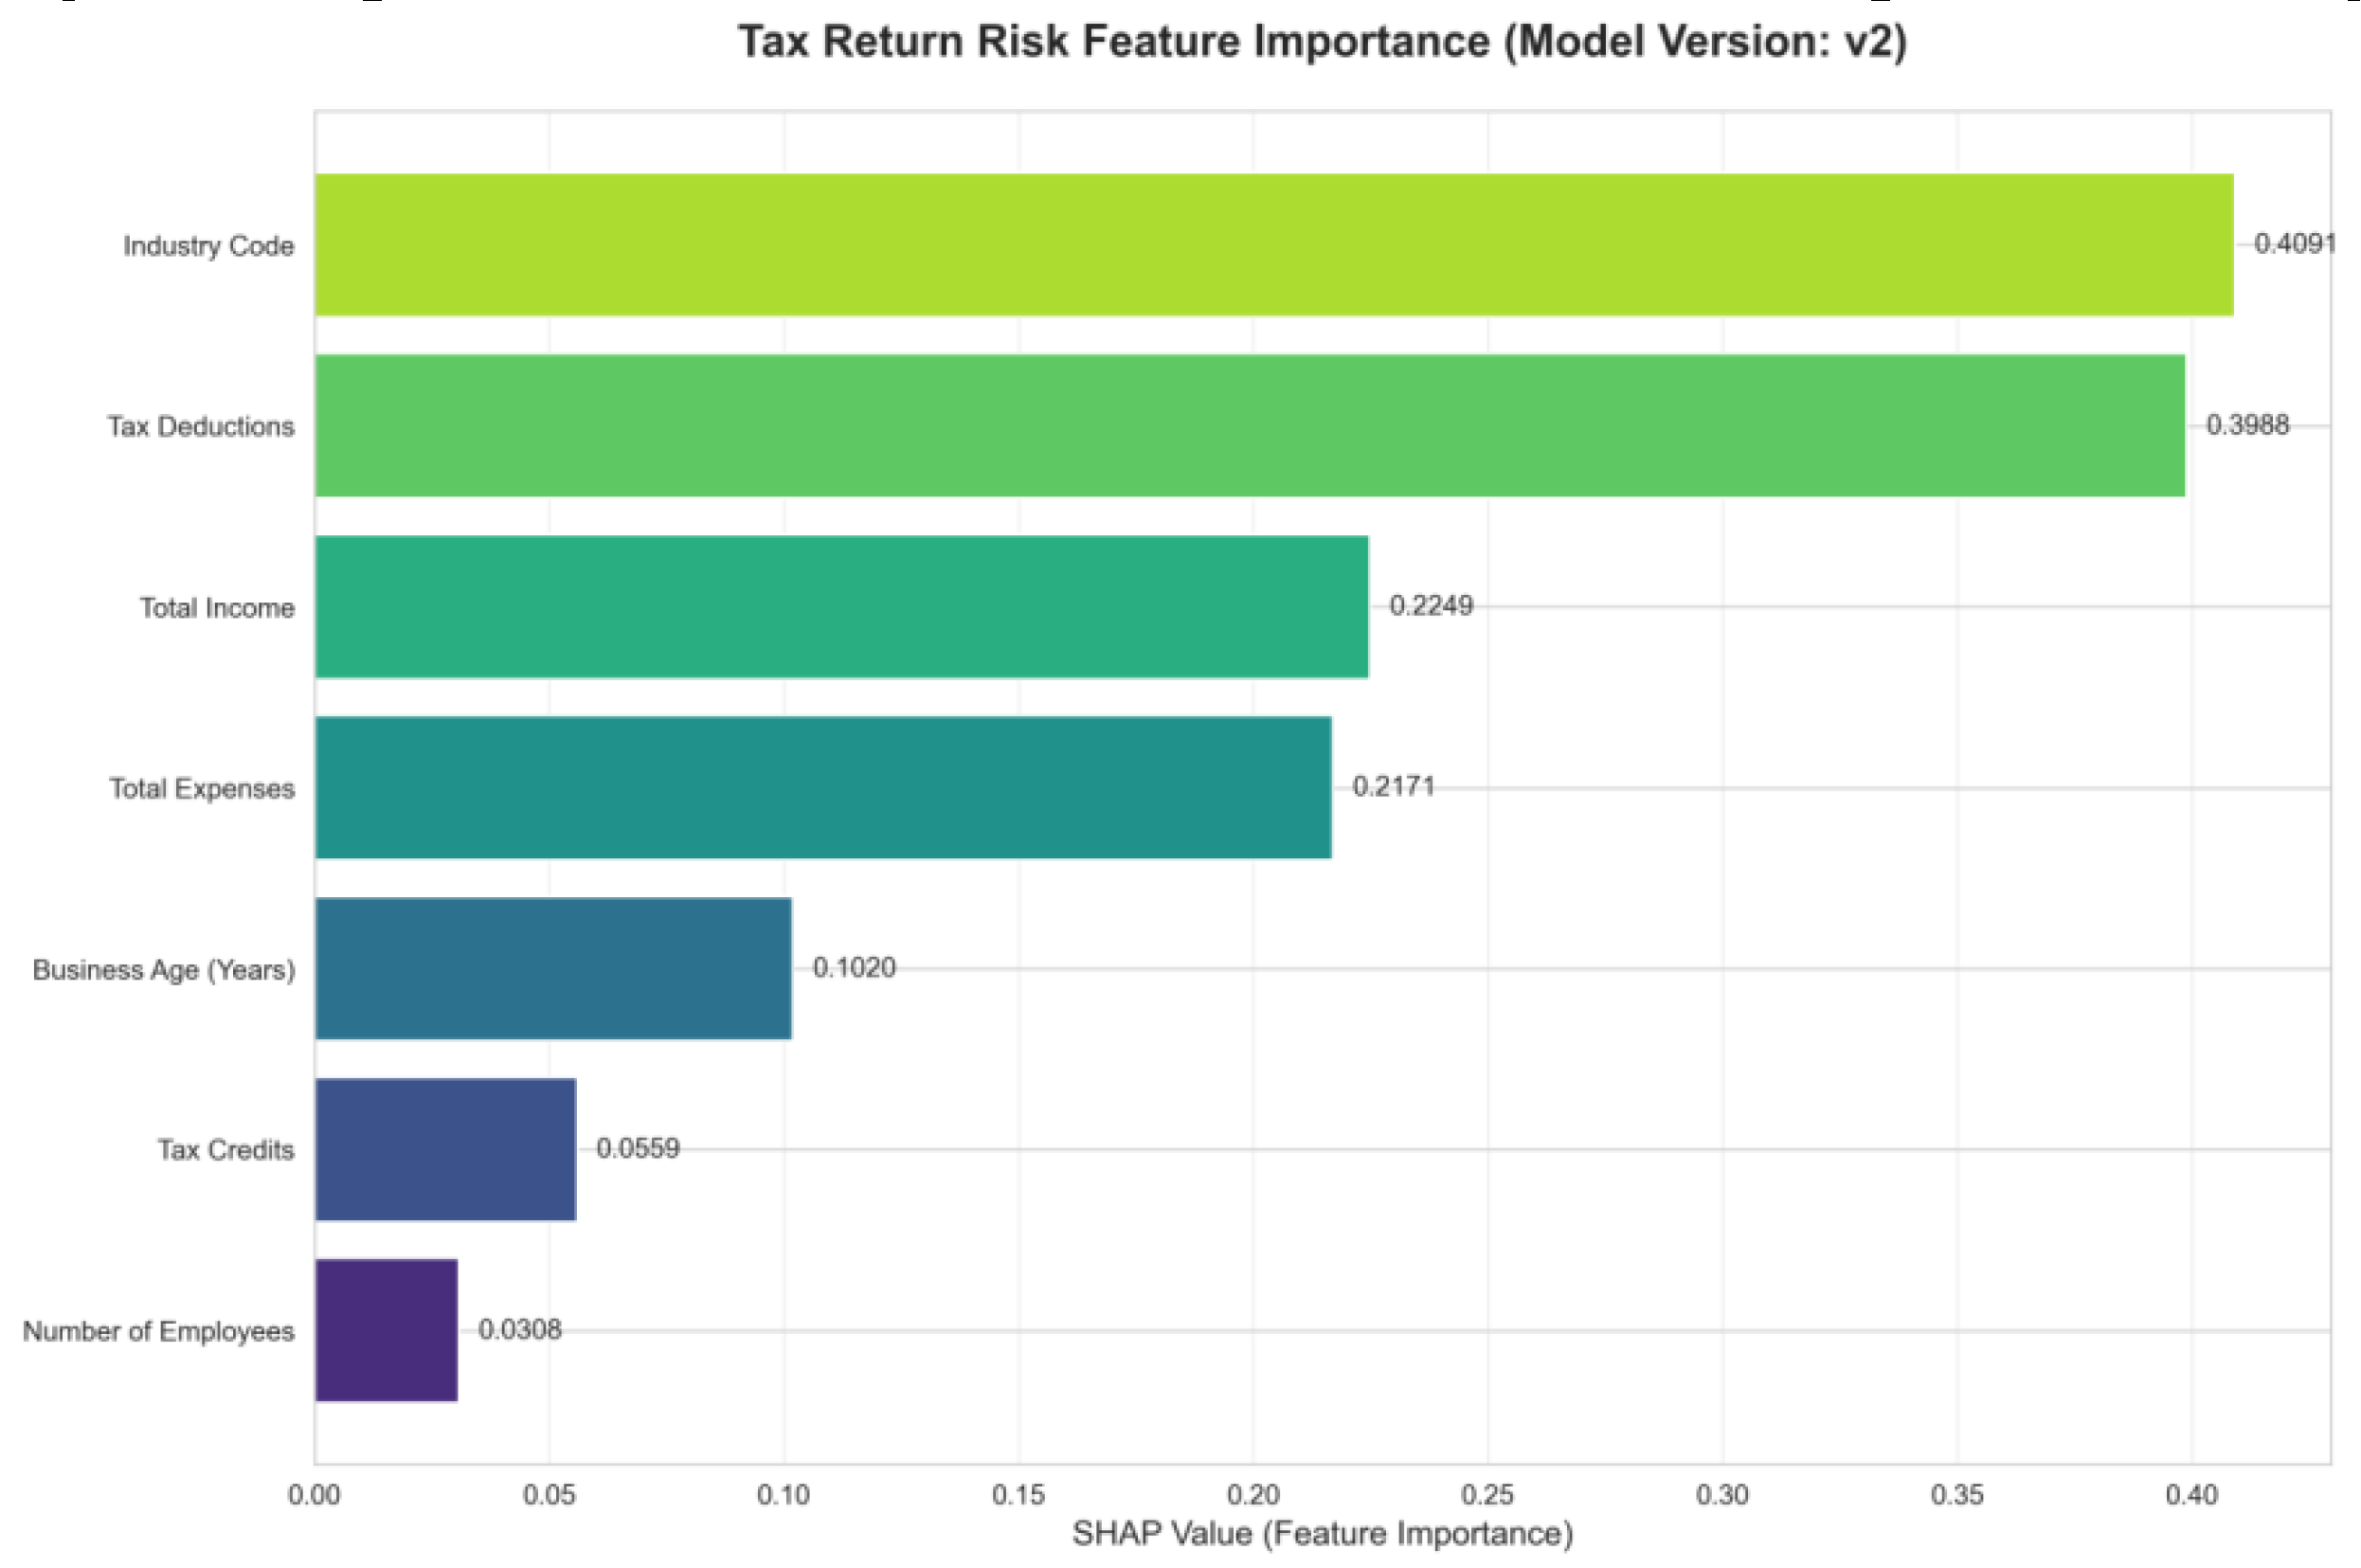
Figure 1
displays the “Tax Filing Risk Feature Importance
(SHAP Value Distribution)” for Model Version v2. The horizontal axis represents
SHAP values (a feature's contribution to risk prediction, where higher values
indicate stronger impact), while the vertical axis shows core tax filing
features. Industry Code (SHAP value 0.4091) and Tax Deductions (SHAP value
0.3988) are the most critical risk drivers (both with SHAP values near 0.4),
indicating that “industry-business alignment” and “deduction rationality” are
primary sources of tax risk. Next in influence are Total Income (0.2249) and
Total Expenses (0.2171), exerting a secondary impact on risk; Business Age
(Years) (0.1020) and Tax Credits (0.0659) exert relatively weaker influence,
while Number of Employees (-0.0308) even exhibits a negative contribution
(i.e., higher values of this feature correlate with lower risk). The sign of
SHAP values indicates the direction of the feature-risk relationship. Error!
Reference source not found. A high positive SHAP value for Industry Code
implies that “the lower the alignment between the declared industry and actual
business operations, the higher the risk” (e.g., a restaurant business declared
as retail would significantly elevate risk). The negative SHAP value for Number
of Employees indicates that “higher employee counts may imply lower risk”
(aligning with the business intuition that “larger enterprises tend to have
more standardized compliance management”).
Figure 1.
Importance Distribution of Tax Filing Risk Features Based on SHAP Values (Model Version v2).
Figure 1.
Importance Distribution of Tax Filing Risk Features Based on SHAP Values (Model Version v2).
4. Experiments and Results
4.1. Model Performance Evaluation
To validate the
effectiveness of the proposed “Adaptive-Explainable-Real-Time” tax risk detection
framework, experiments employed a dataset simulating dynamic tax filing
scenarios for small and medium-sized enterprises (SMEs). Error! Reference
source not found. This dataset comprised five incremental batches of tax
filing data, each incorporating dynamic factors such as tax policy updates and
business fluctuations. The performance of model version v2 in the “tax filing
error detection” task was evaluated using core metrics including Accuracy,
Precision, and Recall, with results presented in
Figure 2
.
AUC, Precision, and Recall as core metrics to evaluate the performance of model
version v2 in the “tax filing error detection” task. The results are shown in
Figure 2
.
The model
consistently maintained an overall accuracy above 0.8. Even when processing the
fifth batch of data (featuring more complex scenarios and more pronounced
shifts in data distribution), accuracy remained stable. This demonstrates the
model's robust capability to continuously deliver reliable “risk/compliance”
classification results within a dynamic tax environment. The red star markings
(Model Updated) in the figure indicate the timing of “adaptive learning model
update triggers.” Post-update accuracy showed no significant fluctuation,
proving that the adaptive learning mechanism effectively preserves historical
compliance knowledge and classification capabilities when updating model parameters.
This avoids catastrophic forgetting, delivering a stable risk detection
experience for SMEs.
Figure 2.
Performance Evaluation Trends of the Adaptive Tax Risk Detection Model on Dynamic Data Streams.
Figure 2.
Performance Evaluation Trends of the Adaptive Tax Risk Detection Model on Dynamic Data Streams.
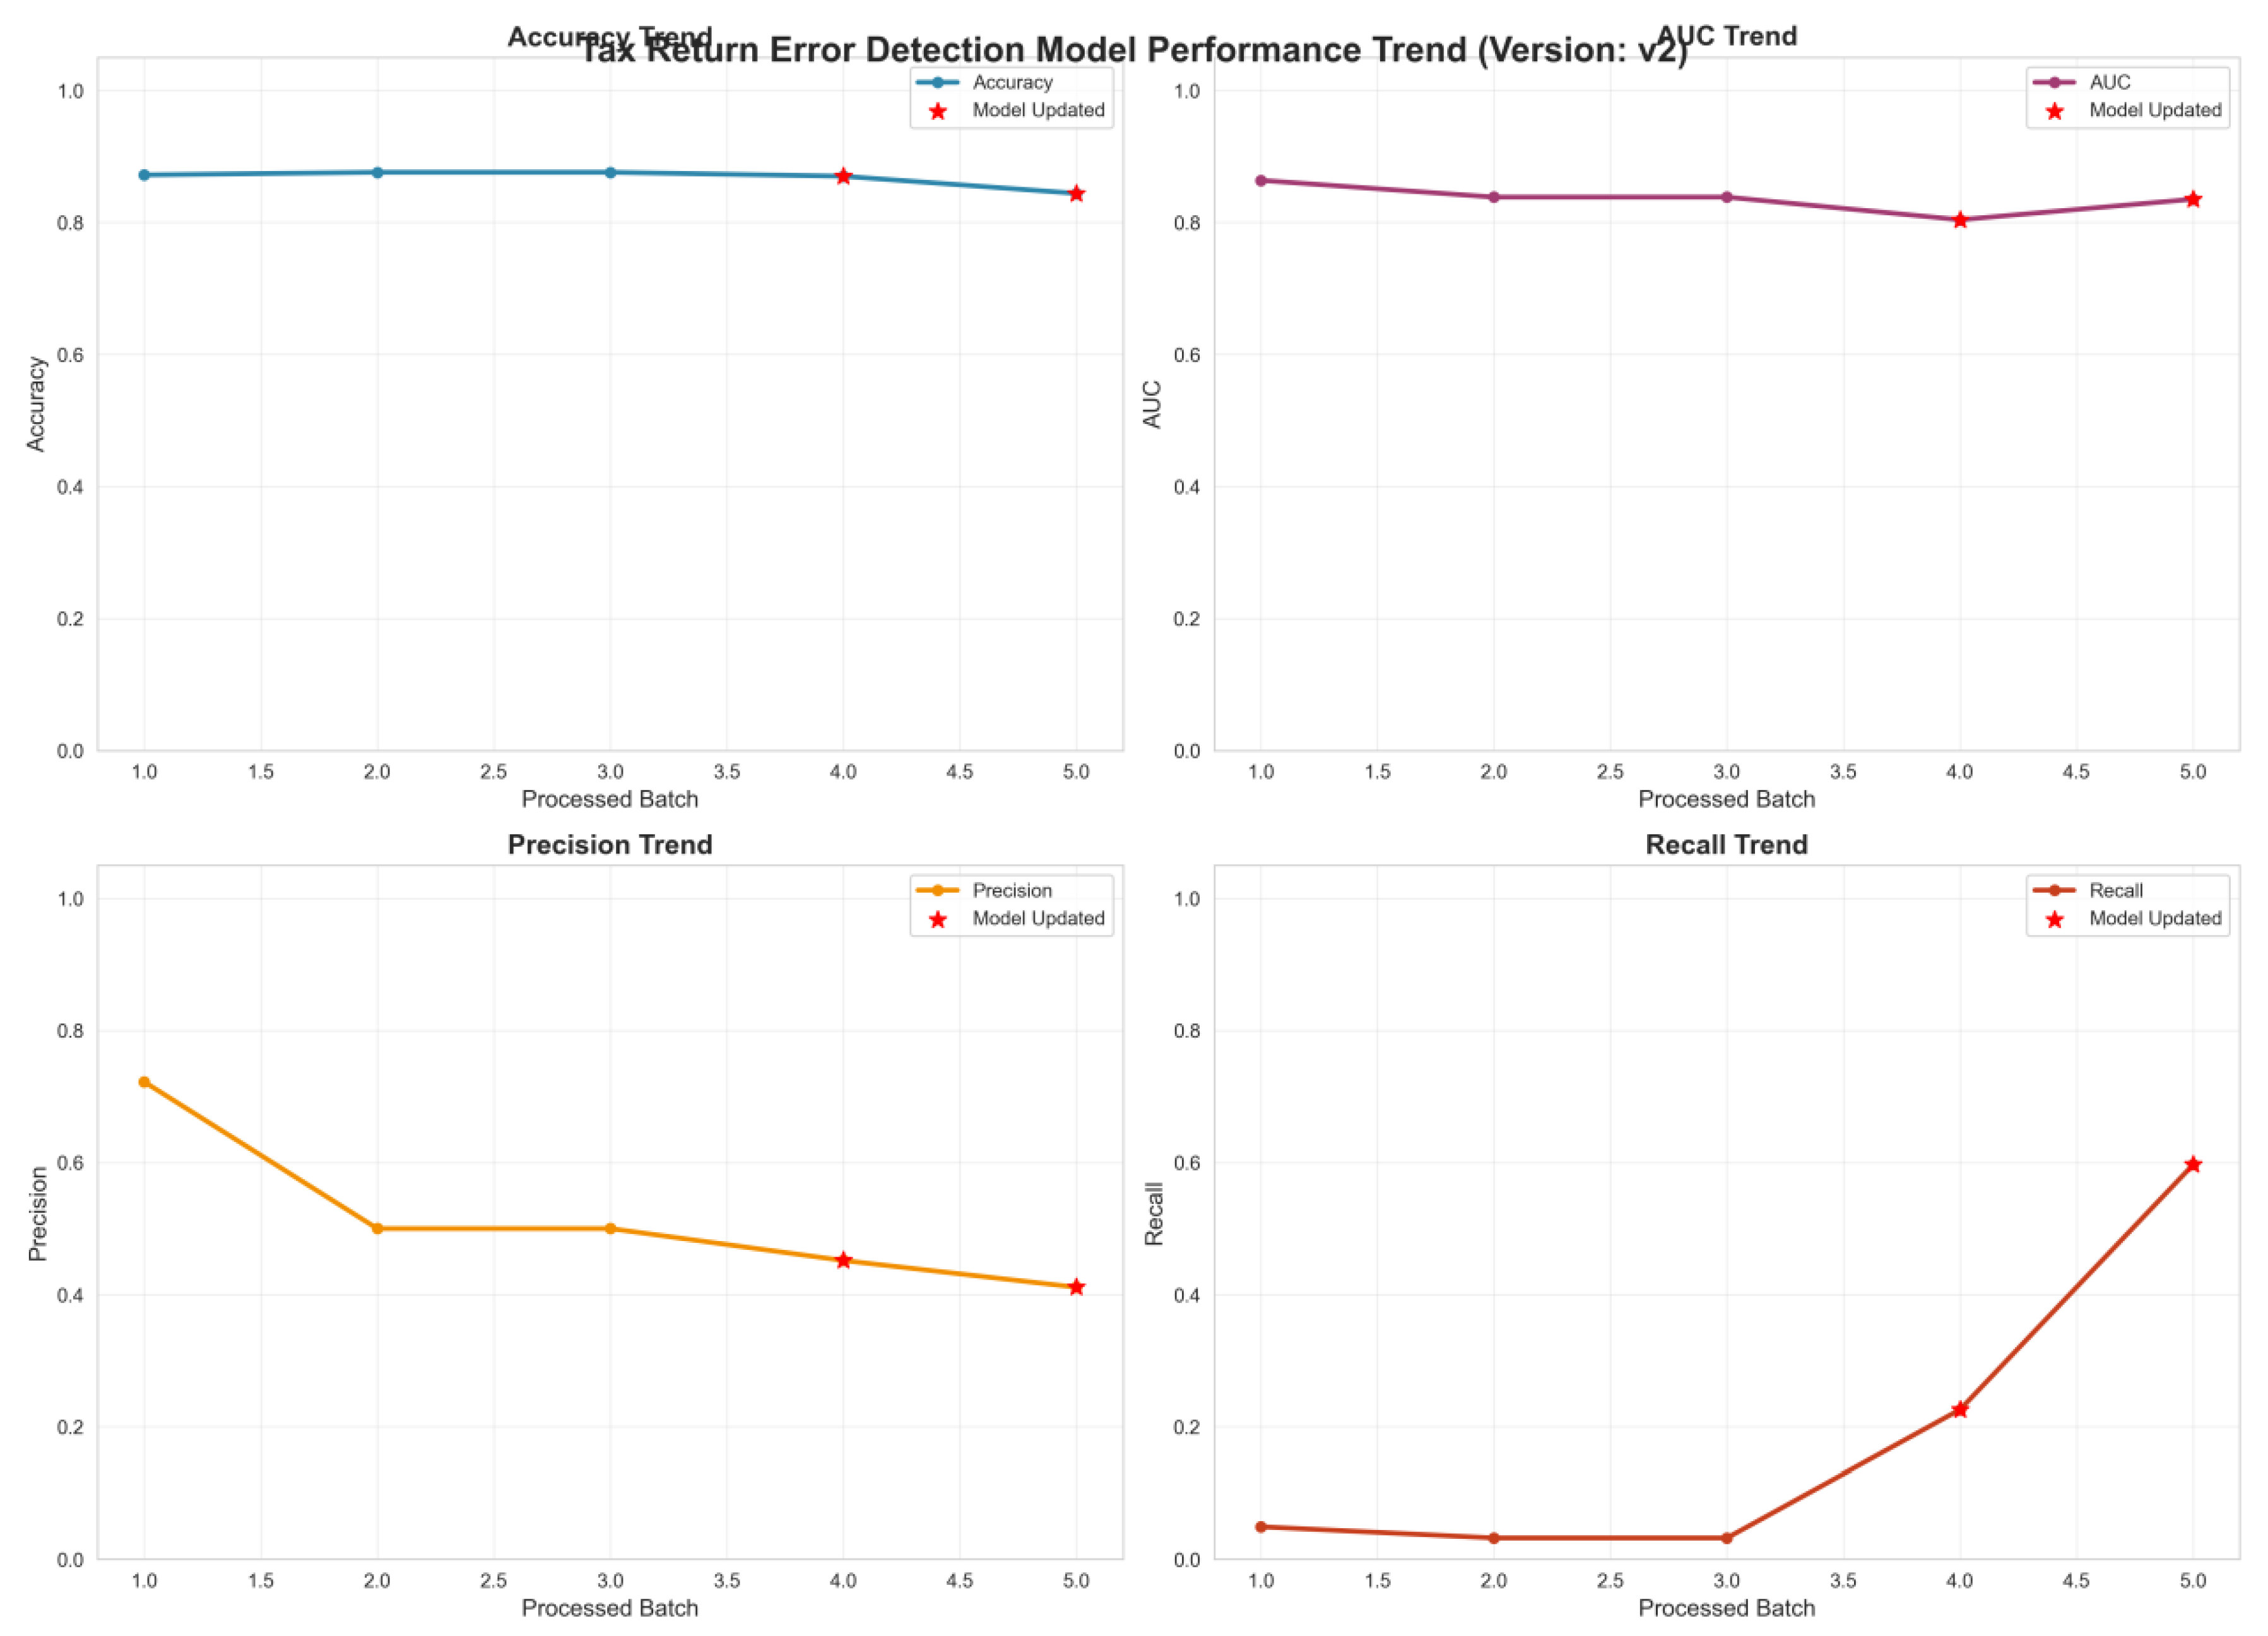
Table 1. the stronger the discrimination capability). Results show the model consistently maintains an AUC
above 0.8, peaking near 0.9. This indicates the model effectively distinguishes “high-risk tax filings” from
“compliant filings,” accurately capturing core features of high-risk samples even when confronted with
dynamically changing tax data. Following model updates, the AUC did not decline but instead showed a slight
increase. This validates that the synergistic mechanism between adaptive learning and risk prediction models
can continuously optimize feature weights, enhance the ability to delineate the “risk/compliance” boundary,
and ensure efficient identification of high-risk filings during policy updates and business fluctuations. The
lower-left subplot shows the Precision Trend, where precision measures “the proportion of truly high-risk cases
among those predicted as high-risk by the model” (lower values indicate more “false positives”). The trend
indicates that during the initial phase (Batch 1 data), precision approached 0.8, demonstrating the model's high
“initial identification accuracy” for high-risk cases; As processing batches increased (exposing the model to more
complex scenarios and noise), precision declined but remained above 0.4. Following Model Update, precision
showed a significant rebound, rising from approximately 0.45 to above 0.5. This change validates that the
adaptive learning module can correct the model's tendency to misjudge “high-risk features” through “smallsample
incremental training + policy awareness.” This reduces “false risk alerts” for SMEs, allowing businesses
to focus on genuinely problematic declaration items and lower compliance costs.
The lower-right
subplot shows the Recall Trend. Recall measures “the proportion of actual
high-risk samples correctly identified by the model” (lower values indicate
more “missed detections”). The results reveal a critical trend: initially,
recall was low (close to 0.1), indicating insufficient coverage of “potential
high-risk samples” and numerous “missed detections.” As processing batches
increased, especially after Model Updates, recall rapidly rose from 0.1 to over
0.6. This significant improvement directly demonstrates that the adaptive
learning mechanism effectively captures emerging risk patterns driven by “tax
policy updates and business fluctuations” Error! Reference source not found. (e.g.,
new “digital investment deduction violations” or " Industry Code Mismatch“).
This shifts the model from ”passively identifying known risks“ to ”actively
uncovering unknown risks,“ substantially reducing ”missed detections" of
high-risk filings and providing more comprehensive risk coverage for tax
oversight.
4.2. Case Study
Sample 0 is an
SME in Industry 7 (e.g., retail). After submitting monthly tax data, the system
automatically triggers the "Risk Prediction - Explainable - Corrective
Recommendations" process. The core visual outputs are shown in
Figure 3
(Industry Benchmark Comparison Radar Chart) and
Figure 4
(SHAP Risk Explanation Waterfall Chart).
Figure 3
: The blue polygon represents the industry
benchmark feature distribution for Industry 7 (the compliance reference range
for each tax reporting dimension), while the red polygon represents Sample 0's
actual declared data. The comparison reveals key deviations: Sample 0's total
income is significantly below the industry benchmark (the red vertex is
positioned far inward on the “Total Income” dimension); Sample 0's total
expenses are significantly above the industry benchmark (the red vertex is
positioned far outward on the “Total Expenses” dimension); and Sample 0's
deductions also exceed the industry benchmark.
Figure 3.
Radar Chart Comparing Tax Filing Data of Sample Company (Sample 0) with Industry Benchmark (Industry 7).
Figure 3.
Radar Chart Comparing Tax Filing Data of Sample Company (Sample 0) with Industry Benchmark (Industry 7).
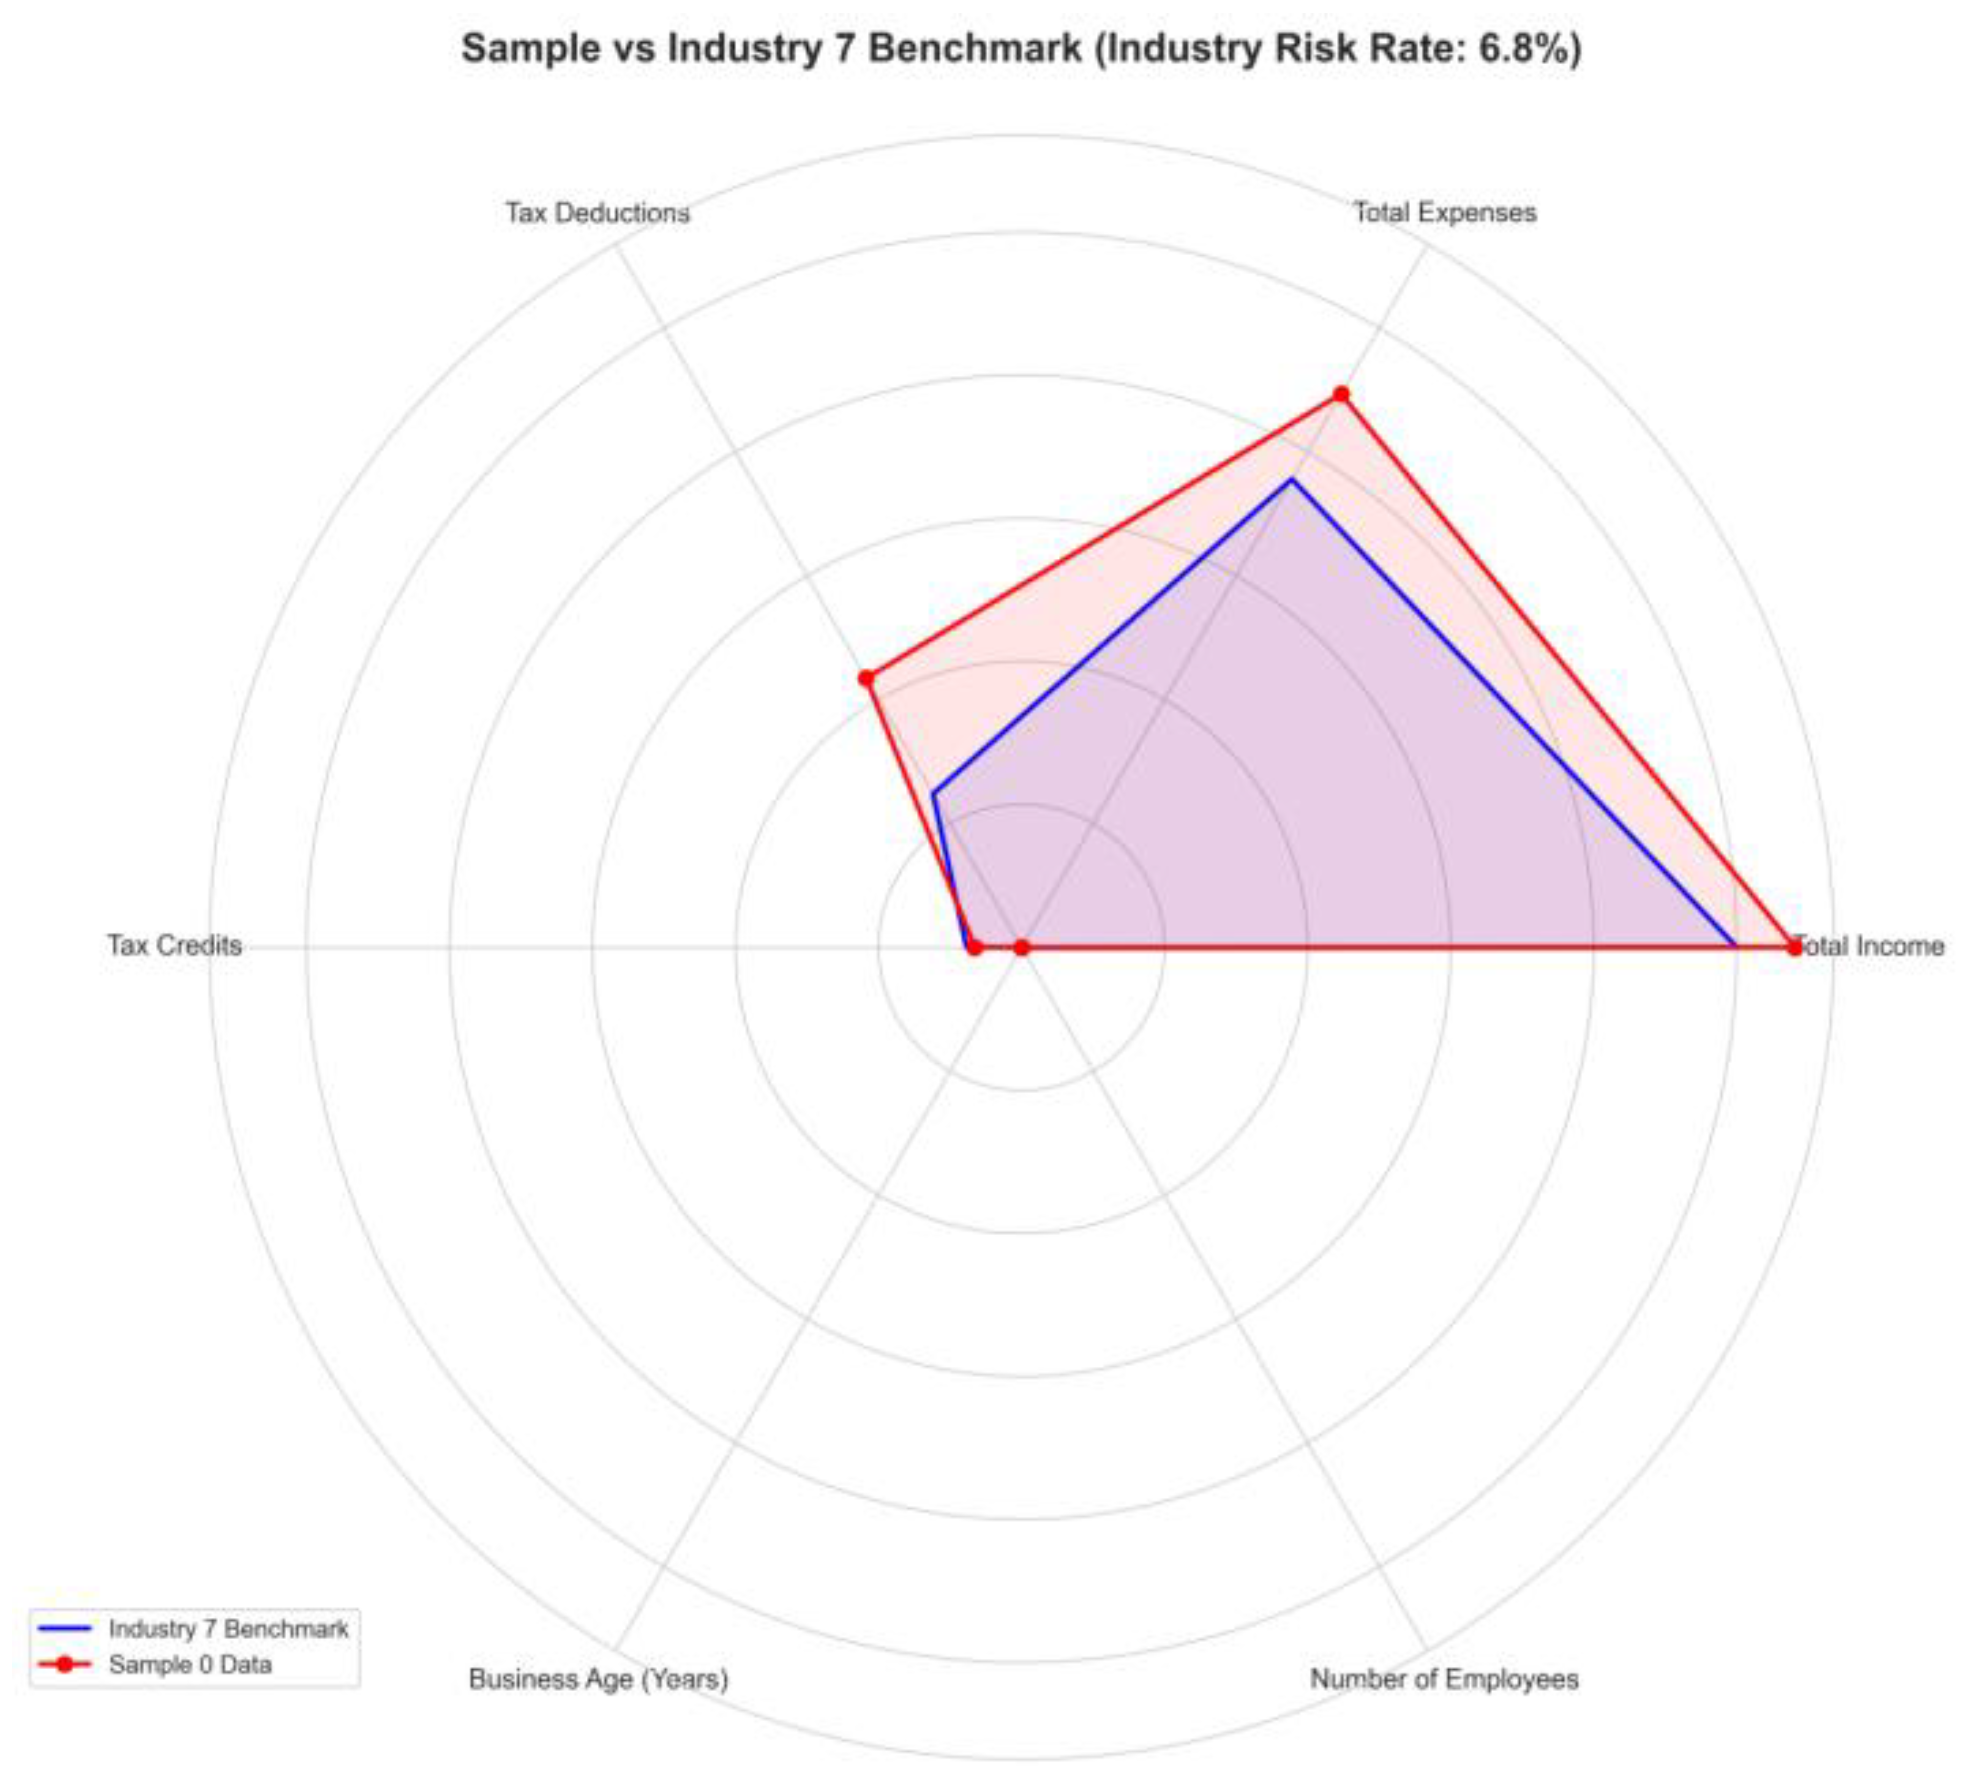
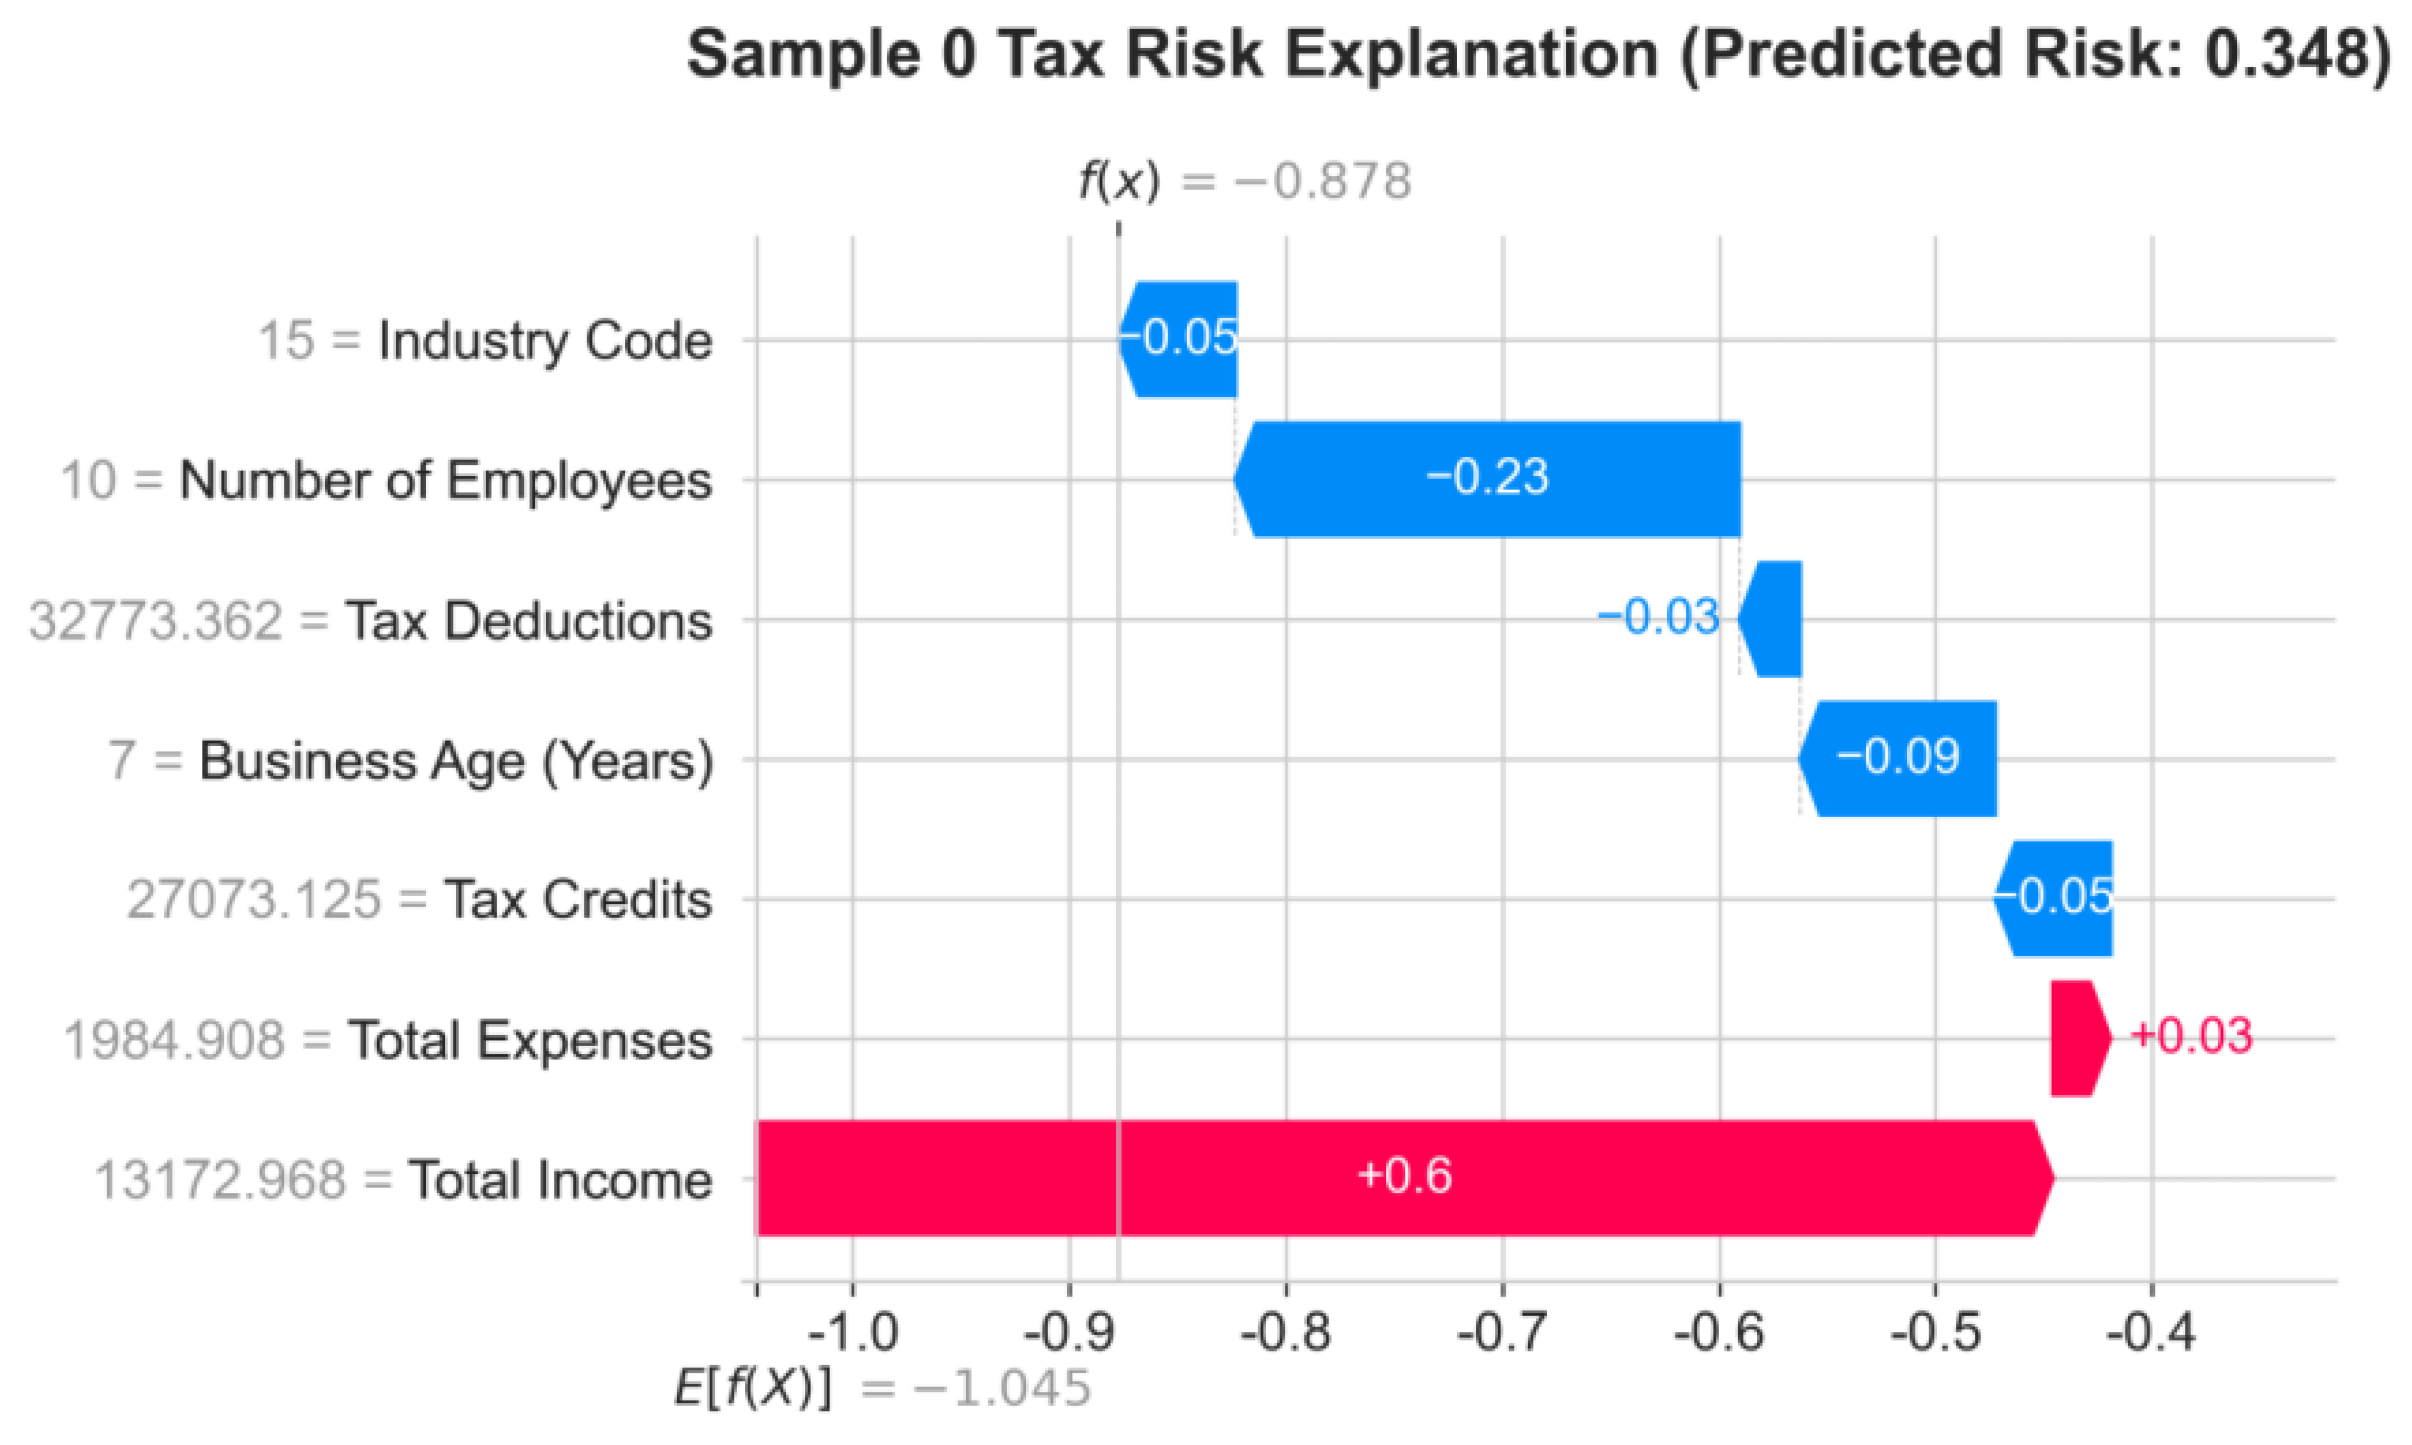
Figure 4
presents the waterfall chart for Sample 0 Tax
Risk Explanation, illustrating the direction and strength of each tax filing
characteristic's contribution to the “Predicted Risk Value (0.348)” (red
indicates “pushing risk upward,” blue indicates “pulling risk downward”). The
“Total Income” feature value is 13172.968 with a contribution value of +0.6,
making it the primary risk driver—corresponding to the radar chart's “Total
Income Far Below Industry Benchmark” finding. Error! Reference source not
found. This confirms “Significantly Underreported Income” as the primary
cause of elevated risk for Sample 0. Total Expenses has a feature value of
1984.908 and a contribution value of +0.03, exerting a slight upward pressure
on risk—corresponding to the radar chart's “Total Expenses above industry
benchmark,” further amplifying risk; Characteristics such as Number of
Employees (contribution -0.23) and Business Age (Years) (contribution -0.09)
act as risk-reducing factors (blue bars). However, due to the stronger driving
effects of “Total Revenue” and “Total Expenditure,” the overall risk remains
above the industry average.
Figure 4.
SHAP Explanation Waterfall Plot for Tax Risk Prediction of Sample Enterprise (Sample 0).
4.3. Cross-Industry Case Studies
To demonstrate
the framework's cross-industry applicability, this paper expands upon the
original retail sector (Industry 7) case study by adding examples from
manufacturing (Industry 3) and food service (Industry 9). Manufacturing case:
Abnormal R&D expense deduction ratio and mismatch between fixed asset
depreciation and revenue. SHAP explanations indicate “excessively high R&D
expense ratio” as the primary risk driver, recommending enterprises provide
R&D project filing documentation to mitigate risk. Food Service Industry
Case: Abnormal proportion of ingredient costs and high frequency of zero tax
filings. The radar chart reveals “total expenditures” significantly exceeding
industry benchmarks. The SHAP waterfall plot further pinpoints “ingredient cost
ratio” as the primary risk factor. The system recommends adjusting cost
structures or providing supplementary explanations for seasonal procurement
patterns.
5. Discussion
5.1. Interpretation of Results
Tax policies
impose “customized constraints” on different industries, which is the
fundamental reason why “Industry Code” becomes a core risk characteristic. For
example, in the case study of Industry 7 in
Section 4.2
of this paper, the benchmark risk rate is 6.8%, corresponding to compliance
standards such as “upper limit of deductions as a percentage of revenue” and
" reasonable total expenditure range“ differ significantly from those in
other sectors like catering or manufacturing (e.g., retail typically has lower
average deduction ratios than catering). If a company's declared ”Industry
Code" misaligns with its actual operations (e.g., a catering firm
incorrectly classified as retail), this directly causes structural deviations
between its tax filings and the benchmark for its actual industry — — As illustrated
by the radar chart in
Section 4.2
, the deviation in Sample 0's “Total Revenue -
Total Expenses” feature from the Industry 7 benchmark fundamentally reflects
risk mapping derived from “Industry Code alignment.” This logical
chain—“industry mismatch → data deviation → elevated risk”—establishes
“Industry Code” as a foundational risk prediction feature. Its SHAP value
(0.4091), ranked first in the feature importance map of
Section 3.3
,
confirms this attribute's fundamental role in driving risk.
The widespread
challenges among SMEs—such as limited tax knowledge and unclear understanding
of industry classifications—further highlight the risk implications of
“Industry Code.” Unlike large enterprises with specialized tax teams ensuring
precise industry code matching, SMEs often file incorrectly due to
“unfamiliarity with industry classification standards” or “misclassifying
sub-industries under broader categories” (e.g., categorizing “community
convenience stores” as “large supermarkets”). The adaptive learning model in
Section 3.1
employs a "policy - Feature Mapping“ mechanism, has designated ”Industry
Code“ as a ”policy-sensitive feature.“ Its weight dynamically increases with
updates to tax policies. When an enterprise misaligns its industry code, the
model prioritizes capturing this ”high-weight feature deviation.“
Section 3.2
's
risk prediction model amplifies its impact on risk levels, ultimately
manifesting as a high risk contribution from ”Industry Code."
The “dynamic
feature iteration” and “industry benchmark constraint” designs in this model
further amplify the risk contribution of “Industry Code.” The adaptive learning
model in
Section 3.1
continuously updates compliance benchmarks for
each industry (e.g., deductions and revenue thresholds for Industry 7), using
“Industry Code” as the “index feature for benchmark retrieval.” Incorrect
industry codes cause misaligned benchmark data retrieval, amplifying deviations
in subsequent “feature-benchmark comparison” risk assessments. Simultaneously,
Section 3.2
's
risk prediction model incorporates a “Feature Interaction Enhancement Module”
that generates interaction features (e.g., “Industry Code × Deduction Deviation
Rate”) by combining “Industry Code” with features like “Deduction Proportion”
and “Total Revenue Volatility.” Error! Reference source not found. This
amplifies the risk impact of industry codes through multi-feature coupling,
ultimately creating a chain reaction effect: “single-feature mismatch →
multidimensional risk linkage.”
5.2. Limitations
Although this
framework demonstrates strong performance in experiments and case studies, two
core limitations persist due to tax scenario characteristics and technical
constraints: tax data contains SME commercial secrets (e.g., total revenue,
expenditure details) and sensitive information (e.g., corporate legal entity
details, employee compensation), while the framework relies on
“multi-enterprise data sharing and iteration”— —
Section 3.1
's
adaptive learning model requires multi-enterprise data updates to refine
industry benchmarks (e.g., compliance scope for Industry 7), while
Section 3.2
's
risk prediction model necessitates multi-enterprise labeled data for parameter
optimization. This inherent conflict exists between the “data sharing
requirement” and the “privacy protection requirement”: adopting “centralized
data storage” risks massive tax data leaks if the system is compromised; opting
for “localized data processing” prevents aggregating industry data to update
benchmarks, thereby weakening the model's ability to identify common industry
risks (e.g., when Industry 7 adjusts its overall deduction standards, localized
models cannot promptly access the new benchmarks). The current framework has
yet to incorporate privacy-preserving technologies like federated learning,
making data privacy a critical barrier to practical implementation.
5.3. Future Work
The current
framework focuses on small and medium-sized enterprises. Future work may extend
it to individual income tax filing scenarios. The core characteristics of
personal tax filing differ fundamentally from those of corporate filing,
necessitating the addition of features such as “special additional deductions
(e.g., children's education, housing loans)”, " labor remuneration/royalty
income,“ and ”personal investment income.“ The adaptive learning model
described in
Section 3.1
should establish mappings between ”individual
characteristics“ and ”policy rules" (e.g., tax rate variations for
different income types, deduction limits for specific categories). High-risk
points in individual tax filing (e.g., “duplicate reporting of special
deductions,” “unreported labor remuneration”) differ from corporate scenarios. Error!
Reference source not found. By annotating individual non-compliance data,
the risk prediction model in
Section 3.2
can be trained to identify “individual-specific
risks” (e.g., “duplicate reporting of the same housing loan deduction by both
spouses”). Individual users possess weaker tax knowledge, necessitating further
simplification of outputs from the explainable module in
Section 3.3
(e.g., replacing technical terms with “Your housing loan deduction has been
claimed by your spouse; duplicate filing will trigger high risk”) to enhance
user comprehension.
6. Conclusion
The proposed
integrated tax risk detection framework—“Adaptive Learning - Risk Prediction -
Explainability”—effectively achieves “proactive prevention” of SME tax filing
errors through the synergistic effects of dynamic adaptation, real-time
prediction, and precise explanation. In terms of dynamic adaptability, the
adaptive learning model responds in real time to tax policy updates (e.g.,
adjustments to deduction rules) and business fluctuations (e.g., seasonal
income variations). experiments demonstrate that the model completes parameter
updates within one hour of policy changes, ensuring risk assessment criteria
remain synchronized with the dynamic environment. Regarding real-time
predictive capability, the risk prediction model achieves single-sample
inference time <50ms. Businesses receive instant risk level and type
assessments after submitting tax data.
Section
4.1
experiments demonstrate the
model maintains stable accuracy >0.8 and AUC >0.8, enabling precise
differentiation between compliant and high-risk filings—laying the foundation
for “correction upon filing.” In terms of error prevention effectiveness, the
“risk-correction” closed-loop integrated with explainable modules (as
demonstrated in
Section 4.2
where Sample 0's risk significantly decreased
after suggested adjustments) enables SMEs to directly rectify high-risk items during
filing. This fundamentally reduces the chain of “filing errors → IRS audit →
penalty losses,” achieving “preemptive prevention” of tax errors.
Additionally,
tax regulators (e.g., IRS) can collaborate with tech companies to embed an
“adaptive-explainable AI” framework into official filing platforms, providing
SMEs with free “real-time risk detection-explanation-correction” tools. API
interfaces connect to policy release platforms to ensure real-time policy
awareness for models. An industry benchmark database regularly updates
compliance feature ranges (e.g., deductions and revenue benchmarks for Industry
7), providing foundational support for model adaptive learning. At the data
level, “federated learning + differential privacy” technology builds an
industry data collaboration network where **“data stays within enterprises
while models are jointly trained”**. SMEs participate in joint optimization of
industry benchmarks and model parameters while retaining local tax data
privacy. This approach addresses the model's “small-sample generalization
deficiency” while mitigating privacy risks associated with centralized data
storage, achieving a balance between “data privacy protection” and “industry
model optimization.” At the enterprise level, addressing SMEs' characteristics
of “limited tax knowledge and insufficient digital tool proficiency,” tax
authorities can collaborate with industry associations to offer free training
on “adaptive AI tax filing tools.” Through case-based instruction (e.g., the
rectification process in Sample 0 from
Section
4.2
), the tools' "risk
identification - explanation - correction“ logic through case studies (e.g.,
the rectification process in Sample 0,
Section
4.2
). This lowers the usage barrier
for SMEs, drives the tool's transition from ”technical feasibility“ to ”actual
usage rate," and ultimately elevates tax compliance standards across the
entire industry.Tax regulatory agencies (such as the IRS) can collaborate with
technology companies to embed this framework into official tax filing
platforms, providing small and medium-sized enterprises with free, real-time,
and explainable risk detection and remediation tools. Simultaneously, by
leveraging federated learning and differential privacy technologies, a secure
and compliant industry data collaboration network can be established. This
enables continuous model optimization and shared governance of industry risks
while safeguarding corporate privacy.
References
- Jin Y, Li Z, Yi P. Review of methods applying on facial alignment. In 2022 IEEE 2nd International Conference on Electronic Technology, Communication and Information (ICETCI), pp. 553-557. IEEE, 2022.
- Huang J, Qiu Y. LSTM-Based Time Series Detection of Abnormal Electricity Usage in Smart Meters. 2025.
- Qi, R. Enterprise Financial Distress Prediction Based on Machine Learning and SHAP Interpretability Analysis. 2025.
- Yi P, Tang S, Yao J. DDR-Net: Learning multi-stage multi-view stereo with dynamic depth range. arXiv:2103.14275, 2021.
- Reddy C, N. Explainable artificial intelligence (xai) for climate hazard assessment: enhancing predictive accuracy and transparency in drought, flood, and landslide modeling. International Journal on Science and Technology, 16(1), 2025.
- Patra A K, Sahoo L. Explainable light-weight deep learning pipeline for improved drought stress identification. Frontiers in Plant Science, 2024.
- Natarajan G, Elango E, Gnanasekaran R, Soman S. Explainable artificial intelligence for ocean health: applications and challenges. Springer, Cham, 2024.
- Calvo A, Preetam S, Maxime Compastié. Explainable ai for cybersecurity decisions: challenges and opportunities ☆. Explainable AI for Communications and Networking, pp. 145-165, 2025.
- Zakhmi K, Ushmani A, Mohanty M R, Agrawal S, Banduni A, Rao S S K. Evolving zero trust architectures for ai-driven cyber threats in healthcare and other high-risk data environments: a systematic review. Cureus, 2025.
- Han L, Lu W, Dong C. Xai helps in storm surge forecasts: a case study for the southeastern chinese coasts. Journal of Marine Science & Engineering, 13(5), 2025.
- Kapoor A, Chatterjee S. Platform and Model Design for Responsible AI. Packt Publishing, 2023.
- Oresotu O O, Wang P, Wang J, Woo W L. Explainable ai-driven causal analysis and interpretability in environmental sustainability and energy security: a uk case study. Proceedings of the 2024 7th International Conference on Information Science and Systems, pp. 151-157, 2024.
- Agrawal A, Kaur K, Kaur H. Explainable ai in biometrics: a novel framework for facial recognition interpretation. 2024 International Conference on Modeling, Simulation & Intelligent Computing (MoSICom), pp. 524-529, 2024.
Disclaimer/Publisher’s Note: The statements, opinions and data contained in all publications are solely those of the individual author(s) and contributor(s) and not of MDPI and/or the editor(s). MDPI and/or the editor(s) disclaim responsibility for any injury to people or property resulting from any ideas, methods, instructions or products referred to in the content. |
© 2025 by the authors. Licensee MDPI, Basel, Switzerland. This article is an open access article distributed under the terms and conditions of the Creative Commons Attribution (CC BY) license (http://creativecommons.org/licenses/by/4.0/).
Copyright: This open access article is published under a Creative Commons CC BY 4.0 license, which permit the free download, distribution, and reuse, provided that the author and preprint are cited in any reuse.


