
Submitted:
25 February 2025
Posted:
25 February 2025
You are already at the latest version
Abstract
The financial sector operates on a delicate balance of continuous cash flows between firms and customers, inherently exposing itself to credit risk. Effec- tive and precise credit risk assessment is paramount for maintaining finan- cial stability and mitigating potential losses. Leveraging the rapid advance- ments in artificial intelligence (AI) and machine learning (ML), this study proposes an automated, real-time credit risk evaluation framework. Utiliz- ing the World Bank Global Findex dataset, encompassing transactional data from 123 countries, the research focuses on extracting and analyzing financial features critical for risk prediction. A suite of machine learning algorithms, including Support Vector Machines (SVM), Logistic Regression, and Decision Trees, is implemented to model credit risk. These models achieve remarkable performance, with accuracy reaching 99% and an F1-score of 1.00, underscor- ing their robustness in identifying at-risk profiles. Interpretability is ensured using Explainable AI (XAI) tools, highlighting key financial features such as debit card usage, mobile banking adoption, and deposit patterns as the most influential predictors of credit risk. This study emphasizes the integration of domain expertise with ML models, advocating for a human-in-the-loop approach to ensure reliability and trust in automated systems. By focus- ing on model interpretability and transparency, the proposed solution aligns with regulatory requirements and enhances decision-making processes in the financial sector. This work highlights the transformative potential of AI in credit risk management, offering a scalable, data-driven framework for global financial institutions.
Keywords:
Automated Credit Risk Assessment (ACRA)
; Explainable AI(XAI)
; Predictive Performance
; Human in he loop decision making
; Finance Technology (FinTech)
; Findex dataset
1. Introduction
The financial sector is pivotal to a country’s growth and development Attigeri et al. (2019). Institutions such as banks and insurance companies directly manage the rotation of money, making cash flow their central business model. However, this inherently introduces credit risk, which is present in the finance industry. Types of credit risks include default risk, institutional risk, and concentration risk, among others. Non-recovery or partial recovery of loans negatively impacts a bank’s balance sheet and income statement, reducing interest income, increasing provisions for non-performing assets (NPAs), escalating capital requirements, and ultimately lowering profits. These challenges have led to the deterioration of asset quality, particularly in public sector financial institutions Kadanda and Raj (2018). Consequently, rising NPAs are a significant concern, and identifying their determinants before loans turn into NPAs is critical Bawa et al. (2018). Therefore, a systematic approach to identifying, understanding, and assessing key risk parameters is essential for the early prediction of default behavior Attigeri et al. (2019). Evaluating risks proactively will ensure the safe and efficient operation of financial institutions.
With advancements in technology, including the widespread adoption of AI and ML, efforts have been made to automate this process. Numerous studies have developed machine learning-based models for achieving high accuracy in predicting NPAs and identifying potential credit risks by analyzing key financial parameters Chow (2017); Yao and Li (2022). However, many of these models function as black boxes, offering little to no interpretability regarding how predictions are made. This lack of transparency raises challenges in understanding and trusting the results, particularly in high-stake financial decision-making.
This study proposes a machine learning-based solution to address credit risk assessment in the financial sector. It not only offers a data-driven approach to tackling credit risk but also emphasizes the importance of model interpretability. By integrating domain knowledge and human expertise with the predictions generated by machine learning models, this study ensures that these insights are both actionable and trustworthy. Using the Word Bank Global Findex datasetDemirgu¨¸c-Kunt and Klapper (2012), which covers data from 123 countries, this research prepares a dataset for machine learning applications, followed by training classification models using the preprocessed data. The project evaluates the predictive performance and testing accuracies of various machine learning models to identify the most effective approaches. A key focus of this research is the interpretability of these classification models. By examining how the models process data and generate predictions, the study highlights the critical role of domain knowledge and the integration of human-in-the-loop decision-making in credit risk assessment within the financial sector. This emphasis on interpretability aims to bridge the gap between complex machine learning algorithms and actionable insights, ensuring transparency, reliability, and trust in predictive systems. The human-in-the-loop solution enhances trust and authenticity in predictive systems by combining machine-generated insights with human expertiseBussmann et al. (2020). The specific objectives of this study on applying interpretability methods in credit risk assessment in finance are as follows:
- To identify the most effective interpretability methods for credit risk assessment in finance, striking an optimal balance between interpretability and predictive accuracy.
- To explore how trade-offs between interpretability and accuracy vary across different credit risk assessment tasks in finance.
- To examine the role of domain knowledge in enhancing the interpretability of credit risk assessment models in financial contexts.
- To develop a robust framework for integrating human-in-the-loop decisionmaking into credit risk assessment workflows using interpretable models.
By addressing these objectives, this study seeks to advance the field of credit risk assessment by fostering greater transparency, reliability, and collaboration between machine learning systems and human decision-makers.
The research questions this research aims to answer are:
- What are the most effective interpretability methods for credit risk assessment in finance, in terms of balancing interpretability and accuracy?
- How do the interpretability and accuracy trade-offs differ across different credit risk assessment tasks in finance?
- How does domain knowledge impact the interpretability of credit risk assessment models in finance?
- How can human-in-the-loop decision making be effectively incorporated into credit risk assessment using interpretable models in finance?
2. Literature Review
Credit risk management and risk prediction are critical tasks for financial institutions such as banks. Leveraging AI and ML for these tasks introduces a modern and efficient approach to enhancing predictive security against credit risks. However, a major challenge in using AI and ML for automating banking processes is the lack of interpretability and explainability in these systems. Humans have a tendency to look for “Why” every time they experience an unexpected “What” Molnar (2022). For machine learning models to be trusted, particularly in the financial sector, they must provide clear reasoning for their predictions. While interpretability may not be essential for all ML applications, it is crucial in finance, where the decisions made by these systems have direct and significant impacts on people’s lives. Therefore, ensuring transparency and interpretability in AI-driven credit risk assessment systems is vital for building trust and accountability.
2.1. An Overview of Interpretability Methods
ML models are increasingly used to solve real-world problems, but their predictions and actions must be accurate, unbiased, and aligned with ethical standards Molnar (2022). For instance, an ML model designed to automate credit application approvals might unintentionally discriminate against historically marginalized groups. While the goal is to minimize loan defaults, fairness must also be maintained. Bias in predictions often stems from incomplete problem formulation, and in such cases, interpretability becomes crucial to understanding and improving model behavior.
Interpretability methods for ML models can be categorized based on their outcomes, such as feature summary statistics, visualizations, model internals (e.g., learned weights), data points, and intrinsically interpretable models Molnar (2022). These methods also include model-specific tools, limited to certain model types, and model-agnostic tools, applicable to any model after training.
In finance, where AI-powered systems influence critical decisions, transparency is vital. Arrieta et al. (2019) emphasizes that as black-box ML models are deployed in sensitive areas like finance and healthcare, stakeholders demand explanations for predictions. When developing an ML model, the consideration of interpretability as an additional design driver can improve its implementation ability for 3 reasons Arrieta et al. (2019):
- Interpretability helps ensure impartiality in decision making, enabling detection and consequently correction from bias in the training dataset. • Interpretability facilitates the provision of robustness by highlighting potential adversarial perturbations that could change the prediction. • Interpretability can act as an insurance validating meaningful variables for inferring output, i.e., guaranteeing that an underlying truthful causality exists in model reasoning.
Emmert-Streib et al. (2020) defines explainable AI as the ability to understand the internal decisions leading to an external outcome, with goals such as trustworthiness, fairness, and privacy awareness. In sectors such as finance, where ML predictions directly affect human lives, explainability fosters confidence and ensures ethical decision-making, addressing key concerns for stakeholders.
2.2. Interpretability in Context of Finance
Despite the accessibility of advanced ML models today, implementing systems for real-world financial applications remains challenging due to their lack of transparency and explainability—key factors for establishing trust in credit risk management systems Misheva et al. (2021); Bussmann et al. (2020). Since ML models generate decisions based on data-driven algorithms, it is often difficult to trace the steps leading to a decision. This creates significant hurdles in verifying whether the outcomes are justifiable Bussmann et al. (2020). Consequently, it is essential to provide explanations for model outputs and improve understanding of these systems to ensure they are reliable.
Interpretability and explainability are therefore vital components of ML models used in credit risk management. According to Misheva et al. (2021), interpretability refers to the extent to which cause-and-effect relationships can be observed within a system. It focuses on understanding the mechanics of the model without necessarily delving into the underlying reasons. In contrast, explainability emphasizes describing the internal workings of ML/AI systems in human terms, enabling users to grasp not only how decisions are made but also why they occur. Balancing these two aspects is critical for fostering trust and advancing the application of state-of-the-art ML models in the finance sector.
Demajo et al. (2020) discusses the growing achievements in AI and the surge of enthusiasm in financial technology, particularly focusing on the application of ML and AI in credit scoring and other financial processes. Credit scoring models powered by ML are decision-making tools that help lenders evaluate whether to approve loan applications based on the likelihood of the applicant fulfilling their financial obligations Demajo et al. (2020). These models offer significant benefits, such as reducing loan processing times, enabling loan officers to focus on specific cases, minimizing human subjectivity, lowering costs, and decreasing default risks.
Despite their advantages, these predictive models, often considered ”blackbox” methods, present a challenge: the lack of transparency in their decisionmaking process. As a result, financial experts are unlikely to trust model predictions without adequate justification Demajo et al. (2020). This has led to the emergence of XAI, a field aimed at demystifying black-box models to enhance understanding of the reasoning behind their predictions.
However, XAI in finance presents unique challenges, such as determining the intended audience for explanations (experts or users), identifying the best representation format for explanations, and developing robust methods to evaluate their effectiveness Demajo et al. (2020). To address these challenges, Demajo et al. (2020) highlight the importance of applicationgrounded analysis in evaluating XAI models. This involves engaging domain experts to assess the accuracy and quality of explanations by performing real-world tasks. For example, in credit scoring, loan officers—who possess deep knowledge of loan requirements and banking regulations—are considered key experts for evaluating model explanations. Building on this, these models serve as intelligent systems that automate financial processes and predictions, streamlining operations and enhancing efficiency. Developing predictive models for financial applications involves training classification models, such as Decision Trees and Deep Learning algorithms, to accurately assess risks and make informed decisions. The following section delves into the existing literature on the use of Deep Learning and Decision Tree models for credit risk assessment, highlighting the challenges associated with their training, implementation, and integration into financial systems.
2.3. Deep Learning and Decision Trees Model for Credit Risk Assessment
The financial sector generates and processes vast amounts of data due to the high volume of financial transactions, making it intrinsically linked to big data. Advances in big data technologies, coupled with improved data availability and computational power, have prompted many banks and lending institutions to modernize their business models to remain competitive Addo et al. (2018).
According to Addo et al. (2018), effective credit risk prediction, monitoring, model reliability, and streamlined loan processing are essential for transparent and informed decision-making in the sector. Through a study utilizing real-world data, they present a binary classification approach leveraging machine learning and deep learning models. Their findings reveal that tree-based models demonstrate greater stability compared to multilayer artificial neural network models, highlighting their suitability for financial applications where consistency and reliability are paramount. The integration of technology and big data in the financial sector has enabled the development of predictive models to automate loan processing and credit risk assessments. In their research, Addo et al. (2018) employ regression models such as Linear, Logistic, and Multinomial regression, each with specific parameters, stopping criteria, and activation functions. Additionally, they utilise classification models like Random Forest and Gradient Boosting. They also explore deep learning approaches, emphasising the use of multilayer neural networks. The study presents four architectures: convolutional neural networks (CNNs), recurrent neural networks (RNNs), recursive neural networks, and standard deep neural networks. Each of these models featured unique parameters and architectures. The study evaluates model performance using metrics such as AUC and RMSE, as summarized in Table 1 found below.
Chow (2017) highlights the growing adoption of machine learning in the corporate sector, noting that over 40% of large corporations are already leveraging it to enhance their marketing strategies. These companies attribute approximately 38% of their sales growth to machine learning and, remarkably, 76% believe that it will play a pivotal role in driving their future sales performance.
Machine learning offers a wide range of applications in business, extending beyond targeted sales and market segmentation to include inventory optimization through demand forecasting, personalized customer service, and customer segmentation, among others, including its critical role in the finance sector Chow (2017); Bello (2023). Focusing on credit risk analysis, Chow (2017) highlights the increasing reliance on machine learning models, particularly as more companies expand internationally to capitalize on global resources. He cautions that a multinational corporate bankruptcy could significantly disrupt the global financial ecosystem. Machine learning has gained prominence in big data analytics due to its ability to learn complex patterns and relationships in data Zhou et al. (2017). Techniques such as support vector machines, adaptive boosting, artificial neural networks, and Gaussian processes are particularly effective at uncovering patterns that might elude human analysts Chow (2017); Bello (2023). Jacky’s study demonstrates that machine learning models can achieve prediction accuracies exceeding 95% when incorporating informative features, such as expert assessments. However, he notes that relying solely on financial factors to predict corporate bankruptcy yields weaker correlations. To improve predictive accuracy, additional features are needed to better represent the data, but this creates a high-dimensional problem. With limited data available from publicly listed companies, the “curse of dimensionality” arises, where flexible non-linear models risk over-fitting to training samples and fail to generalize to unseen dataCrespo Ma´rquez (2022); Aremu et al. (2020). This challenge highlights the importance of balancing model complexity and feature selection for effective credit risk assessment Chow (2017); Crespo Ma´rquez (2022).
In their study on credit scoring using machine learning, specifically the Gradient Boosting method, Yao and Li (2022) highlight that credit scoring is a vital tool for banks and lending institutions to effectively manage borrowers’ credit risk. Machine learning algorithms have significantly advanced the automated and accurate classification of borrowers into ”good” or ”bad” categories. Among these, Random Forest, Decision Tree, and Gradient Boosting have emerged as the leading ensemble methods for precise credit scoring in the financial sector. Yao and Li (2022) enhance their model by combining the strengths of bagging ensemble training strategies and boosting ensemble optimization patterns, thereby improving the diversity and performance of the base learners. Their findings are further supported by a graph (Figure 1) visualizing the average ranking of credit scoring models based on the Nemenyi test Nemenyi (1963), illustrating the effectiveness of their approach.
The existing literature on credit risk assessment highlights significant efforts to use customer financial data for automating loan approval or rejection processes in financial institutions. Many researchers have explored the application of AI and machine learning models, showcasing their potential in the finance sector while also identifying challenges in deploying these systems in such a sensitive domainBuckley et al. (2021). While interpretability and explainability have been acknowledged as critical factors by some authors, few studies have thoroughly addressed these challenges in the context of financial technology. Additionally, the integration of human judgment into the prediction and decision-making processes, known as the human-the-loop approach, remains an under-explored area in credit risk assessment researchBuckley et al. (2021). The present study proposes a novel approach to credit risk assessment using machine learning techniques that not only enhance the interpretability and explainability of black-box models but also incorporate human-in-the-loop decision-making to address these gaps.
3. Methodology
The dataset used in this study is the World Bank “Global Findex 2021”, dataset Demirgu¨¸c-Kunt and Klapper (2012). This dataset contains survey responses on demographic, income, and finance from customers in 123 countries. This dataset is used for analysis and training the machine learning model for credit risk assessment. It covers the data pre-processing steps and their rationale, followed by an analysis of the data, including graphs that illustrate the relationships between features and their relevance to the prediction model. Originally containing 127 variables, the dataset was refined by handling null values and removing duplicate columns, leaving the independent features listed below with their descriptions and data types.
3.1. Data Pre-Processing
After addressing the null values, the dataset was complete with 127 columns and no missing data. These columns included customer demographic information, such as country, gender, age, employment status, and rural/urban living area, as well as financial data such as ever saved money, ever borrowed money, has a mobile and internet connection, and has an account. The remaining features were survey responses provided by customers. Many of these responses were repetitive, leading to multiple similar columns. To determine which columns to retain, we conducted exploratory data analysis and visualized the distribution of related features, comparing responses to identify the most informative feature to keep. The list of features analyzed is shown below in Figure 2.
The first graph in Figure 2 illustrates the number of customers with an account at a financial institution; the second shows those with a mobile money account; and the third combines both groups, showing customers who have either or both types of accounts. Since the third feature encompasses the information in the first two, the account fin and account mob columns were dropped, leaving only the combined account feature.
In Figure 3, the first graph displays the distribution of the borrowed feature, representing customers who have ever borrowed money from a financial institution, family, friends, or for medical purposes. The second graph shows fin20 (customers who borrowed for medical reasons), the third shows fin22a (customers who borrowed from a financial institution), and the fourth shows fin22b (those who borrowed from family or friends). Since borrowed captures all these scenarios, we kept this column and dropped fin20, fin22a, and fin22b.
In Figure 4, we analyze the saved column. The first graph shows the number of customers who have ever saved money in any form. The second graph represents the fin16 column, showing customers who saved for old age. The third graph corresponds to fin17a, indicating customers who saved using an account, while the fourth graph shows fin17b, representing customers who saved through informal methods. According to the World Bank’s feature descriptions, the saved column combines the information from fin16, fin17a, and fin17b. As a result, we retained the saved column and removed the other three.
This approach was applied to other sets of duplicate features, where we kept the feature that provided the most comprehensive information and removed the redundant ones. The groups of duplicate features analyzed are as follows:
- receive wages, fin32
- receive transfers, fin37
- receive pension, fin38
- receive agriculture, fin42
- pay utilities, fin30
- • anydigpayment, merchantpay dig, fin14 1, fin14a, fin14a1, fin14b
From these groups, one feature was retained while the others were dropped. The features retained in the dataset are listed in Table 2 and Table 3. Continuing with the analysis, we graphed the number of customers with mobile phones and internet connections.
Figure 6 shows graphs for customers who have a credit card, have used it, and paid their credit card bill on time. The relevant features for this information are fin7, fin8a, and fin8b.
The responses to most questions in the questionnaire are formatted as follows:
- 0 = It was a null cell in the raw dataset
(fin7, fin8a, fin8b).
- 1 = Yes
- 2 = No
- 3 = I do not know
- 4 = Refuse to answer
Some features, such as fin24, have a slightly different response format:
- 1 = Respondent’s main source of emergency funds is savings
- 2 = Family, relatives, or friends
- 3 = Money from working
- 4 = Borrowing from a bank, employer, or private lender
- 5 = Sale of assets
- 6 = Some other source
(fin7, fin8a, fin8b).
- 7 = Could not come up with the money
- 8 = Don’t know
- 9 = Refused to answer
After removing duplicate columns by analyzing customer distribution, the dataset was reduced from 127 to 80 features. Next, extended features, such as fin11a, fin11b, fin11c, etc., were combined into a single feature. Using Spearman correlation, features with a correlation coefficient greater than 0.85 were identified and combined, resulting in five new features (see Figure 8).
Principal Component Analysis (PCA) further reduced the dataset to 34 features. The economycode feature was encoded using binary encoding, reducing the dataset to 40 numerical features. Finally, k-means clustering classified records as 0 (negative credit risk) or 1 (positive credit risk). Figure 9 shows the classification results, with 66.66% classified as ”not risky” and 33.33% as ”risky.”
Results
This section presents the results of the research, including the performance of machine learning models trained to predict credit risk based on financial features. It also includes the accuracy of these models, along with the outcomes from explainable AI techniques for interpreting the black-box models.
Machine Learning Models
This research paper aims to provide a machine learning-based solution for credit risk assessment, automating the prediction process for finance. The first research question addresses the most effective interpretability methods for credit risk assessment, balancing interpretability and accuracy. To determine the best interpretability method, we first train and develop prediction models to extract insights. The machine learning models trained on the preprocessed data include Support Vector Machine (SVM), Logistic Regression, and Decision Tree ClassifierMahesh (2020); Das and Behera (2017). These models are used for binary classification to assess credit risk, based on a set of features derived from the financial history and survey responses of customers. The dataset is split into independent (X) and dependent (Y ) variables, and further divided into training and testing sets using a 70/30 split for model training and testing.
The classification models are evaluated on their test accuracy, which is provided in Table 4. These trained models are crucial for automating the process of assessing credit risk for financial institutions.
The SVM classifier is a supervised machine learning algorithm used for both classification and regression tasks Mahesh (2020); Das and Behera (2017). In this research, SVM is applied to a binary classification problem, with the goal of creating the optimal decision boundary to separate ndimensional space into distinct classesMahesh (2020). For the test dataset, the F1-scores for the SVM model are 1.00 for both classes, indicating perfect classification performance. The precision and recall values for both classes are also recorded as 1.00. The confusion matrix and classification report for the SVM model’s predictions on the test dataset are shown in Table 4.
The machine learning model used for predicting credit risk using the World Bank data is logistic regressionMahesh (2020); Das and Behera (2017); Choudhary and Gianey (2017). Logistic regression is a supervised machine learning technique commonly used for classification tasks Choudhary and Gianey (2017). It is a statistical method that analyzes datasets with multiple independent variables to determine the outcome. The purpose of using logistic regression in this research is to find the best-fitting model that describes the relationship between the independent and dependent features in the dataset. The dataset contains 39 independent features and 1 dependent feature, with the 39 independent features used to predict the outcome through the logistic regression model.
Similar to the SVM model, the classification report for the Logistic Regression model shows F1-scores of 1.00 for both classes. The precision and recall values for both classes are also 1.00. The confusion matrix and classification report for Logistic Regression, along with those for SVM, are presented in Table 4. Given that this is a binary classification problem, the third machine learning model used is the Decision Tree Classifier. The accuracy of the Decision Tree model on the test dataset was recorded at 98.21%. The classification report for the Decision Tree model shows an F1-score of 0.99 for class ”0” and 0.97 for class ”1,” with corresponding precision and recall values of 0.99 and 0.97, respectively. The confusion matrix and classification report for the Decision Tree predictions are also provided in Table 4. Bottom of Form
4. Interpretability and Explainability of ML Models
After training the machine learning model we need to understand the processing of these machine learning models to find the model which performs the predictions most effectively. This also answers the first research question for finding the most efficient interpretability method for credit risk assessment in finance. There are multiple interpretability methods present which can be used to understand the black – box machine learning models. The interpretability method used in this research project is the Shapley Value (SHAP) to understand how the machine learning models process the input data to formulate and deliver the outputLundberg and Lee (2017).
Figure 10.
Shap Bar plot (i) and Heatmap (ii) for SVM algorithm.
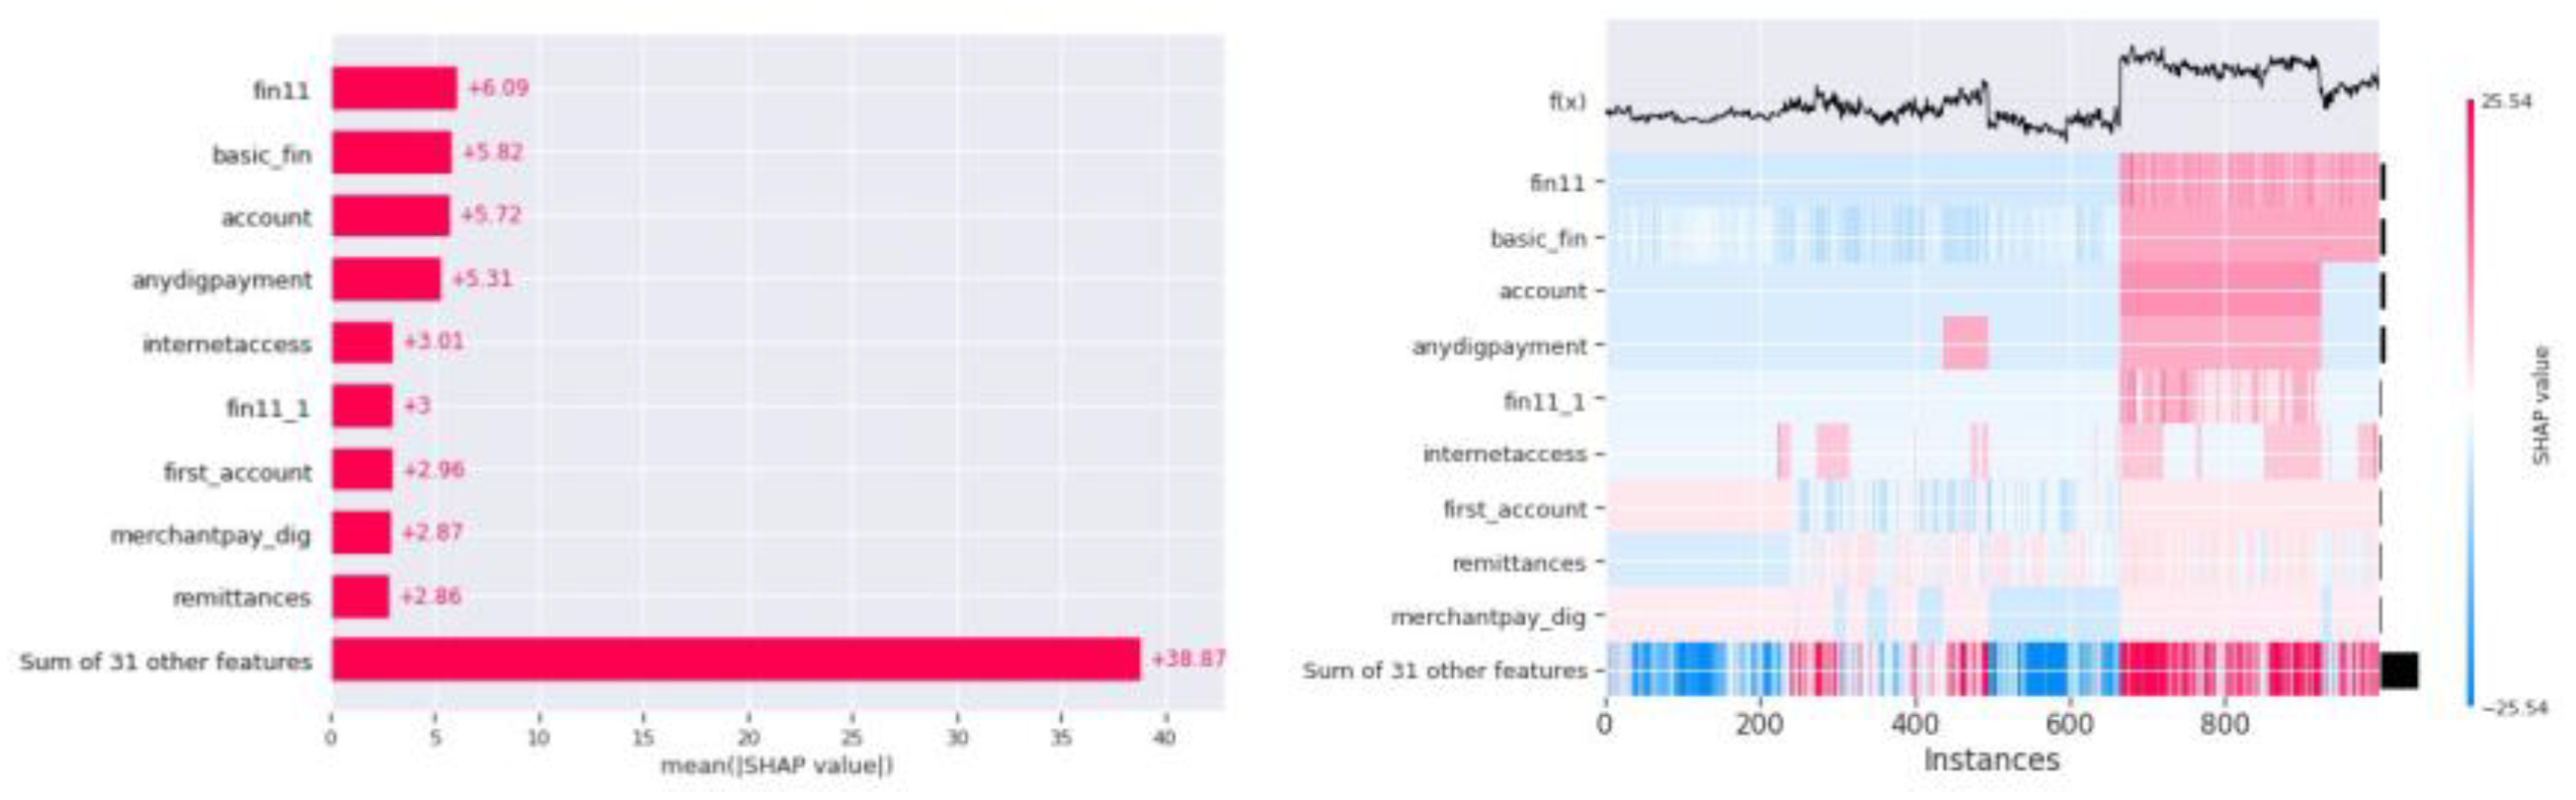
Figure 11.
Shap Waterfall plot (i, ii) and Summary plot (iii) for SVM algorithm.
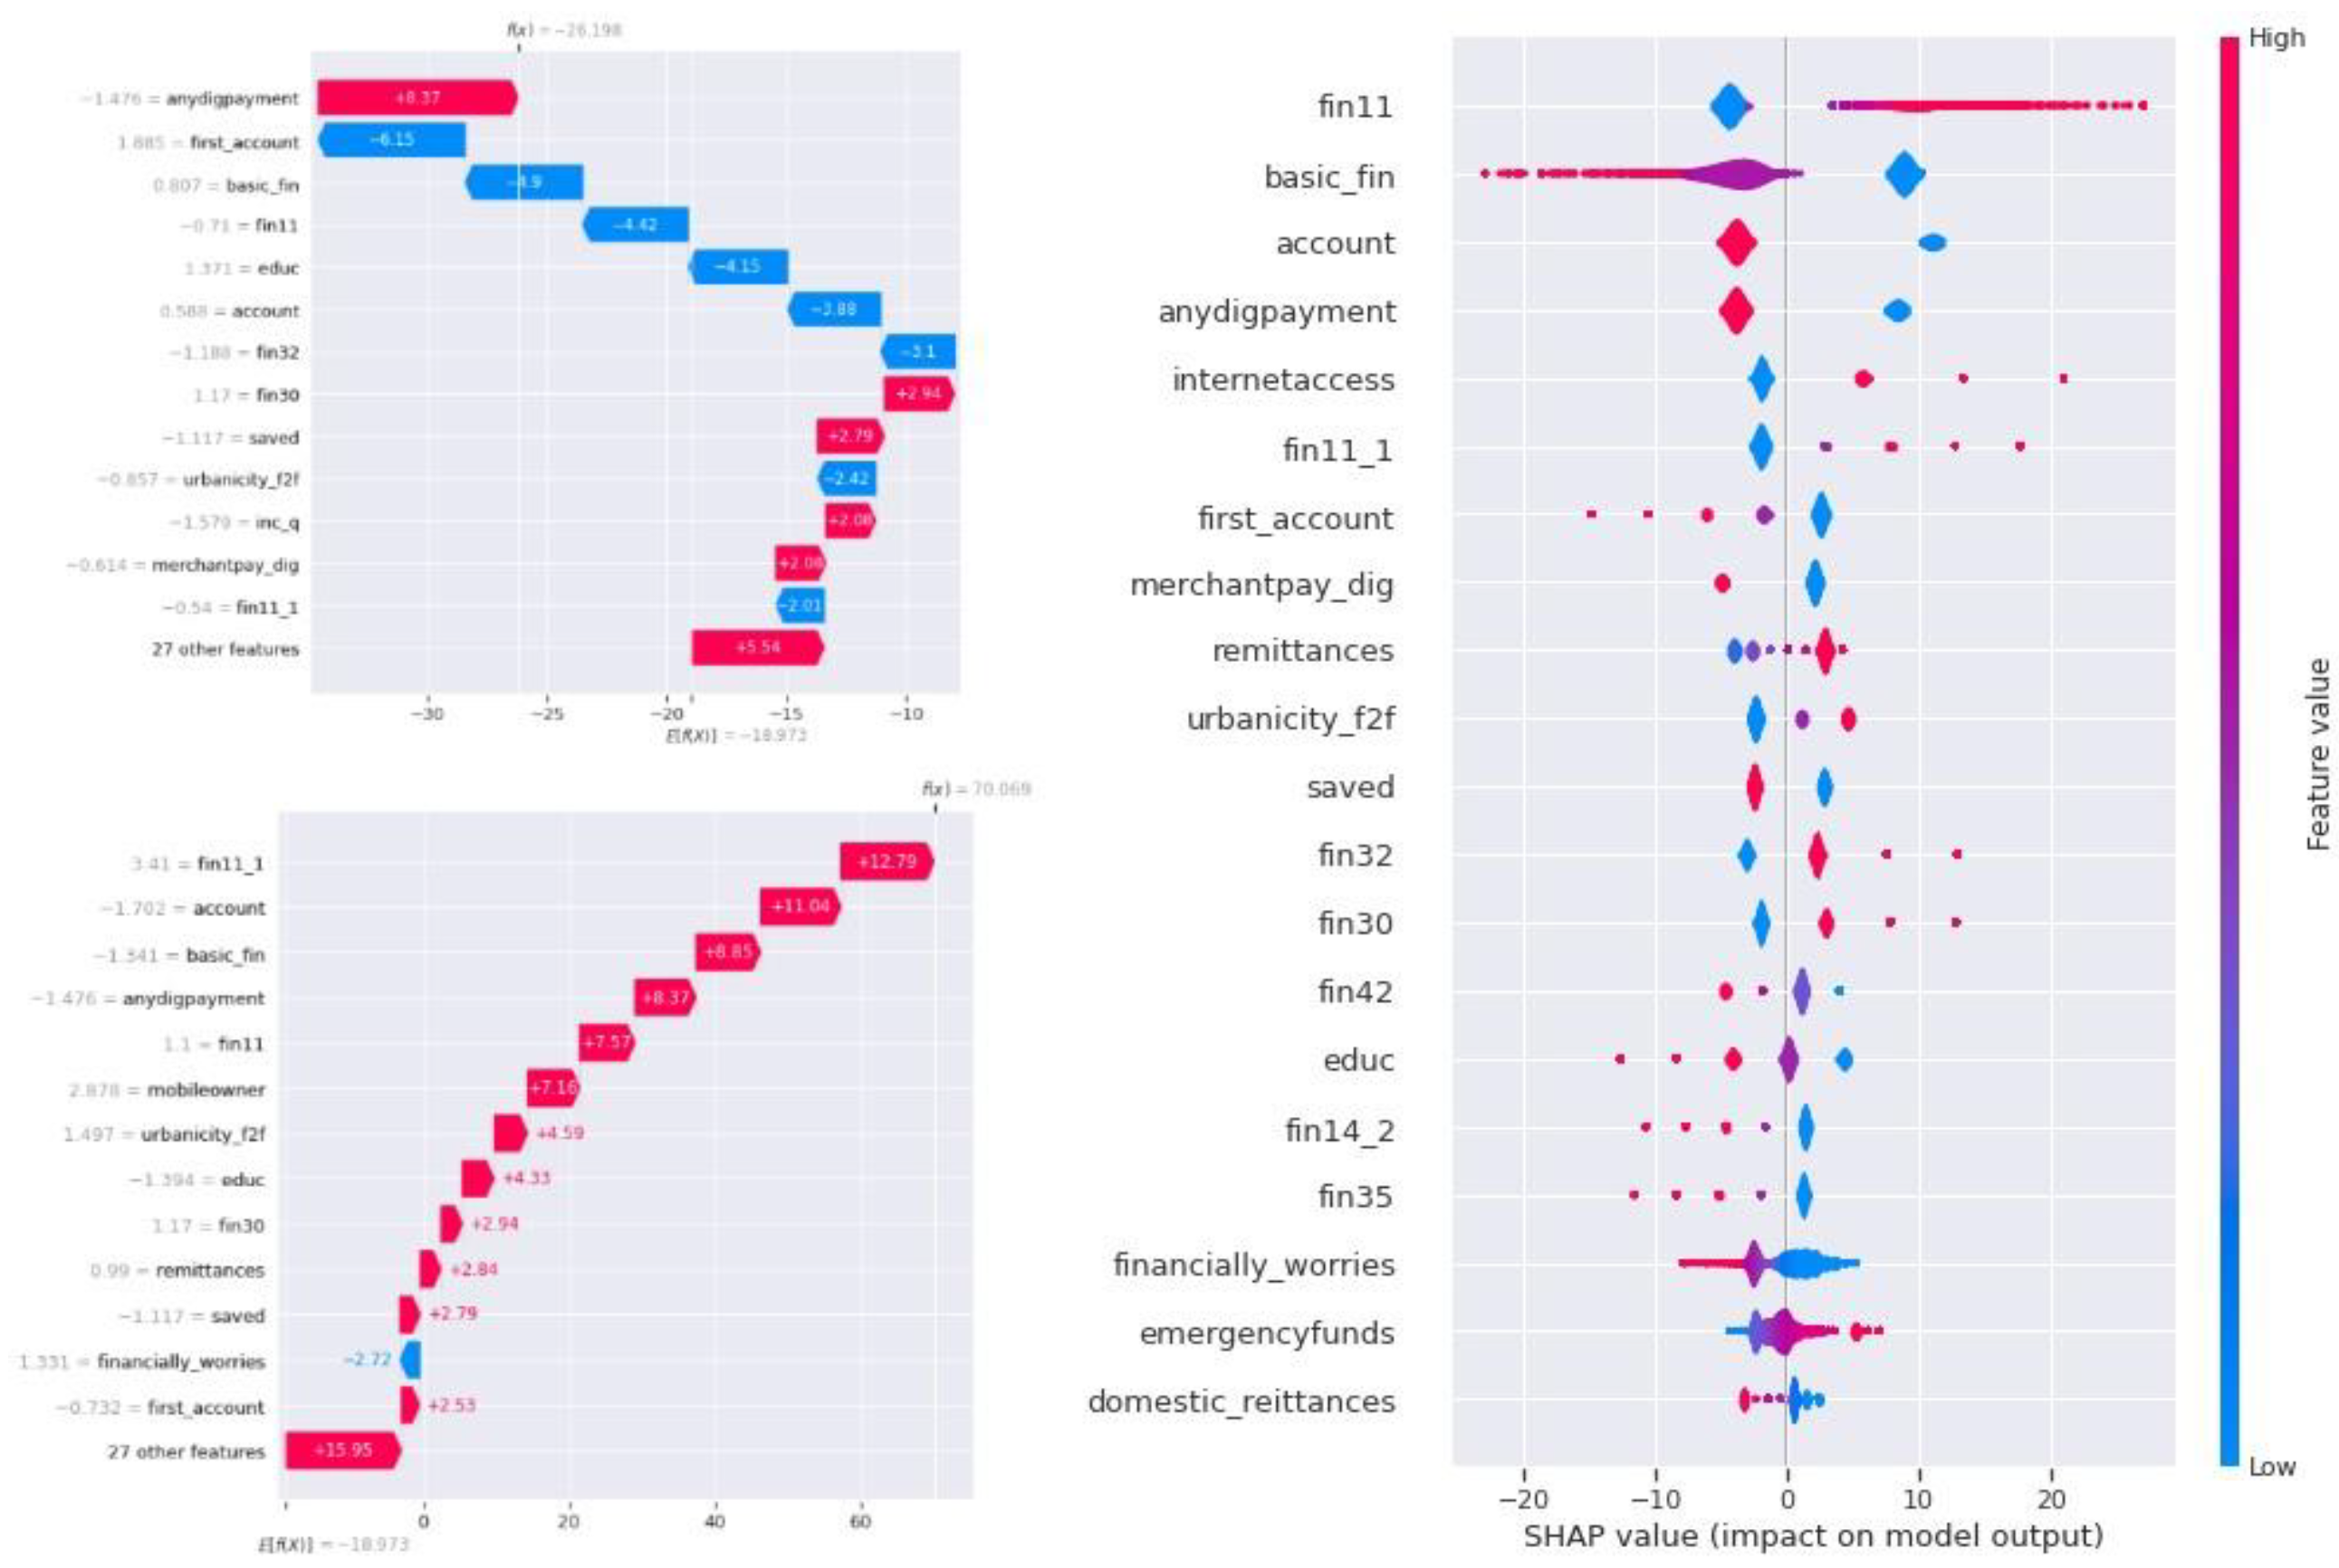
Figure 12.
Shap Bar plot (i) and Heatmap (ii) for Logistic Regression Model.
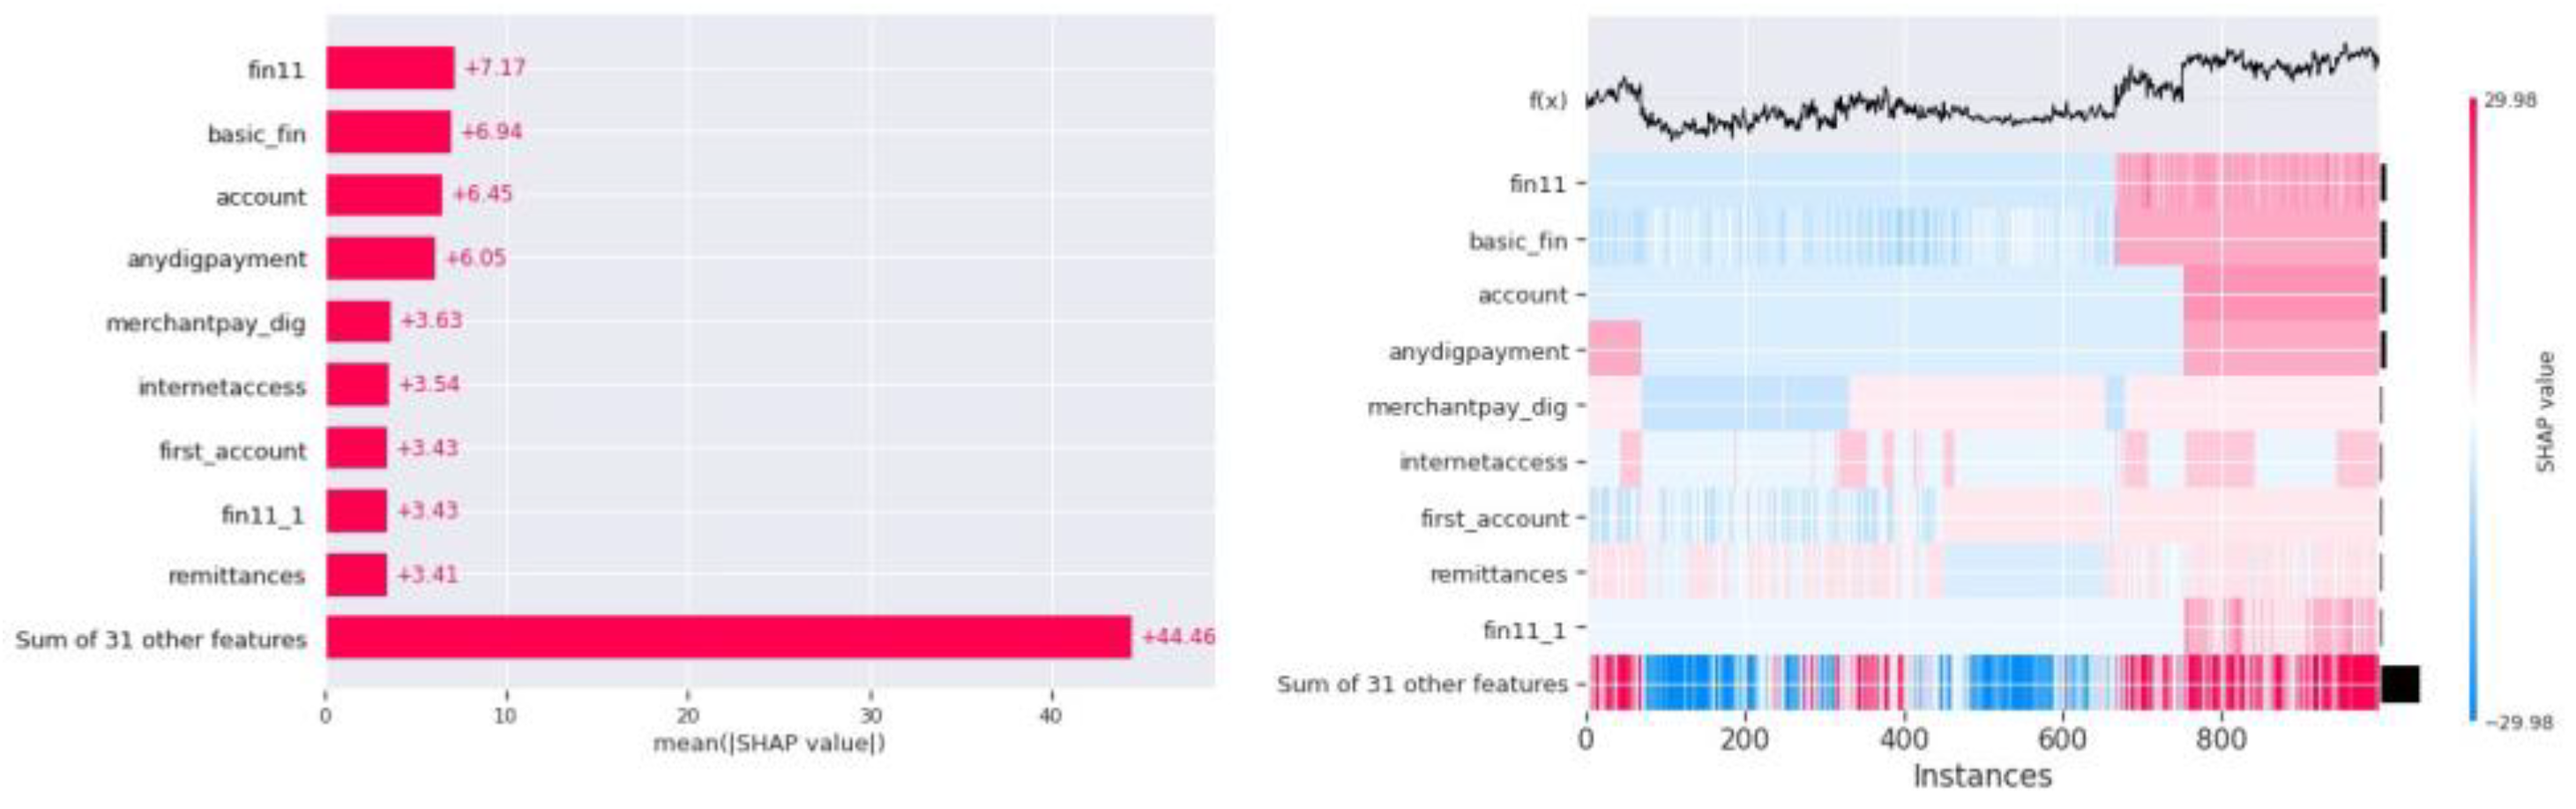
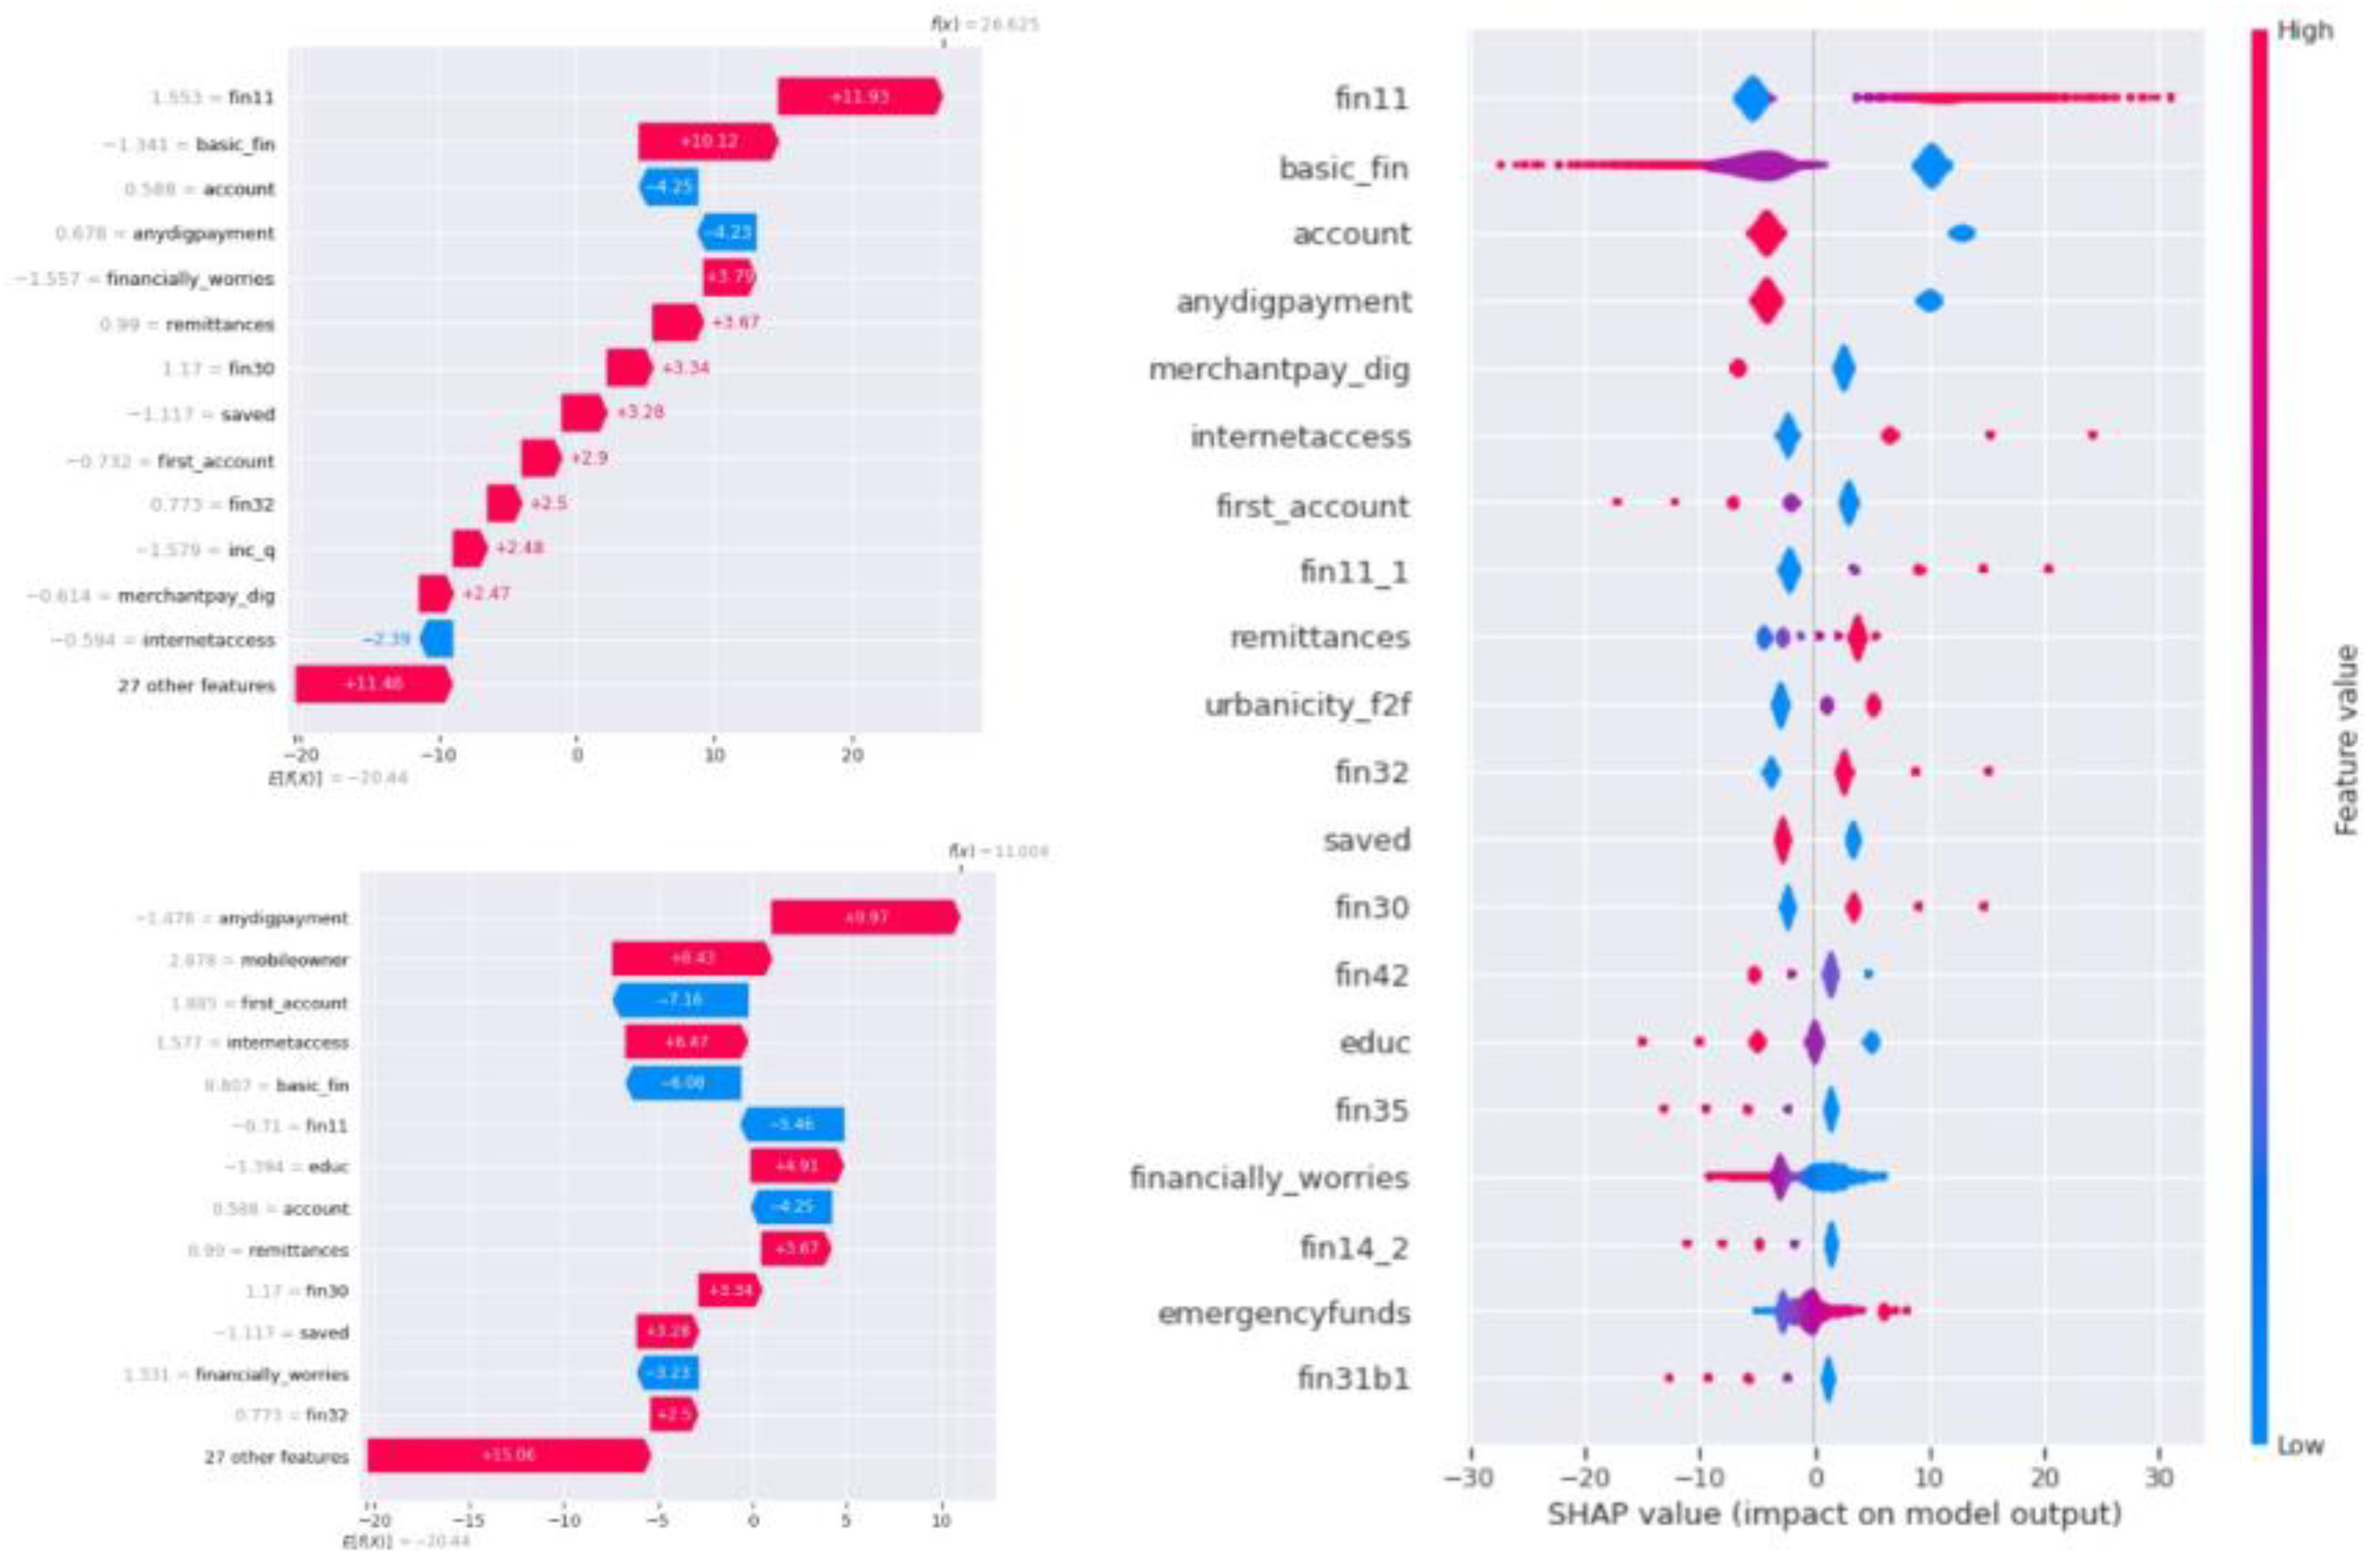
Figure 13.
Shap Waterfall plot (i, ii) and Summary plot (iii) for Logistic Regression.
The third classification machine learning model is the Decision Tree. The explainable artificial intelligence model for decision tree in the shap model is shap.TreeExplainer and plots the shap decision plot. The decision plot for the decision tree model trained on the world bank dataset can be seen in Figure 14. The multiple lines seen in the decision plot shows the contribution of different features in the final classification through the decision tree classifier.The other shap plot shows the processing of the decision tree classifier is the force plot which shows the contribution of difference features for a single classification. The force plot for the decision tree classifier can be seen in Figure 15 which shows the contribution of different features for the final classification.
5. Discussion
This section discusses the essential interpretation based on the key finding of the research. To answer the first research question and understand the reasoning behind the predictive performance of the machine learning models for classifying the dataset against the credit risk and finding the most effective interpretability methods for credit risk assessment, we apply the explainable artificial techniques to visualize the processing of the black-box machine learning models. There are several interpretability methods and tools for interpreting the black-box machine learning models Adadi and Berrada (2018). These tools are listed in an order from least to greatest complexity below:
Figure 14.
Shap Decision plot for Decision Tree Classifier.
- Partial Dependence Plot (PDP) Goldstein et al. (2014)
- Individual Conditional Expectation (ICE) Goldstein et al. (2014)
- Feature Importance Fang et al. (2020)
- Global Surrogate Lualdi et al. (2022)
- Local Surrogate (LIME) Ribeiro et al. (2016)
- Shapley Value (SHAP) Lundberg and Lee (2017)
We use the explainable AI model ”SHAP” to visualize and understand the processing of the machine learning models and check the features influencing the predictions delivered by the machine learning modelsLundberg and Lee (2017). The SHAP model explains a prediction by assuming that each feature value of the instance is a ”player” in a game. The contribution of each feature is measured by adding and removing the feature from all subsets of the rest of the features. The Shapley Value for one feature is the weighted sum of all its contributionsLundberg and Lee (2017). These values are additive and locally accurate. If we add up the Shapley Values of all the features, plus the base value or the prediction average, we get the exact prediction value. This feature is not present in other explainable AI models.
The SHAP bar plot for SVM from Figure 10 shows the influence of features on the prediction results given by the model. As per the SHAP bar plot, ”fin11” (not having a bank account) is the feature influencing the prediction followed by the feature ”basic fin” and ”account,” where ”basic fin” feature is the combination of multiple features ”fin2,” ”fin4,” ”fin5,” ”fin6,” ”fin7,” ”fin8,” ”fin8a,” ”fin8b,” ”fin9,” ”fin9a,” ”fin10,” ”fin10a,” and ”fin10b.” These features capture having and use of a debit card, use of a mobile phone for banking, and bank deposits. A bank account provides a record of income, expenses, and savings patterns. Without it, lenders lack critical insights into an individual’s financial behavior, such as cash flow stability or savings habits. Not having an account can restrict access to credit, contributing to higher credit risk. Debit cards may have a clear financial footprint, which helps lenders evaluate spending patterns and financial discipline. The frequency and volume of debit card transactions can indicate how well a customer manages cash flow and avoids overdrafts, providing a measure of financial responsibility. Unlike credit cards, debit card use suggests that customers rely on available funds rather than borrowing, potentially indicating lower reliance on credit and reduced credit risk. Similarly, mobile phone users are likely to access financial services more easily, such as tracking expenses, making payments, or receiving alerts, reducing the likelihood of missed payments or overdrafts. Customers who actively use debit cards, manage financial transactions via mobile phones, and make regular deposits are likely to exhibit strong financial discipline, stable income, and access to modern financial tools. This reduces the likelihood of default. These features provide lenders with a holistic view of a customer’s financial habits, enabling more accurate credit risk assessment and tailored decision-making. Likewise, regular deposits indicate consistent income streams, which are essential for assessing repayment capacity. The size, frequency, and source of deposits provide insights into financial stability. Any deviations in these behaviors, such as a drop in deposits or irregular mobile banking activity, may act as early indicators of financial distress, allowing preemptive action.
Figure 15.
Shap Force plot for Decision Tree Classifier.
The summary plot for SVM in Figure 11 (iii) shows the influence of the first 20 features on the predictive power of the machine learning model. The waterfall plot in Figure 11 (i) and (ii) is visualized for 2 different predictions and shows the influence of features in the final prediction for that particular record. The last SHAP graph for the SVM algorithm is the heatmap in Figure 10 (ii), which shows the influence of features in the prediction at different instances of the predictions. By analyzing all the SHAP plots, it is clear that ”fin11” has the greatest influence on the prediction, closely followed by ”basic fin” and ”account.” This suggests that basic financial features and the status of the financial account play a crucial role in predicting credit risk for an application.
Figure 12 (i) shows the SHAP bar plot for the logistic regression machine learning model, and similar to the results for the SVM model, in the logistic regression model, the SHAP bar plot reads the feature ”fin11” as the feature with the highest influence on the prediction, closely followed by ”basic fin” and ”account.” The summary plot for the logistic regression model is shown in Figure 13 (iii), which shows the top 20 features having maximum influence on the prediction of the logistic regression model. Observing the summary plot for SVM and logistic regression models, we can say that the top 4 features for both models are the same: ”fin11,” ”basic fin,” ”account,” and ”anydigpayment.” The results indicate that the classification heavily relies on the customer’s financial data, such as having an account, debit card, credit card, timely credit card payments, and the use of mobile phones and the internet for digital payments and internet banking. Additionally, features influencing the rejection of an application or predicting it as risky include ”saved,” ”inc q,” ”financially worries,” and ”emergencyfunds.” Figure 13 (i) and (ii) show the waterfall plot for two different predictions in the dataset and the positive and negative influence of the features on the final prediction for that single record. Figure 12 (ii) shows the heatmap for the influence of features on the final predictions at multiple different instances in the dataset and predictions.
The third classification machine learning model used is the Decision Tree. For explainability, the SHAP model utilizes shap.TreeExplainer to generate decision plots. The decision plot for the Decision Tree model trained on the World Bank dataset is shown in Figure 14. The multiple lines in the decision plot represent the contributions of various features to the final classification made by the Decision Tree classifier. Another SHAP visualization used for the Decision Tree classifier is the force plot, which highlights the contributions of individual features to a single classification. The force plot for the Decision Tree classifier can be seen in Figure 15, which shows the contribution of different features for the final classification.
Comparing the results from the SHAP analyses for all three machine learning models, the primary feature influencing the predictions—or in the case of the Decision Tree classifier, the root node of the tree—is identified as ”fin11.” This feature, derived through PCA from the group of features ”fin11a” to ”fin11h,” captures the reason for not having an account in any financial institution. The SHAP analysis highlights the critical role of ”having an account” in assessing credit risk. ”Fin11” is closely followed by other influential features such as ”basic fin,” ”saved,” ”inc q,” ”financially worries,” and others, forming a list of the top 10 contributors to the predictive power of the models. This finding addresses the second research question of this study by demonstrating how the features driving the predictions reveal the underlying meaning of the model’s outcomes. The inherently subjective nature of interpreting black-box models highlights the importance of domain expertise in accurately understanding and contextualizing the results from machine learning models.
The third research question of this project examines how domain knowledge influences the interpretability of credit risk assessment models in finance. This question is addressed through the inherently subjective nature of interpretability. As discussed, the impact of features on predictions can vary depending on the specific prediction task, and interpreting this impact effectively requires domain expertise. For instance, if a model predicts a customer’s financial instability in repaying a loan, the contribution of features like credit score and previous bill payments holds a different meaning compared to their contribution in predicting a customer’s need for a loan. Understanding and contextualizing these differences demands domain knowledge and a human-in-the-loop decision-making process in the credit risk assessment using the machine learning models presented in this research paper.
6. Conclusion
The rapid advancement of technology continues to drive innovation across various industries, including the finance sector. Automation is becoming a key focus, reducing reliance on human effort and intelligence in many tasks. The finance industry, which revolves around credit and money, is particularly susceptible to credit risk, such as loan defaults, market crashes, and inflation impacts. These risks require proactive and accurate assessment to mitigate potential threats. This research highlights the potential of leveraging machine learning and artificial intelligence to automate credit risk assessment. By establishing assumptions and rules, machine learning models can streamline this critical process. However, the adoption of these technologies brings challenges, particularly regarding trust in the models’ predictions and decision-making processes.
To address these concerns, this study presents a machine learning-based solution for automated credit risk assessment, paired with XAI tools and a human-in-the-loop approach. The findings emphasize that credit risk assessment is a nuanced and subjective task requiring domain knowledge to interpret predictions meaningfully. Incorporating human expertise ensures the authenticity of decisions and increases trust in the system. The models developed in this study achieve an impressive accuracy of 99% and an F1-score of 1.00, demonstrating their effectiveness. Additionally, XAI tools like SHAP provided insights into the models’ processing, highlighting the influence of each feature on predictions and validating the models’ performance.
While this research focuses on presenting machine learning models for credit risk assessment and identifying effective interpretability methods, the full implementation and integration of such systems into financial institutions remain a task for future exploration. Future research could build on these findings to develop comprehensive systems that combine automation, interpretability, and expert decision-making for robust credit risk management.
References
- Adadi, A., Berrada, M., 2018. Peeking inside the black-box: a survey on explainable artificial intelligence (xai). IEEE access 6, 52138–52160. [CrossRef]
- Addo, P.M., Guegan, D., Hassani, B., 2018. Credit Risk Analysis using Machine and Deep Learning Models. Technical Report 08/WP/2018. Universit´e Paris 1 Panth´eon-Sorbonne. [CrossRef]
- Aremu, O.O., Hyland-Wood, D., McAree, P.R., 2020. A machine learning approach to circumventing the curse of dimensionality in discontinuous time series machine data. Reliability Engineering & System Safety 195, 106706. [CrossRef]
- Arrieta, A.B., Rodriguez, N.D., Ser, J.D., Bennetot, A., Tabik, S., Gonz´alez, A.B., Garcia, S., Gil-Lopez, S., Molina, D., Benjamins, V.R., Chatila, R., Herrera, F., 2019. Explainable artificial intelligence (xai): Concepts, taxonomies, opportunities and challenges toward responsible ai. Information Fusion 58. [CrossRef]
- Attigeri, G., M, M.P.M., Pai, R.M., 2019. Framework to predict npa/willful defaults in corporate loans: A big data approach. International Journal of Electrical and Computer Engineering (IJECE) 9, 3786–3797. [CrossRef]
- Bawa, J., Goyal, V., Mitra, S., Basu, S., 2018. An analysis of npas of indian banks: Using a comprehensive framework of 31 financial ratios. IIMB Management Review 31. [CrossRef]
- Bello, O.A., 2023. Machine learning algorithms for credit risk assessment: an economic and financial analysis. International Journal of Management 10, 109–133.
- Buckley, R.P., Zetzsche, D.A., Arner, D.W., Tang, B.W., 2021. Regulating artificial intelligence in finance: Putting the human in the loop. Sydney Law Review, The 43, 43–81.
- Bussmann, N., Giudici, P., Marinelli, D., Papenbrock, J., 2020. Explainable ai in fintech risk management. Frontiers in Artificial Intelligence 3, 26. [CrossRef]
- Choudhary, R., Gianey, H.K., 2017. Comprehensive review on supervised machine learning algorithms, in: 2017 International Conference on Machine Learning and Data Science (MLDS), IEEE. pp. 37–43.
- Chow, J.C.K., 2017. Analysis of financial credit risk using machine learning URL: https://arxiv.org/ftp/arxiv/papers/1802/1802.05326.pdf.
- Crespo Ma´rquez, A., 2022. The curse of dimensionality, in: Digital Maintenance Management: Guiding Digital Transformation in Maintenance. Springer, pp. 67–86.
- Das, K., Behera, R.N., 2017. A survey on machine learning: concept, algorithms and applications. International Journal of Innovative Research in Computer and Communication Engineering 5, 1301–1309.
- Demajo, L., Vella, V., Dingli, A., 2020. Explainable ai for interpretable credit scoring. CSIT. [CrossRef]
- Demirgu¨¸c-Kunt, A., Klapper, L.F., 2012. Measuring financial inclusion: The global findex database. World bank policy research working paper .
- Emmert-Streib, F., Yli-Harja, O., Dehmer, M., 2020. Explainable artificial intelligence and machine learning: A reality rooted perspective . [CrossRef]
- Fang, F., Ventre, C., Li, L., Kanthan, L., Wu, F., Basios, M., 2020. Better model selection with a new definition of feature importance. URL: https: //arxiv.org/abs/2009.07708, arXiv:2009.07708.
- Goldstein, A., Kapelner, A., Bleich, J., Pitkin, E., 2014. Peeking inside the black box: Visualizing statistical learning with plots of individual conditional expectation. URL: https://arxiv.org/abs/1309.6392, arXiv:1309.6392. [CrossRef]
- Kadanda, D., Raj, K., 2018. Non-performing assets (npas) and its determinants: A study of indian public sector banks. Journal of Social and Economic Development 20, 193–212. [CrossRef]
- Lualdi, P., Sturm, R., Siefkes, T., 2022. Exploration-oriented sampling strategies for global surrogate modeling: A comparison between one-stage and adaptive methods. Journal of Computational Science 60, 101603. [CrossRef]
- URL:. [CrossRef]
- Lundberg, S., Lee, S.I., 2017. A unified approach to interpreting model predictions. URL: https://arxiv.org/abs/1705.07874, arXiv:1705.07874.
- Mahesh, B., 2020. Machine learning algorithms-a review. International Journal of Science and Research (IJSR).[Internet] 9, 381–386.
- Misheva, B.H., Hisra, A., Osterrieder, J., Kulkarni, O., Lin, S.F., 2021. Explainable ai in credit risk management URL: https://arxiv.org/pdf/ 2103.00949.pdf.
- Molnar, C., 2022. Interpretable Machine Learning: A Guide for Making Black Box Models Explainable. URL: https://christophm.github.io/ interpretable-ml-book/.
- Nemenyi, P.B., 1963. Distribution-free multiple comparisons. Princeton University.
- Ribeiro, M.T., Singh, S., Guestrin, C., 2016. ”why should i trust you?”: Explaining the predictions of any classifier. URL: https://arxiv.org/ abs/1602.04938, arXiv:1602.04938.
- Yao, Y., Li, J., 2022. Operational risk assessment of third-party payment platforms: a case study of china. Financial Innovation 8, 19. [CrossRef]
- Zhou, L., Pan, S., Wang, J., Vasilakos, A.V., 2017. Machine learning on big data: Opportunities and challenges. Neurocomputing 237, 350–361. [CrossRef]
Figure 1.
Average ranks of credit scoring models for Nemenyi test Yao and Li (2022);.
Figure 2.
Number of customers having Account, and Mobile Money Account (account, account fin, account mob).
Figure 2.
Number of customers having Account, and Mobile Money Account (account, account fin, account mob).
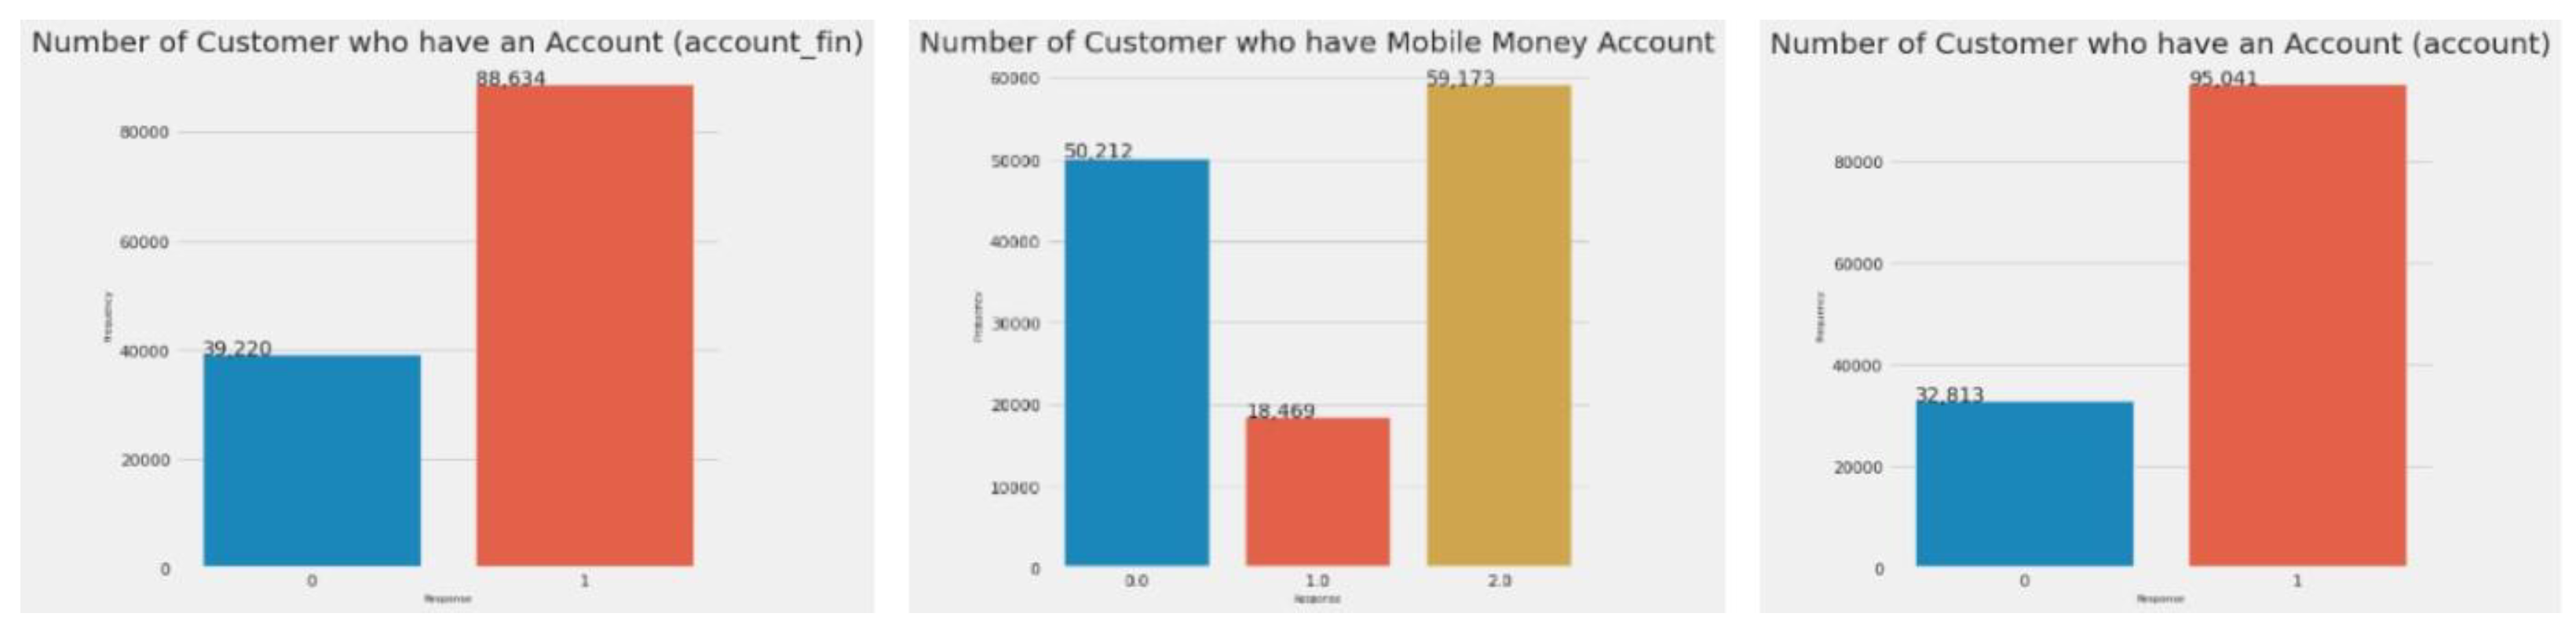
Figure 3.
Number of customers who ever borrowed money (borrowed, fin20, fin22a, fin22b).
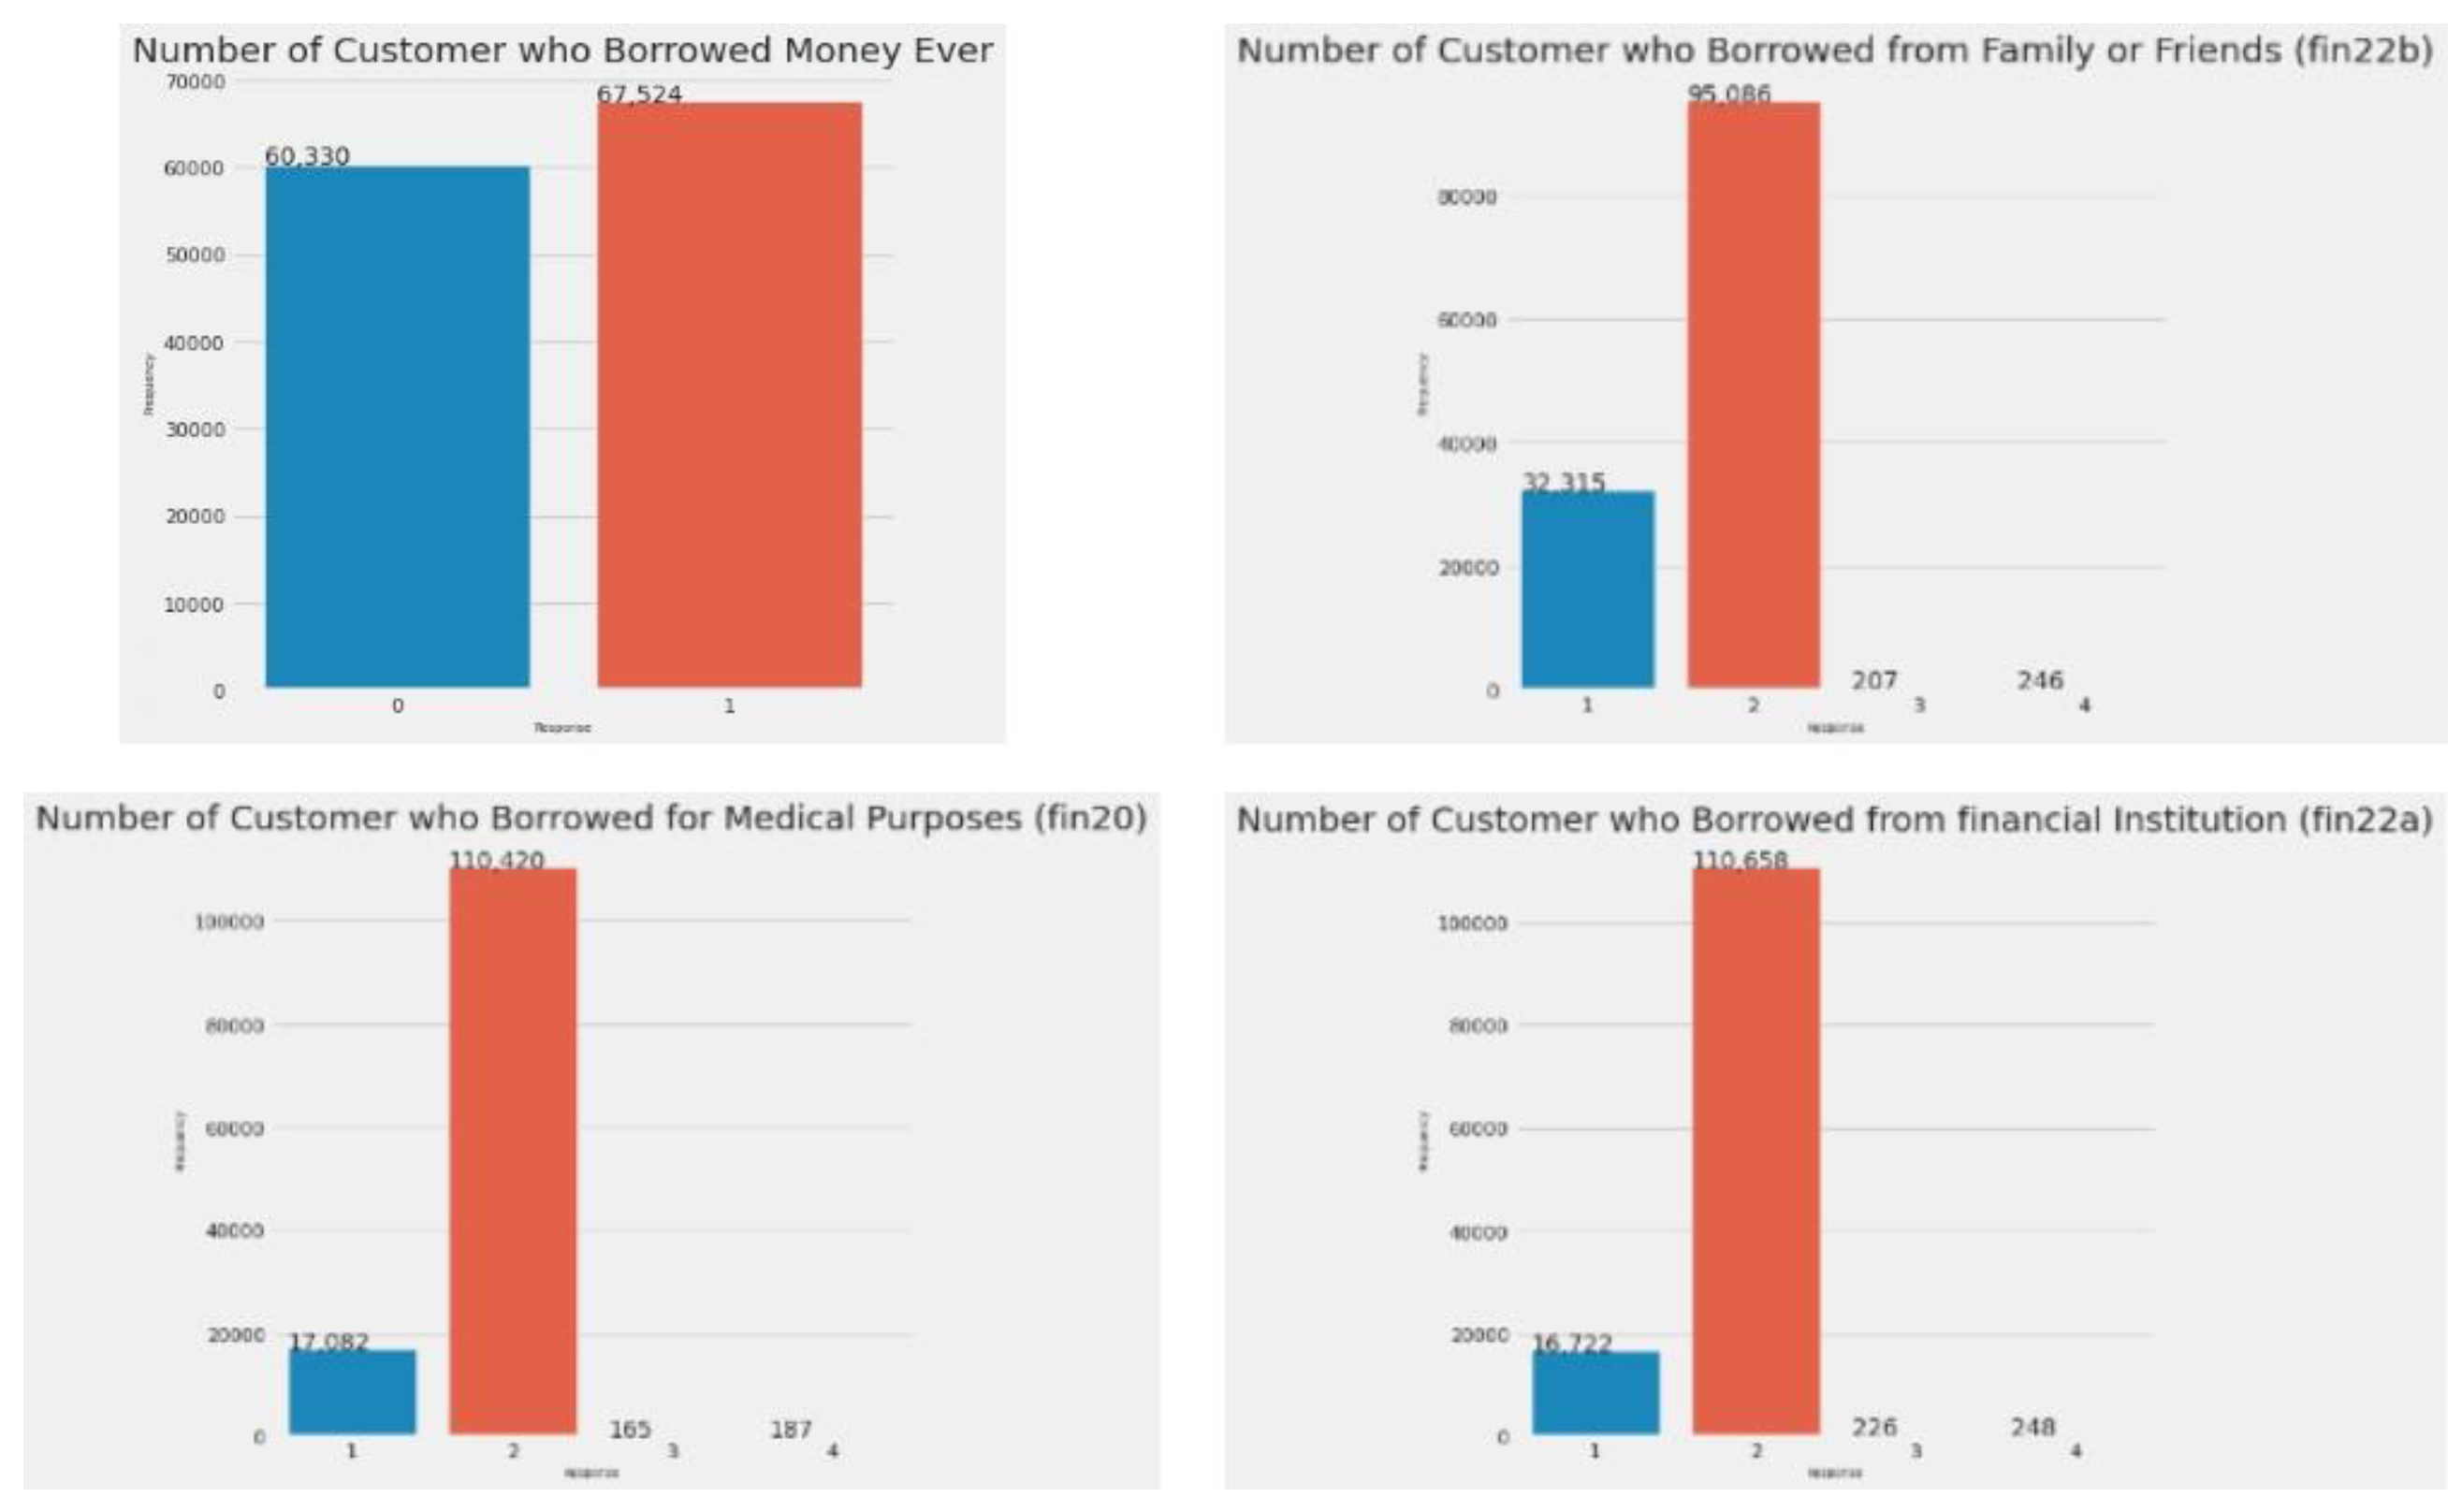
Figure 4.
Number of customers who ever saved money (saved, fin16, fin17a, fin17b).
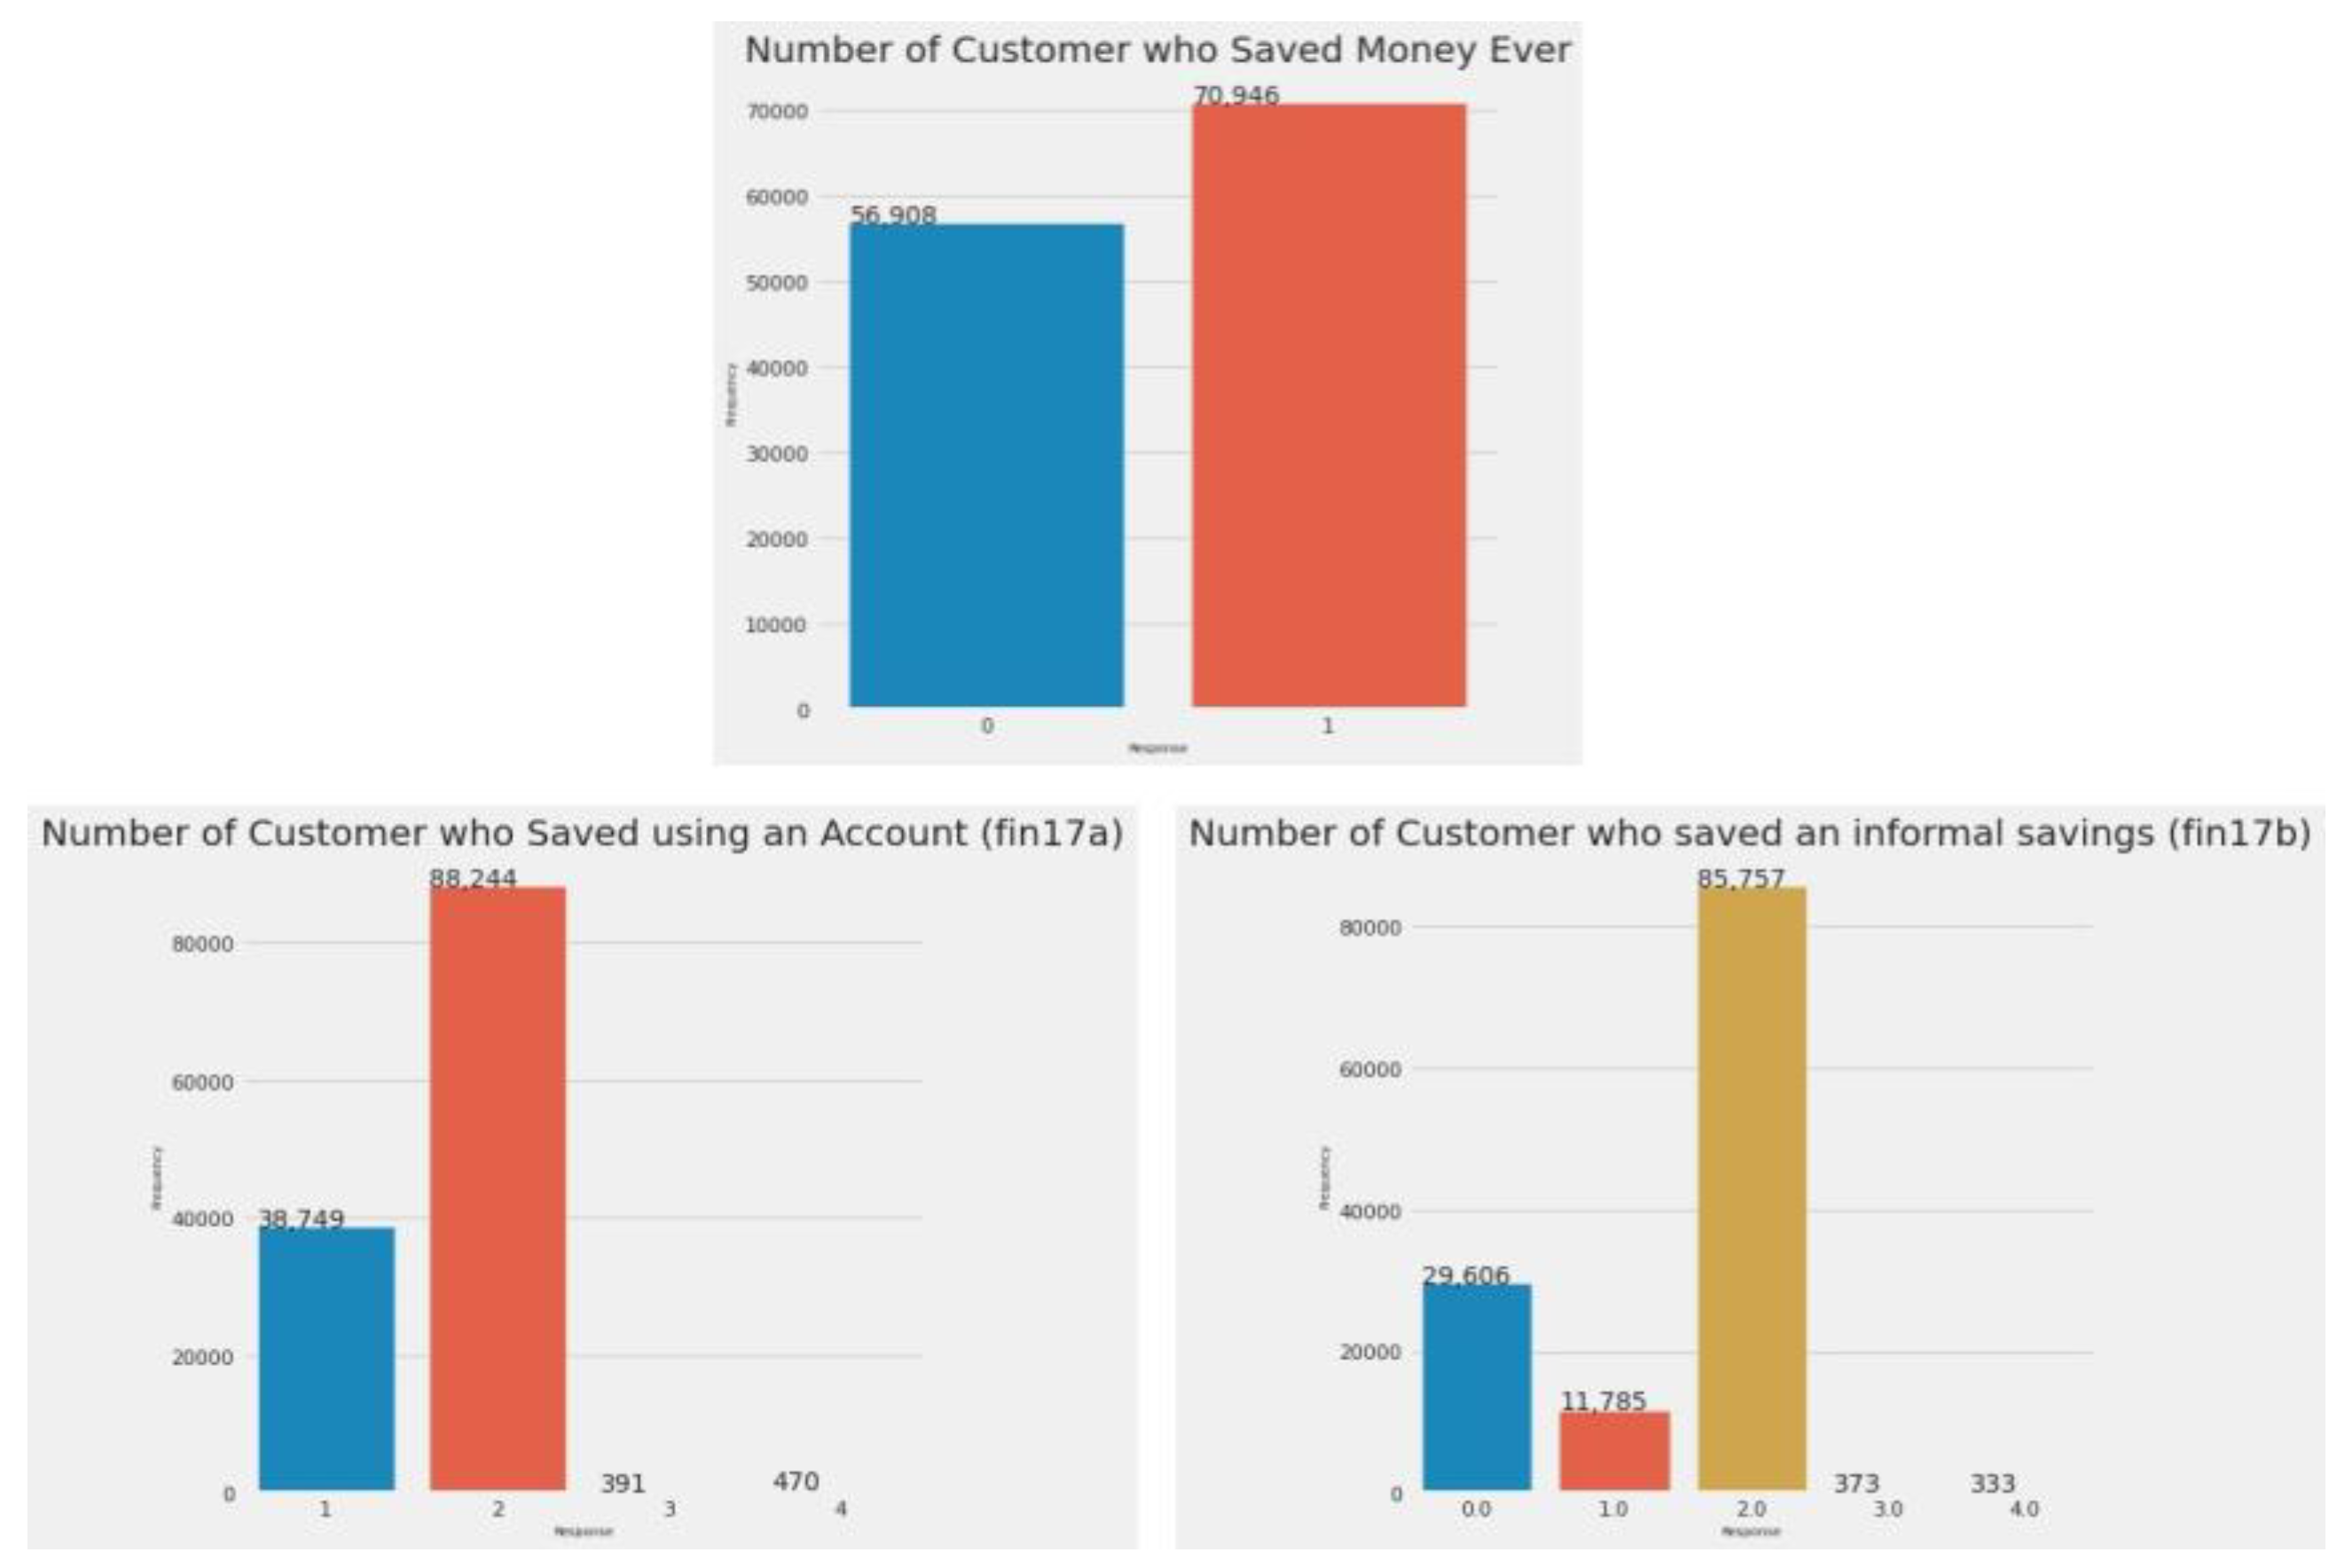
Figure 5.
Number of customers who have a debit card and have used it (fin2, fin4, fin4a).
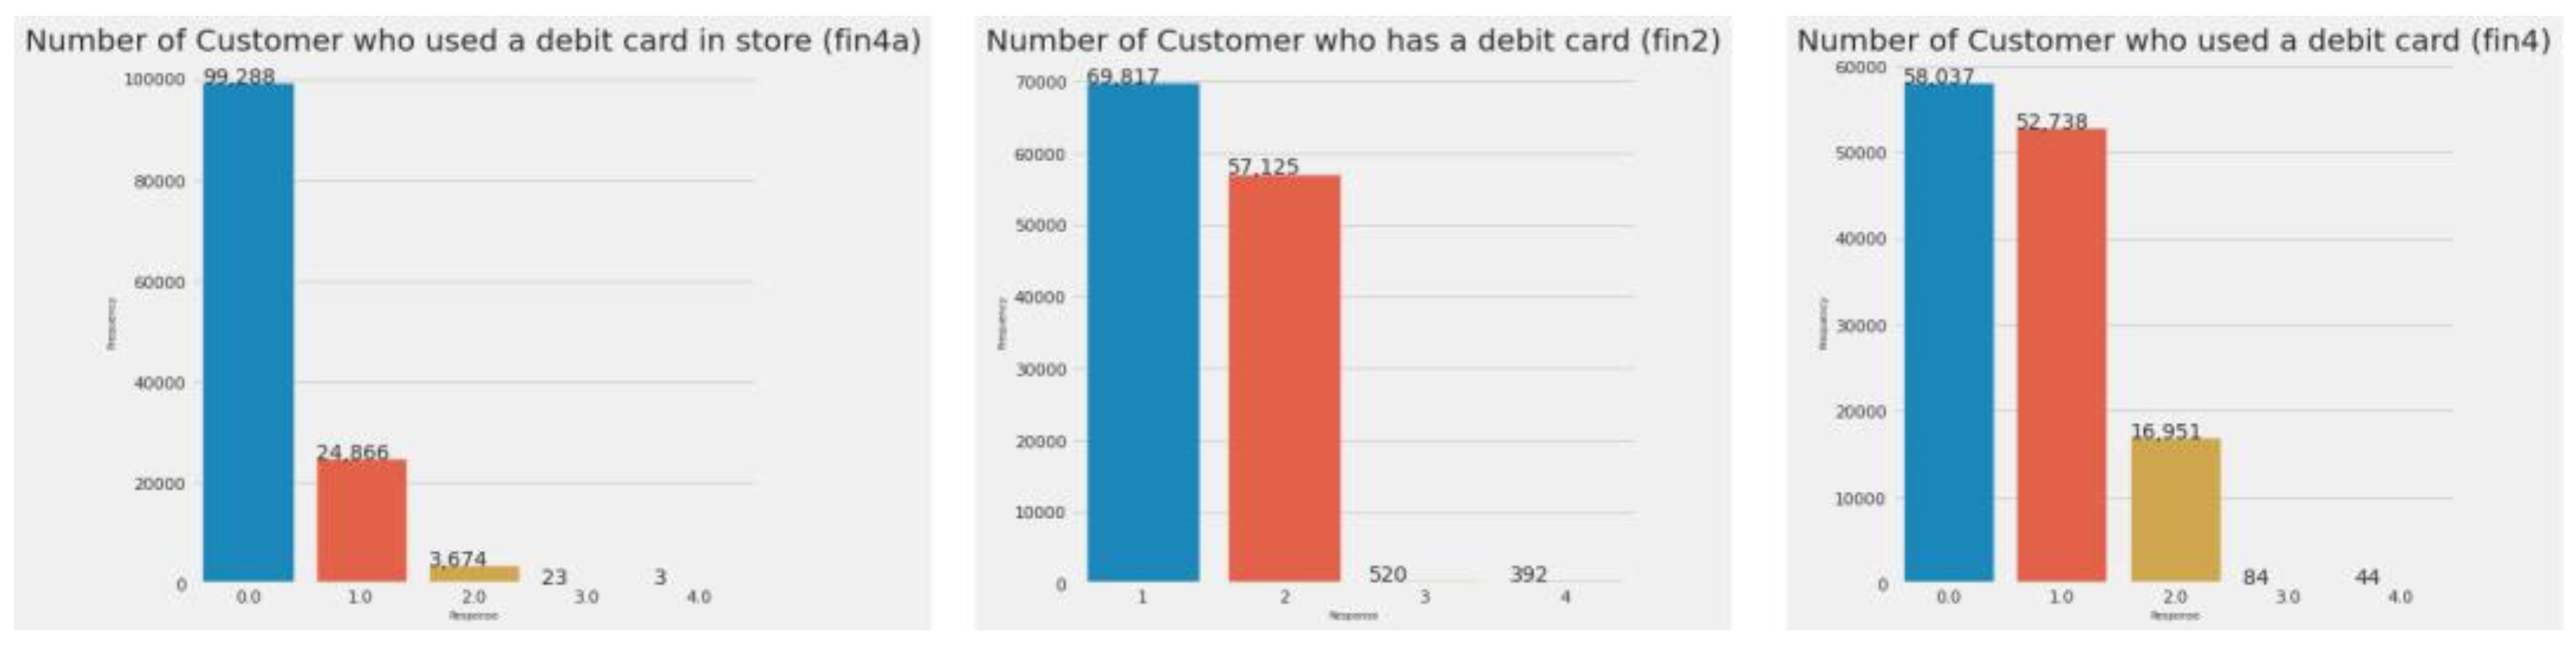
Figure 6.
Number of customers who have a credit card, have used it, and paid the bill.
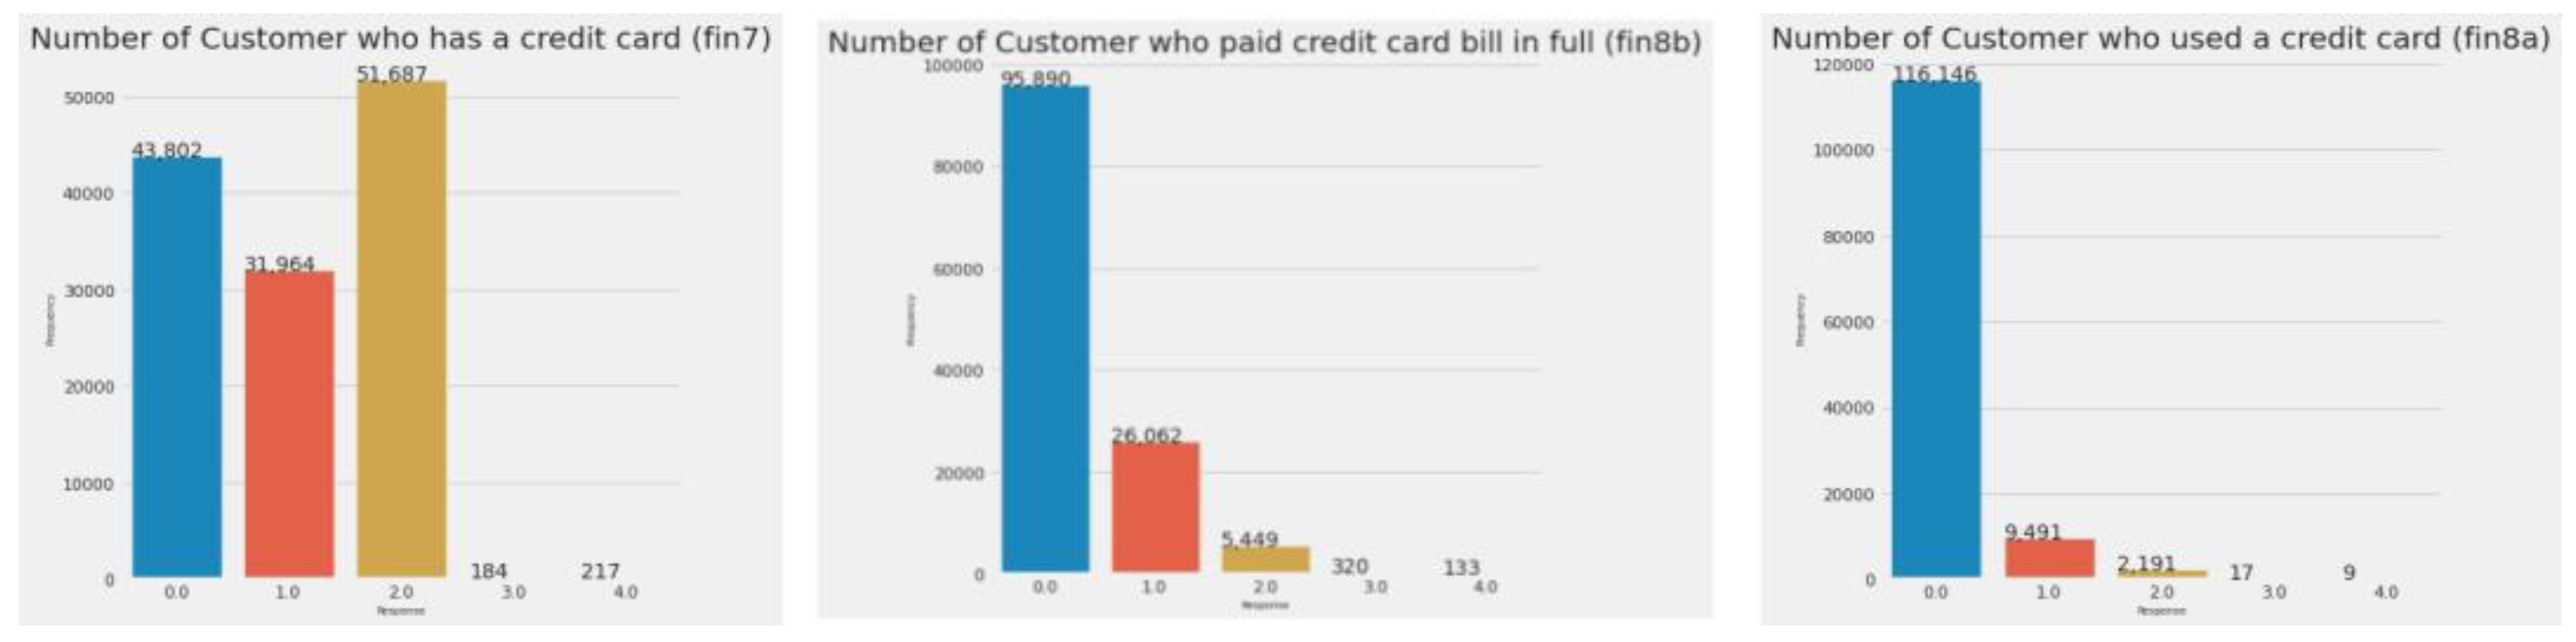
Figure 7.
Number of customers who have a credit card, have used it, and paid the bill.
Figure 8.
Spearman Correlation Heatmap for coefficient > 0.85.
Figure 9.
Classification results from k-means clustering.
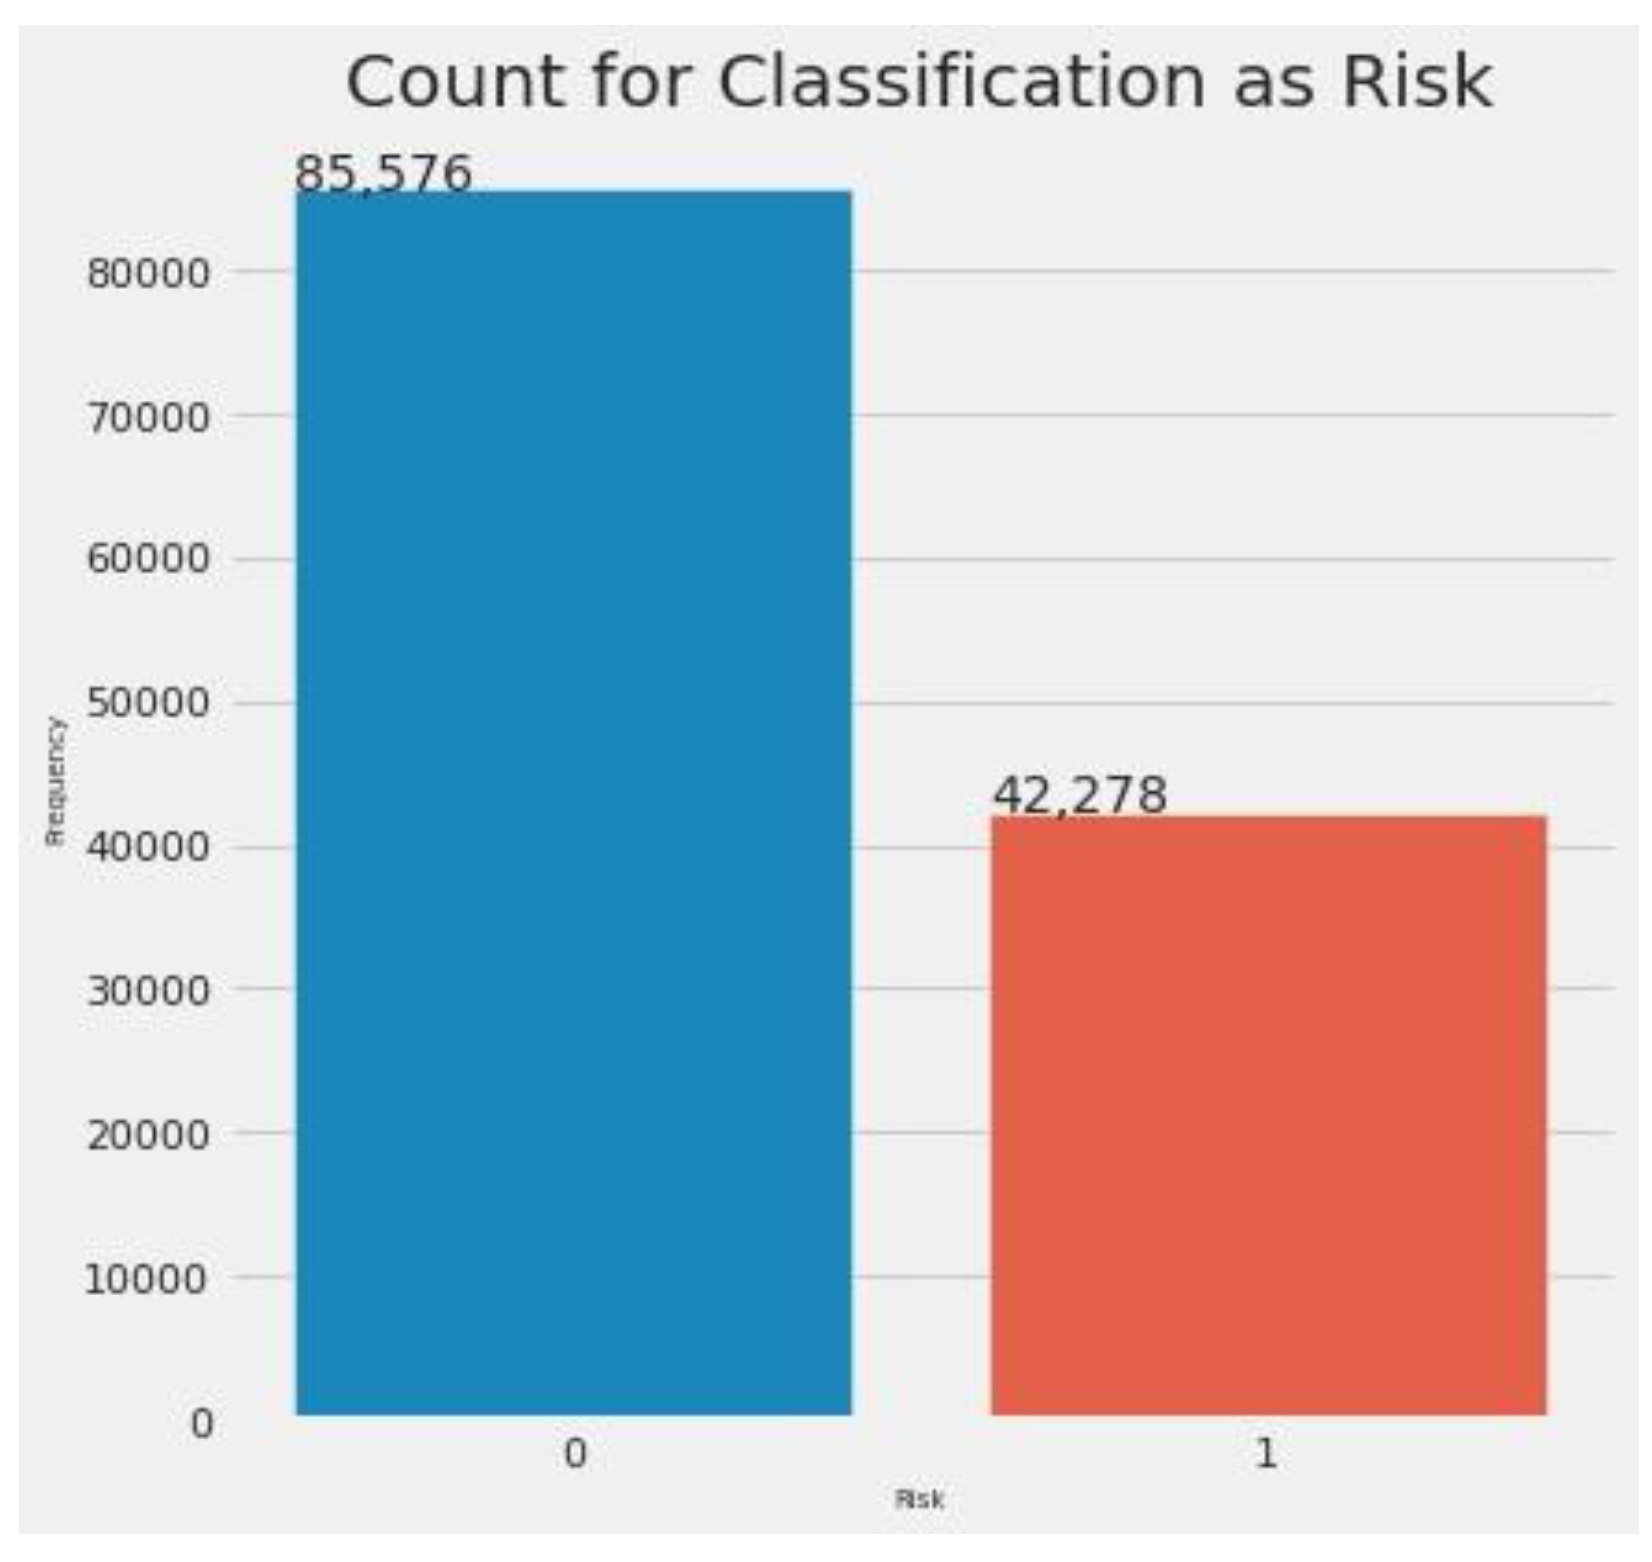

Table 1.
Models’ performances on the test dataset using AUC and RMSE values Addo et al. (2018).
| Models | AUC | RMSE |
| M1 | 0.876280 | 0.245231 |
| M2 | 0.993066 | 0.096683 |
| M3 | 0.994803 | 0.044277 |
| D1 | 0.904914 | 0.114487 |
| D2 | 0.841172 | 0.116625 |
| D3 | 0.975266 | 0.323504 |
| D4 | 0.897737 | 0.113269 |
Table 2.
All the features in the dataset after treating the null values. (Table part I).
| Variable Name | Description | Data Type |
| economycode | Name of the economy | object |
| pop adult | Adult (15+) population using 2020 World Development Indicators (WDI) |
float64 |
| wpid random | Individual-level identifier to merge with Gallup World Poll data | int64 |
| wgt | Weight assigned to each observation | float64 |
| female | Respondent is female or male: 1 = female, 2 = male |
int64 |
| age | Respondent’s age (in years) | float64 |
| educ | Respondent’s education level: = primary or less, = secondary, = tertiary or more |
int64 |
| inc q | Respondent’s within-economy household income quintile (1 to 5) | int64 |
| emp in | Respondent is in workforce: 1 = in workforce, 2 = out |
float64 |
| urbancity f2f | Respondent lives in rural or urban area: 1 = rural, 2 = urban |
float64 |
| account | Has an account: 1 = yes, 0 = no |
int64 |
| saved | Personally saved money in the past year: 1 = yes, 0 = no |
int64 |
| borrowed | Personally borrowed money in the past year: 1 = yes, 0 = no |
int64 |
| mobileowner | Owns a mobile phone | int64 |
| internetaccess | Respondent has internet access | int64 |
| anydigpayment | Made/received a digital payment: 1 = yes, 0 = no |
int64 |
| remittances | Made/received a domestic remittance payment | int64 |
| merchantpay dig | Made a digital merchant payment: 1 = yes, 0 = no |
int64 |
| fin1 1a | Opened first account to receive a wage payment | float64 |
| fin1 1b | Opened first account to receive government money | float64 |
| fin2 | Has a debit card | int64 |
| fin4 | Used a debit card | float64 |
| fin4a | Used a debit card in store | float64 |
| fin5 | Used mobile phone or internet to access account | float64 |
| fin6 | Used mobile phone or internet to check balance | float64 |
| fin7 | Has a credit card | float64 |
| fin8 | Used a credit card | float64 |
| fin8a | Used a credit card in store | float64 |
| fin8b | Paid credit card balances in full | float64 |
| fin9 | Made a deposit into the account | float64 |
| fin9a | Made a deposit two or more times per month | float64 |
| fin10 | Withdrew from the account | float64 |
| fin10a | Withdrew two or more times per month | float64 |
| fin10b | Used account to store money | float64 |
| fin11 1 | Unbanked: use account without help | float64 |
| fin11a | Reason for no account: too far | float64 |
| fin11b | Reason for no account: too expensive | float64 |
| fin11c | Reason for no account: lack documentation | float64 |
| fin11d | Reason for no account: lack trust12 | float64 |
| fin11e | Reason for no account: religious reasons | float64 |
| fin11f | Reason for no account: lack money | float64 |
| fin11g | Reason for no account: family member already has one | float64 |
| fin11h | Reason for no account: no need for services | float64 |
Table 3.
All the features in the dataset after treating the null values (Table part II).
| Variable Name | Description | Data Type |
| fin13 1b | Reason for no mobile money account: too expensive | float64 |
| fin13 1c | Reason for no mobile money account: lack documentation | float64 |
| fin13 1d | Reason for no mobile money account: lack money | float64 |
| fin13 1e | Reason for no mobile money account: use agent | float64 |
| fin13 1f | Reason for no mobile money account: no mobile phone | float64 |
| fin13a | Use mobile money account two or more times per month | float64 |
| fin13b | Use mobile money account to store money | float64 |
| fin13c | Use mobile money account to borrow money | float64 |
| fin13d | Use mobile money account without help | float64 |
| fin14 2 | Paid digitally for in-store purchase after COVID-19 | float64 |
| fin14c | Paid online or in cash at delivery | float64 |
| fin14c2 | Paid online for the first time after COVID-19 | float64 |
| fin24 | Main source of emergency funds in 30 days | int64 |
| fin24a | Difficulty of emergency funds in 30 days | float64 |
| fin24b | Difficulty of emergency funds in 7 days | float64 |
| fin26 | Sent domestic remittances | float64 |
| fin28 | Received domestic remittances | float64 |
Table 4.
Confusion Matrices and Other Evaluation Metrics for ML Models.
| ML Model | Confusion Matrix | TP | FP | TN | FN | F1-Score | Precision | Recall |
| Support Vector Machine |
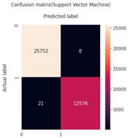 |
25,752 | 8 | 12,576 | 21 | 1.00 | 1.00 | 1.00 |
| Logistic Regression |  |
25,740 | 6 | 12,589 | 22 | 1.00 | 1.00 | 1.00 |
| Decision Tree Classifier |
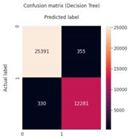 |
25,391 | 355 | 12,281 | 330 | 0.99 | 0.99 | 0.99 |
Disclaimer/Publisher’s Note: The statements, opinions and data contained in all publications are solely those of the individual author(s) and contributor(s) and not of MDPI and/or the editor(s). MDPI and/or the editor(s) disclaim responsibility for any injury to people or property resulting from any ideas, methods, instructions or products referred to in the content. |
© 2025 by the authors. Licensee MDPI, Basel, Switzerland. This article is an open access article distributed under the terms and conditions of the Creative Commons Attribution (CC BY) license (http://creativecommons.org/licenses/by/4.0/).
Copyright: This open access article is published under a Creative Commons CC BY 4.0 license, which permit the free download, distribution, and reuse, provided that the author and preprint are cited in any reuse.


