
Submitted:
21 October 2025
Posted:
22 October 2025
You are already at the latest version
Abstract
Energy consumption trends particulary for residental buildings have a significant share in terms of energy consumption. In the determination of consumption trends, it is crucial for instant and accurate measurement of the consumed energy by the electrical appliances in the residentals. This paper presents a low-cost, flexible, scalable and secure system for real-time analysis of key electrical parameters including RMS voltage and current, active, reactive, apparent power and cumulative energy consumption. The proposed system comprises multiple distributed sensor nodes and a central coordinator unit responsible for aggregating data from all active sensor nodes. In addition to other electronic circuits, all sensor nodes are equipped with an ESP8266 microcontroller and a PZEM-004T v3.0 energy sensor, while the coordinator node is equipped with the same controller and MicroSD card module. Internal communication between the sensor nodes and the central coordinator node is established via nRF24L01 radio frequency (RF) modules, whereas external connectivity of the system is maintained through Wi-Fi. User friendly interface. While real-time monitoring and data analysis can be performed through a user-friendly web-based interface, the data stored on the MicroSD card can be further evaluated using statistical software. In order to evaluate accuracy, The measurements from the designed energy metering device has been compared against those from the HIOKI 3334 AC/DC Power HiTester, known for its high sensitivity and precision after the network system was established. Then, the energy consumed by home appliances was measured by the designed system. As a result of power measurements, mean absolute percentage error was found as 1.71%. The most important advantage of the proposed system is the flexibility, portability, sensitivity under different loads, and the ability to display and record data without the need of a computer.
Keywords:
power quality
; energy
; embedded systems
; data acquisition system
1. Introduction
With the development of embedded system card technology and the decrease in microcontroller prices, microcontroller-based data collection systems have begun to be developed to store and monitor data. Although they are used in many different areas, they are especially preferred in buildings and in the continuous monitoring and control of renewable energy resources 24/7 [1,2,3]. Thanks to micro-controlled data acquisition systems, much more convenient storage systems can be established.
In order to accurately quantify the energy consumption of an electrical device, it is crucial to first determine the type of current upon which the device operates. Since there is no time-changing signal in circuits operating with direct current, there is no phase difference between current and voltage, and the power factor does not occur in these circuits. It will be sufficient to know the current and voltage values of these devices to calculate the power they consume. In circuits operating with alternating current, it is mandatory to use the power factor in calculations due to the time difference between the current and voltage values occurring in inductive and capacitive loads.
There has been much research and new studies in the literature on energy management, energy monitoring, smart energy meters, and energy analysers, and this trend continues. Karthichk et al. [4] designed an IoT-based commercial building energy management system to address IoT power quality problems and control the system. The system was tested at M/s Quantanics Techserve Private Limited. The system includes a real-time operating system and Advanced Reduced Instruction Set Computing (RISC) Machines (ARM). The energy meter in the proposed system was tested and compared with the Elmeasure iM-8000 meter. The results indicate that power quality issues are detected with over 90% accuracy. Mudaliar and Sivakumar [5] applied a real-time energy monitoring and management system in their paper. The system they used included IoT and Raspberry Pi. This system, implemented in an industrial facility, is reported to be economical, compatible with new sensors, and highly efficient and accurate. Ferdiansyah and Wardana [6] proposed a home energy power monitoring system. Their proposed system includes current-voltage sensors, an Arduino Uno, a relay, an LCD display, a cloud system, and IoT-based software. The system has been tested and found to have average voltage and current error rates of 0.30% and 0.28%, respectively, and provides real-time monitoring and management. Athanasiadis et al. [7] developed a real-time power monitoring and estimation system for home appliances. A new power estimation algorithm is proposed, which includes non-invasive load monitoring (NILM) and a convolutional neural network classifier. Various tests have shown that the system has high accuracy, fast response, low-latency computation, high performance, and an efficient structure.
In their article, Hariharan et al. [8] used an energy analyser system for a smart home management system. The system, which includes an Arduino Uno, has an Android application and is IoT-based. With its energy measurement feature, which can be recorded via the cloud, various system-related data can be accessed from mobile devices. Hussain et al. [9] designed and tested an online energy control system. The system, which includes a SCADA server, an IoT-based energy monitoring system, and a LoRa-based system, consists of a microcontroller, a Raspberry Pi, a Data Communication Network (DCN), and a Data Acquisition System (DAQ). The designed system was tested with simulation programs such as MATLAB and Proteus, and experimental system design and results were examined, demonstrating its efficiency and flexibility in real-time implementation and measurement. Khanna et al. [10] proposed a real-time energy meter for home and industrial usage. The proposed architecture, which allows for AC and DC measurements, used a Raspberry Pi. The system, which offers features such as high measurement accuracy, cost-effective implementation, ease of use, and integration with the EmonCMS web application, was tested with a PM3000 energy analyser. Elkholy et al. [11] designed a smart home management system for energy savings. The system, which also integrates a PV system, includes a Raspberry Pi 4B. The Cayenne IoT system was used to implement energy management for a smart home. Testing and analysing the results revealed a 23.13% percent cost reduction. The proposed system is remotely accessible, efficient, economical, and reliable.
Chen et al. [12] conducted an analysis of home electricity consumption. The study primarily focused on calibrating electricity meters. A smart energy analyzer was installed in the study home. The results were monitored and interpreted for four months. Similar pilot applications were implemented at the relevant electricity distribution company. Customer feedback was collected, and improvements were made. The study resulted in electricity savings, identification of actual energy demands, increased customer satisfaction, and improved service quality for the electricity distribution company. In the article, Paul and Manohar [13] integrated an energy analysis system for smart grids. They automated energy measurement and billing in the proposed system. The IoT-based system provides customers with information about their consumption by communicating with them when necessary. The Arduino-integrated system provides efficient power analysis and user-friendly energy monitoring. Kumar et al. [14] developed an IoT-based energy meter. The developed system utilises Fast Fourier Transform (FFT) calculations. The design utilises an ATMega328-P microcontroller to process sensor data to determine power. The system was tested against three Fluke power analysers and found to offer superior features, including low cost, efficiency, cloud storage, and accurate power measurement (<5% error rate). Kumar et al. [15] implemented home energy management using a smart energy meter in their study. In a home energy management system that includes a PV system and batteries, various electrical information is obtained using meter data. Customer electricity consumption behaviour is determined in the system, and solutions are implemented. The designed analyser was tested with the Typhoon HIL simulation program, and it was determined that the proposed system achieved the best results compared to the other compared methods.
Radhika et al. [16] implemented a home energy meter. In the designed system, the meter monitors home power consumption and sends a warning to the customer. Additionally, a power cut off feature can be activated based on consumption. The proposed system incorporates IoT integration using NodeMCU. Simulation and experimental results demonstrate the system’s accuracy and efficiency. Midul et al. [17] introduced their internet-integrated smart energy meter design. Using Arduino Nano, the system performs energy monitoring and provides customers with power and energy information via Short Message Services (SMS). The system’s primary purpose is energy monitoring and billing. The system, which includes an ESP-8266 Wi-Fi module and a GSM module, was designed using Proteus software. Hassan et al. [18] introduced a smart energy meter with billing features in their paper. The energy meter has an IoT-based system. The proposed system provides customer awareness through SMS and a mobile application. Muralidhara et al. [19] designed an energy meter capable of device-based monitoring in their article. Their proposed system is IoT-enabled and efficient. The design, which includes a Wi-Fi module and an Arduino Uno, aims to raise awareness among home customers about the energy consumed by individual devices. The system can also record the resulting power data and send it to the ThingSpeak application.
Muthu et al. [20] proposed the design of a remote-access smart energy analyser. The system, like similar studies, includes an IoT-based meter. The system includes a GSM module, Arduino, and sensors. The designed energy meter measures and stores the power data of each home appliance, and transmits it to an online storage unit via the GSM module. Ajay et al. [21] implemented an energy management meter in their paper. The designed structure includes mechanisms such as an IoT system, a GSM module, an SMS system, two-way communication, and power outage management with a relay. Energy measurements can be sent to customers via SMS. In article [22], Martinez-Blanco et al. designed and tested an IoT-based smart energy meter for homes. The study described an internet-connected smart meter that can analyse electricity and power consumption in homes. The proposed system includes an ESP32 microcontroller, an ACS712 current sensor, a relay, and an LM385 operational amplifier. Various tests were conducted with the Arduino-controlled system, allowing the energy analysis of different electrical appliances in a home to be observed. A literature review study for energy consumption analysis was conducted by Purwania et al. [23]. This study provided information about the microcontrollers, sensors, IoT technology, devices, and other system requirements used. The comparative table of previous researches and this study can be seen in Table 1.
When previous studies are reviewed, it is seen that in calculations where power factor is needed, the values from the central power factor measuring device located in the main distribution panel are used instead of individual measurements or the power factor is accepted as a constant value [24]. As a result of measuring the power factor centrally, corrections to the power factor with the help of compensation panels is important in order to achieve the desired active/reactive power ratio. Power factor correction has beneficial results such as; increasing the energy quality, preventing fines due to low power factor, saving on the electricity bill, the opportunity to switch to more affordable tariffs, reducing the power drawn from the grid, reducing losses, enabling the purchase of less costly devices in electricity-related investments [25,26]. However, using the power factor value that is obtained from the central measurement when calculating the power consumed by a single device will cause the make a mistake in the calculations. The integration of the PZEM module in each sensor node facilitates independent measurements of values such as current, voltage, power and power factor without the need for any other devices, thus eliminating the dependency on the power factor (cos ).
The error rate obtained in the measurement will also be reflected on the electricity bill. For this reason, in order to obtain correct values in the measurements, it is necessary to measure the current and voltage drawn by each device and the power factor value of the device correctly. In this study, it is aimed to obtain accurate power consumption by measuring instantaneous power factor, current and voltage values with the proposed device.
In the developed application, communication between nodes done by RF transmission. For the RF module nRF24L01 is used. nRF24L01 is a single chip 2.4GHz transceiver having embedded baseband protocol engine, specially designed to provide support to ultra-low power wireless applications. It is capable of transmit and receive data in half duplex and full duplex modes when programmed using a microcontroller. It uses SPI communication protocol and uses four data lines MOSI, MISO, SCK and CLK. It has multiple bit rate options 250kbps, 1Mbps and 2Mbps, and bit rate can be changed by developers based on specific needs by programming initials of the module [27]. It has features like auto-retransmission that activates when there is packet loss, and automatic acknowledgment that provides reliable data transmissions, making it suitable for applications where data integrity is crucial. nRF24L01 provides cost-effective and efficient solutions for wireless communication applications like sensor networks, remote control systems, home automation and robotics [28]. For these features, it has chosen for the application of this study.
PZEM-004T is another module that is used in the developed application. It is the measurement unit of the application. It measures key electrical parameters such as Voltage, Current, Real Power, Apparent Power, Reactive Power and Power Factor. It uses UART communication protocol and has four pinouts, VCC, GND, TX and RX. TX an RX pins are used in communication one transmits and other one receives [29]. PZEM-004T could have slightly low accuracy when comparing it with other measurement devices but it has compact and durable design, better stability then the compared ones and ease of integration with IoT platforms [30]. These features making it suitable for the developed project.
The ESP8266 (NodeMCU) was selected for this application because it offers an integrated, low-cost solution that combines a microcontroller, memory, and a built-in 2.4 GHz Wi-Fi module, enabling seamless Internet connectivity essential for IoT systems. With its Tensilica Xtensa 32-bit LX106 processor, 128 KB of RAM, and up to 4 MB of Flash memory, it provides sufficient processing power and storage for both control logic and data handling while leaving resources available for user applications [31]. Despite having a limited number of GPIO pins, its compatibility with shift registers such as the 74HC165 allows flexible input expansion for interactive elements [32]. Furthermore, its support for both station (client) and soft-AP (access point) modes, built-in TCP/IP networking capabilities, and a strong open-source ecosystem make it highly adaptable for IoT development [33]. These features, combined with affordability and wide community support, make the ESP8266 an ideal choice for implementing efficient, scalable, and cost-effective IoT solutions.
Thanks to this new design, the measured values were recorded in the defined time period from the moment the system was commissioned until it was deactivated. In the developed system, date, time, voltage, current, active power, reactive power, apparent power, frequency, and power factor values are recorded. In this system, characterized by its flexible architecture, new parameters such as humidity, temperature, and others can also be integrated by selecting the appropriate devices. The most important point to consider here is the number of input and output pins and the supply voltage range of the microcontroller used. The sensors to be connected to the input terminals of the microcontroller must have maximum value of 5 V.
The developed system additionally has the following features. After the system is activated, it records the measured values every second for a duration of 1 second per sensor node. This sampling time can be adjusted if desired. The system has a flexible structure. It can be improved by adding new sensors. Since the system has its own MicroSD card, it does not need a separate computer. The requested data is saved directly to the file with CSV (Comma-Separated Variables) extension. This recording format can be converted to TXT (Text) by simply changing the file extension. Since both writing formats are alike and the only difference between them is that the delimited fields are tab or comma separated, the format can be adjusted according to the preference of the person using the device. Since the data is saved on the SD card compatible with different operating systems, it can be used in any Windows, Linux or MACOS operating system without the need for any additional software. The data is also saved on a PostgreSQL database via Wi-Fi as JSON to a Node.js API server, which securely stores the data.
Additionally, the resulting txt file can be opened with Notepad or can be easily transferred to application programs such as MATLAB, Excel, R, etc., where graphical results can be obtained by performing mathematical analysis. Thanks to the LCD (Liquid Crystal Display) in the system, the desired data can be displayed on the screen, thus eliminating the need for an additional external display. Finally, the file in which the data is saved can be transferred to the computer by means of the Micro SD card slot or wireless network.
The main contributions of this study are listed as follows;
- The energy consumption of all desired household appliances can be measured and recorded without the need for a computer. Additionally, all measurements can be controlled via Web and mobile applications to prevent overconsumption.
- The instantaneous power consumption and power factor of individual household appliances can be monitored.
- The sampling interval for energy measurements can be adjusted,
- The proposed system provides low data usage for data recording and consumes minimal memory space,
- The system has a data output structure suitable for detailed data analysis in different computer programs,
- Data can be stored on the server with the PostgreSQL database recording feature,
- This paper contributes to the literature for future energy monitoring system studies,
- Additionally, the study results show the energy consumption trends of household appliances.
- The system has a flexible structure. Regardless of brand, the system can be expanded depending on the number of pins on the microcontroller and the input and output voltages of the new sensors/devices to be connected.
- Moreover, environmental functions such as temperature, humidity, gas sensors, etc.can be easily integrated into the system.
- In order to improve the measurement accuracy of the measurements, an ADC with a higher number of bits can be added.
- In the proposed system, coordinator nodes can control different and independent sensor nodes. By placing sensor nodes at all electrical outlets in a home, energy monitoring of all connected appliances can be achieved from a single point. Communication between the sensor nodes and the coordinator node is achieved remotely via Wi-Fi and RF.
- By easily changing the embedded system software, the system can work with different communication protocols such as ZigBee in addition to Radio Frequency and Wi-Fi.
- As a result of the measurements, it is observed that the measurement error in voltage, current, power factor, and power is generally a maximum of 1% when the results are compared with a more sensitive etalon device.
- In consequence of power measurements, it was determined that the average absolute percentage error was 1.71%.
2. Design and Implementation of Project
The system’s architecture employs a star network topology, a configuration that is particularly advantageous for IoT applications involving multiple distributed nodes communicating with a central entity. The configuration of the architecture in question has been demonstrated to facilitate the streamlining of network administration and ensure the efficient transmission of data from measurement points to the central aggregation and logging unit [34].
The system is composed of two distinct categories of devices: The Sensor Node(s) and the Coordinator Node. The Sensor Node(s) consist of one or more units that are dedicated to the measurement of electrical parameters at designated locations. Conversely, the Coordinator Node functions as a centralized hub that collects, displays and records the data transmitted by all sensor nodes.
The Sensor Node’s primary function is to operate as a remote data acquisition unit. The primary functions of the device encompass measurement, RF transmission, and user configuration. For measurement purposes, the device interfaces with the PZEM-004T v3.0 energy meter via a serial connection, enabling the periodic acquisition of a comprehensive set of electrical parameters. These parameters include voltage, current, power, energy, frequency, and power factor [35]. With regard to RF transmission, the collected data are encapsulated into a custom data structure and wirelessly transmitted to the Coordinator Node via the nRF24L01 module [36]. With regard to user configuration, the Sensor Node instigates a self-contained web server in the absence of a connection to a known Wi-Fi network. The server in question provides an interface that enables users to scan available networks and submit their credentials. This facilitates a user-friendly initial setup, obviating the need for prior programming or serial communication. Sensor node also shows the needed information such as IP address, Voltage, Current, Power, etc. on the LCD screen.
The Coordinator Node is the system’s central control unit and data repository. The core responsibilities of the system encompass RF reception, data processing and visualisation, data logging, and time synchronisation. With regard to RF reception, the system under discussion perpetually monitors the receipt of data packets from all registered sensor nodes. With regard to data processing and visualisation, the system parses the received packets and presents real-time information from a selected sensor on the integrated OLED display. A physical button is also present, enabling the user to cycle through the active sensors. In the context of data logging, each received data packet is appended to a CSV file stored on a MicroSD card, along with a Unix timestamp, to a CSV file stored on a MicroSD card and PostgreSQL database. This process ensures the creation of a permanent and long-term record of the system’s energy consumption. In order to achieve time synchronisation, the node is required to establish a connection with a user-specified Wi-Fi network during the initialisation process. This is done exclusively to align the node’s internal real-time clock (RTC) with an NTP server. The purpose of this alignment is to ensure that all logged data is accompanied by globally accurate timestamps. As illustrated in Figure 1, a general block diagram is provided which demonstrates the relationship between the sensor nodes and the Coordinator Node.
2.1. Communication Protocols Used in Proposed System and Data Flow
In the proposed system, the connection and communication with the computer are facilitated through a Universal Serial Bus (USB) interface. It is evident that microcontrollers utilise serial communication protocols for the purpose of interacting with peripheral devices. Specifically, the protocols employed for facilitating device-to-device communication include Universal Asynchronous Receiver Transmitter (UART), Inter-Integrated Circuit (I2C), and Serial Peripheral Interface (SPI). The various types of serial communication connections utilised within the system are illustrated in Figure 2 [37].
By default, the UART port on the microcontroller operates through digital pins 0 and 1, designated as TX (Transmit Data) and RX (Receive Data), respectively. In order to facilitate effective communication, it is necessary for the corresponding terminals of the devices to be interconnected. It is evident that UART communication facilitates data exchange between two devices, yet it does not necessitate the utilization of a synchronous clock signal. The overall system architecture incorporates a set of communication protocols, each of which has been selected for its particular advantages within the context of the project [38]. The protocol employed for enabling point-to-point communication between the ESP8266 microcontroller and the PZEM-004T energy meter within each Sensor Node is the Universal Asynchronous Receiver-Transmitter (UART) protocol. This protocol, utilizing merely two lines (TX and RX), provides an efficient means of acquiring the digital measurements generated by the sensor. The ubiquity of UART as a standard for inter-chip communication can be attributed to two key characteristics: simplicity and robustness.
Another communication protocol employed by the microcontroller is the I2C (Inter-Integrated Circuit) protocol. The protocol necessitates two lines and pull-up resistors for physical connectivity, a characteristic that has led to its designation as the Two-Wire Interface (TWI). The I2C interface, initially developed by Philips, employs SDA (Serial Data) and SCL (Serial Clock) terminals. The protocol supports data transfer speeds of up to 400 Kbps, with SDA facilitating data transmission between devices and SCL ensuring proper timing synchronization [39]. In the proposed system, the Coordinator Node employs the I2C protocol to interface with the OLED display. The I2C bus is particularly well-suited to this application due to its ability to share a bus between multiple devices, thereby optimizing the utilization of GPIO pins on the microcontroller.
The SPI protocol, developed by Motorola, is a protocol that is commonly employed for communication with pre-assembled expansion modules (shields) in embedded systems due to its high-speed data transfer capabilities [40]. In contrast to UART, SPI facilitates concurrent communication with multiple devices. Like I2C, it necessitates a master device that functions as the orchestrator of communication, controls device selection, and manages the timing of data exchanges. SPI communication utilises four primary terminals: The MOSI (Master Out Slave In), MISO (Master In Slave Out), SS (Slave Select), and SCK (Serial Clock) are also used. The MOSI transmits commands from the master to the slave devices, the MISO returns data from the slaves to the master, the SS selects the active slave device, and the SCK synchronizes data transmission. The extant research indicates that SPI exhibits lower energy consumption than I2C and UART, while achieving superior data transfer speeds. Indeed, SPI supports rates of 4 Mbps and higher [41]. In the proposed system, the SPI protocol is utilised by the microcontrollers to interface with both the nRF24L01 RF module and the SD Card module. Despite the aforementioned similarities, it is important to note that both peripherals share common data and clock lines (MOSI, MISO, SCK). However, independent Chip Select (CS) pins ensure exclusive control, thereby allowing the microcontroller to activate only the intended device. This configuration facilitates the sharing of a common bus by multiple high-throughput devices without the occurrence of conflicts [42].
The wireless energy monitoring system employs a variety of complementary communication protocols to ensure reliable data acquisition, transmission, and logging. As illustrated in Figure 3, the specific protocols employed and their respective functions within the overall data flow architecture are mapped to their corresponding layers in the OSI (Open Systems Interconnection) reference model. This highlights their roles in ensuring structured and efficient communication across the system [43].
Radio Frequency (RF) via nRF24L01 is the primary data link between the sensor(s) and the coordinator. The nRF24L01’s “Enhanced ShockBurst” protocol provides features like packet acknowledgment and retransmission, creating a reliable link. The network is configured with the coordinator listening on multiple “pipes (ports)”, allowing it to receive data from up to six sensor nodes concurrently without data collision. Data is sent as a compact binary struct, which is far more efficient than text-based formats like JSON for this application, reducing transmission time and power consumption [36].
The IEEE 802.11 standard, commonly referred to as Wi-Fi, plays a dual role in this context. Initially, the Sensor Node operates in Access Point (AP) mode to provide a secure, password-protected, web-based configuration portal, including a captive portal that automatically redirects users to the setup interface. Following configuration, the Sensor Node transitions to Station (STA) mode to establish a connection with the user’s network. In this mode, the Node hosts a password-protected web dashboard, facilitating real-time data monitoring and device management. On the Coordinator Node, Wi-Fi operates solely in Station (STA) mode, primarily to perform an NTP query at start-up to obtain the current time [44]. In the event of a connection failure, the Coordinator Node has the capacity to receive updated network credentials from a Sensor Node via the RF handshake mechanism.
As demonstrated in Figure 4, the system’s operation is facilitated by a meticulously structured data flow. The process under discussion may be subdivided into three distinct phases: initial setup, coordinator synchronization (including a specialized handshake for configuration), and the primary operational loop. The sequence diagram provides a clear representation of the data flow within the system.
The initial device setup is a user-driven phase that is required only once for each sensor node. The user is required to establish a connection between a computer or smartphone and the Wi-Fi Access Point that is broadcast by the Sensor Node. This is then followed by the user accessing the configuration portal via a web browser. It is via this interface that the user selects the local Wi-Fi network and submits the corresponding password. The Sensor Node is responsible for storing these credentials in its non-volatile EEPROM memory, and subsequently reboots in order to apply the new configuration [45].
The process of Node Initialization and Configuration Handshake is initiated. Upon initiation, both the Sensor and Coordinator Nodes initialize their nRF24L01 modules to operate on the same RF channel and communication pipes. Subsequently, the Coordinator Node endeavours to establish a connection with the Wi-Fi network that has been stored. In the event of a successful outcome, the system synchronizes its internal clock with an NTP server, thereby ensuring the provision of precise timestamps for data logging. In the event of a connection failure, such as the presence of missing or incorrect credentials, the coordinator enters a specialized Requesting Config state. In this state, the system transmits a request packet to a Sensor Node via the RF link. Upon receipt of the request, the Sensor Node responds by transmitting its verified Wi-Fi credentials to the coordinator, which stores them in its EEPROM and reboots. This mechanism enables the coordinator to be configured without the need for direct user intervention, a critical feature for headless deployment.
Main Operational Loop: This phase constitutes the continuous core operation of the system. The Sensor Node periodically polls the PZEM-004T sensor to acquire the latest electrical measurements, packages the data into a compact binary structure, and computes a checksum for preliminary data integrity verification. Subsequently, the packet is transmitted to the Coordinator Node, where the nRF24L01 module automatically verifies the CRC. In the event that the CRC is valid, the coordinator firmware will proceed to verify the internal checksum. Upon successful completion of the full validation process, the Coordinator’s RF module transmits an acknowledgment (ACK) to the Sensor Node, thereby confirming the successful delivery of the message. The coordinator then processes the data by retrieving the current timestamp, formatting the data as a CSV string, appending it to the SD card log, and updating the OLED display. In the event that the Sensor Node does not receive an acknowledgement (ACK), due to packet loss, corruption, or a lost acknowledgment, the nRF24L01’s Enhanced ShockBurst protocol will automatically retransmit the packet. This ensures a highly reliable communication link [42].
The system aims to improve data reliability and enable remote backup by combining local SD card storage with a secure, scalable architecture. While sensor data is still logged to an SD card on the ESP8266 device, it is also transmitted via Wi-Fi as JSON to a Node.js API server, which securely stores the data in a PostgreSQL database. This hybrid approach protects against SD card failures, ensures structured long-term storage, and provides remote access to measurements. Depending on project needs, the API server and database can run locally on a laptop for development, on a Raspberry Pi for low-cost continuous operation, or in the cloud for global accessibility, high availability, and scalability.
2.2. Hardware Components
The hardware selection was guided by criteria emphasizing low cost, high availability, modularity, and robust community support.
The ESP8266 is a low-cost Wi-Fi microchip featuring a complete TCP/IP stack and integrated microcontroller functionality. The device is powered by a 32-bit Tensilica L106 RISC processor, which provides sufficient computational capability for the tasks required in this project. The device’s defining feature is the incorporation of a 2.4 GHz Wi-Fi transceiver, which conforms to the IEEE 802.11 b/g/n standards, thus facilitating connectivity to wireless networks or its utilisation as an access point. The NodeMCU development board integrates the ESP8266 chip with essential peripherals, encompassing a USB-to-serial converter for programming and debugging, a 3.3 V voltage regulator, and breadboard-compatible I/O pins. The ESP8266 functions as the central processing unit for both the Sensor and Coordinator Nodes, with its high-performance processor and integrated Wi-Fi facilitating the project’s user-friendly web-based configuration and monitoring interface [35].
The PZEM-004T is a compact, self-contained energy metering module. The device is able to measure voltage through direct connection to the AC line within a range of 80–260 V and measure current using a non-invasive current transformer (CT). The CT is designed to clamp around a single AC conductor, thereby detecting the magnetic field that is generated by the current flowing through it; this configuration obviates the requirement for physical contact with high-voltage wiring. The onboard circuitry, which includes a dedicated metering IC, processes these signals to compute RMS voltage, RMS current, active power (W), power factor, frequency (Hz), and cumulative energy (Wh). The parameters are made accessible through a 5 V TTL serial (UART) interface, employing the Modbus-RTU protocol. The primary function of the module is to facilitate the abstraction of the complexity and safety risks associated with direct AC power measurement. The utilisation of complex analog signal conditioning and computational circuits is circumvented by the microcontroller, which has the capacity to directly request precise digital measurements from the module via serial commands. This approach has been shown to significantly simplify the design of the Sensor Node, enhance measurement accuracy, and improve the overall safety of the system [46].
The nRF24L01+ module operates within the 2.4 GHz Industrial, Scientific, and Medical (ISM) radio band. Despite the absence of Wi-Fi functionality, the device utilises a proprietary communication protocol, designated as ’Enhanced ShockBurst, to facilitate communication. This packet-based transport layer protocol has been developed to automatically manage critical low-level functions, including packet framing, CRC-based error detection, and, most importantly, automatic packet acknowledgment (ACK) and retransmission (ART). Upon transmission of a data packet by a Sensor Node (Transmitter, PTX), a response in the form of an ACK from the Coordinator (Receiver, PRX) is awaited. In the absence of acknowledgement within a predefined interval, the module automatically retransmits the packet, thereby significantly enhancing link reliability without imposing complex logic on the microcontroller firmware. The selection of the nRF24L01+ module was informed by the intentional preference for establishing a private data network over Wi-Fi for inter-node communication. The advantages of this decision include low latency, simplicity, network isolation and reliability. This configuration provides enhanced communication speed and reliability in comparison to a full TCP/IP link, whilst maintaining the separation of sensor traffic from the primary Wi-Fi network. This approach has the dual benefits of enhancing both network security and performance. The ’Enhanced ShockBurst’ protocol is an innovative piece of technology that solves a number of problems inherent to the field. By handling acknowledgments and retransmissions at the hardware level, it ensures a highly reliable link without the need for extensive software overhead [36].
The project employs two types of displays, each tailored to the specific function of its respective node. Both types of display utilise the I2C protocol to minimize microcontroller pin usage. The Sensor Node incorporates a standard 16x2 (16 columns, 2 rows) character LCD. These displays typically necessitate a multitude of parallel data pins; nevertheless, to streamline the wiring process, an I2C ’backpack’ module has been integrated with the LCD. The present module incorporates a PCF8574 I/O expander chip, thereby functioning as a bridge, translating two-wire I2C commands (SDA and SCL) from the microcontroller into the parallel signals required to operate the LCD. As has been confirmed in the Sensor Node firmware, the I2C LCD provides immediate on-site visual feedback of electrical measurements, cycling through voltage, current, power, and other critical parameters. This feature enables the preliminary configuration and diagnostic procedures to be conducted without the requirement of accessing the web interface.
LCD screen was used to instantly monitor the data obtained in the control section It can be connected to the microcontroller by different methods, and care has been taken to use the minimum number of terminals. There are a total of 16 pins on the LCD board. The first terminal, Vss, is used for ground, and the second terminal, Vdd, is used for the supply voltage. V0, the third pin of the LCD, is used to adjust the contrast of the LCD screen by using a potentiometer. If contrast adjustment is not desired, this terminal must be grounded. The fourth pin, RS (Register Select), is used to switch between sending commands or reading data. When the RS terminal is 1 (HIGH), the data option will be selected. In this case, pins D0-D7 will be used for data. When the RS pin is 0 (LOW), the command option will be selected instead of data and D0-D7 pins will be defined for the command. R/W (Read/Write) terminal is the fifth terminal and is used to determine whether the data will be written to the LCD or the data will be read from the LCD. When the R/W pin has a value of 0, it indicates that data will be written to the LCD, and when it has a value of 1, it indicates that data will be read from the LCD. E (Enable) terminal is the sixth terminal and enables writing to Registers. There are eight D0-D7 terminals and these terminals are used as data bus. Commands or data are sent to the LCD from these terminals. When the LCD is operated as 4 bit, D4-D7 pins will be used. The remaining 4 ends (D0-D3) will not be connected. When the LCD is first powered on, it starts working in 8-bit mode. Start-up commands are sent in 8 bits. Since the D0-D3 pins are not connected, they cannot carry the bits they receive. After the first 4 commands, the LCD is switched to 4-bit operation. When the LCD is operated as 8 bits, all D0-D7 pins will be actively used. The last two pins on the LCD board are the fifteenth and sixteenth pins and are designated A and K. These terminals are used to illuminate the background of the LCD screen. Since the LCD screen is illuminated with an LED lamp, the A terminal represents the anode (+ terminal) and the K terminal represents the cathode (- terminal). For screen illumination, 5 V must be entered at the A terminal and 0V must be entered at the K terminal. In case of direct connection of the LCD board to the microcontroller board, it is necessary to use many pins on the microcontroller. If 4 bits are used, 12 bits will be used, and if 8 bits are used, a total of 16 bits will be used. I2C converter card was used in the project to use fewer pins. Thanks to this card, pin savings are achieved on the microcontroller card, which uses only four pins on the microcontroller [2,47]. The LCD card, which has 16 pins, is connected to the microcontroller with the help of the I2C converter card is shown in Figure 5. The jumper on I2C is used for addressing. Since only one LCD screen with I2C converter was used in the project, there was no need for addressing. When more than one LCD screen is wanted to be used with an I2C converter, it must be addressed using the A0, A1 and A2 (Address input 0,1,2 = Address input 0,1,2) terminals with the help of a connecting wire.
The Coordinator Node utilises a 128x64 pixel monochrome Organic Light Emitting Diode (OLED) display. In contradistinction to LCDs, which necessitate a backlight, each OLED pixel emits its own light. This results in superior contrast (true blacks), wider viewing angles, and reduced power consumption, particularly when large portions of the screen remain dark. The communication with the microcontroller is facilitated by the I2C protocol, typically through an SSD1306 driver chip [48]. The OLED display, which functions as the primary user interface in accordance with the Coordinator Node firmware, provides a rich graphical representation of real-time data from the Sensor Nodes. This graphical representation includes system status indicators, such as Wi-Fi connectivity and time, as well as the ability to identify the currently selected sensor. The higher resolution of the device’s display relative to that of the character LCD facilitates the presentation of more detailed and user-friendly information.
The MicroSD Card module constitutes a compact breakout board that integrates a MicroSD card socket in conjunction with level-shifting circuitry, thereby facilitating the interface between a 3.3 V microcontroller and a 5 V SD card. It communicates with the microcontroller via the SPI bus. In this configuration, the data and clock lines are shared between the two components, namely the nRF24L01+ module and the aforementioned microcontroller.
The firmware utilises the standard SD library, which implements the FAT (File Allocation Table) file system. Consequently, the generated files are able to be readily accessed by any computer. The MicroSD card module, a standard component, offers persistent and high-capacity storage. The utilisation of the FAT (File Allocation Table) file system ensures that the resulting CSV (Comma Separated Values) log files are universally compatible. The provision of a reliable power supply is of critical importance for the stability of embedded systems. In order to guarantee uninterrupted and reliable functioning of the Sensor Node, a compact 220 VAC to 5 VDC power supply module is employed. This configuration enables the system to be powered directly from a standard wall outlet, thereby eliminating the requirement for external USB adapters and ensuring consistent performance. The 5 V output from this converter is supplied to the VIN pin of the NodeMCU boards.
The system’s modules have varying voltage requirements: the ESP8266 and nRF24L01+ operate at 3.3 V, whereas the PZEM-004T and LCD can function at 5 V. The NodeMCU board’s onboard 3.3 V regulator adequately powers the ESP8266 and nRF24L01+; however, the nRF24L01+ is particularly sensitive to power supply fluctuations, especially during transmission bursts. To maintain stable operation, a decoupling capacitor (e.g., 10 µF) is commonly placed directly across the module’s VCC and GND pins to mitigate voltage drops [49].
The system consists of two ESP8266-based nodes with distinct pin assignments for their respective functions. The sensor node utilises pins D4 (GPIO2) and D0 (GPIO16) for UART communication with the PZEM-004T energy monitoring module. For wireless communication, pins D3 (GPIO0) and D8 (GPIO15) control the nRF24L01 transreceiver’s CE and CSN signals, while SPI communication employs pins D5 (GPIO14) for SCK, D7 (GPIO13) for MOSI, and D6 (GPIO12) for MISO. The sensor node’s LCD display connects via I2C using pins D2 (GPIO4) for SDA and D1 (GPIO5) for SCL [49].
The Coordinator Node employs the same nRF24L01 and SPI pin configuration used by the Sensor Node. Furthermore, it interfaces with an SD card module using pin D4 (GPIO2) as the chip select, whilst sharing the common SPI bus. The OLED display employs the same I2C pins as the Sensor Node’s LCD, with D2 (GPIO4) for SDA and D1 (GPIO5) for SCL. This configuration has been demonstrated to guarantee effective use of hardware resources, whilst concurrently ensuring that clear functional separation between the two nodes is maintained. As demonstrated in Figure 6 and Figure 7 the pin configurations of the Sensor and Coordinator Nodes are illustrated respectively. The sensor nodes and the coordinator node communicate with each other via RF.
2.3. Software Implementation for Embedded Cards
The firmware for both nodes was developed in the programming language C++, utilising the embedded framework provided by the PlatformIO integrated development environment (IDE). The development process was executed within the Visual Studio Code environment, utilising PlatformIO’s sophisticated features for dependency management and project organisation [50].
The key interfaces employed in the project are as follows: The following header files are required for interfacing with the PZEM-004T v3.0 module: PZEM004Tv30.h. The following header files are required for managing nRF24L01+ RF communication: RF24.h. The following header files are required for implementing the non-blocking web server on the Sensor Node: ESPAsyncWebServer.h. The following header files are required for controlling the I2C LCD on the Sensor Node: LiquidCrystal_I2C.h. The following header files are required for operating the I2C OLED on the Coordinator Node: Adafruit_SSD1306.h. The following header files are required for interfacing with the MicroSD card module: SPI.h and SD.h. The following header file is required for persistent storage of configuration data: EEPROM.h. The Sensor Node firmware (sensor_node.cpp) can be regarded as a sophisticated application, in that it is capable of harmonising real-time data acquisition with a user-friendly and secure Wi-Fi configuration interface.
The firmware’s operation is structured around a state machine implemented within the main loop function. The device operates in two primary modes, as illustrated in the state diagram shown in Figure 8.
Station (STA) Mode is the default mode. It connects to a known Wi-Fi network to enable its web interface and potentially other network services. It continuously reads sensor data and transmits it to the coordinator. If it fails to connect to a saved network, it creates its own Wi- Fi network. In Access Point (AP) mode, its sole purpose is to serve a web page that allows the user to configure new Wi-Fi credentials. This fail-safe mechanism ensures the device is always configurable.
Security represents a primary concern in the system’s design, with multi-layered measures incorporated to ensure protection. These include the use of Secure AP Mode, a web interface subject to authentication, management of sessions, and the configuration of credentials. Upon entering AP (Access Point) mode for configuration, the device does not generate an open network. In the implementation of the sensor_node.cpp, the AP is secured with WPA2 encryption using a hardcoded password. For a production environment, this password is made unique per device, it is derived from their MAC address, to prevent unauthorized initial setup. Once connected in STA mode, access to the web interface is not public. The firmware implements a login system (handleLogin, authenticate). Users must provide a valid username and password to access any page. This prevents unauthorized users on the same Wi-Fi network from viewing energy data or changing device settings. Upon successful login, the server creates a session cookie (PZEMTOKEN) to keep the user logged in for a set period, providing a seamless user experience without requiring a login for every page click. Users are not stuck with default credentials. The /user-settings page allows them to change the login username and password, which are then saved securely to the device’s EEPROM. The user’s password is not written to EEPROM in plain text. Instead, a random "salt" value is generated for each password and the password’s "salted hash" (salted SHA-256 hash) is stored. This makes it impossible to obtain the original password even if the EEPROM is read.
The Coordinator Node firmware (coordinator_node.cpp) places particular emphasis on reliability, data integrity, and ease of management. The system has been engineered to ensure uninterrupted data acquisition, even in the face of network challenges. The firmware functions in accordance with a state machine that determines the coordinator’s operational mode based on Wi-Fi connectivity. As demonstrated in Figure 9, the ’Data Processing’ path remains continuously active.
Multi-Pipe listening and Wi-Fi configuration handshake are advanced communication protocols. The nRF24L01 is configured to listen on multiple “reading pipes” each with a unique address corresponding to a sensor. This configuration facilitates the Coordinator Node’s reception of data from multiple Sensor Nodes concurrently without the occurrence of packet collisions. The coordinator is distinguished by a distinctive mechanism that facilitates configuration without the necessity of a direct user interface. In the event of an unsuccessful attempt to connect to the Wi-Fi network, the device transitions into a state designated as REQUESTING CONFIGURATION. During this phase, the device initiates the transmission of a unique request packet to Sensor Node 1. Upon receipt of the aforementioned request, the Sensor Node returns its stored Wi-Fi credentials to the coordinator. The coordinator then saves the aforementioned credentials and reboots, automatically joining the network. This handshake protocol has been demonstrated to significantly simplify the deployment of new coordinators within an existing system.
During the developmental process, a number of practical challenges were encountered. With regard to RF interference, preliminary testing revealed sporadic packet loss, attributable to interference from proximate Wi-Fi networks operating within the same 2.4 GHz band. This issue was mitigated in a number of ways. Firstly, a less congested RF channel was selected, which was located within the operational range of the nRF24L01 module. Secondly, the module’s built-in error correction and retransmission features were utilised. With regard to power stability, the nRF24L01+ module has been shown to be particularly sensitive to fluctuations in supply. Early prototypes demonstrated reliability concerns until the implementation of a stable 3.3 V power supply, which occasionally necessitated the integration of an additional decoupling capacitor directly across the module’s power pins to mitigate current spikes during transmission.
2.4. User Interface (UI) Analysis
The Sensor Node provides a comprehensive, self-hosted web interface for configuration, real-time monitoring, and data analysis. The interface has been designed to prioritise security, user-friendliness and accessibility from any contemporary web browser within the same network. Access to the system is protected by a username and password authentication system. The ensuing sections are devoted to a detailed description of each page of the web interface, including its intended purpose and its most salient features.
The login page functions as the primary security gateway for the system, thereby preventing unauthorised access to energy data and device settings. In order to successfully complete the authentication process, it is necessary to provide a valid username and password. The default credentials are provided during the initial setup process. In the event of erroneous credentials being entered, the system displays a generic error message without indicating which part of the credential was invalid. In the event of a successful login, the server generates a session cookie (PZEMTOKEN) for the purpose of maintaining user authentication across different pages for a defined period.
The dashboard functions as the centralised control panel for real-time data visualisation, thereby providing an overview of all critical electrical parameters measured by the PZEM-004T sensor. The page employs JavaScript to retrieve updated data from the /data API endpoint at 500 millisecond intervals, thereby ensuring that the values displayed remain current without requiring a page refresh. The primary dashboard provides a comprehensive data display, incorporating voltage (V) and current (A) with graphical gauges denoting levels relative to predefined maxima, real power (W), apparent power (VA), and reactive power (VAR). This offers a complete view of power consumption. Furthermore, the display incorporates dedicated value cards and gauges to present cumulative energy (kWh), frequency (Hz), and power factor (PF). A status bar situated at the top of the screen provides information regarding the connected Wi-Fi network (SSID), the device’s IP address, its unique Device ID, the status of the nRF24L01 connection, and the current system time if synchronised with an NTP server. A persistent navigation menu facilitates straightforward access to additional interface sections, encompassing Charts, Wi-Fi Settings, Device Settings, User Settings, and Logout. The user interface is illustrated in Figure 10.
Charts page offers a powerful tool for historical data analysis, allowing the user to visualize trends in energy consumption over time. Interactive graphing utilises the Chart.js library to render dynamic, interactive line charts. Users can select which parameters (e.g., Voltage, Current, Power) to display on the chart using a series of checkboxes. The chart intelligently groups related data on different Y-axes for clarity. It fetches the buffered data and provides it to the user as a PZEM data.csv file for offline analysis in spreadsheet software. Users can clear the device’s internal data buffer.
The Wi-Fi Settings page offers a user-friendly interface for connecting the Sensor Node to a local Wi-Fi network, which is imperative for initial device setup, particularly when operating in Access Point (AP) mode. The initiation of an asynchronous request to the /scan endpoint is facilitated by the ’Scan Wi-Fi Networks’ button. The results are presented in a dropdown list, which displays each network’s SSID and signal strength (RSSI), thus enabling the user to select the desired network with ease. The Wi-Fi credentials can be entered in a standard password field. Upon submission, the credentials are stored in the EEPROM of the device and the device subsequently reboots automatically in order to establish a connection with the new network.
The User Settings page facilitates the management of security credentials for accessing the web interface. The system incorporates a designated interface to modify usernames and passwords, a crucial aspect for ensuring device security following the preliminary configuration. It is notable that the ’Reset Zone’ section facilitates access to critical operations that have the potential to be destructive; these include links to the ’/factory-reset’ page and the ’/reset-energy’ page. The latter enables the user to reset the cumulative energy (kWh) counter on the PZEM module to zero.
Device Settings page is used to configure the unique identifier for the sensor node within the nRF24L01 network.
The Device ID configuration feature incorporates a dropdown menu that enables the user to assign the Device ID to either 1 or 2. This functionality is pivotal in facilitating communication between multiple Sensor Nodes and the Coordinator, thereby preventing address conflicts. The Status Display provides information regarding the current Device ID and the operational status of the nRF24L01 radio connection. Subsequent to any alteration in the Device ID, the nRF24L01 module is automatically reinitialised with the updated address settings, thus ensuring seamless communication.
System Action pages are a type of informational interface that functions as a confirmation or status page, designed for specific operations. The /factory-reset page presents a conspicuous cautionary notice concerning the ramifications of executing a factory reset, a process that results in the complete removal of both Wi-Fi and user settings. It is important to note that this action is only undertaken upon the explicit confirmation of the user. The /reset-energy page displays a confirmation dialog prior to issuing the command to the PZEM module to reset its cumulative energy counter, thereby initiating a new measurement period. The logout page serves to inform the user of a successful logout, and automatically redirects to the login page after a brief interval.
3. System Testing and Results
The accuracy of the PZEM-004T Sensor Node was validated through comparison with a high-precision, commercial-grade power analyser. In order to conduct this evaluation, a contemporary non-linear load was utilised; this was in the form of a 33 W smartphone fast charger actively charging a telephone. Reference measurements for the electrical parameters were obtained using a HIOKI 3334 AC/DC Power HiTester. A comparison was made of the voltage, current, active power and power factor readings obtained from the Sensor Node with the corresponding measurements recorded by the Hioki power analyser.

Table 2.
Accuracy Verification against HIOKI 3334
| Parameter | PZEM-004T Reading | HIOKI 3334 Reading | Deviation |
|---|---|---|---|
| Voltage | 220.3 V | 220.5 V | -0.09 % |
| Current | 0.18 A | 183.5 mA | -1.91 % |
| Power | 23.9 W | 23.83 W | 0.29 % |
| Power Factor | 0.59 | 0.589 | 0.17 % |
The comparison yielded minimal deviation across all measured parameters. The PZEM004T exhibited high accuracy even under complex, non-linear loads, such as a switching power supply, thereby confirming its suitability for the monitoring of contemporary electronic devices. The findings of this study corroborate the hypothesis that the system is capable of delivering reliable and actionable energy data for real-world applications.
The reliability of the nRF24L01+ communication link was the subject of a study conducted within a conventional residential environment. In order to assess the effectiveness of the positioning system, the Coordinator Node was situated centrally while a Sensor Node was relocated at varying distances with obstacles such as walls and floors in the way. It was demonstrated that a consistent and reliable data link could be maintained up to a distance of approximately 15 metres, even in circumstances where there were two interior walls obstructing the line of sight. Beyond this range, a noticeable loss of packets was observed. This level of performance is regarded as adequate for the majority of single-family residences and small office applications.
The system functioned uninterruptedly for a period of four hours, during which no errors were encountered. During this period, the Coordinator Node successfully logged over 7,200 data entries to the SD card. The following example of the recorded data is provided below for illustrative purposes.
Table 3.
Example of Logged Data from SD Card
| DateTime | DevID | V | A | W | VA | VAR | KWh | Hz | PF |
|---|---|---|---|---|---|---|---|---|---|
| 2025-06-21 05:03:50 | 1 | 221.3 | 0.980 | 217.1 | 224.7 | 22.1 | 12.565 | 49.9 | 0.98 |
| 2025-06-21 05:03:50 | 2 | 220.4 | 3.602 | 793.5 | 793.5 | 0.0 | 0.041 | 50.0 | 1.00 |
| 2025-06-21 05:03:52 | 1 | 220.5 | 0.851 | 187.4 | 194.2 | 15.8 | 12.565 | 49.9 | 0.98 |
| 2025-06-21 05:03:52 | 2 | 220.5 | 3.603 | 794.2 | 794.2 | 0.0 | 0.041 | 50.0 | 1.00 |
| 2025-06-21 05:03:54 | 1 | 219.9 | 0.723 | 158.3 | 164.1 | 10.2 | 12.566 | 50.0 | 0.98 |
| 2025-06-21 05:03:54 | 2 | 220.4 | 3.600 | 793.5 | 793.5 | 0.0 | 0.042 | 50.0 | 1.00 |
| 2025-06-21 05:03:56 | 1 | 221.4 | 0.588 | 128.4 | 133.2 | 6.8 | 12.566 | 50.0 | 0.98 |
A thorough evaluation was undertaken, employing a solitary Sensor Node to assess the system’s prospective capacity for enduring data storage. The Coordinator Node employs a 16 GB MicroSD card, formatted with the FAT32 file system, to log incoming data. The data are stored in a CSV file comprising ten columns. It has been estimated that the size of a single data row – including, it should be noted, the timestamp, sensor readings and delimiters – is approximately 80 bytes. It is evident that, with a logging interval of one entry every two seconds, the system generates 17,280 data entries per day. The calculation of daily data generation is as follows:
The system is able to record data from a single Sensor Node continuously for approximately 12.7 years prior to the point at which a 16 GB SD card reaches its maximum storage capacity. This storage capability is more than sufficient when it comes to long-term, uninterrupted energy monitoring applications. It enables data collection over multiple decades without the need for manual intervention in terms of storage management.
As previously stated, the working principles of the implemented system and the functionality of all utilised devices have been explained in detail above. The microcontroller-based power measurement and data acquisition system is illustrated in Figure 11.
4. Sample Results
Subsequent to the design and installation stages, an evaluation of the system’s precision was conducted utilising a calibrated reference device (Hioki 3334), a model that has garnered recognition for its superior measurement accuracy. The developed device’s sampling rate is 5Hz as default, and it gives the results by 1 second intervals. These rates can be changed by needs.
The initial testing procedure entailed the execution of instantaneous measurements while varying loads were in use. These loads included a 1200W resistive element connected to an electric stove (with selectable operating times), two 20W compact fluorescent lamps (CFLs), a 1600W hair dryer, and a water dispenser. Subsequently, the software was updated to account for any measurement errors. The LCD display provides a comprehensive overview of the system’s status, including the date, time, voltage, current, and power factor measurements. The summary of the instantaneous measurement results is presented in Table 4, with voltage (V) measured in volts and current (I) measured in amperes. The observed error was consistently below 1% across all measurements, with the maximum recorded error being 1.86%.
Subsequent to the execution of instantaneous measurements and sensitivity tests, the device was connected to a selection of domestic electrical appliances. Concurrently, both instantaneous and periodic measurements were conducted. The measurement of the parameters was conducted at regular intervals, with the data being recorded on an SD card via the data acquisition system in accordance with the stipulated sampling interval as defined within the programme. The results of the instantaneous measurements are presented in Table 2, with voltage (V) measured in volts, current (I) measured in amperes, and power (P) measured in watts. The magnitude of the error as indicated by the measurements was found to be no greater than 2.11% for voltage, current and power factor. The Average Absolute Percentage Error (MAPE) was calculated across all measurements, yielding a result of 1.71%.
As illustrated by the graphs presented in Figure 12, the operating durations of the devices, and the corresponding power consumed during these periods, are demonstrated. The measurements obtained facilitated the identification of the energy consumption patterns exhibited by the devices.
Table 5.
Power measurements and error percentages
| Device | Development Device | Etalon Device |
Percentage Errors |
||||||
| V | I | cos | P | V | I | cos | P | ||
| Refrigerator | 227.2 | 1.692 | 0.459 | 176.45 | 227.0 | 1.685 | 0.455 | 174.04 | 1.39% |
| Oven | 224.2 | 9.486 | 1.000 | 2,126.76 | 223.2 | 9.446 | 0.999 | 2,106.24 | 0.97% |
| Dishes M. | 220.2 | 8.704 | 0.999 | 1,914.70 | 220.0 | 8.600 | 0.999 | 1,890.11 | 1.30% |
| Water Heat. | 219.2 | 8.710 | 1.000 | 1,909.23 | 219.0 | 8.670 | 1.000 | 1,898.73 | 0.55% |
| Washing M. | 219.9 | 9.320 | 0.935 | 1,916.25 | 220.8 | 9.390 | 0.944 | 1,957.21 | -2.09% |
| Dryer M. | 224.7 | 3.446 | 0.988 | 765.02 | 224.5 | 3.426 | 0.988 | 759.91 | 0.67% |
| Television | 227.8 | 0.283 | 0.887 | 57.16 | 228.4 | 0.289 | 0.902 | 59.54 | -3.99% |
| Laptop | 227.3 | 0.405 | 0.916 | 84.41 | 227.5 | 0.414 | 0.934 | 87.97 | -4.05% |
| Vacuum C. | 224.6 | 5.865 | 0.967 | 1,273.81 | 222.5 | 5.840 | 0.967 | 1,256.52 | 1.38% |
| Iron | 222.8 | 8.543 | 1.000 | 1,903.38 | 222.2 | 8.505 | 1.000 | 1,889.81 | 0.72% |
| Mean Absolute Percentage Error (MAPE) | 1.71% | ||||||||
The calculation of MAPE is as follows:
Where is the number of data points, is the reference value, is the measured value, and multiplying by 100 expresses the error as a percentage.
All measurements were conducted at ambient temperature, with temperature and humidity values recorded throughout the process. The mean temperature was 24.13°C, and the mean relative humidity was 62.04%. Appliances with program-based operation, including dishwashers, washing machines, and dryers, were monitored until the completion of their respective programs. The kettle was operated for a period of 5–6 minutes, after which measurements were taken. For devices operating on a continuous basis, such as refrigerators, measurements were recorded over a 120-minute period. The oven was operated for a period of 20 minutes in order to obtain the required measurements. For devices that are used intermittently, such as the television, laptop, and vacuum cleaner, measurements were conducted over a period of 15 minutes. The iron, which exhibits irregular starting and stopping behaviour, necessitated a sampling interval of 10 seconds as opposed to the standard 1-minute interval, in order to accurately capture its operational characteristics. A total of 15 consecutive measurements were analysed. It was demonstrated that power consumption increased by approximately 13 W when the refrigerator door was opened, due to the activation of interior lighting. This increase in power consumption was observed to be consistent over a period of 120 minutes. The duration of the drying process is influenced by the load size; nevertheless, subsequent to the conclusion of the drying process, the appliance continues to operate at a low power setting until the program duration is complete. It was observed that the laptop consumed a greater quantity of power than the television. This was due to the laptop’s high-power charging adapter, which enabled faster charging.
5. Conclusions
The prevailing data collection systems are characterised by the utilisation of internal memory for the storage of recorded data, with subsequent transfer of this data to a computer. The present study constitutes an investigation into the development of a microcontroller-based power measurement and data acquisition system for utilisation in building applications. The operational principle of the designed system, along with the technical specifications of the selected devices and circuit components, was defined. Following this, the system was implemented, and a series of test measurements were conducted. Following the completion of the requisite calibrations and adjustments, the energy consumption patterns of the various devices were determined. The acquired data were directly stored on a MicroSD card in CSV format, allowing for straightforward transfer to a computer via an SD card adapter or Wi-Fi. The system is designed to measure various electrical parameters, including voltage, current, power factor, temperature, and humidity. By utilising these measurements, the system facilitates the calculation of the power consumption of the monitored device. All data, inclusive of the date and time of measurement, are recorded in the storage system. As the recorded data are saved in TXT or CSV format, they require minimal memory space. It has been determined that each measurement entry occupies only a few bytes. This finding indicates that a 16GB MicroSD card provides extensive, practically unlimited, long-term storage capacity. Moreover, in view of the fact that the recorded files are designed to be transferred to a computer for further analysis, the storage area on the MicroSD card is subject to continuous updates. The stored data can be accessed using common applications such as Notepad or Excel. Furthermore, the data can be imported into statistical analysis software, such as MATLAB or R, thus enabling more detailed investigations. The data are also displayed in real time on the LCD screen. However, due to limitations in the number of characters that can be displayed on the screen, only the date, time, voltage, current, and power factor values are shown. During the recording process, ancillary parameters such as power, temperature, and humidity are stored in the data acquisition system. A thorough examination of the measurements reveals that the maximum error in voltage, current, power factor and power readings is typically less than 1%. The mean absolute percentage error for power measurements was determined to be 1.71%. A marginally elevated error was detected in devices exhibiting low current draw. It is hypothesised that this error could be further reduced by using a higher-resolution, more sensitive external ADC for micro-level measurements.
Abbreviations
The following abbreviations are used in this manuscript:
| ADC | Analog Digital Converter |
| AP | Access Point |
| API | Application Programming Interface |
| ART | Retransmission |
| CFL | Compact Fluorescent Lamp |
| CSV | Comma-Seperated Variables |
| CT | Current Transformer |
| DAQ | Data Acquisition System |
| DCN | Data Communication Network |
| EEPROM | Electronically Erasable Programmable Read-Only Memory |
| FAT | File Allocation Table |
| FFT | Fast Fourier Transform |
| GND | Ground |
| GPIO | General-Purpose Input-Output |
| GPRS | General Packet Radio Service |
| I/O | Input/Output |
| I2C | Inter-Integrated Circuit |
| IEEE | Institute of Engineers and Everyone Else |
| IoT | Internet of Things |
| IP | Internet Protocol |
| ISM | Industrial, Scientific, and Medical |
| LCD | Liquid Crystal Display |
| LoRa | Long Range |
| M2M | Machine to Machine |
| MAPE | Mean Absolute Percentage Error |
| NILM | Non-Invasive Load Monitoring |
| NTP | Network Time Protocol |
| OLED | Organic Light-Emitting Diote |
| OSI | Open Systems Interconnection |
| PF | Power Factor |
| PT | Potential Transformer |
| PV | Photovoltaic |
| R/W | Read/Write |
| RAM | Random Access Memory |
| RF | Radio Frequency |
| RMS | Root Mean Square |
| RSSI | Received Signal Strength Indicator |
| RTC | Real-Time Clock |
| RTU | Remote Terminal Unit |
| RX | Receive Data |
| SCADA | Supervisory Control and Data Acquisition |
| SD | Secure Digital |
| SMPS | Swithch Mode Power Supply |
| SPI | Serial Peripheral Interface |
| SSID | Service Set Identifier |
| STA | Node Transitions to Station |
| TCP | Transmission Control Protocol |
| TSI | Turkish Standards Institution |
| TWI | Two Wire Interface |
| TX | Transmit Data |
| UART | Universal Asynchronous Receiver Transmitter |
| UI | User Interface |
References
- Karami, M.; McMorrow, G.; Wang, L. Continuous Monitoring of Indoor Environmental Quality using an Arduino-based Data Acquisition System. Journal of Building Engineering 2018, 19. [Google Scholar] [CrossRef]
- Samal, A.; Mohanty, A.; Ray, P.; Mohanty, S.; Mohanty, P. Implementation of digital temperature control system on photovoltaic cell model: An experimental analysis. Optik 2019, 176, 324–333. [Google Scholar] [CrossRef]
- Rahman, M.; Selvaraj, J.; Abd Rahim, N.; Hasanuzzaman, T.D.M. Global modern monitoring systems for PV based power generation: A review. Renewable and Sustainable Energy Reviews 2017, 82. [Google Scholar] [CrossRef]
- T., K.; Raja, C.; J., J.; K., C. Design of IoT based smart compact energy meter for monitoring and controlling the usage of energy and power quality issues with demand side management for a commercial building. Sustainable Energy, Grids and Networks 2021, 26, 100454. [CrossRef]
- Mudaliar, M.; Sivakumar, N. IoT based real time energy monitoring system using Raspberry Pi. Internet of Things 2020, 12, 100292. [Google Scholar] [CrossRef]
- Ferdiansyah.; Wardana, A.S. Enginuity: Journal of Engineering Science and Technology 2025, 1, 34–42.
- Athanasiadis, C.; Doukas, D.; Papadopoulos, T.; Chrysopoulos, A. A Scalable Real-Time Non-Intrusive Load Monitoring System for the Estimation of Household Appliance Power Consumption. Energies 2021, 14, 747. [Google Scholar] [CrossRef]
- Hariharan, R.; Agarwal, R.; Kandamuru, M.; Gaffar, A. Energy consumption monitoring in smart home system. IOP Conference Series: Materials Science and Engineering 2021, 1085, 012026. [Google Scholar] [CrossRef]
- Hussain, Z.; Osman, A.; Moin, M.; Memon, J. IoT Enabled Real-time Energy Monitoring and Control System. 06 2021, pp. 97–102. [CrossRef]
- Khanna, P.; Howells, G.; Lazaridis, P. Design and Implementation of Low-Cost Real-Time Energy Logger for Industrial and Home Applications. Wireless Personal Communications 2021, 119. [Google Scholar] [CrossRef]
- Elkholy, M.; Senjyu, T.; Elsayed Abouzeid, M.E.L.; Elgarhy, A.; Ali, N.; Gaafar, T. Design and Implementation of a Real-Time Smart Home Management System Considering Energy Saving. Sustainability 2022, 14, 13840. [Google Scholar] [CrossRef]
- Chen, Y.; Si, Y.; Li, J.; Wu, X. Development and Pilot Application of Intelligent Analyzer for Residential Electricity Consumption Situation Analysis. 10 2024, pp. 544–548. [CrossRef]
- Paul, B.; v, M. IoT based Energy Analyzer and Tampering Detection System for Smart Grid Applications. 03 2024, pp. 1–6. [CrossRef]
- Kumar, L.A.; Indragandhi, V.; Selvamathi, R.; Varadarajan, V.; R., L.; Subramaniyaswamy, V. Design, power quality analysis, and implementation of smart energy meter using internet of things. Computers & Electrical Engineering 2021, 93, 107203. [CrossRef]
- Kumar, G.; Kumar, L.; Kumar, S. Multi-objective control-based home energy management system with smart energy meter. Electrical Engineering 2023, 105, 1–11. [Google Scholar] [CrossRef]
- Radhika, S.; Chandrasekar, A.; Jothi, S.; K, V. Consumer Friendly Energy Meter for Home Application. In Proceedings of the 2022 International Conference on Advances in Computing, Communication and Applied Informatics (ACCAI), 2022, pp. 1–6. [CrossRef]
- Pranta, S.; Biddut, A.S.; Siam, S.; Hazari, M.R.; Mannan, M. Design and Implementation of IoT-Based Smart Energy Meter to Augment Residential Energy Consumption. 03 2023. [CrossRef]
- Hassan, T.; Das, D.; Rhyme, S.; Bal, S.; Hazari, M.R.; Jahan, E.; Hossain, C.; Mannan, M. IoT-based smart net energy meter with advanced billing feature for residential buildings including solar PV system. International Journal of Power Electronics and Drive Systems (IJPEDS) 2024, 15, 1254. [Google Scholar] [CrossRef]
- Muralidhara, S.; Hegde, N.; P M, R. An internet of things-based smart energy meter for monitoring device-level consumption of energy. Computers & Electrical Engineering 2020, 87, 106772. [Google Scholar] [CrossRef]
- V, U.; Shunmugalatha, A.; Balamurugan, K.; S, A.; B, S. Design and Development of Autonomous Smart Energy Meter with Remote Management Control. 08 2023, pp. 1782–1785. [CrossRef]
- Aiswarya, A.; Akhil, Mohanand Mekha, N.M.I.; Vrinda, A.R.; George, S. IoT Enabled Energy Management Meter. International Research Journal of Engineering and Technology (IRJET) 2020, 07, 2987–2990.
- Martínez-Blanco, M.D.R.; Soriano-Romero, J.; Serrano-Muñoz, A.; Escobedo Barajas, M.; Del Rio De Santiago, A.; Guerrero-Osuna, H.; Ortiz-Rodriguez, J.M. IoT Based Smart Electrical Meter for Smart Homes. EAI Endorsed Transactions on Internet of Things 2020, p. 165672. [CrossRef]
- IDA BAGUS GEDE, P.; I NYOMAN, S.K.; MADE, S. Application of IoT-Based System for Monitoring Energy Consumption. International Journal of Engineering and Emerging Technology 2020, 5, 81–93. [Google Scholar]
- Pocero, L.; Amaxilatis, D.; Mylonas, G.; Chatzigiannakis, I. Open source IoT meter devices for smart and energy-efficient school buildings. HardwareX 2017, 1, 54–67. [Google Scholar] [CrossRef]
- Ajenikoko, G.; Adigun, O.; Rafiu, A. Control Techniques and Power Factor Correction Methods: A Review. Journal of Engineering Research and Reports 2018, pp. 1–13. [CrossRef]
- Manikandan, P.; Krishnaveni, A.; Selvaraj, D.E.; Muthukumaran, M.; Ganesan, J. A Review on Importance of Power Factor. Journal Club for Electrical Engineering (JCEE) 2015, 2, 72–78. [Google Scholar]
- Mahbub, M. Design and Implementation of Multipurpose Radio Controller Unit Using nRF24L01 Wireless Transceiver Module and Arduino as MCU. International Journal of Digital Information and Wireless Communications 2019, 9, 61–72. [Google Scholar] [CrossRef]
- Vaz F, A.J.; Sangeetha, T.; Leksmi, S.; Dhanusha, A. Performance Analysis of nRF24L01 Wireless Module. 11 2024, pp. 216–222. [CrossRef]
- Somantri, M.; Fauzan, M.; Surya, I. Optimization of IoT-based monitoring system for automatic power factor correction using PZEM-004T sensor. Indonesian Journal of Electrical Engineering and Computer Science 2025, 39, 860–873. [Google Scholar] [CrossRef]
- Sari, Y.; Mustamin, N.F.; Maulida, M.; Baskara, A.; Wijaya, E.; Maulidyanto, M.; Alkaff, M.; Ariyadi, M. Comparing the Accuracy of INA219, PZEM-004T, and MAX471 Sensors for Measuring Current and Voltage of Internet of Things-Based Solar Panels. 10 2024, pp. 1–6. [CrossRef]
- Macheso, P.; Manda, T.; Chisale Ph.D., S.; Dzupire, N.; Mlatho, J.; Mukanyiligira, D. Design of ESP8266 Smart Home Using MQTT and Node-RED. 03 2021, pp. 502–505. [CrossRef]
- Dosbayev, Z.; Tuleshov, A.; Osmanov, A.; Sadykova, B.; Smailov, N.; Sabibolda, A. Development of a Literacy Enhancement System Based on Iot and Web Technologies: Integration of ESP8266 and Laravel. Eastern-European Journal of Enterprise Technologies 2025, 4. [Google Scholar] [CrossRef]
- Sattaru, P.; Burugula, K.; Channagiri, R.; Kavitha, S. Smart Home Security System using IoT and ESP8266. 01 2023, pp. 469–474. [CrossRef]
- Union, I.T. Overview of the Internet of Things – Recommendation Y.4000/Y.2060. Technical report, ITU-T, Geneva, 2021.
- Kirange, Y.K.; Patil, S.A.; Patil, R.S.; Tavade, H.S.; Jadhav, S.D. IOT BASED POWER MONITORING SYSTEM WITH THE HELP OF ESP8266 AND PZEM 004T SENSOR. International Research Journal of Engineering and Technology (IRJET) 2024, 06, 1992–1995. [Google Scholar] [CrossRef]
- ANONYM. nRF24L01+ Single Chip 2.4GHz Transceiver – Product Specification. Nordic Semiconductor ASA, Trondheim (Norway), 2007.
- Trehan, M.; Kumar, P.; Gaur, N. Design and Analysis of Multi-Protocol Conversion Unit for SPI, I2C and UART. 03 2024, pp. 324–329. [CrossRef]
- Fang, Y.y.; Chen, X.j. Design and Simulation of UART Serial Communication Module Based on VHDL 2011. [CrossRef]
- Kim, T.; Liu, H.; Huang, C.T.; Wu, I.; Liu, X. OpenNIRScap: An Open-Source, Low-Cost Wearable Near-Infrared Spectroscopy-based Brain Interfacing Cap 2025. [CrossRef]
- Cvjetkovic, V.; Matijevic, M. Overview of Architectures with Arduino Boards as Building Blocks for Data Acquisition and Control Systems:. International Journal of Online Engineering (iJOE) 2016, 12, 10. [Google Scholar] [CrossRef]
- Nguyen gia, T.; Sarker, V.; Tcarenko, I.; Rahmani, A.M.; Westerlund, T.; Liljeberg, P.; Tenhunen, H. Energy Efficient Wearable Sensor Node for IoT-based Fall Detection Systems. Microprocessors and Microsystems 2018, 56. [Google Scholar] [CrossRef]
- Tobi, M.; Van Harling, V. Wireless electric energy transmission system and its recording system using PZEM004T and NRF24L01 module. Indonesian Journal of Electrical Engineering and Computer Science 2021, 21, 1372. [Google Scholar] [CrossRef]
- Hafeez, U.; Zimmerman, H. OSI reference model-the ISO model of architecture for open systems interconnection. IEEE Transactions on Communications 1980, COM-28, 425–432. [CrossRef]
- Deng, C.; Fang, X.; Han, X.; Wang, X.; Yan, L.; He, R.; Long, Y.; Guo, Y. IEEE 802.11be Wi-Fi 7: New Challenges and Opportunities. IEEE Communications Surveys & Tutorials 2020, 22, 2136–2166. [Google Scholar] [CrossRef]
- Kolodny, A.; Nieh, S.; Eitan, B.; Shappir, J. Analysis and modeling of floating-gate EEPROM cells. Electron Devices, IEEE Transactions on 1986, 33, 835–844. [Google Scholar] [CrossRef]
- Kadukar, D.; Kamdi, R.; Bende, V.; Dhumane, D.; Shahane, S.; Sondkar, S. IoT Based Smart Energy Meter. SSGM Journal of Science and Engineering 2024, 2, 49–52. [Google Scholar]
- Ltd., L.P.C. TC1602D-02WB0 LCD Module User Manual. LET Pacific Co. Ltd., 2012. Available at https://www.ersinelektronik.com/class/INNOVAEditor/assets/Datasheets/TC1602D-01YC0.pdf.
- Salehi, A.; Fu, X.; Shin, D.; So, F. Recent Advances in OLED Optical Design. Advanced Functional Materials 2019, 29, 1808803. [Google Scholar] [CrossRef]
- Chaiyong, W.; Sonasang, S. Applications of energy monitoring using the IoT. SNRU Journal of Science and Technology 2022, 14, 245041. [Google Scholar] [CrossRef]
- Torres-Sanchez, E.; Alastruey-Benedé, J.; Torres-Moreno, E. Developing an AI IoT application with open software on a RISC-V SoC. 11 2020, pp. 1–6. [CrossRef]
Figure 1.
High-Level System Architecture
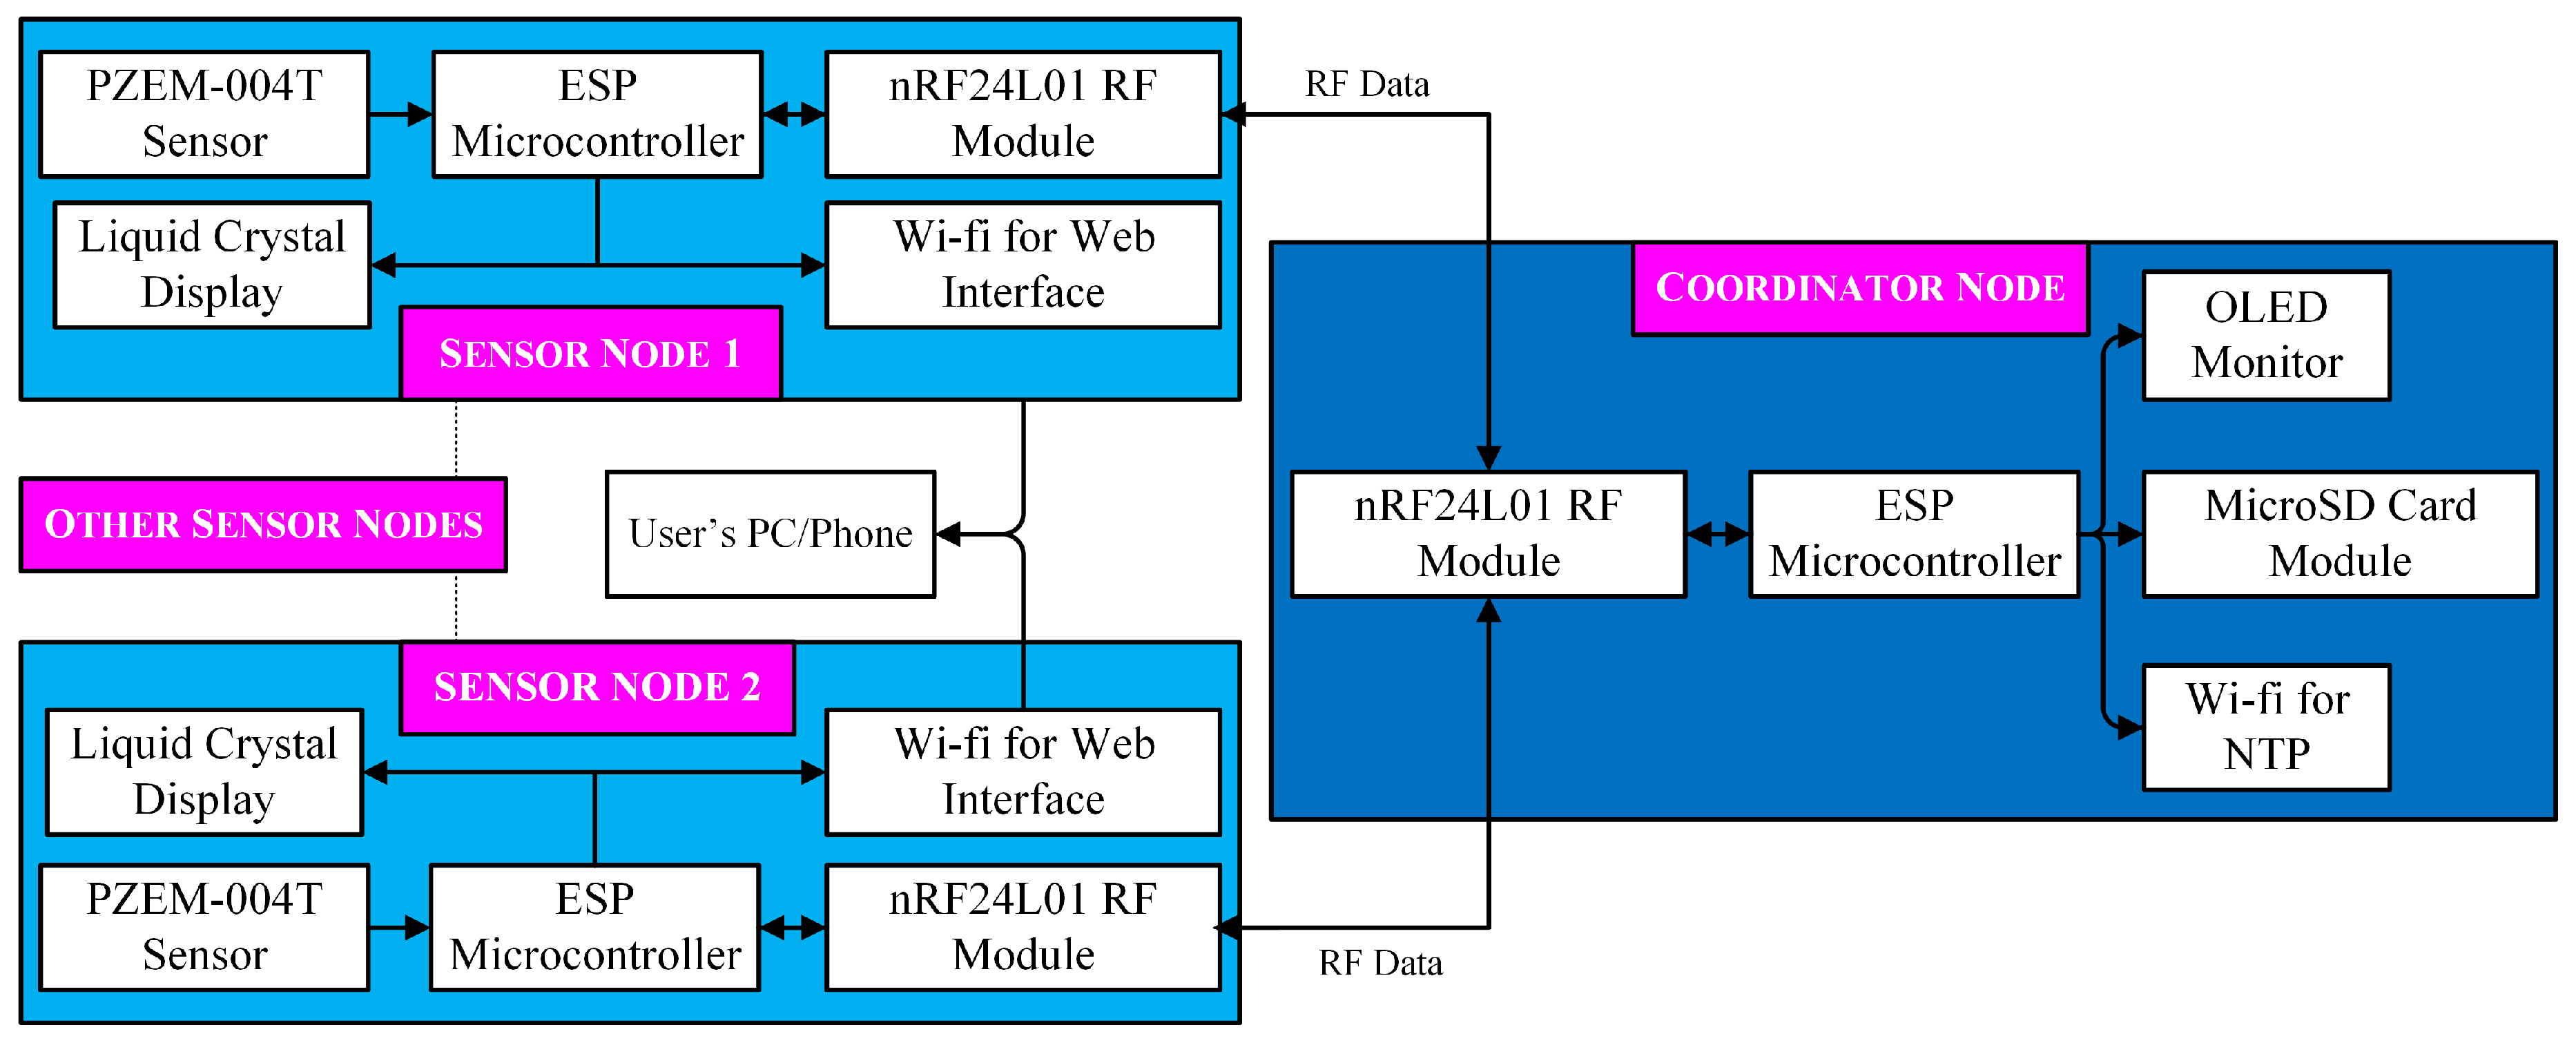
Figure 2.
Serial Communication Protocols Used by Micro Controller
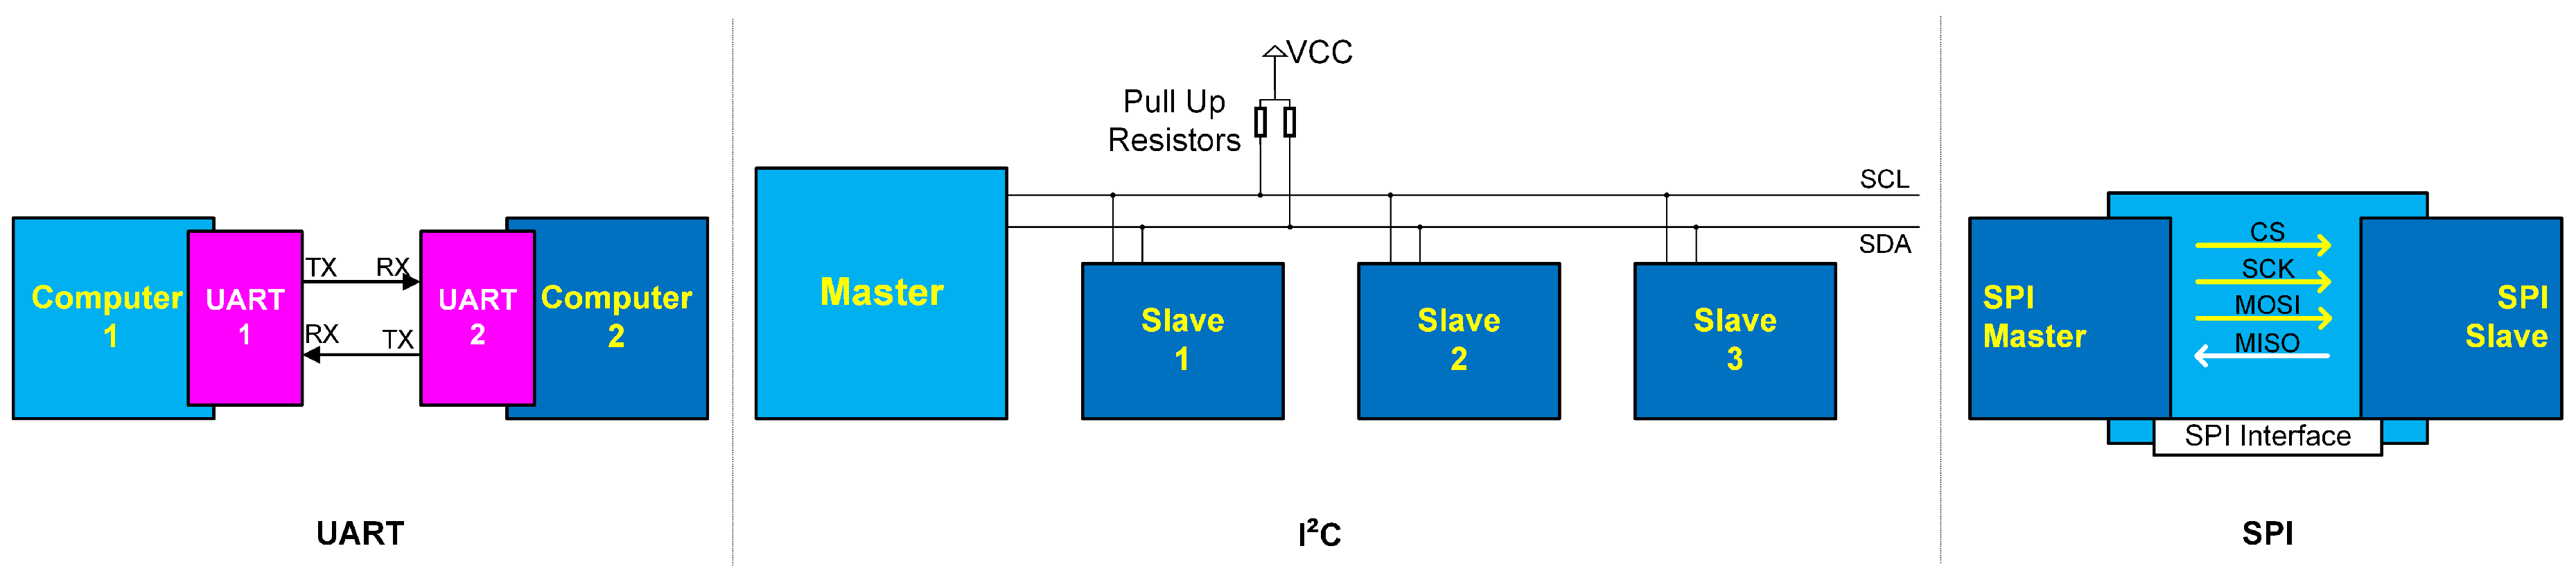
Figure 3.
System Communication Protocol Architecture
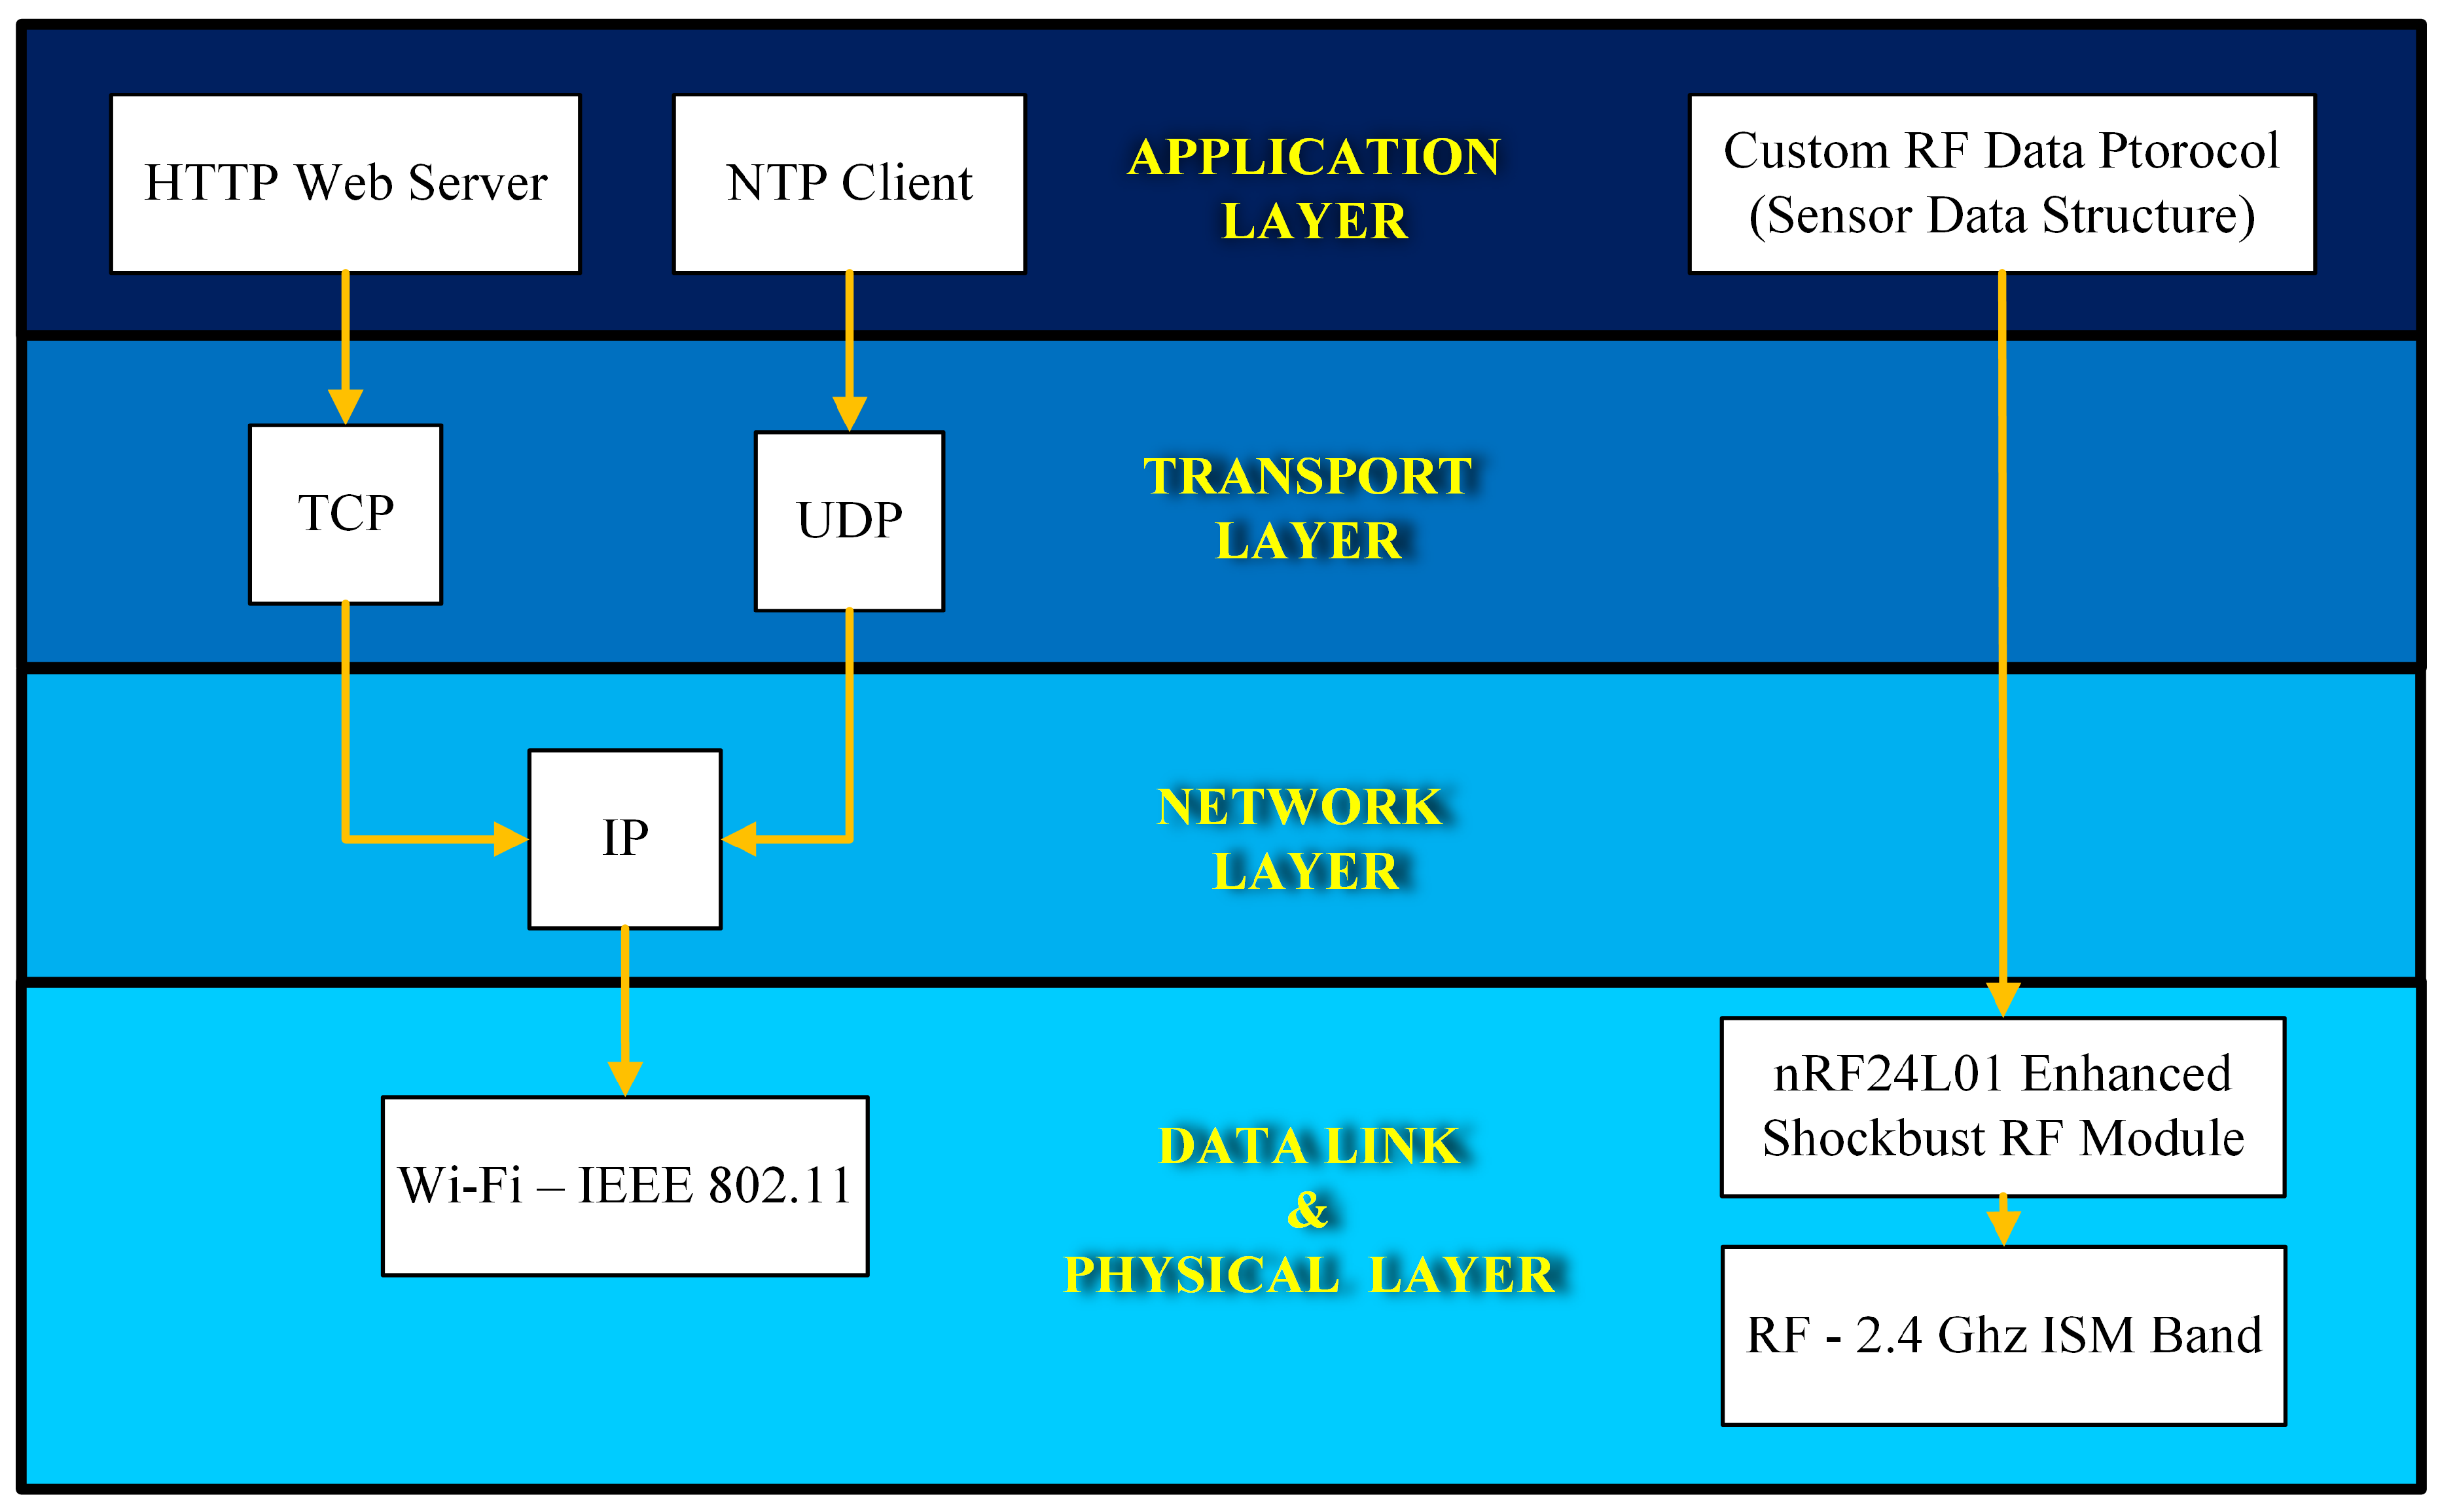
Figure 4.
Detailed System Data Flow
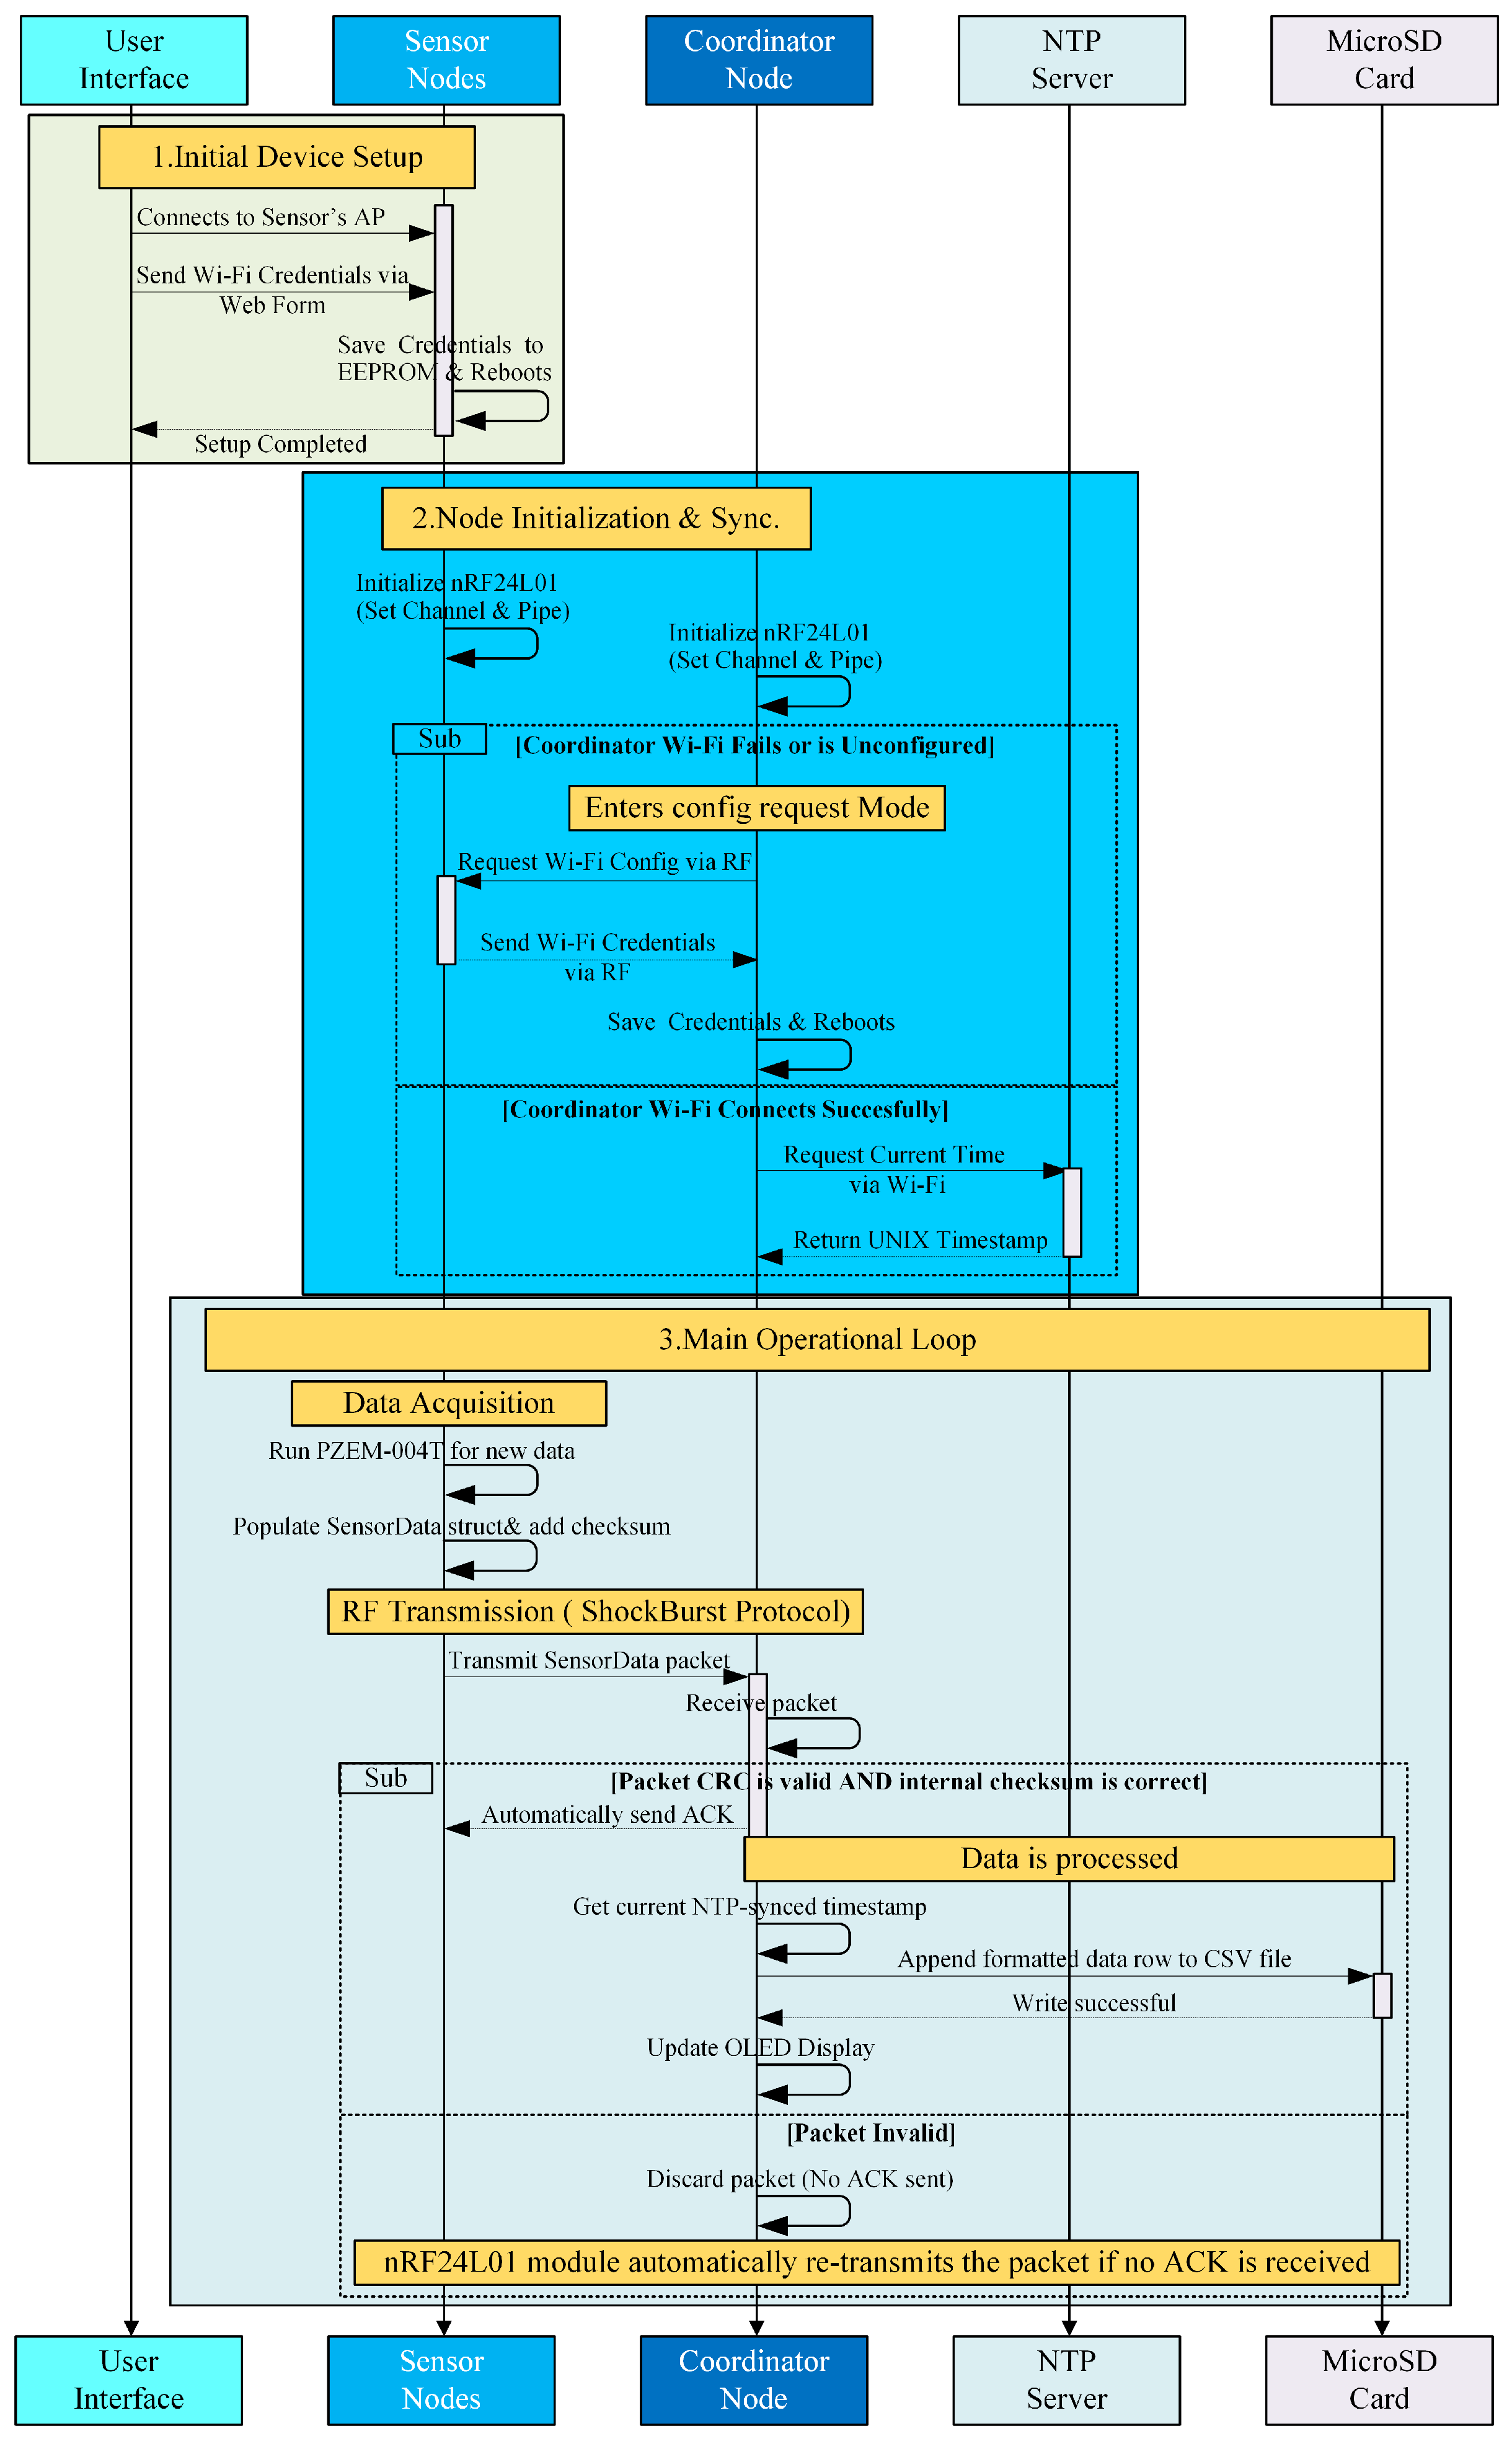
Figure 5.
Connecting of liquid crystal display board by using I.2C board
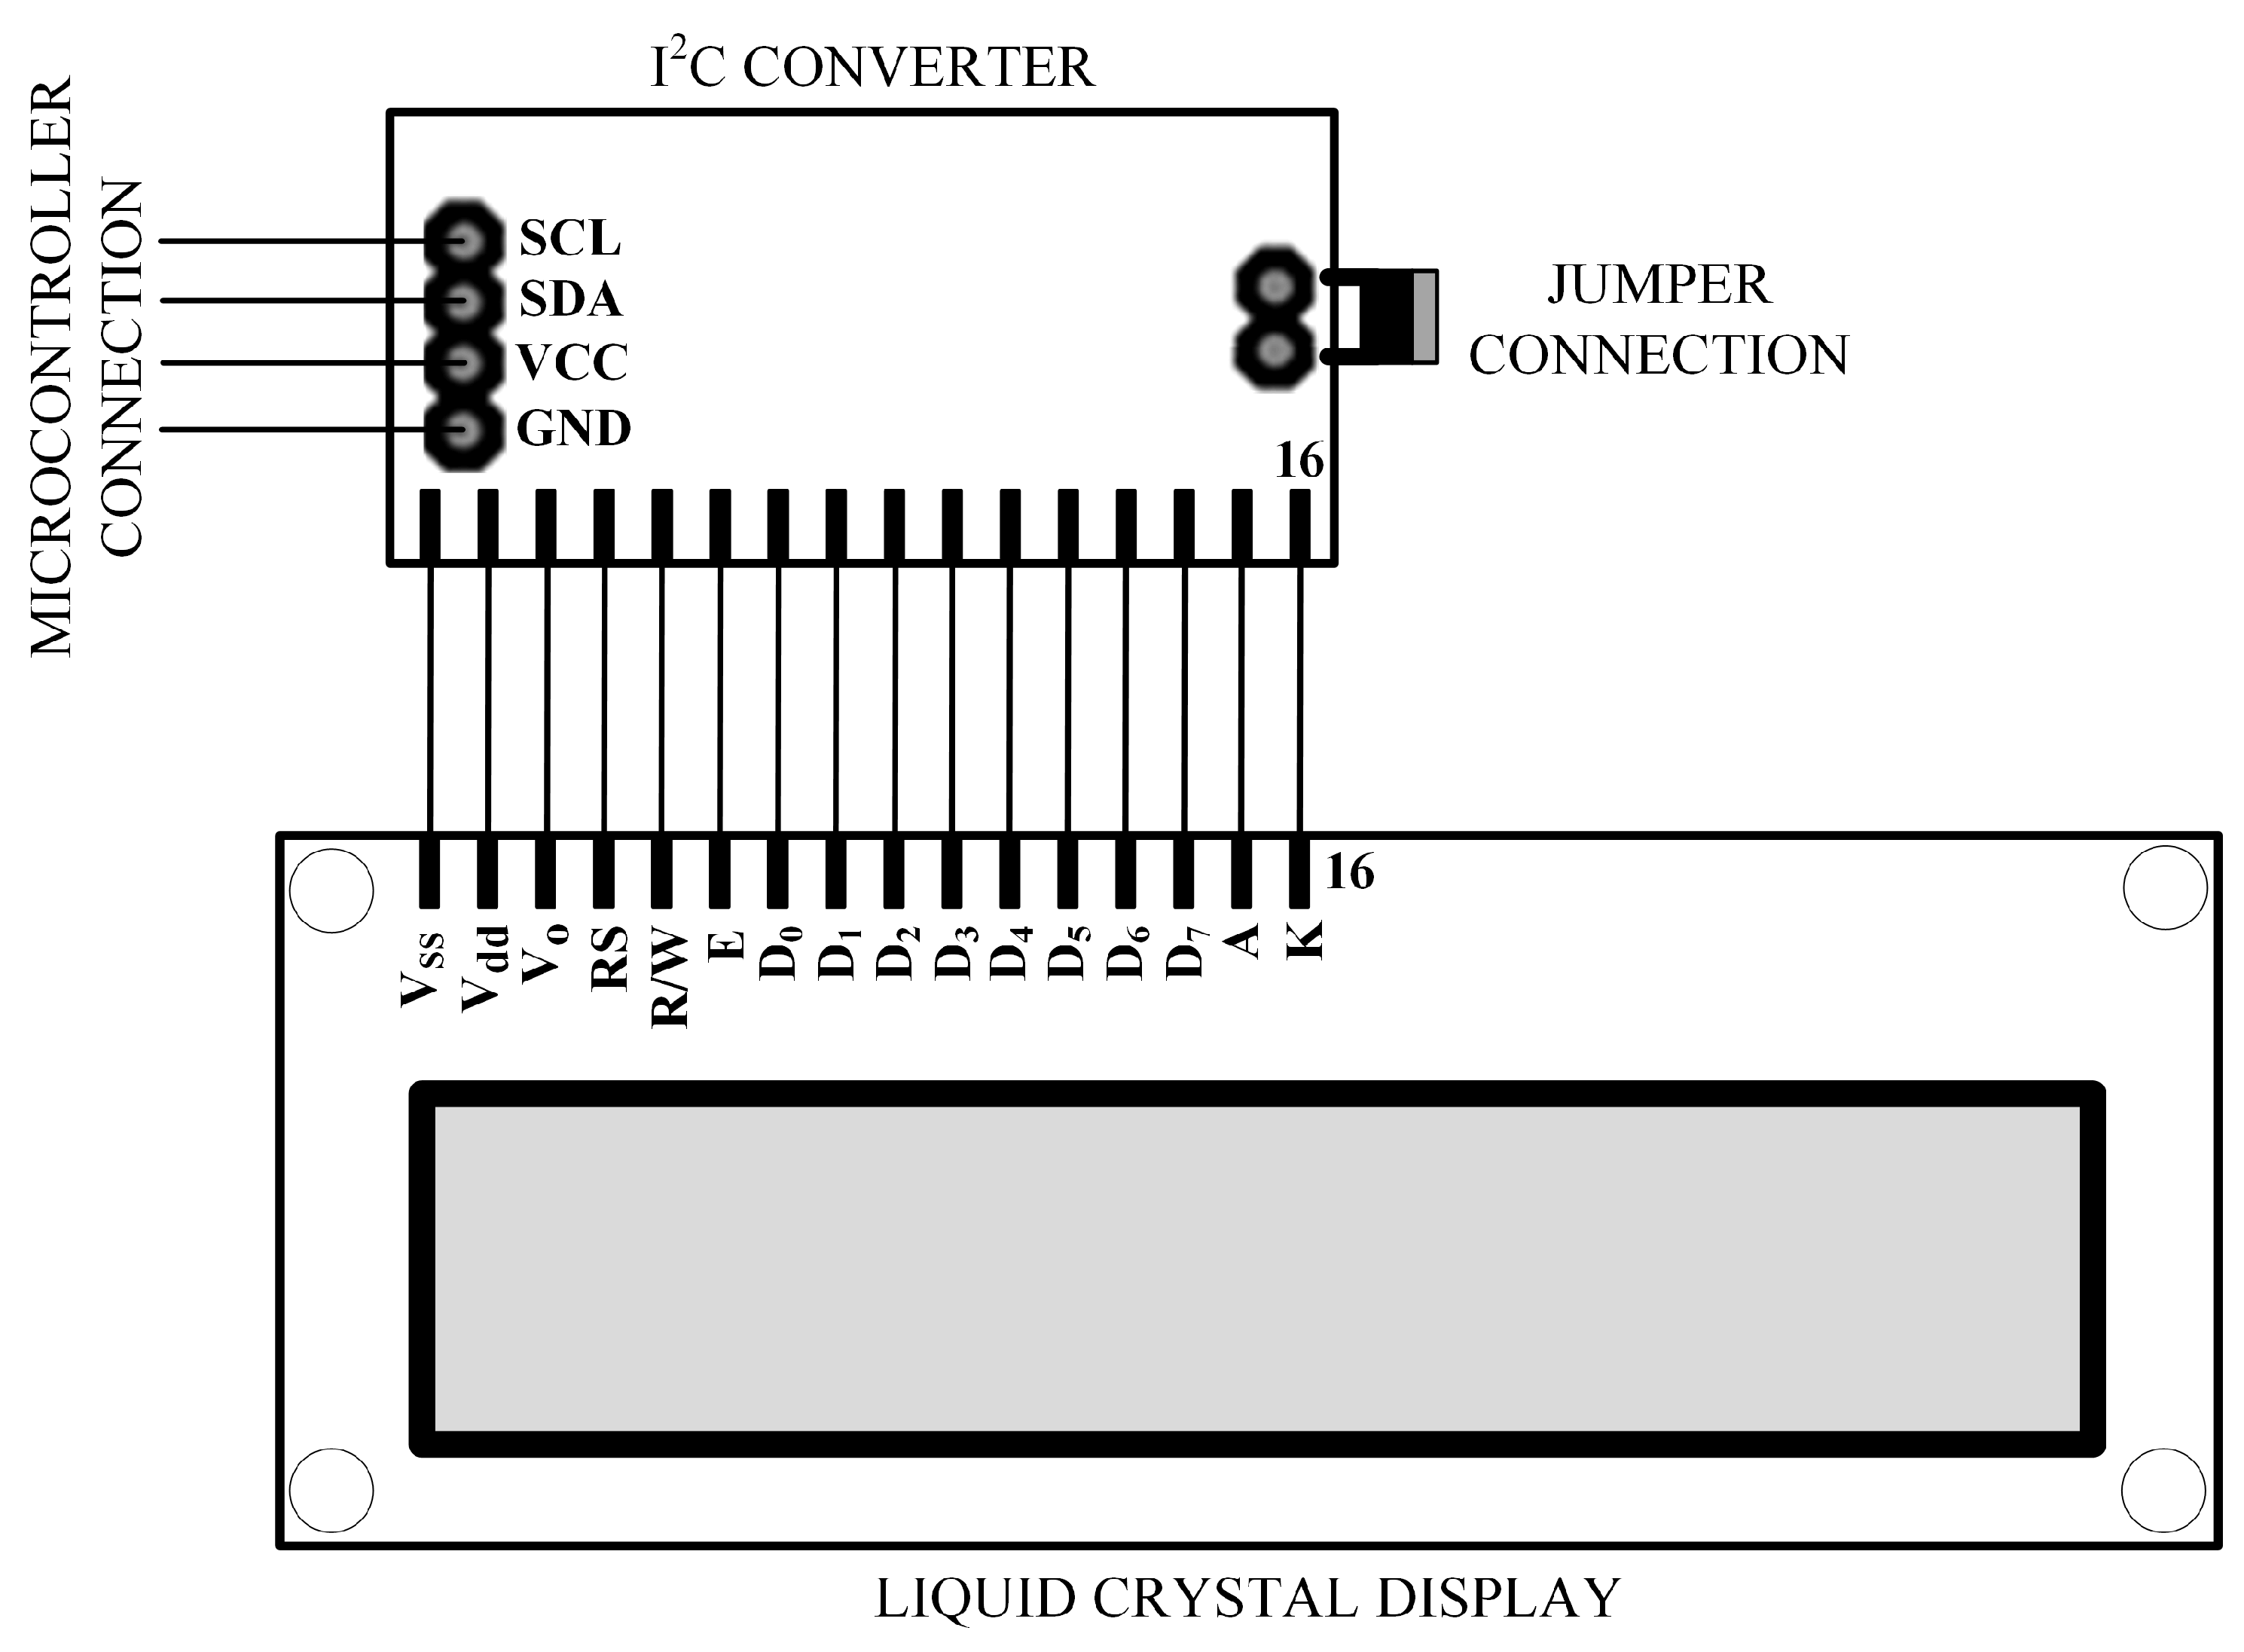
Figure 6.
Pin Configuration of Sensor Nodes
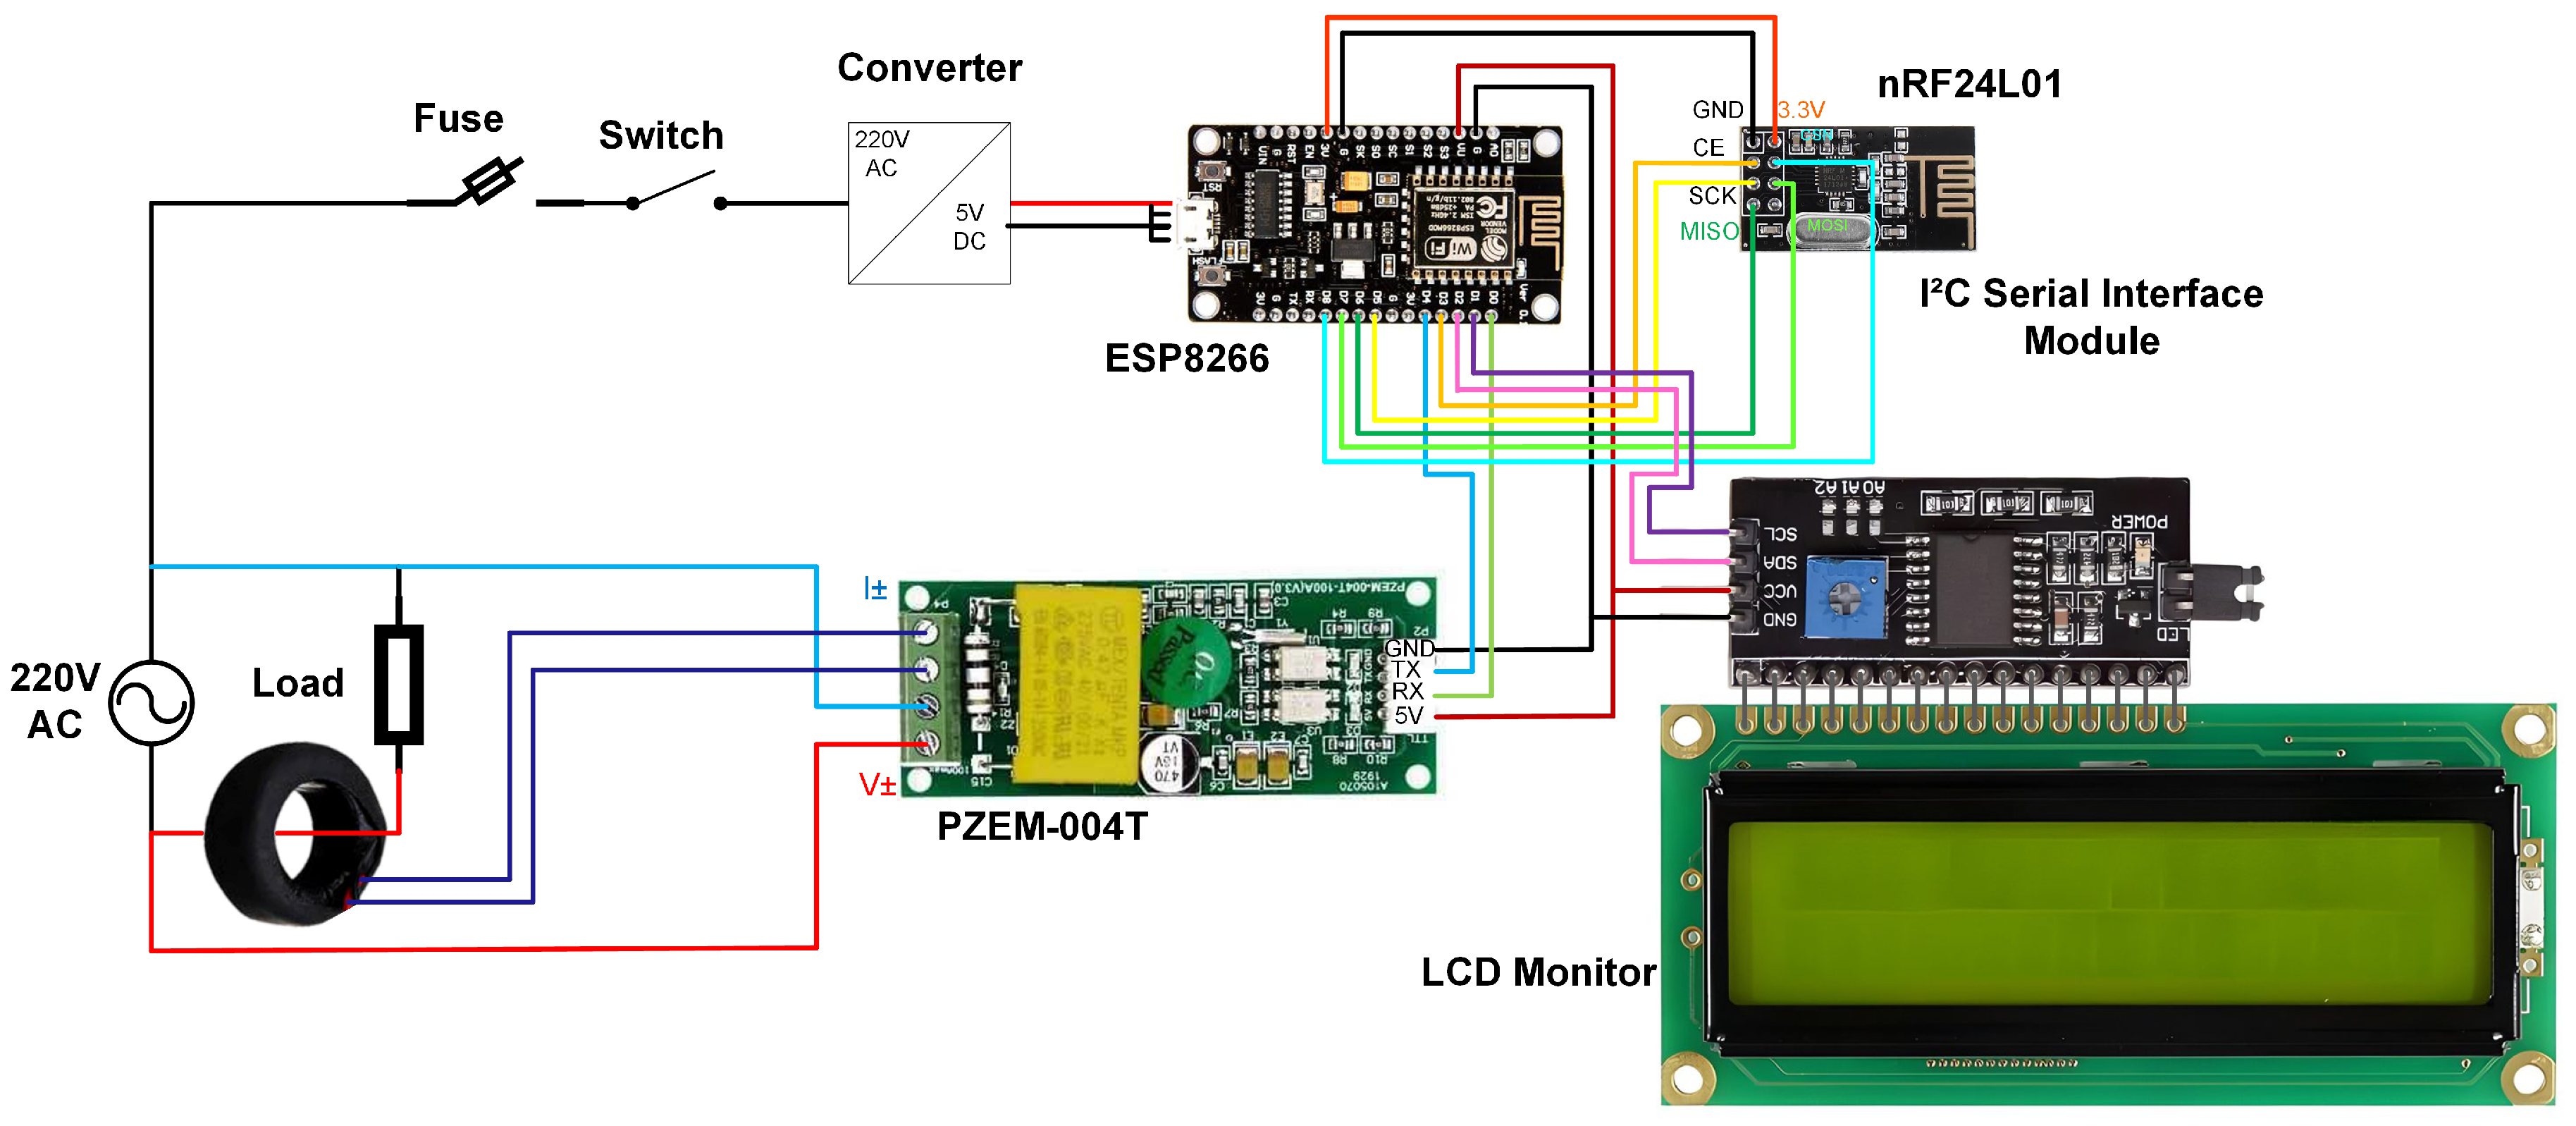
Figure 7.
Pin Configuration of Coordinator Node
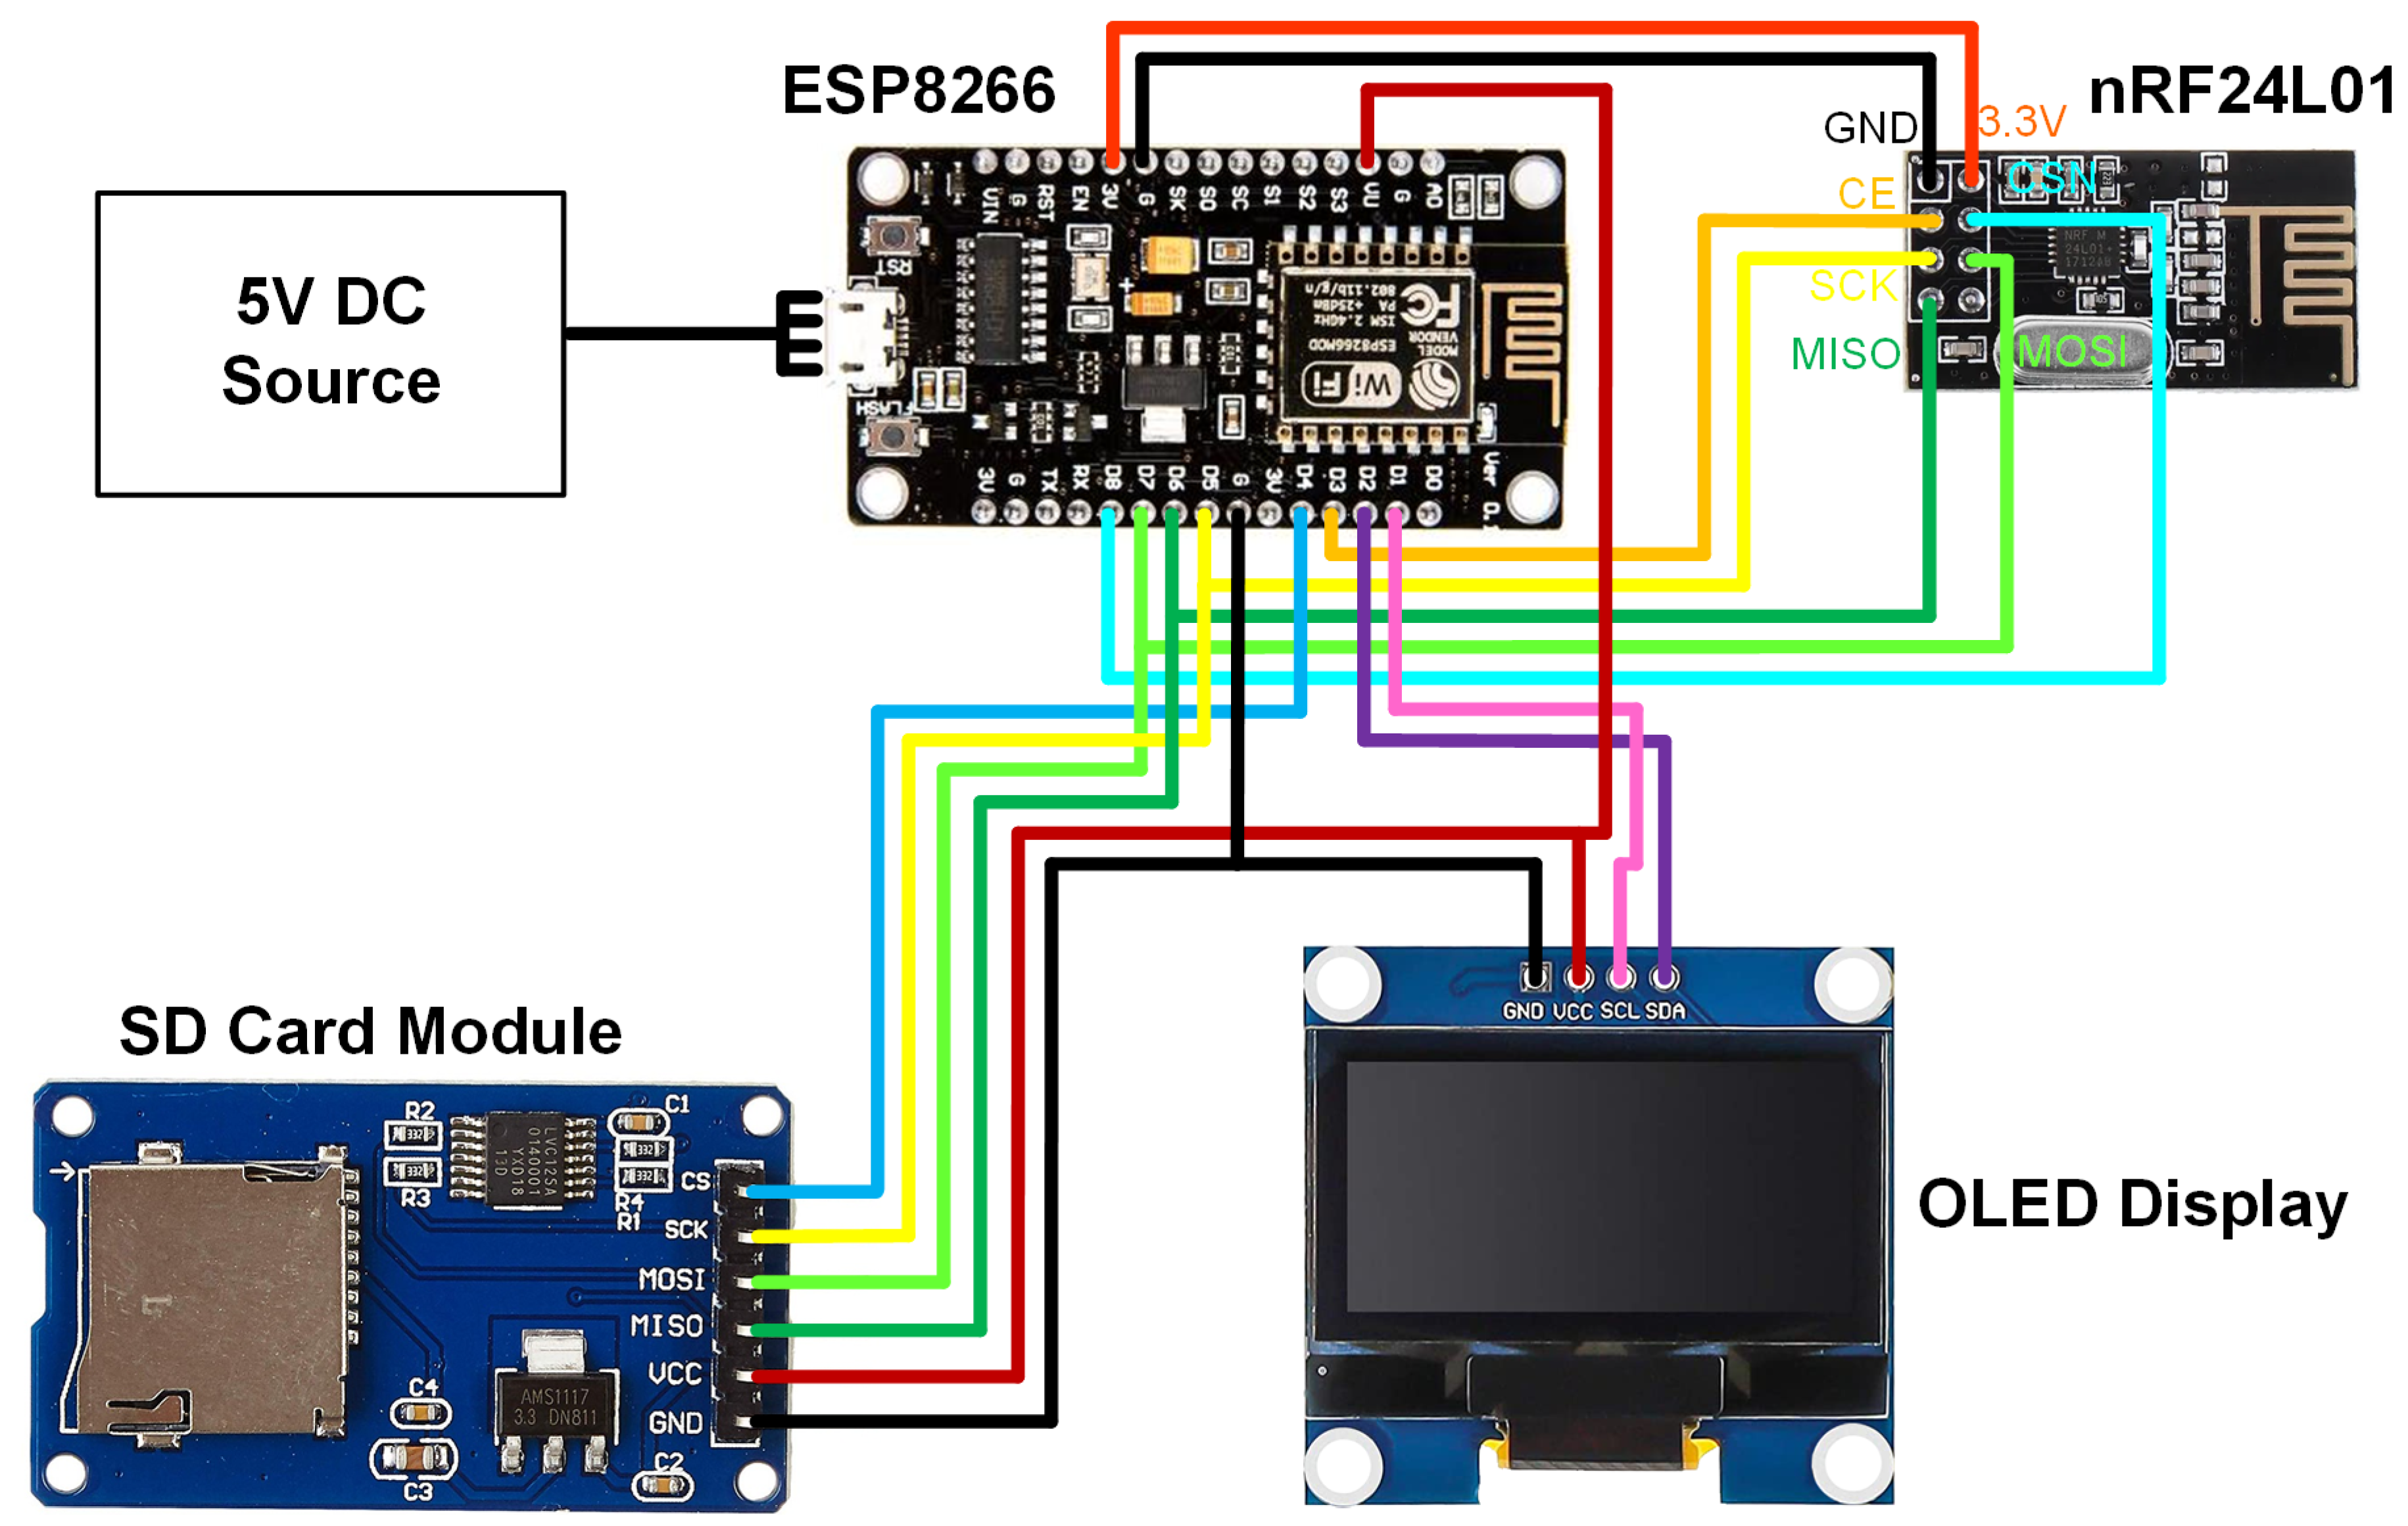
Figure 8.
Sensor Node Flowchart
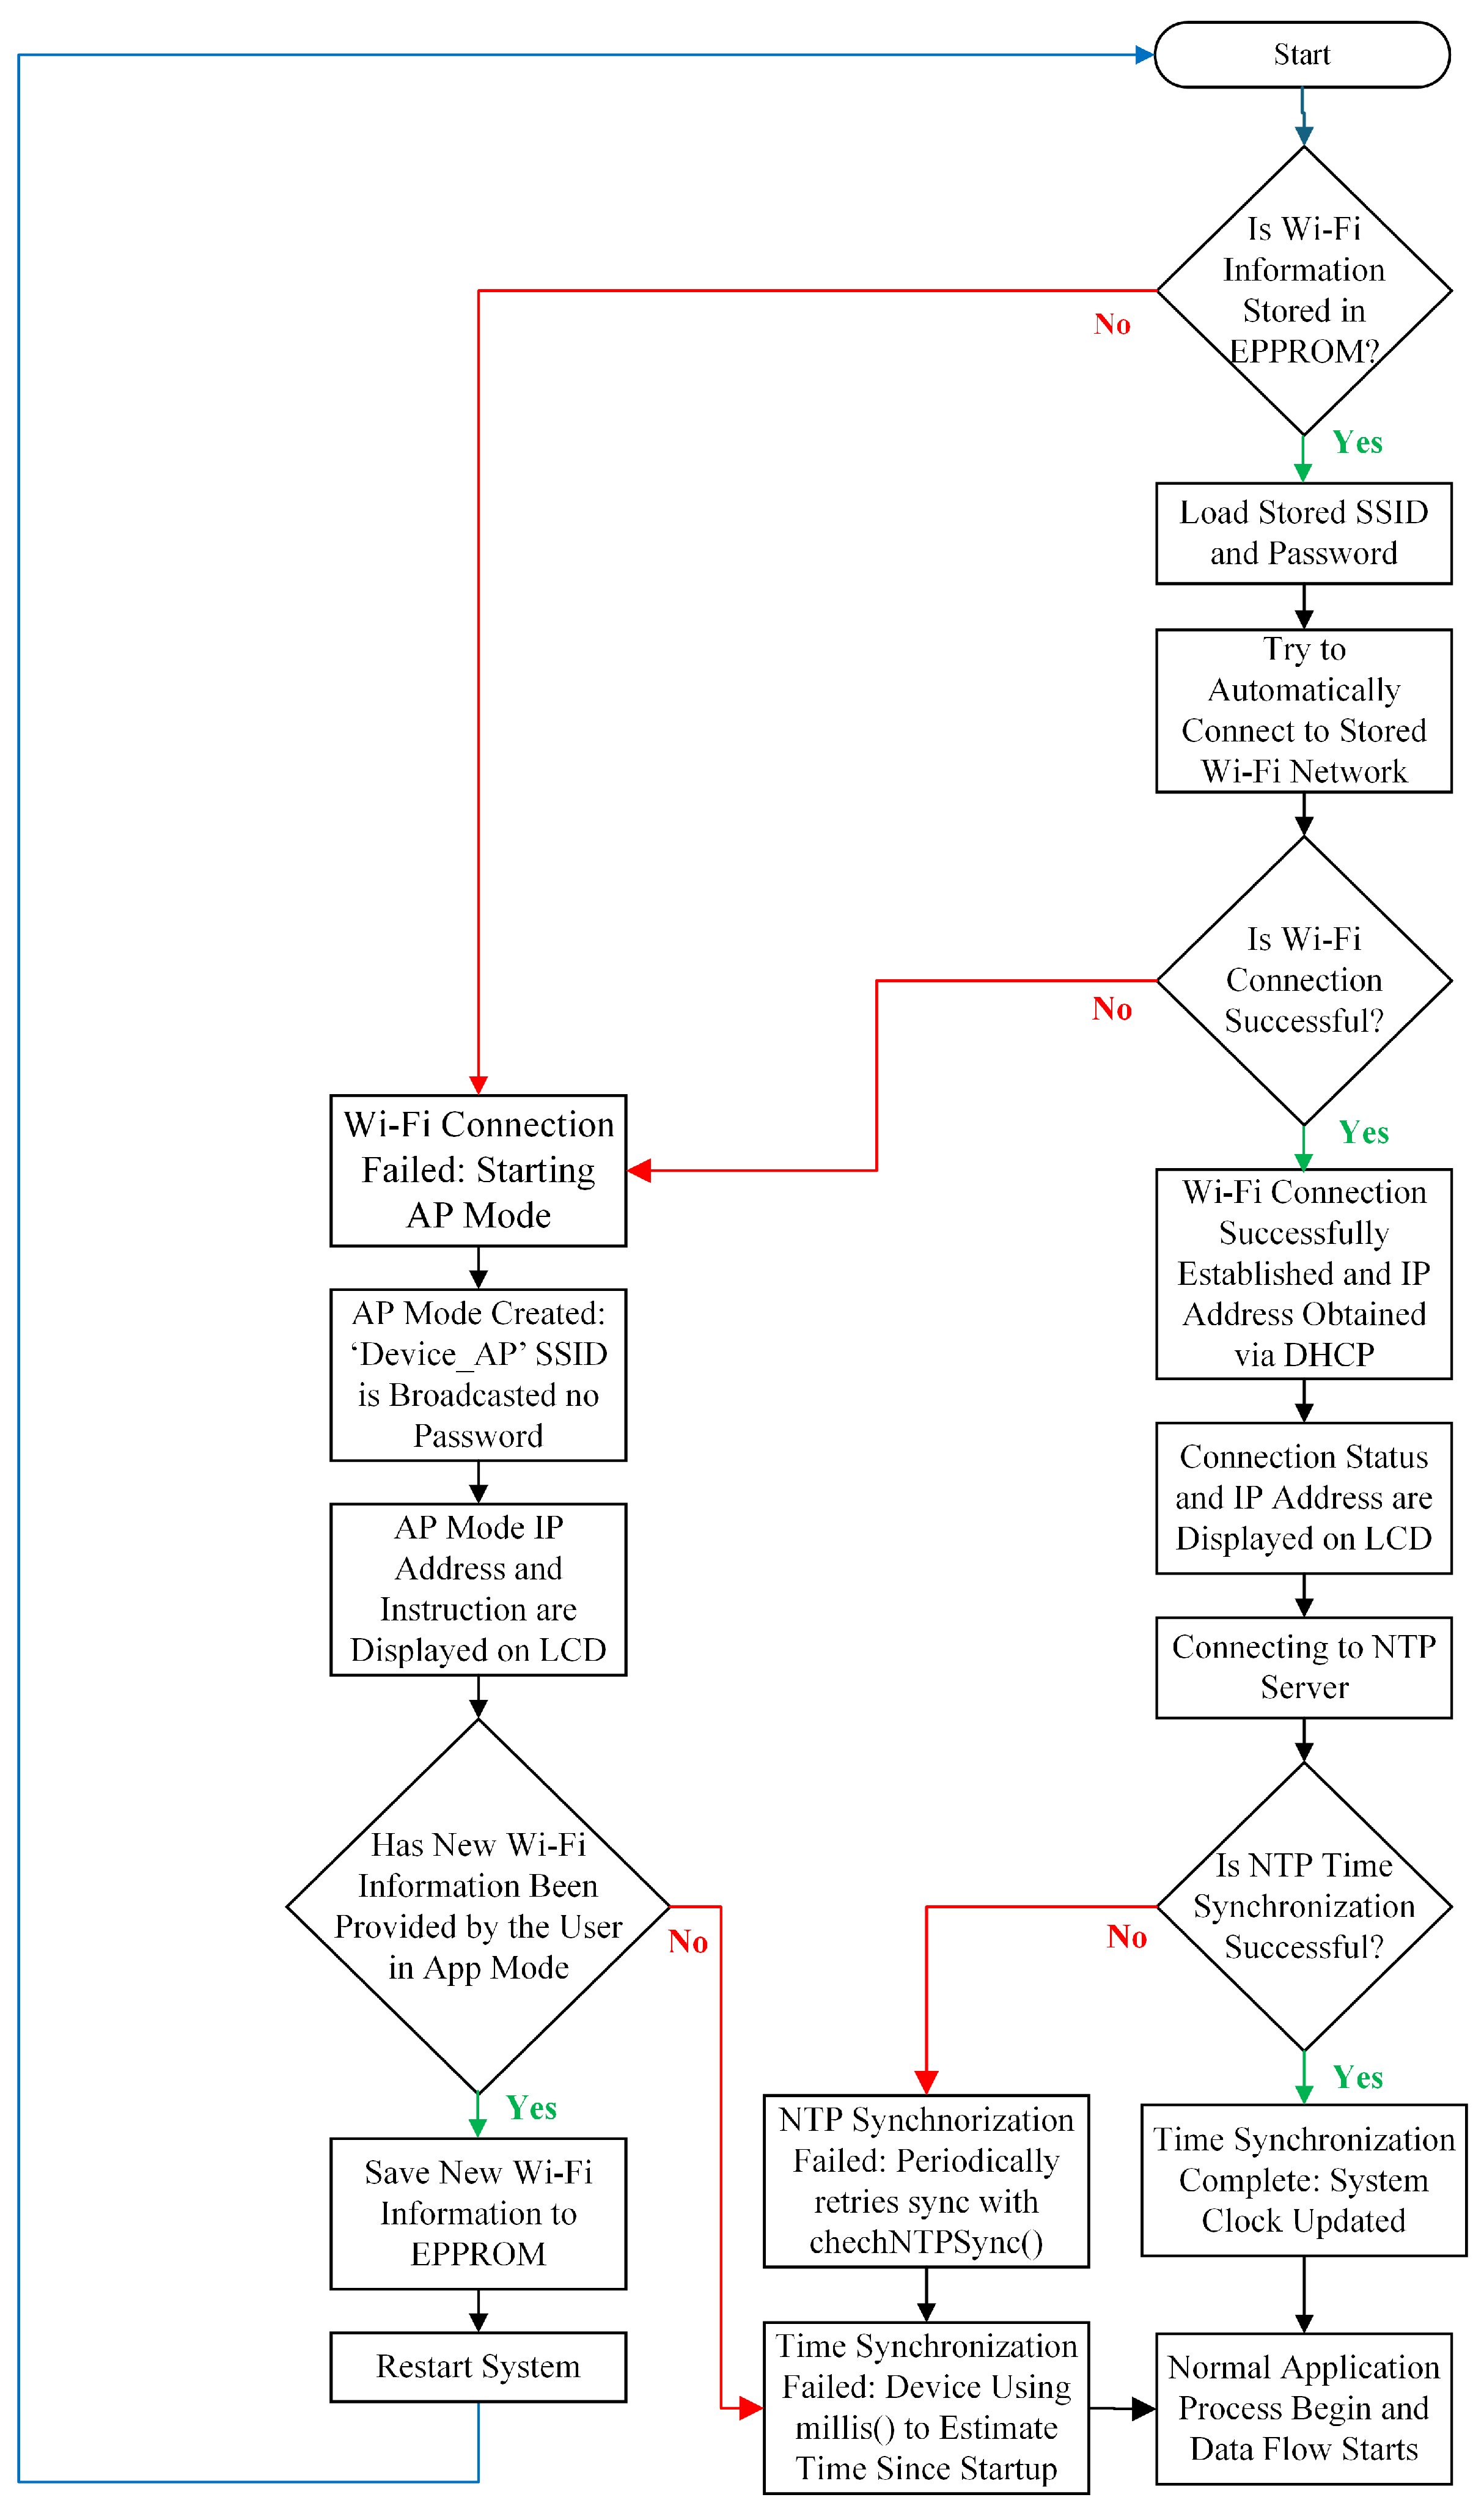
Figure 9.
Coordinator Node Flowchart
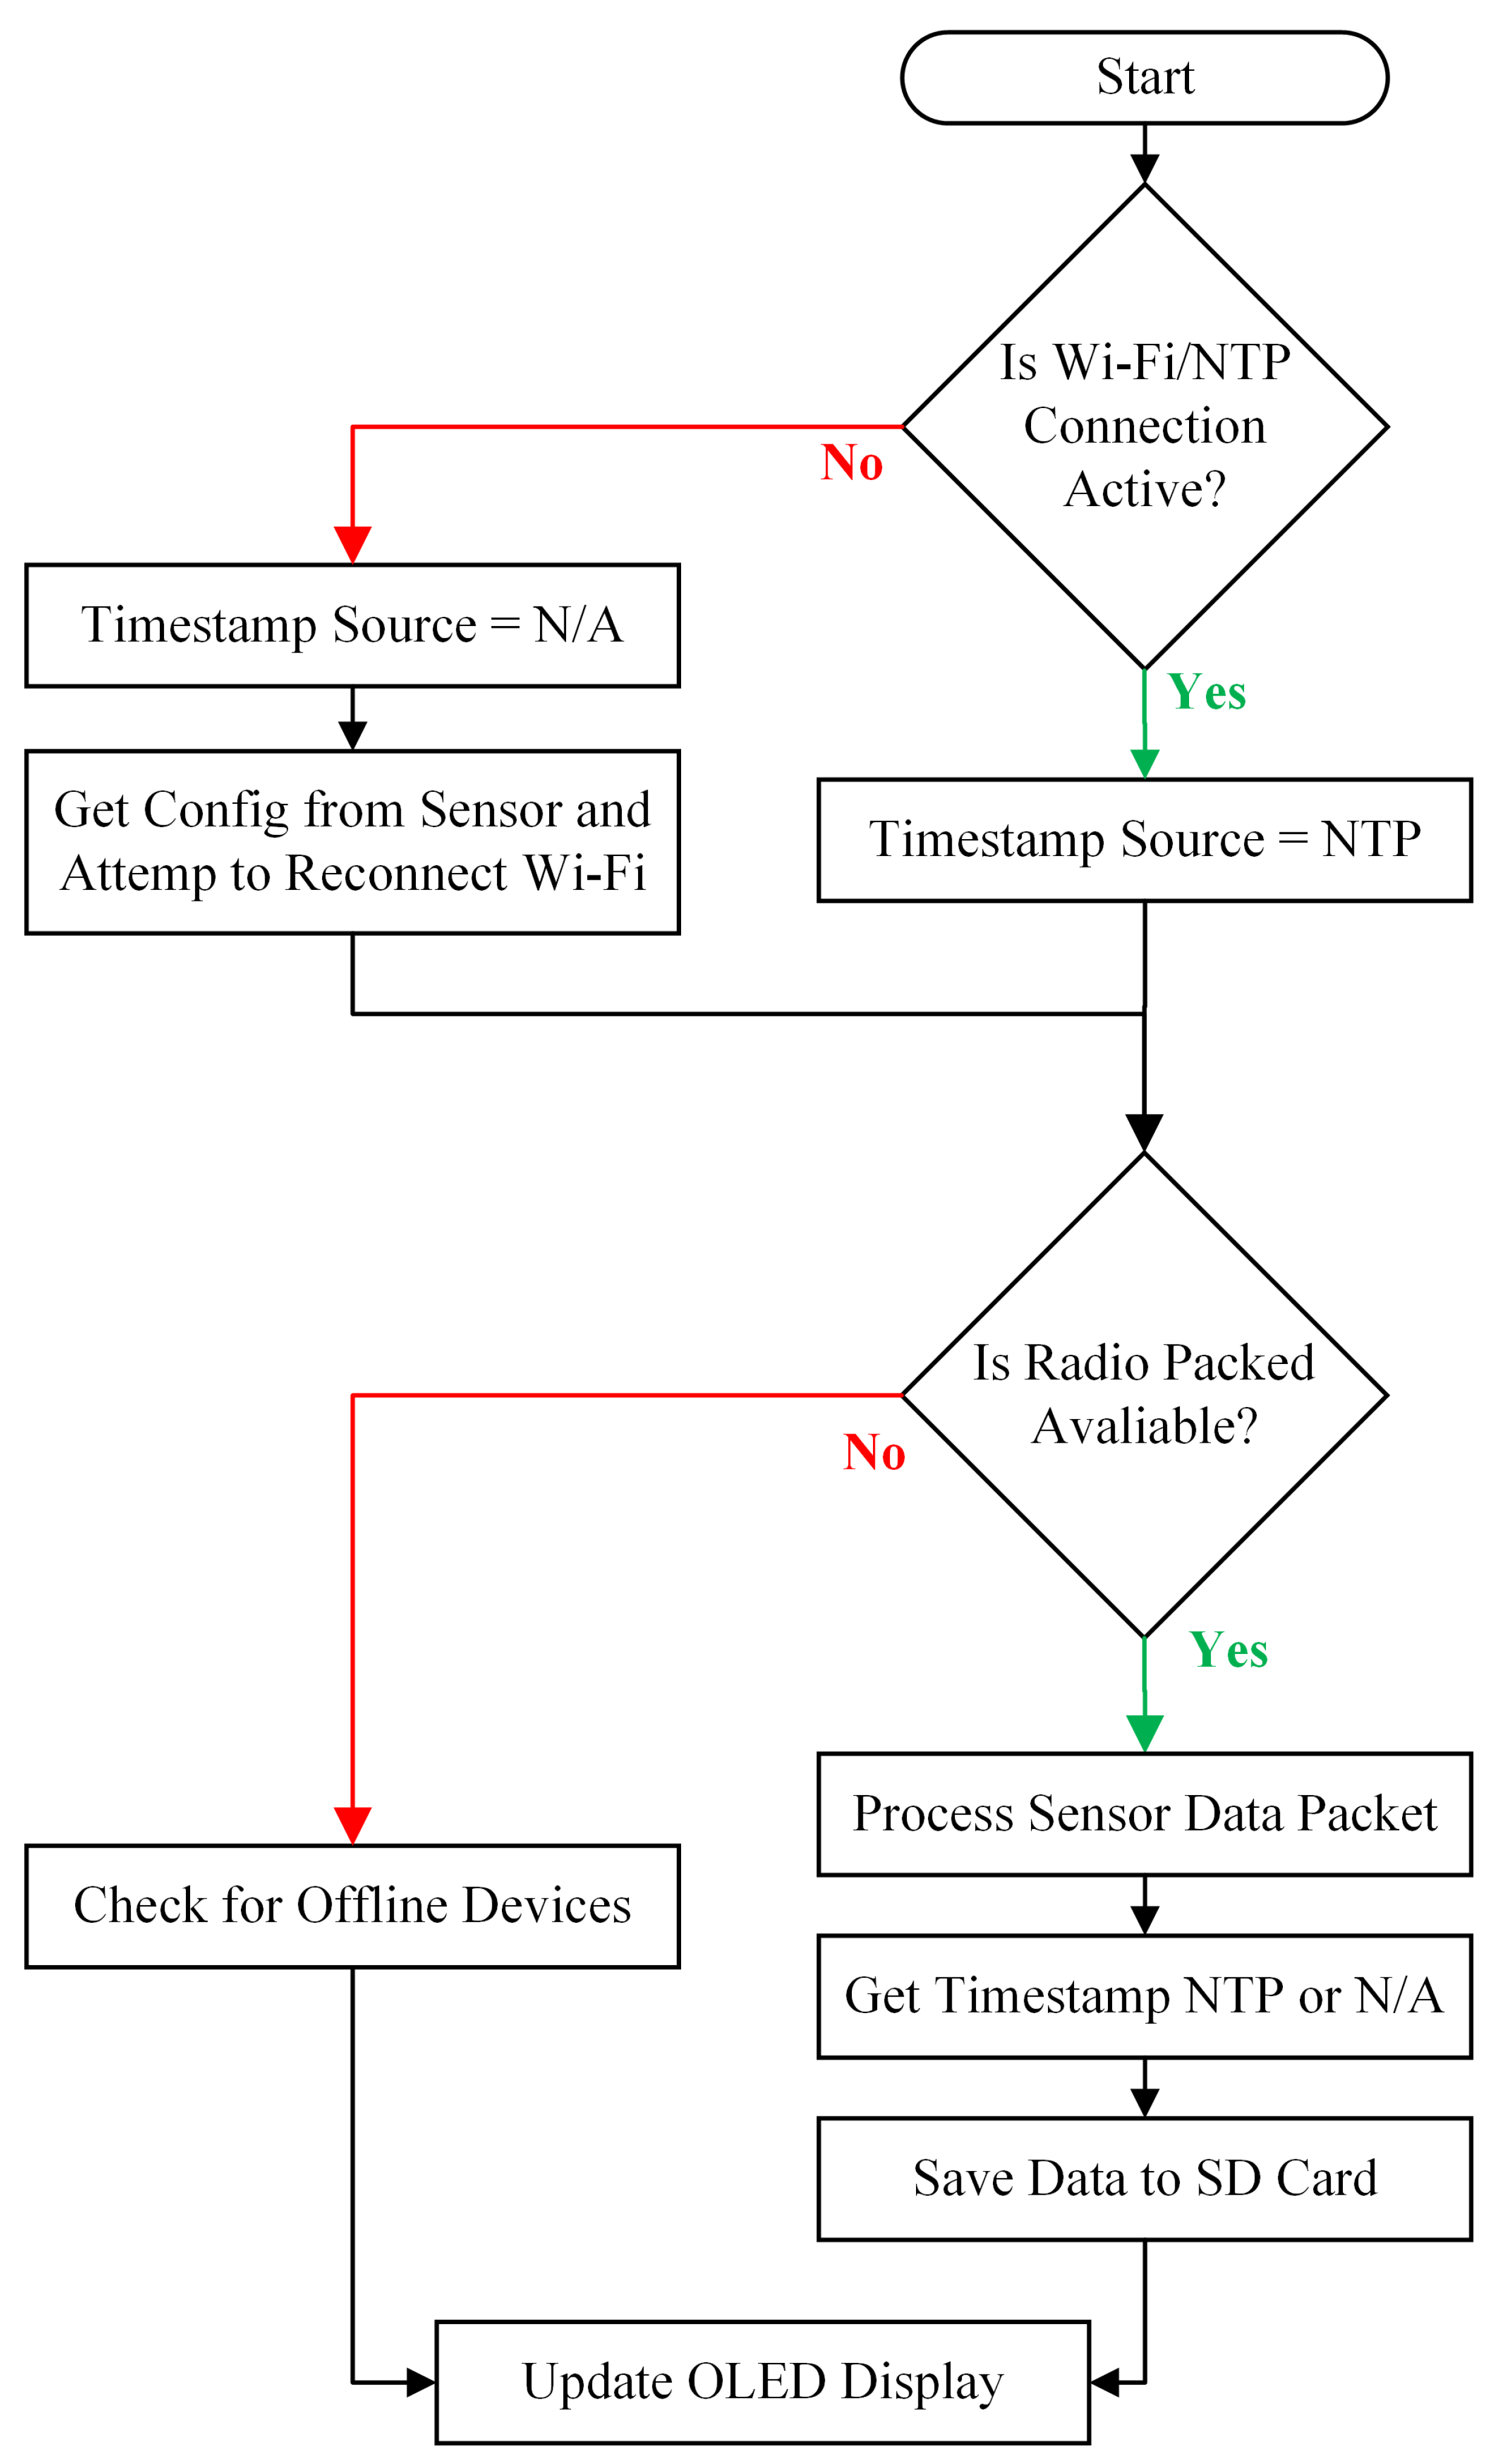
Figure 10.
User Interface
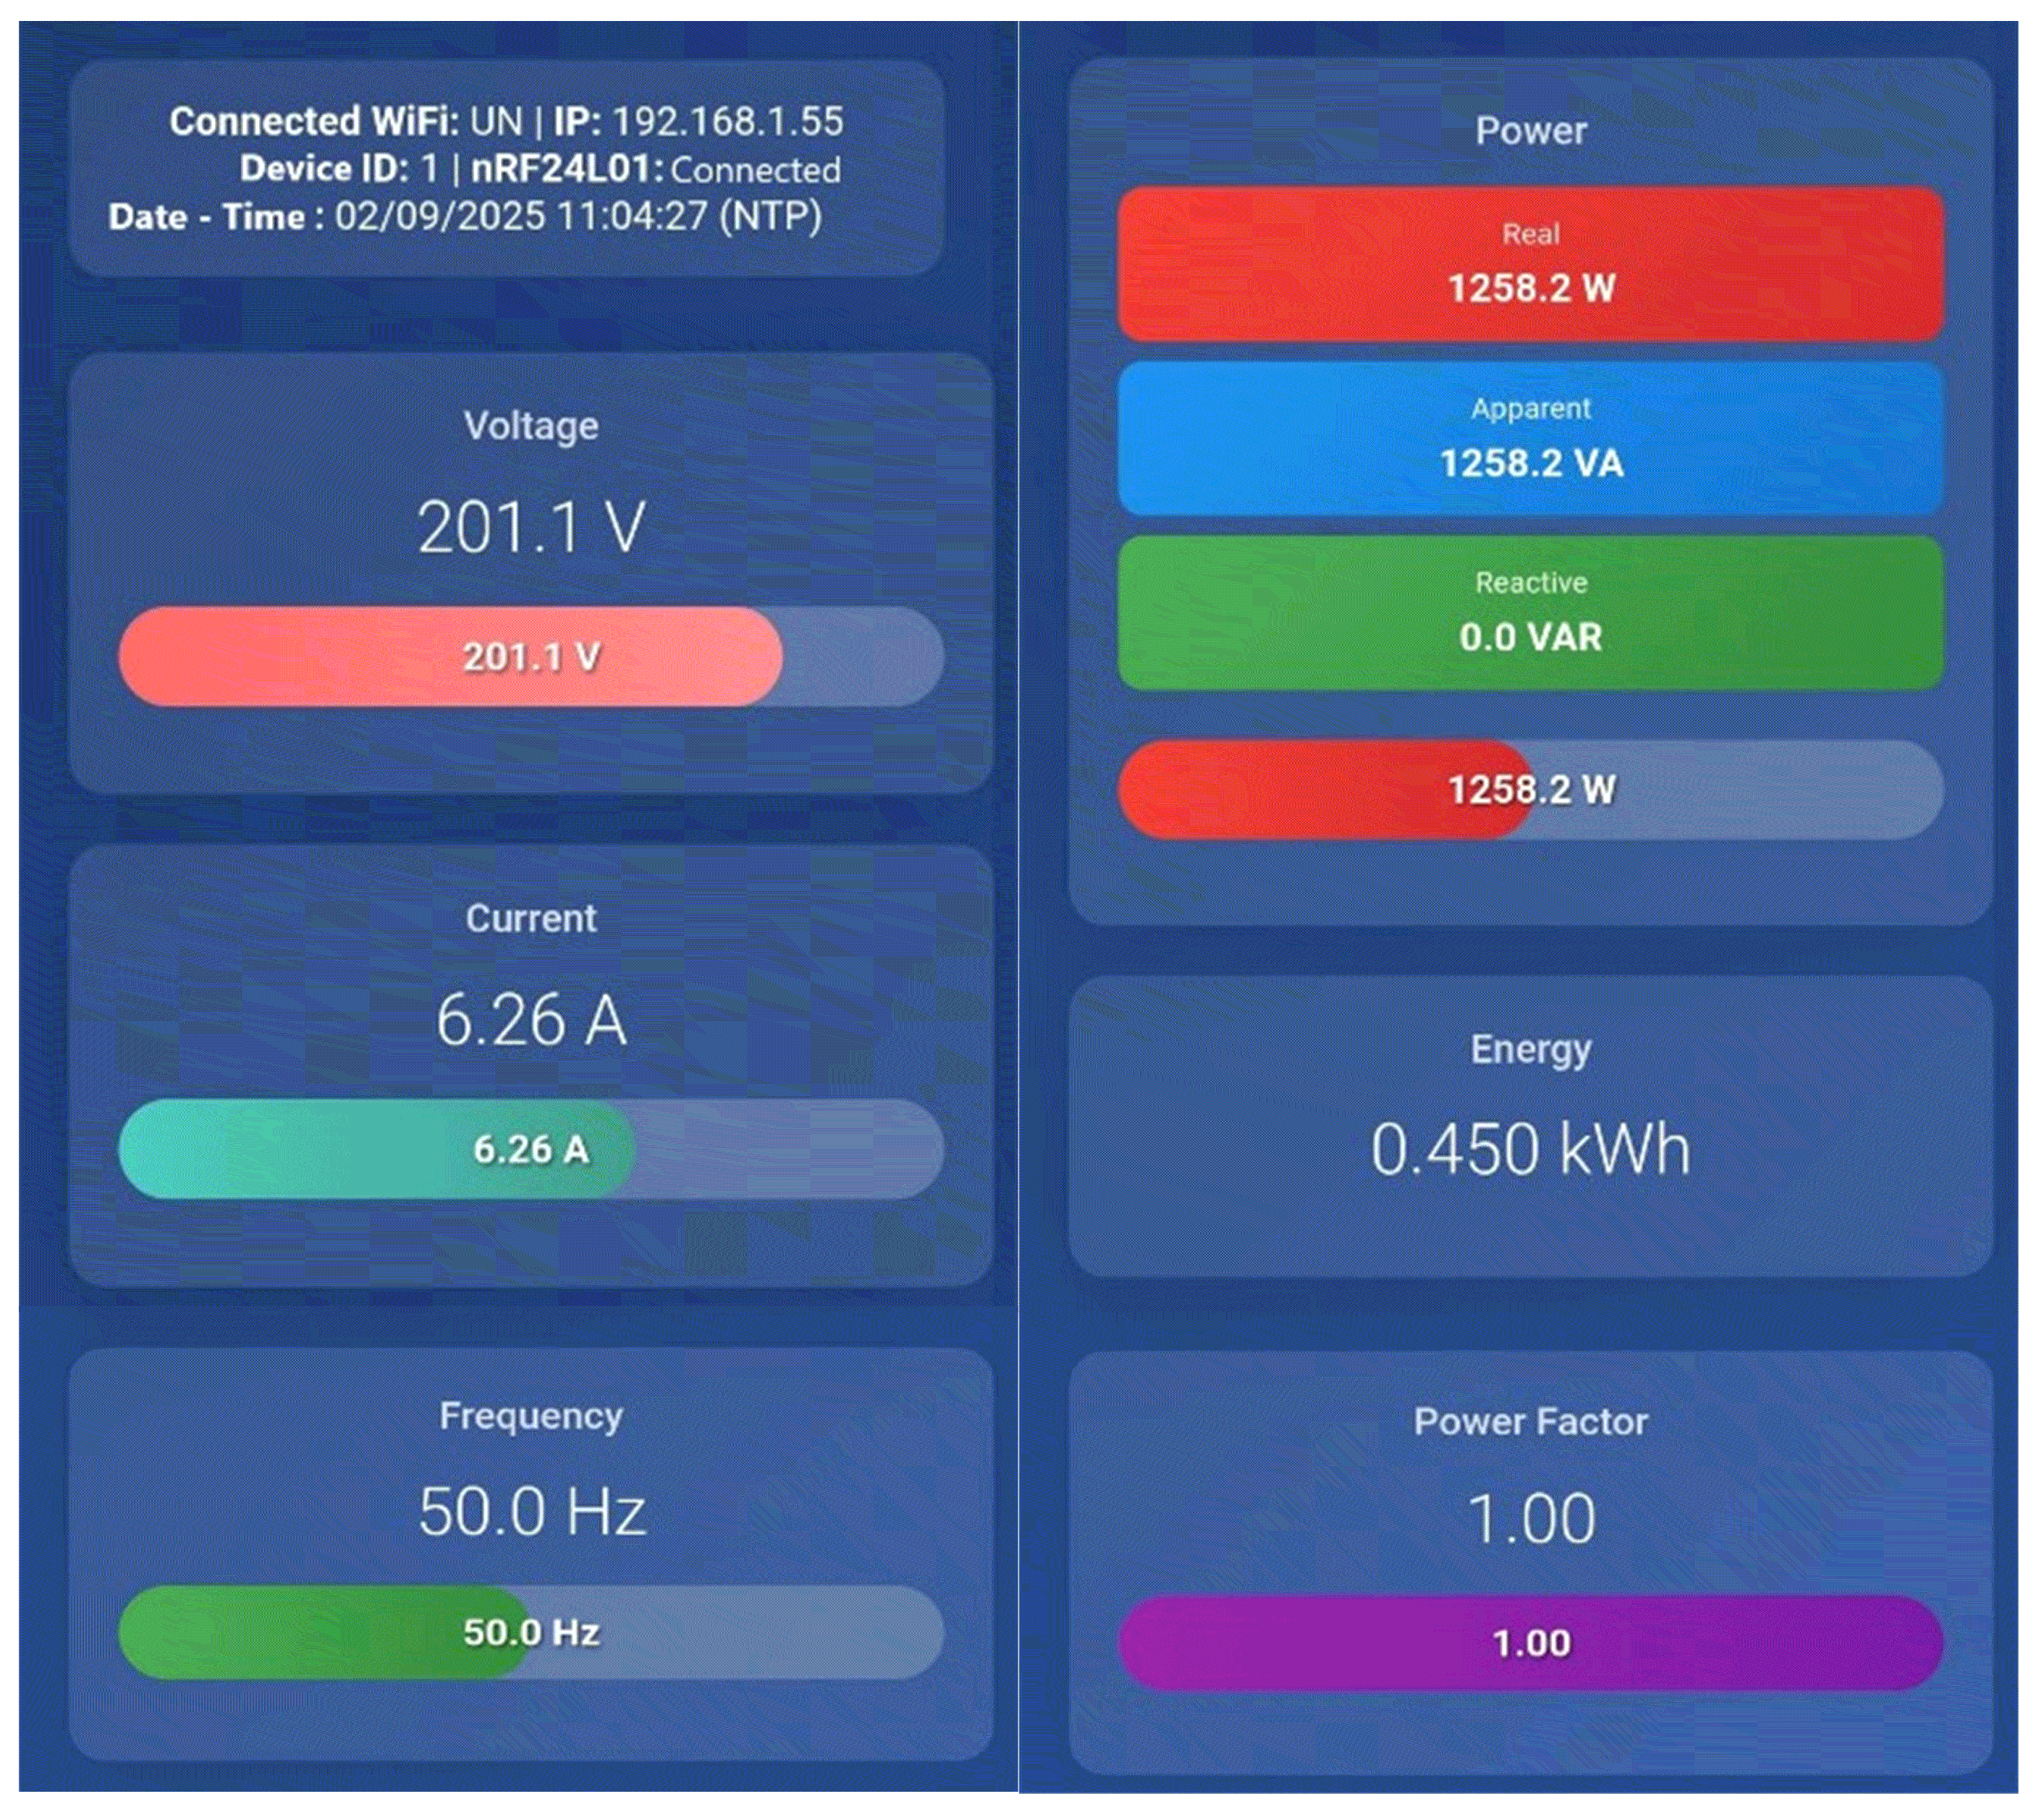
Figure 11.
Photograph of the realized project
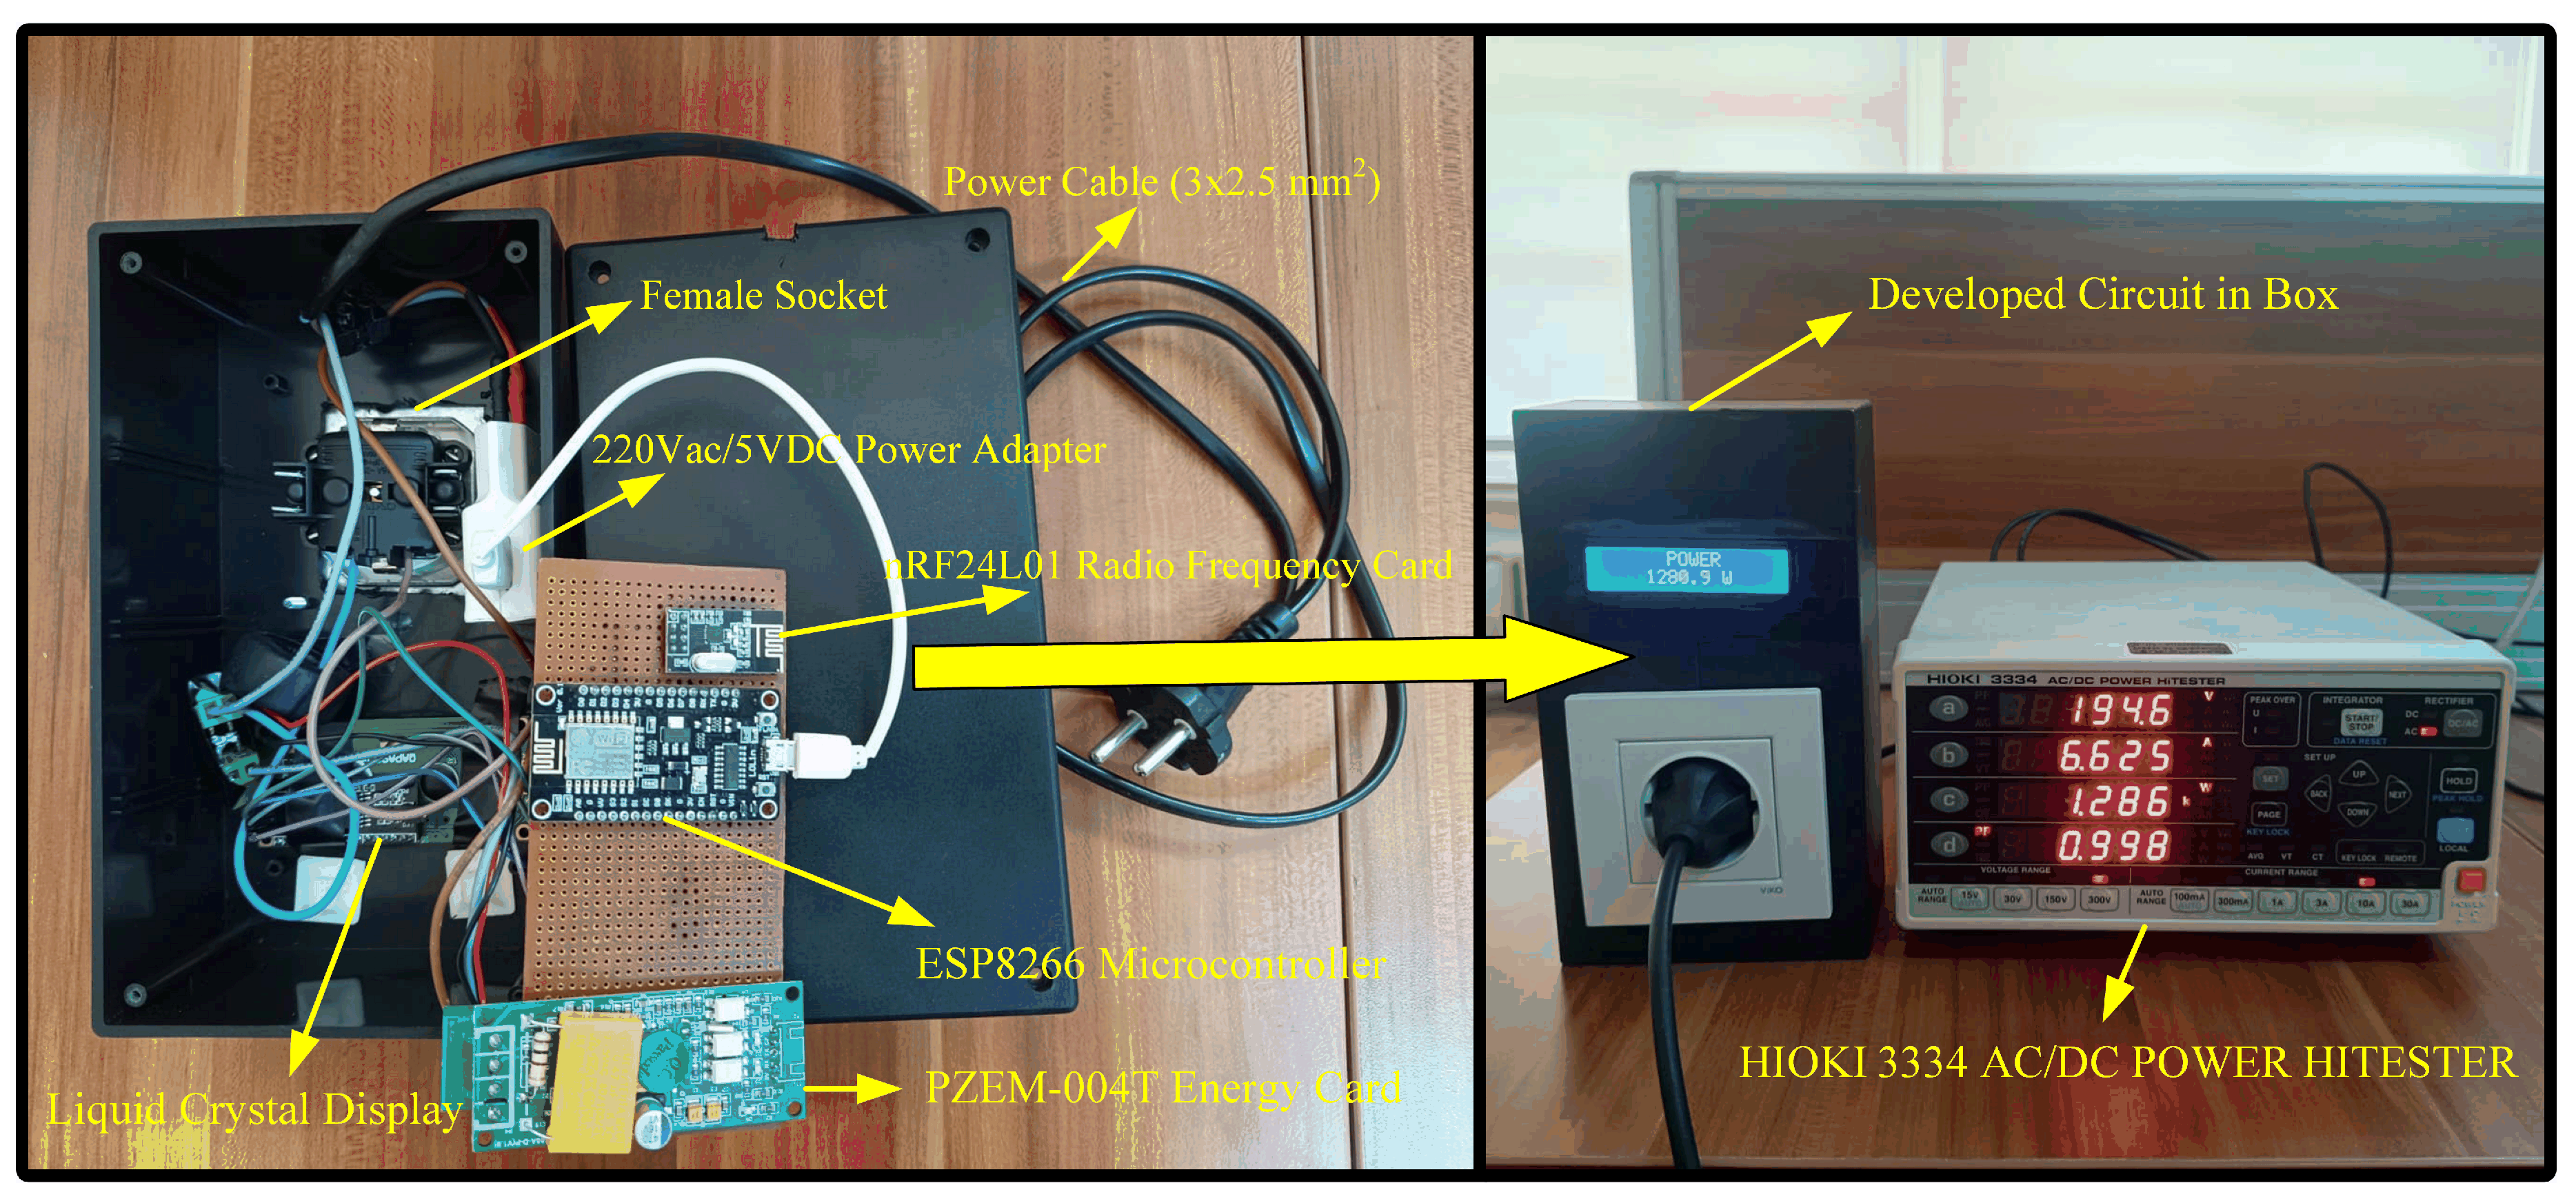
Figure 12.
Power measurement graphics
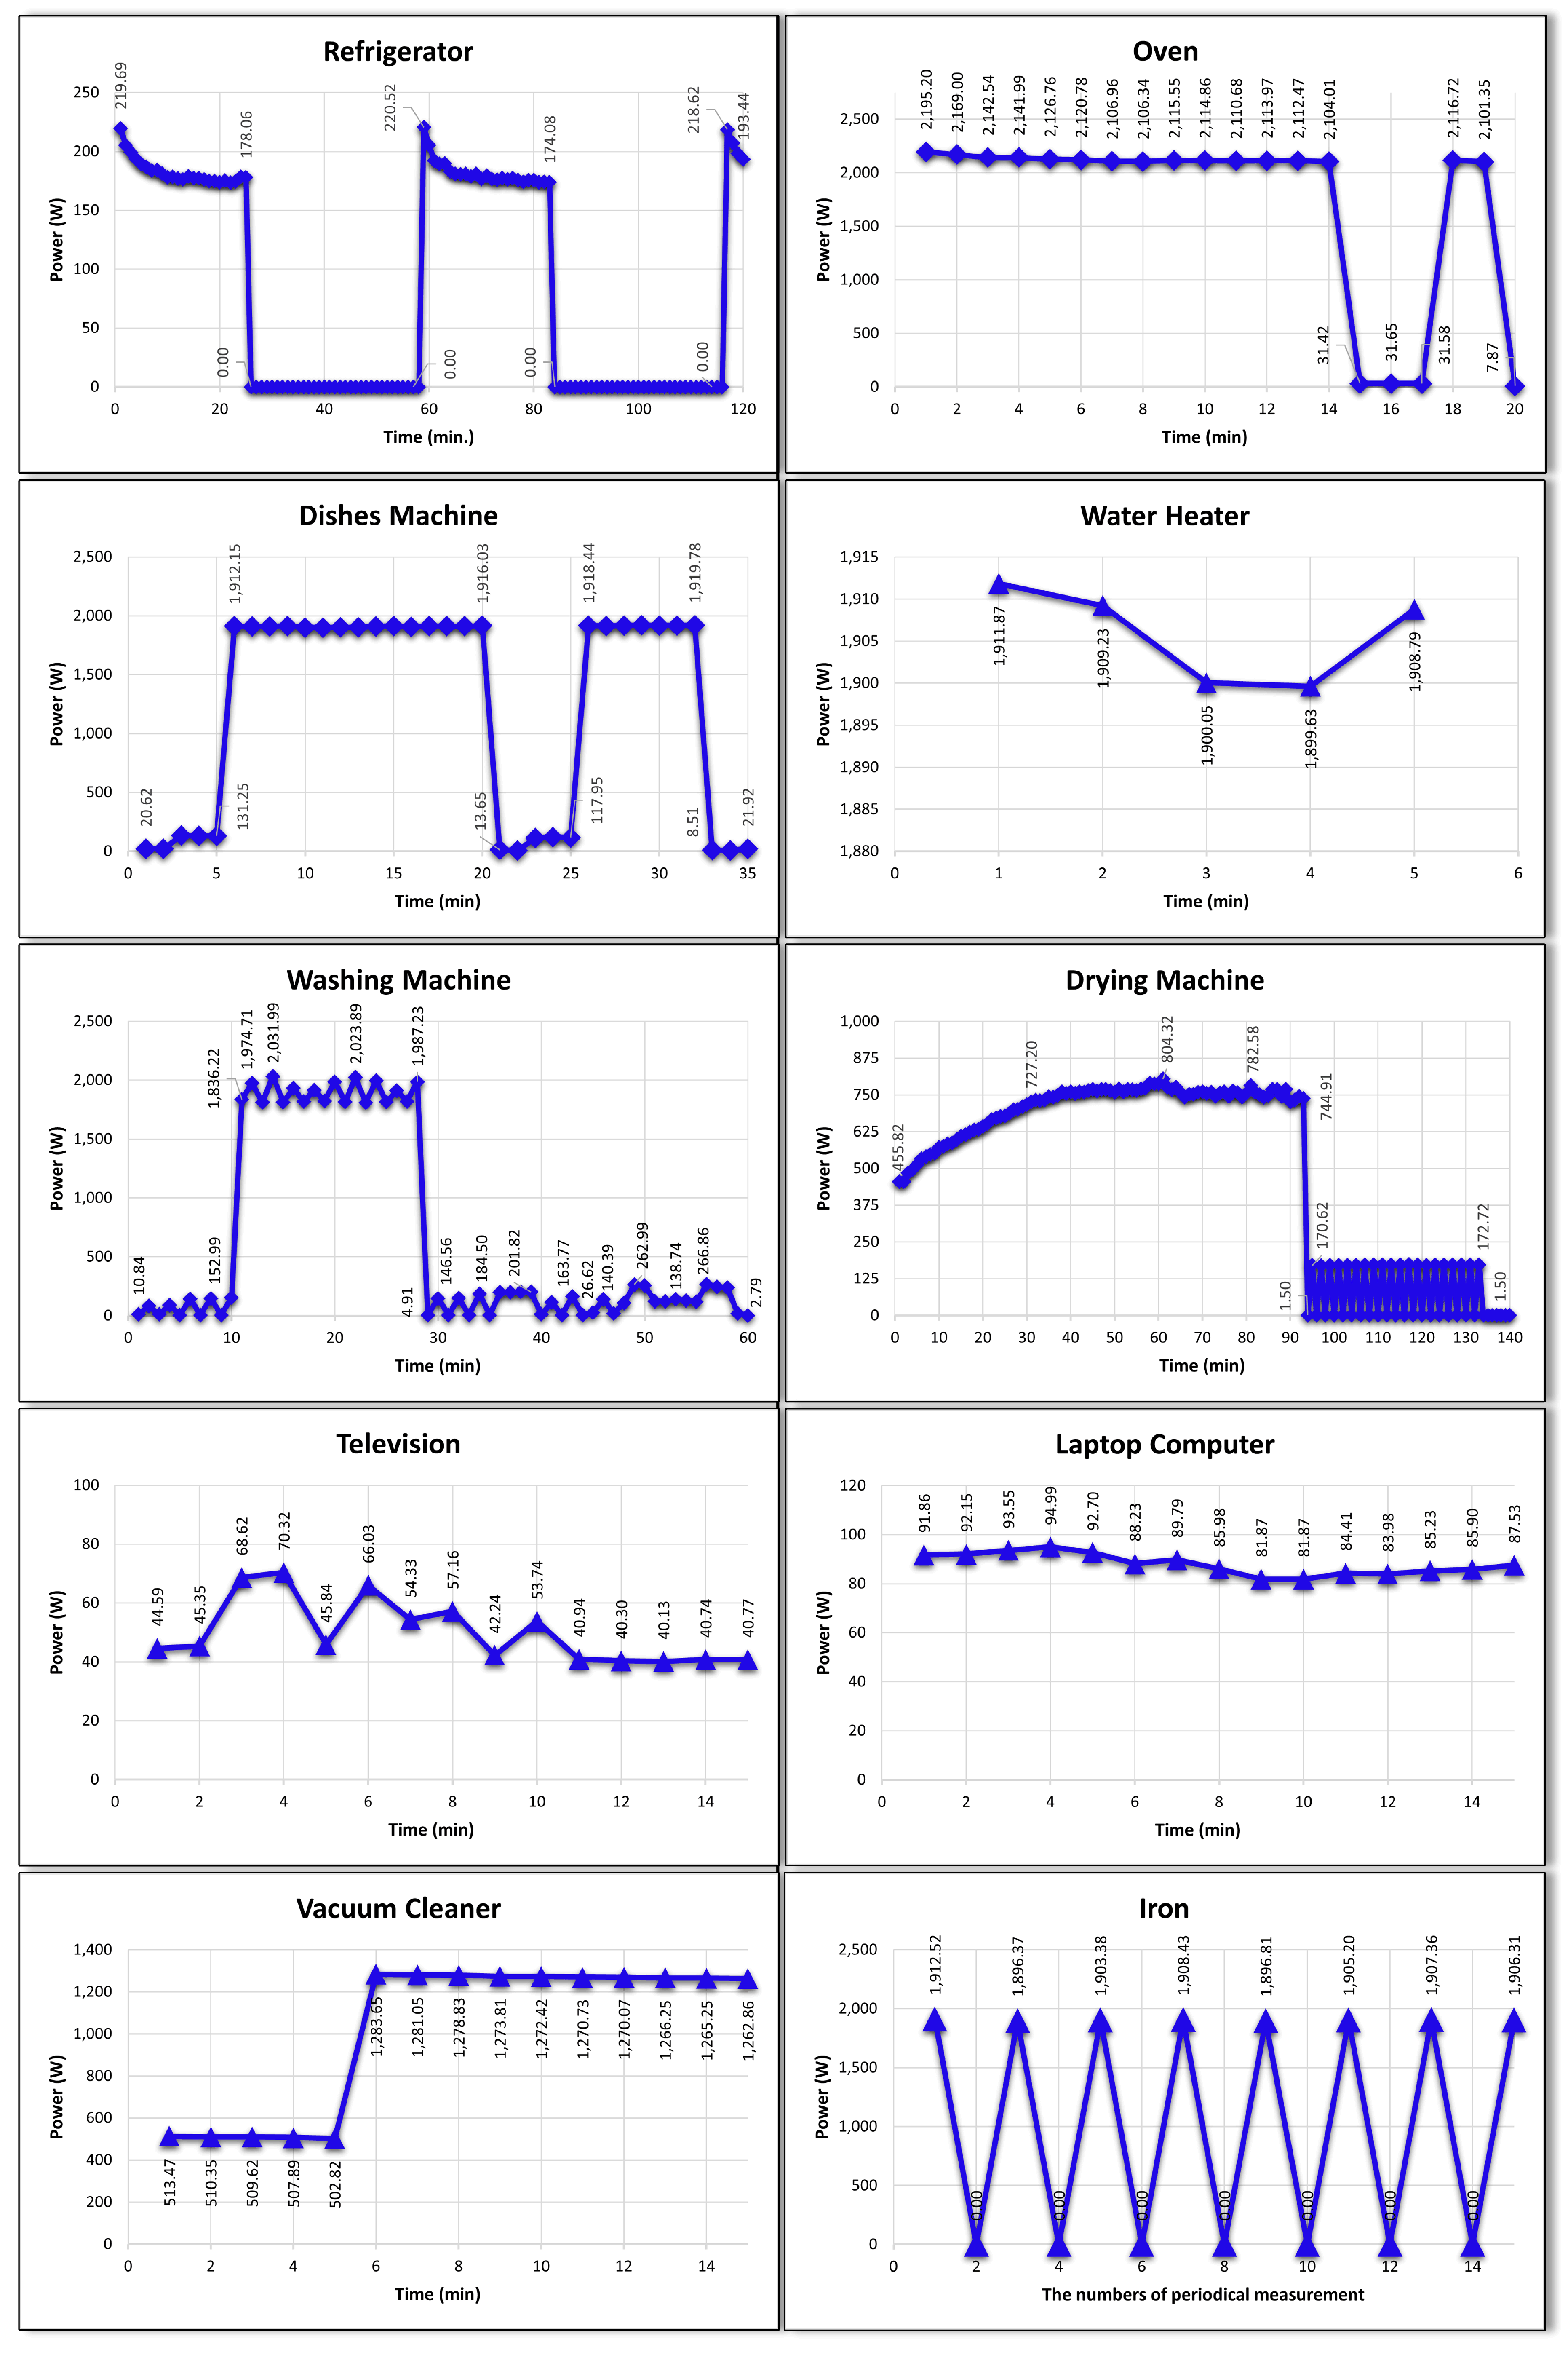
Table 1.
Comparative table of Prior Work’s Features.
| Author/s (Year) | Application Type | Sensors | Communication Type | Microcontroller | Wireless Chip | Power Supply |
|---|---|---|---|---|---|---|
| Karthick et al. (2021) [4] | Commercial Building Energy Management System (CBEMS) | PZEM-004T | MQTT | Raspberry Pi 4B+, ESP8266 | ESP8266 Wi-Fi microchip | SMPS 5V |
| Mudaliar & Sivakumar (2020) [5] | RealTime Energy Monitoring and Control | Schneider EM 6400NG, Elmeasure EN8400 | RS485 | Raspberry Pi 3 Model B+ | Raspberry Pi 3 Model B+ | Micro USB connector 5V supply |
| Harihara et al. (2020) [8] | Energy Consumption Monitoring System | ACS712 | HTTP, web socket protocol | Arduino Uno | WIFI ESP8266 module | 3.7V Battery, 12V DC to 5V DC voltage regulator |
| Hussain et al. (2021) [9] | Real-Time Load Monitoring and Control System | Voltage Sensor: ZMPT101B, Current Sensor: ACS712-5A, GPS Module: NEO-6M | LoRa for DCN, MQTT | Arduino MEGA 2560, Raspberry Pi | SX1276-based Dragino LoRa Shield, RF96-based Dragino LoRa GPS Shield | 220/12 Vrms transformer, 5V regulator |
| Khanna et al. (2021) [10] | Real-time Energy Monitoring | YHDC SCT-013, HCT-0016-100 | Serial Connection, Wi-Fi protocol | Atmega328P, Raspberry Pi 3B+ | Raspberry Pi | Variable DC Power Supply |
| Elkholy et al. (2022) [11] | Real-Time Smart Home Management System (HAMS) | Temperature, Humidity, Smoke, Lighting, PIR, Body Temperature Sensors, Smart Meter | Cayenne (IoT platform), Z-Wave | Raspberry Pi 4B | Raspberry Pi | Solar Panels, 12 V, 7 AH lead-acid battery, DC-DC converter |
| Paul & Manohar (2024) [13] | Automated Energy Metering and Billing System | Cutting-Edge Sensors | SMS Notifications/Alerts | Arduino | GSM Module | Step-Down Transformer, Rectifier, Regulator |
| Kumar et al. (2021) [14] | Smart Energy Meter | ACS712, ZMPT101B | Wi-Fi, GSM, HTTP | ATMega328p | Wi-Fi Shield (ESP8266) | Regulated Power Supply |
| Radhika et al. (2022) [16] | Smart Energy Meter | Current Sensors (name not specified) | Two-Way Communication, SMS | NodeMCU | Wi-Fi Module ESP8266 | 230 V, 50Hz AC Supply |
| Midul et al. (2023) [17] | IoT-Based Smart Energy Meter (SEM) | CT and PT Sensors (names not specified) | GSM / SMS | Arduino Nano V3.0 | SIM 800L GSM Module, ESP-8266 WiFi Module | 220V-50Hz Source, Rectifier, regulator |
| Hassan et al. (2024) [18] | IoT-based Smart Energy Meter | AC current, AC voltage, Flame, Smoke, Gas, Vibration sensors (names not specified) | Internet of Things (IoT), Wi-Fi | Arduino Mega 2560 V2 | ESP8266 Wi-Fi Module | Regulated Power Supply (PV/grid) |
| Muralidhara et al. (2020) [19] | IoT-based Smart Energy Meter | ACS712 | Internet of Things (IoT) via Wi-Fi | Arduino Uno | ESP8266 Wi-Fi Module | AC Power Supply |
| Muthu et al. (2023) [20] | Autonomous Smart Energy Meter | Potential Transformer (PT), Current Transformer (CT) | Internet of Things (IoT) via GSM | Arduino Uno | SIM800L GSM/GPRS Module | 5V Power Supply |
| Ajay et al. (2020) [21] | IoT Enabled Energy Meter | ACS712 | GSM/SMS (Offline), IoT/Wi-Fi (Online) | Arduino Uno | ESP8266 Wi-Fi Module | Main Supply (not specified) |
| Martinez-Blanco et al. (2020) [22] | IoT Based Smart Energy Meter | ACS712 (CT) | Wi-Fi, Machine-to-Machine (M2M) | ESP32 | ESP32 | Mains Supply |
| Sattaru et al. (2023) [35], Kadukar et al. (2024) [46], Chaiyong & Sonasang (2022) [49] | IoT-based Power Monitoring System, Smart Energy Meter | PZEM-004T | Wi-Fi, HTTP | NodeMCU | ESP8266 Wi-Fi Module | SMPS, DC Supply |
| Tobi & Van Harling (2021) [42] | Wireless Electrical Energy Transmission Recording System | PZEM-004T | RF Transmission | Arduino Uno | nRF24L01 | AC Power Supply, Step-down Transformer, Rectifier, DC Regulator |
| Proposed Application | Real-Time Low-Cost Energy Data Acquisition and Monitoring System | PZEM-004T | Radio Frequency, Wi-Fi (IEEE 802.11), Serial Communication | NodeMCU | nRF24L01, ESP8266 | 220V AC/5V DC Regulator |
Table 4.
Instantaneous measurement results and error percentages
| Measured Device | Development Device | Etalon Device | Percentage Errors | ||||||
| V | I | V | I | V | I | ||||
| 1.2kW Heater | 222.2 | 5.640 | 0.989 | 220.5 | 5.590 | 0.990 | 0.09% | 0.89% | -0.10% |
| 2x20W CFL | 224.5 | 0.278 | 0.633 | 224.0 | 0.275 | 0.645 | 0.22% | 1.09% | -1.86% |
| Hair Dryer | 220.6 | 6.667 | 1.000 | 220.2 | 6.652 | 1.000 | 0.18% | 0.23% | 0.00% |
| Water Dispenser | 223.6 | 1.728 | 0.990 | 223.2 | 1.720 | 1.000 | 0.18% | 0.47% | -1.00% |
Disclaimer/Publisher’s Note: The statements, opinions and data contained in all publications are solely those of the individual author(s) and contributor(s) and not of MDPI and/or the editor(s). MDPI and/or the editor(s) disclaim responsibility for any injury to people or property resulting from any ideas, methods, instructions or products referred to in the content. |
© 2025 by the authors. Licensee MDPI, Basel, Switzerland. This article is an open access article distributed under the terms and conditions of the Creative Commons Attribution (CC BY) license (http://creativecommons.org/licenses/by/4.0/).
Copyright: This open access article is published under a Creative Commons CC BY 4.0 license, which permit the free download, distribution, and reuse, provided that the author and preprint are cited in any reuse.


