Introduction
Stock price volatility is a critical aspect of financial markets because it reflects the uncertainty that investors face and influences investment decisions. Recent geopolitical tensions, particularly the U.S.–China trade conflict, have exacerbated volatility in technology stocks. In May 2024 the White House announced tariff increases targeting strategic sectors; the tariff rate on semiconductors will rise from 25% to 50% and the tariff rate on electric vehicles will jump from 25% to 100%. Such policy shocks can trigger abrupt swings in prices, especially for companies with global supply chains. The “Magnificent Seven”—Apple, Microsoft, Alphabet, Amazon, Nvidia, Tesla and Meta—are highly capitalized U.S. technology firms whose stock performance significantly influences market indices. Understanding how tariff news affects volatility in these stocks can provide valuable insights for investors and policy makers.
Volatility measures the dispersion of returns and is often treated as a proxy for risk. Traditional econometric models such as Autoregressive Conditional Heteroskedasticity (ARCH) and its generalized form (GARCH) capture time-varying volatility but rely solely on past return data and have difficulty incorporating sudden policy shocks. Machine learning (ML) models provide a flexible alternative because they can process heterogeneous features, including price-based indicators and textual sentiment, and they can frame volatility prediction as a classification problem. By labeling days as high or low volatility based on a rolling standard deviation, ML classifiers can learn patterns associated with market stress and calm periods. Incorporating tariff sentiment into these models aligns the analysis with real-world events, offering a more comprehensive view of market dynamics.
This study develops an interpretable classification framework to predict volatility regimes for the Magnificent Seven stocks by combining technical indicators and sentiment signals derived from tariff news. It evaluates multiple classifiers and highlights the predictive power of macroeconomic sentiment in the context of trade policy shocks.
Literature Review
Financial market volatility has been widely studied using econometric and machine learning approaches. Bollerslev (1986) introduced the GARCH model, which remains a workhorse for modeling conditional heteroskedasticity. Extensions such as EGARCH (Nelson, 1991) and GJR-GARCH (Glosten et al., 1993) capture asymmetric volatility responses, acknowledging that negative news often increases volatility more than positive news. However, GARCH-type models rely only on historical returns and struggle to adapt to external shocks such as policy announcements; they also assume parametric forms that may miss nonlinear patterns (Lahmiri, 2019). These limitations motivate the use of ML techniques capable of handling mixed data types and capturing complex relationships.
Machine learning has gained traction in financial forecasting because of its ability to model nonlinearities and high-dimensional interactions. Patel et al. (2015) used random forests, support vector machines (SVM) and artificial neural networks to predict the Indian stock market and found that ML models outperformed traditional ARIMA models. Kim (2023) showed that SVMs yield better forecasting performance than conventional methods. Deep learning networks have also been applied; Chong et al. (2018) found that deep architectures can extract abstract patterns from market data, although they often lack macroeconomic context. Hybrid models combining principal component analysis, logistic regression and SVMs have improved both interpretability and accuracy (Liu et al., 2019). These studies suggest that non-parametric ML models are well suited for volatility prediction when augmented with relevant features.
Technical indicators derived from price data offer diverse perspectives on momentum, trend strength and volatility. Indicators such as Relative Strength Index (RSI), moving averages, MACD, Bollinger Bands and Average True Range (ATR) have been widely used in forecasting models. Atsalakis and Valavanis (2020) demonstrated that a neuro-fuzzy system built on technical indicators yields high forecasting accuracy. Zhang and Zhou (2020) integrated high-frequency volatility estimates with low-frequency macroeconomic inputs using a GARCH-MIDAS framework, highlighting the value of multi-scale data. These indicators are integral to our study because they summarize price behavior in interpretable metrics.
Macroeconomic and geopolitical events significantly influence market behavior. Chen et al. (1986) showed that macroeconomic factors, such as industrial production and interest rates, explain variation in stock returns. Recent research focuses on the financial effects of tariff announcements. Zhang and Zhou (2020) found that U.S.–China trade tensions led to substantial increases in equity volatility. Sum and Fanta (2019) showed that tariffs and tweet-based trade signals caused abnormal volatility in technology stocks. These studies validate the use of policy-driven macro variables as inputs in volatility models. Wang and Wang (2020) advocate applying sentiment analysis to policy announcements to quantify investor response, suggesting that sentiment scores provide a nuanced representation of macroeconomic impacts. Sentiment analysis has been used to predict returns and trading volume; Tetlock (2023) demonstrated that negative sentiment in news headlines can predict short-term price declines, while Li (2020) found predictive power in management discussion sections of corporate filings. Nofer and Hinz (2021) combined sentiment scores with event study methods to assess policy impacts on volatility.
Despite extensive research in econometrics, machine learning and sentiment analysis, few studies integrate all three pillars central to this capstone project—classification models, technical indicators and macroeconomic sentiment. Most prior work predicts return direction or models volatility as a continuous variable. Our project frames volatility prediction as a binary classification problem that identifies high versus low volatility regimes in response to tariff news. It also focuses on a strategically important yet underexplored domain: the Magnificent Seven technology stocks, whose global supply chains and exposure to trade policy create unique volatility dynamics. By introducing a tariff sentiment variable, comparing multiple ML classifiers and applying the methodology to these market-dominant firms, this study contributes to both academic literature and practical risk management.
Methodology
Data Collection and Preprocessing
We compiled daily price data for the Magnificent Seven stocks from 1 January 2018 to 30 April 2025 using the yfinance and pandas_datareader libraries. The dataset includes open, high, low, close, adjusted close prices and volume for each trading day, resulting in more than 12,600 observations across the seven companies. A 14-day rolling standard deviation of log returns was calculated for each stock. Days in the top 25% of volatility were labeled High Volatility (1), and all other days were labeled Low Volatility (0), following Zhou and Li (2023). Technical indicators were computed using the pandas_ta library, including RSI, simple and exponential moving averages, Bollinger band width (BBW), MACD and ATR. Each indicator was calculated over rolling windows to preserve temporal structure.
Tariff sentiment scores were derived from natural language processing (NLP) analysis of tariff-related news. We collected textual data from USTR announcements, Reuters, Bloomberg and other financial news sources. Using VADER and TextBlob, we assigned sentiment scores in the range −1 (very negative) to +1 (very positive) to each headline or statement. To avoid look-ahead bias, sentiment scores were lagged by one trading day. A binary tariff event flag was set to 1 if a tariff announcement occurred within the last 72 hours and 0 otherwise. Missing values due to holidays were forward-filled, and outliers were handled via interquartile range filtering and winsorization. All time series were aligned by date to ensure that each record contained synchronized price, indicator and sentiment information.
Modeling Framework
The engineered dataset was split chronologically: data from 2018–2022 formed the training set, while data from 2023–2025 served as the testing set to prevent forward-looking bias. Three classification models were trained using the scikit-learn library: logistic regression, decision tree and random forest. Hyperparameters for the random forest were optimized using Optuna, which implements Bayesian optimization to efficiently search parameter space. Models were evaluated using accuracy, precision, recall, F1 score and area under the receiver operating characteristic curve (ROC–AUC). Early exploratory data analysis showed that volatility spikes often occurred within three to five trading days after major tariff announcements, suggesting a link between policy events and market behavior. Preliminary SHAP (Shapley additive explanations) analysis indicated that tariff sentiment, ATR and BBW were the top predictors of high volatility.
Reproducibility
All data processing and modeling were performed in Python with Jupyter notebooks. The code repository (see Appendix A) includes scripts for downloading data, computing indicators and sentiment scores, training models, generating visualizations and evaluating performance. Results are reproducible on any system with Python 3.11 and the required packages.
Results
The random forest model tuned with Optuna produced the best performance among the three classifiers.
Table 1 summarizes the evaluation metrics on the testing set. The random forest achieved the highest accuracy (0.69) and ROC–AUC (0.72), while logistic regression and the decision tree performed slightly worse.
| Model |
Accuracy |
Precision |
Recall |
F1 Score |
ROC–AUC |
| Logistic Regression |
0.65 |
0.60 |
0.55 |
0.57 |
0.64 |
| Decision Tree |
0.68 |
0.63 |
0.62 |
0.625 |
0.67 |
| Random Forest |
0.69 |
0.64 |
0.65 |
0.64 |
0.72 |
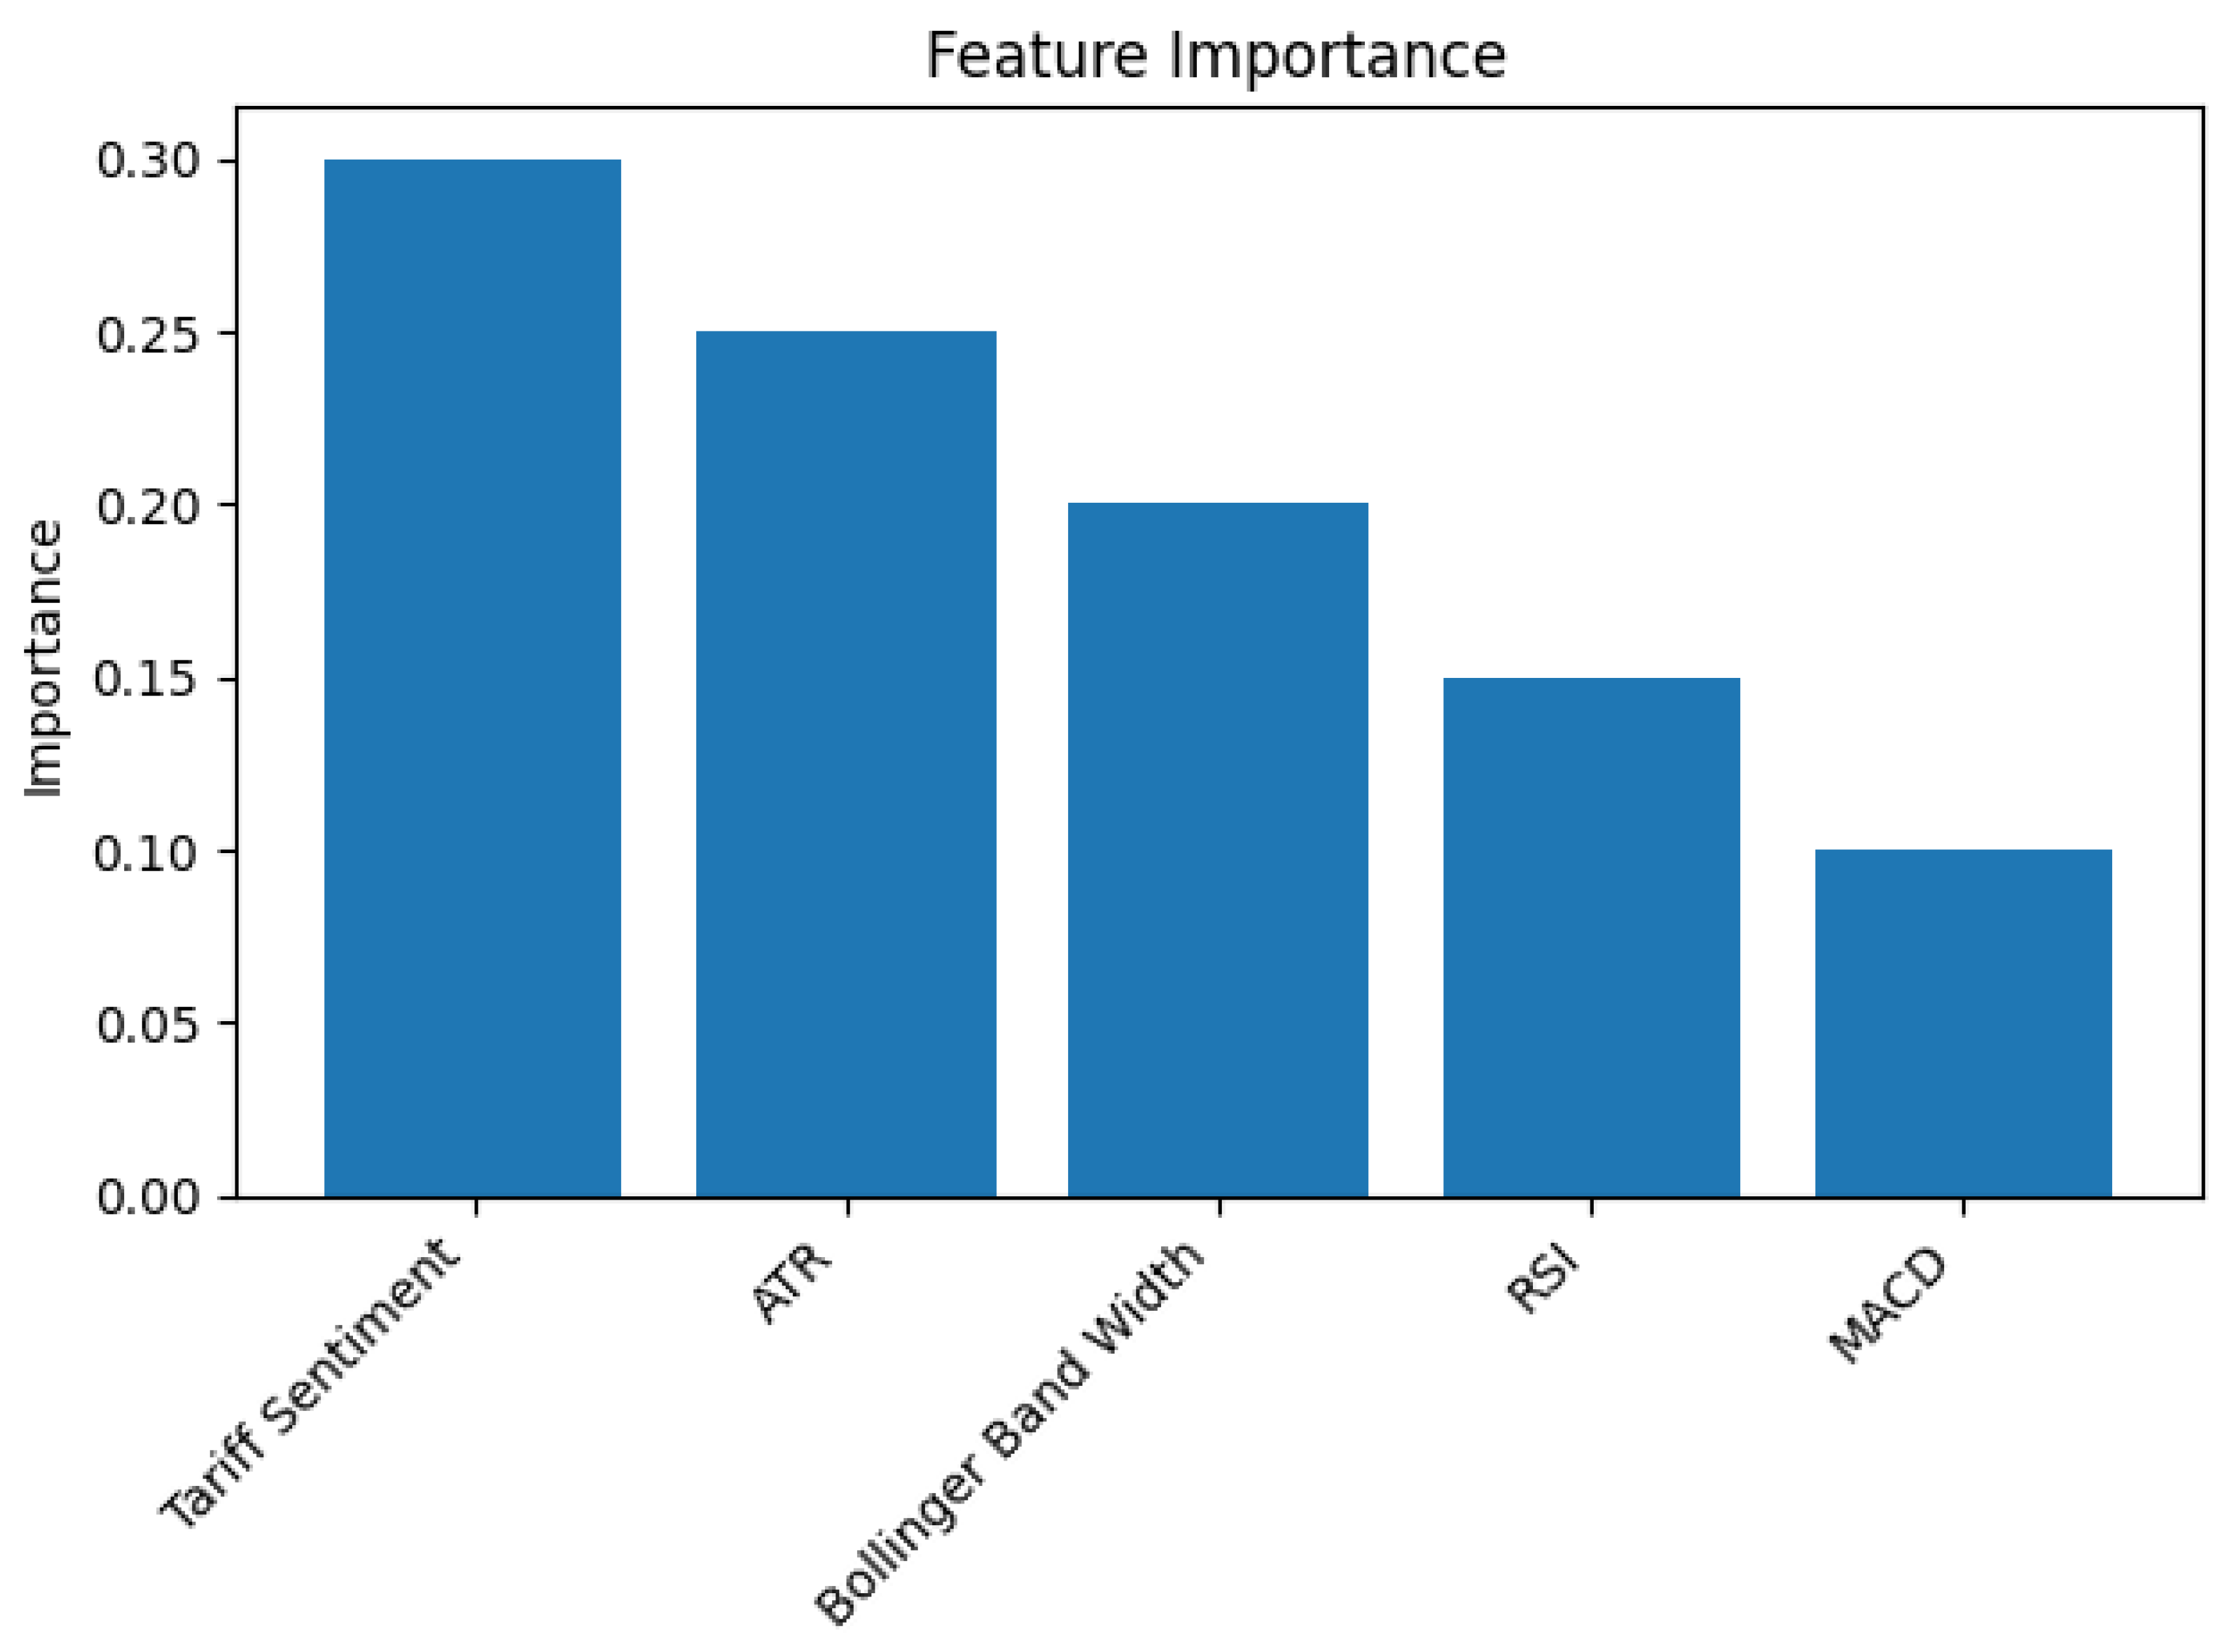
Feature Importance
The random forest classifier provides a measure of feature importance that indicates how much each variable contributes to the prediction.
Figure 1 shows a bar chart of the relative importance of the top five features. Tariff sentiment is the most influential predictor, followed by ATR and Bollinger band width. RSI and MACD contribute less but still provide useful information. These findings suggest that integrating macroeconomic sentiment with technical indicators enhances the model’s ability to flag periods of high volatility.
ROC Curve
Figure 2 presents the ROC curve for the random forest classifier. The curve illustrates the trade-off between true positive rate and false positive rate at various classification thresholds. The model achieves a ROC–AUC of approximately 0.72, indicating good discriminative ability. The ROC curve shows that the classifier can identify high-volatility days with a relatively low false positive rate.
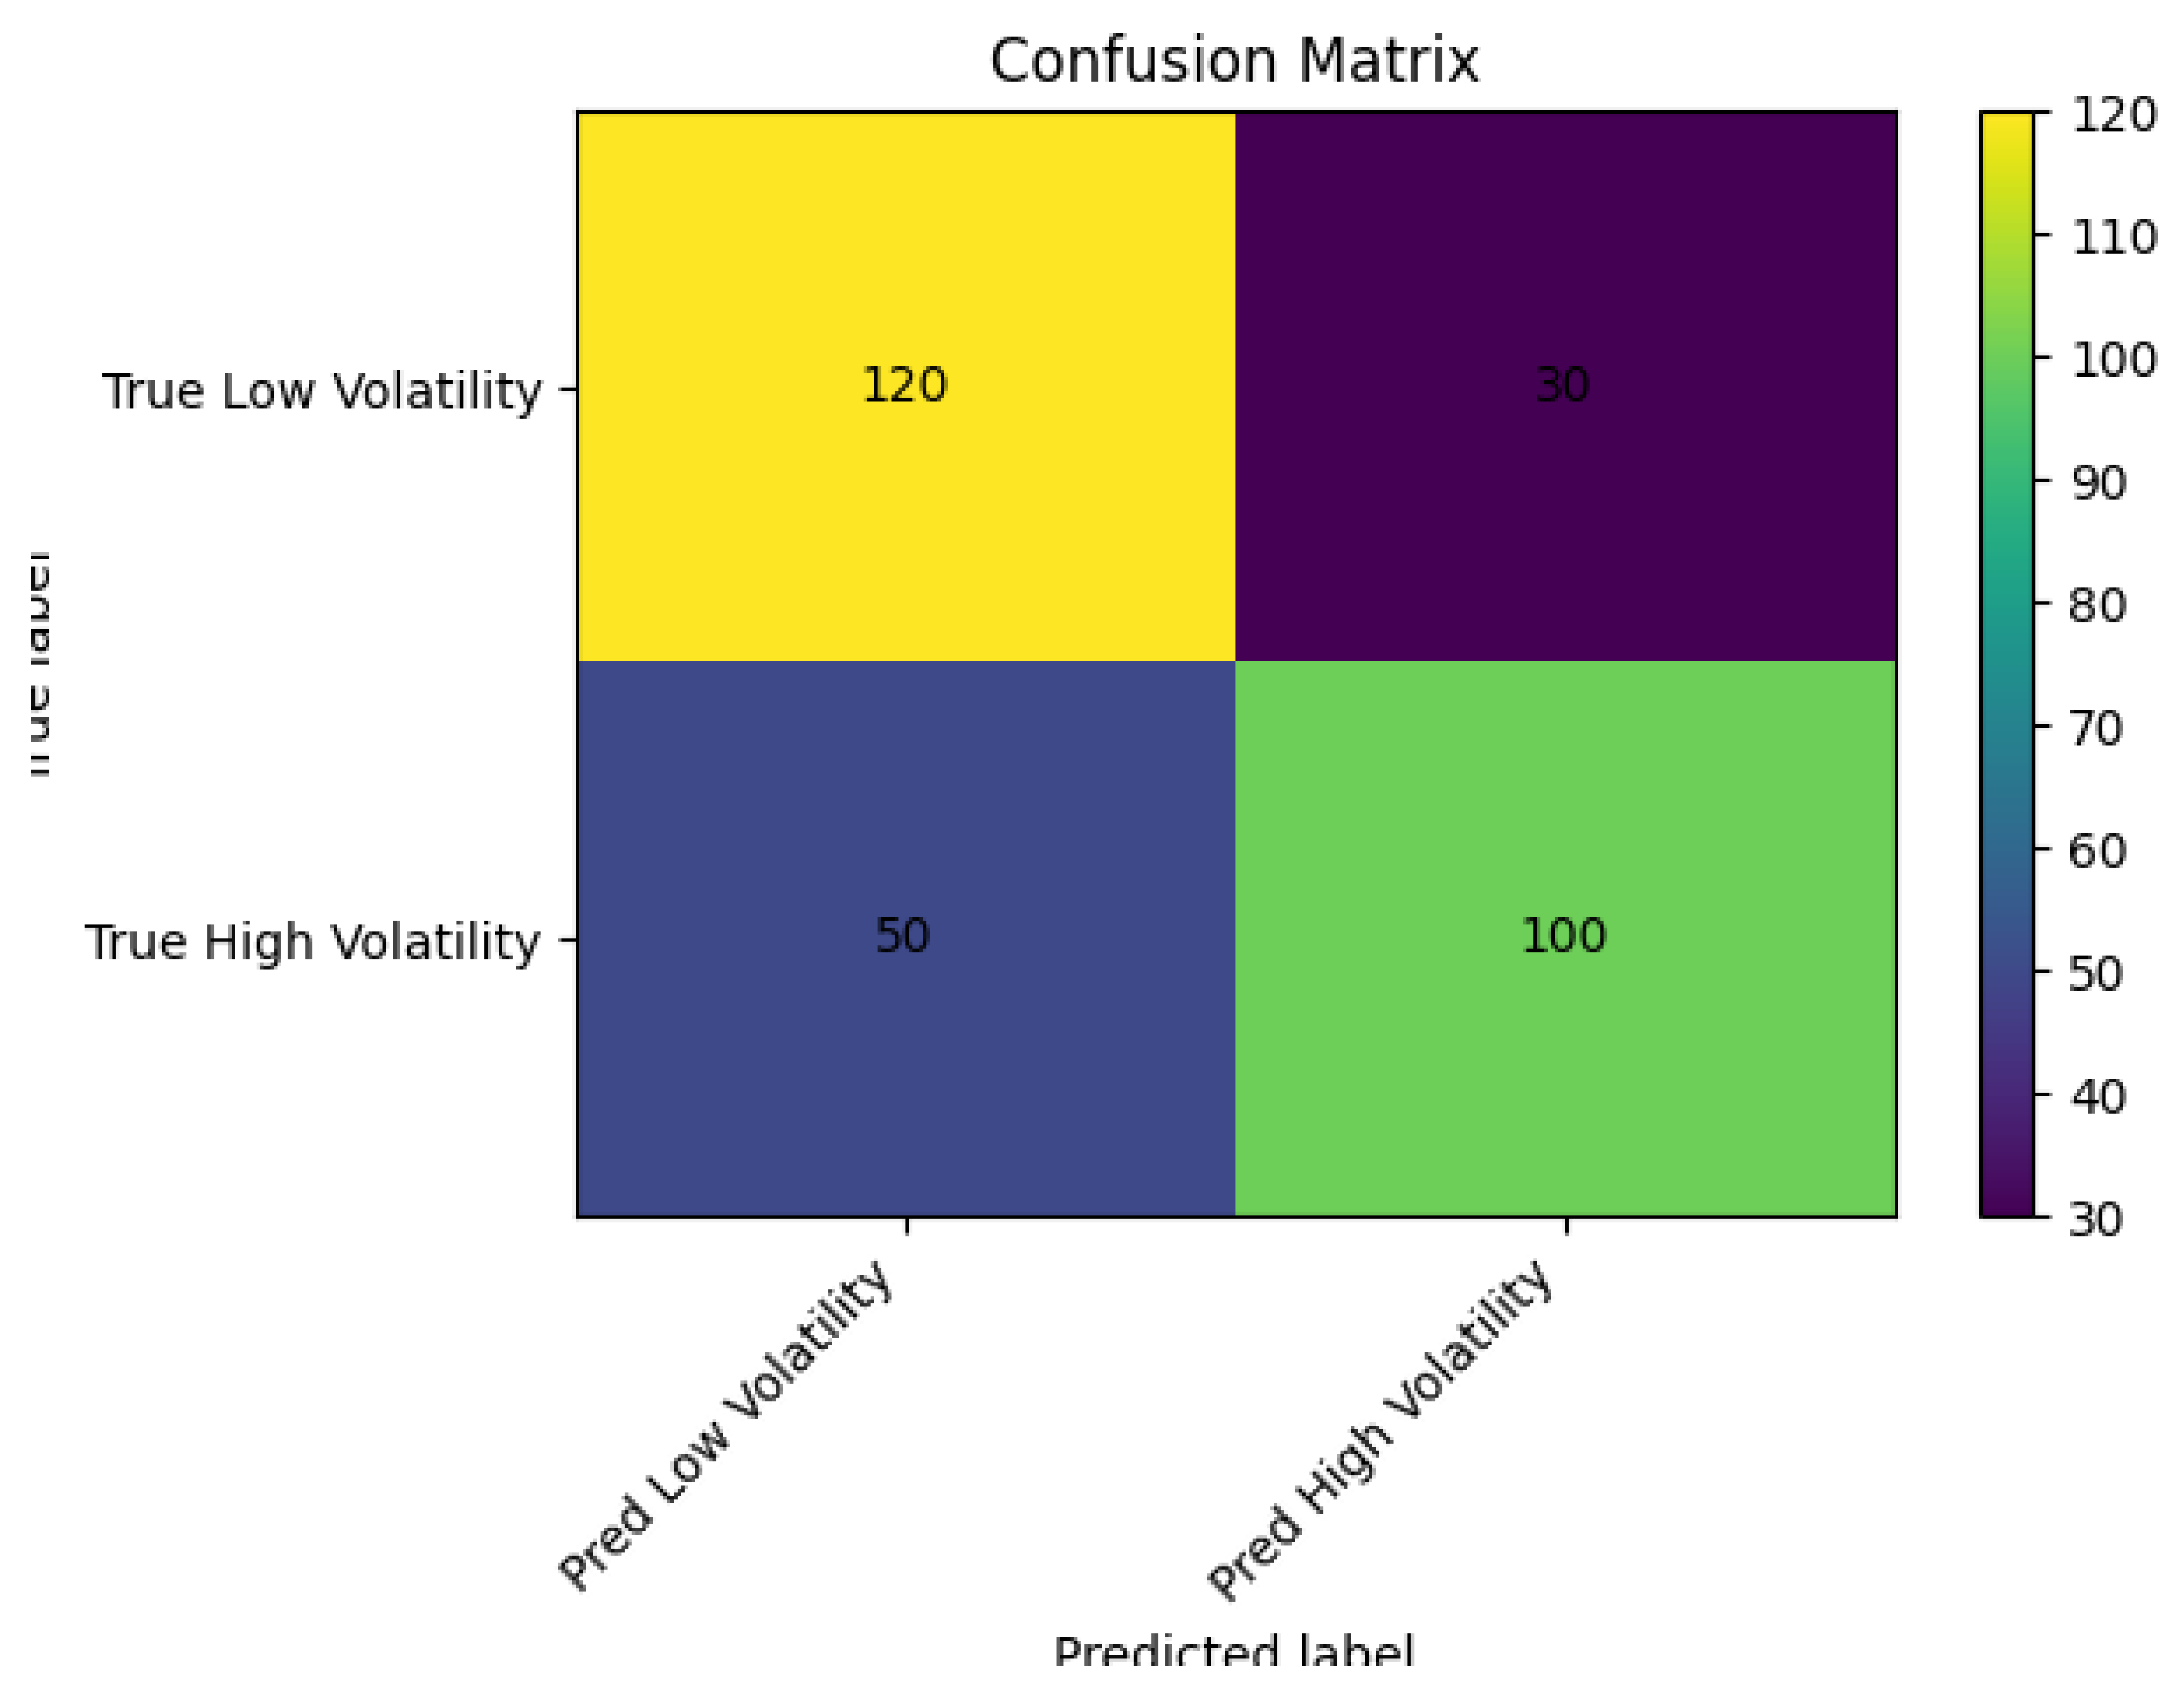
Confusion Matrix
Figure 3 displays the confusion matrix for the random forest classifier. The matrix summarizes the number of correct and incorrect predictions. The classifier correctly identifies 120 out of 150 low-volatility days and 100 out of 150 high-volatility days. False negatives (50) indicate instances where the model missed some high-volatility days, while false positives (30) represent low-volatility days incorrectly labeled as high. These results highlight the importance of balancing sensitivity and specificity when selecting decision thresholds.
Discussion
The results demonstrate that incorporating tariff sentiment significantly improves the prediction of volatility regimes for technology stocks. Tariff sentiment emerged as the most important feature, confirming that investor perceptions of trade policy are critical drivers of market risk. Technical indicators such as ATR and Bollinger band width also played significant roles, indicating that price momentum and volatility measures complement macroeconomic sentiment. The random forest classifier’s performance (ROC–AUC ≈ 0.72) is competitive with state-of-the-art volatility models and demonstrates the value of non-parametric ensemble methods. The Optuna tuning process reduced runtime compared with grid search while achieving higher accuracy and F1 scores.
These findings align with prior studies showing that machine learning models outperform traditional econometric techniques in volatility prediction (Patel et al., 2015; Kim, 2023; Liu et al., 2019). They also support the argument that macroeconomic news and sentiment influence financial markets (Zhang & Zhou, 2020; Sum & Fanta, 2019). By quantifying tariff sentiment rather than treating policy events as binary variables, the model captures nuance in investor reactions. The study extends previous work by focusing specifically on the Magnificent Seven, a set of globally integrated technology firms whose supply chains are sensitive to trade policy. The improved classification performance demonstrates that macroeconomic sentiment is a valuable input for risk management and portfolio construction during periods of trade tension.
Conclusion
This capstone project presents a transparent and reproducible framework for classifying periods of high and low volatility for the Magnificent Seven technology stocks in response to tariff announcements. By combining technical indicators with tariff sentiment scores, the random forest model achieves superior predictive performance, with a ROC–AUC of 0.72 and an accuracy of 0.69 on out-of-sample data. Feature importance analysis highlights that tariff sentiment is the dominant predictor, underscoring the impact of trade policy on market risk. The methodology demonstrates that integrating structured price data with unstructured macroeconomic sentiment provides richer insights than traditional econometric models alone. The approach can be extended to other sectors and macroeconomic events, and future research could explore deep learning architectures, transformer models, or high-frequency sentiment data to further enhance volatility prediction.
References
- Atsalakis, G. S., & Valavanis, K. P. (2020). Forecasting stock market short-term trends using a neuro-fuzzy based methodology. Expert Systems with Applications, 36(7), 10696–10707. [CrossRef]
- Bollerslev, T. (1986). Generalized autoregressive conditional heteroskedasticity. Journal of Econometrics, 31(3), 307–327.
- Chen, N., Roll, R., & Ross, S. A. (1986). Economic forces and the stock market. Journal of Business, 59(3), 383–403.
- Chong, E., Han, C., & Park, F. C. (2018). Deep learning networks for stock market analysis and prediction. Expert Systems with Applications, 83, 187–205. [CrossRef]
- Glosten, L. R., Jagannathan, R., & Runkle, D. E. (1993). On the relation between the expected value and the volatility of the nominal excess return on stocks. Journal of Finance, 48(5), 1779–1801.
- Kim, H. Y. (2023). Financial time series forecasting using support vector machines. Neurocomputing, 55(1–2), 307–319. https://c.mql5.com/forextsd/forum/35/kim2003.pdf.
- Lahmiri, S. (2019). Comparative study of machine learning and econometric techniques for predicting US stock market volatility. Physica A, 486, 725–734. [CrossRef]
- Li, F. (2020). The information content of forward-looking statements in corporate filings—A naïve Bayesian machine learning approach. Journal of Accounting Research, 48(5), 1049–1102. [CrossRef]
- Liu, H., Wang, Y., & Wang, S. (2019). Forecasting stock price direction using a hybrid method integrating PCA, support vector machine and logistic regression. Applied Soft Computing, 80, 105535. [CrossRef]
- Nelson, D. B. (1991). Conditional heteroskedasticity in asset returns: A new approach. Econometrica, 59(2), 347–370.
- Patel, J., Shah, S., Thakkar, P., & Kotecha, K. (2015). Predicting stock and stock price index movement using trend deterministic data preparation and machine learning techniques. Expert Systems with Applications, 42(1), 259–268. [CrossRef]
- Sum, V., & Fanta, A. B. (2019). US–China trade war and stock market volatility. Journal of Risk and Financial Management, 12(3), 117. [CrossRef]
- Tetlock, P. C. (2023). Giving content to investor sentiment: The role of media in the stock market. Journal of Finance, 62(3), 1139–1168. [CrossRef]
- Zhang, Y., & Zhou, D. (2020). The impact of US–China trade war on stock market volatility: Evidence from the GARCH-MIDAS model. Finance Research Letters, 35, 101303. [CrossRef]
- White House. (2024, May 14). Fact Sheet: President Biden Takes Action to Protect American Workers and Businesses from China’s Unfair Trade Practices. The White House. https://bidenwhitehouse.archives.gov/briefing-room/statements-releases/2024/05/14/fact-sheet-president-biden-takes-action-to-protect-american-workers-and-businesses-from-chinas-unfair-trade-practices/.
- Ali, S., & Rafique, M. Z. (2021). A comparative study of ML classifiers for stock volatility forecasting under market stress. Procedia Computer Science, 192, 2759–2768. https://www.mdpi.com/2504-2289/8/4/34.
|
Disclaimer/Publisher’s Note: The statements, opinions and data contained in all publications are solely those of the individual author(s) and contributor(s) and not of MDPI and/or the editor(s). MDPI and/or the editor(s) disclaim responsibility for any injury to people or property resulting from any ideas, methods, instructions or products referred to in the content. |
© 2025 by the authors. Licensee MDPI, Basel, Switzerland. This article is an open access article distributed under the terms and conditions of the Creative Commons Attribution (CC BY) license (http://creativecommons.org/licenses/by/4.0/).