
Submitted:
04 July 2023
Posted:
06 July 2023
You are already at the latest version
Abstract
Financial markets require a great deal of decision making from the investors and market makers. One metric that can help ease the process of decision making is investment risk which can be measured in two parts; systematic risk and idiosyncratic risk. Clear understanding of the volatilities in each risk component can be a powerful signal in recognizing the right assets to maximize the investment returns. In this paper, we focus on the idiosyncratic volatility values and pre-calculate the idiosyncratic volatility values for 31,198 members of NYSE, Amex and Nasdaq markets for the trades occurring between January 1963 and December 2019. Utilizing a subset of dataset, limited to Nasdaq100 index, we consider the application of machine learning techniques in predicting the idiosyncratic volatility values using the raw trade data to explore a data extension option for the future market trade records that have not yet occurred. We offer a deep learning based regression model and compare it with traditional tree-based methods on a small subset of our per-calculated idiosyncratic volatility dataset. Our analytical results show that the performance of the deep learning techniques is much more robust in comparison to that of the traditional tree-based baselines.
Keywords:
Idiosyncratic Volatility Estimation/Prediction
; Machine Learning
; Deep learning Based Regression
; Tree-Based Regression
; Artificial Intelligence
1. Introduction
Financial markets are complex and investors strive to learn various techniques for better decision making and improved investment returns. Markowitz (1952)’s pioneering studies on portfolio risk diversification highlight the relation between gains and returns of risky assets, enabling investors to reduce overall investment risk. This involves systematically selecting baskets of assets instead of individual ones, thereby reducing basket risk. Sharpe (1964) and Lintner (1969) further built upon Markowitz’s work and proposed the Capital Asset Pricing Model (CAPM), establishing the foundation of Modern Portfolio Theory (MPT). Notably, they differ from Markowitz in their definition of risk: Markowitz defines it as total risk measured by the standard deviation of asset returns, while Sharpe and Lintner define it as market-based risk measured by the average sensitivity (beta or systematic risk) to market movements. unsystematic risk (also known as unique risk or idiosyncratic risk), the difference between total risk and systematic risk, can be significantly reduced through portfolio diversification, but complete elimination is not possible. Reducing market-based risk is more challenging and requires risk-management instruments and methods Fu (2009); Gouvea et al. (2015); Mangram (2013).
According to MPT, rational investors should diversify their portfolios, implying that idiosyncratic risk has no pricing relevance. Similarly, the traditional CAPM theory suggests that only market risk should be priced in equilibrium 1. Hence, idiosyncratic volatility is not related to expected returns as it can be diversified at no cost. Pioneers like Fama and MacBeth (1973) have rejected the role of idiosyncratic risk in asset pricing, and numerous publications on asset pricing, including Fama and French (1993); Lintner (1969); Sharpe (1964), do not consider idiosyncratic risk when examining the risk-return trade-off.
MPT has faced criticism due to its unrealistic assumptions and inadequate representation of real-world financial markets, as highlighted by Mangram (2013). These assumptions include the notions that investors receive all relevant information in a timely and complete manner, can borrow without interest, stock performance is independent of other investments, market changes are expected and explicable, and transactions are cost and tax-free. However, in reality, investors do not hold perfectly diversified portfolios, leading to theories such as Merton et al. (1987) and Xu and Malkiel (2004) which consider this under-diversification assumption and predict that a positive relationship should exist between the idiosyncratic risk and the return since the investors expect a compensation in return for bearing the idiosyncratic risk. While CAPM suggests idiosyncratic risk is irrelevant in asset pricing, theoretical works such as Merton et al. (1987) indicate that it should be priced. Inspired by this theory, Xu and Malkiel (2004) analyze the role of idiosyncratic risk in asset pricing and find that it affects asset returns even after controlling for factors like size, book-to-market ratio, and liquidity. They provide evidence from individual US stock data and the Japanese stock market, supporting a positive relationship between idiosyncratic risk and asset return, replicating studies by Fama and MacBeth (1973) and Eugene and French (1992).
There is large number of works to examine the relation between idiosyncratic risk and expected stock returns (e.g., Ang et al. (2006 2009); Fu (2009); Guo and Savickas (2006); Nartea et al. (2011); Spiegel and Wang (2005); Xu and Malkiel (2004)). However, they do not agree on the positivity of the relationship. Fu (2009); Nartea et al. (2011); Spiegel and Wang (2005); Xu and Malkiel (2004) find this relationship positive while Ang et al. (2006 2009); Guo and Savickas (2006) believe it is negative; leading to the “Idiosyncratic Risk Puzzle”. Interestingly enough Nartea et al. (2011) and Fu (2009) base their work on Ang et al. (2006) and Ang et al. (2009) and find contrary results. One major difference between the setup in Nartea et al. (2011) in comparison to the prior works is that their analysis is based on firm-level. Fu (2009) states that the results Ang et al. (2006) reported are based on small firms which have a high idiosyncratic volatility and a high return in a month, however, the return is reversed in the following month.
Furthermore, the literature contains studies focusing on the other factors affecting return such as Spiegel and Wang (2005) studying the effect of idiosyncratic volatility on liquidity and vice versa, Eiling (2013) studying the relation of the idiosyncratic risk on the hedging demand of investors’ non-tradable human capital, De Bondt and Thaler (1985) and Jegadeesh and Titman (1993) studying the effect of momentum on the return, and Shi et al. (2016) studying the effects of news on the relation between idiosyncratic risk and returns. However, since the focus of this work is solely on the value of idiosyncratic volatility, we do not get into more details about these studies and leave them to the readers.
Clearly, all the research studies focusing on the relation of idiosyncratic volatility and the other important variables to achieve the investment strategy with better returns, require to initially calculate the values of idiosyncratic volatility as an early step to move forward with further analysis. This work studies the possibility of predicting the idiosyncratic volatility values without the need for heavy calculations.
1.1. Motivation
The advent of the big data era has brought about a revolutionary shift in financial analysis across various academic domains. Among the vast array of data categories, the quantity of stock returns collected through stock market transactions holds great significance. Predicting the magnitude of these returns is crucial for both investors, who seek to safeguard their investments, and market analysts, who provide valuable consulting services. As highlighted by Guo and Savickas (2006), idiosyncratic volatility serves as a widely employed indicator that effectively elucidates the intricacies of stock return fluctuations.
Idiosyncratic volatility, a latent factor within market data, plays a pivotal role in predicting return values. This volatility is not readily discernible from the collected data alone, necessitating laborious manual extraction procedures. Moreover, most studies within this research domain concentrate on employing financial techniques to uncover the underlying relationship between idiosyncratic volatility and investment returns. In contrast, we construct a large dataset containing pre-calculated idiosyncratic volatility values, and study the possibility of employing machine learning techniques to estimate these values for raw records.
1.2. Contribution
Many finance-based research projects (some of which mentioned earlier) rely on the calculation and the analysis of idiosyncratic volatility values. However, the research community lacks a technique that can quickly estimate such values and allows for a more efficient use of time through focusing on more important ideas rather than the calculation of idiosyncratic volatility values. To this end, this paper (1) based on the traditional approach of Ang et al. (2006); Fu (2009), creates a large set of data containing pre-calculated idiosyncratic volatility values, and distributes this data for each company separately to provide the ease of access to individual company trade records (Section 3.1). To further facilitate experimenting using machine learning based estimation techniques, (2) we also hand select a limited number of market trade record sets for the companies listed in Nasdaq 100 index and create a machine learning usable dataset (we call this dataset N100IVOL; Section 3.1.1).
In addition, (3) we examine different machine learning techniques aiming for an AI-based model that can predict the idiosyncratic volatility values directly receiving the trade record as an input, and analyze the examination results. In our experiments, we study both traditional tree-based modelling techniques as well as more modern deep learning based methods (Section 4). In addition, the experiments on N100IVOL will be performed on two separate settings one considering all the trade records up to the year 2019, assuming the trade records of the year 2019 as our testing year; the other performing the same experiments extending the history to the year 2021 and considering the year 2022 as the testing year. We aim this pair of studies can guide future studies on the essence of multi-layered testing to provide deeper understanding and insights on the provided frameworks.
2. Literature Review
In this section, we cover essential literature used in our work, including research on idiosyncratic volatility, its relationship with expected return parameters, and necessary computer science background knowledge.
2.1. Idiosyncratic Volatility
For years, exploring the intricate relationship between asset returns and risk factors has captivated researchers, prompting numerous endeavors to model and elucidate this connection. In this context, we delve into the most pertinent work that specifically center around the subject of idiosyncratic volatility, shedding light on its significance and implications. Fama and French (1993) suggest a new method concentrated on using time series regression models for analyzing the relation of the risk factors and the return, relying on the fact that the work of Fama and MacBeth (1973) did not support adding more variables to the model (e.g. required for bonds). Fama and French (1993) extend the work of Eugene and French (1992) and add other variables to it to help better explaining the returns. Also, their approach to test asset pricing is different. Previous works were based on the cross-section of stock returns which were regressed on variables hypothesized to explain the average returns.
Fama and French (1993) uses time series regression approach. The slope of time series regression is a risk factor for stocks. The authors introduce three stock market factors on the return (namely overall market factor (MKT), firm size (SMB), and book-to-market equity (HML)); two of which (in addition to the intercept of these three factors) are strongly correlated with return in stocks. These are proxy for sensitivity to common risk factors in returns.
These three factors (FF-3) do a good job in explaining stock returns and the cross-section of average returns. Based on this model the difference of the expected return on a portfolio and the risk-free return can be explained based on the effect of each of the following three factors on the return. Equation (1) describes the FF-3 model in which , , , and are tunable parameters that are adjusted so that the regression model fits the trade record data.
2.1.1. The relation between Idiosyncratic Volatility and Expected Return
Our current understanding reveals a lack of consensus regarding the nature of the relationship between idiosyncratic volatility/risk and expected return. The scholarly literature presents diverse viewpoints, with some studies reporting a positive association, others indicating a negative correlation, and a few suggesting a neutral connection. Additionally, there are publications that propose a non-linear relationship between these two variables. In this discussion, we will delve into some of the significant scholarly works that have explored and analyzed the intricate interplay between these factors.
Ang et al. (2006) study the effects of systematic volatility risk (in aggregate volatility) and idiosyncratic volatility on the cross section of returns. They report that stocks with past high aggregate volatility can lead to lower average returns in future. Also, they conclude that FF-3 model cannot explain the negative correlation between the return and aggregate market volatility. In the second experiment, the authors use idiosyncratic volatility relative to Fama and French (1993) model, sort the portfolios based on the total volatility2, and consider all the stocks on AMEX, NASDAQ and NYSE from July 1963 to December 2000. They conclude that average return and idiosyncratic volatility are negatively correlated and this negative relation holds in different time periods and different formation strategies.
Previous findings in Ang et al. (2006) were based only on a particular small sample of U.S. data, therefore, Ang et al. (2009) aim to test3 whether the anomalous relation between lagged idiosyncratic volatility and future average returns in international markets follow the same pattern observed in U.S. data. They find that the negative relation between lagged idiosyncratic volatility and future average returns also exist in the larger sample of 23 international developed markets, for each of the largest seven (G7) equity markets (Canada, France, Germany, Italy, Japan, the United States, and the United Kingdom).
Fu (2009) bases his work on the fact that the return and one month lagged idiosyncratic volatility are negatively correlated (the conclusion of (Ang et al. 2006)). The author calculates the idiosyncratic volatility for each individual stock based on the FF-3 model (Fama and French 1993) and concludes that the idea to analyze return based on the lagged idiosyncratic volatility does not hold the most accurate results, and one must study the expected return and the expected idiosyncratic volatility in the same time period.
Fu (2009) uses an EGARCH4 model to estimate the expected idiosyncratic volatility values and finds that returns are positively related to the EGARCH-estimated conditional idiosyncratic volatilities. Also, he controls for the variables that can affect return, e.g. size. The author mentions that the results in Ang et al. (2006) are based on small firms that have a high idiosyncratic volatility and a high return in a month; however, the return is reversed in the following month.
Nartea et al. (2011) base their work on the fact that Ang et al. (2006) and Ang et al. (2009) find a negative relation between one month lagged idiosyncratic risk and return in many developed markets. In their study, they attend to emerging Asian markets of Malaysia, Singapore, Thailand, Indonesia, and the Philippines.
They follow Ang et al. (2006)’s portfolio-sorting approach and relate one month lagged idiosyncratic volatility with portfolio returns5. They find a positive relationship between idiosyncratic volatility and returns in Malaysia, Singapore, Thailand, and Indonesia with exceptional of Philippines. They highlight the fact that Ang et al. (2006) generalizes the developed stock markets results (which have negative relation) and did not consider new and emerging markets.
There are other lines of work that try to look at different effecting factors on explaining the relation of return and idiosyncratic volatility. Spiegel and Wang (2005) consider the effect of liquidity on the mentioned relation and try to test if liquidity is a better replacement for explaining the fluctuations of return. They find that the correlation between return and idiosyncratic risk is much stronger than that of the liquidity and return. This work describes the relation between return and idiosyncratic volatility to be positive. Eiling (2013) considers the effects of industry-level human capital on the relation of the variables under study. Shi et al. (2016) analyze the impact of news and its sentiment on the relationship between idiosyncratic volatility and expected return. They propose that the perceived negative relationship between idiosyncratic volatility and expected return could be the result of the public news. However, their study corroborates the positive relationship that Fu (2009) reports when ignoring the news related information. Guo and Savickas (2006) considers value-weighted idiosyncratic volatility instead of equal-weighted idiosyncratic volatility and finds the relation of value-weighted idiosyncratic volatility and stock market return to be negative.
From the other perspective, as we mentioned earlier, we would like to focus on using machine learning to predict idiosyncratic volatility values using the raw data. Trivially, this work is not the first in this research thread. Ghoddusi et al. (2019) conduct a survey on the thirteen years of research (leading to 2018) and report the most popular machine learning techniques used in energy economics and finance, including artificial neural networks (Section 2.2.4). Zhong and Enke (2019) report an important application of the neural networks in predicting the market sentiment (daily direction of stock market index returns). Readers can also refer to the work of Rasekhschaffe and Jones (2019) to get a better grasp on the connection between machine learning and the field of finance.
More recently, Gu et al. (2020) have combined machine learning techniques with CAPM model to study the effects of different factors on the asset pricing model. Leippold et al. (2022) extend this work for the Chinese stock market.
In the literature, we find the work of Rossi (2018) closest to our work, in which they perform a semi-parametric method, called Boosted Regression Trees (BRT), to predict stock returns and volatility. Since the common approaches are generally using simple linear regression models to predict, and such models are prone to overfit the training dataset, BRT has a good forecasting accuracy as well as an ability to handle high dimensional forecasting problems without overfitting. They suggest two volatility forecasting models; in the first of which, they use monthly time-series data to model volatility, and in the second of which they use Mixed Data Sampling (MIDAS) to model monthly volatility data.
They use 12 predictor variables to forecast return and volatility by BRT. They apply refinements to the BRT like shrinkage and sub-sampling. Although most of the volatility forecast studies are based on EGARCH models, Rossi (2018) use MIDAS which is based on BRT. They target the optimal portfolio based on the return and the volatility forecasting, they directly model the optimal portfolio allocation as a target variable. Their results suggest that the relation between predictor variables and the optimal portfolio allocation to risky assets is highly non-linear.
To compare the work of Rossi (2018) to our work, we would like to mention that (1) the focus of our work is strictly to predict the values of idiosyncratic volatility, (2) we explore different (specialized) predictor variables for each individual company (Section 2.2.2) as opposed to using 12 fixed predictor variables (as we have tested a fixed set of variables and it did not hold optimal results), and (3) we explore different tree-based and non-tree-based models to predict idiosyncratic volatility values as opposed to relying solely on BRT models.
To sum up, considering all the mentioned works in the literature, it is pretty clear that finding the relationship between idiosyncratic volatility and return is a common concern in the finance community and one of the first steps to study this relationship would be to calculate the values of idiosyncratic volatility itself. We contribute to this thread through studying the usefulness of machine learning modelling techniques in estimating the idiosyncratic volatility values without the need to perform heavy calculation.
2.2. Machine Learning related Literature Review
In this section, we focus on using machine learning techniques to predict the values of idiosyncratic volatility. We will first define the general paradigm of the problem as a supervised learning regression task in Section 2.2.1 and then we focus on the required techniques to select the most important parts of the asset trading data (Section 2.2.2) as well as different approaches to perform the regression task (Section 2.2.3).
2.2.1. Supervised Learning and Regression
Inherently, three different types of tasks can be defined in machine learning; namely supervised learning, unsupervised learning, and reinforcement learning. In supervised learning, the dataset records are already labelled and our job is to create a model that can predict labels for unseen (future) records based on what it has learned from the available labelled data. On the contrary, unsupervised learning does not assume access to any available target labels for the data and focuses on making sense of the data without using any prior supervision that provides the correct label predictions. Lastly, reinforcement learning assumes accessing to a supervisor that can only provide one simple signal indicating whether the model was right or wrong. However, it does not define how wrong or right the model was or how the model can improve its performance. Due to this reason the reinforcement learning models (also called agents) heavily rely on trial-and-error.
The input records to our models will be the asset trade records (including the price, bid, ask, return, etc.) and the target labels in our task will be the values of idiosyncratic volatility. We assume that we have access to the idiosyncratic volatility values (in Section 3.1.1 will explain how we create a dataset that contains our desired target labels); therefore, our task falls under supervised learning.
There are two major sub-tasks in supervised learning; namely regression and classification. The former focuses on predicting one value (mostly a real number) based on the input, while the latter focuses on relating the input to one of the finitely many available options. Referring to our task definition in previous paragraph, we categorize our task under regression category as we intend to predict the idiosyncratic volatility values which are single real numbers.
2.2.2. Feature Selection
In most cases, when performing regression, the dataset contains many pieces of information and it is not clear whether all such pieces are necessary for getting the best regression results. Feature selection is a technique in machine learning which intends to help pruning out less useful pieces of dataset records so that we can approach the best possible regression model fitting our dataset. We recommend the work of Pilnenskiy and Smetannikov (2020) as a very helpful resource in gaining a broad overview on how feature selection can be helpful in machine learning applications.
There are a handful of off-the-shelf feature selection methods available on the web. In this paper, we focus on the methods that are implemented in python and specifically under sklearn python package (Hao and Ho 2019). We briefly explain the major categories of feature selection techniques that are used in this paper and refer the readers to learn more about them at the sklearn tutorials page6:
- Selection Based on Variance: considers the variance of the different values in each data column (possible feature to be selected) and removes the ones that have a variance less than a certain threshold. VarianceThreshold is one such feature selector in sklearn library.
- Selection Based on Univariate Statistical Tests: considers certain univariate statistical tests as a means of selection and once the tests score the features, selects the highest scoring features using a certain algorithm. Among the feature selectors of this category, SelectPercentile chooses the top p percent of the high scoring features, SelectKBest chooses the k highest scoring ones, SelectFpr selects based on false positive rate test, SelectFdr selects based on false discovery rate test, and SelectFwe selects based on family-wise error rate test. Each of these feature selectors will need a scoring function that can assign importance values to each feature. We will discuss some such scoring functions in the next paragraph.
- Selection Based on Preference of A Regressor/Classifier: considers a regressor or a classifier and tests the importance of the features with training two models one with the feature and the other without it. If the model figures that the existence of the feature does not make much of difference in the model accuracy, the feature will be excluded. SelectFromModel is one such feature selector in sklearn library.
- Sequential Feature Selection: considers a recursive approach in which the model iteratively adds one feature to the selected features set. This is done until the selected features set reaches a desired size. SequentialFeatureSelector is one such feature selector in sklearn library.
Each feature selector in the last three mentioned categories will require a scoring function (or an estimator) to weigh the importance of each feature based on that function and follow its algorithm to remove some features and select the others. In our experiments in Section 4.1, we have used f_regression, r_regression, f_classif, mutual_info_regression, and Ridge regression; however, we don’t get into the details of the scoring functions/estim ators and refer our reader to the documentations of sklearn library for more information.
2.2.3. Decision Tree based Regression
Once we are done with feature selection, we should begin training regressors to predict the idiosyncratic volatility values using the selected features. Decision Tree based regressors are the first class of regressors that we examine to predict the desired values. We consider the following three implementations of this class in our experiments (Section 4.2 and Section 4.4). We refer our readers to Loh (2014) for further reading about different regression tree modeling techniques.
- DecisionTreeRegressor is a supervised learning method used for regression. The model learns simple decision rules inferred from the features extracted from the training data to predict the target.
- ExtraTreeRegressor uses randomization ideas to find the best split points in the continuous range of target values (as opposed to using a loss function to determine the points). It draws random splits for the node to be added to the tree and chooses the best performing split to be the next chosen range split point.
- GradientBoostingRegressor creates an additive model and adds the regression tree nodes to the tree one at a time.
2.2.4. Deep Learning (Neural Network) Components
In this section, we introduce the most important neural network components that will be used in our deep learning network designs in Section 3.2.1.
- Linear Layer: a layer which receives an input one dimensional vector and maps it to another one-dimensional vector using an affine transformation ( where W and B will contain learnable neural network parameters).
- Long Short-Term Memory (LSTM; Hochreiter and Schmidhuber 1997; Lindemann et al. 2021): a neural network component designed to extract time-dependant information from the times series data. Internally, it has multiple memory gates and for each input, in addition to the conventional output that the recurrent neural networks emit, it also provides a context output which can be fed back to it to remind it of what information the previous inputs had. This context output is the reason that LSTMs are categorized under the recurrent neural network modules category.
- Loss Function: a mathematical function which is used to calculate the amount of error in a neural network prediction in comparison to the expected actual output. There are many such functions available to be used to train neural networks but we only use the Mean Squared Error function unless otherwise stated.
- Optimizer: an object in charge of updating the neural network parameters based on the calculated loss values by the loss function. Many off-the-shelf optimizers are available, some of which like SGD (Stochastic Gradient Descent; Amari 1993) simply multiply the learning rate to the value of error (gradient) and add this value to each parameter (), while the others consider a separate learning rate for each neural network parameter i. Such methods are called adaptive learning rate optimzers and RMSProp (Graves 2013) and AdaDelta (Zeiler 2012) are from such optimizers.
3. Materials and Methods
In this section, we first discuss our approach to create dataset with the pre-calculated idiosyncratic volatility values (Section 3.1) and then we will discuss our approach to form a smaller subset from this dataset (Section 3.1.1) for the idiosyncratic volatility prediction experiments. In the end of this section, we visualize some of the pre-calculated idiosyncratic volatility values versus the return values and perform visual analysis based on the provided plots (Section 3.1.2).
3.1. CRSP-dIVOL a Dataset with Pre-calculated Idiosyncratic Volatility Values
Based on the essential background knowledge presented in Section 2 and Section 2.2, we proceed to provide a detailed account of our dataset creation procedure. It is worth noting that we have adopted the methodology proposed by Ang et al. (2006) for (pre-)calculating the idiosyncratic volatility values. To this end, we obtained the CRSP (Center for Research in Security Price) daily stock return dataset7. This dataset encompasses stocks traded on the NYSE, Amex, and Nasdaq exchanges during the period spanning from January 1963 to December 2019. The CRSP-daily collection comprises an extensive dataset of 87,196,239 trade records, each containing 62 columns (features). Within the CRSP-daily data, we identified 31,198 unique tickers and 33,036 unique (CUSIP, PERMNO) pairs8.
The CRSP-daily dataset, while valuable, does not provide all the necessary information for calculating the idiosyncratic volatility values as outlined in Ang et al. (2006). Additionally, as mentioned in Section 2.1.1, we require the Fama-French 3-factor (FF-3) values (Fama and French 1993) for the daily trades. We obtain this data from Kenneth R. French’s personal website9. The FF-3 dataset includes four crucial factors that influence stock returns in the market, independent of other market factors in time-series regressions.
In view of the substantial disk storage size of approximately 22GBs occupied by the downloaded CRSP-daily dataset, it becomes impractical for a standard processing workstation to load and process the entire dataset. Therefore, employing the divide-and-conquer algorithm design technique, we partitioned the CRSP-daily dataset into 57 distinct parts, each encompassing the daily trade records for a specific year. Similarly, we performed the same partitioning for the FF-3 dataset, aligning our data processing range to a single year10. To calculate the idiosyncratic volatility (the standard deviation of variable in Equation (1), we retrieve the values of return from the CRSP-daily dataset, while the remaining variables are sourced from the FF-3 dataset. Given that idiosyncratic volatility is a monthly attribute, we group the data records for each stock by trade months within a year. We consider each unique (CUSIP, PERMNO) pair11 as a distinct stock, gathering all its trade records for a particular month-year in a separate group. We iterate through each yearly data partition, inner joining the CRSP-daily and FF-3 datasets for that year (on the date attribute), and store each distinct group of trade records for a unique stock/year-month combination. This process results in a total of 4,179,940 such groups.
Once we have the processed stock/year-month trade data groups, we calculate a single idiosyncratic volatility value for each group. To achieve this, we conduct a separate time series regression for each group, utilizing the Ordinary Least Squares regression model. Notably, we exclude groups with fewer than 16 trading day records at this stage to mitigate the impact of infrequent trading on volatility estimation. Following the approach of Fu (2009) (based on Ang et al. 2006), we determine the ground truth daily idiosyncratic volatility values as the standard deviation of the regression residuals from the trained model. We then convert these values into monthly estimates using Equation (2), where represents the standard deviation calculation function.
Upon executing this process for the entire set of stock/year-month trade data groups12, our resulting dataset comprises 4,067,339 calculated idiosyncratic volatility values, accompanied by the corresponding stock identifiers (CUSIP and PERMNO), as well as the year and month for which the values were computed. The execution of this record creation process takes approximately 35 minutes. We partition the resulting (pre-)calculated idiosyncratic volatility by year and store them in accordance to our approach with the CRSP-daily and FF-3 datasets. We refer to the collection of the three yearly-partitioned datasets (CRSP-daily, FF-3, and the calculated idiosyncratic volatility) as CRSP-dIVOL dataset.
3.1.1. N100IVOL a subset of CRSP-dIVOL
While our collected dataset encompasses 31,198 unique tickers, conducting a comprehensive study of the effectiveness of various machine learning techniques on all of these tickers would be an onerous task. Moreover, the vast array of available modeling techniques in machine learning, coupled with the limited availability of prior studies, renders such an endeavor nearly impossible.
Therefore, we focus our idiosyncratic volatility prediction studies solely on the stocks included in the Nasdaq100 index. To obtain the ticker list for this index, we source the information from Wikipedia13. We then collect the corresponding CUSIP, PERMNO, and PERMCO values for each ticker from the CRSP dataset in WRDS, enabling us to filter our data based on these identifiers. Subsequently, we merge the CRSP, FF-3, and idiosyncratic volatility yearly splits and filter out the records from each merged dataset using the ticker list obtained from Wikipedia. As a final step, we partition the resulting merged data based on the tickers, irrespective of the differences in CUSIP, PERMNO, or PERMCO, and store the processed data (including all columns from CRSP, FF-3, and the calculated monthly idiosyncratic volatility) separately for each ticker. This limited dataset, created exclusively for the Nasdaq100 index, is referred to as the N100IVOL dataset.
It is important to note that, during this process, we encountered a particular issue with the CMCSA (Comcast Corporation) ticker. This ticker lacks values for BID, ASK, the number of trades, and other relevant attributes. Additionally, it exhibits negative price values. Consequently, we exclude all records that exhibit such conditions for this ticker before utilizing the data for any subsequent tasks, including feature selection and regression. Table 1 presents statistical information on the calculated idiosyncratic volatility values using the procedures outlined in this section.
3.1.2. Idiosyncratic Volatility Data Visualization
Now that we have calculated the idiosyncratic volatility values, we would love to examine the relation of the calculated values and the reported return values in the CRSP-daily dataset.
Although it is infeasible to visualize and examine each of the 31,198 tickers in this dataset, we would like to suggest a number of such tickers as case studies, and discuss what we find in each case. To this end, we have looked at a number of tickers and plotted them. For each case, we present the visualization for one ticker in here and move the rest to Appendix A. We reference each visualization plot from Appendix in appropriate places in our analysis so the readers can easily access each related plot.
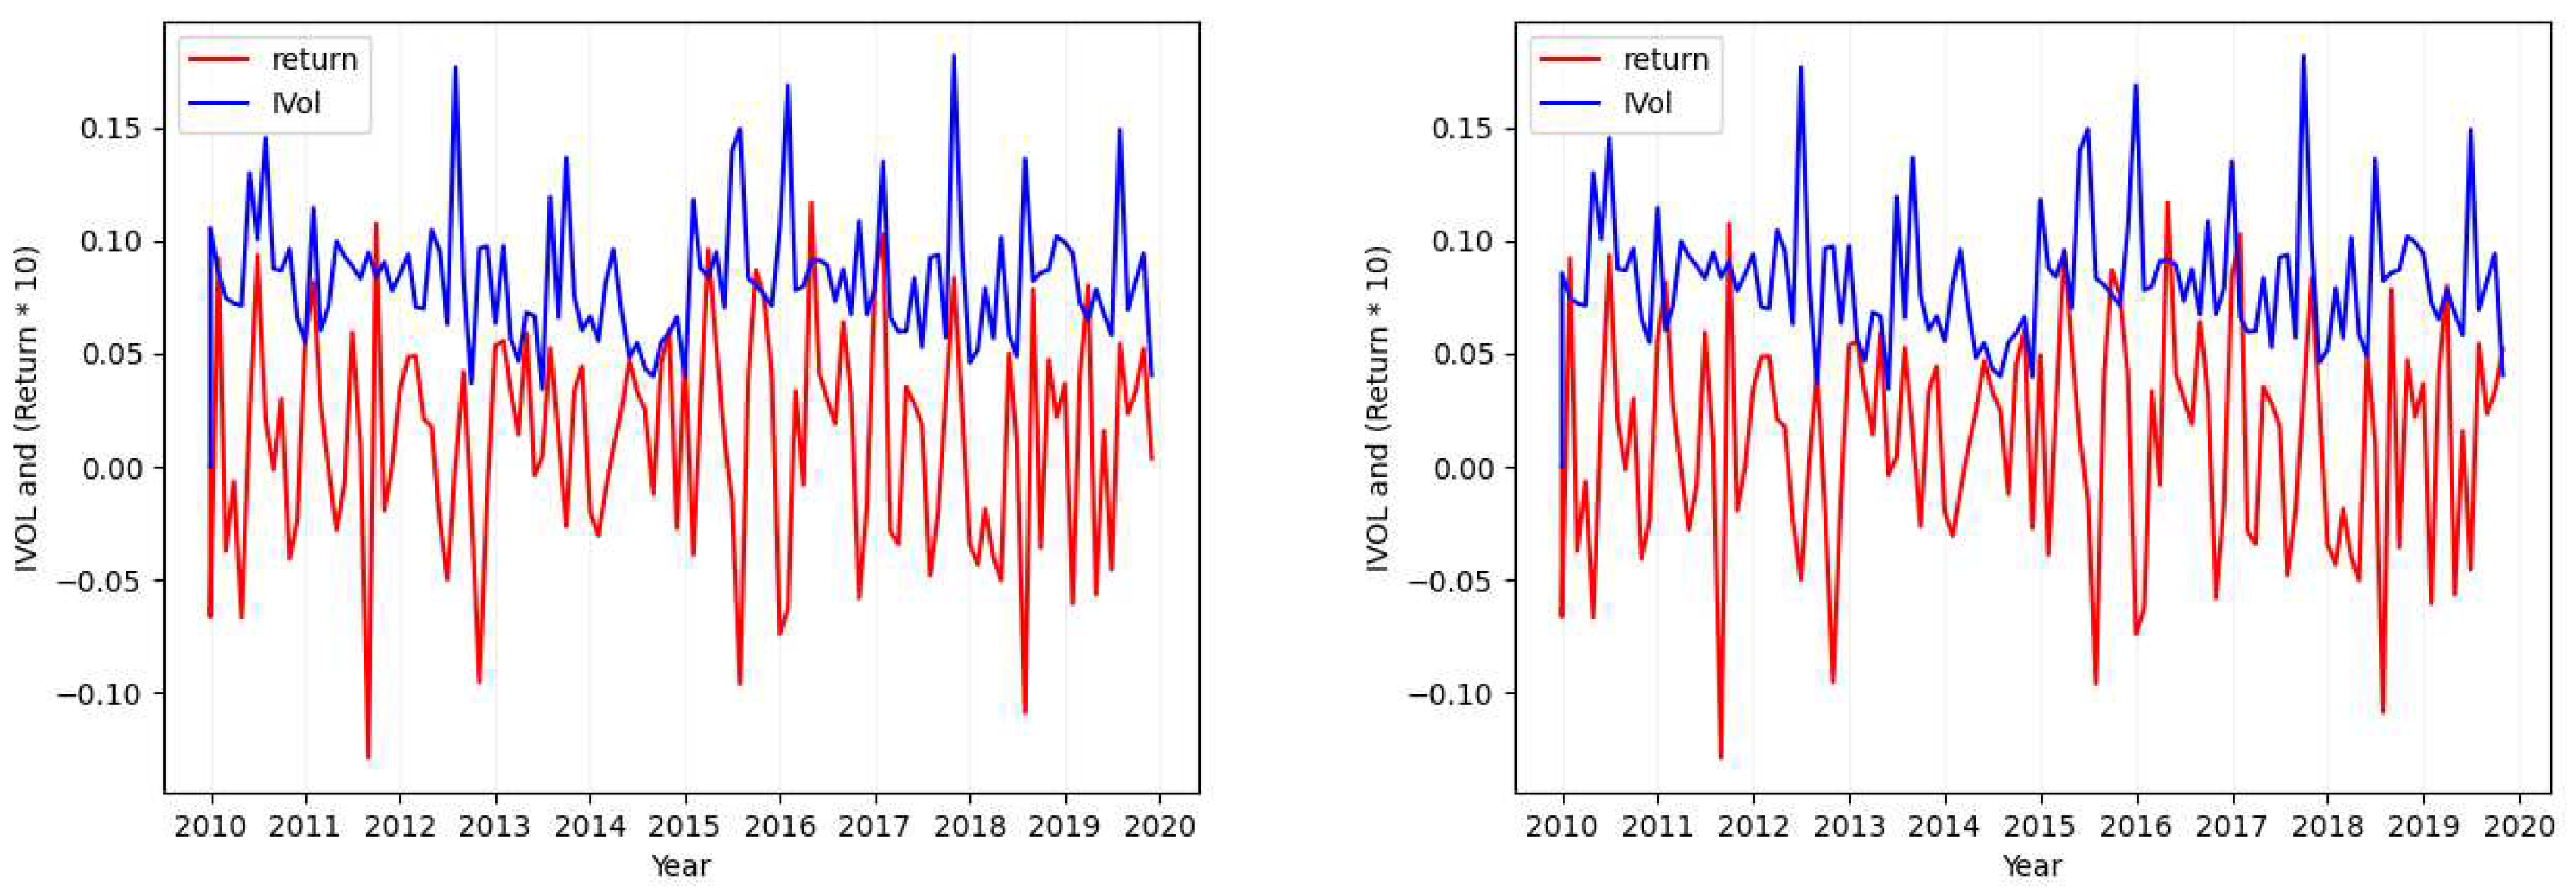
Please note that in each of the figures plotted for each case, the figure will show the values of both return (red; when seen in color) and the calculated idiosyncratic volatility values (blue; when seen in color). Also in each figure, the plot in the left shows both the calculated idiosyncratic volatility values and returns of the same month together while the plot in the right depicts the calculated idiosyncratic volatility values of each month with the returns of its next immediate month.
- Case 1
- Considering the tickers MSFT (Figure 1), SIRI (Figure A1), OKTA (Figure A2), and GOOG (Figure A3), we find that the absolute value of the calculated standard deviation for the idiosyncratic volatility and the absolute value of the calculated standard deviation for the return are similar and close (with a maximum of difference).
- Case 2
- Considering the tickers ALGN (Figure 2), NFLX (Figure A7), REGN (Figure A4), CHTR (Figure A5), and NVDA (Figure A6), we find that the calculated standard deviation for each of these tickers differs largely (one is approximately double the absolute value of the other) when calculating the metric over the idiosyncratic volatility values in comparison to its calculation over returns.
- Case 3
- Case 4
In addition to the mentioned cases, considering the premise of Section 2.1.1 and all the plots provided here, it can be seen that there is no clear positive or negative relation between the idiosyncratic volatility values and the return that can explain this relation for all the stocks. However, it can be found in some individual ones. As in our example plots, it is mostly positive.
Although, our main focus in this paper has been on the idiosyncratic volatility, in a tangent here, we also calculate the systematic risk for CRSP-All as a means to compare in future studies.
Considering the studies of Ang et al. (2006) and Sharpe (1964) as well as other works following them, the formula for calculating the systematic risk is as follows:
where the definitions of , , , , and are similar to the ones in Equation (1). In other words, Equation (3) is really similar to Equation (1) (used for calculating idiosyncratic volatility) except that the two factors and are not considered in here. Among the variables in Equation (3), variable is considered a direct representative of the systematic risk and defines the relation between the excess return on a broad market portfolio and the timely return of the stocks.
As mentioned earlier, we will use the CRSP-All created dataset and follow the same procedure that we defined earlier in finding the idiosyncratic volatility values for calculating the systematic risk () values. Table 2 presents the summary of the calculated systematic risk results over CRSP-All.
3.1.3. Systematic Risk and Volatility
3.2. Idiosyncratic Volatility Prediction
In this section, we will detail our designed idiosyncratic volatility prediction architecture (Section 3.2.1). In the second part of this section, we will provide our proposed evaluation metric and explain how we will use it to compare our proposed architecture with its baselines (Section 3.2.2).
3.2.1. LSTM based Regression
In this section, we detail our designed regressor that uses an LSTM layer to memorize the time series trade records of a month and predict the monthly idiosyncratic volatility for the ticker/month data. Figure 5 visualizes our simple designed model.
Each trade record will first pass through a feature selector to remove the less useful records. The resulting record will contain each feature value as a real number; meaning that the record can be easily converted into a deep learning tensor. However, the ticker train data will first be unit scale zero mean normalized () so that each feature column in the dataset will have an equally likely chance of receiving the model attention. The normalization parameters (, , and are learned on the train data and are applied to the test data to ensure that the test data is truly held out).
As we perform separate feature selection processes for each ticker, we will train a separate regressor for each ticker and the model input size for each ticker might be different than the others. We consider the internal hidden dimension size of all the layers in the regressor to be fixed and equal to 32 as the time series data does not have a size bigger than 31 (the total number of days in a month).
As for the transformation process of the regressor, the model simply passes the input features through a linear perceptron layer (as a replacement for embedding layer in conventional encoders) and then passes the time series of the “embedded” trade vector through a unidirectional LSTM layer (see Section 2.2.4). Using another linear layer, the output of the LSTM layer is mapped to a continuous value which is intended to be the predicted idiosyncratic volatility value.
The LSTM layer context vectors are initialized to zero vectors for the first trade record in each month. For the next days, we will pass along the context vectors from previous days to the next day; helping the LSTM layer extract hidden relations between different input values through the trade records of the month.
3.2.2. Model Performance Evaluation
We evaluate the performance of our model based on the distance of the predicted idiosyncratic volatility values and the actual calculated monthly idiosyncratic volatility values. To be more exact, if we predict idiosyncratic volatility values for p months (predicting N separate idiosyncratic volatility values) for ticker t, the idiosyncratic volatility prediction error, which we will call IVerror throughout the paper, can be calculated as follows:
We will report three such values to evaluate one certain experimental setup (e.g. a combination of a feature selector and a certain regression model); (1) the best value of IVerror and the ticker associated with it, (2) the worst value of IVerror and the ticker associated with it, (3) the average of IVerror values for all the tickers in N100IVOL dataset.
Please note that the proposed metric is an error evaluation metric, so we expect the best model to hold the least reported IVerror (the lower the better). Also, please note that we consider three decimal points to report our results meaning that any error rate less than 0.0009 will be approximated by 0.0.
4. Experiments and Results
In this section, we will focus on our experimental efforts to evaluate our proposed architecture to predict the idiosyncratic volatility values. To this end, we will first attend to our efforts on feature selection and discuss our findings in Section 4.1. In Section 4.2, we will make a simplifying assumption about our data and we will conduct experiments on the N100IVOL dataset using this assumption. In Section 4.3, we will ease the mentioned simplifying assumption and conduct more experiments to study the capabilities of our proposed model (from Section 3.2.1) in predicting the monthly idiosyncratic volatility values.
4.1. Feature Selection
We begin our analysis by one of the most important tasks in supervised learning framework; data preparation. One part of the data preparation, specially for tabular datasets, is feature selection.
Our goal is to find the best set of feature columns for each ticker and we define the task separately for each one since one feature (e.g. ask price) might be a crucial feature to accurately predict idiosyncratic volatility for one ticker but it might not be useful in prediction of the target for another ticker. Although there can be structural differences in different companies that would motivate this phenomenon, we refrain from delving into more details and leave this to our readers for more research.
We utilize the off-the-shelf feature selectors explained in Section 2.2.2 in combination with different scoring functions, explained in the same section and choose the best possible set of features for each ticker. Once we have this feature set, we will freeze the selected feature set for each ticker and perform further analysis.
To choose the best method to select the features, we would need a regressor that would actually try each possible suggested feature set and would return an equivalent IVError value for the feature set for the certain ticker.
We tried all combinations of the Tree-based regressors of Section 2.2.3 (namely Decision TreeRegressor, ExtraTreeRegressor, and GradientBoostingRegressor) with each of the implemented feature selection methods to calculate three possible IVError values for each feature selector14 and chose the best score (the least IVError value) for the feature selector. Please note that we left our suggested LSTM-based regressor out of the list since we wanted to make sure our later analysis results remain independent from the selected feature sets. Also, we wanted to give the Tree-based regressors some head start to make sure our suggested LSTM-based regressor has very strong baselines to beat (we will use the Tree-based regressors of Section 2.2.3 as the baselines for our proposed model, as well).
We randomly split each ticker train data into five parts and chose one part as a held out test set while the other four parts were used to train the tree-based regressors (we did 5-fold cross validation to evaluate each candidate choice). Please note that we do not use the split of trade records for the year 2019 as the held out test set as we do not want our feature selection process to overfit into the features that are the best for predicting the idiosyncratic volatility values for the records of that year; which would undermine our results by looking into the held out set.
To get the best results, we had to run enormous counts of hyper-parameter search for many combinations of feature selectors and scoring functions; however, we refrain from getting into a lot of detail about the different explored settings and their resulting IVError values.
In order to pick the best feature sets, one can consider three approaches. First, taking the best performing feature selector based on IVError values. Second, taking the majority vote for the selected features from the best performing tree-based regressor. Lastly, taking the majority vote for the selected features from all tree-based regressors. To limit the scope of our analysis, we only consider the first option and we leave the other two as future work.
In our evaluation of the tree-based regressors given different feature selection settings, we found Extra Tree Regressor holding the best performance for 69 tickers, Gradient Boosting Regressor holding the best performance for 30 tickers, and Decision Tree Regressor holding the best performing result only once. These results gave us some preliminary insights on how to design the next experiment.
4.2. Evaluating the LSTM based Regressor on daily data
In this section, we explain our next experiment which compares the performance of our LSTM-based regressor with its tree-based competitors. Due to this reason and the fact that the tree-based models do not have an internal memory to keep track of the daily records in a month (unless the tree design is made much more complicated, which we leave for future work), we compare the performance of the two model classes on the daily records; assuming that each daily trade record would have enough information for the model to predict the idiosyncratic volatility value for the month in which the trade is happening. This assumption would clearly be sub-optimal as we know that the idiosyncratic volatility is calculated over the trade records of a month, however, with this assumption, we examine two important points; (1) how important is it to consider all the trade records of a month for predicting the values of idiosyncratic volatility, and (2) even with the assumption that the daily records are enough for predicting idiosyncratic volatility, how superior the LSTM-based regressor is to a tree-based model?
We leave the conclusion for the first point to the next experiment where we also collect the LSTM-based regression results on the monthly data (Section 4.3), and we continue this section focusing on the second point.
We consider all three tree-based models explained in Section 2.2.2 (namely Decisi onTreeRegressor, ExtraTreeRegressor, and GradientBoostingRegressor) as our baseline models and compare their performance with the LSTM-based regressor trained on the daily records to predict the idiosyncratic volatility. Please note that in this experiment the LSTM layer in our LSTM-based regressor is always initialized with a zero vector and its memory capability remains unused, however, we will have a fair setup to compare the baseline models to the designed regressor.
4.2.1. Experimental Setup
We consider 50 years of historical data for each ticker in N100IVOL dataset, containing the trade records starting from 1969 and ending to 2019. Clearly, not all the tickers (representing companies) have existed for the mentioned span of 50 years. For such cases, we will consider the trade records for all the available days and months from the initial offering of the ticker stocks in the stock market.
However, to shed light on the effect of the history on the regression results, we consider four different data selection setups for our model comparison; considering different historical periods of trade as the training data. Our different historical periods will be as follows.
- Setup 1
- We would consider all the available data from 1969 to 2018 as the training data (the default setup).
- Setup 2
- We would consider all the trade records from 2016 to 2018 as the training data (a period of 36 months of history will be considered as all the available history and the older trade records will be discarded).
- Setup 3
- We would consider all the trade records from 2017 to 2018 as the training data (same as above).
- Setup 4
- We would consider all the trade records only from year 2018 as the training data (same as above).
For all the setups, we set aside the trade records that took place in 2019 as the held out test data. With this consideration, we are not able to find any training data for the four companies Zoom (ZM), DataDog (DDOG), Moderna (MRNA) and CrowStrike (CRWD) since they are fairly young companies and have been added to the NASDAQ 100 index after 2018. For that reason, we remove these tickers from setups 2, 3, and 4 and for setup 1 we assume the model to receive the 2019 data as training set while trying to predict the same records. Please note that we only keep these tickers in one out of the four setups to have considered all the NASDAQ 100 tickers in at least one setting although the test records will not be truly held out for these tickers. In addition to the mentioned tickers, we also remove Keurig Dr Pepper (KDP), Zscaler (ZS), Constellation Energy (CEG), Pinduoduo (PDD), Docusign (DOCU), and Broadcom (AVGO) from all the setups except for setup 1 due to historical data incompleteness which makes them hard to compare to the other ticker results. Lastly, we only consider Booking Holdings (BKNG) and Okta (OKTA) in setups 1 and 4 since they have trade records for 2018 and 2019.
We implement our LSTM-based regressor using pytorch15 library and run it along with our three tree-based regressor baselines. For each ticker, we use the best feature sets found in the experiments of Section 4.1, and we unit scale zero mean normalize all the values of features.
For the LSTM-based regressor, we perform a hyper-parameter optimization search over the number of training epochs, the optimizer (considering SGD, RMSProp and AdaDelta) and the optimization learning rate. We find AdaDelta with a learning rate of 0.05 and a decay value of 0.01, and training for 50 epochs to be the best performing settings, and we use these settings for all LSTM-based models trained in this section. We train all our models using one Nvidia 1060 GPU with 6GB memory.
4.2.2. Results and Analysis
Table 3 shows our experimental results, based on which we can confirm that the LSTM-based model, on average, performs much better than the baseline tree-based regressors. As well, we find that the overfitting capability of the tree-based models has not been quite helpful in improving their average performance in comparison to the neural network based model. As we see the best IVError for the decision tree regressor (considering all the history) is 0.0 while its average and worst performing scores are much worse in comparison to our suggested model.
We can also confirm that the performance of the tree-based models is pretty similar in the worst case as their worst IVError scores are quite similar and they have had bad performance on Verisign (VRSN), while we can confirm that the LSTM-based regressor has had a much better performance on this ticker.
Looking at the IVError scores, we find that the best and worst scores reported for tree-based models have a much wider range in comparison to that of our suggested model. This confirms that the LSTM-based model even without consideration of the memory capabilities is more stable for the variety of the records for different tickers. As well, the best average IVError score reported for our proposed model is 31% better than the best average IVError for the baselines.
As for the effect of the access to the different ranges of historical data for training, we find increasing the range has little to no effect on the worst and the best performing tickers while increasing the range can improve the IVError scores by providing more training instances for each ticker.
4.3. Evaluating the LSTM based Regressor on monthly data
Now that we have confirmed the superiority of our proposed model to the tree-based models, we move on to the next important set of experiments to study the full potential of the LSTM-based regressors in predicting the monthly idiosyncratic volatility values based on the trade records of a month.
In these experiments, we follow the same four data setups mentioned in Section 4.2.1. We also keep all the data configurations the same, except that our notion of the input record changes from a one day trade record to a set of trade records for one month for a certain ticker. Like the previous experiments, we will initialize the LSTM layer in our LSTM-based regressor with a zero vector for the first day trade record. However, the next day trade record will keep the context vector of the previous day, will use it and will update it to be used for the trade record of the day after and so on. This process continues until we feed the last trade record of the month to the model in which case the model is expected to predict the idiosyncratic volatility associated with the records it has just seen.
To study the effect of the context in the prediction accuracy, we also perform experiments with the same setting as the above except that in these experiments, we keep the context information from one month to the next. In other words, the context vectors will only be initialized to a zero vector once and will not be reset in the beginning of the next months. Trivially, the context vector will be re-initialized to a zero vector when starting the testing process, but will keep a memory of all the test records in the previous months it has seen.
To study the effect of the trade records in each month to the idiosyncratic volatility value for the next month, we also change the created N100IVOL dataset idiosyncratic volatility values for each record to the calculated value for the next month. We feed this modified dataset instead of the original N100IVOL dataset for the experiments that study the effect of lagged record data in predicting the idiosyncratic volatility values.
Like the previous experiments, we perform hyper-parameter search for these experiments and we find RMSProp with a learning rate of 0.025 as the best optimization settings. We keep the other experimental settings the same as what we explained in Section 4.2.1.
4.3.1. Results and Analysis
Table 4 presents our experimental results. In comparison to the results of the previous experiment, the most important conclusion that can be verified is that the monthly context information do help in improving the prediction accuracy, and the longer we keep the context the better results we will have. On the other hand, the lagged data idiosyncratic volatility prediction follows the same trend and holds the best results, overall.
Although, our experiments report the best results in all the experiments in this section, it is worth mentioning that the best IVError score of 0.124 still means our model is far from perfect and needs more data to hold more accurate predictions.
In the end, our results show that deep learning based methods are far better in predicting the desired volatility values. However, the prediction techniques are quite young and there is a large room for improvement. We hope that our work can be used as a building block to fuel the research thread in which machine learning based techniques can replace traditional methods for calculating idiosyncratic volatility to study the relation of this important variable with the expected return of assets.
4.4. Further Experiments and Results on Year 2022
As our initial experiments in Section 4 have covered the fifty years leading to the year 2019, we extend our N100IVOL dataset with the trade records of the years 2020 to 2022 and perform the same experiments motivated in Section 4 assuming all the trade records up to and including the trade records in the December of 2021 as training records and the trade records of the year 2022 as our testing records.
This extension on the data can help us validate the generalization of our analytical results to the future records (by comparing the model performance on the test data being the trade records collected in 2019 and 2022). As well, it will help us realize the potential factors that we could have missed in our first batch of experiments.
Please note that we keep all the experimental settings exactly as explained in Section 4 for providing the readers with a unified comparison framework the only changing component of which is the data collected in the next years.
Interestingly enough, our experiments in Section 4 can cover the pre-pandemic (COVID-19) trade records and the experiments in this section would re-examine the same settings in the post pandemic times.
For these experiments, we did not find any training data records for the companies: Constellation Energy (CEG) and Atlassian Corp (TEAM) since our collected data did not contain any trade records for the year 2022. We remove these tickers from the trade records of the year 2022 in the held out test set. In addition to the mentioned tickers, for the setups 2 and 3, we also remove Airbnb Inc (ABNB), LUCID Group Inc (LCID) and DataDog (DDOG), since they are fairly young companies and have been added to the NASDAQ 100 index after 2018. Table 5 provides the same statistics provided in Table 1 for the created data extension for the years 2020 to 2022.
Table 6 and Table 7 depict our daily and monthly prediction results, based on which we can confirm that the LSTM-based model, on an average, performs much better than the baseline tree-based regressors and this result holds in both of our experimental settings for the years 2019 and 2022. As well, we find that the overfitting capability of the tree-based models has not been quite helpful in improving their average performance in comparison to the neural network based model and this has also been consistent across both of our experiment batches.
5. Discussion and Conclusions
In this work, we replicated one of the important research papers in the field of finance to pre-calculate the idiosyncratic volatility values for 31,198 members of NYSE, Amex and Nasdaq markets. In this process, we utilized the CRSP-daily data and the pre-calculated Fama and French 3 factor values as well as our calculated idiosyncratic volatility values to carefully create a large dataset of trade records covering the years 1963 to 2019. In a tangent, we also calculated the systematic risk values for the same created dataset to provide the opportunity for future research projects to have a base of comparison.
We targeted the task of idiosyncratic volatility prediction using the raw trade data records. For this task, we experimented through various different approaches including our own proposed deep learning based regression model and showed that our model is much more accurate in regressing the idiosyncratic volatility values based on the monthly trade records, although far from perfect.
In future, we would like to collect more annotated data and improve our model by incorporating more complex non-recurrent neural network components in the regression model. We would also love to explore the other two feature selection techniques we explained in Section 4.1 and consider more than one month for our time lagged analysis experiments. One other avenue that we did not explore enough was the tangent on studying the systematic risk instead of the idiosyncratic volatility. In future, we would like to expand our prediction studies to the systematic risk prediction using both tree-based and deep learning based regressors. As well, we find studies on the relationships of the systematic risk and idiosyncratic volatility with each other and with the return values to be another future direction of this project. Last but not least, we believe the suggested studies can potentially be considered for other markets whose data was not considered in CRSP.
Supplementary Materials
We release our implemented source code and it can be accessed at: https://github.com/NSeifi/MSc-Project.
Author Contributions
Conceptualization, H.S.S. and N.S.; methodology, H.S.S. and N.S.; software, N.S.; validation, N.S.; data curation, H.S.S.; writing—original draft preparation, N.S.; writing—review and editing, H.S.S.; supervision, H.S.S. All authors have read and agreed to the published version of the manuscript.
Funding
This research received no external funding.
Data Availability Statement
Data available on request due to licence restrictions. The data presented in this study are available on request from the corresponding author. The data are not publicly available since a large part of it was downloaded from WRDS through the license provided by Simon Fraser University.
Acknowledgments
We are grateful to Simon Fraser University for providing us with access to WRDS (Wharton Research Data Services), which enabled us to obtain the CRSP dataset. As well, we would like to express our gratitude to Dr. Chengbo Fu (chengbo.fu@unbc.ca) for his insightful comments and feedback on this project.
Conflicts of Interest
The authors declare no conflict of interest.
Appendix A. Extra Idiosyncratic Volatility Data Visualization Graphs
Figure A1.
Ticker: SIRI (Idiosyncratic Volatility Data Visualization - Case 1).
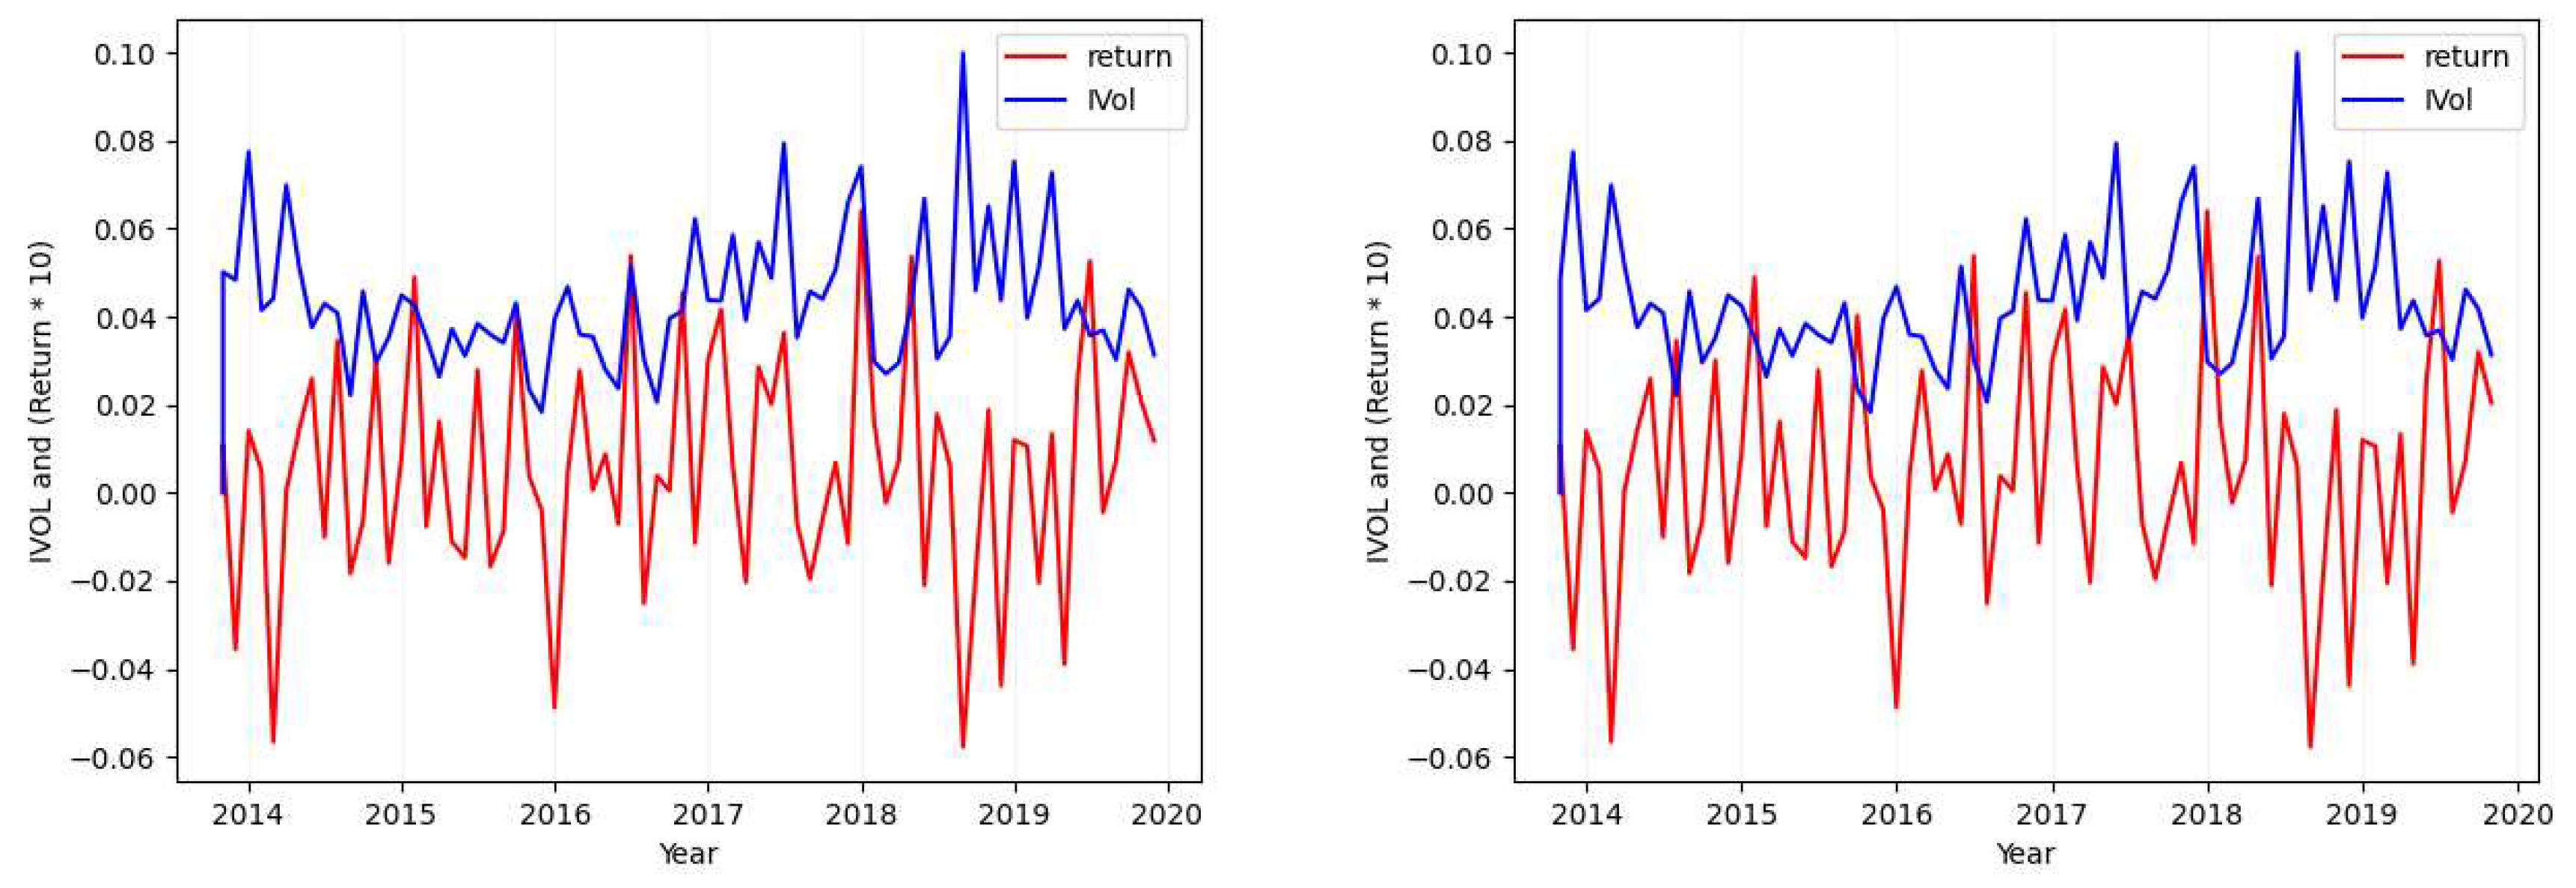
Figure A2.
Ticker: OKTA (Idiosyncratic Volatility Data Visualization - Case 1).
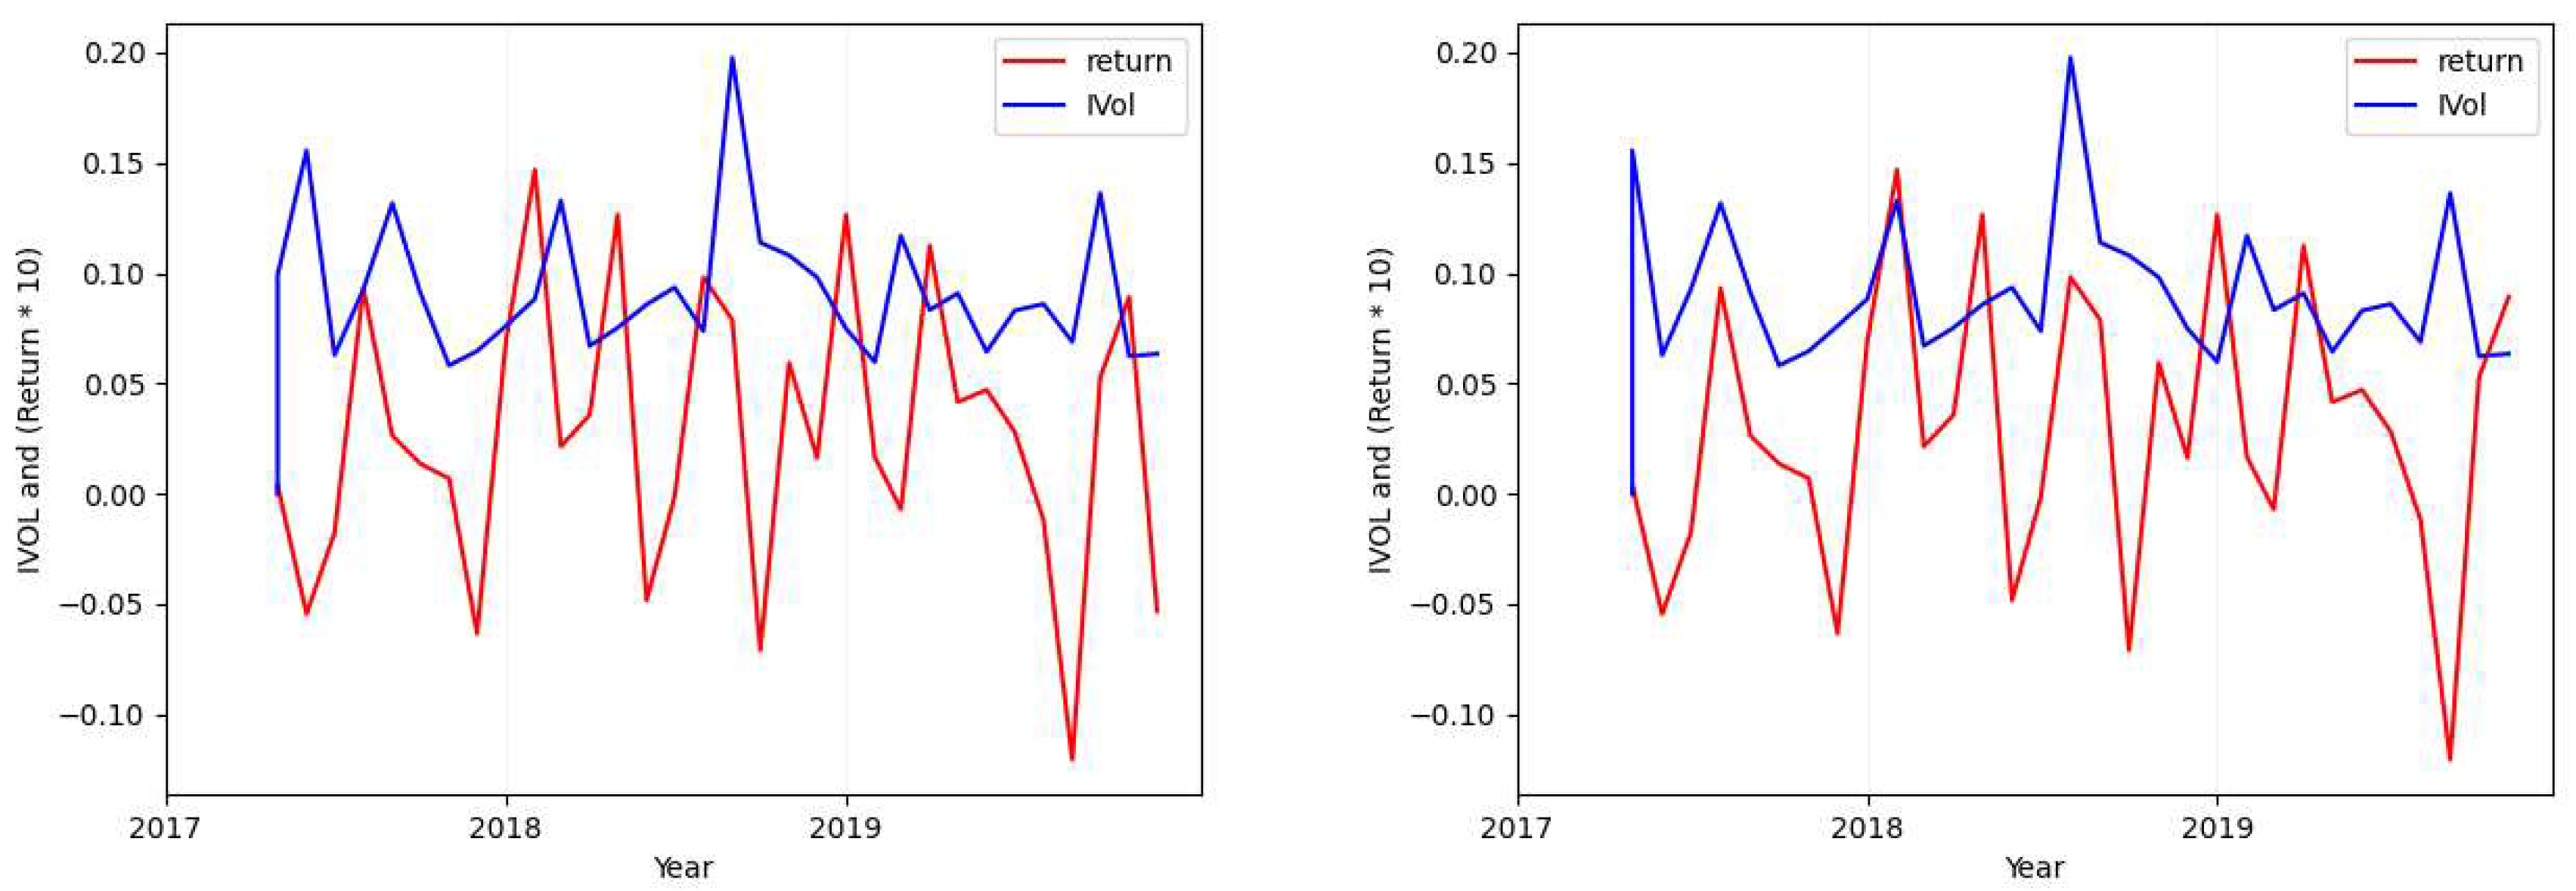
Figure A3.
Ticker: GOOG (Idiosyncratic Volatility Data Visualization - Case 1).
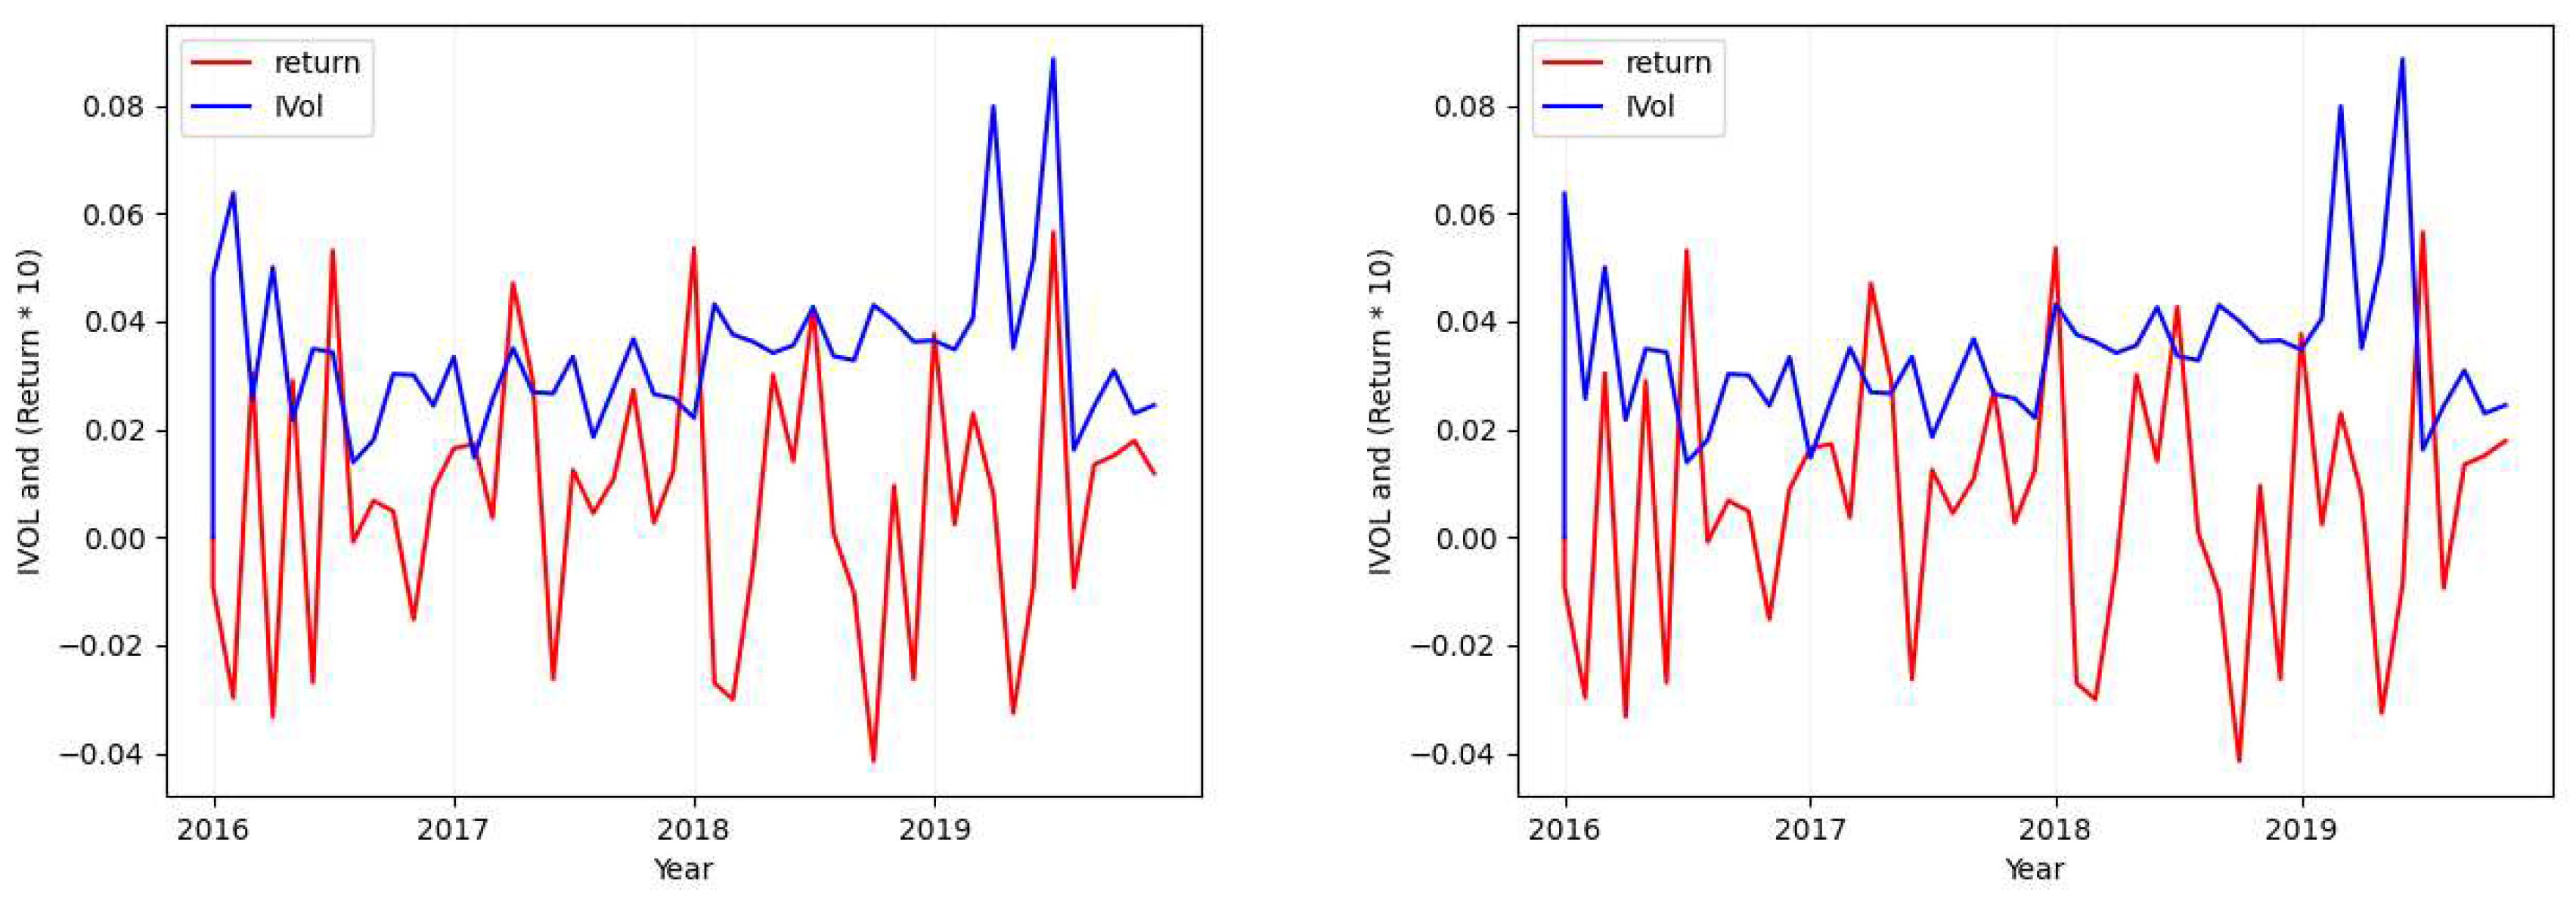
Figure A4.
Ticker: REGN (Idiosyncratic Volatility Data Visualization - Case 2 and 3).
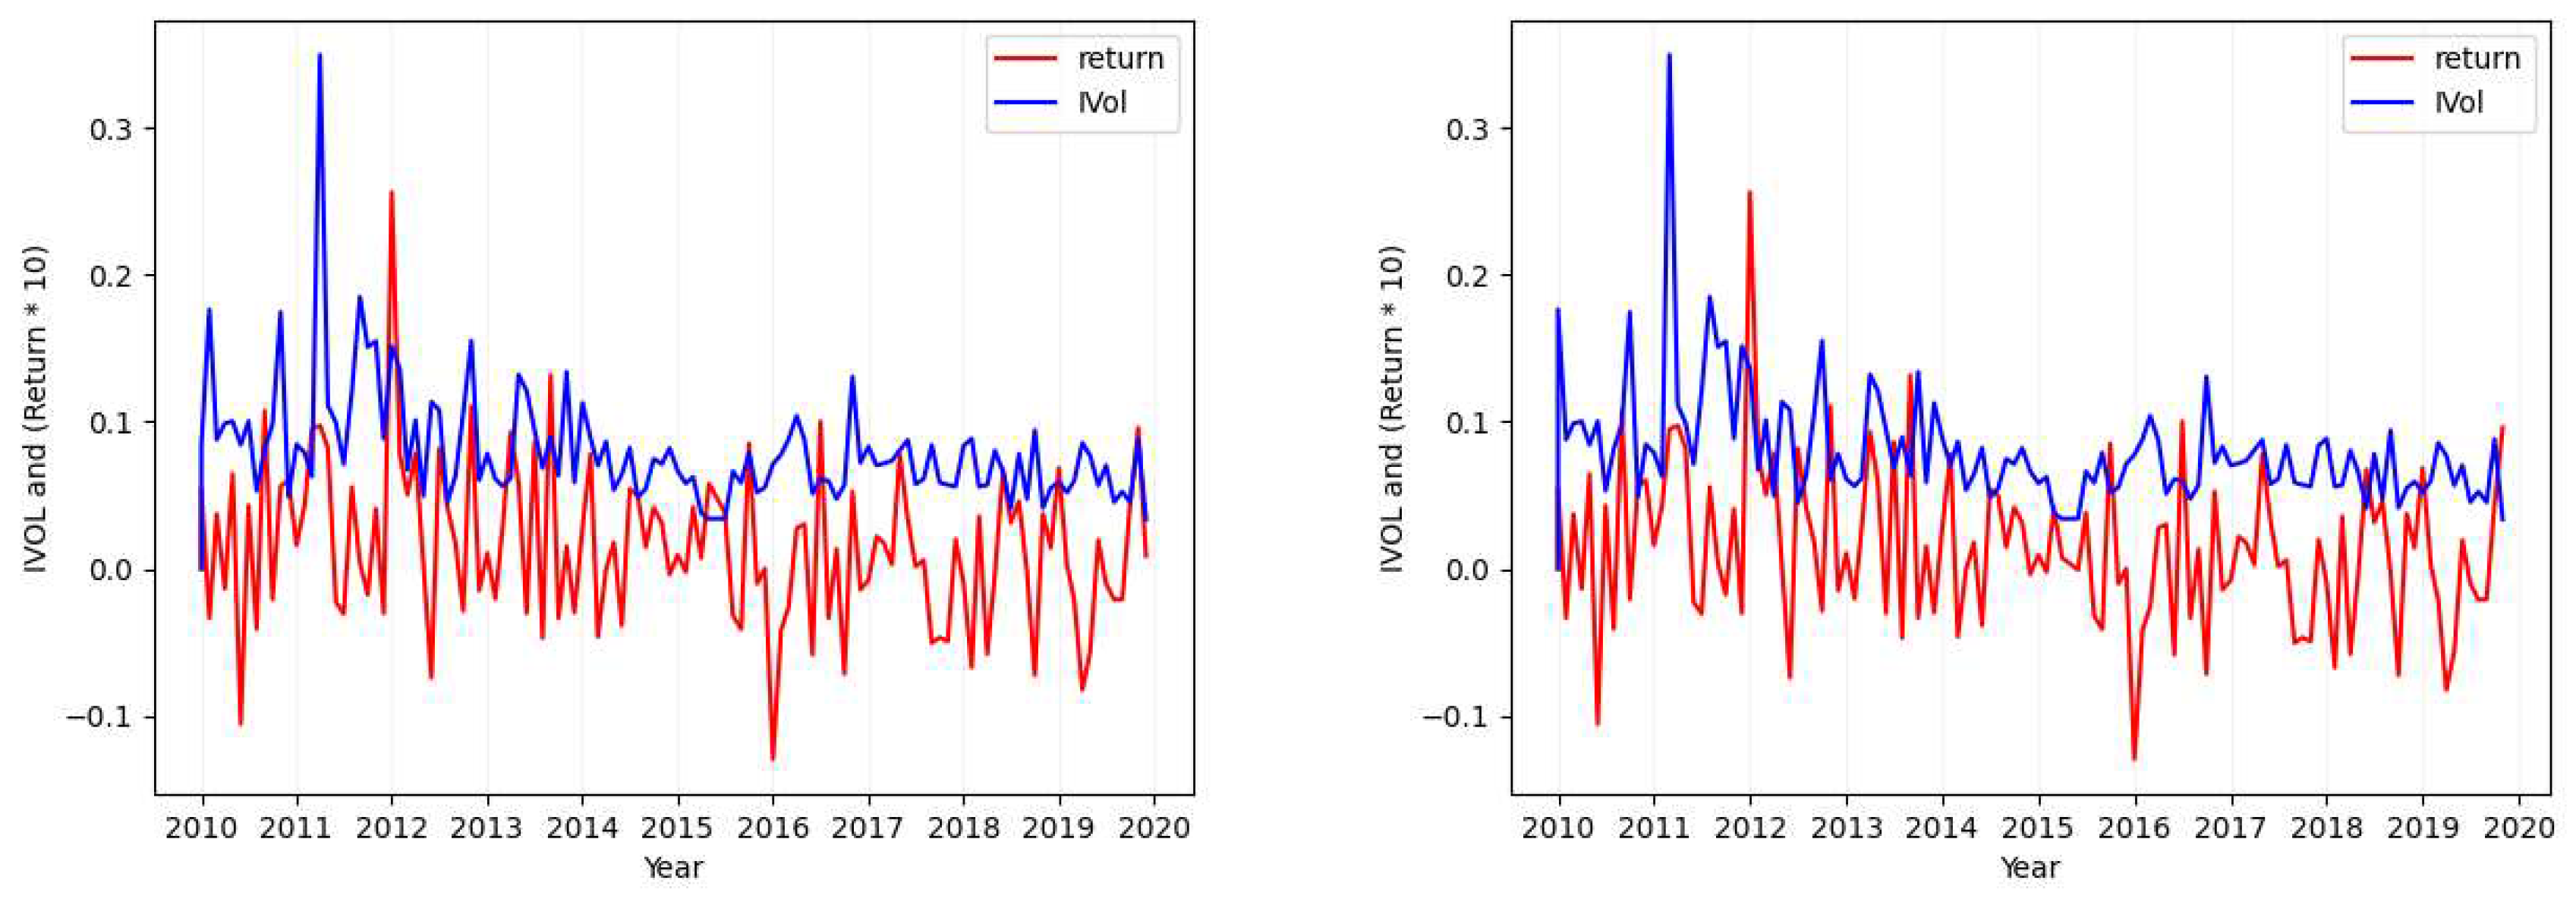
Figure A5.
Ticker: CHTR (Idiosyncratic Volatility Data Visualization - Case 2, 3, and 4).
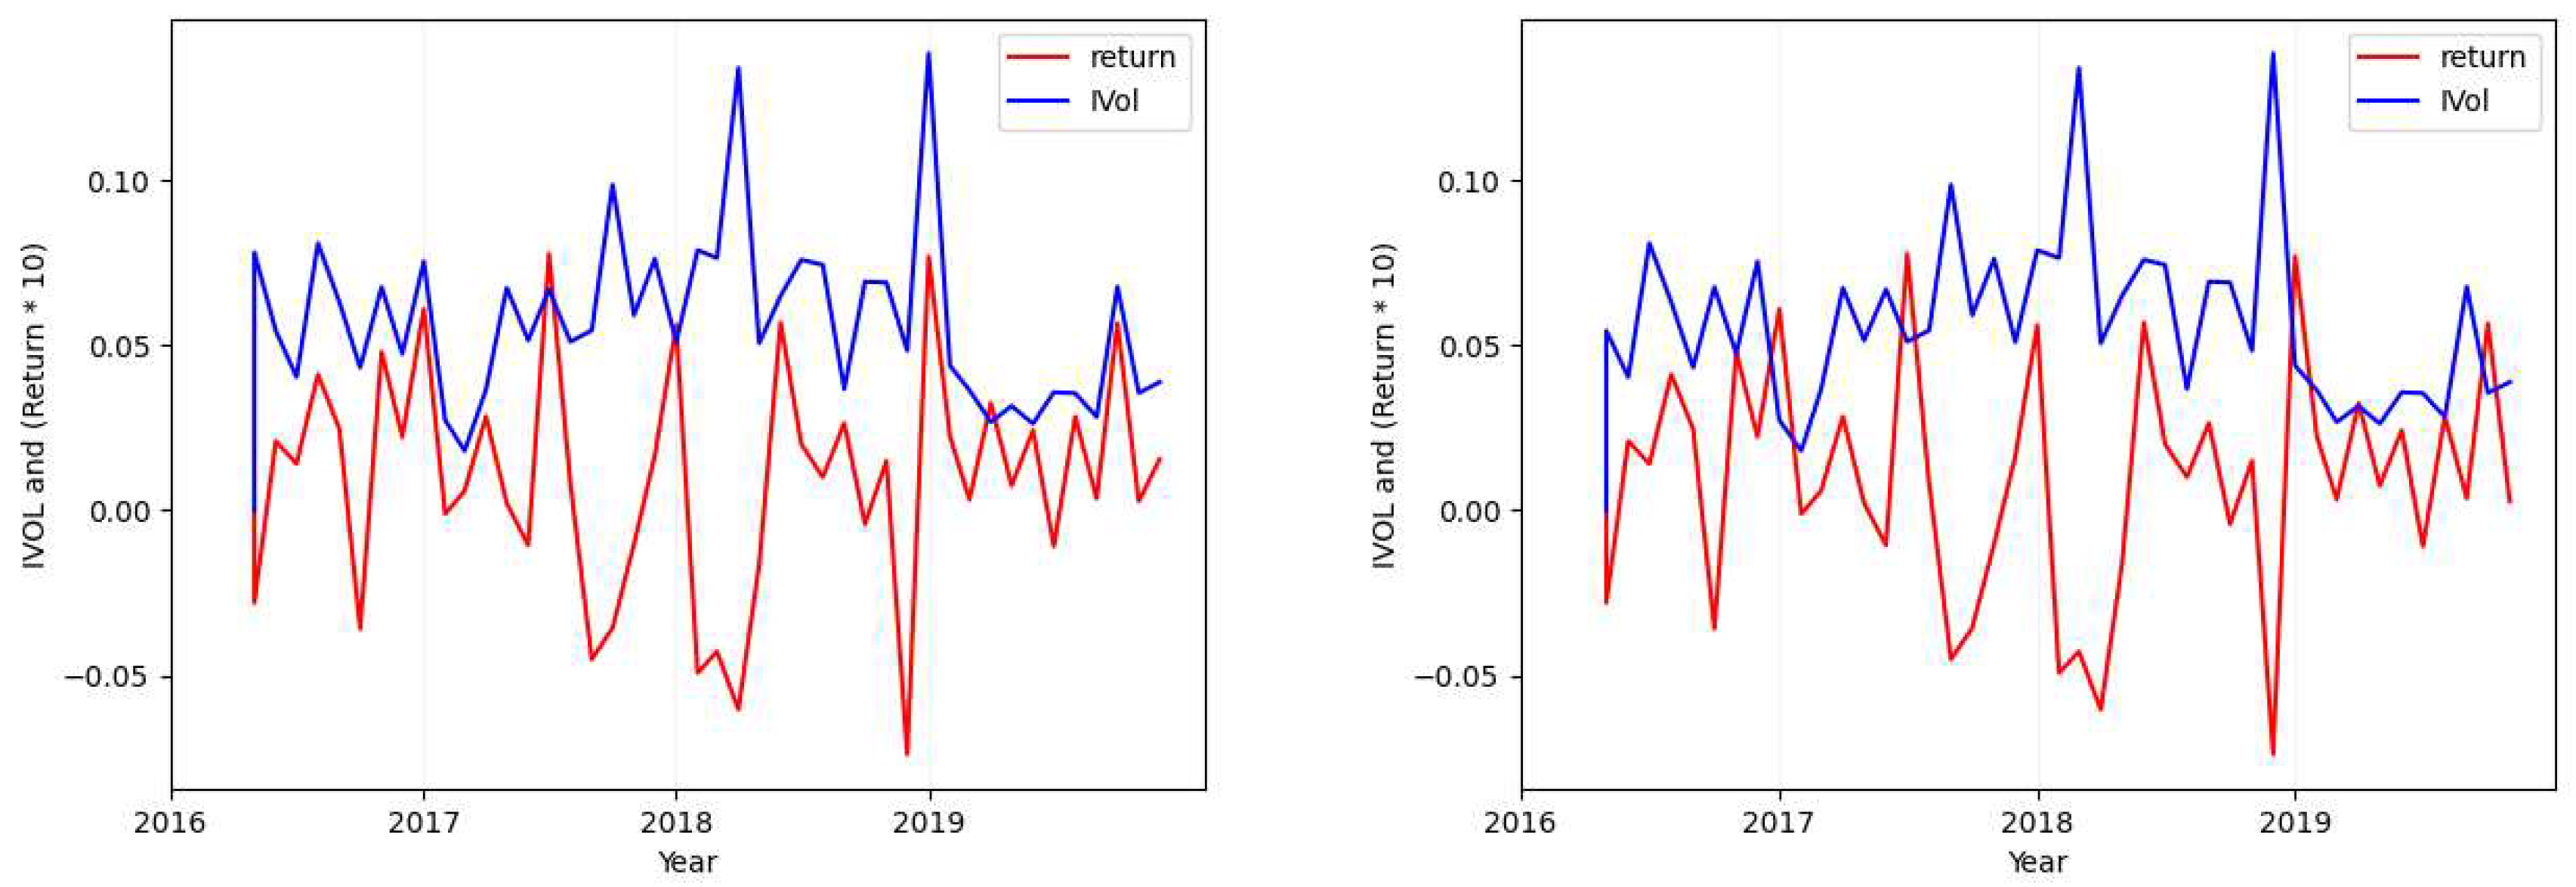
Figure A6.
Ticker: NVDA (Idiosyncratic Volatility Data Visualization - Case 2 and 3).
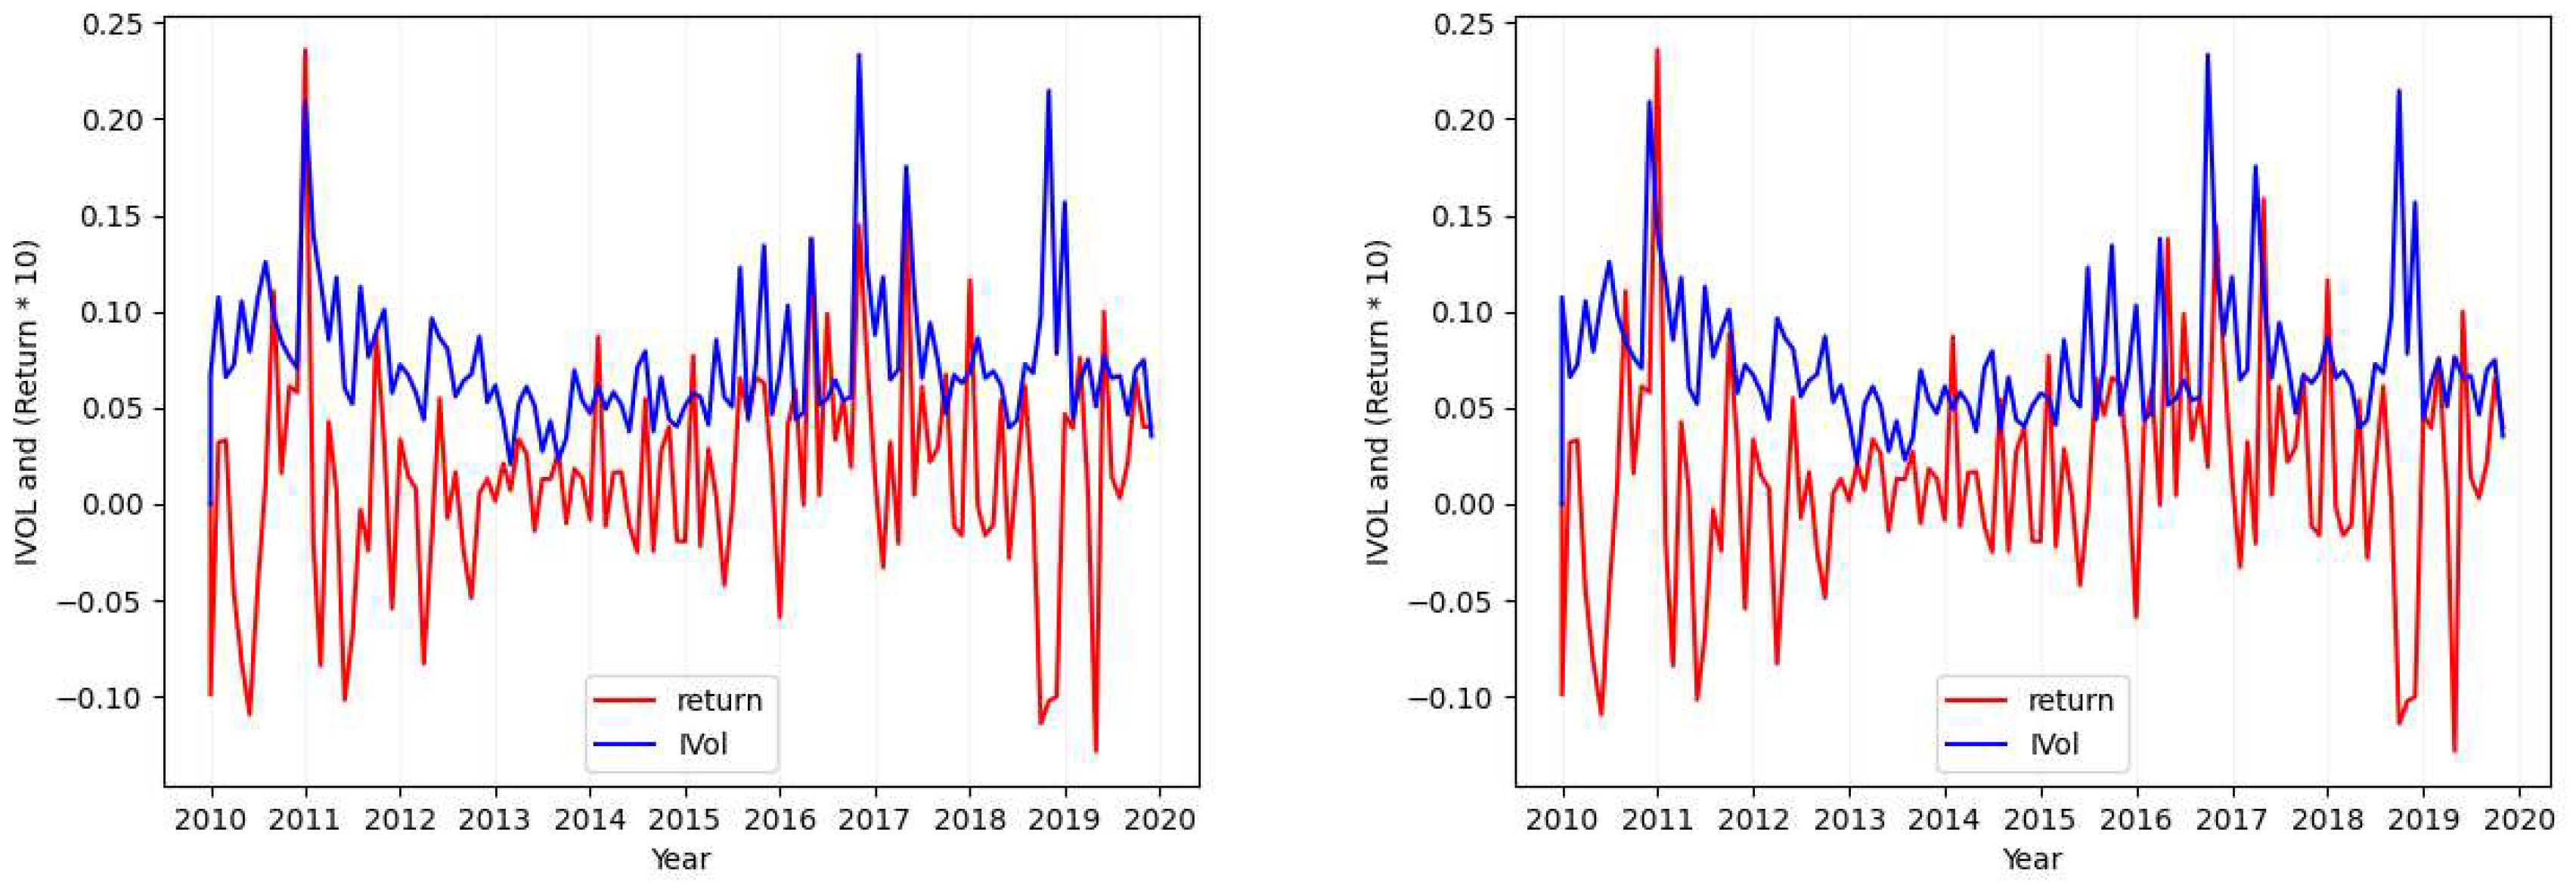
Figure A7.
Ticker: NFLX (Idiosyncratic Volatility Data Visualization - Case 2).
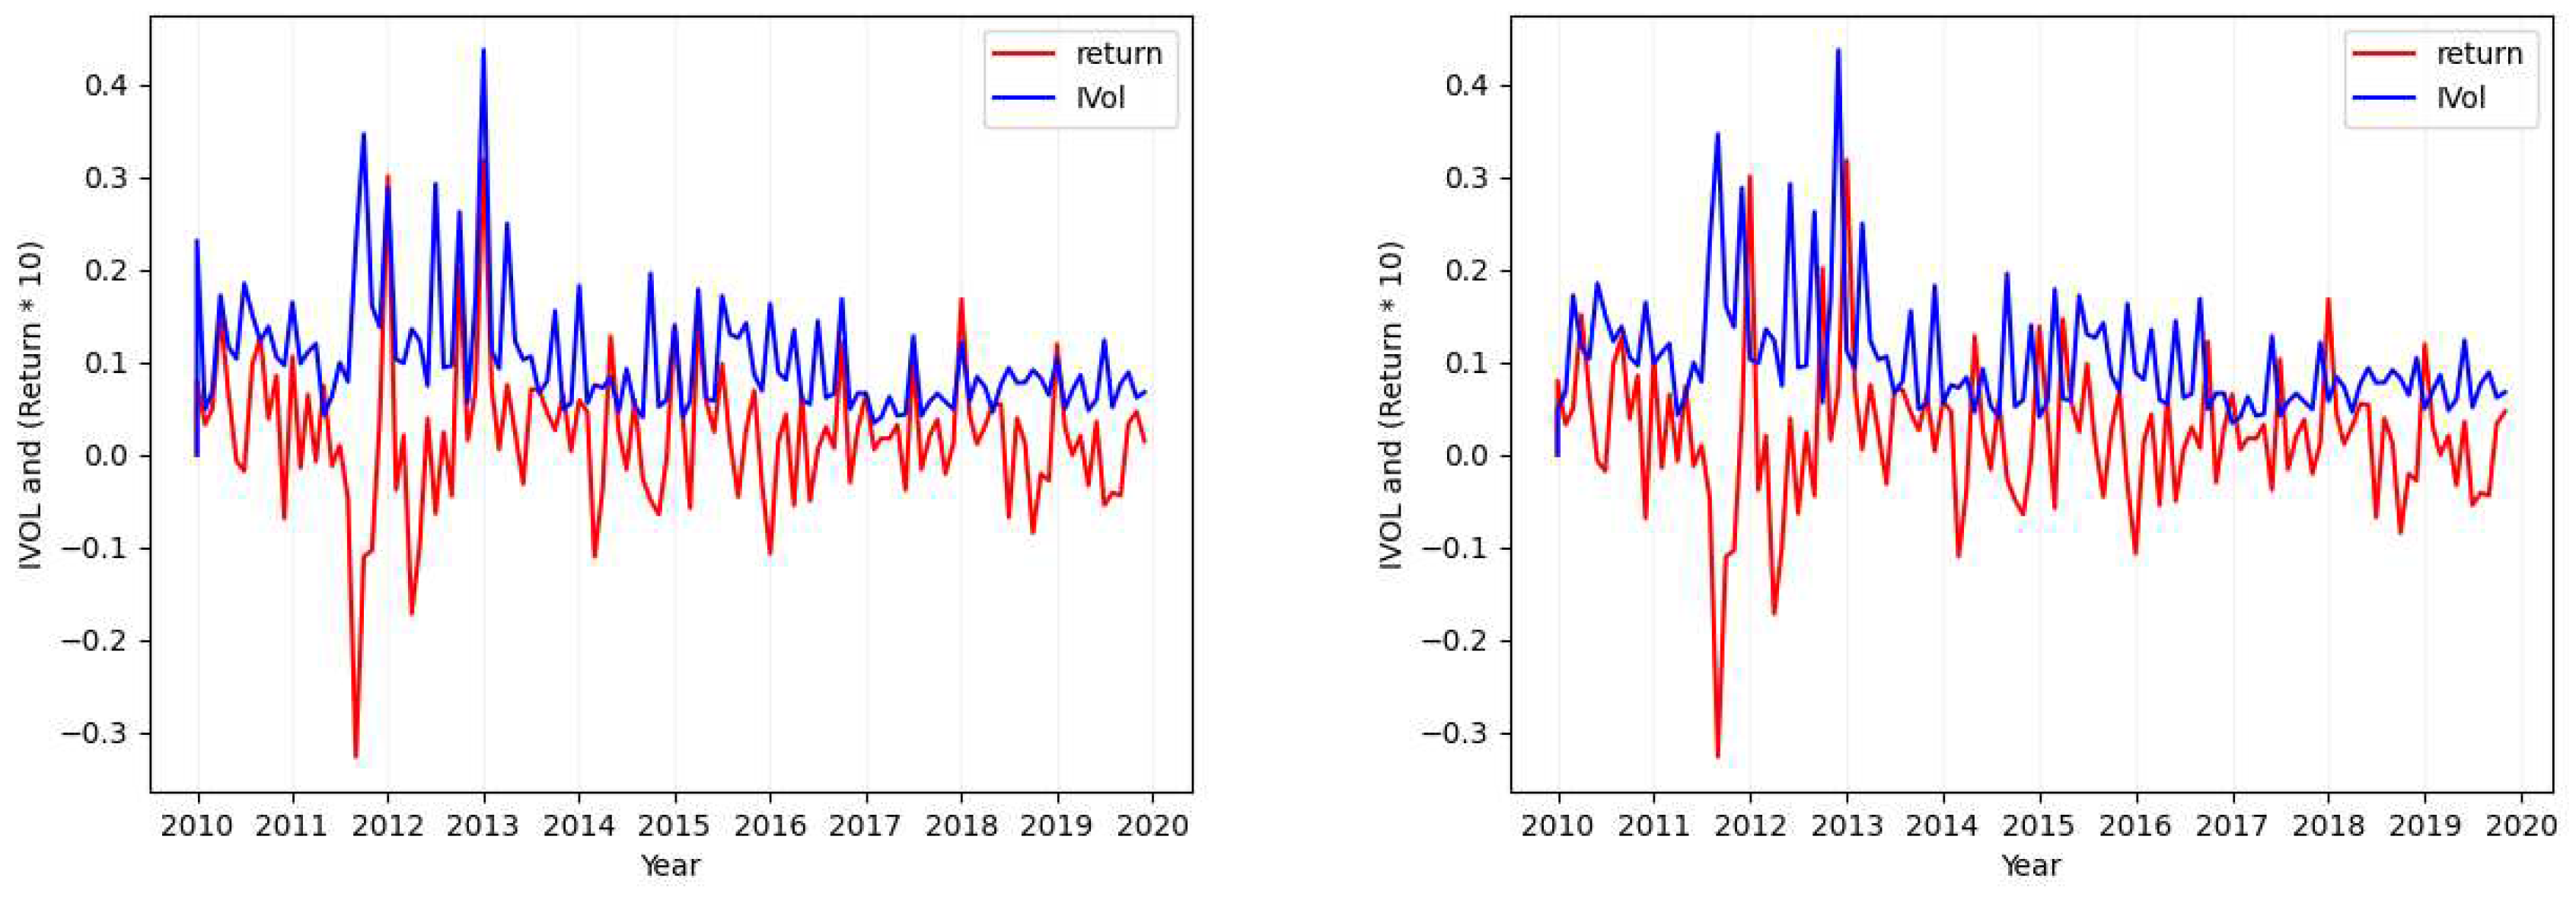
Figure A8.
Ticker: IDXX (Idiosyncratic Volatility Data Visualization - Case 4).
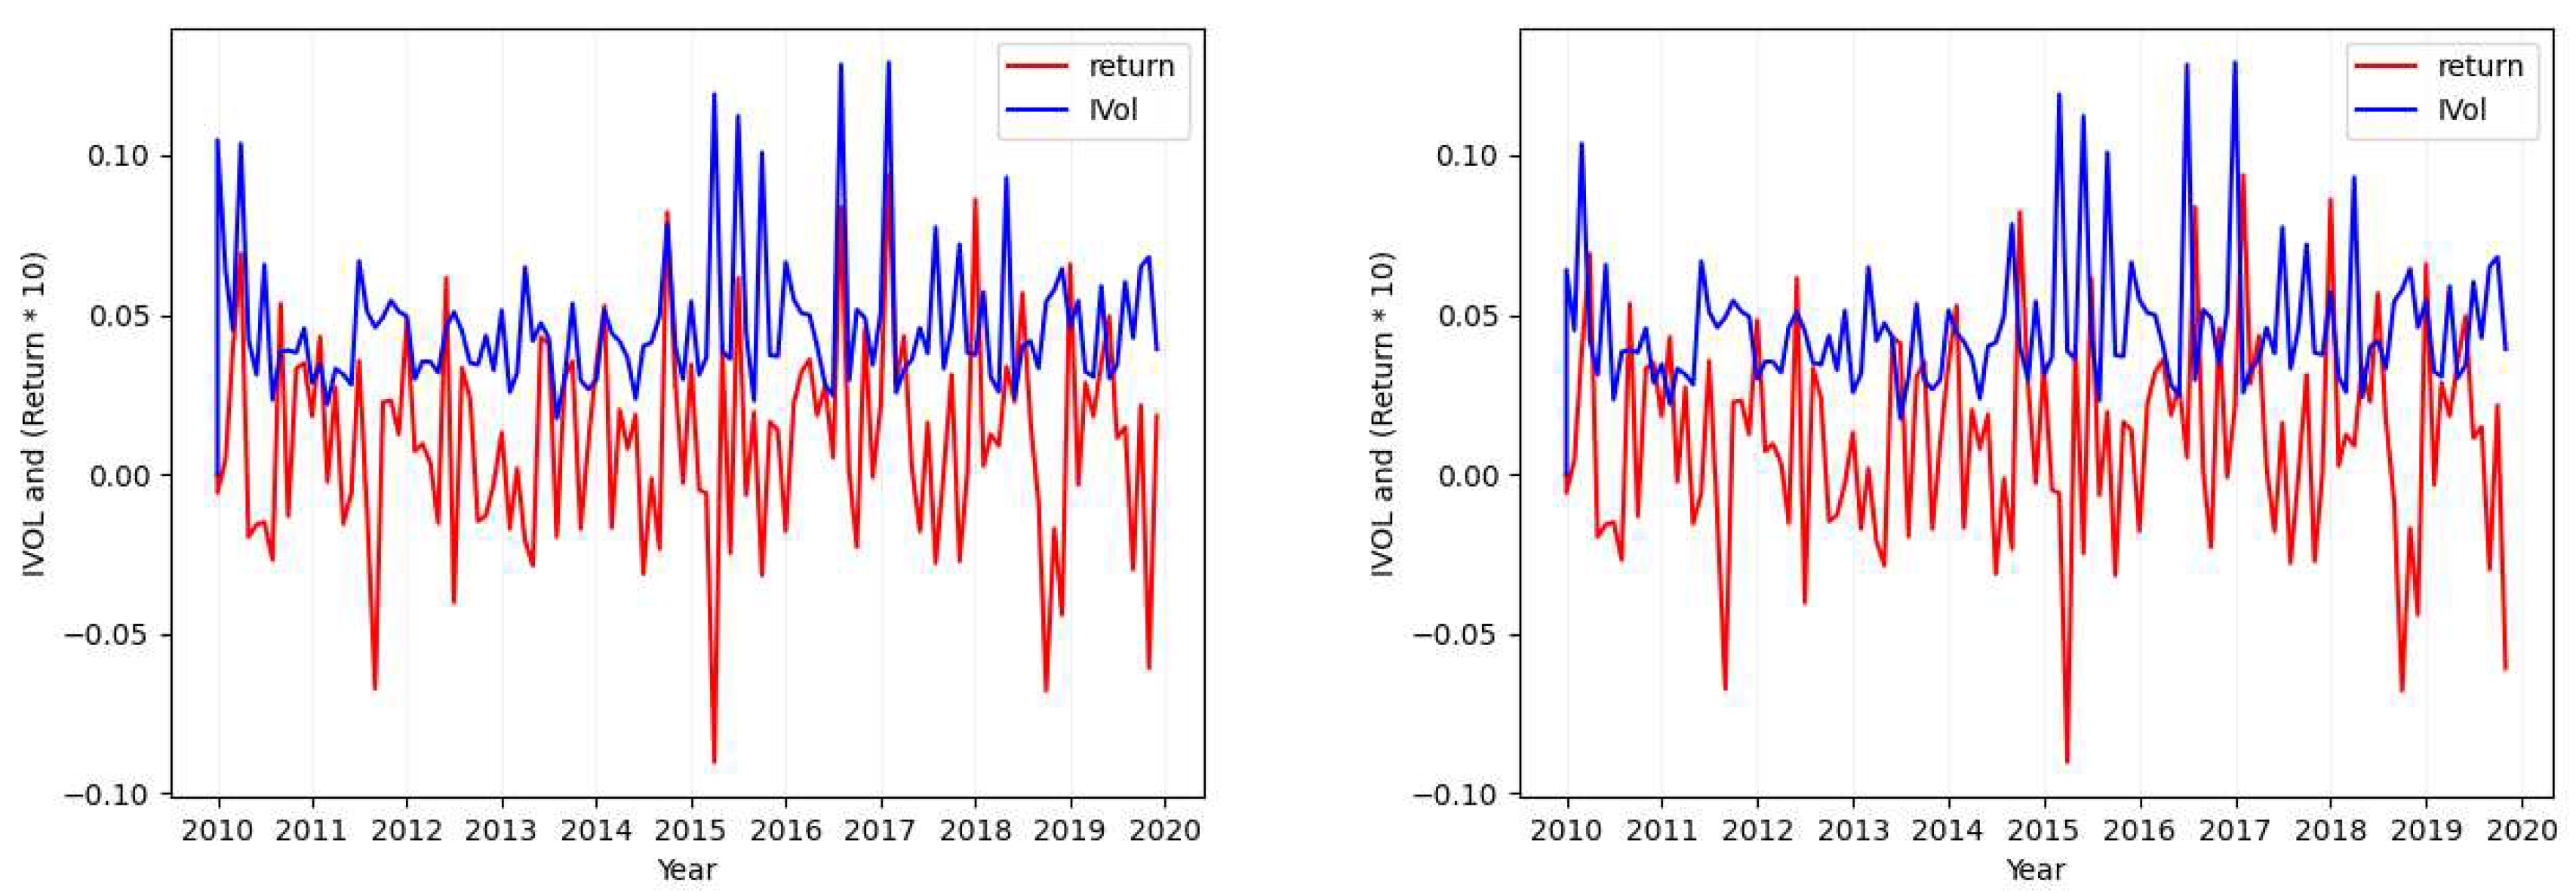
Figure A9.
Ticker: NTES (Idiosyncratic Volatility Data Visualization - Case 4).
References
- Amari, Shun-ichi. 1993. Backpropagation and stochastic gradient descent method. Neurocomputing 5(4-5), 185–196. [CrossRef]
- Ang, Andrew, Robert J Hodrick, Yuhang Xing, and Xiaoyan Zhang. 2006. The cross-section of volatility and expected returns. The Journal of Finance 61(1), 259–299. [CrossRef]
- Ang, Andrew, Robert J Hodrick, Yuhang Xing, and Xiaoyan Zhang. 2009. High idiosyncratic volatility and low returns: International and further us evidence. Journal of Financial Economics 91(1), 1–23. [CrossRef]
- De Bondt, Werner FM and Richard Thaler. 1985. Does the stock market overreact? The Journal of finance 40(3), 793–805.
- Eiling, Esther. 2013. Industry-specific human capital, idiosyncratic risk, and the cross-section of expected stock returns. The Journal of Finance 68(1), 43–84. [CrossRef]
- Eugene, Fama and Kenneth French. 1992. The cross-section of expected stock returns. Journal of Finance 47(2), 427–465.
- Eugene, Fama, R French Kenneth, et al. 1996. Multifactor explanations of asset pricing anomalies. Journal of Finance 51(1), 55–84.
- Fama, Eugene F and Kenneth R French. 1993. Common risk factors in the returns on stocks and bonds. Journal of financial economics 33(1), 3–56. [CrossRef]
- Fama, Eugene F. and James D. MacBeth. 1973. Risk, return, and equilibrium: Empirical tests. Journal of Political Economy 81(3), 607–636. [CrossRef]
- Fu, Fangjian. 2009. Idiosyncratic risk and the cross-section of expected stock returns. Journal of financial Economics 91(1), 24–37. [CrossRef]
- Ghoddusi, Hamed, Germán G Creamer, and Nima Rafizadeh. 2019. Machine learning in energy economics and finance: A review. Energy Economics 81, 709–727. [CrossRef]
- Gouvea, Raul, Gautam Vora, et al. 2015. Reassessing export diversification strategies: a cross-country comparison. Modern Economy 6(01), 96. [CrossRef]
- Graves, Alex. 2013. Generating sequences with recurrent neural networks. arXiv preprint arXiv:1308.0850.
- Gu, Shihao, Bryan Kelly, and Dacheng Xiu. 2020, 02. Empirical Asset Pricing via Machine Learning. The Review of Financial Studies 33(5), 2223–2273. [CrossRef]
- Guo, Hui and Robert Savickas. 2006. Idiosyncratic volatility, stock market volatility, and expected stock returns. Journal of Business & Economic Statistics 24(1), 43–56.
- Hao, Jiangang and Tin Kam Ho. 2019. Machine learning made easy: A review of scikit-learn package in python programming language. Journal of Educational and Behavioral Statistics 44(3), 348–361. [CrossRef]
- Hochreiter, S. and J. Schmidhuber. 1997. Long short-term memory. Neural Computation 9, 1735–1780.
- Jegadeesh, Narasimhan and Sheridan Titman. 1993. Returns to buying winners and selling losers: Implications for stock market efficiency. The Journal of finance 48(1), 65–91.
- Leippold, Markus, Qian Wang, and Wenyu Zhou. 2022. Machine learning in the chinese stock market. Journal of Financial Economics 145(2), 64–82. [CrossRef]
- Lindemann, Benjamin, Timo Müller, Hannes Vietz, Nasser Jazdi, and Michael Weyrich. 2021. A survey on long short-term memory networks for time series prediction. Procedia CIRP 99, 650–655. [CrossRef]
- Lintner, John. 1969. The valuation of risk assets and the selection of risky investments in stock portfolios and capital budgets: A reply. The review of economics and statistics, 222–224. [CrossRef]
- Loh, Wei-Yin. 2014. Fifty years of classification and regression trees. International Statistical Review 82(3), 329–348. [CrossRef]
- Mangram, Myles E. 2013. A simplified perspective of the markowitz portfolio theory. Global journal of business research 7(1), 59–70.
- Markowitz, Harry M. 1952. Portfolio selection. The Journal of Finance 7(1), 77–91.
- Merton, Robert C et al. 1987. A simple model of capital market equilibrium with incomplete information.
- Nartea, Gilbert V, Bert D Ward, and Lee J Yao. 2011. Idiosyncratic volatility and cross-sectional stock returns in southeast asian stock markets. Accounting & Finance 51(4), 1031–1054. [CrossRef]
- Pilnenskiy, Nikita and Ivan Smetannikov. 2020. Feature selection algorithms as one of the python data analytical tools. Future Internet 12(3), 54. [CrossRef]
- Rasekhschaffe, Keywan Christian and Robert C Jones. 2019. Machine learning for stock selection. Financial Analysts Journal 75(3), 70–88. [CrossRef]
- Rossi, Alberto G. 2018. Predicting stock market returns with machine learning. Georgetown University.
- Sharpe, William F. 1964. Capital asset prices: A theory of market equilibrium under conditions of risk. The journal of finance 19(3), 425–442.
- Shi, Yanlin, Wai-Man Liu, and Kin-Yip Ho. 2016. Public news arrival and the idiosyncratic volatility puzzle. Journal of Empirical Finance 37, 159–172. [CrossRef]
- Spiegel, Matthew I and Xiaotong Wang. 2005. Cross-sectional variation in stock returns: Liquidity and idiosyncratic risk.
- Xu, Yexiao and Burton G Malkiel. 2004. Idiosyncratic risk and security returns. Available at SSRN 255303.
- Zeiler, Matthew D. 2012. Adadelta: an adaptive learning rate method. arXiv preprint arXiv:1212.5701.
- Zhong, Xiao and David Enke. 2019. Predicting the daily return direction of the stock market using hybrid machine learning algorithms. Financial Innovation 5(1), 1–20. [CrossRef]
| 1 | Studies like Eugene et al. (1996) demonstrate that CAPM fails to explain certain patterns in average stock returns, but these anomalies are captured by the three-factor model Fama and French (1993) (explained in Section 2.1). |
| 2 | They follow the trading strategy suggested by Jegadeesh and Titman (1993). |
| 3 | Using international data from January 1980 to December 2003, except for Finland, Greece, New Zealand, Portugal, Spain, and Sweden, which began in the mid-1980s. |
| 4 | The exponential generalized autoregressive conditional heteroskedasticity model. |
| 5 | Using data from DataStream that covers the period up to November 2007. |
| 6 | Please note that we use each method in combination with different possible regressors and classifiers to test their suitability to our framework. |
| 7 | Downloaded from Wharton Research Data Services (WRDS); https://wrds-web.wharton.upenn.edu/wrds/ds/crsp/stock_a/dsf.cfm?navId=128; last accessed on December 15, 2020. |
| 8 | According to the guidelines provided by WRDS, a unique (CUSIP, PERMNO) pair represents a distinct company. In certain cases, companies undergo significant changes but retain their trading ticker, resulting in a disparity between the number of tickers and companies. |
| 9 |
https://mba.tuck.dartmouth.edu/pages/faculty/ken.french/data_library.html; last accessed on December 15, 2020. |
| 10 | Although the FF-3 dataset covers a wider range of years from 1926 to 2022 (97 years), we focus only on the data from 1963 to 2019, disregarding the remaining years in the created FF-3 yearly data. |
| 11 | These attributes serve as permanent stock identifiers over time. |
| 12 | We exclude 112,601 stock/year-month groups due to having fewer than 16 trading day records. |
| 13 |
https://en.wikipedia.org/wiki/Nasdaq-100; last accessed on May 16, 2022. |
| 14 | In the process, we remove the irrelevant, empty and repetitive feature selector results from the different combinations. |
| 15 |
Figure 1.
Ticker: MSFT (Idiosyncratic Volatility Data Visualization - Case 1).
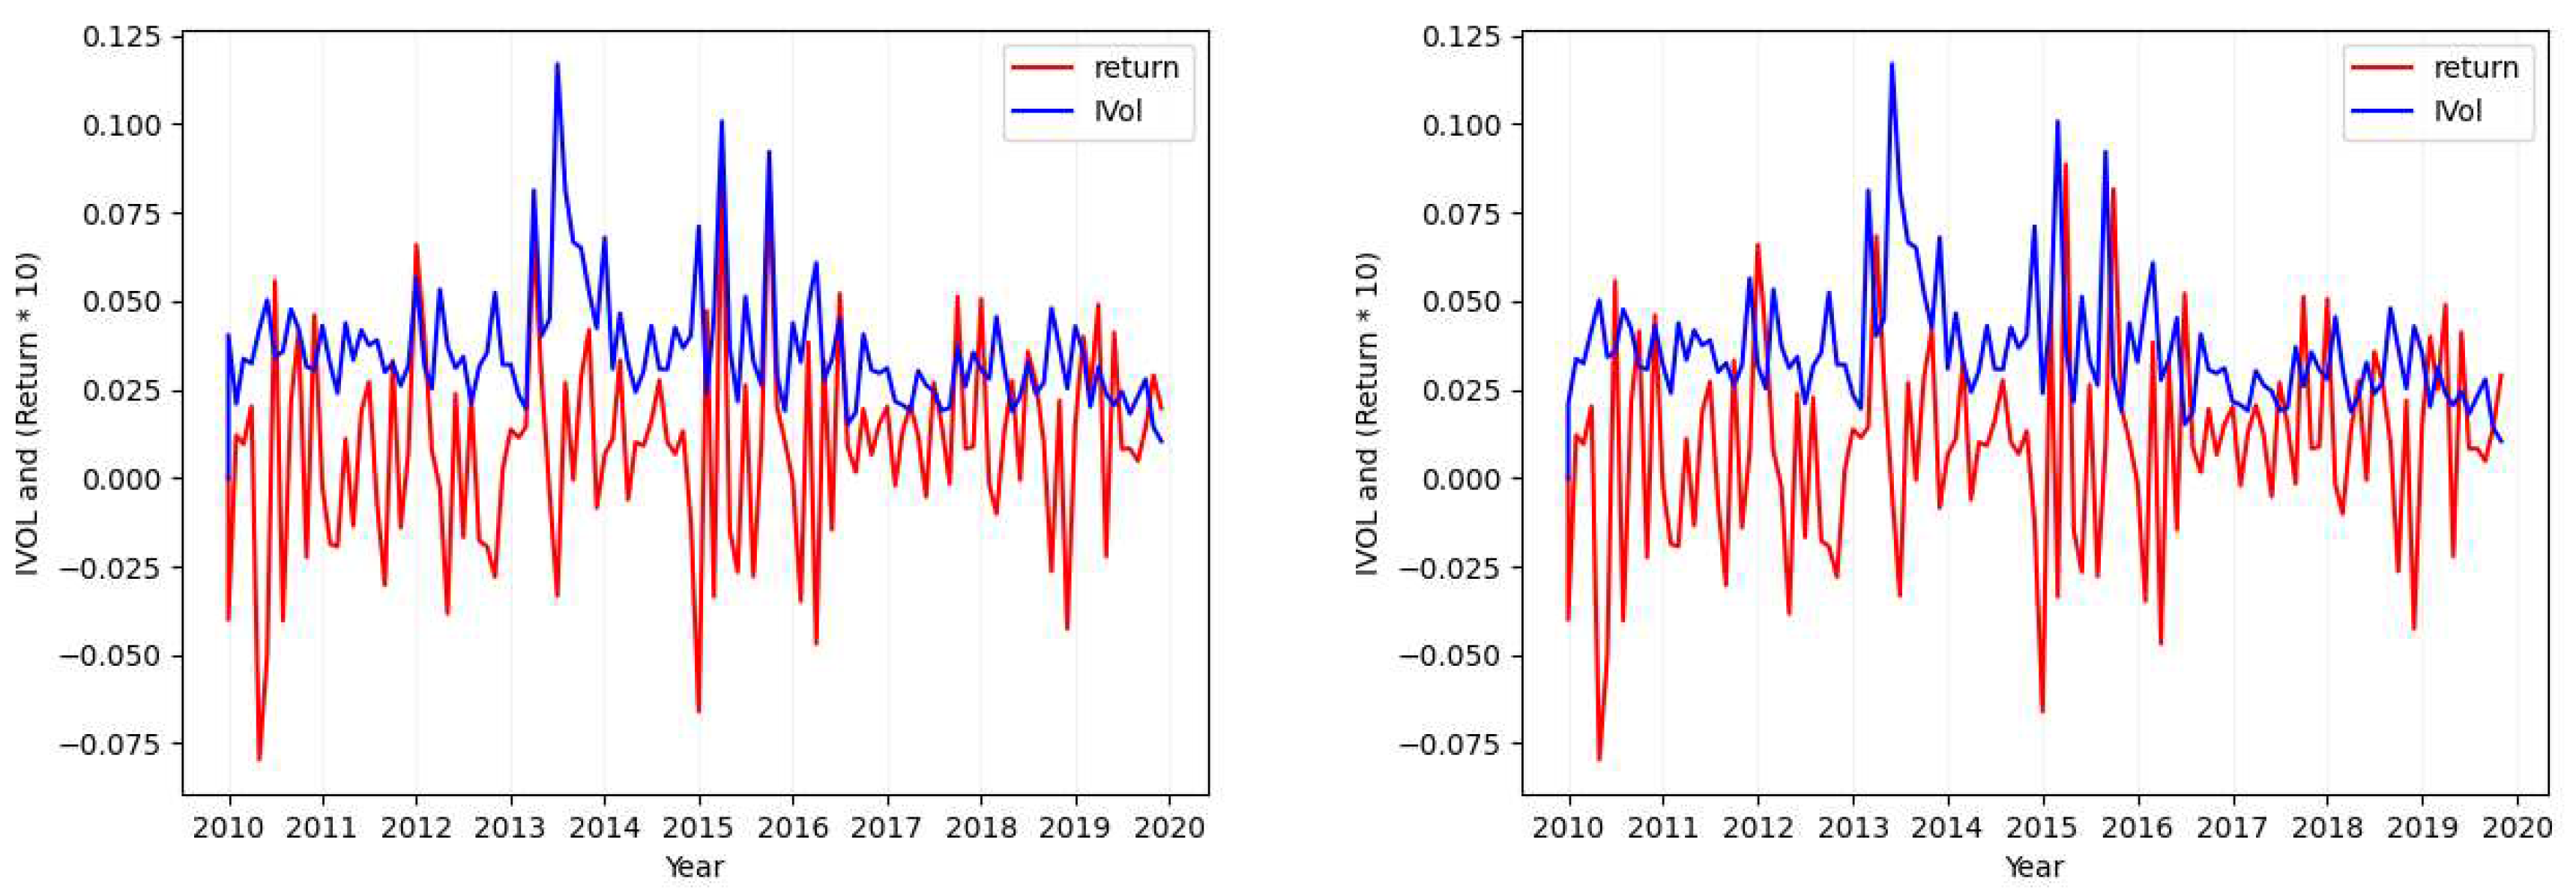
Figure 2.
Ticker: ALGN (Idiosyncratic Volatility Data Visualization - Case 2).
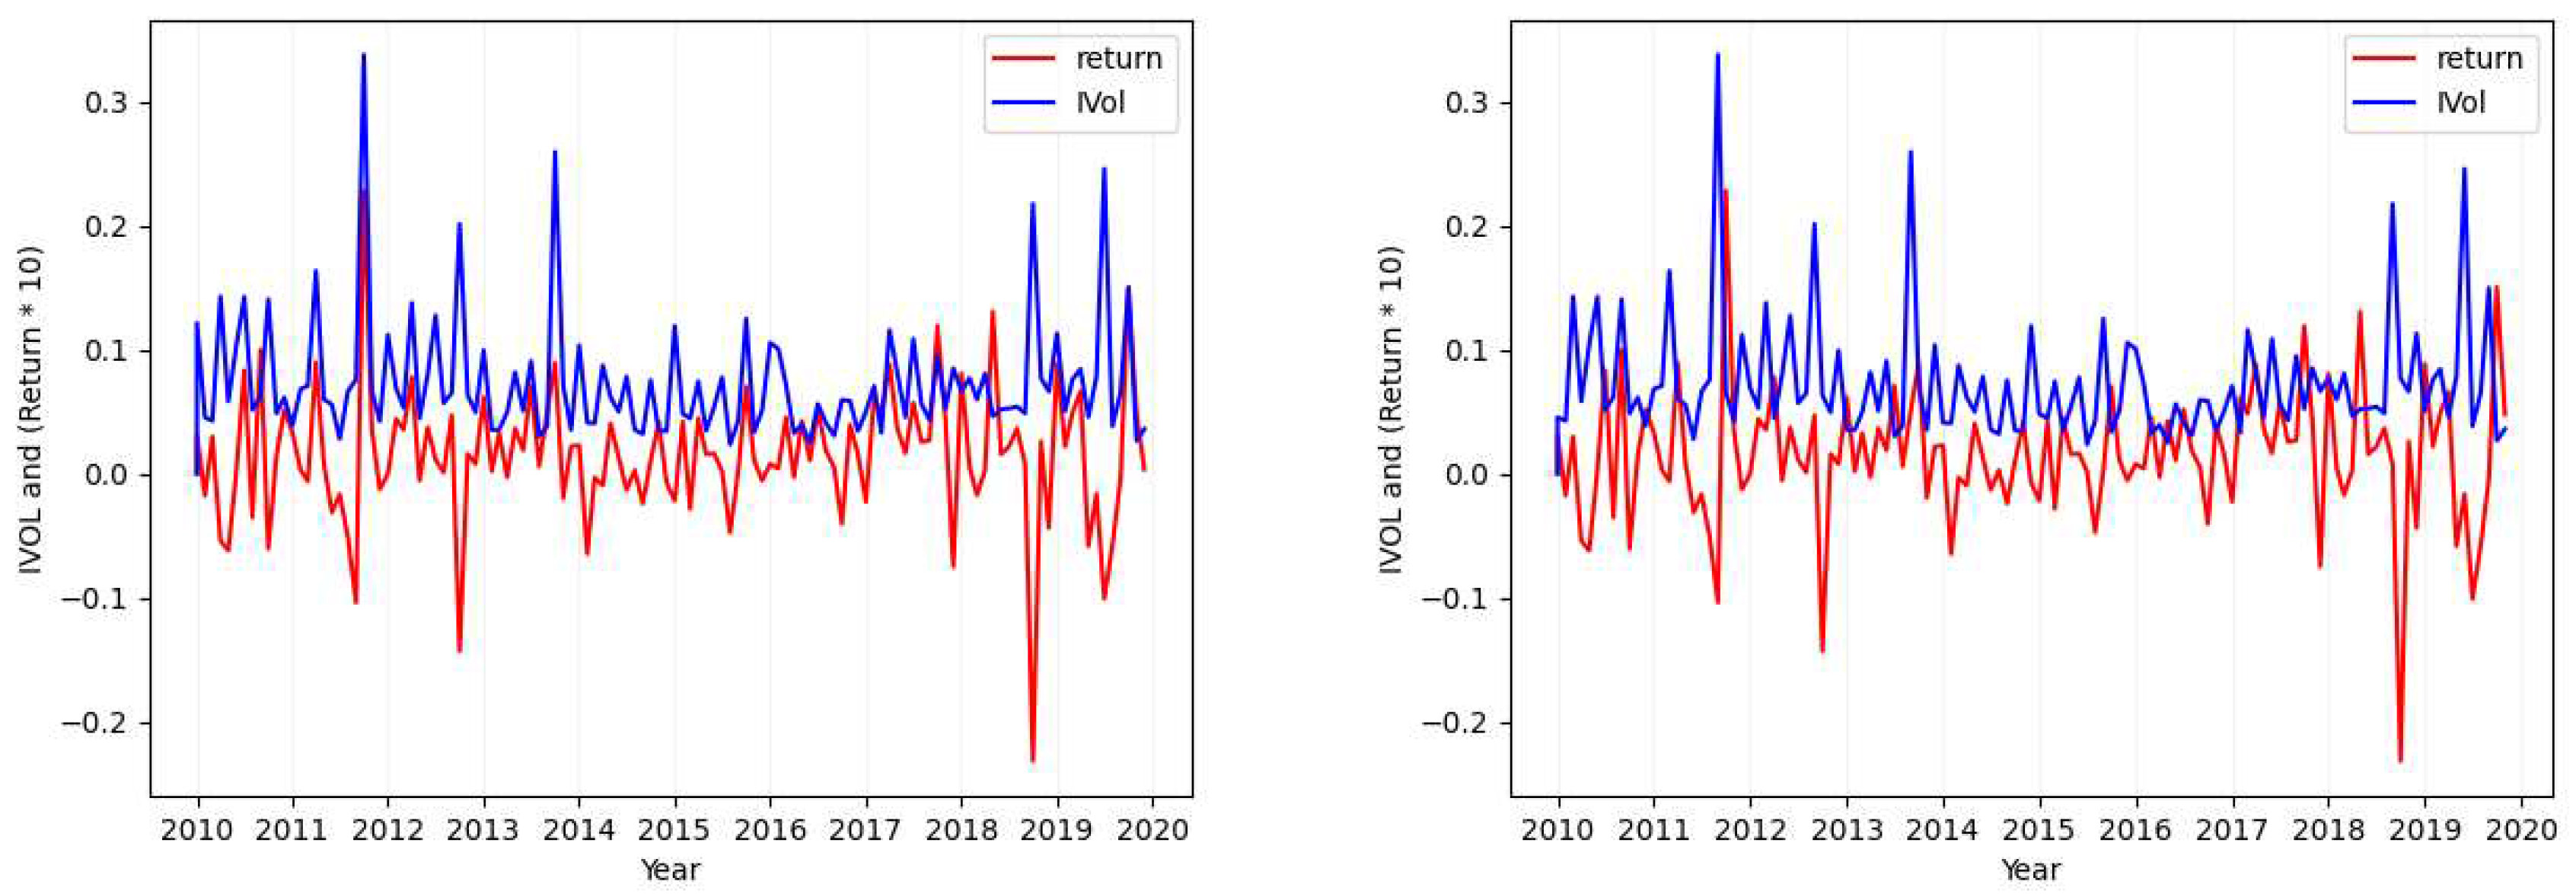
Figure 3.
Ticker: ILMN (Idiosyncratic Volatility Data Visualization - Case 3 and 4).
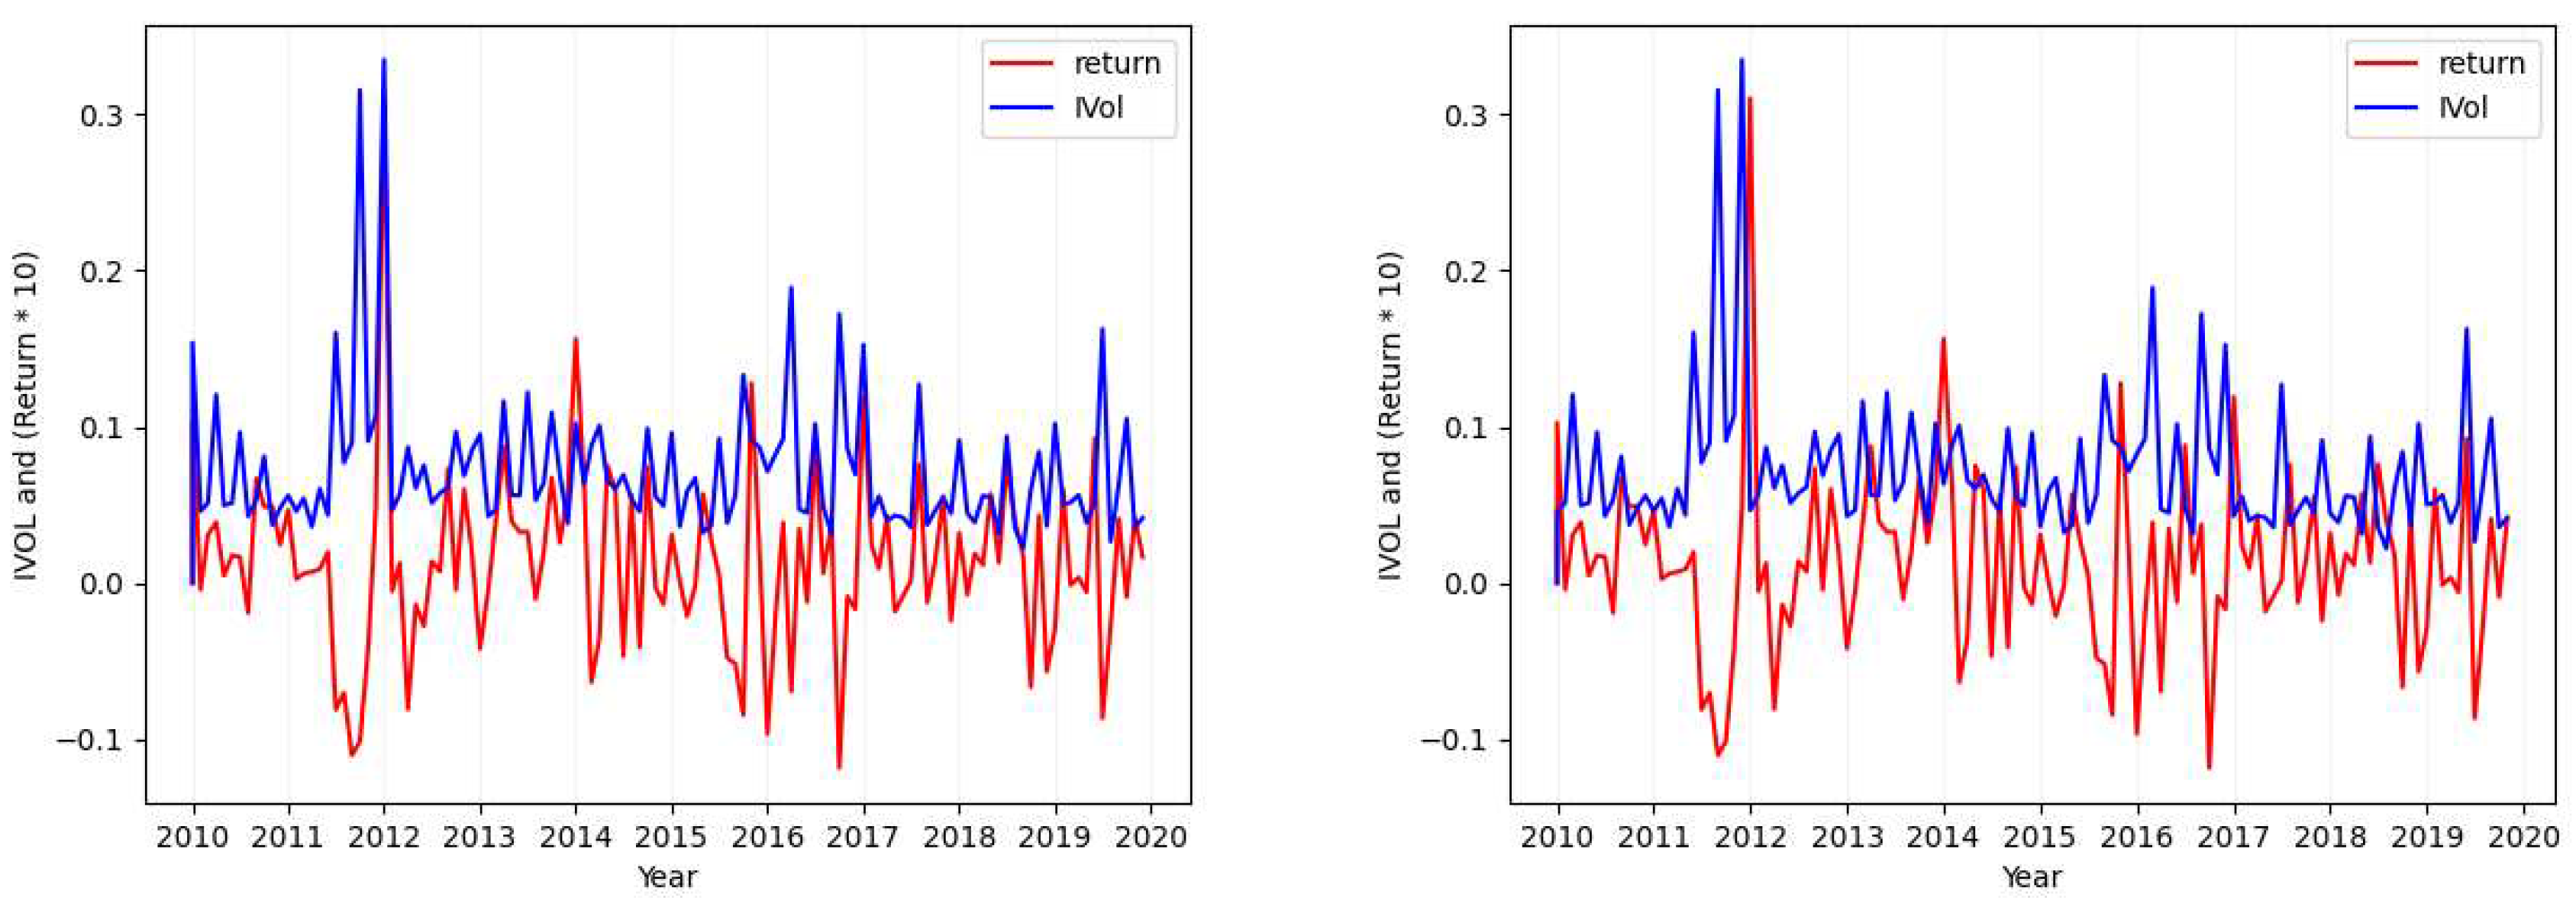
Figure 4.
Ticker: VRTX (Idiosyncratic Volatility Data Visualization - Case 4).
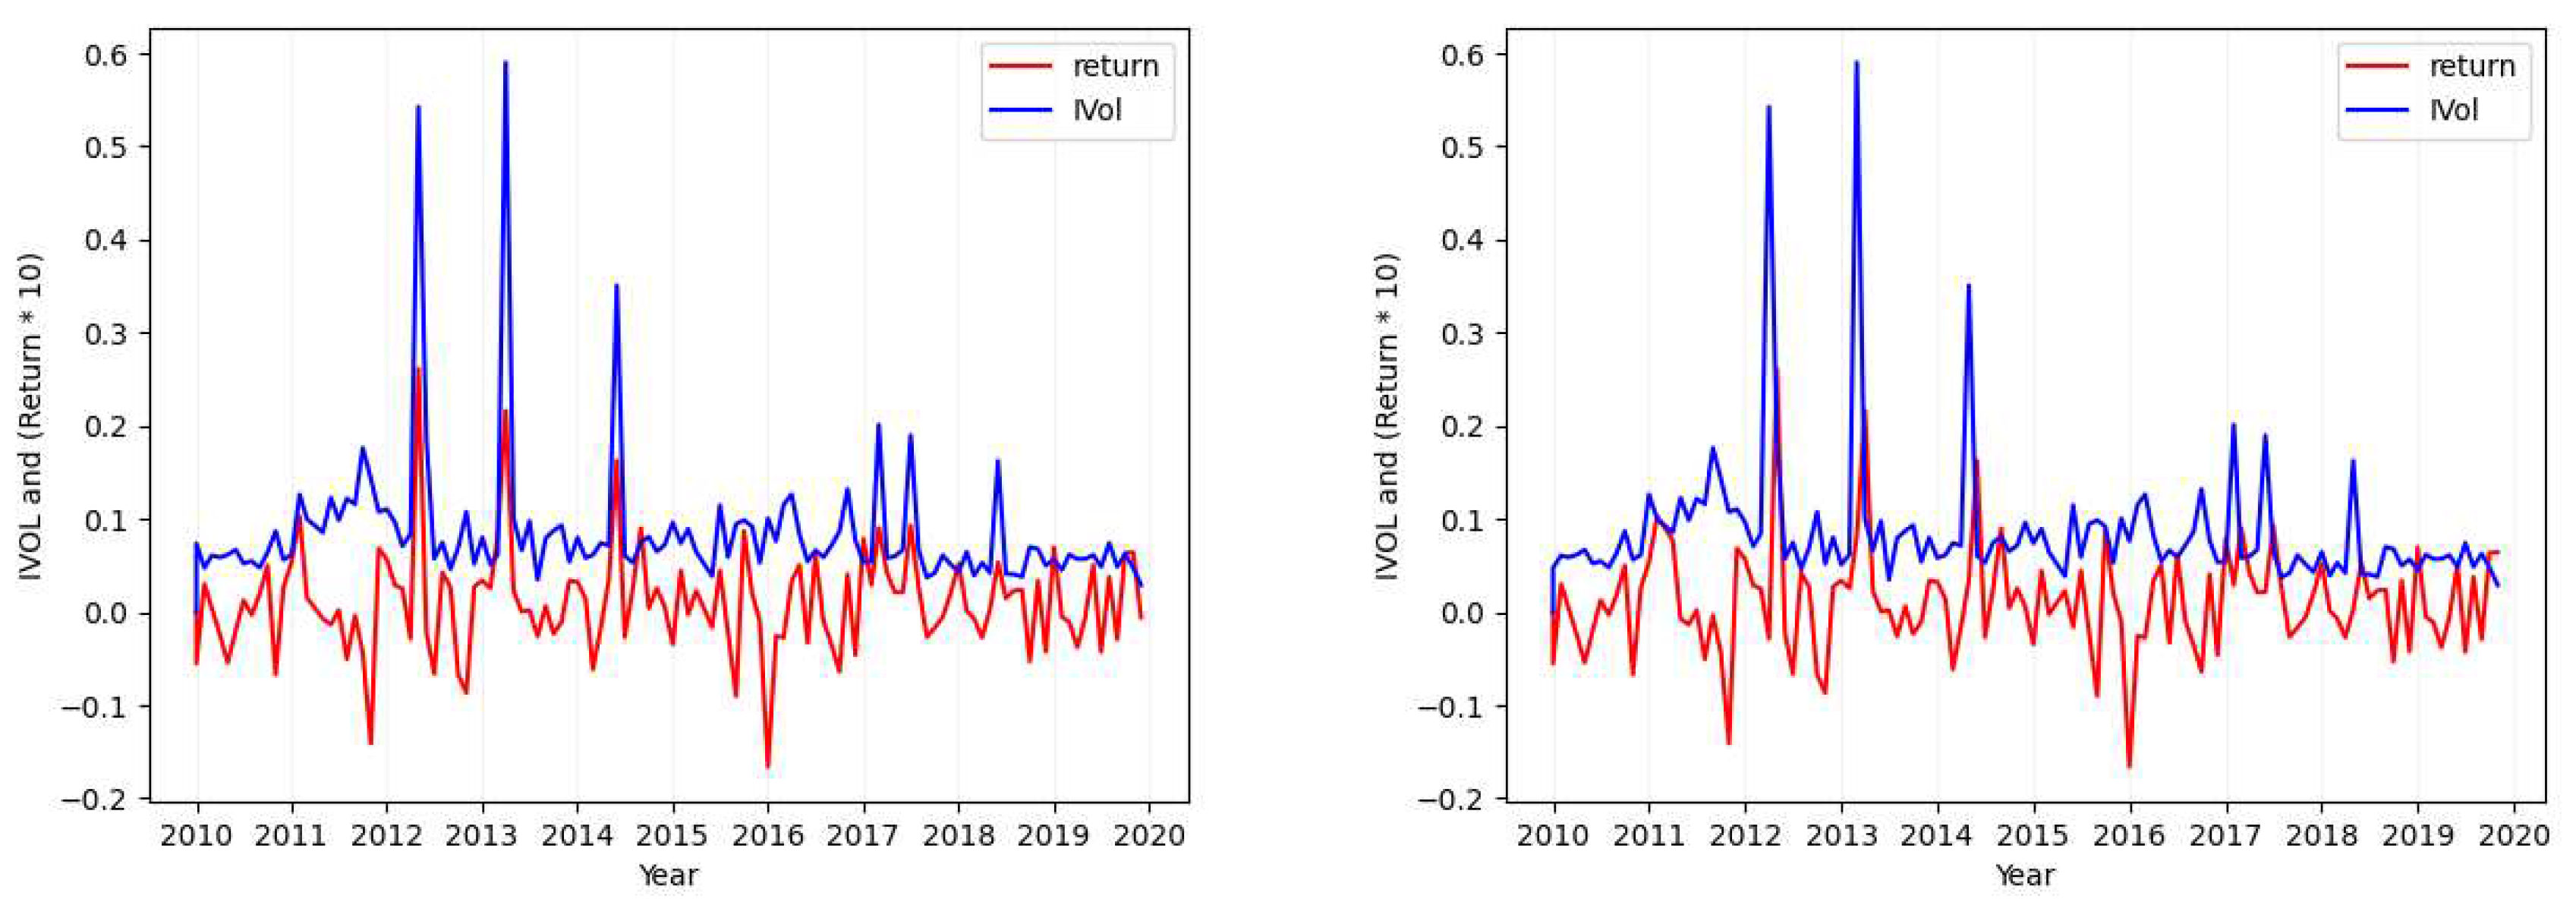
Figure 5.
Our designed Idiosyncratic Volatility regressor.
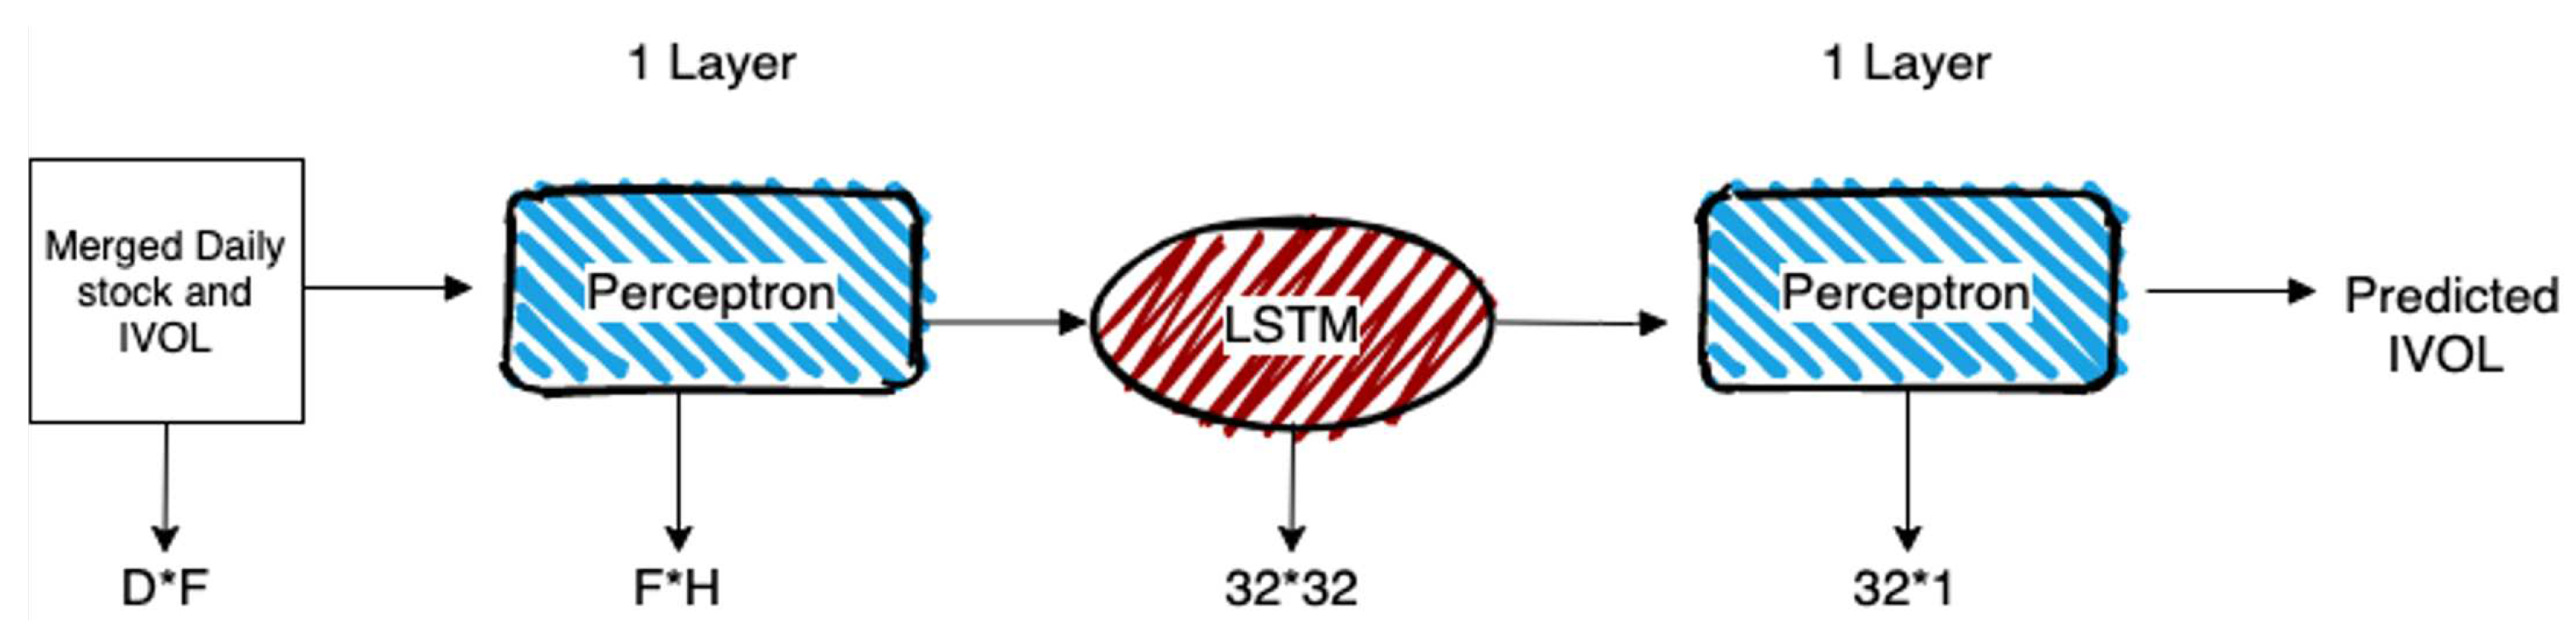

Table 1.
Statistical results on the ground truth calculated idiosyncratic volatility values for the original full dataset calculated over the CRSP data from January 1963 to December 2019 as well as the created subset dataset N100IVOL †.
Table 1.
Statistical results on the ground truth calculated idiosyncratic volatility values for the original full dataset calculated over the CRSP data from January 1963 to December 2019 as well as the created subset dataset N100IVOL †.
| Data | observations | IVOL | |||
|---|---|---|---|---|---|
| mean | sd | min | max | ||
| CRSP-dIVOL | 4,024,328† | 0.117 | 0.123 | 0.000 | 16.627 |
| N100IVOL | 501,429 | 0.078 | - | 0.006 | 1.156 |
† The total value in this part is 43,011 records less than the total count reported earlier. This is due to the reason that some of the calculated idiosyncratic volatility values for these 43,011 records has been too large or NaN (which would have been caused by the data error in original recorded files).
Table 2.
The summary of the calculated systematic risk results over CRSP-All.
| CRSP-All | ||
|---|---|---|
| observation | 4,024,328 | 4,024,328 |
| mean | 0.007 | -0.016 |
| std | 0.015 | 0.015 |
| min | -1.277 | -0.208 |
| max | 1.450 | 1.113 |
Table 3.
IVError results of running the LSTM based Regressor along with the baselines when considering the historical data from 1969 to 2018 as training data (column one), when considering three years data prior to 2019 as training data (column two), when considering two years data prior to 2019 as training data (column three), and when considering only one year of data prior to 2019 as training data (last column). All the IVError values are calculated over the trade records of the year 2019 which has been held out and has never been considered in any step of feature selection and training.
| 1969-2018 | 2016-2018 | 2017-2018 | 2018 | ||||||
|---|---|---|---|---|---|---|---|---|---|
| IVError | Ticker | IVError | Ticker | IVError | Ticker | IVError | Ticker | ||
| Decision Tree Regressor | Best | 0.000 | DDOG | 0.000 | DDOG | 0.000 | DDOG | 0.000 | DDOG |
| Average | 0.438 | - | 0.510 | - | 0.509 | - | 0.557 | - | |
| Worst | 1.341 | VRSN | 2.354 | VRSN | 2.350 | VRSN | 4.110 | VRSN | |
| Extra Tree Regressor | Best | 0.000 | KDP | 0.000 | DOCU | 0.000 | DOCU | 0.000 | MRNA |
| Average | 0.476 | - | 0.524 | - | 0.550 | - | 0.539 | - | |
| Worst | 1.694 | NVDA | 2.065 | VRSN | 2.350 | VRSN | 4.110 | VRSN | |
| Gr. Boosting Regressor | Best | 0.000 | CRWD | 0.000 | CRWD | 0.000 | CRWD | 0.000 | CRWD |
| Average | 0.503 | 0.524 | - | 0.530 | - | 0.563 | - | ||
| Worst | 2.346 | VRSN | 2.353 | VRSN | 2.351 | VRSN | 4.110 | VRSN | |
| LSTM based Regressor | Best | 0.180 | MRNA | 0.161 | ODFL | 0.182 | ODFL | 0.173 | ANSS |
| Average | 0.302 | - | 0.308 | - | 0.306 | - | 0.297 | - | |
| Worst | 0.521 | ASML | 0.819 | CHTR | 0.586 | PCAR | 0.563 | ASML | |
Table 4.
IVError results of running the LSTM based Regressor model on the monthly trade records in three configurations. (1) with a context that keeps the information of all the time from the beginning of the train or test session, (2) with a context that only keeps the information of the trade records of a month and gets reset for the records of each next month (3) with the regression objective changed to predict the idiosyncratic volatility values for the next month based on the records of the current month. The context will also get re-initialized in the beginning of each month in this setting.
| 1969-2018 | 2016-2018 | 2017-2018 | 2018 | ||||||
|---|---|---|---|---|---|---|---|---|---|
| IVError | Ticker | IVError | Ticker | IVError | Ticker | IVError | Ticker | ||
| With All Months Prediction | Best | 0.155 | ANSS | 0.168 | CMCSA | 0.161 | ODFL | 0.160 | ODFL |
| Average | 0.283 | - | 0.299 | - | 0.282 | - | 0.286 | - | |
| Worst | 0.935 | WBA | 0.833 | EBAY | 1.465 | PAYX | 0.735 | CPRT | |
| With One Month Prediction | Best | 0.177 | EXC | 0.160 | ANSS | 0.160 | ODFL | 0.160 | ODFL |
| Average | 0.506 | - | 0.287 | - | 0.271 | - | 0.279 | - | |
| Worst | 4.367 | HON | 0.890 | ISRG | 0.726 | COST | 0.957 | XEL | |
| With One Month Lagged Prediction | Best | 0.124 | CMCSA | 0.145 | ODFL | 0.126 | CMCSA | 0.134 | ODFL |
| Average | 0.283 | - | 0.277 | - | 0.270 | - | 0.273 | - | |
| Worst | 1.317 | PEP | 0.580 | AMGN | 0.663 | AMAT | 0.576 | EXC | |
Table 5.
Statistical results on the ground truth calculated idiosyncratic volatility values for the created subset dataset N100Dataset calculated over the CRSP data from January 1963 to December 2022.
Table 5.
Statistical results on the ground truth calculated idiosyncratic volatility values for the created subset dataset N100Dataset calculated over the CRSP data from January 1963 to December 2022.
| N100Dataset | observations | IVOL | ||
|---|---|---|---|---|
| mean | min | max | ||
| 1963-2019 | 501,429 | 0.078 | 0.006 | 1.156 |
| 2020-2022 | 3696 | 0.073 | 0.008 | 0.679 |
Table 6.
IVError results of running the LSTM based Regressor along with the baselines when considering the historical data from 1969 to 2021 as training data (column one), when considering three years data prior to 2022 as training data (column two), when considering two years data prior to 2022 as training data (column three), and when considering only one year of data prior to 2022 as training data (last column). All the IVError values are calculated over the trade records of the year 2022 which has been held out and has never been considered in any step of feature selection and training.
| 1969-2021 | 2019-2021 | 2020-2021 | 2021 | ||||||
|---|---|---|---|---|---|---|---|---|---|
| IVError | Ticker | IVError | Ticker | IVError | Ticker | IVError | Ticker | ||
| Decision Tree Regressor | Best | 0.170 | NXPI | 0.178 | MDLZ | 0.118 | EXC | 0.128 | EXC |
| Average | 0.448 | - | 0.488 | - | 0.520 | - | 0.434 | - | |
| Worst | 2.760 | DOCU | 2.767 | DOCU | 2.767 | DOCU | 2.421 | DOCU | |
| Extra Tree Regressor | Best | 0.230 | ADI | 0.193 | PCAR | 0.125 | EXC | 0.120 | EXC |
| Average | 0.579 | - | 0.513 | - | 0.556 | - | 0.424 | - | |
| Worst | 2.980 | CSX | 1.404 | QCOM | 2.706 | DOCU | 2.767 | DOCU | |
| Gr. Boosting Regressor | Best | 0.203 | HON | 0.192 | MU | 0.147 | EXC | 0.121 | EXC |
| Average | 0.494 | 0.489 | - | 0.524 | - | 0.426 | - | ||
| Worst | 2.756 | DOCU | 2.755 | DOCU | 2.767 | DOCU | 2.556 | DOCU | |
| LSTM based Regressor | Best | 0.120 | NVDA | 0.215 | SWKS | 0.122 | NVDA | 0.121 | NVDA |
| Average | 0.270 | - | 0.310 | - | 0.269 | - | 0.260 | - | |
| Worst | 1.324 | ATVI | 0.578 | AMD | 0.846 | ATVI | 0.529 | ATVI | |
Table 7.
IVError results of running the LSTM based Regressor model on the monthly trade records in three configurations. (1) with a context that keeps the information of all the time from the beginning of the train or test session, (2) with a context that only keeps the information of the trade records of a month and gets reset for the records of each next month (3) with the regression objective changed to predict the idiosyncratic volatility values for the next month based on the records of the current month. The context will also get re-initialized in the beginning of each month in this setting.
| 1969-2021 | 2019-2021 | 2020-2021 | 2021 | ||||||
|---|---|---|---|---|---|---|---|---|---|
| IVError | Ticker | IVError | Ticker | IVError | Ticker | IVError | Ticker | ||
| With All Months Prediction | Best | 0.122 | NVDA | 0.120 | NVDA | 0.130 | NVDA | 0.137 | EXC |
| Average | 0.480 | - | 0.354 | - | 0.401 | - | 0.385 | - | |
| Worst | 2.050 | ANSS | 1.375 | VRSK | 2.558 | ROST | 1.673 | LRCX | |
| With One Month Prediction | Best | 0.211 | PEP | 0.215 | NVDA | 0.215 | NVDA | 0.215 | NVDA |
| Average | 0.292 | - | 0.322 | - | 0.311 | - | 0.309 | - | |
| Worst | 0.522 | GOOG | 0.929 | CTAS | 0.626 | XEL | 0.593 | AZN | |
| With One Month Lagged Prediction | Best | 0.207 | NVDA | 0.107 | NVDA | 0.210 | NVDA | 0.171 | CRWD |
| Average | 0.324 | - | 0.396 | - | 0.333 | - | 0.643 | - | |
| Worst | 1.602 | CDNS | 3.978 | XEL | 1.258 | PEP | 2.649 | ADP | |
Disclaimer/Publisher’s Note: The statements, opinions and data contained in all publications are solely those of the individual author(s) and contributor(s) and not of MDPI and/or the editor(s). MDPI and/or the editor(s) disclaim responsibility for any injury to people or property resulting from any ideas, methods, instructions or products referred to in the content. |
© 2023 by the authors. Licensee MDPI, Basel, Switzerland. This article is an open access article distributed under the terms and conditions of the Creative Commons Attribution (CC BY) license (http://creativecommons.org/licenses/by/4.0/).
Copyright: This open access article is published under a Creative Commons CC BY 4.0 license, which permit the free download, distribution, and reuse, provided that the author and preprint are cited in any reuse.


