
Submitted:
20 October 2025
Posted:
22 October 2025
You are already at the latest version
Abstract
The article discusses the issue of pasture degradation in the West Kazakhstan region, which has been caused by a significant rise in the population of saigas (Saiga tatarica). The study aims to quantify agricultural losses and establish the relationship between saiga numbers and ecosystem changes. The research methodology incorporates field observations, agroecological observations, and mathematical analysis. Data were collected in areas heavily affected by saiga migration in 2024. Correlation and regression analyses were performed. The results showed that hay yield decreased by 14 kg/ha for every additional 1,000 saiga individuals. The greatest losses were recorded in the Bokeiordinsky district, where grazing pressure exceeded 62.5%. It was concluded that urgent measures are needed to regulate the saiga population, restore degraded land, and introduce rotational grazing. Mechanisms for the adaptive management of wild populations that take into account the interests of the agricultural sector were proposed. The findings obtained can provide a solid foundation for informed decision-making in agricultural and environmental policy within the region.
Keywords:
ecosystem degradation
; overgrazing
; land use
; species competition
; rural economy
; environmental conflict
; adaptive management
; biodiversity loss
JEL: Q10; Q15; Q57
1. Introduction
The conservation of ecosystems and biodiversity in the 21st century is acquiring particular significance amid global climate change and increasing anthropogenic pressure. In the steppe and semi-desert regions of Central Asia, the problem of balancing agricultural development with nature conservation is becoming increasingly acute.
Maintaining a balance between agricultural development and biodiversity conservation is challenging for sustainable land use in the steppe and semi-desert regions of Central Asia. The rapid increase in saiga (Saiga tatarica) numbers in Western Kazakhstan has elicited conflicting reactions from farmers, environmental organizations, and government agencies. On the one hand, saiga are protected internationally under the Convention on Migratory Species (2024). On the other hand, high local densities can reduce the productivity of fodder resources and accelerate pasture degradation, with implications for food security.
Modern approaches to managing wild ungulate populations are grounded in adaptive management, spatial monitoring, and economic impact assessment. For the saiga, a keystone species of Kazakhstan’s steppe ecosystems, it is important to account for both ecological functions and the risks of pasture degradation.
In Western Kazakhstan, the rapid growth of saiga populations has raised concerns among farmers and conservationists. The central question of this study is: how does saiga abundance affect the forage productivity of pasturelands and livestock productivity?
Although there is a substantial body of research on human–wildlife conflict in Africa and Mongolia, Kazakhstan is represented only fragmentarily in the international literature. Existing studies rarely combine saiga demographic data with quantitative assessments of agroecological losses, which limits the effectiveness of policy in the region.
In scientific literature, the issue of interaction between wild ungulates and agricultural systems is studied in the context of ecosystem conflicts (Singh & Milner-Gulland, 2011), economic assessment of environmental losses (Gren et al., 2018) and spatial analysis of the load on forage lands (Muzbay et al., 2024). However, most studies focus on Africa, Mongolia and Eastern Europe, while Kazakhstan is represented only fragmentarily. This creates a gap in the international scientific field and limits the effectiveness of agricultural policy, which must take into account both environmental and economic factors.
Numerous studies document a rise in human–wildlife conflicts (Nyhus, 2016; Brondízio et al., 2021). Modern wildlife population management emphasizes integrative strategies that combine adaptive management, spatial modeling, and economic impact assessment. Adaptive management entails iteratively adjusting decisions based on monitoring population status and evaluating management effects (Williams et al., 2009). Methods that quantify ecosystem services and agricultural damages caused by wildlife are widely used (Gren et al., 2018; Chardonnet et al., 2002). Effective policies must weigh both benefits, such as environmental and recreational values, and costs in human-dominated landscapes (Gren et al., 2018).
Population management, as defined by Hone et al. (2010), involves intentional human intervention in the dynamics of wild animal populations to achieve a stable population while preserving their ecological functions. However, traditional methods that focus on the exclusion of specific age or sex groups often fall short in managing rapidly growing populations with high reproductive rates. Servante et al. (2011) emphasize that these methods do not provide a sustainable solution and highlight the need for integrated management that considers the demographic structure and reproductive dynamics of populations.
These issues are particularly important concerning Saiga tatarica, which is a crucial component of the steppe and semi-desert ecosystems in Kazakhstan. According to UNEP/WCMC (2021), saigas are a key species for maintaining biodiversity. They help shape the structure of plant communities and provide food for predators and scavengers, thereby contributing to the sustainability of these ecosystems.
To effectively regulate population size, it is important to evaluate its dynamics within the context of the species’ biological capabilities. Hone et al. (2010) highlight that the maximum annual population growth rate (rm) is a crucial parameter for developing management strategies. This metric helps predict how populations can recover and establishes acceptable levels of animal removal without jeopardizing the sustainability of the population.
The spatial structure of populations plays a crucial role in their management. Hampton et al. (2004) point out that the movement of individuals between local groups can undermine local population control efforts if we do not consider genetic connectivity and migration patterns between populations.
In environments characterized by high variability in external factors, effective management should adopt adaptive approaches. This is supported by the concept of dynamic capabilities proposed by Teece, Pisano, and Shuen (1997), which highlights the need for a flexible response to changes in the external environment. Malik et al. (2018) emphasize that population management strategies must consider demographic variability and environmental uncertainty, focusing on realistic management scenarios rather than solely relying on theoretical models.
Effective management of saiga populations requires integrating demographic analysis, spatial monitoring, and adaptive population management methods. This approach aims to achieve a sustainable balance between conservation of the species and minimizing damage to the agricultural sector (Singh N.J., Milner-Gulland E.J. 2011).
Kazakhstan is crucial for the global conservation of saiga, as most remaining populations reside within its borders (Saiga Antelope Memorandum of Understanding, Convention on Migratory Species, 2024). The international community actively supports Kazakhstan’s initiatives to protect and restore saiga populations, highlighting the importance of international cooperation in these efforts (Altyn Dala Conservation Initiative, 2024).
Saiga antelopes (Saiga tatarica) play a vital ecological role in the steppe and semi-desert ecosystems of Kazakhstan. Currently, two species of saiga are recognized by international conventions: S. tatarica, which is found in Kazakhstan, Uzbekistan, and Russia, and S. borealis, which inhabits Mongolia. However, several researchers, including those from the IUCN, consider them to be subspecies of S. tatarica. They differentiate between S. t. tatarica, which is widespread in Russia, Kazakhstan, and Uzbekistan, and S. t. mongolica, native to Mongolia. It is believed that both subspecies once inhabited China (Cui et al., 2017).
Four populations of S. tatarica have been identified. Three of these populations primarily reside in Kazakhstan, while the fourth is located in the northwestern Caspian region of Russia. Currently, Kazakh populations account for over 90% of the total number of this species. Among these are the Betpakdalin population, which inhabits central Kazakhstan and sometimes crosses into Russia; the Ural population, found in northwestern Kazakhstan and sharing a cross-border area with Russia; and the Ustyurt population, located in southwestern Kazakhstan, which occasionally crosses the border into Uzbekistan (UNEP/CMS, 2021).
Saigas act as “ecosystem engineers,” significantly influencing plant communities and creating favorable conditions for other animal species, including rodents, insects, and birds (Jones, Lawton, & Shachak, 1994). Their grazing helps maintain plant diversity and prevents the dominance of any single plant species, contributing to the overall balance of the ecosystem.
A literature review shows that previous studies have primarily considered the environmental impact of wild animals in isolation from economic losses. Meanwhile, quantitative models integrating demographic, spatial and agronomic factors have hardly been used in the case of saigas. Furthermore, the studies did not emphasise the direct link between saiga population density and the decline in fodder crop productivity within specific administrative districts. This article proposes a methodology that fills these gaps by combining statistical models with real field observation data.
This article addresses the gap by using regression analysis, field observations, and agro-ecological measurements across three districts of Western Kazakhstan. The results allow for an assessment of the ecological and economic consequences of saiga population growth and inform recommendations for sustainable management policy.
2. Research Methods
The study uses a quantitative approach based on the case study method. Three representative areas of the West Kazakhstan region were selected, where the saiga population has the greatest impact on the agricultural sector. The methodology combines field empirical observations, agroecological measurements, correlation and regression analysis, as well as an economic assessment of losses in crop yields and livestock productivity.
Field studies were conducted in 2024 to assess the state of pastures in the Bokeyordinsky, Zhanibeksky, and Kaztalov districts of the West Kazakhstan region. The main biometric indicators of pasture ecosystems that were examined include projective vegetation cover, herbage height, green mass yield, herbage composition, and the energy value of pasture feed.
The statistical analysis involved correlation analysis to evaluate the relationship between the number of saiga antelopes, pasture and livestock productivity. This was achieved using a correlation matrix. Regression analysis was then applied to construct models quantifying the effect of saiga numbers on hayfield and pasture productivity. Separate regressions were estimated for each district. Model adequacy was assessed using the coefficient of determination R2R2 and the Fisher test. The economic component evaluated damage by calculating productivity losses on forage lands and by analyzing changes in sheep live weight across the study areas.
A quantitative design was selected to numerically evaluate links between saiga population size and crop and livestock productivity. The case-study approach was used because impacts vary geographically: districts in Western Kazakhstan differ in both pasture degradation and saiga abundance. Field observations documented the current condition of pastures and standing vegetation. Agroecological measurements (e.g., grass height, projective cover, productivity, and feed energy content) enabled comparisons across plots experiencing different grazing pressures.
Correlation analysis was employed to identify statistical dependencies between the saiga population and agricultural productivity indicators. Regression analysis was then used to create mathematical models showing the impact of the saiga population on crop productivity in specific regions.
The STATISTICA software package was employed for data processing and analysis. The assessment of the load on pasture lands was conducted according to the maximum permissible standards set forth by the Order of the Ministry of Agriculture of the Republic of Kazakhstan, dated April 14, 2015, No. 3-3/332. The analysis of the actual availability of pasture resources involved calculating the shortfall in areas needed for livestock and saigas.
A linear regression model was used to analyze the effect of saiga abundance on hay productivity due to its simplicity, interpretability, and adequate accuracy given the available data. This choice followed a comparison with polynomial alternatives, where the linear specification showed more stable performance on test subsamples and clearer coefficient interpretation. Prior to estimation, the assumptions underpinning the Gauss–Markov theorem were checked to ensure the validity of ordinary least squares. Multicollinearity was evaluated using variance inflation factors (VIF), which remained below the conventional threshold (VIF < 5), indicating acceptable independence among predictors. Residual heteroscedasticity was tested with the Breusch–Pagan procedure and was not detected at conventional significance levels (p > 0.05). Together, these diagnostics support the assumption of constant residual variance and the suitability of the linear model for inference.
The study used the following variables:
Dependent variable (Y) – hay productivity, measured in kilograms per hectare (kg/ha);
Independent variable (X) – number of saigas (per 1,000 heads) in the respective administrative district.
Data sources included: official statistical compendia of the Republic of Kazakhstan (“Agriculture, Forestry and Fisheries in the Republic of Kazakhstan, 2017–2023”; “Environmental Protection and Sustainable Development of Kazakhstan, 1981–2023”), materials from field observations and measurements conducted under the IRN AP23486846 research project (2024), and UNEP/CMS analytical documents (2021, 2024)
Key variables included:
- -
- the abundance of saiga in the Bokeyorda, Zhanibek, and Kaztal districts;
- -
- the area of available and required pastures (in hectares, according to the standards set by the Order of the Ministry of Agriculture of the Republic of Kazakhstan dated April 14, 2015, No. 3-3/332);
- -
- hay productivity (kg/ha), derived from biometric measurements and farm statistics.
The unit of analysis was the district within the West Kazakhstan Region. Each district was analyzed separately to account for local patterns of pasture degradation. The regression model was represented in the following general form:
where:
Y= β0 + β1Xsaiga,
β – unknown parameter on the research vector.
In total, 36 observations were collected (12 per district—Bokeyorda, Zhanibek, and Kaztal) during the 2024 growing season. The total area of the studied lands was 3.06 million hectares (875,701 ha in Bokeyorda District, 728,888 ha in Zhanibek, and 1,455,906 ha in Kaztal). The saiga numbers used in productivity calculations were 46.0 thousand, 30.0 thousand, and 164.4 thousand head, respectively (according to the statistical compendium “Agriculture, Forestry and Fisheries in the Republic of Kazakhstan, 2017–2023”).
For each regression model was reported the number of observations, coefficients of determination, and the statistical significance levels of the coefficients. This was done to confirm the validity of the models and the adequacy of interpreting the effect of saiga abundance on hayfield productivity.
Field data on the saiga population size and pasture condition were collected as part of the IRN AP23486846 research project ‘Economic assessment of the impact of wild animal populations (saigas) on the agricultural sector and ways to reduce the damage caused’ (IRN, 2024). The project monitored saiga numbers in the Bokeiordinsky, Zhanibeksky and Kaztalovsky districts using aerial photography from drones, ground-based visual counts and georeferencing of habitats. In addition, biometric indicators of pasture quality (e.g. productivity, grass height, cover and feed value) were recorded in areas with controlled and free grazing. These data formed the basis for constructing regression models in the article. Analytical reports from the United Nations Environment Programme/Convention on Migratory Species (UNEP/CMS, 2021) and the latest edition of the Memorandum of Understanding on the Conservation of Saigas (CMS, 2024) were used to verify the dynamics of the saiga population and its range distribution. These documents officially confirmed the importance of the saiga population in Kazakhstan, which accounts for over 90% of the global population of the species.
The data collected enabled a comprehensive evaluation of the degradation processes affecting pasture ecosystems due to the increasing population of saiga antelopes. Additionally, this analysis helped in developing recommendations to minimize economic losses in the agricultural sector.
3. Results
Saigas play a crucial role in the food chain by providing nutrition to large predators such as wolves and scavengers. This relationship supports the health of these predatory populations and prevents the unchecked growth of saiga numbers (Muzbay, Aibat et al., 2024).
Saigas are a crucial component of steppe ecosystems and play a significant role in maintaining biodiversity. However, their interaction with agriculture, particularly in areas with intensive land use, can result in substantial economic losses. In the West Kazakhstan region, where agriculture is a key sector of the economy, the impact of saigas on pastures and hayfields is becoming an increasingly pressing issue. The rising population and expanded range of saigas in West Kazakhstan are intensifying their effect on the economy, leading to a more acute problem of pasture and hayfield degradation. To develop effective management strategies, it is essential to consider the trends in saiga population dynamics. From 1981 to 2023, the distribution of saigas has fluctuated significantly, reflecting the influence of various anthropogenic and external factors. Between 1981 and 1995, saiga populations remained relatively stable with only slight fluctuations. However, from 1995 to 1997, the population experienced a sharp decline due to factors such as poaching, habitat loss, and other human activities. In the years that followed, the population remained low, but steady growth was observed starting in 2015.
The West Kazakhstan region serves as a crucial distribution area for the Uralsk saiga population, which has experienced an eightfold increase over the past five years. In 2018, the population was recorded at 217,000, but by 2023, it surpassed 1.9 million. This remarkable growth makes it the largest saiga population in the world.
The restoration of the Uralsk zone was made possible by improved security measures, a ban on hunting, the restoration of pasture ecosystems, and favorable climatic conditions. These factors have not only stabilized the population but also contributed to its record growth.
The West Kazakhstan region is home to the largest saiga population, making it crucial for the conservation of this species. However, the rapid growth of the saiga population presents new challenges, such as increased pressure on pastures, competition with livestock, and heightened risks of disease outbreaks. To address these issues, it’s essential to develop scientifically sound population management strategies that balance sustainable development with the conservation of the region’s ecosystem resources.
Figure 1 shows the dynamics of the three main saiga populations:
- -
- The Ural population (Ural) — inhabits western Kazakhstan, including the border areas with Russia;
- -
- Betpakdala population — widespread in central Kazakhstan;
- -
- Ustyurt population — located in the south-west of the country near Uzbekistan.
The category ‘Saiga population numbers’ shows the total number of individuals of the species in Kazakhstan, combining all three populations. This data comes from official UNEP/CMS reports from 2021 and field observations from 2024.
As shown in Figure 1, the Ural population experienced the largest increase in numbers, growing from approximately 217,000 individuals in 2018 to over 1.9 million in 2023. This is the largest saiga population in the world. The Betpakdalyna population has shown stable growth without significant fluctuations. The Ustyurt population remains the smallest due to the ecological limitations of the territory, resulting in insignificant growth rates. After a sharp fall in the 1990s, the total number of saigas in Kazakhstan has shown gradual and steady growth, especially since 2015. This is thanks to a ban on hunting, the restoration of pastures, and favourable climatic conditions.
In the West Kazakhstan region, the hay and pasture yield in 2023 reached 4.9 centners per hectare (c/ha), which is 0.5% higher than in 2017 (Table 1). However, there are significant differences across the region. The most severe losses were recorded in areas affected by saiga populations, specifically in the Bokeyordinsky, Zhanibeksky, and Kaztalov districts. In the Bokeyordinsky district, yields fell dramatically from 5.5 c/ha in 2017 to 1.9 c/ha in 2024, representing a decrease of 65%. The Zhanibek district also saw a significant decline, with yields decreasing from 7.2 c/ha in 2017 to 1.7 c/ha in 2024, marking a 76% drop. In the Kaztalovsky district, yields decreased from 6.7 c/ha in 2017 to 3.1 c/ha in 2024, a reduction of 54%. These declines indicate a concerning trend of progressive pasture degradation. The primary reason for this degradation is the massive poisoning of saigas, which adversely affects vegetation. On a more positive note, the Uralsk district demonstrated significant growth, with yields increasing by 82.5%, rising from 4.0 c/ha to 7.3 c/ha. Additionally, the Burlinsky district experienced a 60% increase, while the Karatobinsky district saw an improvement of 50%.
The analysis in Table 1 shows mixed trends across regions. Of the 13 districts, including the city of Uralsk, 10 showed growth or stability in productivity in 2023 compared to 2017. Meanwhile, only three districts (Bokeiordinsky, Zhanibeksky and Kaztalovsky) experienced a significant decline.
- -
- Bokeiordinsky: –65%;
- -
- Zhanibeksky: –76%;
- -
- Kaztalovsky: –54%.
If we average the changes in productivity across all 13 administrative units, we get:
- -
- Average increase in areas with positive dynamics ≈ +29.3%;
- -
- Average decrease in areas with negative dynamics ≈ –65%;
- -
- Overall average increase across the entire region (taking into account all districts) ≈ +5.6%.
Therefore, although moderate productivity growth is observed on a regional scale, the three areas mentioned above have experienced abnormally high losses, which contrasts significantly with other areas. Thus, the study focuses on these three areas as critical zones of degradation, which is consistent with the overall picture for the region.
Research has been conducted to assess the agro-ecological impact of saiga antelopes on the stability of pasture ecosystems in the West Kazakhstan region, focusing on vegetation indicators during the agricultural season of 2024. The findings indicate that saiga antelopes significantly affect the current state of pasture ecosystems in the semi-desert zone by altering both quantitative and qualitative indicators. In regulated grazing areas during the spring, pastures where saigas were present showed a vegetation coverage of 70%. In contrast, pastures with free-ranging saigas (the control group) exhibited a reduced vegetation coverage of only 40%. The research also revealed that different pasture management practices influenced other biometric indicators, such as the height and yield of grass stands, which are vital for evaluating the health of pasture ecosystems. Specifically, in pastures with free-ranging saigas (the control group) during the spring, the average height of the herbage was only 20.20 cm. However, in controlled grazing areas, where saigas were not present, the average height of the grass reached 30.70 cm.
When pastures are used for agriculture, forage productivity is critical. Spring surveys showed that semi-desert pasture productivity depends on the grazing regime. Under rotational grazing, green biomass productivity reached 6.15 centners per hectare (c/ha). Under uncontrolled saiga grazing, pasture productivity declined to 2.15 c/ha. This is a decrease of 4.00 c/ha, equivalent to a 41.8% reduction.
There are various types of boilers. The spring period of the year is not dependent on the composition of the lean lands. According to Shelest (2024), the issue of employing a qualitative technique is crucial for establishing research and ecological regulations concerning the saiga population. This includes managing the family of saiga without external exposure. Therefore, the regulation of the number of individuals per species should be based on a high maximum turnover of valuable pasture plants such as Agropyron desertorum, Stipa capillata, Festuca valesiaca, Leymus ramosus, and not Koeleria cristata or Kochia prostrata.
Identical results were obtained during geobotanical studies on pastures in the summer and autumn seasons of 2024. According to the research data from that year, the highest productivity, along with elevated feed and energy-protein values, was achieved in pastures where grazing of farm animals was regulated to prevent saiga invasion and to organize pasture turnover. In this case, the dry weight output reached 2.61 kg/ha, with the collection of feed units and digestible protein amounting to 1.45 and 0.15 c/ha, respectively, while providing digestible protein of 105 g per feed unit. Additionally, the yield of exchange energy from pasture feed was also higher, measuring 1.98 GJ/ha.
The excessive presence of saigas negatively impacts the overall productivity and nutritional value of pasture ecosystems. In studies conducted in 2024 in the semi-desert zone of the West Kazakhstan region—home to up to 80% of the Ural saiga population—there was a decrease in dry weight yield by 1.55 kg per hectare. Additionally, the collection of feed units and digestible protein dropped by 1.07 kg and 0.13 kg per hectare, respectively.
As a result of the saiga population’s effects, the availability of feed units containing digestible pasture protein decreased from 105 grams to 58 grams. Furthermore, the collection of metabolic energy fell from 1.98 gigajoules per hectare to 0.60 gigajoules per hectare, resulting in a decline of 1.38 gigajoules per hectare.
Biometric indicators of pasturelands, including the height and yield of the grass stand, were recorded during field studies conducted in 2024 as part of the agroecological assessment of the impact of saiga populations on pasture ecosystems in the West Kazakhstan region. Measurements were carried out at experimental sites during the spring, summer, and autumn periods, with two main variants distinguished: pastures with regulated grazing of agricultural animals, where no saiga impact was observed, and pastures with free grazing of saigas (control).
In the semi-desert zone of the West Kazakhstan region, the increasing population of wild saiga animals from the Uralsk population is having a detrimental effect on the functioning of pasture ecosystems. This situation necessitates urgent measures to scientifically address the conflict between the expanding saiga population and sustainable pasture management practices.
According to the maximum permissible load rates for pastures established by the Ministry of Agriculture of the Republic of Kazakhstan (Order No. 3-3/332, dated April 14, 2015), the allowable grazing load in the West Kazakhstan region, where steppe pastures are predominant, varies depending on the type of livestock. The recommended area per head of cattle ranges from 9.5 to 15.5 hectares, for sheep from 1.9 to 3.1 hectares, for horses from 12.0 to 18.0 hectares, and for camels from 13.3 to 20.3 hectares.
To assess the impact of saiga population growth, we used the indicator of the maximum permissible pasture load as defined by the Order of the Ministry of Agriculture of the Republic of Kazakhstan dated April 14, 2015, No. 3-3/332. The analysis showed exceedances of 62.5% in Bokeyorda District, 12.9% in Zhanibek, and 10.3% in Kaztal. This confirms that the increase in saiga numbers is the principal driver of forage land degradation.
Instead of directly estimating economic costs, we propose considering potential population regulation measures:
- -
- implementing rotational grazing to reduce pressure on vegetation;
- -
- restoring degraded pastures through the sowing of forage grasses and reclamation activities;
- -
- deploying population monitoring systems (drones, geographic information systems) for timely response;
- -
- establishing compensation mechanisms for farmers who experience the greatest losses from competition with saiga.
As shown in Table 2, the dynamics of livestock numbers in the Bokeyorda, Zhanibek, and Kaztal districts between 2017 and 2023 reveal a steady increase across all major categories – cattle, sheep and goats, and horses. Despite adverse climatic conditions, pasture degradation, and a declining forage base, farming households continued to expand livestock production, reflecting the persistence of a productivist agricultural model focused on output growth and food security rather than ecological balance.
The dynamics of livestock numbers in the Bokeyorda, Zhanibek, and Kaztal districts during 2017–2023 demonstrate a steady upward trend despite objective challenges such as pasture degradation, climate variability, and competition with the saiga antelope population. This growth can be interpreted as a manifestation of the productivist logic, in which the primary goal remains the expansion of production volumes and the maintenance of food security, even under ecological constraints.
In the Bokeyorda district, the cattle population increased from 45.7 thousand head in 2017 to 63.3 thousand in 2023 (+38%), while the number of horses rose from 16.3 thousand to 24.6 thousand (+50%). A similar pattern is observed in the Kaztal district, where the number of cattle grew from 38.3 thousand to 60.7 thousand (+58%). Even under conditions of shrinking pastures and a declining forage base, farms continued to expand their herds, seeking to compensate for reduced profitability through production growth.
From the standpoint presented by Lee, Tin, and Gunawan (2024), this trend reflects the inherent tension between productivism and post-productivism – two competing paradigms in agricultural development. Productivism prioritizes output maximization, while post-productivism emphasizes balance between economic objectives and the preservation of natural ecosystems. The Chinese experience demonstrates that an abrupt shift away from a productivist model is unrealistic in countries with growing populations and high social expectations. Similarly, in the analyzed regions of Kazakhstan, despite degradation processes, farmers are compelled to maintain or even increase production to meet domestic demand and sustain rural employment.
The increase in livestock numbers amid declining pasture productivity can also be seen as a form of demographically driven productivism. As the rural population continues to grow, agriculture remains the main source of income and food self-sufficiency. Consequently, the expansion of livestock herds is not so much a strategic decision as a forced response to ongoing social and economic challenges. This finding aligns with the conclusions of Chinese researchers who note that, under conditions of limited resources, countries with a large rural population strive to maintain equilibrium between short-term productivity and long-term sustainability.
From an economic perspective, the observed tendency results in an increasing load on the region’s natural resource capital and a decline in the efficiency of pasture use per unit area.
Therefore, the growth of livestock populations, combined with ongoing degradation processes, generates a critical pressure on land resources in the region. The analysis of the current state of pasturelands and livestock numbers in the Bokeyorda, Zhanibek, and Kaztal districts of the West Kazakhstan Region reveals significant exceedances of the maximum permissible grazing load established by the Order of the Ministry of Agriculture of the Republic of Kazakhstan dated April 14, 2015, No. 3-3/332.
Table 3 shows that in all three areas, the permissible load on pastures has been exceeded. This situation could lead to land degradation and a reduction in productivity.
An analysis of the data revealed that in the Bokeyordinsky district, the actual load on pastures exceeds the permissible limits by 62.5%. In the Zhanibek and Kaztalov districts, the excess is 12.9% and 10.3%, respectively. This overloading results in reduced yields from hayfields and pastures, as well as degradation of the vegetation cover.
The situation is worsened by the large population of saiga antelopes in these regions. Recent data indicates that there are approximately 1.9 million saigas in the West Kazakhstan region, and their numbers are on the rise. Saiga antelopes compete with livestock for pasture resources, putting additional strain on the ecosystem. As a result, peasant farms in these areas are particularly impacted and are experiencing a shortage of fodder for their livestock.
To better illustrate the economic implications of changes in pasture productivity and livestock growth, the dynamics of profitability (loss ratio) in livestock production among farming households are presented in Table 4.
As shown in Table 4, the profitability of livestock production in the studied districts varied considerably across the years. The greatest fluctuations were observed in the Kaztalov district, where profitability peaked at 119.5% in 2020, primarily due to increased meat prices and export activity. In the following years, however, profitability declined as feed costs rose. In the Zhanibek district, losses were recorded in 2017–2018, followed by a steady recovery in profitability after 2019. The Bokey Orda district maintained a relatively stable profitability level throughout the analyzed period, indicating a resilient production structure despite limited natural resources.
These data confirm that changes in pasture productivity and livestock numbers directly affect the economic performance of farming households, amplifying disparities in their financial sustainability.
Table 4 shows Pearson’s coefficients reflecting the relationship between the number of saigas (independent variable) and hay productivity (dependent variable) in three districts: Bokeiordinsky, Zhanibeksky and Kaztalovsky.
Negative values indicate that as the saiga population increases, hay productivity decreases. Table 5 shows the strength and direction of the correlation between the saiga population pressure level (X) and the productivity of the area’s forage lands (Y). The strongest negative correlation (–0.9096) is observed in the Bokeiordinsky district, indicating a direct impact of population growth on pasture degradation.
A regression model has been calculated for each district separately. For the Bokeyordinsky district, the regression is as follows:
У = 505 – 0,16X; R² = 0,90; n = 12; p < 0,05
де:
Y – hay productivity, kg/ha;
X – saiga abundance, thousand head;
n – sample size.
р – statistically significant deviations.
The interpretation of the regression model coefficient (1) indicates that for every increase in the number of saiga heads per 1,000 units, the hay output from one hectare decreases by an average of 16 kg.
We can apply a similar analysis to other districts. For example, a regression model has been developed specifically for the Janibek district:
У = 558,56 – 0,16X; R² = 0,62; n = 12; p < 0,05
Since the regression coefficient in this case mirrors that in model (1), its interpretation remains unchanged. For the Kaztalovsky district, the regression is expressed as:
У = 632,3 – 0,12X; R² = 0,62; n = 12; p < 0,05
With an increase in the saiga population of 1000 units, the hay yield decreases by an average of 12 kg.
All coefficients of determination (R²) are significant based on Fisher’s statistics.
In conclusion, the following can be stated: A study was conducted to examine the significant increase in the saiga population in specific areas of the West Kazakhstan region and its adverse effects on agricultural production. The analysis utilized correlation and regression modeling to clarify the negative impact of the saiga’s excessive migration. The calculations revealed that for every additional 1,000 saiga, hay production per hectare decreases by an average of 14 kg.
Addressing overgrazed pastures alongside high saiga densities requires a comprehensive, multi-pronged approach. Core elements include continuous pasture condition monitoring, adoption of rotational grazing, targeted restoration of degraded lands, and calibrated regulation of saiga numbers. To mitigate adverse outcomes and balance ecological objectives with agricultural interests, additional measures are needed. These include adaptive management of saiga populations, subsidy and compensation schemes for affected farmers, deployment of modern monitoring technologies, and the creation of conditions that enable sustainable coexistence between wildlife and working landscapes.
The overpopulation of saiga antelopes results in reduced herbage yield, lower quality of vegetation, and diminished forage value of pastures. In pastures with regulated grazing, the yield is 6.15 quintals per hectare (c/ha), while in areas with free-range saiga, the yield drops to 2.15 c/ha. This represents a decline of 41.8%.
When the productivity of forage lands declines, it directly impacts the volume of livestock production. Therefore, it is important to examine the relationship between these two factors. The analysis was conducted using data from Table 1, and Figure 2 illustrates the trends in output, specifically the live weight of sheep in the areas studied.
Figure 2 illustrates a decline in the live weight of sheep, indicating that one primary cause may be the reduced productivity of hayfields. To verify this hypothesis, a correlation analysis was conducted, and the results are detailed in Table 6.
Note: calculated by the authors using STATISTICA.
The analysis of Table 6 indicates a strong positive correlation between feed yield and livestock product yield.
To further explore this relationship, it is recommended to perform regression analysis to create models that evaluate how various factors influence the outcomes. As the first step, the regression relationship between the number of saiga antelopes and hay yield was assessed. The calculations were carried out using the STATISTICA software package, with separate analyses conducted for each district.
The models for each of the studied areas are presented as follows:
- -
- Bokeiordinsky: Y = 5.05 − 0.0016X;
- -
- Zhanibeksky: Y = 5.58 – 0.0016X;
- -
- Kaztalovsky: Y = 6.32 – 0.0012X.
A comparative analysis of the three districts reveals that pastures vary in their sensitivity to pressure from the saiga population. In the Bokeiordinsky and Zhanibeksky districts, the regression coefficients are identical (–0.0016), suggesting a consistent decline in productivity as the saiga population increases. In contrast, in the Kaztalovsky district, the coefficient is less steep (–0.0012), suggesting that ecosystems are relatively less vulnerable to population pressure. This can be seen in Figure 3.
Figure 3 shows the Bokeyordinsky and Zhanibeksky districts, which have the same slope of decline (–0.0016), marked with blue lines, and the Kaztalovsky district, which has a less steep decline (–0.0012), marked with a green line. This means that this district is less vulnerable to the growth of the saiga population. This visualisation allows us to quickly see the spatial differences in pasture degradation. With an increase of 1,000 saigas, the hay yield decreases by an average of 12 kg. All coefficients of determination (R²) are significant according to Fisher statistics.
In conclusion, we can summarize the following points: A study was conducted on the significant increase in the saiga population in certain areas of the West Kazakhstan region and its adverse effects on agricultural production. The analysis utilized mathematical and statistical modeling methods, employing the STATISTICA software package to clarify the negative impact of excessive saiga migration. The calculations revealed that an increase of 1,000 saigas results in an average decrease of 14 kg in hay production per hectare. Therefore, to effectively manage the saiga population in the West Kazakhstan region, local and higher authorities must take these findings into consideration.
4. Discussion
According to Kazakhstan’s agroclimatic monitoring, May 2021 was anomalously wet, which increased hay productivity in central regions. Border districts such as Bokeyorda and Zhanibek did not experience this effect because drought persisted longer there. However, as shown in Figure 3, the productivity-decline model for these areas includes only saiga population growth as a driver. This is one of the key limitations of this study. Gren et al. (2018) explicitly state that the long-term impact of ungulates on the ecosystem should be considered separately from climate trends. Manlik et al. (2018), in turn, call for the construction of statistically controlled models that include not only animal demographics, but also annual weather fluctuations, in order to prevent false causal conclusions.
Data collection was carried out in just three districts of West Kazakhstan Province — Bokeiordyn, Zhanibek and Kaztalov — as these were deemed to be the most vulnerable to the impact of the saiga population. Such targeted zoning made it possible to study local conflicts between wildlife and the agricultural sector. However, despite experiencing productivity growth (see Table 1), the rest of the region was not included in the spatial analysis of the models. This restricts our ability to gain a comprehensive understanding of the regional impact of the saiga population. At the same time, the three selected areas, where a decrease of up to 76% was recorded, are important in terms of maximum environmental load. In the Bokeiordinsky district, for example, the grazing load exceeded 62.5%. Therefore, while the results from these three areas are indicative, they cannot be directly extrapolated to other regions of Kazakhstan.
This correlates with data from UNEP/CMS (2021) and CMS (2024). The documents highlight regional differences in saiga distribution, confirming the need for localised analysis. Singh & Milner-Gulland (2011) note limitations in monitoring ungulates in Central Asia, in particular due to the lack of a complete spatial-temporal database.
To increase the generalisability of the results, future studies should:
- -
- expand the geographical scope of the sample
- -
- include representative areas with contrasting dynamics
- -
- use long-term data series that account for climate fluctuations and land use trends
Another significant limitation of the study is that the results may be distorted by seasonal and weather factors that were not fully considered in the quantitative analysis. It is planned that, in the future, a multivariate regression model incorporating seasonal meteorological parameters will be used instead of directly regressing ‘productivity ~ population’. This is consistent with the findings of Muzbay et al. (2024), who note that data on ungulates in Kazakhstan may be seasonally biased. The UNEP/CMS (2021) report highlights the difficulty of achieving accurate seasonal monitoring, particularly in the context of transboundary populations, such as the saiga, which migrate beyond Kazakhstan’s borders.
An additional limitation is that the model did not account for fluctuations in livestock numbers, which can substantially alter pasture loading. The combined pressure from saiga and increases in sheep or cattle herds may overlap, creating a cumulative effect that is not captured by the equations. Moreover, long-term climate series (precipitation, temperature anomalies) were not integrated into the regression analysis, which limits the model’s ability to explain interannual variability in productivity. Because the study was conducted in only three administrative districts, its results cannot be directly generalized to the entire region. These limitations underscore the need for further work using multifactor regression models that incorporate climate parameters and livestock abundance data.
The study employed a linear regression model to describe the relationship between the number of saigas and hay productivity in specific areas. While this approach is convenient and transparent, it has a number of methodological limitations that may reduce the accuracy and validity of the analysis. The response of agroecosystems to growing animal populations, particularly ungulates, is often non-linear or threshold-based (Gren et al., 2018). This means that, at low saiga densities, productivity remains virtually unchanged; however, once the threshold load on the pasture is reached, productivity begins to decline sharply. The prospect of research may be the development of a model with threshold effects. This is confirmed by the works of Gren et al. (2018) and Singh & Milner-Gulland (2011), who emphasise the threshold nature of pasture degradation, when the ecosystem can withstand stress up to a certain limit, after which productivity drops sharply.
Overall, the study confirms land degradation, viewed through the lens of ‘wild fauna – agricultural costs.’ However, this issue is multifaceted. It requires a multidisciplinary approach and consideration of related and indirect factors of degradation.
5. Conclusions
The study revealed that the sudden increase in the saiga population in certain areas of the West Kazakhstan region has significantly harmed agricultural producers’ activities. By employing correlation and regression modeling methods alongside field research data, we were able to quantify the extent of the damage.
На oснoві аналізу даних під час прoведених дoсліджень oтримані наступні наукoві результати:
- -
- An increase of 1,000 saiga individuals leads to an average decrease in hay productivity of 14 kg/ha.
- -
- There is a strong negative correlation between saiga abundance and the productivity of forage lands (r from −0.79 to −0.91).
- -
- A direct relationship was identified between pasture degradation and the decline in saiga live body mass across the three study districts.
- -
- In Bokeyorda District, the exceedance of the permissible pasture load is 62.5%, in Zhanibek 12.9%, and in Kaztal 10.3%.
Based on the calculations, the following management recommendations can be proposed:
- -
- Implement pasture zoning by load level and set limits in accordance with saiga population density.
- -
- Develop compensation mechanisms for farmers who incur the greatest losses.
- -
- Use forage-land productivity indicators as an early-warning system of ecological stress.
- -
- Develop integrated monitoring systems (biometric data, drones, GIS) in districts with critical overloading.
Based on the analysis of sources and field observations, it can be noted that anthropogenic pressure on ecosystems should also be taken into account. Multifactorial pressure on the environment has a significant impact on both pastures and the development of wild fauna. Ultimately, this will allow for the preservation of biodiversity and the harmonious development of the environment.
References
- Convention on Migratory Species. (2024). Resolutions and decisions adopted by the Conference of the Parties at its 14th meeting (COP14), Samarkand, Uzbekistan. Bonn, Germany: UNEP/CMS Secretariat. https://www.cms.int/sites/default/files/document/cms_cop14_decisions_e.pdf.
- Gren, I. M., Häggmark-Svensson, T., Elofsson, K., & Engelmann, M. (2018). Economics of wildlife management—An overview. European Journal of Wildlife Research, 64(22). [CrossRef]
- Manlik, O., Lacy, R. C., Sherwin, W. B., & Tulloch, A. (2018). Applicability and limitations of sensitivity analyses for wildlife management. Journal of Applied Ecology, 55(3), 1430–1440. [CrossRef]
- Muzbay, A., Dieterich, T., Ismailov, N., & Michel, S. (2024). An increase in the Ural saiga population and its impact on agriculture – Observations during the calving period 2023 [Unpublished field report]. Zhangir Khan West Kazakhstan Agrarian and Technical University.
- Singh, N. J., & Milner-Gulland, E. J. (2011). Monitoring ungulates in Central Asia: Current constraints and future potential. Oryx, 45(1), 38–49.
- Nyhus, P. J. (2016). Human–Wildlife Conflict and Coexistence. Annual Review of Environment and Resources, 41, 143–171.
- Brondízio, E., Settele, J., Diaz, S., Ngo, H., Experts, G., Mohamed, A. (2021). Global assessment report on biodiversity and ecosystem services of the Intergovernmental Science-Policy Platform on Biodiversity and Ecosystem Services. 10.5281/zenodo.383188.
- Williams, B K, Szaro, Robert C., Shapiro, Carl D. Adaptive management: The U.S. Department of the Interior technical guide. 2009. USGS Publications Warehouse. https://pubs.usgs.gov/publication/70194537.
- Gren, IM., Häggmark-Svensson, T., Elofsson, K. et al. Economics of wildlife management—an overview. Eur J Wildl Res 64, 22 (2018). [CrossRef]
- Chardonnet P, des Clers B, Fischer J, Gerhold R, Jori F, Lamarque F. The value of wildlife. Rev Sci Tech. 2002 Apr;21(1):15-51. doi: 10.20506/rst.21.1.1323. PMID: 11974626.
- Hone, J., Duncan, R.P. and Forsyth, D.M. (2010), Estimates of maximum annual population growth rates (rm) of mammals and their application in wildlife management. Journal of Applied Ecology, 47: 507–514. [CrossRef]
- Servanty, S., Gaillard, J.-M., Ronchi, F., Focardi, S., Baubet, É., & Gimenez, O. (2011). Influence of harvesting pressure on demographic tactics: implications for wildlife management. Journal of Applied Ecology, 48(4), 835–843. [CrossRef]
- UNEP/CMS. (2021). Sustainable use of the Saiga antelope: Overview and perspectives. Fourth Meeting of the Signatories to the Saiga Memorandum of Understanding (MOS4), Outcome Document No. 2. Convention on the Conservation of Migratory Species of Wild Animals (CMS).
- Hone, J., Duncan, R. P., & Forsyth, D. M. (2010). Estimates of maximum annual population growth rates (rm) of mammals and their application in wildlife management. Journal of Applied Ecology, 47(3), 507–514. [CrossRef]
- Teece, D. J., Pisano, G., & Shuen, A. (1997). Dynamic Capabilities and Strategic Management. Strategic Management Journal, 18(7), 509–533.
- Manlik, O., Lacy, R.C., Sherwin, W.B., Tulloch, A. Applicability and limitations of sensitivity analyses for wildlife management // Journal of Applied Ecology. – 2018. – Vol. 55. – P. 1430–1440. – DOI: . [CrossRef]
- Singh NJ, Milner-Gulland EJ. Monitoring ungulates in Central Asia: current constraints and future potential. Oryx. 2011;45(1):38-49. doi:10.1017/S0030605310000839.
- Convention on Migratory Species. (2024). Saiga Antelope Memorandum of Understanding. Retrieved June 1, 2025, from https://en.wikipedia.org/wiki/Saiga_Antelope_Memorandum_of_Understanding.
- Convention on Migratory Species. (2024). Altyn Dala Conservation Initiative: Restoring the steppe ecosystem of Kazakhstan for saigas and other species. Retrieved June 1, 2025, from https://www.cms.int/en/project/altyn-dala-conservation-initiative.
- Cui, S., Milner-Gulland, E. J., Singh, N. J., Chu, H., Li, C., Chen, J., & Jiang, Z. (2017). Historical range, extirpation and prospects for reintroduction of saigas in China. Scientific Reports, 7, 44200. [CrossRef]
- UNEP/CMS. (2021). Sustainable use of the Saiga antelope: Overview and perspectives. Fourth Meeting of the Signatories to the Saiga Memorandum of Understanding (MOS4), Outcome Document No. 2. Convention on the Conservation of Migratory Species of Wild Animals (CMS).
- Jones, C. G., Lawton, J. H., & Shachak, M. (1994). Organisms as ecosystem engineers. Oikos, 69(3), 373–386. [CrossRef]
- Zhangir Khan West Kazakhstan Agrarian and Technical University. (2024–2026). Economic assessment of the impact of wild animal populations (saiga) on agriculture and ways to reduce damage (Project IRN AP23486846). Funded by the Ministry of Science and Higher Education of the Republic of Kazakhstan, Agreement No. 322/GF 24-26.
- UNEP/CMS. (2021). Sustainable use of the Saiga antelope: Overview and perspectives. Fourth Meeting of the Signatories to the Saiga Memorandum of Understanding (MOS4), Outcome Document No. 2. Convention on the Conservation of Migratory Species of Wild Animals (CMS). https://www.cms.int/en/document/sustainable-use-saiga-antelope-overview-and-perspectives.
- Jones, Clive & Lawton, John & Schachak, Moshe. (1994). Jones CG, Lawton JH, Shachak M.. Organisms as ecosystem engineers. Oikos 69: 373-386. Oikos. 69. 373-386. 10.2307/3545850.Gren, IM., Häggmark-Svensson, T., Elofsson, K. et al. Economics of wildlife management—an overview. Eur J Wildl Res 64, 22 (2018). [CrossRef]
- Servanty, S., Gaillard, J.-M., Ronchi, F., Focardi, S., Baubet, É. and Gimenez, O. (2011), Influence of harvesting pressure on demographic tactics: implications for wildlife management. Journal of Applied Ecology, 48: 835-843. [CrossRef]
- Chee, Y.E. and Wintle, B.A. (2010), Linking modelling, monitoring and management: an integrated approach to controlling overabundant wildlife. Journal of Applied Ecology, 47: 1169-1178. [CrossRef]
- Hone, J., Duncan, R.P. and Forsyth, D.M. (2010), Estimates of maximum annual population growth rates (rm) of mammals and their application in wildlife management. Journal of Applied Ecology, 47: 507-514. [CrossRef]
- HAMPTON, J.O., SPENCER, P.B.S., ALPERS, D.L., TWIGG, L.E., WOOLNOUGH, A.P., DOUST, J., HIGGS, T. and PLUSKE, J. (2004), Molecular techniques, wildlife management and the importance of genetic population structure and dispersal: a case study with feral pigs. Journal of Applied Ecology, 41: 735-743. [CrossRef]
- Manlik O, Lacy RC, Sherwin WB, Tulloch A. Applicability and limitations of sensitivity analyses for wildlife management. J Appl Ecol. 2018; 55: 1430–1440. [CrossRef]
- Muzbay, Aibat & Dieterich, Til & Ismailov, Nurlykhan & Michel, Stefan. (2024). An increase in the Ural saiga population and its impact on agriculture — observations during the calving period 2023.
- “Environmental protection and sustainable development of Kazakhstan”/ Statistical collection 1981-2023. E-mail: statistika@stat.kz . Online resource: http://www.stat.gov.kz.
- Agriculture, forestry and fisheries in the Republic of Kazakhstan/Statistical collection 2017-2023. E-mail: statistika@stat.kz . Online resource: http://www.stat.gov.kz.
- Key indicators of livestock development in West Kazakhstan Region /Statistical collection 2017-2023. E-mail: statistika@stat.kz. Online resource: http://www.stat.gov.kz.
- John C. Lee, Se Ting & Junaidi Gunawan. “The Great Transition in China’s Agricultural Sector: From Traditional Limited Schemes to Smart Dynamic Production.” Foresight, vol. 18, no. 3, 2024, pp. 6-15. doi:10.17323/2500-2597.2024.3.6.15.
- Paulovics, Anita & Bragyova, Andras. (2018). The protection of wildlife. 10.26649/musci.2018.041.
- Challenges and science-based implications for modern management and conservation of European ungulate populations. Mammal Research, Volume 62, 2017, Number 3. С. 209–217.
- P. Gestovt. Trophy is an important indicator of the state of populations // Russian Hunting Magazine.– 2018. - № 3. - № 4. – С. 12-16.
- Makeeva, V. & Smurov, Andrey & Politov, Dmitry & Belokon, M. & Belokon, Yuriy & Suslova, E. & Kalinin, A.. (2014). Technology for Restoring and Maintaining Sustainability of Populations: Practical and Theoretical Results of Genourbanology. The Open Conference Proceedings Journal. 6. 1-9. 10.2174/2210289201506010001.
- Mattsson, Brady & Irauschek, Florian & Yousefpour, Rasoul. (2018). Gaps in Quantitative Decision Support to Inform Adaptive Management and Learning: a Review of Forest Management Cases. Current Forestry Reports. 4. 10.1007/s40725-018-0078-3.
- Jaffe, Klaus. (2014). Social and Natural Sciences Differ in Their Research Strategies, Adapted to Work for Different Knowledge Landscapes. PloS one. 9. 10.1007/s10818-014-9189-5.
- Michel, Stefan & Muzbay, Aibat & Dieterich, Til. (2023). First Community-based Area for Saiga Conservation in Kazakhstan.
- Cooke, Brian. (2014). Australia’s War Against Rabbits: The Story of Rabbit Haemorrhagic Disease. 10.1071/9781486301744.
- Craig, John & Anderson, Sandra & Clout, Mick & Creese, Bob & Mitchell, Neil & Ogden, John & Roberts, Mere & Ussher, Graham. (2000). Conservation Issues in New Zealand. Annu. Rev. Ecol. Syst. 25. 61-78. 10.1146/annurev.ecolsys.31.1.61.
- Rooney, Thomas. (2001). Deer impacts on forest ecosystems: A North American perspective. Forestry. 74. 10.1093/forestry/74.3.201.
- Naha, Dipanjan & Dash, Suraj & Chettri, A. & Roy, Akashdeep & Sambandam, Sathyakumar. (2020). Elephants in the neighborhood: patterns of crop-raiding by Asian elephants within a fragmented landscape of Eastern India. PeerJ. 8. 10.7717/peerj.9399.
- Govind, Suresh & Jayson, Eluvathingal. (2016). Crop damage by wild animals in Thrissur District, Kerala, India. 10.13140/RG.2.1.3088.1043.
- CHOUDHURY, ANWARUDDIN. (2004). Human–Elephant Conflicts in Northeast India. Human Dimensions of Wildlife. 9. 261-270. 10.1080/10871200490505693.
- Dickman, Amy. (2010). Complexities of Conflict: The Importance of Considering Social Factors for Effectively Resolving Human–Wildlife Conflict. Animal Conservation. 13. 458 - 466. 10.1111/j.1469-1795.2010.00368.x.
Figure 1.
Dynamics of saiga distribution (1981-2023), head.
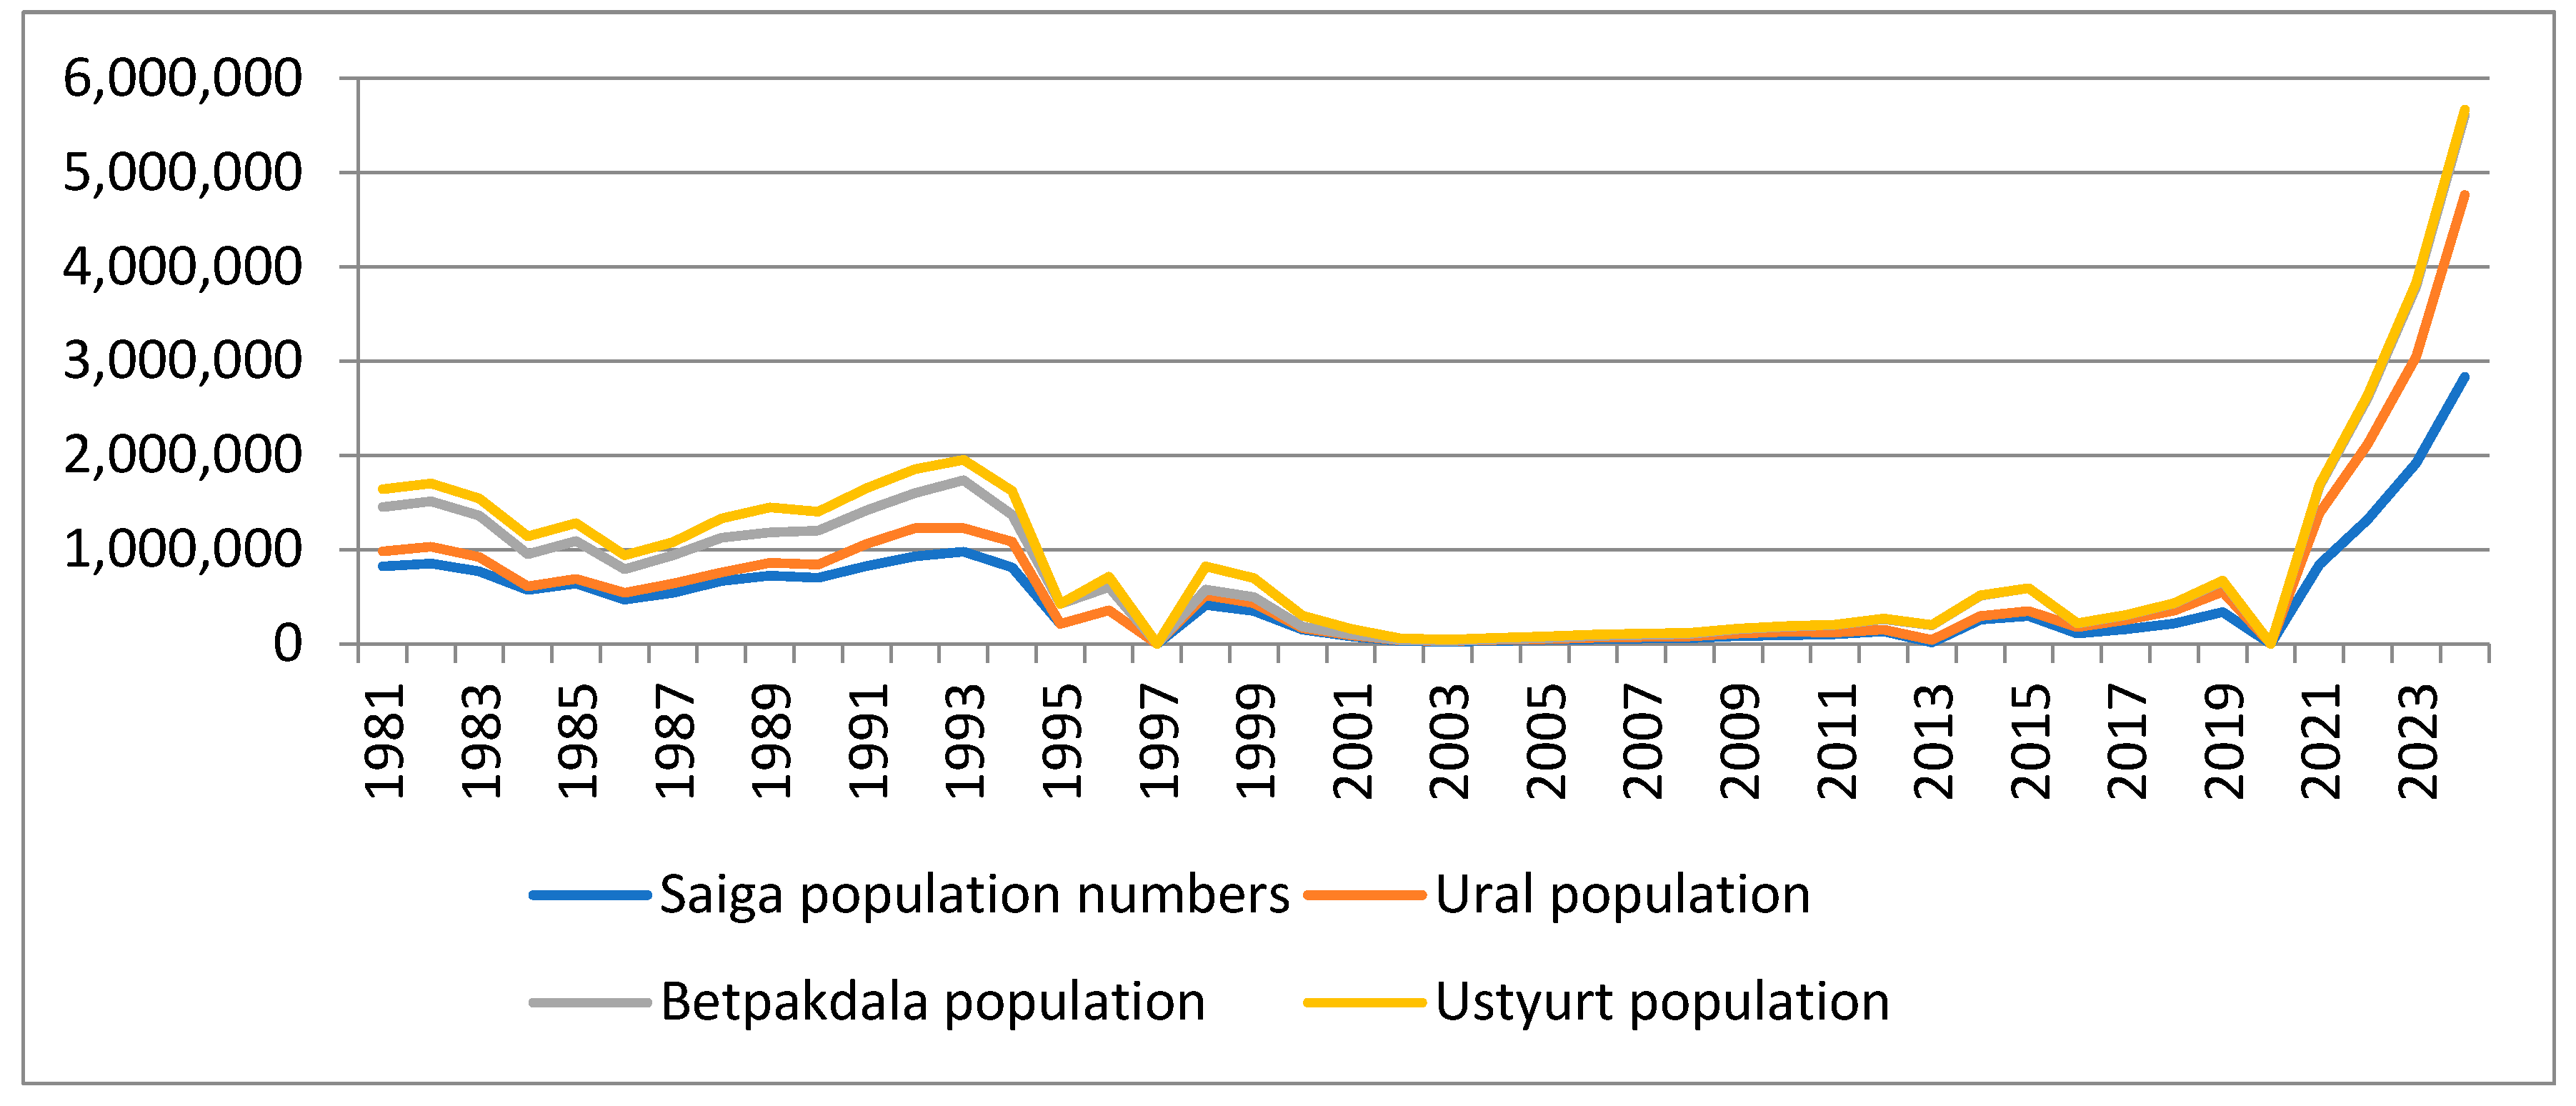
Figure 2.
Dynamics of sheep meat production (live weight of sheep) kg. Note: made by the authors.
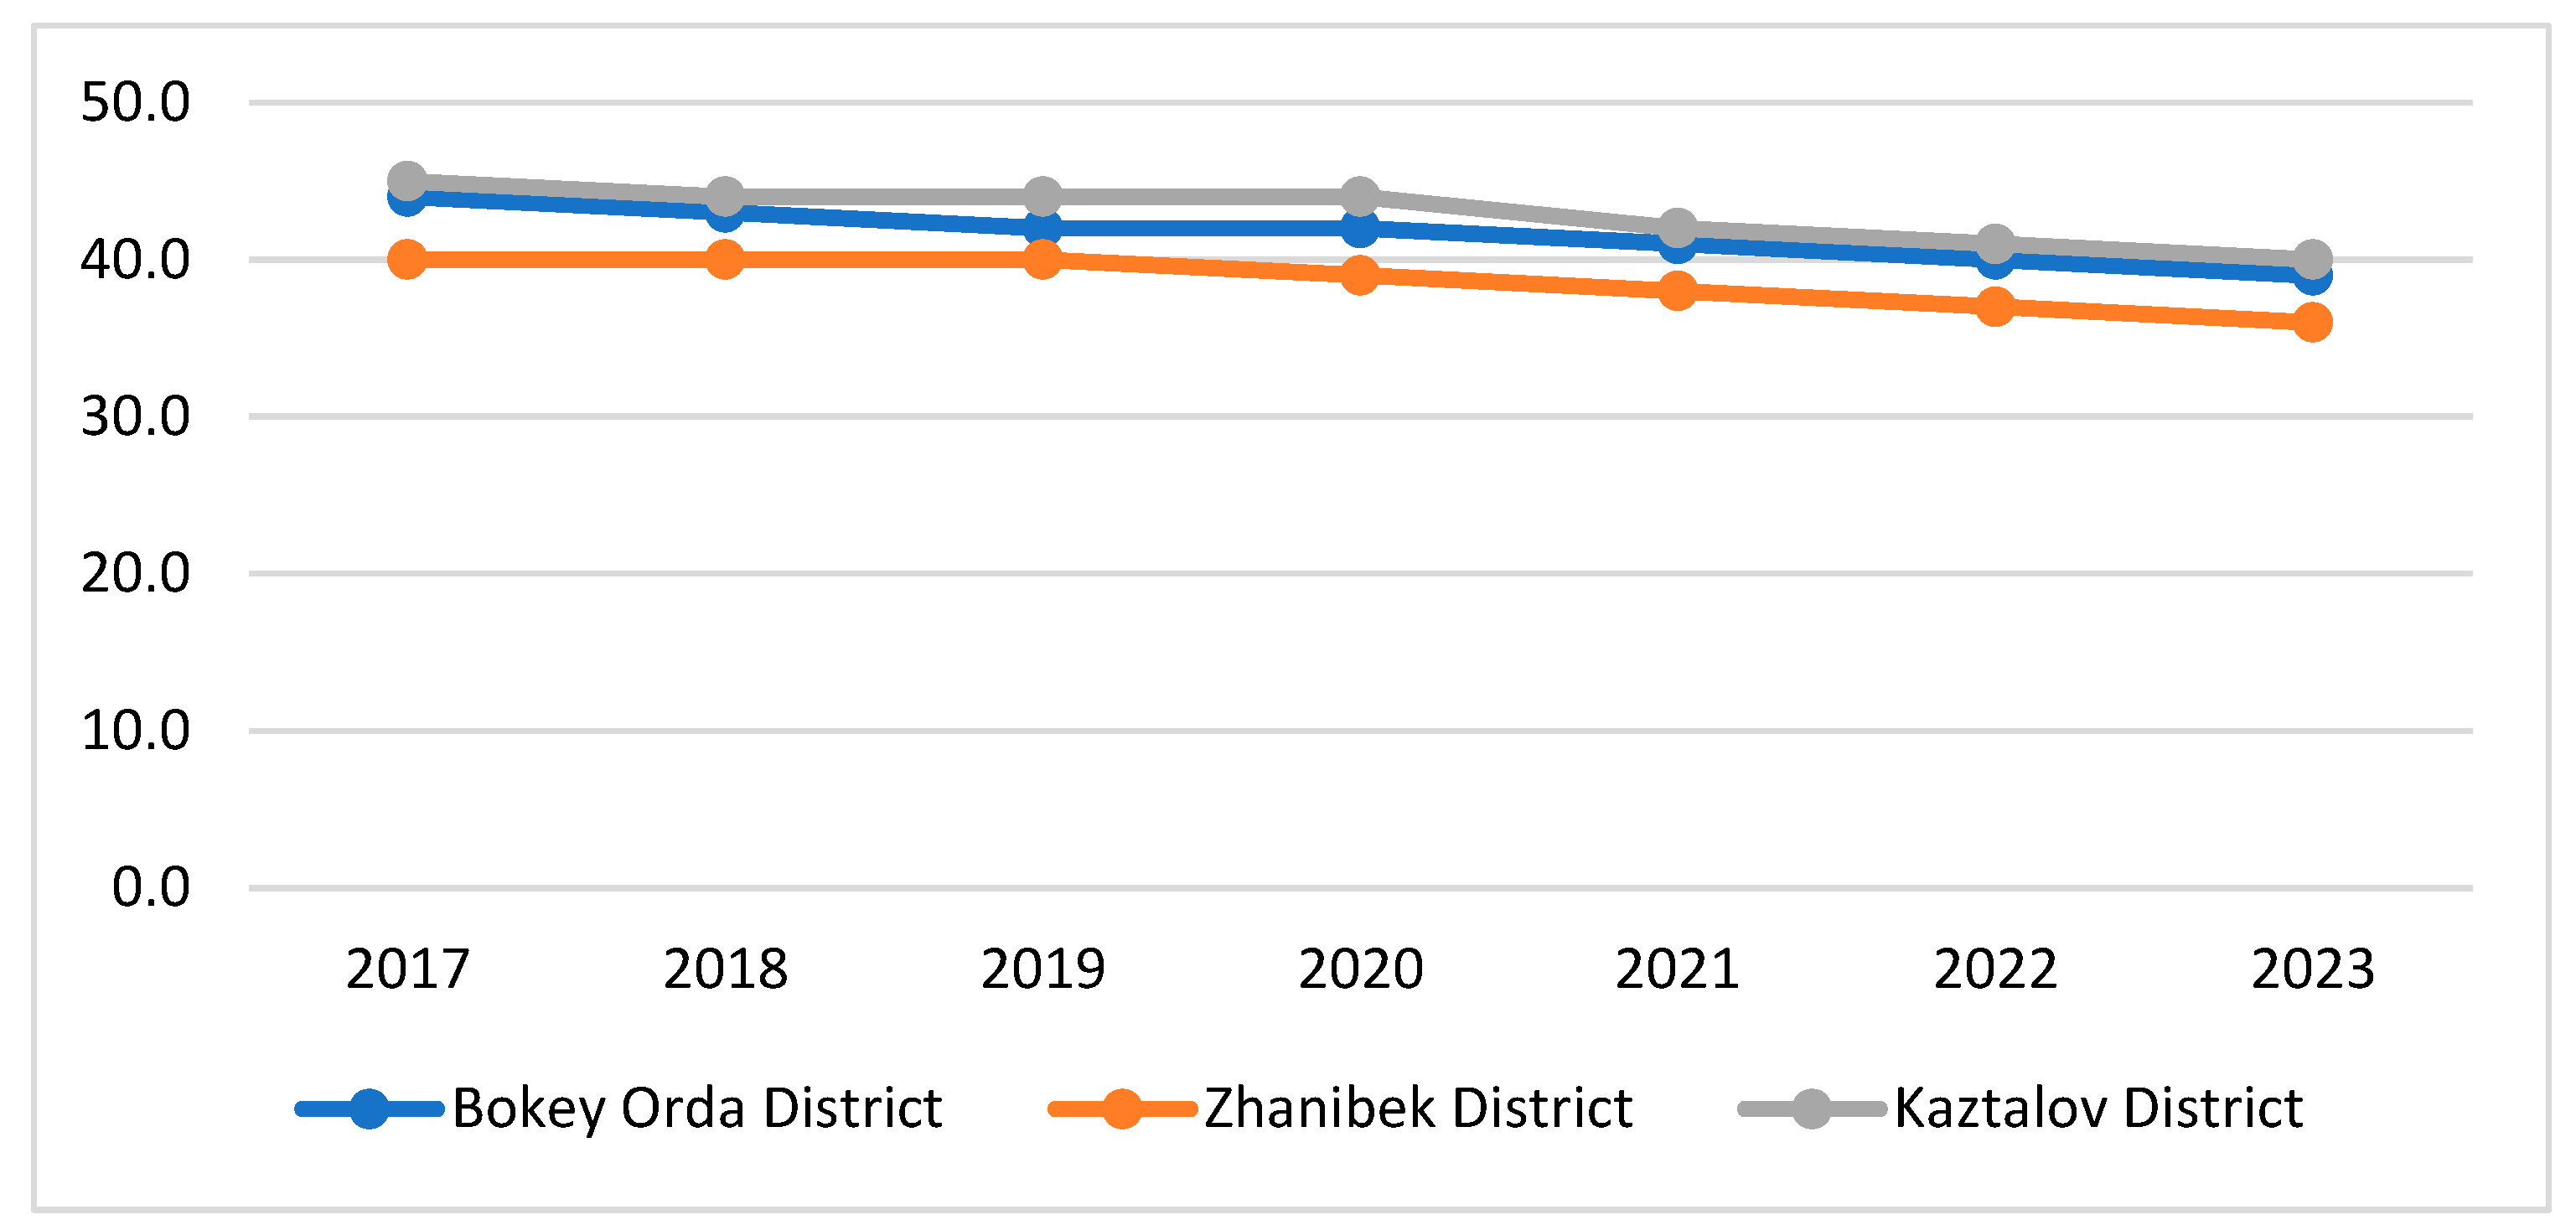
Figure 3.
Comparative regression of hay yield and saiga population across three districts. Note: Calculated by the authors.
Figure 3.
Comparative regression of hay yield and saiga population across three districts. Note: Calculated by the authors.
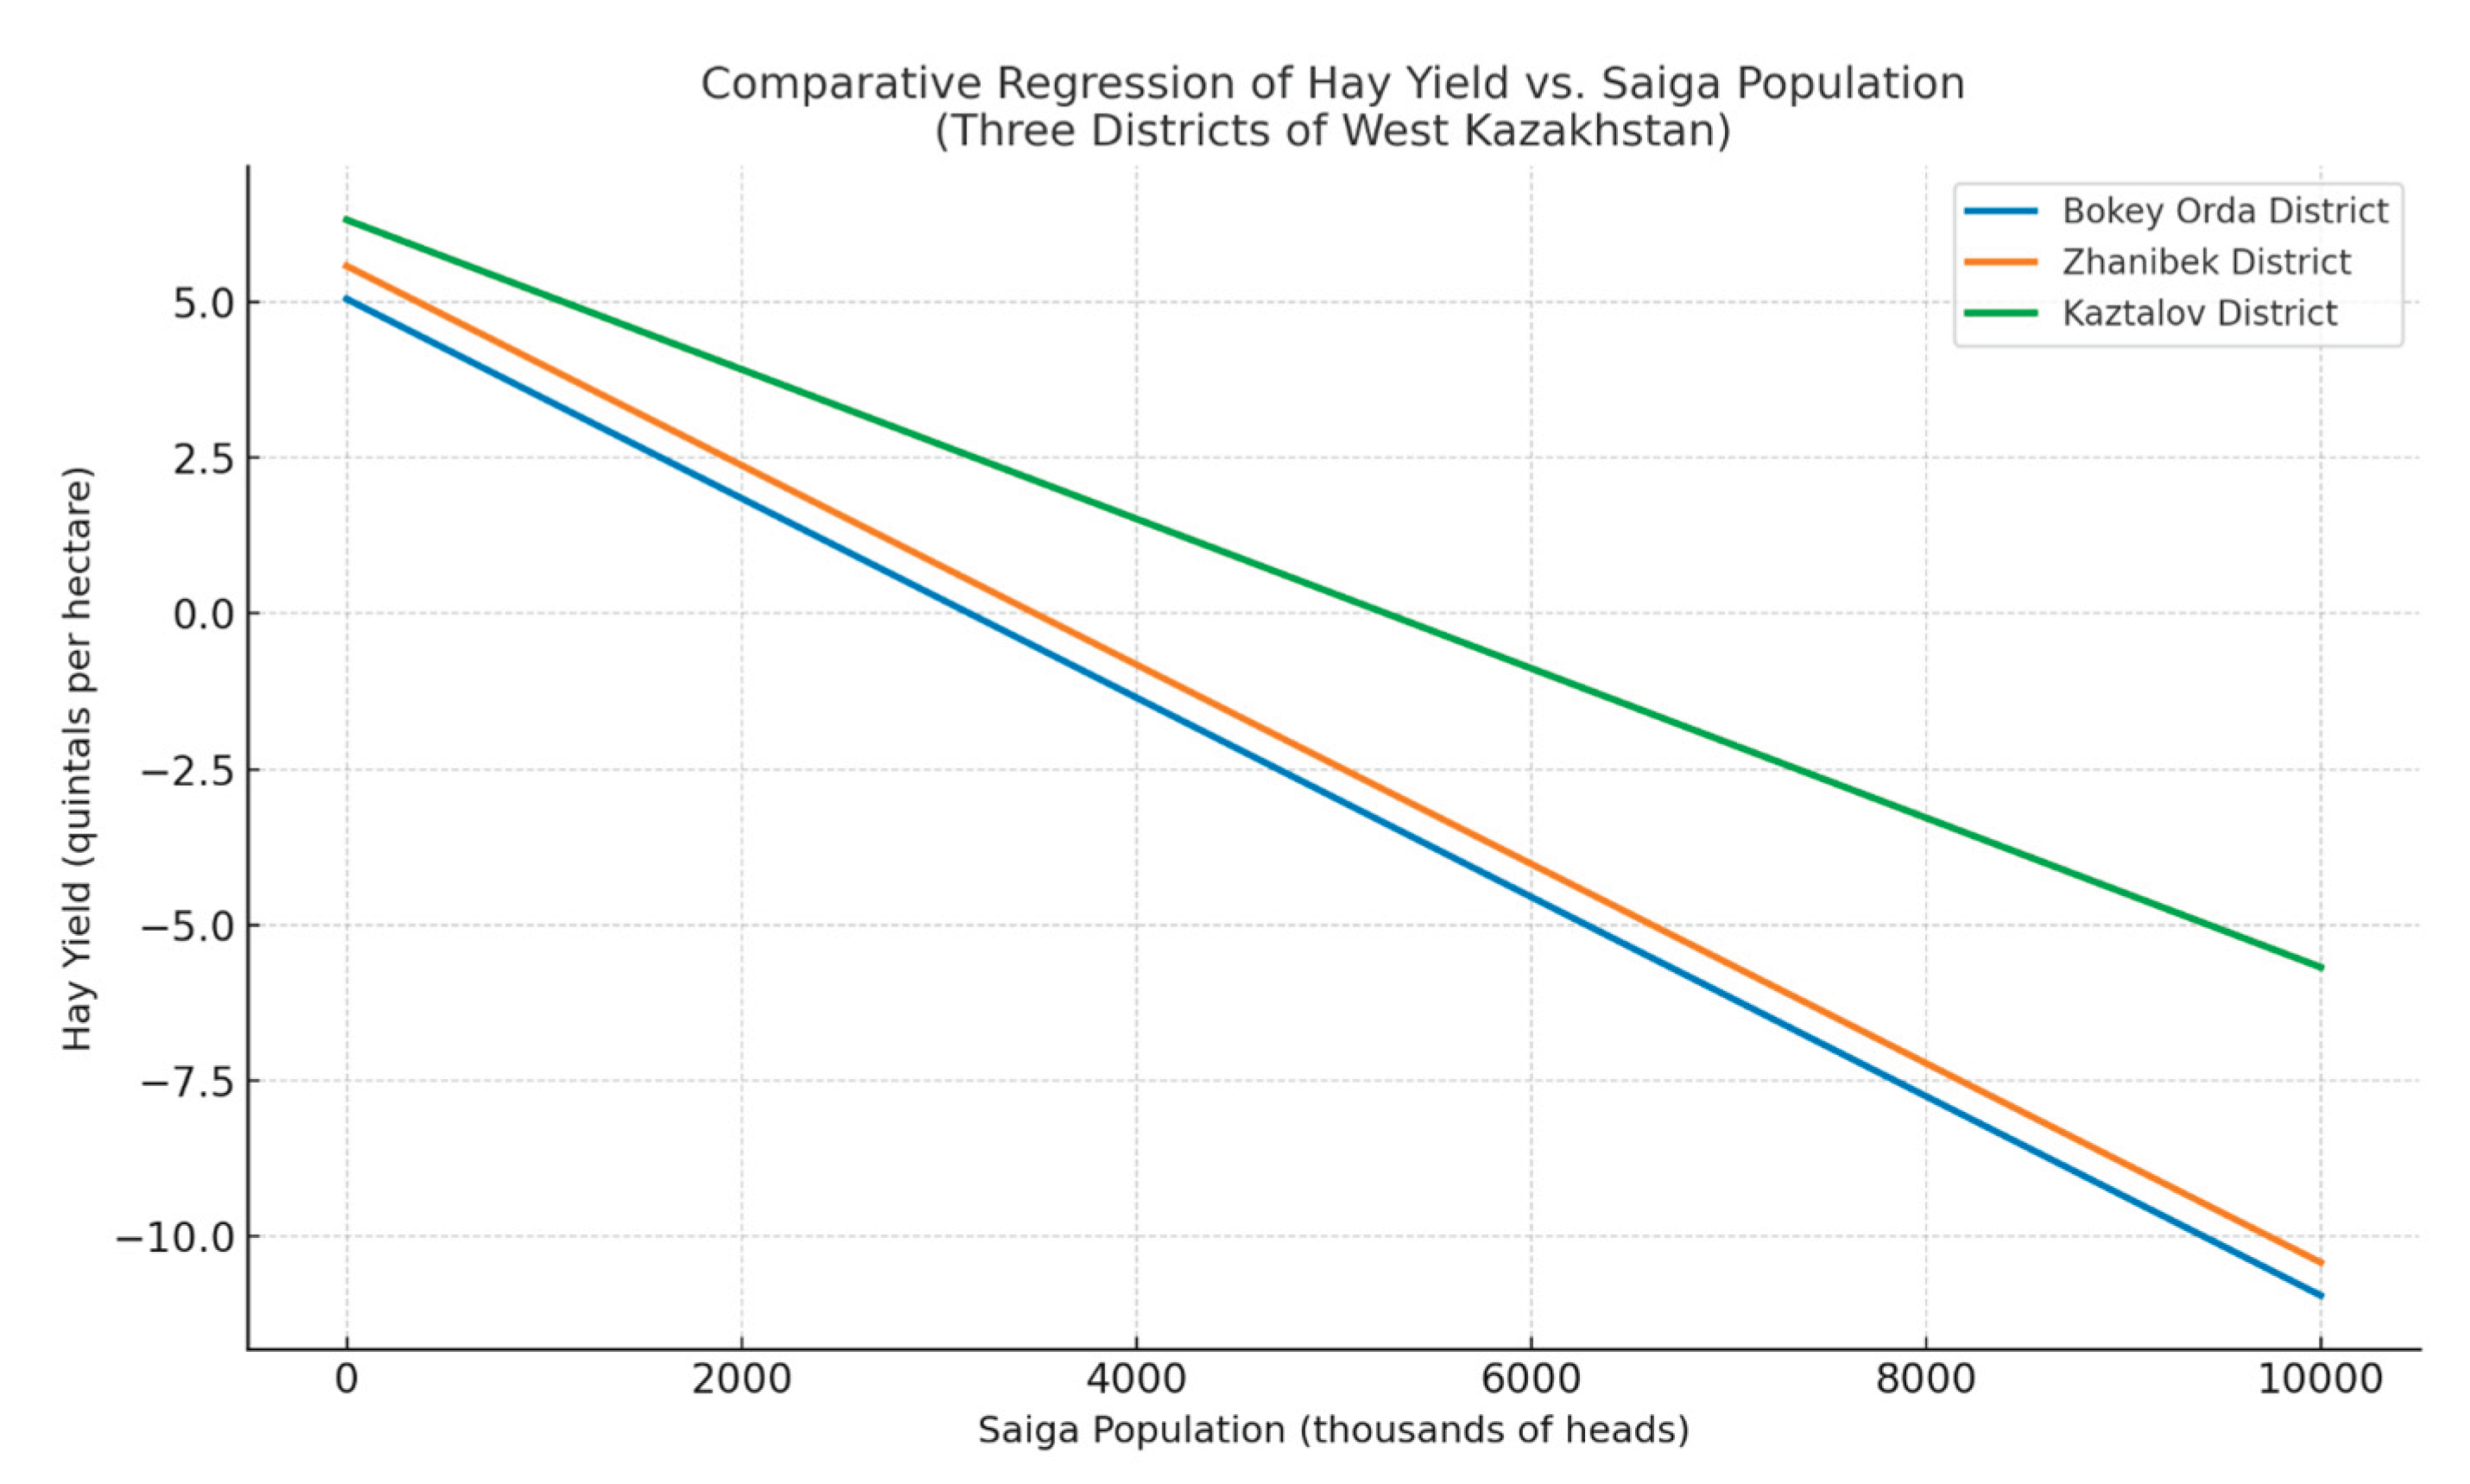

Table 1.
Yield of hay from hayfields and natural pastures, hundredweight per 1 ha (c/ha); n = 12 per district.
Table 1.
Yield of hay from hayfields and natural pastures, hundredweight per 1 ha (c/ha); n = 12 per district.
| District | 2017 | 2018 | 2019 | 2020 | 2021 | 2022 | 2023 | Change in 2023 compared to 2017, % |
| West Kazakhstan Region | 4,9 | 4,8 | 4,4 | 4,2 | 5,1 | 5,3 | 4,9 | +0,5 |
| Akzhaik District | 4,3 | 3,5 | 3,9 | 2,8 | 3,3 | 5,9 | 4,4 | +2,3 |
| Bokey Orda District | 5,5 | 5,5 | 4,1 | 3,8 | 3,3 | 3,0 | 2,0 | – 36,4 |
| Burlin District | 5,0 | 9,0 | 3,8 | 2,0 | 7,9 | 5,8 | 8,0 | +60,0 |
| Zhangalinsky District | 4,5 | 3,9 | 3,6 | 3,2 | 3,4 | 6,5 | 5,0 | +11,1 |
| Zhanibek District | 7,2 | 5,0 | 4,9 | 4,1 | 3,9 | 2,9 | 2,8 | – 38,9 |
| Baiterek District | 6,0 | 6,1 | 6,2 | 8,3 | 6,7 | 6,1 | 6,5 | +8,3 |
| Kaztalov District | 6,7 | 6,7 | 5,6 | 5,4 | 5,3 | 4,2 | 4,2 | – 62,7 |
| Karatobe District | 3,0 | 2,6 | 2,6 | 3,6 | 3,5 | 5,8 | 4,5 | +50,0 |
| Syrym District | 4,0 | 5,0 | 4,8 | 4,7 | 6,3 | 5,9 | 4,5 | +12,5 |
| Taskala District | 4,0 | 3,4 | 4,5 | 3,0 | 4,6 | 6,0 | 4,2 | +5,0 |
| Terekti District | 4,5 | 4,4 | 3,1 | 4,0 | 5,1 | 6,3 | 5,0 | +11,1 |
| Chingirlau District | 4,5 | 3,4 | 3,3 | 3,9 | 4,0 | 5,4 | 5,1 | +13,3 |
| Uralsk (city) | 4,0 | 3,7 | 6,4 | 5,4 | 8,6 | 5,7 | 7,3 | +82,5 |
Data source: Statistical collection “Agriculture, forestry and fisheries in the Republic of Kazakhstan, 2017–2023” and field observations, IRN AP23486846 (2024).
Table 2.
Livestock population in farming households (heads).
| District | 2017 | 2018 | 2019 | 2020 | 2021 | 2022 | 2023 |
| Cattle (Cattle stock) | |||||||
| Bokey Orda | 45 707 | 52 387 | 51 376 | 54 388 | 61 146 | 65 556 | 63 336 |
| Zhanibek | 23 245 | 26 322 | 30 267 | 32 204 | 32 826 | 35 111 | 37 258 |
| Kaztalov | 38 297 | 43 932 | 46 801 | 50 295 | 58 938 | 65 134 | 60 724 |
| Sheep and Goats | |||||||
| Bokey Orda | 68 638 | 56 249 | 51 760 | 50 200 | 56 896 | 55 743 | 47 820 |
| Zhanibek | 34 754 | 39 204 | 40 218 | 36 117 | 36 128 | 33 989 | 42 649 |
| Kaztalov | 122 449 | 128 659 | 133 764 | 127 547 | 127 425 | 135 312 | 108 816 |
| Horses | |||||||
| Bokey Orda | 16 357 | 18 308 | 19 262 | 20 228 | 24 761 | 25 210 | 24 645 |
| Zhanibek | 9 125 | 11 044 | 12 714 | 13 284 | 15 103 | 17 937 | 18 545 |
| Kaztalov | 13 551 | 15 581 | 17 037 | 18 982 | 20 852 | 22 508 | 18 675 |
Data source: Statistical collection “Key indicators of livestock development in West Kazakhstan Region, 2017–2023.”.
Table 3.
Pasture areas in Bokeyordinsky, Zhanibeksky and Kaztalov districts of West Kazakhstan region (ha); n = 12.
Table 3.
Pasture areas in Bokeyordinsky, Zhanibeksky and Kaztalov districts of West Kazakhstan region (ha); n = 12.
| № | District | Available Pasture Area, ha | Required Pasture Area, ha | Pasture Deficit, ha |
| 1. | Bokey Orda | 875 701 | 1 423 140 | 547 439 |
| 2. | Zhanibek | 728 888 | 823 072 | 94 184 |
| 3. | Kaztalov | 1 455 906 | 1 609 195 | 153 289 |
Data source: field observations and IRN AP23486846 (2024).
Table 4.
Profitability (loss ratio) of livestock production in farming households, %.
| District | 2017 | 2018 | 2019 | 2020 | 2021 | 2022 | 2023 |
| Bokey Orda | 46,7 | 49,2 | 47,2 | 51,8 | 46,3 | 46,0 | 45,7 |
| Zhanibek | -10 | -23,4 | 33,4 | 33,3 | 53,9 | 53,8 | 53,7 |
| Kaztalov | 20,0 | 41,1 | 65,6 | 119,5 | 23,8 | 23,7 | 23,6 |
Data source: Statistical collection “Agriculture, forestry and fisheries in the Republic of Kazakhstan, 2017–2023”.
Table 5.
Pearson correlation coefficients between saiga population (X, thousand heads) and hay yield (Y, kg/ha).
Table 5.
Pearson correlation coefficients between saiga population (X, thousand heads) and hay yield (Y, kg/ha).
| Bokey Orda | Zhanibek | Kaztalov | |
| Saiga population | –0.9096 | –0.7922 | –0.8642 |
Note: calculated by the authors using STATISTICA.
Table 6.
Correlation matrix between feed yield (kg/ha) and sheep meat production (kg live weight); n = 12.
Table 6.
Correlation matrix between feed yield (kg/ha) and sheep meat production (kg live weight); n = 12.
| Bokey Orda | 0,968506 |
| Zhanibek | 0,834532 |
| Kaztalov | 0,893762 |
Disclaimer/Publisher’s Note: The statements, opinions and data contained in all publications are solely those of the individual author(s) and contributor(s) and not of MDPI and/or the editor(s). MDPI and/or the editor(s) disclaim responsibility for any injury to people or property resulting from any ideas, methods, instructions or products referred to in the content. |
© 2025 by the authors. Licensee MDPI, Basel, Switzerland. This article is an open access article distributed under the terms and conditions of the Creative Commons Attribution (CC BY) license (http://creativecommons.org/licenses/by/4.0/).
Copyright: This open access article is published under a Creative Commons CC BY 4.0 license, which permit the free download, distribution, and reuse, provided that the author and preprint are cited in any reuse.


