1. Introduction
Cancer-associated fibroblasts (CAFs) are the predominant stromal cell type within the tumor microenvironment and have emerged as key regulators of tumor biology. Extensive studies have demonstrated that CAFs promote cancer progression through diverse mechanisms, including stimulation of tumor cell proliferation and invasion, angiogenesis, metabolic reprogramming, extracellular matrix (ECM) remodeling, and the induction of therapeutic resistance [
1,
2]. Importantly, advances in single-cell sequencing and lineage tracing have highlighted the remarkable heterogeneity of CAFs. Distinct subtypes, including myofibroblastic CAFs (myCAFs), inflammatory CAFs (iCAFs), and antigen-presenting CAFs (apCAFs), exhibit specialized molecular profiles and functional properties that influence cancer progression in different ways [
3]. Beyond their established roles in stromal remodeling, CAFs have recently been recognized as crucial modulators of anti-tumor immunity. In particular, CAF-induced ECM remodeling and secretory programs can physically restrict T cell infiltration and alter T cell activation states, thereby contributing to immune evasion and resistance to immunotherapy [
4]. Given their multifaceted involvement in tumor progression and immune regulation, CAFs have attracted considerable attention as therapeutic targets. Current strategies focus on either eliminating tumor-promoting CAF subsets or reprogramming their phenotypes toward tumor-suppressive functions, which reflects the growing potential of CAFs to serve as targets for precision cancer therapy [
5].
We previously demonstrated that adipocyte enhancer-binding protein 1 gene (
AEBP1) is highly expressed in the stromal compartment of colorectal cancer and promotes tumor angiogenesis [
6]. The protein encoded by the
AEBP1 gene is also referred as aortic carboxypeptidase-like protein (ACLP), a secreted ECM associated protein [
7,
8,
9,
10]. Beyond cancer, ACLP is highly expressed in fibrotic lung tissues and has been shown to promote differentiation of myofibroblasts, highlighting its role in pathological tissue remodeling and fibrosis [
11,
12,
13]. More recently, we reported that ACLP is abundantly expressed in CAFs from oral squamous cell carcinoma (OSCC), where it contributes to CAF activation, and that its expression is inversely correlated with intratumoral CD8+ T-cell infiltration [
14]. This suggests ACLP may foster an immunosuppressive tumor microenvironment. Consistent with those findings, another study demonstrated that ACLP activates CAFs and promotes metastasis in pancreatic cancer through a PPARγ-dependent feedback loop [
15]. Together, these data suggest that
AEBP1/ACLP plays a critical role not only in normal fibroblasts but also in CAFs across multiple pathological contexts.
Nevertheless, the expression patterns and functional significance of AEBP1/ACLP in CAFs across diverse cancer types remain poorly characterized. To address this knowledge gap, in the present study we performed a pan-cancer analysis of AEBP1 expression and investigated its functional implications, with a particular focus on its potential role in enhancing the mechanical stiffness of tumor tissues through CAF activity.
2. Results
2.1. AEBP1-Associated Gene Expression Signatures Across Cancers
To elucidate the functional significance of
AEBP1 expression across different cancer types, we performed a Gene Ontology (GO) analysis of genes correlated with
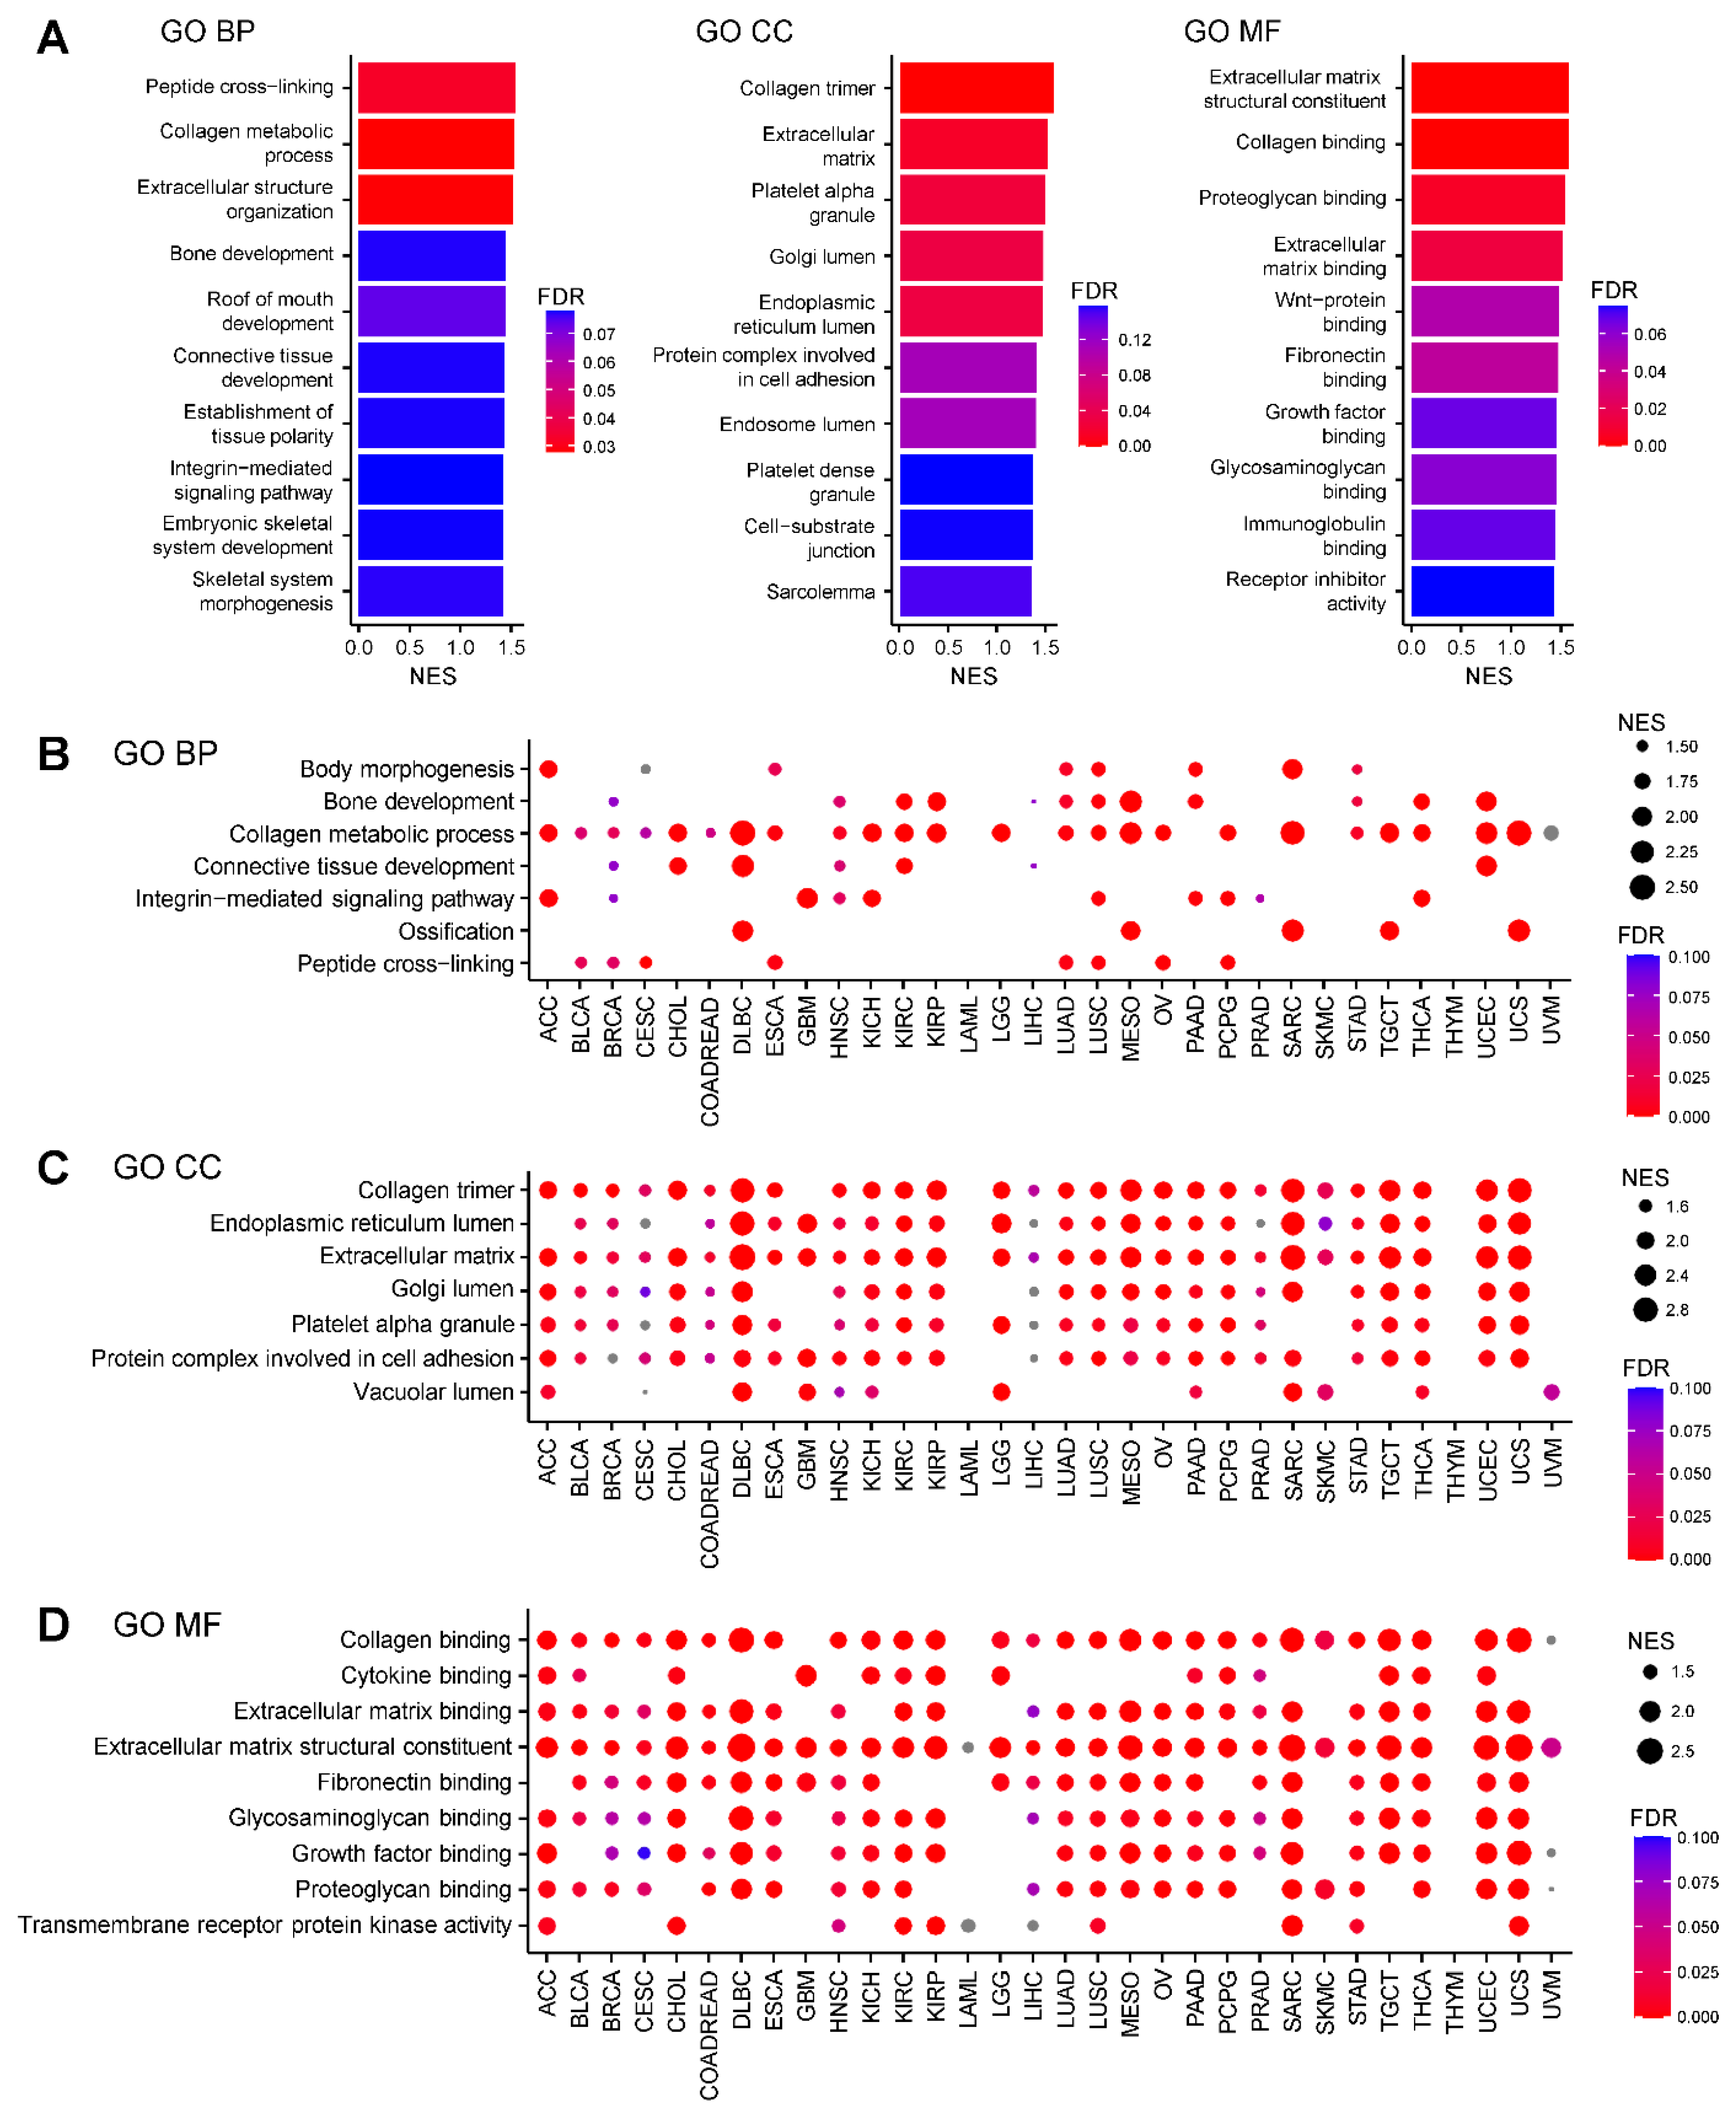
AEBP1 expression using RNA-sequencing (RNA-seq) data from The Cancer Genome Atlas (TCGA). In breast cancer (TCGA-BRCA), genes whose expression patterns closely paralleled that of
AEBP1 were significantly enriched in categories related to collagen and the ECM across the biological process (GO-BP), cellular component (GO-CC) and molecular function (GO-MF) domains (FDR < 0.05,
Figure 1A). Subsequent GO-BP analysis of 32 TCGA tumor types revealed that, in nearly all cancer types,
AEBP1 expression strongly correlated with expression of genes involved in the collagen metabolic process (
Figure 1B). Similarly, GO-CC analysis showed that genes related to collagen and the ECM were consistently associated with
AEBP1 across tumor types. In addition, “genes associated with the endoplasmic reticulum lumen,” “Golgi lumen,” “platelet alpha granule” and “protein complexes involved in cell adhesion” frequently showed high correlation with
AEBP1 (
Figure 1C). GO-MF analysis further confirmed the strong association between
AEBP1 and collagen- or ECM-related genes and also revealed significant correlations with genes involved in “fibronectin binding,” “glycosaminoglycan binding” and “growth factor binding” (
Figure 1D).
By contrast, acute myeloid leukemia (LAML) showed no collagen- or ECM-associated GO categories that significantly correlated with
AEBP1, likely reflecting the lack of tumor stroma and the irrelevance of collagen and ECM in hematological malignancies (
Figure 1B–1D). Similarly, little or no enrichment of collagen- or ECM-associated GO categories was identified in thymoma (THYM) and uveal melanoma (UVM), which may also be attributable to the paucity of stromal components in these tumors (
Figure 1B–1D).
Figure 1.
Characteristics of gene expression correlated with AEBP1 expression. (A) Summary of a Gene Ontology (GO) analysis of genes whose expression correlated with AEBP1 expression in breast cancer (TCGA-BRCA). Left, GO biological process (GO-BP); middle, GO cellular component (GO-CC); right, GO molecular function (GO-MF). NES, normalized enrichment score; FDR, false discovery rate. (B) GO-BP analysis of gene expression correlated with AEBP1 expression across the indicated TCGA tumor types. ACC, adrenocortical carcinoma; BLCA, bladder urothelial carcinoma; BRCA, breast invasive carcinoma; CESC, cervical squamous cell carcinoma and endocervical adenocarcinoma; CHOL, cholangiocarcinoma; COADREAD, colorectal adenocarcinoma; DLBC, diffuse large B-cell lymphoma; ESCA, esophageal carcinoma; GBM, glioblastoma multiforme; HNSC, head and neck squamous cell carcinoma; KICH, kidney chromophobe; KIRC, kidney renal clear cell carcinoma; KIRP, kidney renal papillary cell carcinoma; LAML, acute myeloid leukemia; LGG, lower grade glioma; LIHC, liver hepatocellular carcinoma; LUAD, lung adenocarcinoma; LUSC, lung squamous cell carcinoma; MESO, mesothelioma; OV, ovarian serous cystadenocarcinoma; PAAD, pancreatic adenocarcinoma; PCPG, pheochromocytoma and paraganglioma; PRAD, prostate adenocarcinoma; SARC, sarcoma; SKCM, skin cutaneous melanoma; STAD, stomach adenocarcinoma; TGCT, testicular germ cell tumors; THCA, thyroid carcinoma; THYM, thymoma; UCEC, uterine corpus endometrial carcinoma; UCS, uterine carcinosarcoma; UVM, uveal melanoma. (C) GO-CC analysis of gene expression correlated with AEBP1 expression across the indicated TCGA tumor types. (D) GO-MF analysis of gene expression correlated with AEBP1 expression across the indicated TCGA tumor types.
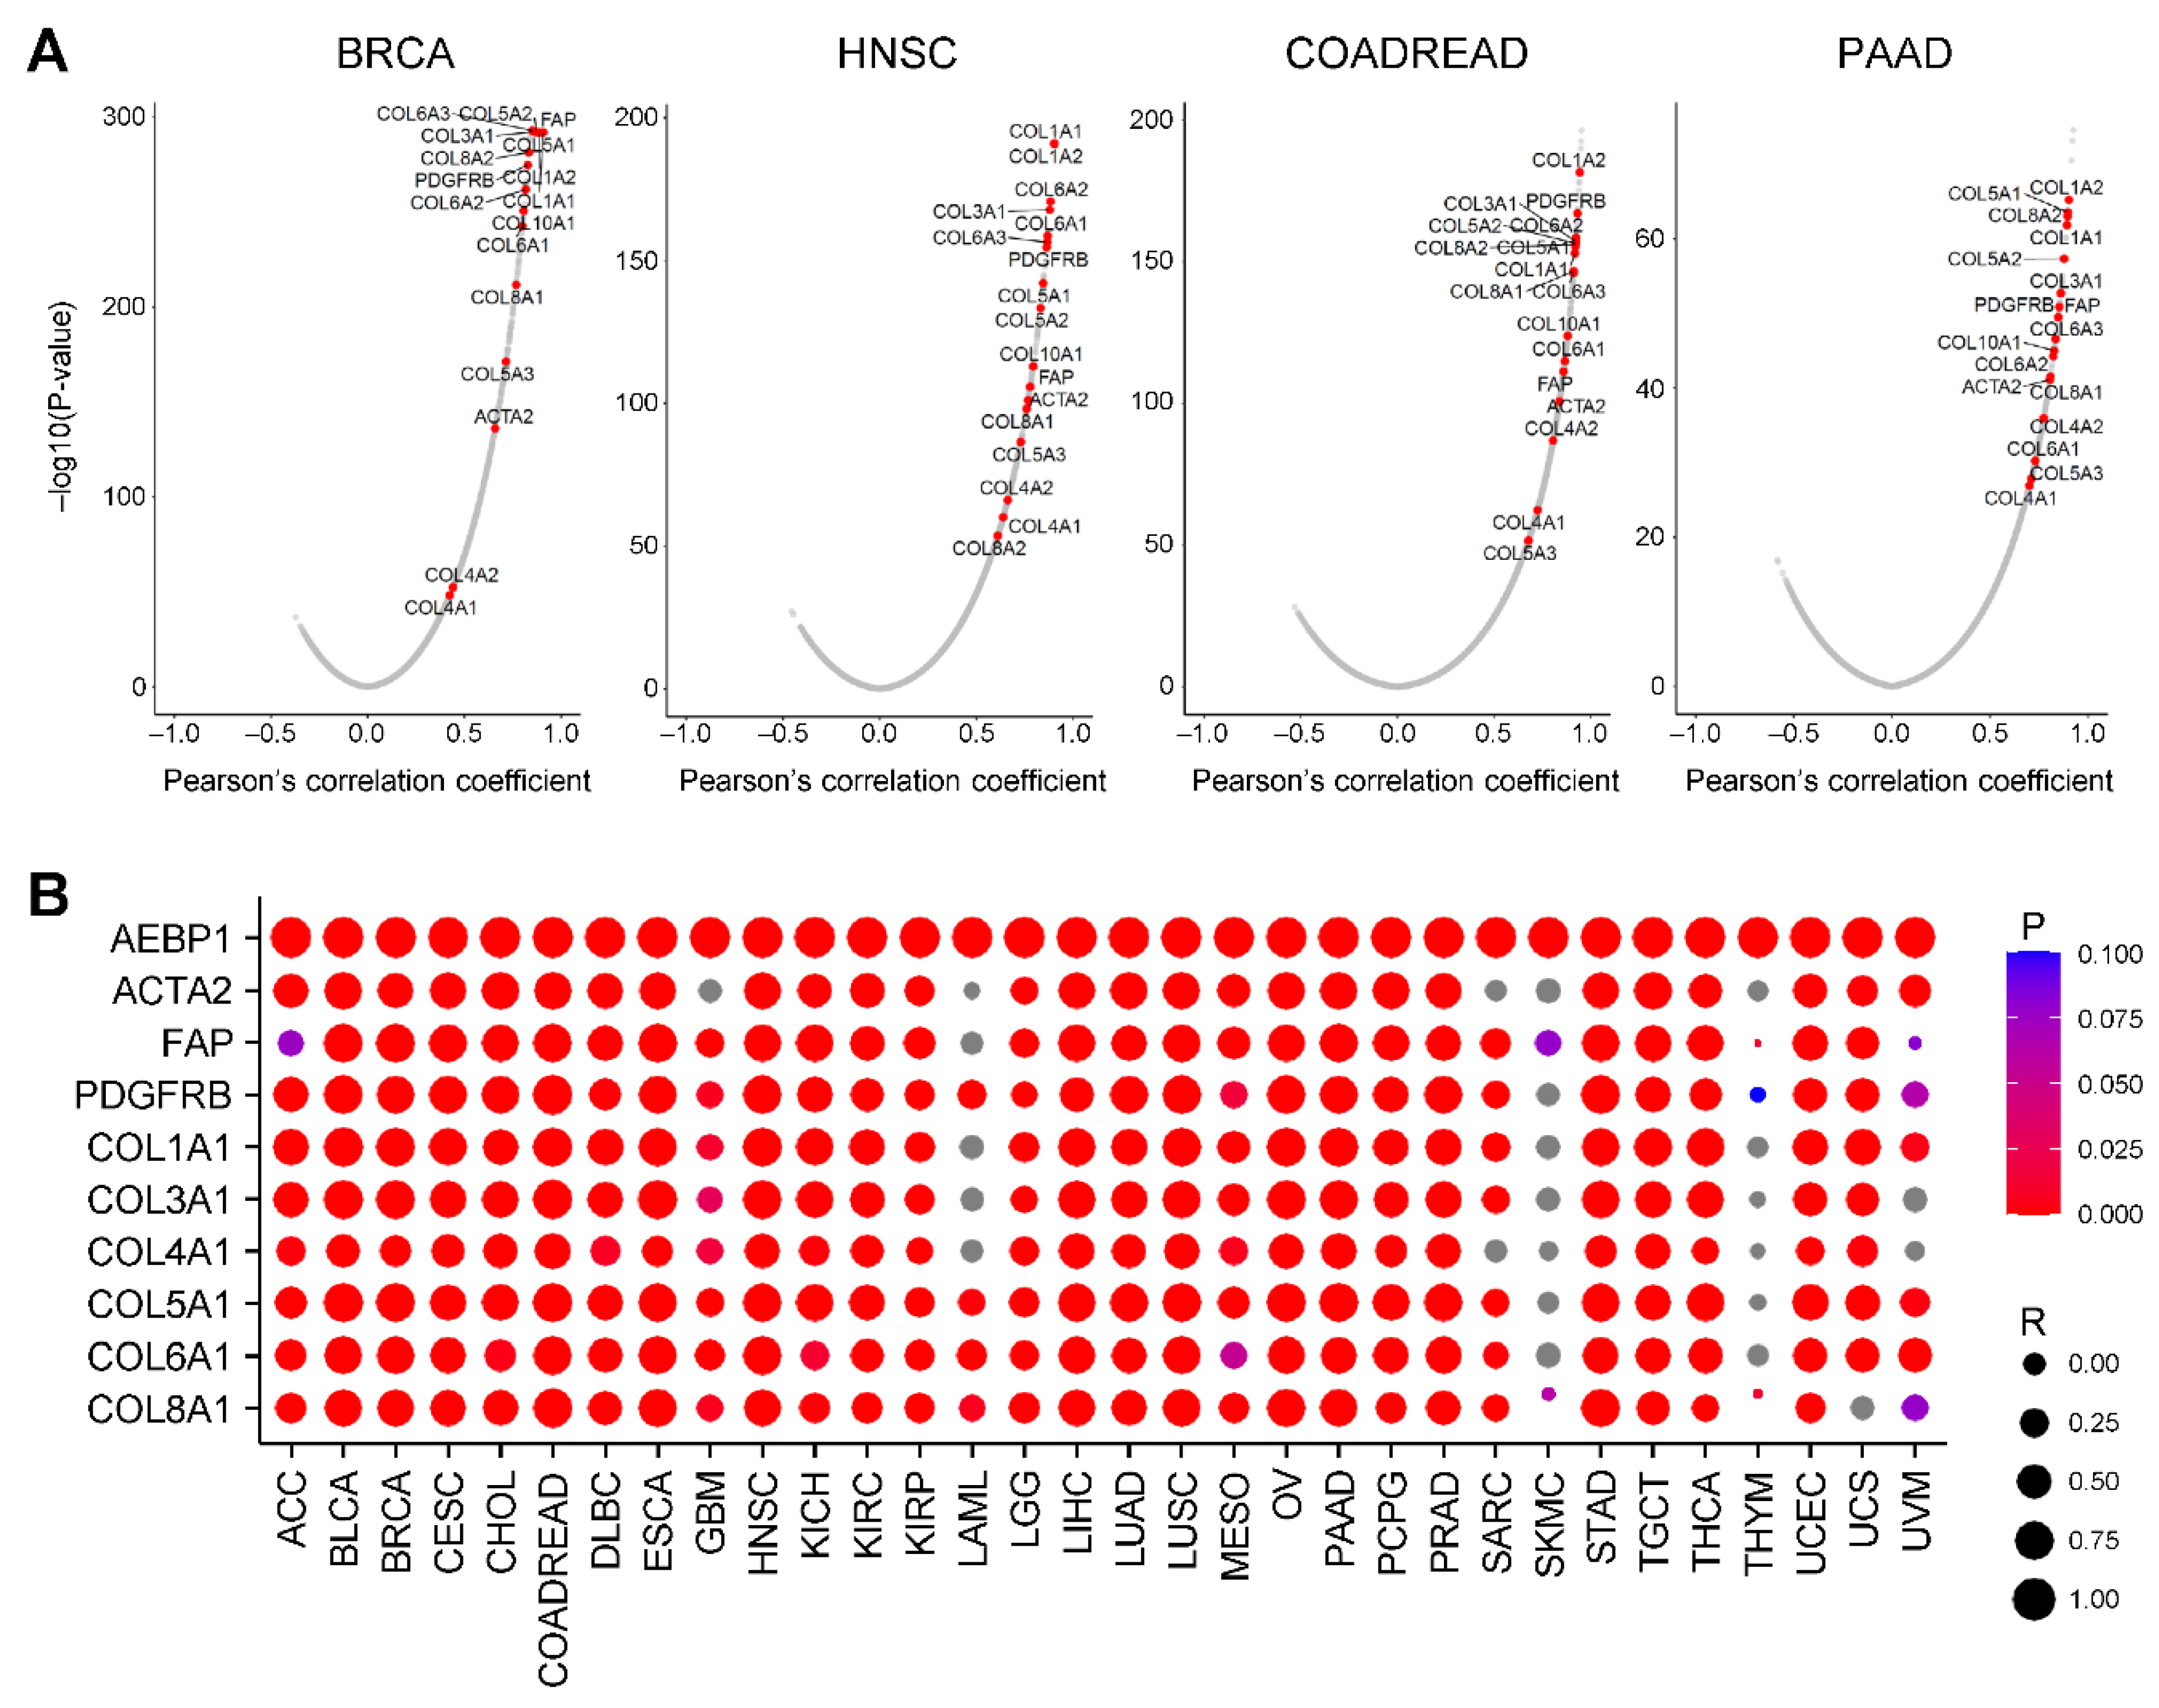
2.2. AEBP1 Expression Strongly Correlates with Collagen Family Gene Expression
We next examined the correlation between
AEBP1 expression and global gene expression using TCGA-BRCA data. A volcano plot revealed that many collagen family genes were among whose expression was the most strongly correlated with
AEBP1 expression (
P < 0.05,
Figure 2A). In addition,
AEBP1 expression was highly correlated with expression of CAF markers, including
ACTA2 (encoding α-smooth muscle actin, α-SMA), fibroblast activation protein (
FAP) and platelet-derived growth factor receptor β (
PDGFRB) (
Figure 2A). Consistent results were observed in other tumor types, including head and neck squamous cell carcinoma (HNSC), colorectal adenocarcinoma (COADREAD) and pancreatic adenocarcinoma (PAAD), where
AEBP1 expression was strongly correlated with expression of both collagen family genes and CAF markers (
Figure 2A).
To further generalize these findings, we assessed the correlation of
AEBP1 expression with CAF markers (
ACTA2,
FAP, and
PDGFRB) and representative collagen family genes across 32 TCGA tumor types. This analysis demonstrated that, in a majority of cancers,
AEBP1 expression was highly correlated with expression of those genes (
P < 0.05,
Figure 2B).
Figure 2.
AEBP1 expression is strongly correlated with the expression of collagen family genes. (A) Volcano plots showing the correlations between AEBP1 and all genes in the indicated tumor types. (B) Correlation between AEBP1 expression and expression of the indicated genes across TCGA tumor types. R, Pearson’s correlation coefficient.
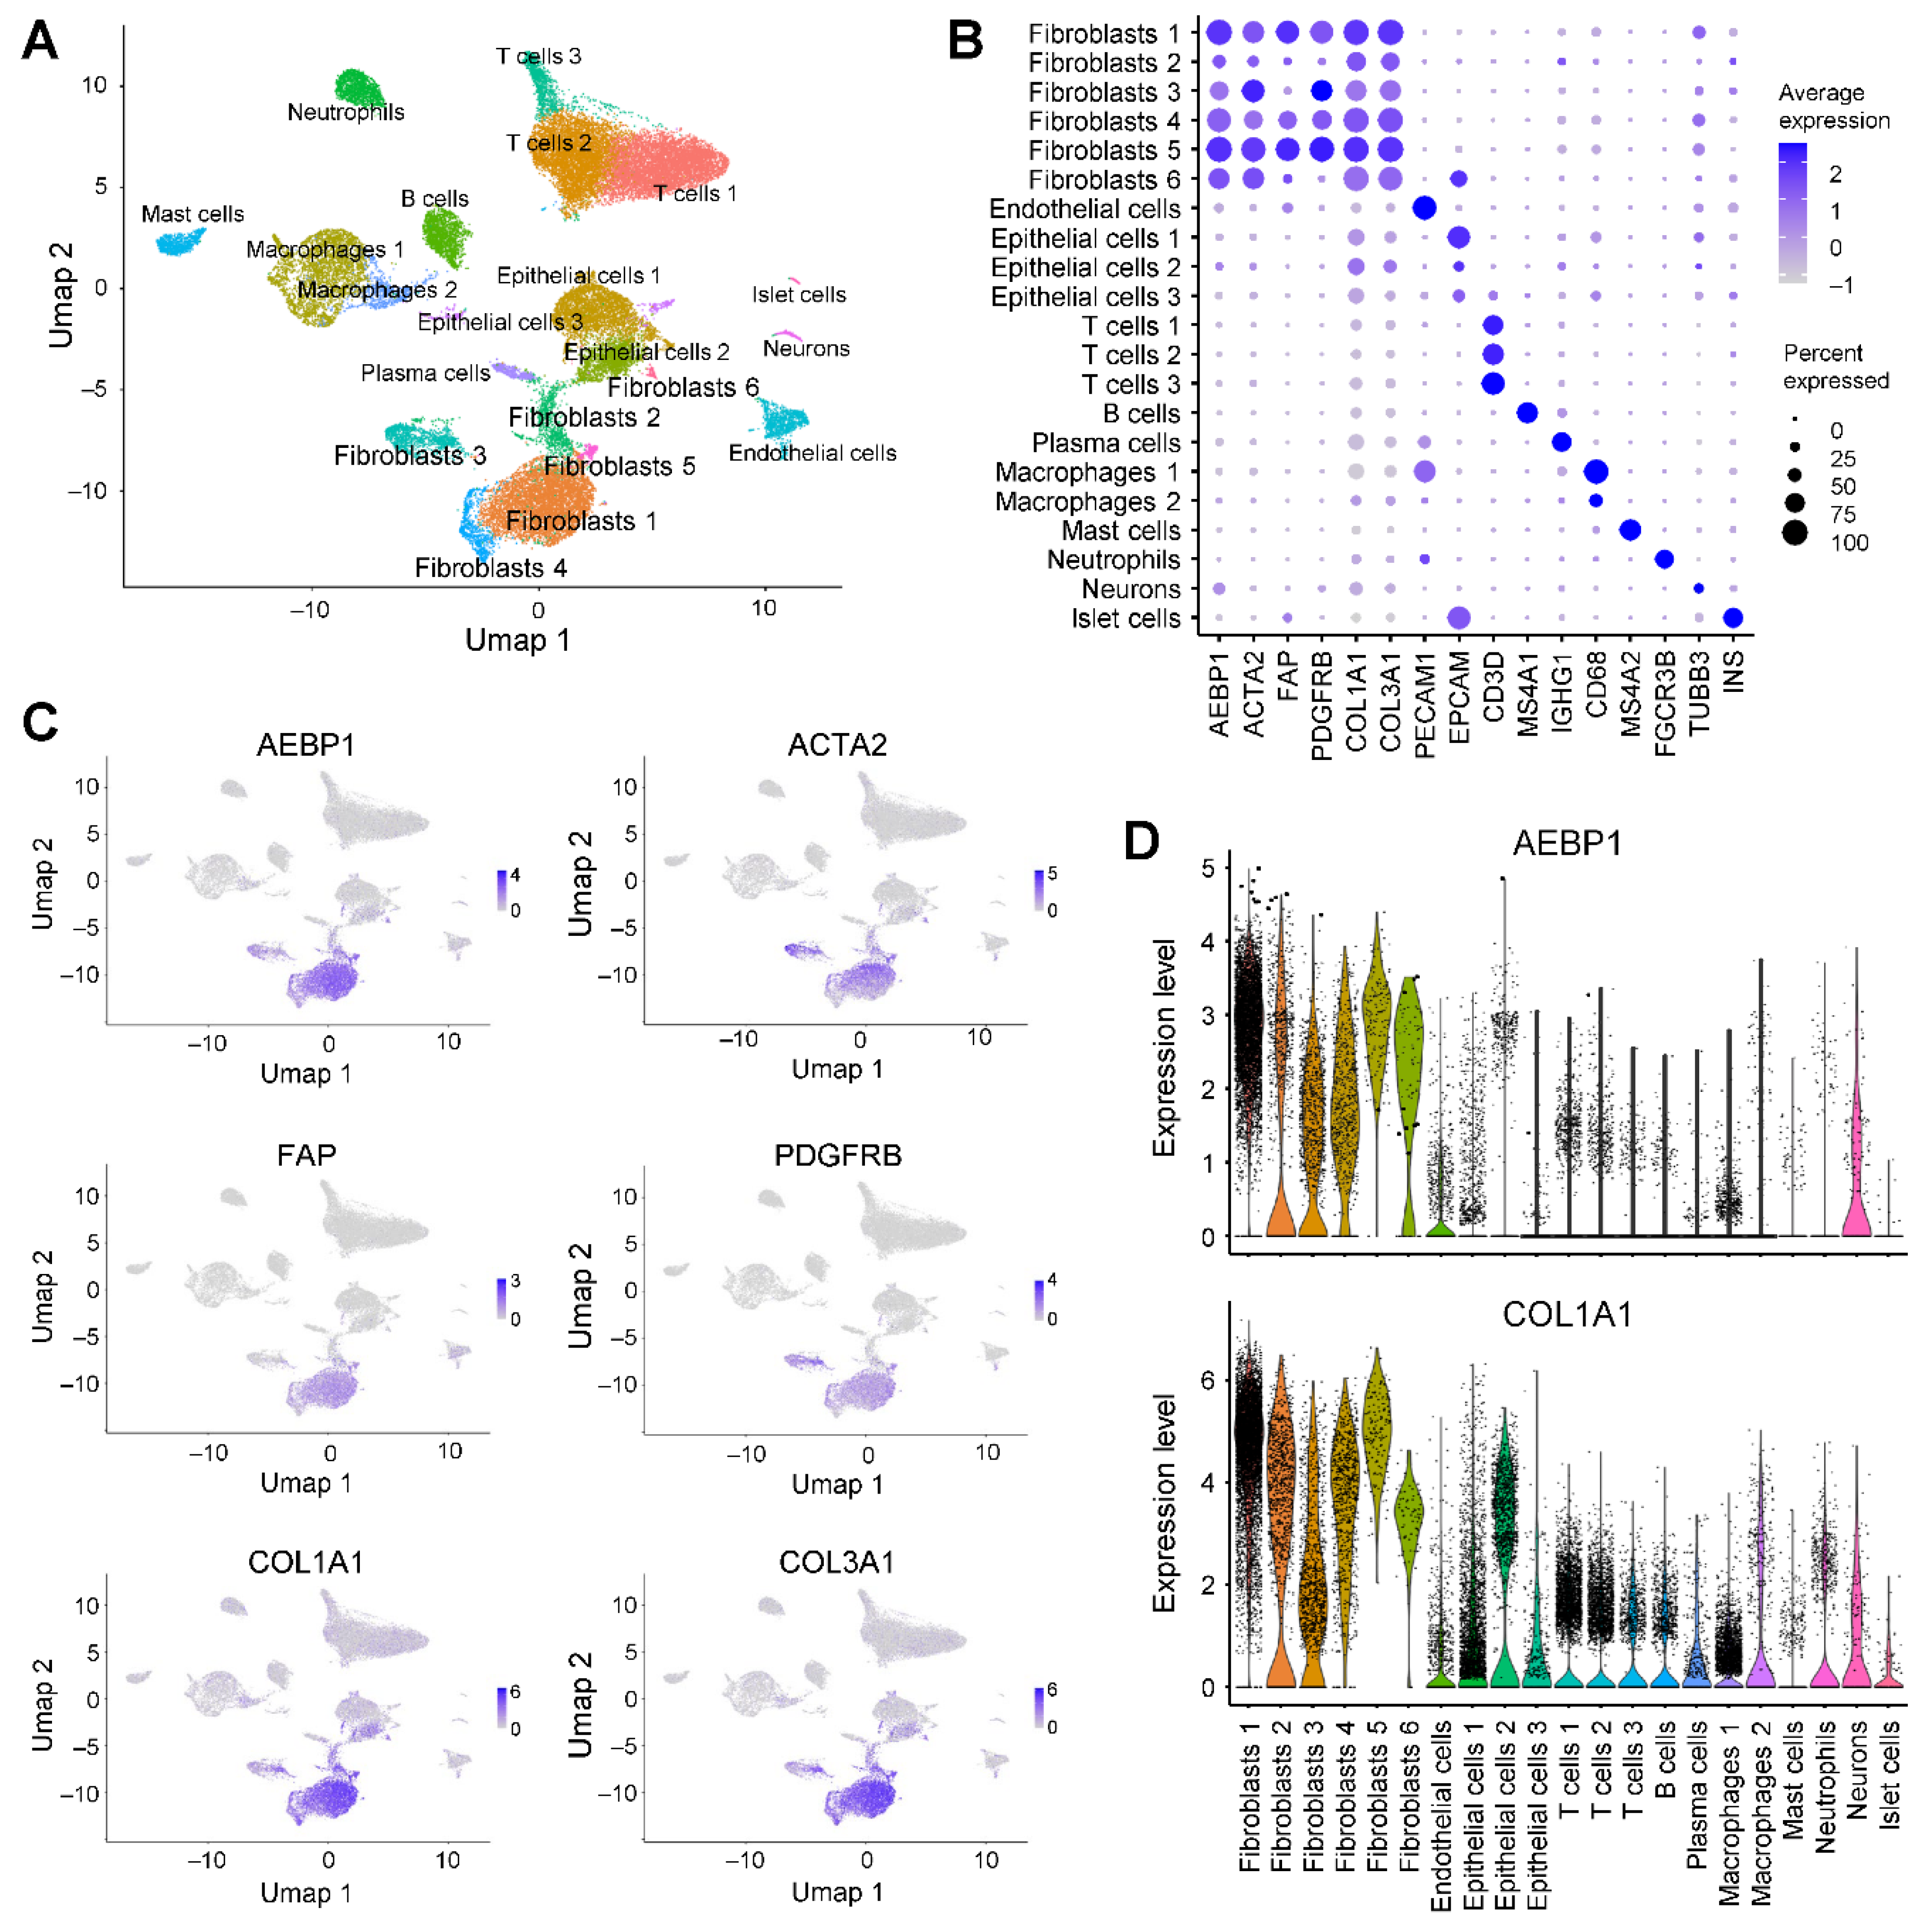
2.3. AEBP1 and Collagen Genes Are Co-Expressed in CAFs From Breast Cancer
We next investigated
AEBP1 expression in detail using single-cell RNA-sequencing (scRNA-seq) data from breast cancer tissues (GSE228499) [
16]. Clustering and uniform manifold approximation and projection (UMAP) analyses identified 14 cell populations, among which two clusters were annotated as fibroblasts (
Figure 3A). Both fibroblast subpopulations expressed
ACTA2 and
PDGFRB, while fibroblast cluster 1 showed higher expression of
AEBP1,
FAP and collagen genes than fibroblast cluster 2 (
Figure 3B, 3C). Visualization of gene expression with UMAP and violin plots further demonstrated that the same fibroblast population strongly expressed both
AEBP1 and collagen family genes (
Figure 3C, 3D). Collectively, these results indicate that in breast cancer tissue,
AEBP1 is highly expressed in CAFs and that
AEBP1-positive CAFs co-express collagen genes. This suggests
AEBP1-positive CAFs represent a major source of collagen production within the tumor microenvironment.
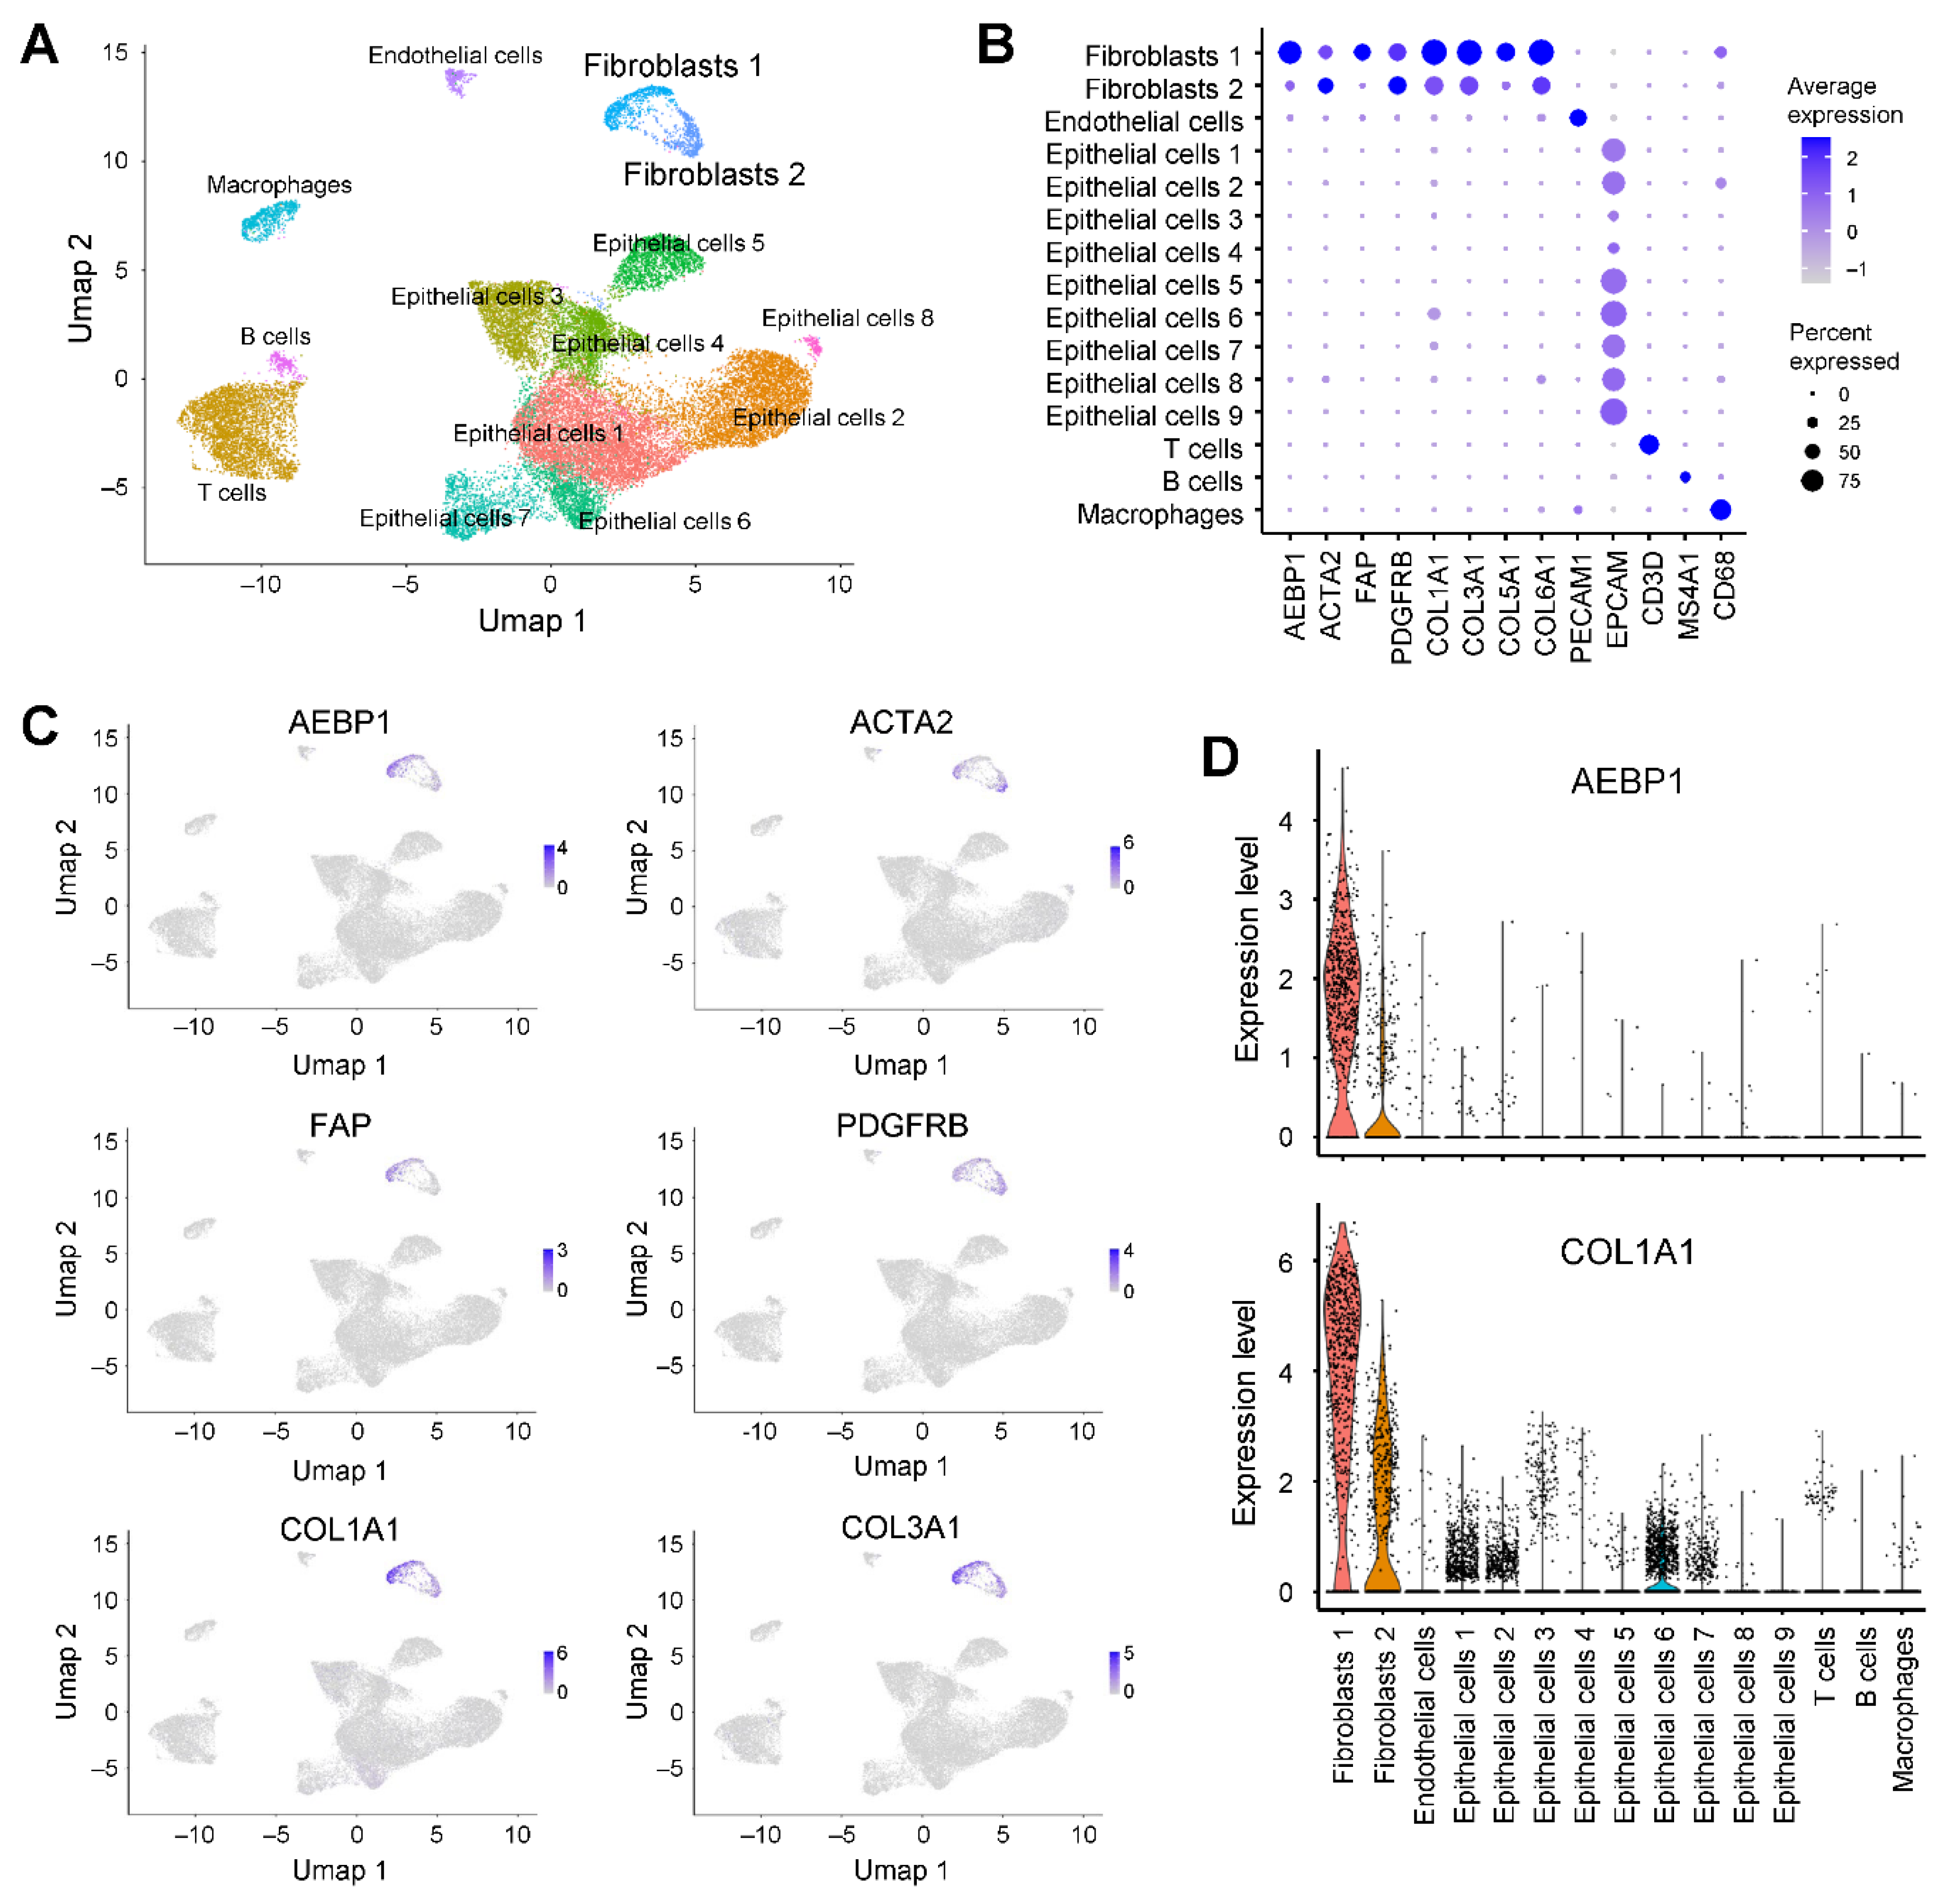
2.4. AEBP1 and Collagen Genes Are Co-Expressed in CAFs from Pancreatic Cancer
We further analyzed scRNA-seq data from pancreatic cancer tissues (GSE212966) [
17]. Clustering and UMAP analysis identified six fibroblast clusters, all of which exhibited high expression of
AEBP1 and collagen family genes (
Figure 4A, 4B). Co-expression of
AEBP1 and collagen genes was further confirmed by UMAP and violin plots (
Figure 4C, 4D).
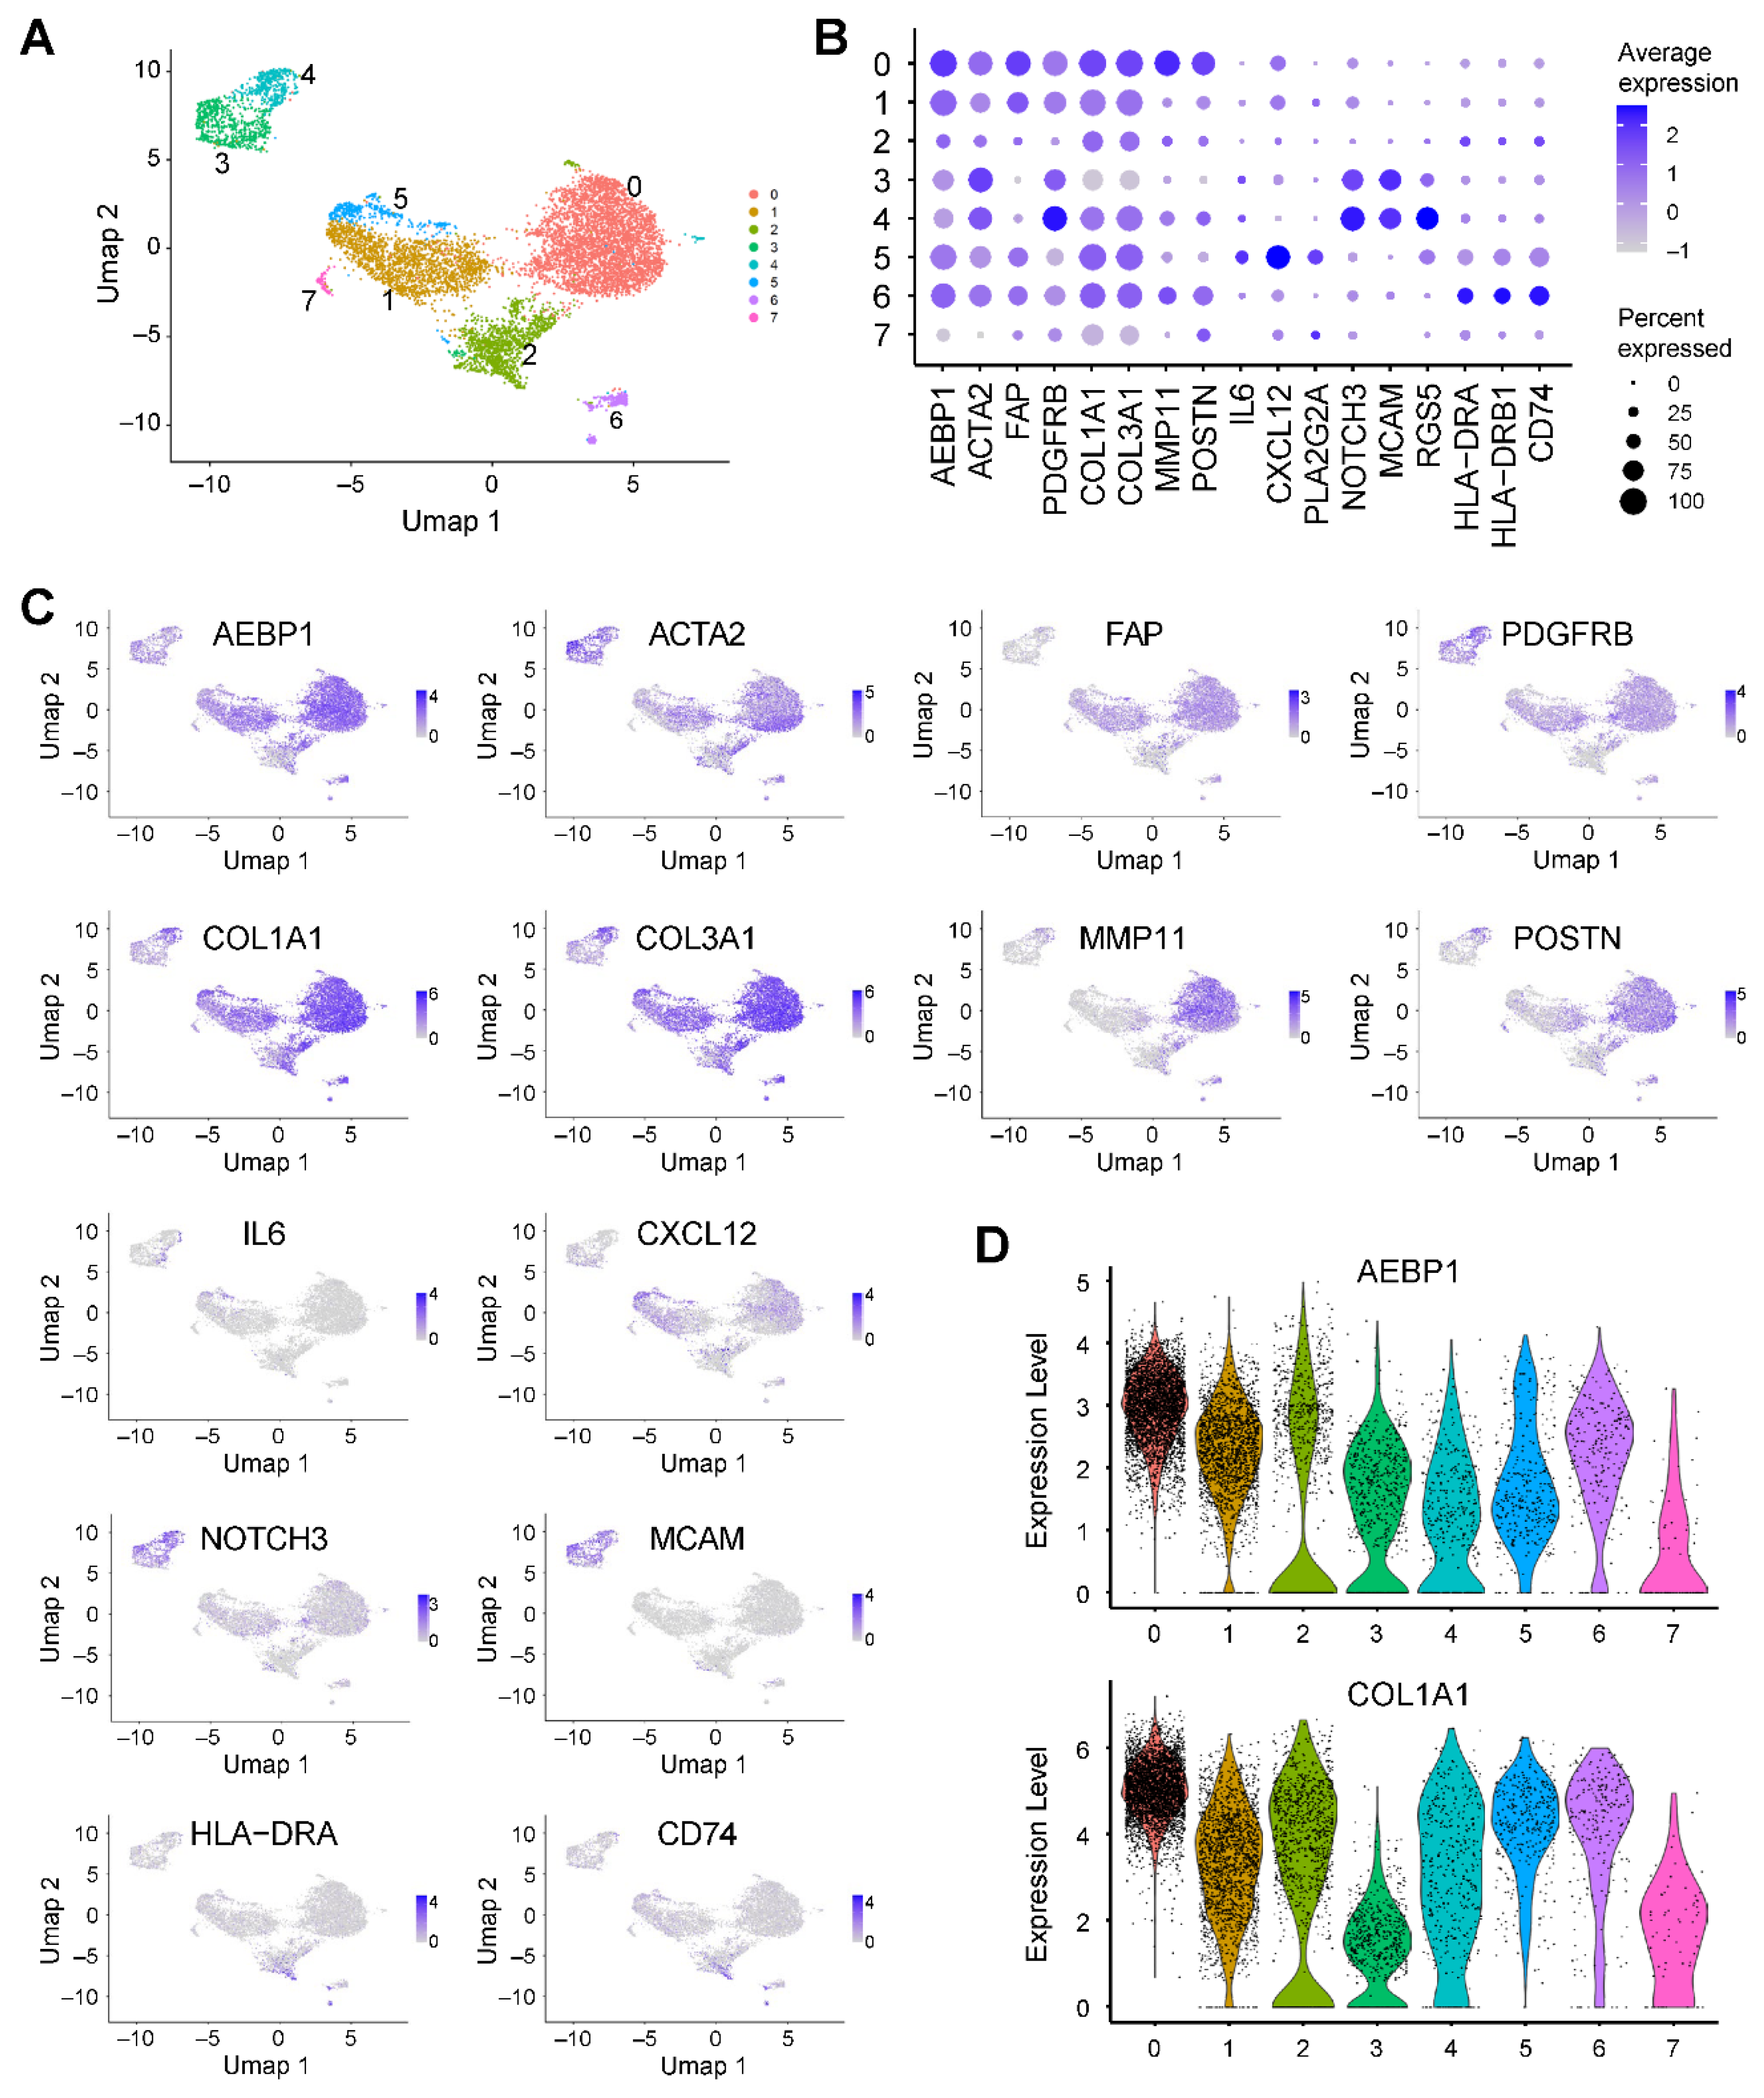
To characterize the fibroblast heterogeneity in greater detail, we extracted fibroblast populations and performed reclustering, which revealed seven distinct clusters (
Figure 5A). Clusters 0, 2, 3, 4, and 6 strongly expressed
ACTA2, consistent with myCAFs (
Figure 5B). Cluster 0 additionally expressed
MMP11 and
POSTN, suggesting features of matrix CAFs (mCAFs) (
Figure 5B) [
18]. Cluster 5 expressed
IL6 and
CXCL12, which is consistent with iCAFs (
Figure 5B) [
18]. Clusters 3 and 4 showed enrichment of
NOTCH3,
MCAM and
RGS5, consistent with vascular CAFs (vCAFs) (
Figure 5B) [
18]. And cluster 6 expressed
HLA-DRA,
HLA-DRB1 and
CD74, corresponding to apCAFs (
Figure 5B) [
18]. Notably, all but one fibroblast cluster (0 to 6) expressed
AEBP1 (
Figure 5B). Moreover, clusters 0, 1, 2, 4, 5 and 6 co-expressed
AEBP1 with collagen family genes such as
COL1A1 and
COL3A1, as demonstrated by both UMAP and violin plots (
Figure 5C, D). These results indicate that in pancreatic cancer, the majority of CAFs exhibit strong expression of both
AEBP1 and collagen genes.
Figure 4.
AEBP1 is preferentially expressed in fibroblasts in pancreatic cancer. (A) UMAP plot of scRNA-seq data from pancreatic cancer tissues (GSE212966) annotated by cell type. (B) Dot plot showing the expression of AEBP1, CAF markers, collagen genes and representative marker genes for each cell type. (C) UMAP plots showing the expression levels of the indicated genes. (D) Violin plots showing AEBP1 and COL1A1 expression levels across the indicated cell types.
Figure 5.
AEBP1 expression in fibroblasts from pancreatic cancer. (A) UMAP plot showing fibroblasts extracted from scRNA-seq data from pancreatic cancer tissues (GSE212966). (B) Dot plot showing the expression of AEBP1 and CAF marker genes across fibroblast subclusters. (C) UMAP plots showing the expression levels of the indicated genes. (D) Violin plots showing AEBP1 and COL1A1 expression levels across the fibroblast subclusters.
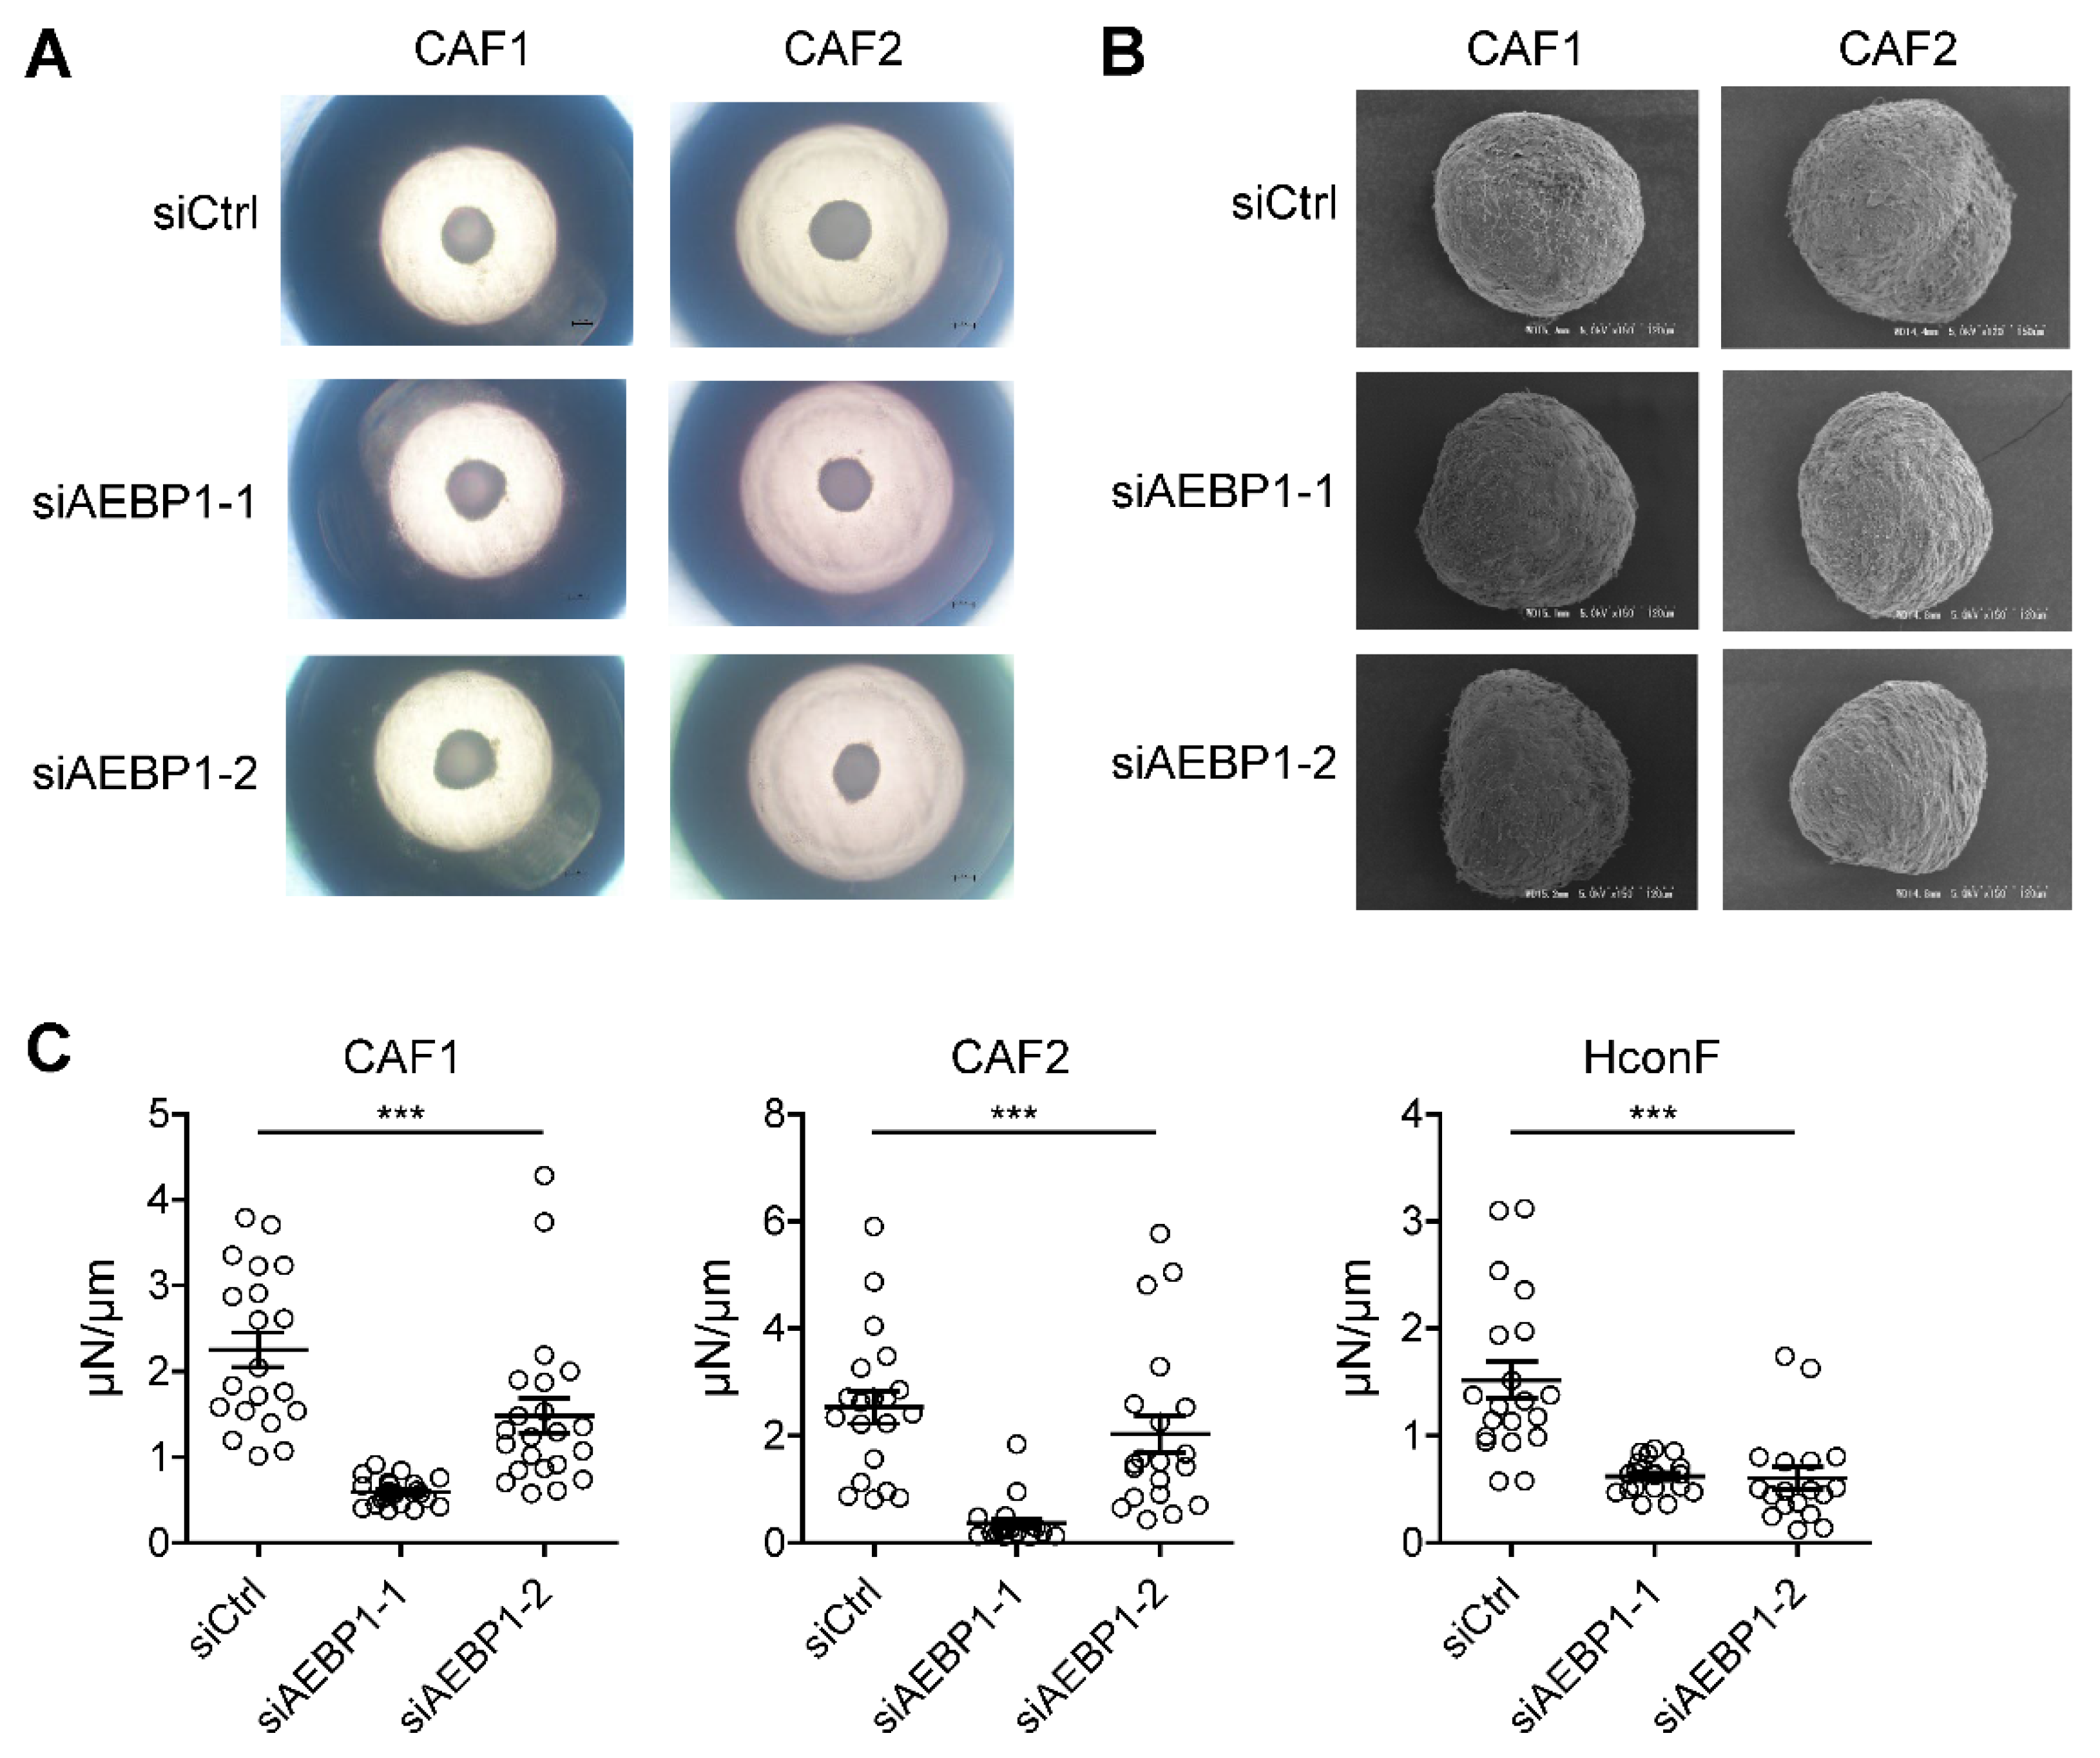
2.4. AEBP1 Enhances the Mechanical Stiffness of CAF-Derived 3D Spheroids
ACLP, encoded by
AEBP1, reportedly interacts with collagen and enhances the stiffness and toughness of collagen fibers [
19]. Based on these findings, we sought to investigate the functional role of
AEBP1 in CAFs. In an earlier study, we established a three dimensional (3D) spheroid culture model using CAFs derived from human OSCC and assessed spheroid stiffness and morphology [
20]. Here, we generated 3D spheroids after knocking down
AEBP1 in OSCC-derived CAFs. The efficiency of
AEBP1 knockdown at both the mRNA and protein level using two independent siRNAs (siAEBP1-1 and siAEBP1-2) was validated in a prior study [
14].
We performed knockdown experiments in two independent CAFs, followed by 3D spheroid culture.
AEBP1 knockdown did not significantly affect spheroid size (
Figure 6A), nor did it markedly alter spheroid morphology as assessed by scanning electron microscopy (
Figure 6B). However,
AEBP1 knockdown significantly reduced the mechanical stiffness of 3D spheroids derived from both CAFs (
Figure 6C). Similar results were obtained using human conjunctival fibroblasts (HconF) as normal fibroblasts, where
AEBP1 knockdown again decreased spheroid stiffness (
Figure 6C,
Supplementary Figure S1). Taken together, these results suggest that high
AEBP1/ACLP expression in CAFs contributes to increased stiffness of the tumor microenvironment, potentially enhancing tissue rigidity in cancer.
3. Discussion
In this study, we performed a pan-cancer analysis which demonstrated that
AEBP1 expression strongly correlates with collagen expression across a wide range of cancers. Previous research has consistently reported that
AEBP1 is highly expressed in various solid tumors, including gastric cancer, colorectal cancer, breast cancer, oral cancer and papillary thyroid cancer, where it promotes tumor progression, epithelial-mesenchymal transition and therapeutic resistance [
21,
22,
23,
24,
25,
26,
27,
28,
29]. These findings suggest that
AEBP1 functions as a common tumor-promoting factor across diverse malignancies. By integrating scRNA-seq datasets, our study further revealed that fibroblasts represent the predominant stromal cell population expressing
AEBP1 within tumor tissues. This observation highlights the importance of CAFs as the principal source of
AEBP1 within the tumor microenvironment and provides a mechanistic link between
AEBP1 expression, collagen co-expression and stromal remodeling in cancer.
In recent years, new insights have emerged regarding the critical relationship between
AEBP1 and collagen. Several independent groups have identified bi-allelic mutations in
AEBP1 as the genetic cause of a variant of Ehlers-Danlos syndrome, a systemic connective tissue disorder characterized by defective collagen assembly and impaired ECM integrity [
30,
31,
32,
33]. Building on these genetic findings, functional studies by Vishwanath and colleagues revealed that the protein encoded by
AEBP1 (i.e. ACLP) physically interacts with collagen and enhances the stiffness, toughness, and tensile strength of collagen fibers [
19]. Importantly,
AEBP1 mutations that degrade ACLP functionality abrogate those biomechanical effects, which underscores ACLP’s essential contribution to collagen fibrillogenesis and connective tissue strength [
19]. Based on these insights, we hypothesized that
AEBP1/ACLP expression in CAFs contribute to the stiffness of tumor tissues. Using our previously established CAF-derived 3D spheroid model [
20], we showed that knocking down
AEBP1 prior to spheroid formation significantly reduces their mechanical stiffness as compared to spheroids derived from control CAFs. This suggests that high expression of ACLP in CAFs enhances tumor stiffness and provides a mechanistic link between stromal
AEBP1 expression, collagen remodeling and the biophysical properties of the tumor microenvironment.
In an earlier study, we reported that
AEBP1/ACLP expression in OSCC is inversely correlated with intratumoral infiltration of CD8+ T cells [
14]. We further demonstrated that CAFs suppress CD8+ T-cell infiltration and that
AEBP1/ACLP knockdown in CAFs attenuates this immunosuppressive effect [
14]. When considered together with the present findings, those results suggest that
AEBP1/ACLP-mediated enhancement of tumor stiffness may represent one mechanism by which CAFs restrict CD8+ T-cell entry into tumor tissues. Adding to this, a recent study showed that CAF-derived AEBP1 protein directly drives T-cell dysfunction within the tumor microenvironment [
34]. In that work, fibroblast-derived AEBP1 was found to impair T-cell proliferation and effector function, thereby promoting immune evasion. Taken together, these findings indicate that CAF-derived
AEBP1/ACLP contributes to tumor immune suppression via multiple mechanisms, which include a physical barrier created by increased tissue stiffness as well as direct inhibition of T-cell activity. Thus,
AEBP1/ACLP may serve as a pivotal stromal mediator linking ECM remodeling with immune evasion in the tumor microenvironment.
This study has several limitations that should be acknowledged. First, the pan-cancer analysis was based solely on statistical interrogation of publicly available transcriptomic datasets. Although these results provide broad insights, further validation is needed in individual tumor types. In particular, histological and immunohistochemical analyses are needed to clarify the spatial distribution and protein-level expression of ACLP within tumor tissues. Second, our functional investigation of tissue stiffness relied exclusively on in vitro experiments using CAF-derived 3D spheroid cultures. While this model recapitulates certain aspects of stromal mechanics, it does not fully reflect the complexity of in vivo tumor architecture and stromal-immune interactions. Future studies using animal models and patient-derived tissues will therefore be critical to substantiate our findings. Third, a recent study identified CKAP4 as a receptor for AEBP1 [
34]. Comparative analysis of AEBP1 (ACLP) expression with CKAP4 expression in human tumor samples will be necessary to elucidate the receptor-ligand axis underlying CAF-mediated tumor remodeling and immune regulation.
4. Materials and Methods
4.1. The Cancer Genome Atlas Data Analysis
RNA-seq data from TCGA were analyzed using LinkedOmics (
https://www.linkedomics.org/) to identify genes whose expression correlated with
AEBP1 expression [
35]. Pearson’s correlation test was applied to calculate correlation coefficients between
AEBP1 expression and the expression of all other genes. GO analysis was performed using the Gene Set Enrichment Analysis (GSEA) tool implemented in LinkedOmics. The resulting data were visualized using the ggplot2 package in R v4.5.0.
4.2. Single-Cell RNA-Sequencing Data Analysis
scRNA-seq datasets from breast cancer tissues (GSE228499) and pancreatic cancer tissues (GSE212966) were obtained from the Gene Expression Omnibus [
16,
17]. Analyses were performed using Seurat (v5.3.0) in R v4.5.0. Cells with fewer than 200 or more than 5,000 detected genes, or with >25% mitochondrial transcript content, were excluded. After quality control, 2,000 highly variable genes were selected and used for principal component analysis (PCA). Batch effects across samples were corrected with Harmony [
36]. The top 20 principal components were applied for downstream analyses. Dimensional reduction was performed with UMAP, and clustering was conducted using FindNeighbors and FindClusters with a resolution of 0.5. Cell type annotation was carried out using SingleR with the Human Primary Cell Atlas as a reference.
4.3. Three Dimensional Cell Culture Experiments
CAFs were obtained from tongue OSCC patients and cultured as described [
14]. Human conjunctival fibroblasts (HconF) were obtained and cultured as described [
37]. Cells were transfected with Silencer Select Pre-designed siRNA (100 pmol each; AEBP1 siRNA1, s1145; AEBP1 siRNA2, s1146; Thermo Fisher Scientific) or Silencer Select Negative Control No. 1 siRNA (Thermo Fisher Scientific) using a TransIT-X2 Dynamic Delivery System (Mirus Bio, Madison, WI, USA) as described [
14]. Three-dimensional spheroid drop culture of the cells was then performed as described previously [
20]. Morphological analysis of 3D spheroids using phase contrast microscopy and scanning electron microscopy were performed as described [
38]. The mechanical stiffness of the 3D spheroids was measured using MicroSquisher (CellScale, Waterloo, ON, Canada) as described [
39].
4.4. Statistical Analysis
Comparisons of continuous variables were made using one-way ANOVA. Values of P < 0.05 (two-sided) were considered significant. Data were analyzed using GraphPad Prism 5 (GraphPad Software, La Jolla, CA, USA).
5. Conclusions
In conclusion, our study revealed that AEBP1 expression is strongly correlated with collagen expression across multiple cancers and that AEBP1 is predominantly expressed by CAFs, where it contributes to the enhancement of tumor stiffness. This suggests that AEBP1/ACLP represents a promising therapeutic target through which to remodel the tumor microenvironment and enhance anti-tumor immunity. Future research will be essential to validate its role in vivo, clarify the underlying mechanisms, and explore the potential of targeting AEBP1/ACLP in combination with existing immunotherapies to improve cancer treatment outcomes.
Supplementary Materials
The following supporting information can be downloaded at: Preprints.org, Figure S1: AEBP1 knockdown did not significantly affect size and morphology of 3D spheroids derived from normal fibroblasts.
Author Contributions
Conceptualization, A.Y. and H.S.; methodology, M.W.; validation, S.O., T.N., H.K., K.I., M.S. and M.K.; formal analysis, S.S. and H.S.; investigation, S.S., A.Y. and M.W.; resources, M.I., A.M. and H.O.; data curation, A.Y. and H.S.; writing—original draft preparation, H.S.; writing—review and editing, S.S., A.Y. and T.N.; visualization, S.S., M.W. and H.S.; supervision, K.T., A.M. and H.O.; project administration, H.S.; funding acquisition, S.S., A.Y., F.O., E.Y. and H.S. All authors have read and agreed to the published version of the manuscript.
Funding
This study was supported in part by JSPS KAKENHI Grant Numbers 24K20001 (S. Sekiguchi), 24K12676 (A. Yorozu), 25K20381 (F. Okazaki), 24K11157 (E. Yamamoto), 23K24186 (H. Suzuki) and 25K22694 (H. Suzuki).
Institutional Review Board Statement
This study was approved by the Institutional Review Board at Sapporo Medical University (No. 322–38).
Informed Consent Statement
Informed consent was obtained from all subjects involved in the study.
Data Availability Statement
The data presented in this study are available on request from the corresponding author upon reasonable request.
Acknowledgments
We thank Dr. William F. Goldman for editing the manuscript.
Conflicts of Interest
The authors declare no conflicts of interest.
Abbreviations
The following abbreviations are used in this manuscript:
| ACC |
Adrenocortical carcinoma |
| ACLP |
Aortic carboxypeptidase-like protein |
| ACTA2 |
Actin alpha 2, smooth muscle |
| AEBP1 |
Adipocyte enhancer-binding protein 1 |
| apCAF |
Antigen-presenting cancer-associated fibroblast |
| BLCA |
Bladder urothelial carcinoma |
| BRCA |
Breast invasive carcinoma |
| CAF |
Cancer-associated fibroblast |
| CESC |
Cervical squamous cell carcinoma and endocervical adenocarcinoma |
| CHOL |
Cholangiocarcinoma |
| COADREAD |
Colorectal adenocarcinoma |
| DLBC |
Diffuse large B-cell lymphoma |
| ECM |
Extracellular matrix |
| ESCA |
Esophageal carcinoma |
| FAP |
Fibroblast activation protein |
| FDR |
False discovery rate |
| GBM |
Glioblastoma multiforme |
| GO-BP |
Gene ontology-biological process |
| GO-CC |
Gene ontology-cellular component |
| GO-MF |
Gene ontology-molecular function |
| HNSC |
Head and neck squamous cell carcinoma |
| iCAF |
Inflammatory cancer-associated fibroblast |
| KICH |
Kidney chromophobe |
| KIRC |
Kidney renal clear cell carcinoma |
| KIRP |
Kidney renal papillary cell carcinoma |
| LAML |
Acute myeloid leukemia |
| LGG |
Lower grade glioma |
| LIHC |
Liver hepatocellular carcinoma |
| LUAD |
Lung adenocarcinoma |
| LUSC |
Lung squamous cell carcinoma |
| mCAF |
Matrix cancer-associated fibroblast |
| MESO |
Mesothelioma |
| myCAF |
Myofibroblastic cancer-associated fibroblast |
| NES |
Normalized enrichment score |
| OSCC |
Oral squamous cell carcinoma |
| OV |
Ovarian serous cystadenocarcinoma |
| PAAD |
Pancreatic adenocarcinoma |
| PCPG |
Pheochromocytoma and paraganglioma |
| PDGFRB |
Platelet-derived growth factor receptor β |
| PRAD |
Prostate adenocarcinoma |
| SARC |
Sarcoma |
| SKCM |
Skin cutaneous melanoma |
| scRNA-seq |
Single-cell RNA-sequencing |
| STAD |
Stomach adenocarcinoma |
| TCGA |
The Cancer Genome Atlas |
| TGCT |
Testicular germ cell tumors |
| THCA |
Thyroid carcinoma |
| THYM |
Thymoma |
| UCEC |
Uterine corpus endometrial carcinoma |
| UCS |
Uterine carcinosarcoma |
| UMAP |
Uniform manifold approximation and projection |
| UVM |
Uveal melanoma |
| vCAF |
Vascular cancer-associated fibroblast |
References
- Sahai, E.; Astsaturov, I.; Cukierman, E.; DeNardo, D.G.; Egeblad, M.; Evans, R.M.; Fearon, D.; Greten, F.R.; Hingorani, S.R.; Hunter, T.; et al. A framework for advancing our understanding of cancer-associated fibroblasts. Nat Rev Cancer 2020, 20, 174-186. [CrossRef]
- Caligiuri, G.; Tuveson, D.A. Activated fibroblasts in cancer: Perspectives and challenges. Cancer Cell 2023, 41, 434-449. [CrossRef]
- Naito, Y. How Do Cancer Cells Create Cancer-Associated Fibroblast Subtypes? Impacts of Extracellular Vesicles on Stromal Diversity. Cancer Sci 2025, 116, 2347-2361. [CrossRef]
- Arpinati, L.; Carradori, G.; Scherz-Shouval, R. CAF-induced physical constraints controlling T cell state and localization in solid tumours. Nat Rev Cancer 2024, 24, 676-693. [CrossRef]
- Yamazaki, M.; Ishimoto, T. Targeting Cancer-Associated Fibroblasts: Eliminate or Reprogram? Cancer Sci 2025, 116, 613-621. [CrossRef]
- Yorozu, A.; Yamamoto, E.; Niinuma, T.; Tsuyada, A.; Maruyama, R.; Kitajima, H.; Numata, Y.; Kai, M.; Sudo, G.; Kubo, T.; et al. Upregulation of adipocyte enhancer-binding protein 1 in endothelial cells promotes tumor angiogenesis in colorectal cancer. Cancer Sci 2020, 111, 1631-1644. [CrossRef]
- Layne, M.D.; Endege, W.O.; Jain, M.K.; Yet, S.F.; Hsieh, C.M.; Chin, M.T.; Perrella, M.A.; Blanar, M.A.; Haber, E.; Lee, M.E. Aortic carboxypeptidase-like protein, a novel protein with discoidin and carboxypeptidase-like domains, is up-regulated during vascular smooth muscle cell differentiation. J Biol Chem 1998, 273, 15654-15660. [CrossRef]
- Layne, M.D.; Yet, S.F.; Maemura, K.; Hsieh, C.M.; Bernfield, M.; Perrella, M.A.; Lee, M.E. Impaired abdominal wall development and deficient wound healing in mice lacking aortic carboxypeptidase-like protein. Mol Cell Biol 2001, 21, 5256-5261. [CrossRef]
- Ro, H.S.; Kim, S.W.; Wu, D.; Webber, C.; Nicholson, T.E. Gene structure and expression of the mouse adipocyte enhancer-binding protein. Gene 2001, 280, 123-133. [CrossRef]
- Runtian, Z.; Wenqiang, H.; Zimeng, S.; Tianyu, W.; Jingquan, Z. AEBP1 or ACLP, which is the key factor in inflammation and fibrosis? Int J Biol Macromol 2025, 310, 143554. [CrossRef]
- Schissel, S.L.; Dunsmore, S.E.; Liu, X.; Shine, R.W.; Perrella, M.A.; Layne, M.D. Aortic carboxypeptidase-like protein is expressed in fibrotic human lung and its absence protects against bleomycin-induced lung fibrosis. Am J Pathol 2009, 174, 818-828. [CrossRef]
- Tumelty, K.E.; Smith, B.D.; Nugent, M.A.; Layne, M.D. Aortic carboxypeptidase-like protein (ACLP) enhances lung myofibroblast differentiation through transforming growth factor beta receptor-dependent and -independent pathways. J Biol Chem 2014, 289, 2526-2536. [CrossRef]
- Wang, D.; Rabhi, N.; Yet, S.F.; Farmer, S.R.; Layne, M.D. Aortic carboxypeptidase-like protein regulates vascular adventitial progenitor and fibroblast differentiation through myocardin related transcription factor A. Sci Rep 2021, 11, 3948. [CrossRef]
- Sekiguchi, S.; Yorozu, A.; Okazaki, F.; Niinuma, T.; Takasawa, A.; Yamamoto, E.; Kitajima, H.; Kubo, T.; Hatanaka, Y.; Nishiyama, K.; et al. ACLP Activates Cancer-Associated Fibroblasts and Inhibits CD8+ T-Cell Infiltration in Oral Squamous Cell Carcinoma. Cancers (Basel) 2023, 15. [CrossRef]
- Li, Y.X.; Zhu, X.X.; Wu, X.; Li, J.H.; Ni, X.H.; Li, S.J.; Zhao, W.; Yin, X.Y. ACLP promotes activation of cancer-associated fibroblasts and tumor metastasis via ACLP-PPARgamma-ACLP feedback loop in pancreatic cancer. Cancer Lett 2022, 544, 215802. [CrossRef]
- Joo, E.H.; Kim, S.; Park, D.; Lee, T.; Park, W.Y.; Han, K.Y.; Lee, J.E. Migratory Tumor Cells Cooperate with Cancer Associated Fibroblasts in Hormone Receptor-Positive and HER2-Negative Breast Cancer. Int J Mol Sci 2024, 25. [CrossRef]
- Chen, K.; Wang, Q.; Liu, X.; Tian, X.; Dong, A.; Yang, Y. Immune profiling and prognostic model of pancreatic cancer using quantitative pathology and single-cell RNA sequencing. J Transl Med 2023, 21, 210. [CrossRef]
- Cords, L.; Tietscher, S.; Anzeneder, T.; Langwieder, C.; Rees, M.; de Souza, N.; Bodenmiller, B. Cancer-associated fibroblast classification in single-cell and spatial proteomics data. Nat Commun 2023, 14, 4294. [CrossRef]
- Vishwanath, N.; Monis, W.J.; Hoffmann, G.A.; Ramachandran, B.; DiGiacomo, V.; Wong, J.Y.; Smith, M.L.; Layne, M.D. Mechanisms of aortic carboxypeptidase-like protein secretion and identification of an intracellularly retained variant associated with Ehlers-Danlos syndrome. J Biol Chem 2020, 295, 9725-9735. [CrossRef]
- Nishikiori, N.; Takada, K.; Sato, T.; Miyamoto, S.; Watanabe, M.; Hirakawa, Y.; Sekiguchi, S.; Furuhashi, M.; Yorozu, A.; Takano, K.; et al. Physical Properties and Cellular Metabolic Characteristics of 3D Spheroids Are Possible Definitive Indices for the Biological Nature of Cancer-Associated Fibroblasts. Cells 2023, 12. [CrossRef]
- Liu, J.Y.; Jiang, L.; Liu, J.J.; He, T.; Cui, Y.H.; Qian, F.; Yu, P.W. AEBP1 promotes epithelial-mesenchymal transition of gastric cancer cells by activating the NF-kappaB pathway and predicts poor outcome of the patients. Sci Rep 2018, 8, 11955. [CrossRef]
- Xing, Y.; Zhang, Z.; Chi, F.; Zhou, Y.; Ren, S.; Zhao, Z.; Zhu, Y.; Piao, D. AEBP1, a prognostic indicator, promotes colon adenocarcinoma cell growth and metastasis through the NF-kappaB pathway. Mol Carcinog 2019, 58, 1795-1808. [CrossRef]
- Li, J.; Ruan, Y.; Zheng, C.; Pan, Y.; Lin, B.; Chen, Q.; Zheng, Z. AEBP1 Contributes to Breast Cancer Progression by Facilitating Cell Proliferation, Migration, Invasion, and Blocking Apoptosis. Discov Med 2023, 35, 45-56. [CrossRef]
- Zhou, Q.; Wang, X.; Zhang, Y.; Wang, L.; Chen, Z. Inhibition of AEBP1 predisposes cisplatin-resistant oral cancer cells to ferroptosis. BMC Oral Health 2022, 22, 478. [CrossRef]
- Ju, G.; Xing, T.; Xu, M.; Zhang, X.; Sun, Y.; Mu, Z.; Sun, D.; Miao, S.; Li, L.; Liang, J.; et al. AEBP1 promotes papillary thyroid cancer progression by activating BMP4 signaling. Neoplasia 2024, 49, 100972. [CrossRef]
- Ladha, J.; Sinha, S.; Bhat, V.; Donakonda, S.; Rao, S.M. Identification of genomic targets of transcription factor AEBP1 and its role in survival of glioma cells. Mol Cancer Res 2012, 10, 1039-1051. [CrossRef]
- Liu, S.; Gu, Y.; Shi, Y.; Yu, S.; Li, W.; Lv, W. AEBP1 upregulation contributes to cervical cancer progression by facilitating cell proliferation, migration, and invasion. J Obstet Gynaecol Res 2024, 50, 1166-1174. [CrossRef]
- Kurosu, H.; Yamada, N.; Nakamura, R.; Ito, H.; Ohnishi, K.; Inoko, A.; Riku, M.; Muramatsu, T.; Sassa, N.; Kasai, K. AEBP1-GLI1 pathway attenuates the FACT complex dependency of bladder cancer cell survival. Biochem Biophys Rep 2025, 43, 102101. [CrossRef]
- Jia, C.; Gong, Z.; Zhang, L. Silencing of AEBP1 inhibits proliferation and promotes apoptosis via the AKT signaling pathway in osteosarcoma. Biomed Rep 2025, 23, 128. [CrossRef]
- Blackburn, P.R.; Xu, Z.; Tumelty, K.E.; Zhao, R.W.; Monis, W.J.; Harris, K.G.; Gass, J.M.; Cousin, M.A.; Boczek, N.J.; Mitkov, M.V.; et al. Bi-allelic Alterations in AEBP1 Lead to Defective Collagen Assembly and Connective Tissue Structure Resulting in a Variant of Ehlers-Danlos Syndrome. Am J Hum Genet 2018, 102, 696-705. [CrossRef]
- Syx, D.; De Wandele, I.; Symoens, S.; De Rycke, R.; Hougrand, O.; Voermans, N.; De Paepe, A.; Malfait, F. Bi-allelic AEBP1 mutations in two patients with Ehlers-Danlos syndrome. Hum Mol Genet 2019, 28, 1853-1864. [CrossRef]
- Hebebrand, M.; Vasileiou, G.; Krumbiegel, M.; Kraus, C.; Uebe, S.; Ekici, A.B.; Thiel, C.T.; Reis, A.; Popp, B. A biallelic truncating AEBP1 variant causes connective tissue disorder in two siblings. Am J Med Genet A 2019, 179, 50-56. [CrossRef]
- Sanai, H.; Nakamura, Y.; Koike, Y.; Murota, H.; Kosho, T.; Sase, M. The detailed obstetric course of the first Japanese patient with AEBP1-related Ehlers-Danlos syndrome (classical-like EDS, type 2). J Obstet Gynaecol Res 2023, 49, 1043-1047. [CrossRef]
- Wang, X.; Li, J.; Song, D.; Wu, Y.; Liu, J.; Yi, Z.; Sun, J.; Huang, J.; Wu, L.; Zhang, X.; et al. AEBP1 drives fibroblast-mediated T cell dysfunction in tumors. Nat Commun 2025, 16, 8171. [CrossRef]
- Vasaikar, S.V.; Straub, P.; Wang, J.; Zhang, B. LinkedOmics: analyzing multi-omics data within and across 32 cancer types. Nucleic Acids Res 2018, 46, D956-D963. [CrossRef]
- Korsunsky, I.; Millard, N.; Fan, J.; Slowikowski, K.; Zhang, F.; Wei, K.; Baglaenko, Y.; Brenner, M.; Loh, P.R.; Raychaudhuri, S. Fast, sensitive and accurate integration of single-cell data with Harmony. Nat Methods 2019, 16, 1289-1296. [CrossRef]
- Oouchi, Y.; Watanabe, M.; Ida, Y.; Ohguro, H.; Hikage, F. Rosiglitasone and ROCK Inhibitors Modulate Fibrogenetic Changes in TGF-beta2 Treated Human Conjunctival Fibroblasts (HconF) in Different Manners. Int J Mol Sci 2021, 22. [CrossRef]
- Ida, Y.; Hikage, F.; Itoh, K.; Ida, H.; Ohguro, H. Prostaglandin F2alpha agonist-induced suppression of 3T3-L1 cell adipogenesis affects spatial formation of extra-cellular matrix. Sci Rep 2020, 10, 7958. [CrossRef]
- Hikage, F.; Atkins, S.; Kahana, A.; Smith, T.J.; Chun, T.H. HIF2A-LOX Pathway Promotes Fibrotic Tissue Remodeling in Thyroid-Associated Orbitopathy. Endocrinology 2019, 160, 20-35. [CrossRef]
|
Disclaimer/Publisher’s Note: The statements, opinions and data contained in all publications are solely those of the individual author(s) and contributor(s) and not of MDPI and/or the editor(s). MDPI and/or the editor(s) disclaim responsibility for any injury to people or property resulting from any ideas, methods, instructions or products referred to in the content. |
© 2025 by the authors. Licensee MDPI, Basel, Switzerland. This article is an open access article distributed under the terms and conditions of the Creative Commons Attribution (CC BY) license (http://creativecommons.org/licenses/by/4.0/).