
Submitted:
15 October 2025
Posted:
20 October 2025
You are already at the latest version
Abstract
Introduction: Cardiovascular disease (CVD) remains a primary cause of mortality worldwide, with persistent disparities driven by a complex interplay of risk factors. Efforts in continual update of localized variations in CVD mortality are essential to develop targeted interventions for optimizing disease and healthcare management.
Methods: This study investigated associations between CVD mortality and a comprehensive mix of factors covering biological, environmental, behavioral, and socioeconomic domains across all U.S. counties. County-level data gathered from nationwide databases were leveraged for correlation analysis, geospatial visualization, stepwise multiple regression and machine learning models to evaluate the importance of risk associations.
Results: Significant disparities in CVD mortality trend were observed across race, age, sex, and region, with elevated rates among older adults, men, and Blacks, particularly in southeastern states exhibiting severe social vulnerability. Correlation analysis identified disease management (e.g., COPD, hypertension, medication non-adherence), environmental factors (PM2.5), lifestyle behaviors (e.g., smoking, sleep duration), and socioeconomic status (e.g., poverty, single-parent households, education) as important contributors to CVD mortality rates. Conversely, higher household income, physical activity and cardiac rehabilitation participation were strong protectors. Multiple regression explained 66.9% variance in CVD mortality, recognizing PM2.5, smoking, and medication non-adherence as top predictors. Random Forest models underscored COPD's predictive dominance being followed by medication non-adherence, smoking, and sleep duration.
Conclusion: The findings highlight the geospatial connection of risk factors to CVD mortality disparities across U.S. counties. It emphasizes the critical importance of data-driven strategies targeting air quality, tobacco control, social inequities, and chronic disease management to mitigate CVD burden and promote health equity.
Keywords:
cardiovascular disease
; risk factors
; geospatial distribution
; correlation
; regressions
; random forest models
1. Introduction
Cardiovascular disease (CVD) has been acknowledged posing the foremost challenge to global public health since the 21st century (Martin et al., 2024). It claims millions of lives annually, with 80% of the deaths occurring in lower-income countries, reflecting disparities in societal and economic developments. Even in the United States, CVD remains a primary healthcare concern despite extensive prevention and treatment advancements (Martin et al., 2024), with projections indicating a rise in prevalence and associated costs through 2050 due to an aging population and persistent risk factors, especially within racially diverse communities (Maddox et al., 2024). While improvements in medical technology and healthcare have reduced age-relevant mortality, geographic and sociodemographic disparities in CVD outcomes persist. Understanding regional distribution and impact of diverse risk factors is crucial for designing targeted public health interventions. Multiple risk factors, including hypertension, diabetes, obesity, smoking, physical inactivity, and suboptimal sleep patterns have been consistently recognized as biological and behavioral determinants contributing to adverse cardiovascular health outcomes (Addo et al., 2024; Maddox et al., 2024; Magnussen et al., 2023; Martin et al., 2024; Welsh et al., 2024). Beyond these traditional metabolic and lifestyle factors on individual level, emerging evidence highlights the role of environmental and social determinants, such as exposure to pollutants of fine particulate matter PM2.5 (Krittanawong et al., 2023), heavy metals (Lamas et al., 2023), transportation noise (Münzel et al., 2024), water quality, green spaces (Kang et al., 2024), and socioeconomic status like low family income and neighborhood-level social vulnerability (Bevan et al., 2023; Minhas et al., 2023; Wilcox et al., 2024), in exacerbating CVD risk and mortality across regions and populations. For instance, education, income, and internet as components of socioeconomic household status have been linked to cardiovascular health, indicating systemic inequities in access to medical info and care for health management and timely services (Baptista and Queiroz, 2022; Bevan et al., 2023; Cotton et al., 2024; Kundrick et al., 2024).
The interplay among the CVD risk factors is highly complex, with synergistic effects that can seriously elevate mortality. More than half of CVD cases may be attributable to the combined impact of five major modifiable factors (Magnussen et al., 2023). This intricate interplay often fosters bidirectional relationships between CVD and other conditions, such as cancer, mental disorders, and chronic obstructive pulmonary disease (COPD) (Fabbri et al., 2023; Wilcox et al., 2024). Adding another layer to complexity, the relationships between the interrelated risk factors and CVD outcomes can vary significantly across geographic areas and population subgroups (Aggarwal et al., 2023; Bevan et al., 2023; Minhas et al., 2023). This underscores the necessity for localized insights into their associations to inform targeted public health interventions. Various studies have been conducted to explore associations of CVD mortality and prevalence with risk factors at different geospatial levels. At the state-by-county level, the median household income and air quality PM2.5 have been identified as the most significant factors explaining CVD mortality in Georgia of the U.S. (Adepu et al., 2020). Research exploring CVD at the national-by-county level suggests that demographic composition, education, income inequality, and social vulnerability are the major contributors to the care costs associated with the prevalence of CVD in the US (Sun et al., 2023). Additionally, studies from South Korea applying AI technical analysis show that high CVD mortality rates often coincide with poor air quality and insufficient green infrastructure (Kang et al., 2024). At the international level, CVD mortality can be possibly affected by characteristics of surrounding nations, with income and other socioeconomic variables being key influencers (Baptista and Queiroz, 2022). Nonetheless, most current studies have focused on geographical averages and often lack in-depth analyses of how these multifaceted risk factors interact at a granular, regional-specific level, potentially masking crucial geospatial disparities. There remains a critical need for comprehensive, geographically resolved analyses that integrate all the environmental, social, economic, and lifestyle factors into considerations to inform targeted public health interventions for developing effective, region-specific prevention strategies (Maddox et al., 2024).
The study herein investigates the associations between CVD mortality and a comprehensive set of risk factors, covering traditional, environmental, behavioral, and socioeconomic perspectives, across all U.S. counties. By leveraging county-level data, the primary goal is set to capture crucial geographic variations and provide a robust framework for understanding how these factors collectively influence CVD mortality rates at the local level. This approach would offer a unique framework by considering the interplay of the factors within specific geographic contexts. For instance, disparities in access to healthcare, socioeconomic inequalities, environmental pollution, and lifestyle factors can vary considerably across counties, potentially contributing to variations in CVD mortality rates. By examining factors at the national-by-county level, this research aims to (1) investigate macro-scale geographic associations between CVD mortality and a complex mixture of human, social, and environmental factors; (2) visualize spatial distribution of CVD mortality and its associated risk factors across the United States; (3) employ advanced statistical and machine learning methods to analyze the complex interdependencies among these factors; (4) inform application of data-driven integrative approaches for development of targeted public health interventions to reduce CVD mortality across U.S. regions. Ultimately, the findings from this study would contribute to a comprehensive understanding of CVD mortality disparities, thereby providing valuable insights into effective and targeted intervention strategies.
2. Methodology
2.1. Data Collection
The data used for analyses were collected from publicly accessible databases of Centers for Disease Control and Prevention (CDC) on November 21, 2024. They were organized in national-by-county geographic type encompassing CVD mortality rates and other different variables. The CVD mortality rates categorized by age, gender and ethnicities from the U.S. counties overtime before and during COVID-19 were sourced from CDC Heart Disease & Stroke Interactive Atlas (http://nccd.cdc.gov/DHDSPAtlas/Reports.aspx). Other datasets were gathered from National Environmental Public Health Tracking Network (https://ephtracking.cdc.gov/download) or CDC National Center for Health Statistics (NCHS) (https://data.cdc.gov/browse), wherever they were available. Specifically, drug poisoning mortality rates were downloaded from NCHS; Interactive Atlas was used to extract relevant data pertaining to lifestyle prevalence of coronary heart disease, high blood pressure, stroke, high cholesterol, diabetes, obesity, physical inactivity, alcohol use, less sleep, and smoking status, social and economic status of broadband internet, computer, education, food stamp, median home value, median household income, income inequality, poverty, housing cost burden, and unemployment rate, physical environment of air quality, park access, and urbanization, and healthcare delivery status of insurance coverage, care costs, blood pressure medication, diuretic non-adherence, renin-angiotensin system antagonism non-adherence, cholesterol-lowering medication, cholesterol screening, cardiac rehabilitation, hospitals, pharmacies, physicians, and specialists; Tracking Network was utilized for collection of factors and indicators including prevalence of asthma, cancer, and COPD, demographic and socioeconomic indices in the composition of community capital resilience, economic resilience, environmental resilience, infrastructural resilience, institutional resilience, social resilience, and social vulnerability, individual components like household composition, transportation, single family, etc., and built environment like age of housing, land cover and use, traffic safety, sunlight, exposure to hazards, etc.
2.2. Data Preparation
The gathered datasets from the publicly available database contained either FIPS (federal information processing standards code uniquely identifying counties in the US) or county-state geographic information in their data-frame. For datasets missing FIPS, geographic identifier was added by cross-checking county-state information with a standardized code reference table via a Python-based approach. The individual datasets were then merged into a single unified data-frame using the 'FIPS' code as the primary index key through the data manipulation library of Pandas in Python. This allowed integration of data from various sources into a coherent structure for subsequent analyses. Any missing values (NA) in the consolidated data-frame were removed to ensure data integrity. Scatter plot exploratory data analyses (EDA) were initially performed to visualize distribution of the variables of interest. This visual inspection helped identify the need for data transformation. Box-Cox transformation was considered to stabilize variance if scatter plot indicated a non-normal distribution or heteroscedasticity, otherwise, Johnson transformation was explored as an alternative.
2.3. Data Analyses
The study was structured with counties as the units of analysis. One-way ANOVA was used to determine differences in the CVD mortality rates across race, age, gender, and year. This allowed for identification of potential trends and disparities in CVD mortality rates over time and across different demographic groups. To evaluate factors influencing CVD mortality rates, a stepwise approach was employed as detailed below. Correlation analysis was first utilized to examine the relationships between CVD mortality rates and various factors. Pearson's correlation coefficient was calculated to measure the strength and direction of linear associations from the variables. The identified factors in strong correlation to the CVD mortality were subsequently included in the geographical mapping visualization and regression model analysis. Geographic information systems (GIS) were used to map the spatial distribution of CVD mortality rates and risk factors across US counties. Multiple regression analysis employing stepwise selection of least squares was utilized to project the relationship between CVD mortality rates and the chosen factors in accordance with the correlation matrix, while controlling potential confounders and interactions between variables to enhance model efficacy. This model enabled evaluation of the independent and combined effects of the factors on the outcome variable. Finally, machine learning models were tested to evaluate the geographical correlations between CVD mortality rates and the factors across US counties, specifically by utilizing popular Random Forest and Support Vector Machine (SVM) algorithms. The dataset was partitioned into 80% for model training and 20% for subsequent evaluation. Model performance was assessed with metrics such as Mean Squared Error (MSE) and R-squared for effective identification of key predictors of CVD mortality rates and their relative importance to the prediction.
3. Results
3.1. Demographic Disparities
The data collected in national-by-county geographic type were initially explored to visualize the trend and disparities in CVD mortality rates across racial, age and gender groups before diving deeper into associated risk factor profiles. Trends and disparities in CVD mortality rates were evident across demographic groups (Figure 1). There has been a notable decline in mortality rates from 2006 to 2019 (Figure 1A), indicating the effectiveness of public health interventions and advancements in medical treatment. However, the trend has bounced back in 2020 and reached similar levels as in 2011 and 2012, implying that COVID-19 related factors have had a significant impact on CVD mortality rates. Significant disparities in CVD mortality rates were observed between men and women (Figure 1B). Men have consistently exhibited higher rates of mortality compared to women across all age groups. This conflicts with previous conclusion and underscores the importance of reconsidering gender-specific risk factors and interventions in CVD management (DuPont et al., 2019; Rodgers et al., 2019). There is a strong association between age and CVD mortality, with the highest death rates occurring in the 65+ age group (Figure 1C), emphasizing critical need for early prevention and risk management strategies, particularly for individuals in older age groups. The data also reveal stark disparities in CVD mortality rates across different racial and ethnic groups (Figure 1D), with Black experiencing the highest rates, followed by Native American, White, Mixed, Hispanic, and Asian. It is not surprising that mixed races show the highest variation in CVD mortality rates as compared to others. The pronounced disparities across racial and ethnic groups reflect long-standing inequities in healthcare access, socioeconomic conditions (e.g., poverty, food insecurity, inadequate housing, unemployment etc.), and exposure to other risk factors such as hypertension, diabetes, smoking, mental health, and environmental toxins (Borkowski et al., 2024; Zuma et al., 2021). To address disparities across different demographic groups, it is essential to conduct further research integrating comprehensive behavioral, socioeconomic, and environmental data into cardiovascular health strategies to develop targeted interventions (Borkowski et al., 2024).
3.2. Key Correlation Factors
The correlation analyses between CVD mortality rates and various factors categorized their associations into different significances (Table 1). A big portion of factors had P-values less than 0.0001, indicating their significant relationships with CVD mortality rates. Conventionally, the correlations were considered as strong (absolute R ≥ 0.7), moderate (0.5 ≤ absolute R < 0.7), low (0.3 ≤ absolute R < 0.5), and negligible (absolute R < 0.3) (Akoglu, 2018). Out of all the risk factors, COPD shows the strongest correlation (R = 0.7). This strong association suggests that policymakers and clinicians should prioritize effective COPD management as an indirect, yet vital, approach to decrease CVD mortality. While the scatter plot visually confirms COPD's importance (Figure 2), the moderate spread of its data points also highlights that other variables significantly influence CVD mortality. As a well-known lifestyle risk factor, smoking was highly associated with CVD mortality rates (R = 0.65), underlining the importance of tobacco control in public health management. High blood pressure as a direct contributor to CVD well explained its correlation (R = 0.64), as well as stroke (R = 0.54). Less sleep emerges as another significant risk factor (R = 0.64), possibly linking to chronic stress and hypertension (Wang et al., 2022). Poverty is associated with limited access to healthcare, unhealthy lifestyles, and stress, which can potentially increase cardiovascular risk (R = 0.59). High reliance on food assistance programs like Food Stamp reflects socioeconomic challenges, further emphasizing the role of poverty in cardiovascular health (R = 0.55). Socioeconomic and social vulnerability indicators (R = 0.4-0.5) like socioeconomic vulnerability rank, single-parent households, and social vulnerability indexes show low correlations, linking the impact of social determinants on health outcomes. Health-related behaviors and factors like coronary heart disease (R = 0.44), diabetes (R = 0.42), leisure-time physical inactivity (R = 0.38), and non-adherence to medications (e.g., blood pressure, diuretics, renin-angiotensin antagonists) are weakly associated, reflecting their contribution power to CVD mortality. The low R values for surrounding environment like household internet access (R = 0.34) and PM2.5 (R = 0.38) indicate that living conditions have a considerable impact on cardiovascular health. Interestingly, obesity as one of the well-established health factors has a weaker but statistically significant correlation (R = 0.09; P-value < 0.0001) to CVD mortality, suggesting more nuanced relationships. This is actually in line with the previous statement that obesity might have a protective effect on the clinical outcome of underlying CVD as the improved cardiac imaging techniques allow the early detection of altered structure and function of the heart in obese patients, resulting in improved survival (Powell-Wiley et al., 2021). Factors like median household income (R = -0.59), social resilience (R = -0.53), alcohol use (R = -0.509), and institutional resilience (R = -0.33) with negative correlations indicate low to moderate protective effects or reverse relationships. While it has been inconclusive and conflictive whether alcohol consumption offers cardio protection in previous studies (Toma et al., 2017), the geographic correlation revealed in this study supports its protective effects. The negative correlation of households with smart phones (R = -0.298) implies there is a weak to negligible protective relationship with CVD mortality. Mobile technology might enable increased access to effective prevention of CVD. Given the high penetration of smart phones into groups with low socioeconomic status, health-related mobile applications might provide an opportunity to overcome traditional barriers to cardiac rehabilitation access (Neubeck et al., 2015). In terms of accessibility, urbanization and healthcare access like developed areas with better infrastructure (e.g., hospitals with cardiac rehabilitation, R = -0.14) and walkability (persons walking to work, R = -0.11) are negligibly linked to reduced CVD mortality rates. Surprisingly, the geospatial correlation barely favors a close relationship between CVD and cancer (R = -0.082), despite being two of the leading causes of death worldwide with known common mechanisms and risk factors that predispose individuals to both conditions (Wilcox et al., 2024). This negligible correlation, though statistically significant (P-value < 0.0001), suggests that their interconnection isn't strongly reflected at a geographic level, a phenomenon also observed in the case of obesity as described above. There are a few factors like atrazine in water (P-value = 0.28) and certain healthcare access measures (e.g., cardiovascular physician, P-value = 0.23) showing no significant relationships. This is in conflict with a previous meta study that indicates positive association of CVD with chronic exposure to drinking water arsenic at concentrations below the WHO provisional guideline value (Xu et al., 2020). One explanation could be due to the limited data points for this factor in the study.
3.3. Geospatial Associations
Three correlation factors at moderate (social vulnerability), low (air quality PM2.5) and negligible (sunlight UV exposure) levels were chosen to showcase the geospatial disparities and potential environmental and social contributors to cardiovascular health outcomes across the United States (Figure 3). The geographic distribution reveals regional disparities with high CVD mortality rates prominently visible in the southeastern U.S., particularly around Mississippi River Basin, including states like Mississippi, Alabama, Louisiana, and parts of Arkansas (Figure 3A). In contrast, areas in the western and northeastern U.S. display significantly lower mortality rates. These disparities underscore the potential role of public health interventions targeting high-risk regions to reduce CVD burden. As a composite measure that assesses the resilience of communities to external stressors such as natural disasters, economic shocks, or public health crises, high social vulnerability index (SVI) indicates populations with greater vulnerability, often linked to factors like low socioeconomic status, limited access to education, racial and ethnic minority status, housing instability, and transportation challenges. Regions with high SVI scores are predominantly concentrated in the southern and southeastern U.S. (Figure 3B), overlapping with areas of high CVD mortality rates. This alignment highlights how social vulnerabilities—such as poverty and healthcare disparities—can exacerbate cardiovascular risk and worsen outcomes. Conversely, lower SVI scores in the Midwest and western states suggest communities with stronger social and economic resilience, which may correlate with better cardiovascular health outcomes. Higher concentrations of PM2.5 are observed in regions with significant industrial activity, urbanization, or reliance on fossil fuel combustion, such as parts of California, the Midwest (including the Ohio River Valley), and the Northeast (Figure 3C). Long-term exposure to PM2.5 has been linked to cardiovascular conditions, including atherosclerosis, hypertension, and myocardial infarction, due to mechanisms such as systemic inflammation and oxidative stress (Al-Kindi et al., 2020). While there is no notable visual overlap between poor air quality and high CVD mortality, many regions with high PM2.5 levels coincide with elevated death rates. The distribution of annual sunlight exposure across the United States demonstrates a clear latitudinal gradient, with higher levels in southern states (Figure 3D). Sunlight has complex effects on health, with moderate exposure promoting vitamin D synthesis but excessiveness increasing oxidative stress and inflammation, potentially influencing cardiovascular outcomes. Regions with higher sunlight exposure in southern states likely exhibit elevated CVD mortality rates. Together, the spatial patterns reveal the multifaceted nature of cardiovascular disease, where social, environmental, and geographic factors converge in shaping its outcomes.
3.4. Multiple Regression Modeling
The factors with absolute R values ≥ 0.3 in the correlation were subjected to a stepwise multiple regression analysis. Variables with high P-values (> 0.05) in the regression were further removed to optimize the model performance. The factors removed from the analysis included family without internet (P-value = 0.148), housing infrastructural resilience (P-value = 0.254), social resilience score (P-value = 0.245), household composition disability (P-value = 0.939), overall percentile vulnerability (P-value = 0.54), socioeconomic percentile vulnerability (P-value = 0.258), alcohol use (P-value = 0.722), asthma (P-value = 0.143), incremental post-acute cost (P-value = 0.271), post-acute care cost (P-value = 0.069), diabetes (P-value = 0.329), leisure-time physical inactivity (P-value = 0.286), median home value (P-value = 0.199), household without internet (P-value = 0.45), poverty (P-value = 0.952), park access (P-value = 0.359), renin angiotensin system antagonist non-adherence (P-value = 0.051), and social vulnerability (P-value = 0.196). Although the correlation examination and previous studies have indicated that some of these removal factors are highly associated with an increased risk of CVD mortality, like asthma (Xu et al., 2017) and physical inactivity (Perry et al., 2023), they are not significantly contributing to the multiple regression based on the P-values. This is highly possible due to the interconnection between factors, e.g., physical inactivity with PM2.5. The current literature suggests that air pollution may prevent people from engaging in physical activity overall in highly polluted environments (Tainio et al., 2021). The variance inflation factor (VIF) values in the regression procedure have been further used to evaluate whether the multiple factors are correlated causing multicollinearity concerns. Any factors with a VIF value greater than 5 would indicate that the regression coefficients were poorly estimated due to severe multicollinearity. The stepwise multiple regression projected the association between CVD mortality rates and various factors after resolving multicollinearity concerns via Principal Component Analysis (PCA) and exclusion of high VIF variables that could not be addressed by PCA (Table 2). During resolution of the multicollinearity, PC 1 from the PCA of COPD, coronary heart disease, smoking, high blood pressure, and stroke still gave a VIF value bigger than 5, suggesting strong correlation and synergistic effects among these factors. The regression model was optimized step-by-step via removing one of these factors each time to compare the outcomes of R-sq and VIF values. The factor giving the higher R-sq and lower VIF was finally used for the regression analysis, and it was smoking status in this case. Upon successful resolution of multicollinearity, VIF values for all variables participating in regression fell below the threshold of 5. The optimized regression model was fit with an R2 value of 66.93% after eliminating the insignificant factors and multicollinearity concern (Table 2). The R2 value indicates that the variables in the model could explain 66.93% of the variance in CVD mortality rates. The R2 (66.93%) is highly close to the adjusted (66.72%) and predicted (66.34%) values, suggesting that the model is not over fit and has moderate predictive ability. The regression coefficients and t-values further pointed to the strength and significance of the predictors. The analysis highlighted the interplay of socioeconomic, behavioral, and environmental factors influencing CVD mortality rates. Particularly, PM2.5 emerged as the strongest predictor (β = 4.72, P-value < 0.001), being followed by smoking status (β = 4.48, P-value < 0.001), blood pressure medication (BPM) non-adherence (β = 0.0886, P-value < 0.001), cardiac rehabilitation eligibility (β = 1.07, P-value < 0.001) and blood pressure medication use (β = 1.23, P-value < 0.001) as pivotal modifiable risk factors, underscoring their relevance in targeted public health interventions. Socioeconomic and household factors, such as single-parent households (β = 0.593, P-value = 0.007), food stamp usage (β = 0.364, P-value = 0.026), no college degree (β = 0.301, P-value = 0.009), and disability (β = 0.434, P-value = 0.039) were positively associated with higher CVD mortality rates. Other lifestyle and health-related predictors, such as diabetes (β = 1.01, P-value = 0.042), sleep hour (β = 0.931, P-value = 0.001), and post-acute care cost (β = 0.0186, P-value < 0.001) were also significant. Conversely, protective socioeconomic factors such as household income (β = −0.458, P-value < 0.001), park access (β = −0.0722, P-value = 0.012), and mobile-home housing (β = −0.512, P-value < 0.001) suggest opportunities for structural improvements in cardiovascular health outcomes. Factors like no high school diploma (β = −1.06, P-value < 0.001) and alcohol use (β = −0.826, P-value = 0.021) were inversely associated with CVD mortality rates, potentially reflecting confounding lifestyle variables. Interestingly, factors of no college degree and no high school diploma contributed to the regression model differently with one positive and the other negative. This divergence might be attributed to the broader trend and association between higher education and healthier lifestyles. Specifically, individuals with more educational background are less prone to risk factors like smoking, high salt intake, air pollution exposure, and depression. Conversely, they are more likely to engage in physical activity and benefit from increased household income, highlighting the importance to mitigate educational inequality in efforts to address CVD mortality disparities (Hu et al., 2024).
3.5. Machine Learning Prediction
The Random Forest and SVM machine learning models were tested to evaluate predictive power of various factors on CVD mortality rates. The outcomes of these models are highly consistent with the findings from correlation and multiple regression analyses. Both models explained over 60% of the variance in the target variable, with Random Forest (MSE of 0.0984 and R² of 0.6960) outperformed SVM (MSE of 0.1119 and R² of 0.6544). The feature importance values from Random Forest quantify the relative contribution of each factor to the prediction of CVD mortality rates. COPD emerges as the most critical predictor, contributing nearly half (45.42%) of the model's predictive power (Figure 4). This suggests that COPD management should be a priority in regions with high CVD mortality rates to address underlying risks. Smoking and PM2.5 remain significant predictive factors in the model with importance values of 6.19% and 3.05, respectively. This strengthens the importance of public health initiatives, especially the efforts focused on respiratory healthcare enhancement, in combating COPD and CVD prevalence. Those interventions could encompass anti-smoking campaigns, smoking cessation programs, targeting high-risk smokers, taxation on tobacco products, and improving air quality. Non-adherence to blood pressure medications (BPM) is the second most influential feature in the model, with an importance of 8.44%, being closely followed by diuretic non-adherence at 8.24% importance. In addition, cardiac rehabilitation (importance: 3.01%) and high blood pressure (importance: 2.93%) were notable features in the model. This highlights the critical role of medication adherence in maintaining cardiovascular health, especially for patients on first-line treatment of hypertension and heart failure as non-adherence can lead to fluid retention, increased cardiac workload, and higher risks of stroke (Roush et al., 2014). Healthcare providers should emphasize the importance of adherence and provide practical solutions to patients, such as fixed-dose combination therapies or subsidized medications. Sleep duration contributes an importance of 4.14% to the model. This aligns with the widely accepted understanding that poor sleep habits are tied to risk factors for cardiovascular stress, including hypertension, obesity, stress, etc. In terms of clinical practice, integrating sleep assessments into routine health screenings might uncover hidden cardiovascular risks.
4. Discussion
This study presents a comprehensive county-level analysis of CVD mortality and its associations with a wide spectrum of risk factors across the United States. A rigorous stepwise analytical framework, integrating correlation, regression and machine learning, was employed to identify and prioritize risks for targeted interventions. The multi-stage approach ensures that variables with subtler effects are not overshadowed by stronger factors in a multivariate context, thereby enhancing the comprehensiveness and reliability of the analytical results. The findings reinforce that CVD mortality disparities are not solely driven by biological or individual-level behaviors, but are also intertwined with broader systemic, socioeconomic, and environmental determinants. The observed demographic disparities, particularly the prominent racial disparities with Black and Native American populations experiencing the highest CVD mortality, indicate the cumulative impact of socioeconomic disadvantages, environmental exposures, and healthcare access barriers on these communities (Borkowski et al., 2024; Zuma et al., 2021). The strong association between age and CVD mortality in the 65+ group reemphasizes the importance of early prevention strategies, such as lifestyle interventions and regular screenings, to mitigate risk accumulation over time (Magnussen et al., 2023). The decline in CVD mortality rates from 2006 to 2019, followed by a significant rebound in 2020, is a critical notion, reflecting the COVID-19 impact on healthcare systems, lifestyle behaviors, and cardiovascular complications (Martin et al., 2024). This warrants further investigation into its long-term effects and underscores the need for resilient healthcare systems capable of maintaining CVD management during public health crises. These efforts should be well informed by the detailed comprehension of dominant pathways to CVD mortality disparities across U.S. regions as portrayed below towards prioritizing mitigation of the most influential risk factors.
Among the individual risk factors, COPD emerged as the strongest predictor of CVD mortality in both statistical and machine learning models, consistent with the established bidirectional relationship between the two conditions (Fabbri et al., 2023). The robust link between COPD and CVD likely reflects shared risk factors, such as smoking and inflammation, as well as pathophysiological mechanisms (Fabbri et al., 2023). Hypertension and stroke are two other bidirectional conditions that show significant relationship with CVD mortality in the correlation and regression analyses. These insights advocate for integrated and patient-centered approaches to CVD and related comorbidities, incorporating multimodal interventions that target shared pathways to yield dual benefits (Barbera et al., 2024; Nelson et al., 2024; Wilcox et al., 2024). Within the patient-centered frameworks, a key component should be a focus on behavioral interventions. Lifestyle factors, including smoking status, sleep duration, and medication adherence, particularly for blood pressure medications and diuretics, ranked as the second most significant predictors to CVD mortality rates in either analysis of correlation, regression or the machine learning model, reinforcing their importance in CVD prevention (Addo et al., 2024; Magnussen et al., 2023; Perry et al., 2023). In addition, the significance of physical activity, as evidenced in the correlation analysis, is consistent with previous studies supporting its preventive measure for the development of CVD (Baran et al., 2024). Similarly, good habit of cardiac rehabilitation participation is another protective factor showing significance in the correlation analysis, reinforcing previous study (Taylor et al., 2022). Public health efforts should therefore explore practical solutions to promote adherence to these lifestyle interventions through patient education with cost-effective strategy to reduce CVD risk (Addo et al., 2024). For instance, strategies like promotion of healthy lifestyle behaviors, financial support of affordable medications, utilization of adherence-tracking technologies, and enhancement of effective risk communication should be routinely integrated into clinical consultations and public health campaigns to improve patient-perceived risk and encourage behavioral changes (Bakhit et al., 2024; Nelson et al., 2024). Interestingly, negative correlation of alcohol use, while conflicting with general cognition, supports the notion of a potential protective effect at a geographic level, though this remains a subject of ongoing debate and requires careful interpretation given the complexities of alcohol consumption patterns and their health impacts (Toma et al., 2017).
Beyond the biological and lifestyle influences at individual level, factors like air quality and socioeconomic status point to the impact of systemic inequalities and environmental conditions on shaping cardiovascular health outcomes. The county-level geospatial analysis has visualized strong regional disparities, with high CVD mortality rates concentrated in the southeastern U.S., a pattern that largely overlaps with areas of high social vulnerability. This alignment echoes prior research showing that counties with higher social vulnerability indices and lower family incomes often experience a greater burden of CVD risk factors, strongly implying that socioeconomic determinants and neighborhood characteristics are not merely correlates but fundamental drivers of health disparities (Bevan et al., 2023; Minhas et al., 2023; Wilcox et al., 2024). Given global projections for a continued rise in CVD burden driven by persistent risk factors (Maddox et al., 2024), the observed region-specific variations underscore the urgent need for targeted public policy interventions to alleviate these systemic inequities to reverse this trajectory. In terms of environmental condition, air pollution, particularly PM2.5 exposure, has been recognized as an important contributor to CVD mortality (Henning, 2024). The geospatial pattern displays that PM2.5 overlaps many regions, though not uniformly colocalized, with high CVD mortality rates. This partially supports previous research suggesting that higher environmental burdens may explain elevated CVD mortality rates in a state or cross counties (Adepu et al., 2020; Lamas et al., 2023). The correlation and multiple regression analyses have further strengthened the geospatial pattern affirming that socioeconomic and environmental factors, especially those including poverty, reliance on food assistance programs, disability population, single-parent households, PM2.5, etc. are significantly associated with CVD mortality rates across U.S. counties. Conversely, protective factors such as higher household income, BRIC resilience, housing-infrastructural resilience, median home value, median household income, social resilience, and access to parks indicate the potential of structural improvements in reducing cardiovascular risks (Baran et al., 2024). The prominence of PM2.5 and smoking status as strong predictors in regression and machine learning models highlights the interconnectedness of environmental and behavioral factors in cardiovascular health, emphasizing the critical need for integrated public health initiatives. Practically, these initiatives should simultaneously target respiratory and cardiovascular health through efforts like smoking cessation programs and promotion of green infrastructures in vulnerable areas and communities.
Notably, certain factors exhibited minimal correlation with CVD mortality rates in the analysis, despite their traditional role as a risk contributor. Obesity, a well-known bidirectional risk factor, demonstrated negligible geospatial association with CVD mortality rates. This observation aligns with the concept of 'obesity paradox', where increased cardiac imaging techniques may allow for earlier detection and improved survival in obese patients with underlying CVD (Powell-Wiley et al., 2021). Similarly, while cancer is biologically linked to cardiovascular health, it might not manifest concurrently at the geographic level due to differences in diagnostic infrastructure, survival rates, or risk mitigation strategies (Wilcox et al., 2024). In the case of the older adult population (65+), though experiencing higher overall CVD mortality rates, their distribution does not exhibit geographic correlation in the analysis. This could be due to the relatively low and consistent percentage of older adults across the counties, which might limit the statistical ability to detect a correlative relationship at a geographical level. Negligible geographical correlations were also observed between CVD mortality and built/neighborhood environment attributes, such as developed areas with better infrastructure, walkability, recreation facilities, and cardiovascular physician. Despite their intuitive links to potentially preventing CVD (Baran et al., 2024), the minimal association implies that their impact on CVD mortality might be more nuanced or mediated by other factors at the county level.
5. Limitations
Despite offering valuable insights, this study has certain limitations that should be acknowledged. First, accuracy of the analysis could be constrained by potential variations in data quality across counties. Second, county-level data cannot explain intra-county variations in risk factor exposure and health outcomes. Third, reliance on publicly available datasets means that some individual-level data simply could not be gathered even though the analysis considered as many variables as possible. For instance, certain unmeasured confounders, like genetic predispositions, disparities in adoption of wearable devices, or specific characteristics in local healthcare infrastructure, could not be fully accounted for and might also have played a role in the observed outcomes. Future research could benefit from longitudinal studies by integrating more granular individual-level data to track changes in risk factor prevalence and their impact on CVD mortality rates over time. Further investigation into the cost-effectiveness of tailored interventions in high-risk counties would be valuable for effectively guiding resource allocation. This should particularly focus on strategies that incorporate lifestyle modifications with pharmacological treatments to address environmental and socioeconomic determinants.
6. Conclusion
Management of CVD burden requires a multifaceted approach encompassing public health initiatives, clinical care, and policy interventions. The study herein provides a robust framework to understand the major linkage pathways to CVD mortality disparities across US regions, offering actionable insights for the development of data-driven interventions to promote population health outcomes. Key predictors, including COPD, smoking, PM2.5, and medication non-adherence, provide opportunities for targeted interventions, such as enhanced respiratory care, tobacco control, air quality improvements, and patient adherence programs. The persistent geographic disparities, particularly elevated mortality rates in the southeastern U.S. coinciding with areas of high social vulnerability, highlight the profound influence of systemic inequalities on cardiovascular health outcomes. The protective effects of structural factors such as housing, income, and healthcare access further emphasize the need for policies to address systemic inequities to reduce CVD burden. The significant 2020 rebound in CVD mortality signals the potential long-term consequences of public health crises like COVID-19 on cardiovascular health. In practical terms, this research advocates for a multi-pronged approach to mitigate CVD mortality disparities. Effective strategies could prioritize integrated public health initiatives focusing on (1) addressing key environmental and behavioral risk factors; (2) implementing primary prevention for patients with chronic conditions through increased physical activity, smoking reduction, and enhanced medication adherence support; (3) improving early detection and treatment via regular screenings for chronic diseases like COPD and hypertension; (4) mitigating socioeconomic and educational inequalities; (5) developing innovative interventions such as mobile health technologies, telehealth services, and community-based care programs to enhance healthcare access and support for high-risk communities. By practicing data-driven interventions at the local and regional levels, it holds promise for reducing the CVD burden throughout the nation. Future research efforts should explore longitudinal changes and assess the effectiveness of targeted interventions in mitigating their temporal effects on CVD outcomes, enabling a reliable long-term forecast and management of cardiovascular health.
Institutional Review Board Statement
Ethics review and approval were waived for this study as all the datasets were collected from publicly accessible databases of Centers for Disease Control and Prevention (CDC). (http://nccd.cdc.gov/DHDSPAtlas/Reports.aspx; https://ephtracking.cdc.gov/download; https://data.cdc.gov/browse).
Informed Consent Statement
Patient consent was waived as publicly accessible data was used in this study.
References
- Addo, P.N.O., Mundagowa, P.T., Zhao, L., Kanyangarara, M., Brown, M.J., and Liu, J. (2024). Associations between sleep duration, sleep disturbance and cardiovascular disease biomarkers among adults in the United States. BMC Public Health 24, 947. [CrossRef]
- Adepu, S., Berman, A.E., and Thompson, M.A. (2020). Socioeconomic determinants of health and county-level variation in cardiovascular disease mortality: an exploratory analysis of Georgia during 2014-2016. Preventive Medicine Reports 19, 101160. [CrossRef]
- Aggarwal, R., Yeh, R.W., Maddox, K.E.J., and Wadhera, R.K. (2023). Cardiovascular risk factor prevalence, treatment, and control in US adults aged 20 to 44 years, 2009 to March 2020. JAMA 329, 899-909. [CrossRef]
- Akoglu, H. (2018). User's guide to correlation coefficients. Turkish Journal of Emergency Medicine 18, 91-93. [CrossRef]
- Al-Kindi, S.G., Brook, R.D., Biswal, S., and Rajagopalan, S. (2020). Environmental determinants of cardiovascular disease: lessons learned from air pollution. Nature Reviews Cardiology 17, 656-672. [CrossRef]
- Bakhit, M., Fien, S., Abukmail, E., Jones, M., Clark, J., Scott, A.M., Glasziou, P., and Cardona, M. (2024). Cardiovascular disease risk communication and prevention: a meta-analysis. Eur Heart J 45, 998-1013. [CrossRef]
- Baptista, E.A., and Queiroz, B.L. (2022). Spatial analysis of cardiovascular mortality and associated factors around the world. BMC Public Health 22, 1556. [CrossRef]
- Baran, C., Belgacem, S., Paillet, M., de Abreu, R.M., de Araujo, F.X., Meroni, R., and Corbellini, C. (2024). Active commuting as a factor of cardiovascular disease prevention: a systematic review with meta-analysis. Journal of Functional Morphology and Kinesiology 9, 125. [CrossRef]
- Barbera, M., Lehtisalo, J., Perera, D., Aspö, M., Cross, M., De Jager Loots, C.A., Falaschetti, E., Friel, N., Luchsinger, J.A., Gavelin, H.M., et al. (2024). A multimodal precision-prevention approach combining lifestyle intervention with metformin repurposing to prevent cognitive impairment and disability: the MET-FINGER randomised controlled trial protocol. Alzheimers Res Ther 16, 23. [CrossRef]
- Bevan, G., Pandey, A., Griggs, S., Dalton, J.E., Zidar, D., Patel, S., Khang, S.U., Nasir, K., Rajagopalan, S., and Al-Kindi, S. (2023). Neighborhood-level social vulnerability and prevalence of cardiovascular risk factors and coronary heart disease. Curr Probl Cardiol 48, 101182. [CrossRef]
- Borkowski, P., Borkowska, N., Mangeshkar, S., Adal, B.H., and Singh, N. (2024). Racial and socioeconomic determinants of cardiovascular health: a comprehensive review. Cureus Journal of Medical Science 16, e59497. [CrossRef]
- Cotton, A., Salerno, P., Deo, S., Virani, S., Nasir, K., Neeland, I., Rajagopalan, S., Sattar, N., Al-Kindi, S., and Elgudin, Y.E. (2024). The association between county-level premature cardiovascular mortality related to cardio-kidney-metabolic disease and the social determinants of health in the US. Sci Rep 14, 24984. [CrossRef]
- DuPont, J.J., Kenney, R.M., Patel, A.R., and Jaffe, I.Z. (2019). Sex differences in mechanisms of arterial stiffness. Br J Pharmacol 176, 4208-4225. [CrossRef]
- Fabbri, L.M., Celli, B.R., Agustí, A., Criner, G.J., Dransfield, M.T., Divo, M., Krishnan, J.K., Lahousse, L., de Oca, M.M., Salvi, S.S., et al. (2023). COPD and multimorbidity: recognising and addressing a syndemic occurrence. The Lancet Respiratory Medicine 11, 1020-1034. [CrossRef]
- Henning, R.J. (2024). Particulate matter air pollution is a significant risk factor for cardiovascular disease. Curr Probl Cardiol 49, 102094. [CrossRef]
- Hu, M.J., Yang, T., and Yang, Y.J. (2024). Causal associations of education level with cardiovascular diseases, cardiovascular biomarkers, and socioeconomic factors. Am J Cardiol 213, 76-85. [CrossRef]
- Kang, E., Cho, D., Lee, S., Im, J., Lee, D., and Yoo, C. (2024). An explainable AI framework for spatiotemporal risk factor analysis in public health: a case study of cardiovascular mortality in South Korea. GIScience & Remote Sensing 61, 2436997. [CrossRef]
- Krittanawong, C., Qadeer, Y.K., Hayes, R.B., Wang, Z., Virani, S., Thurston, G.D., and Lavie, C.J. (2023). PM2.5 and cardiovascular health risks. Curr Probl Cardiol 48, 101670. [CrossRef]
- Kundrick, J., Rollins, H., Mullachery, P., Sharaf, A., Schnake-Mahl, A., Roux, A.V.D., and Bilal, U. (2024). Heterogeneity in disparities by income in cardiovascular risk factors across 209 US metropolitan areas. Preventive Medicine Reports 47, 102908. [CrossRef]
- Lamas, G.A., Bhatnagar, A., Jones, M.R., Mann, K.K., Nasir, K., Tellez-Plaza, M., Ujueta, F., Navas-Acien, A., Group Author(s): American Heart Association Council on Epidemiology and Prevention, Council on Cardiovascular and Stroke Nursing, et al. (2023). Contaminant metals as cardiovascular risk factors: a scientific statement from the American Heart Association. Journal of the American Heart Association 12, e029852. [CrossRef]
- Maddox, K.E.J., Elkind, M.S., Aparicio, H.J., Commodore-Mensah, Y., de Ferranti, S.D., Dowd, W.N., Hernandez, A.F., Khavjou, O., Michos, E.D., Palaniappan, L., et al. (2024). Forecasting the burden of cardiovascular disease and stroke in the United States through 2050 - prevalence of risk factors and disease: a presidential advisory from the American Heart Association. Circulation 150, e65-e88. [CrossRef]
- Magnussen, C., Ojeda, F.M., Leong, D.P., Alegre-Diaz, J., Amouyel, P., Aviles-Santa, L., De Bacquer, D., Ballantyne, C.M., Bernabé-Ortiz, A., Bobak, M., et al. (2023). Global effect of modifiable risk factors on cardiovascular disease and mortality. New England Journal of Medicine 389, 1273-1285. [CrossRef]
- Martin, S.S., Aday, A.W., Almarzooq, Z.I., Anderson, C.A., Arora, P., Avery, C.L., Baker-Smith, C.M., Barone Gibbs, B., Beaton, A.Z., Boehme, A.K., et al. (2024). 2024 heart disease and stroke statistics: a report of US and global data from the American Heart Association. Circulation 149, e347-e913. [CrossRef]
- Minhas, A.M.K., Jain, V., Li, M., Ariss, R.W., Fudim, M., Michos, E.D., Virani, S.S., Sperling, L., and Mehta, A. (2023). Family income and cardiovascular disease risk in American adults. Sci Rep 13, 279. [CrossRef]
- Münzel, T., Molitor, M., Kuntic, M., Hahad, O., Röösli, M., Engelmann, N., Basner, M., Daiber, A., and Sørensen, M. (2024). Transportation noise pollution and cardiovascular health. Circulation Research 134, 1113-1135. [CrossRef]
- Nelson, A.J., Pagidipati, N.J., and Bosworth, H.B. (2024). Improving medication adherence in cardiovascular disease. Nature Reviews Cardiology 21, 396-416. [CrossRef]
- Neubeck, L., Lowres, N., Benjamin, E.J., Ben Freedman, S., Coorey, G., and Redfern, J. (2015). The mobile revolution-using smartphone apps to prevent cardiovascular disease. Nature Reviews Cardiology 12, 350-360. [CrossRef]
- Perry, A.S., Dooley, E.E., Master, H., Spartano, N.L., Brittain, E.L., and Pettee Gabriel, K. (2023). Physical activity over the lifecourse and cardiovascular disease. Circulation Research 132, 1725-1740. [CrossRef]
- Powell-Wiley, T.M., Poirier, P., Burke, L.E., Després, J.P., Gordon-Larsen, P., Lavie, C.J., Lear, S.A., Ndumele, C.E., Neeland, I.J., Sanders, P., et al. (2021). Obesity and cardiovascular disease: a scientific statement from the American Heart Association. Circulation 143, E984-E1010. [CrossRef]
- Rodgers, J., Briesacher, B.A., Wallace, R.B., Kawachi, I., Baum, C.F., and Kim, D. (2019). County-level housing affordability in relation to risk factors for cardiovascular disease among middle-aged adults: The National Longitudinal Survey of Youths 1979. Health Place 59, 102194. [CrossRef]
- Roush, G.C., Kaur, R., and Ernst, M.E. (2014). Diuretics: a review and update. J Cardiovasc Pharmacol Ther 19, 5-13. [CrossRef]
- Sun, F.N., Yao, J., Du, S.C., Qian, F., Appleton, A.A., Tao, C., Xu, H., Liu, L., Dai, Q., Joyce, B.T., et al. (2023). Social determinants, cardiovascular disease, and health care cost: a nationwide study in the United States using machine learning. Journal of the American Heart Association 12, e027919. [CrossRef]
- Tainio, M., Andersen, Z.J., Nieuwenhuijsen, M.J., Hu, L., de Nazelle, A., An, R.P., Garcia, L.M.T., Goenka, S., Zapata-Diomedi, B., Bull, F., et al. (2021). Air pollution, physical activity and health: a mapping review of the evidence. Environ Int 147, 105954. [CrossRef]
- Taylor, R.S., Dalal, H.M., and McDonagh, S.T. (2022). The role of cardiac rehabilitation in improving cardiovascular outcomes. Nature Reviews Cardiology 19, 180-194. [CrossRef]
- Toma, A., Paré, G., and Leong, D.P. (2017). Alcohol and cardiovascular disease: how much is too much? Current Atherosclerosis Reports 19, 13. [CrossRef]
- Wang, S.S., Li, Z.X., Wang, X.Y., Guo, S., Sun, Y.J., Li, G.H., Zhao, C.H., Yuan, W.H., Li, M., Li, X.L., et al. (2022). Associations between sleep duration and cardiovascular diseases: a meta-review and meta-analysis of observational and Mendelian randomization studies. Frontiers in Cardiovascular Medicine 9, 930000. [CrossRef]
- Welsh, A., Hammad, M., Piña, I.L., and Kulinski, J. (2024). Obesity and cardiovascular health. European Journal of Preventive Cardiology 31, 1026-1035. [CrossRef]
- Wilcox, N.S., Amit, U., Reibel, J.B., Berlin, E., Howell, K., and Ky, B. (2024). Cardiovascular disease and cancer: shared risk factors and mechanisms. Nature Reviews Cardiology 21, 617-631. [CrossRef]
- Xu, L.Q., Mondal, D., and Polya, D.A. (2020). Positive association of cardiovascular disease (CVD) with chronic exposure to drinking water arsenic (As) at concentrations below the WHO provisional guideline value: a systematic review and meta-analysis. Int J Environ Res Public Health 17, 2536. [CrossRef]
- Xu, M.Z., Xu, J.L., and Yang, X.J. (2017). Asthma and risk of cardiovascular disease or all-cause mortality: a meta-analysis. Ann Saudi Med 37, 99-105. [CrossRef]
- Zuma, B.Z., Parizo, J.T., Valencia, A., Spencer-Bonilla, G., Blum, M.R., Scheinker, D., and Rodriguez, F. (2021). County-level factors associated with cardiovascular mortality by race/ethnicity. Journal of the American Heart Association 10, e018835. [CrossRef]
Figure 1.
CVD mortality trends across various demographic groups. (A) The fluctuations in CVD mortality rates over a 12-year period from 2006 to 2018. (B) Comparison of CVD mortality rates between men and women. (C) Comparison of CVD mortality rates across different age groups. (D) Comparison of CVD mortality rates among various racial and ethnic groups. The letters (a, b, c, etc.) on the graphs indicate statistical significance between groups.
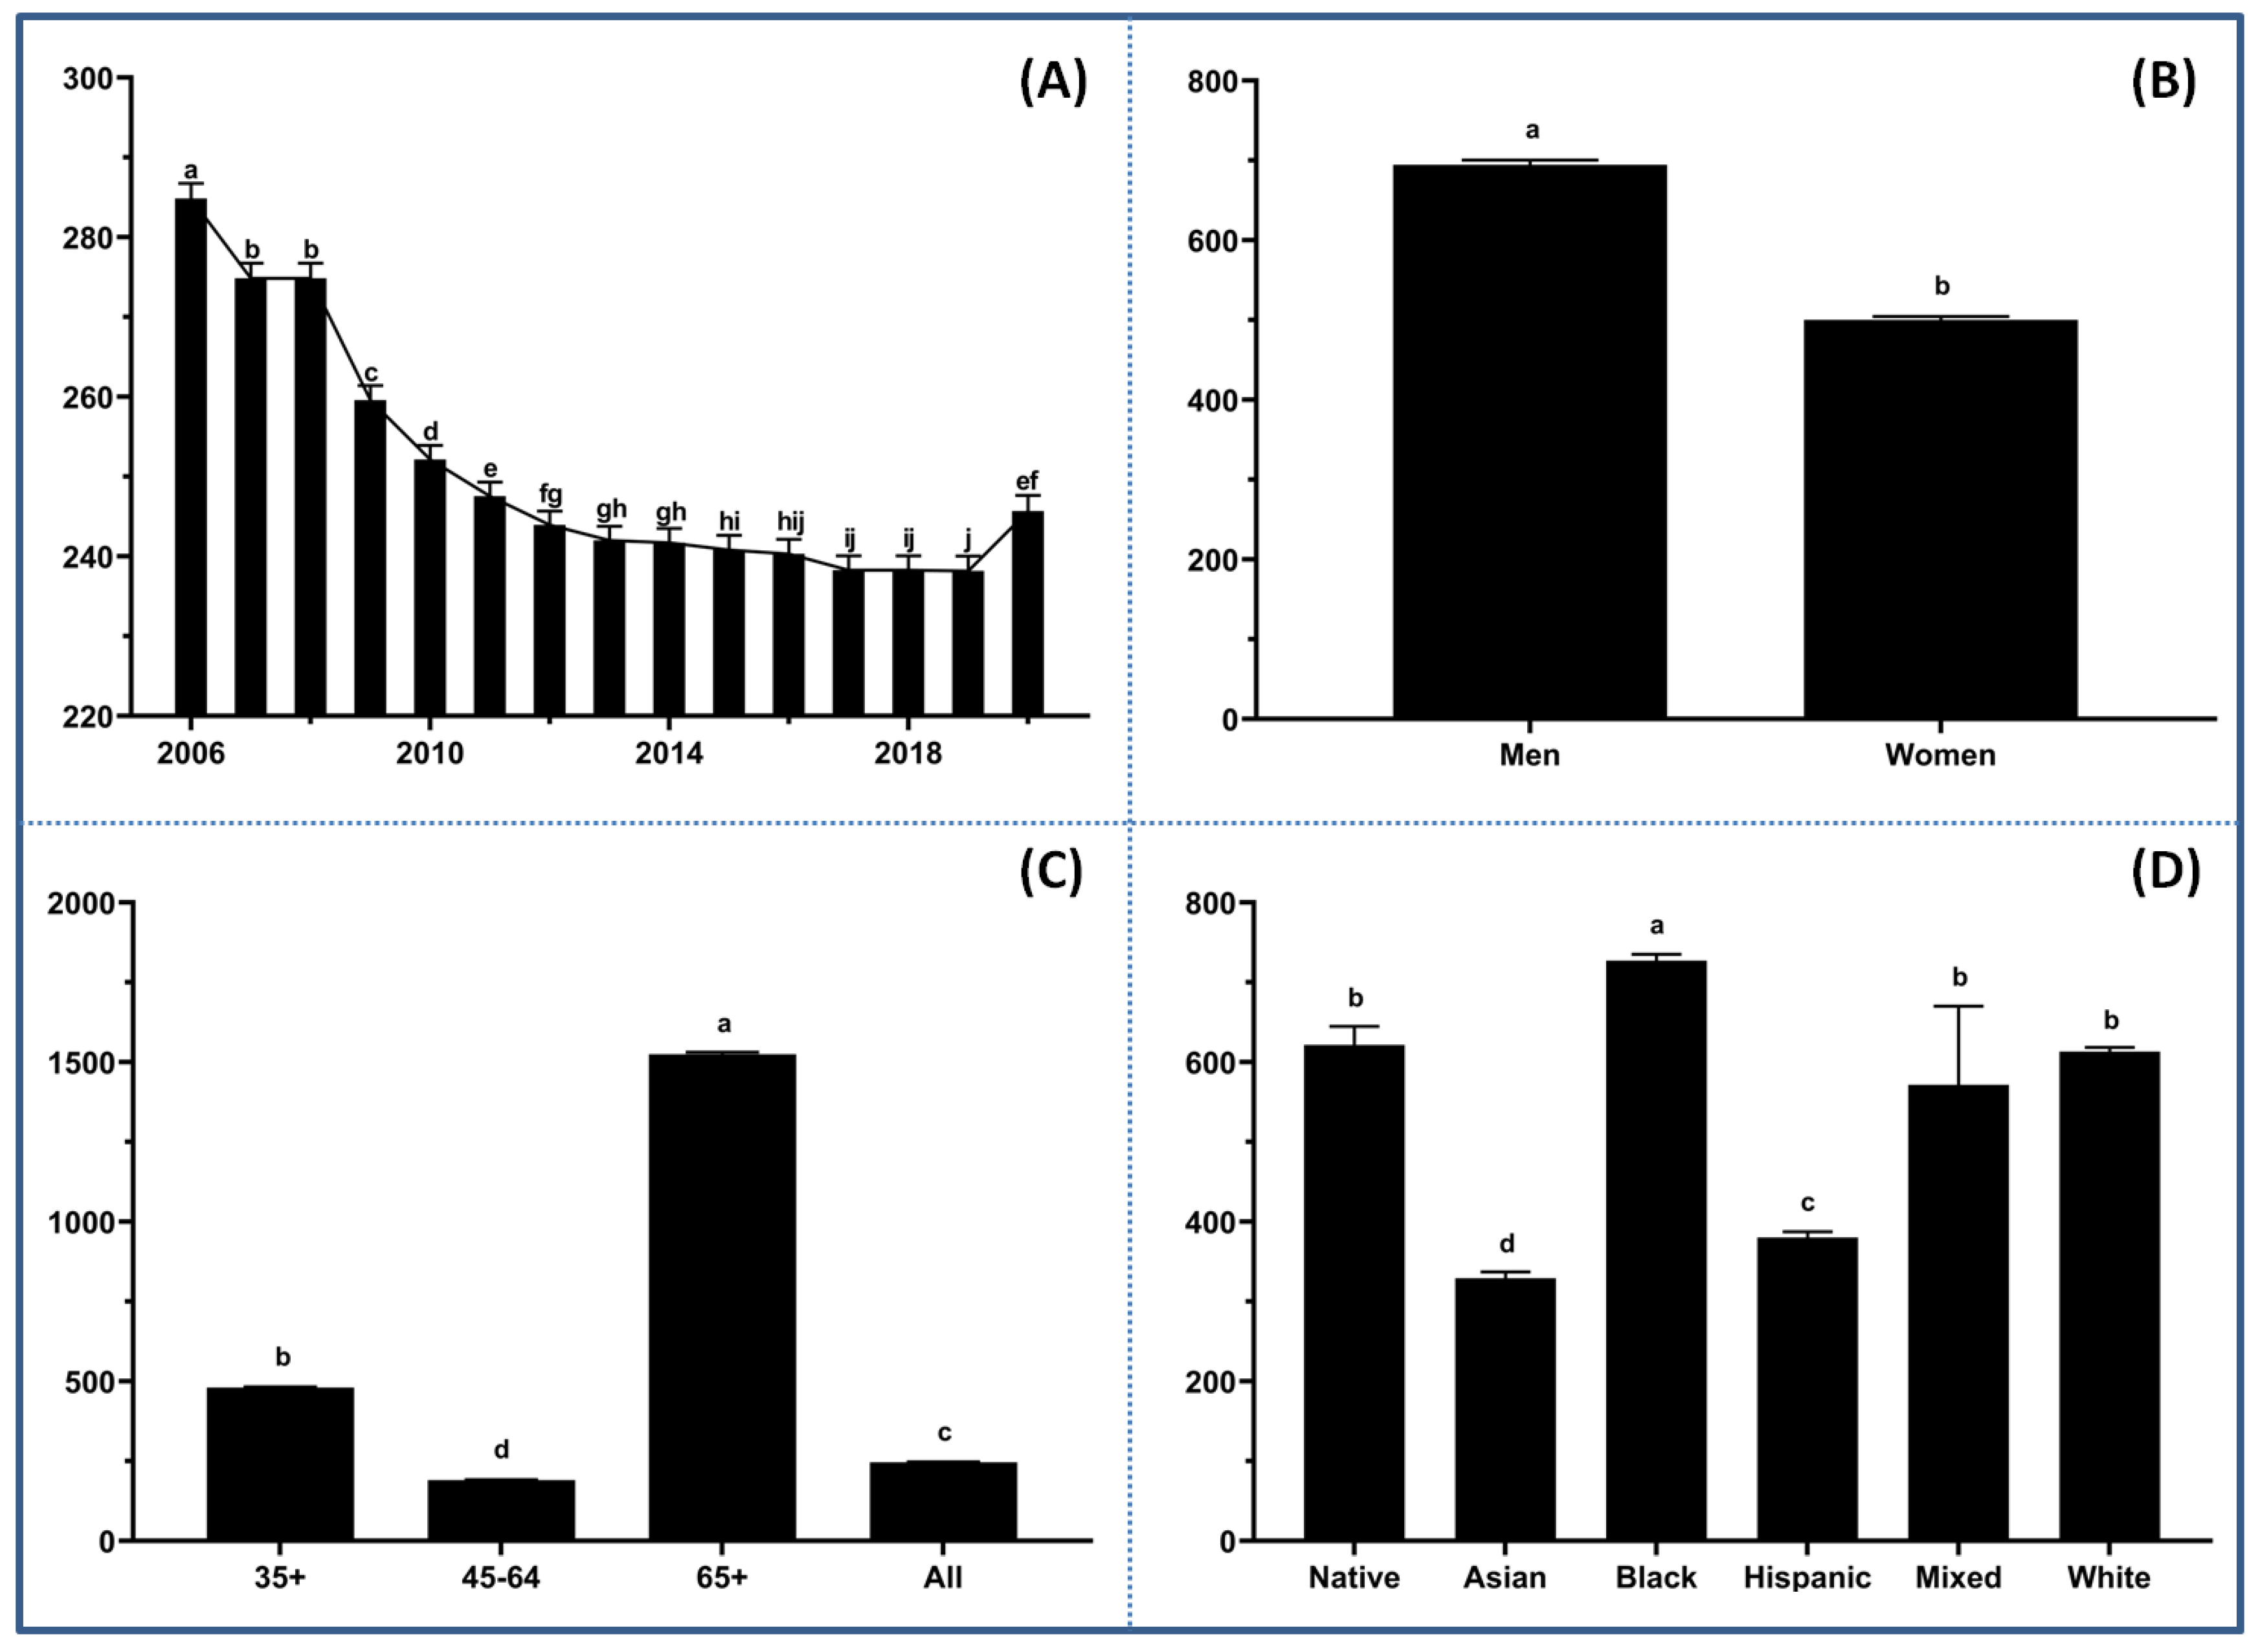
Figure 2.
Spatial patterns of CVD mortality and risk factors across the U.S. counties. (A) Spatial distribution of CVD mortality rates (per 100,000) with the higher depicted in red and the lower in blue. Higher rates concentrate in the southeastern states, particularly around the Mississippi River Basin. (B) Social vulnerability index (SVI) scores ranging from low (white) to high (dark purple). (C) Average annual air quality PM2.5 concentrations represented by shades of green, highlighting regions with different levels of air pollution. (D) Sunlight UV index distribution with darker orange indicating higher exposure levels.
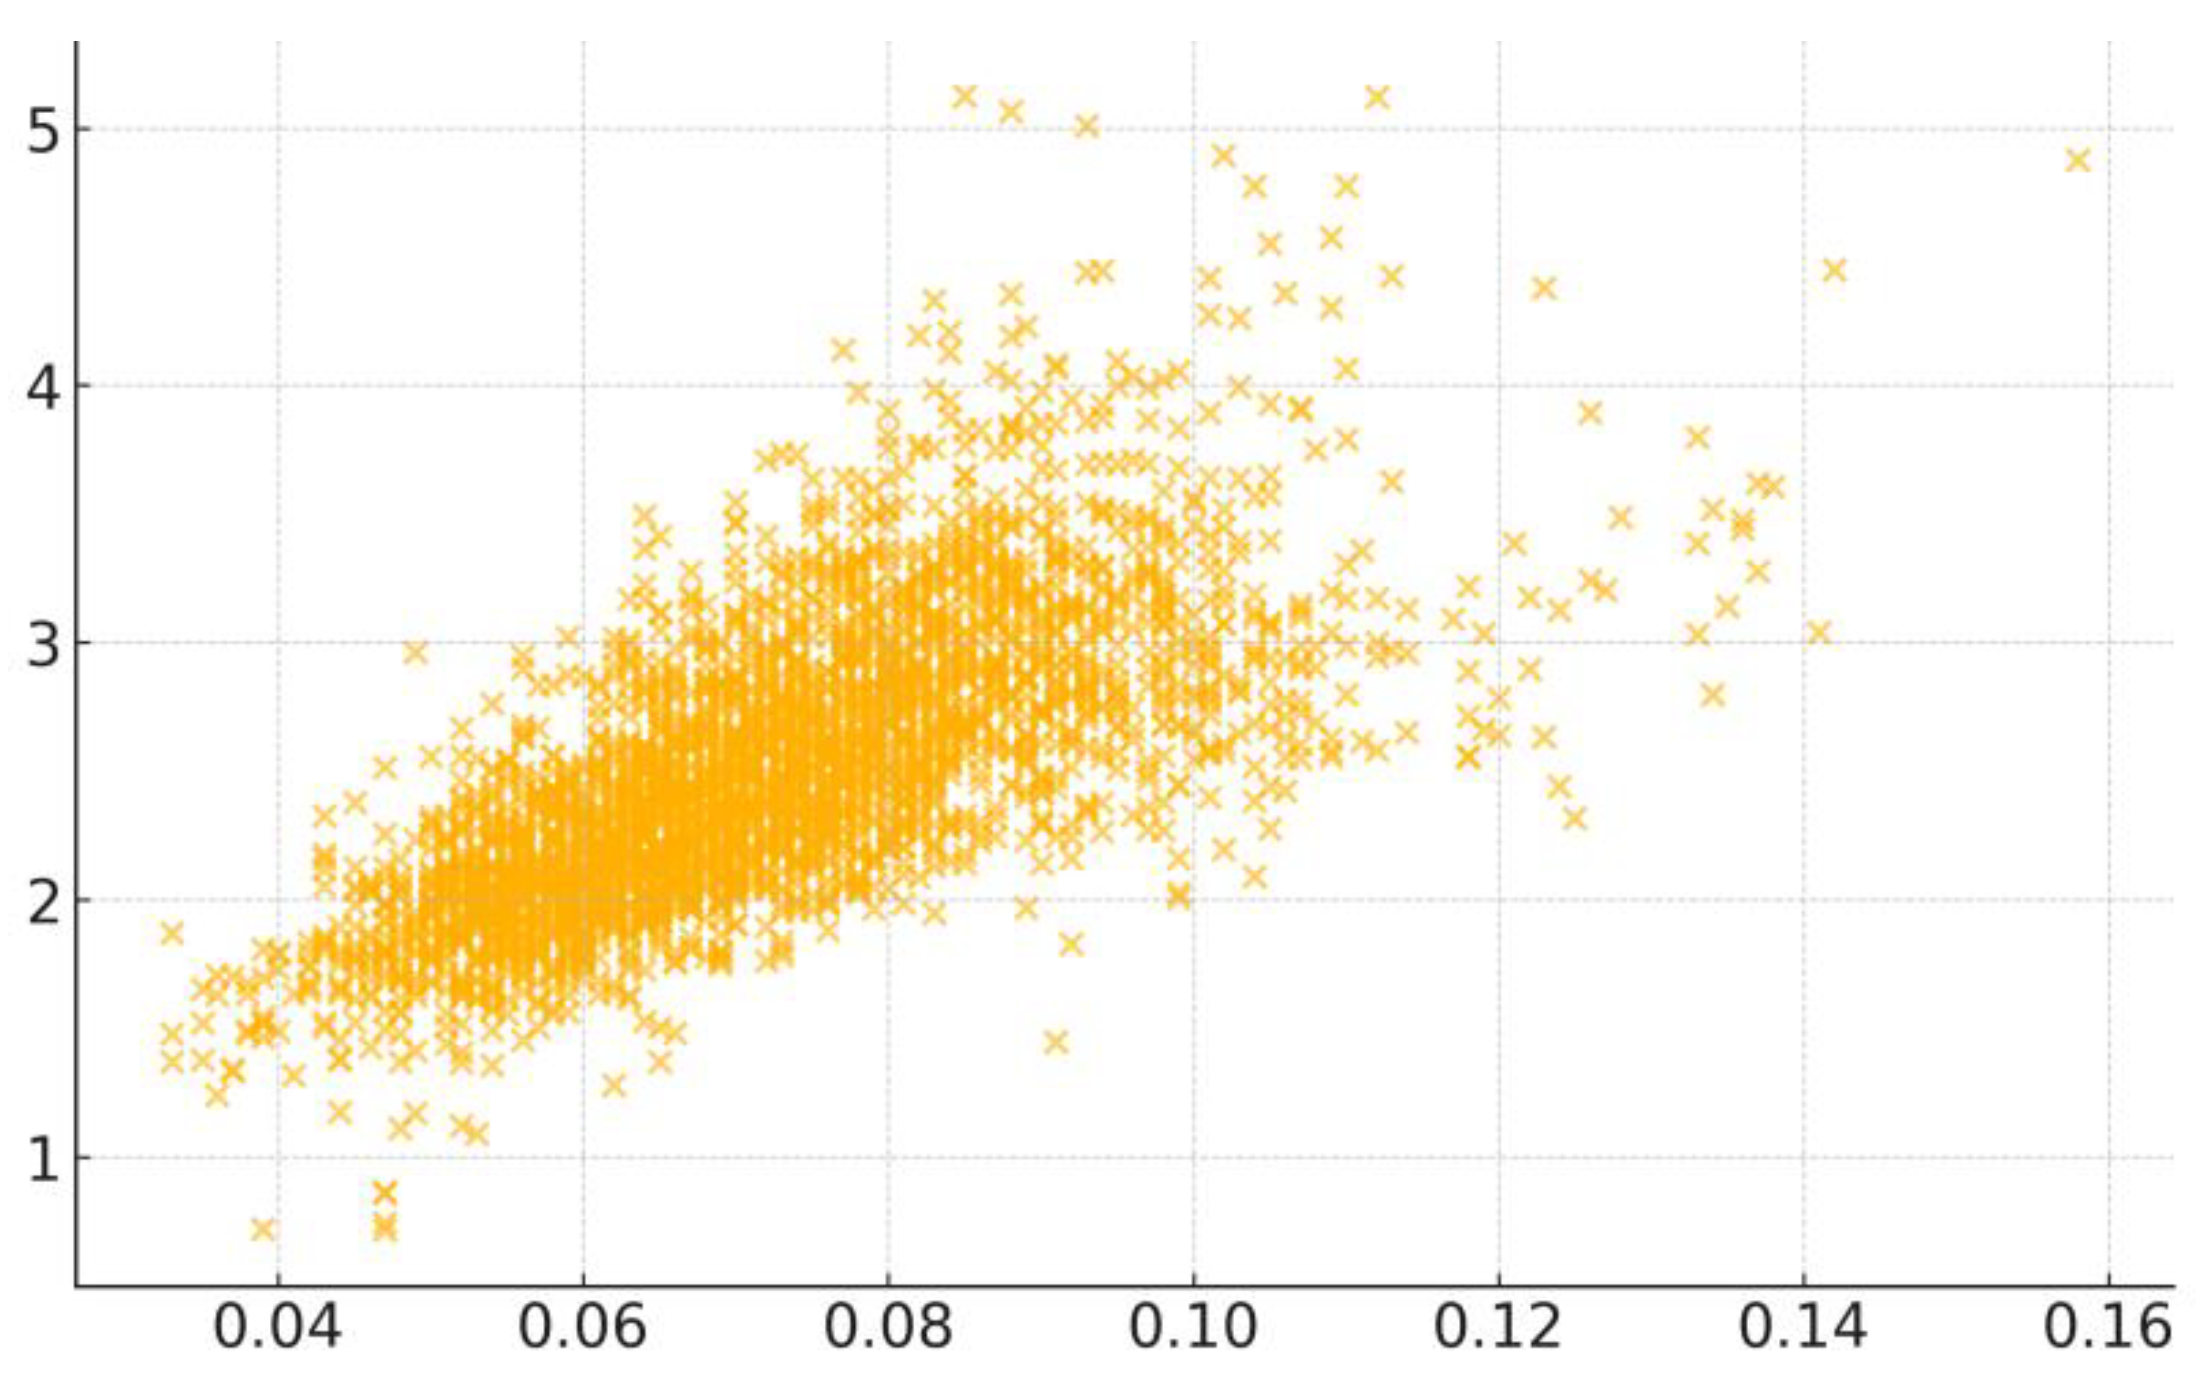
Figure 3.
Scatter plot displaying the correlation between COPD and CVD mortality rates across the U.S. counties.
Figure 3.
Scatter plot displaying the correlation between COPD and CVD mortality rates across the U.S. counties.
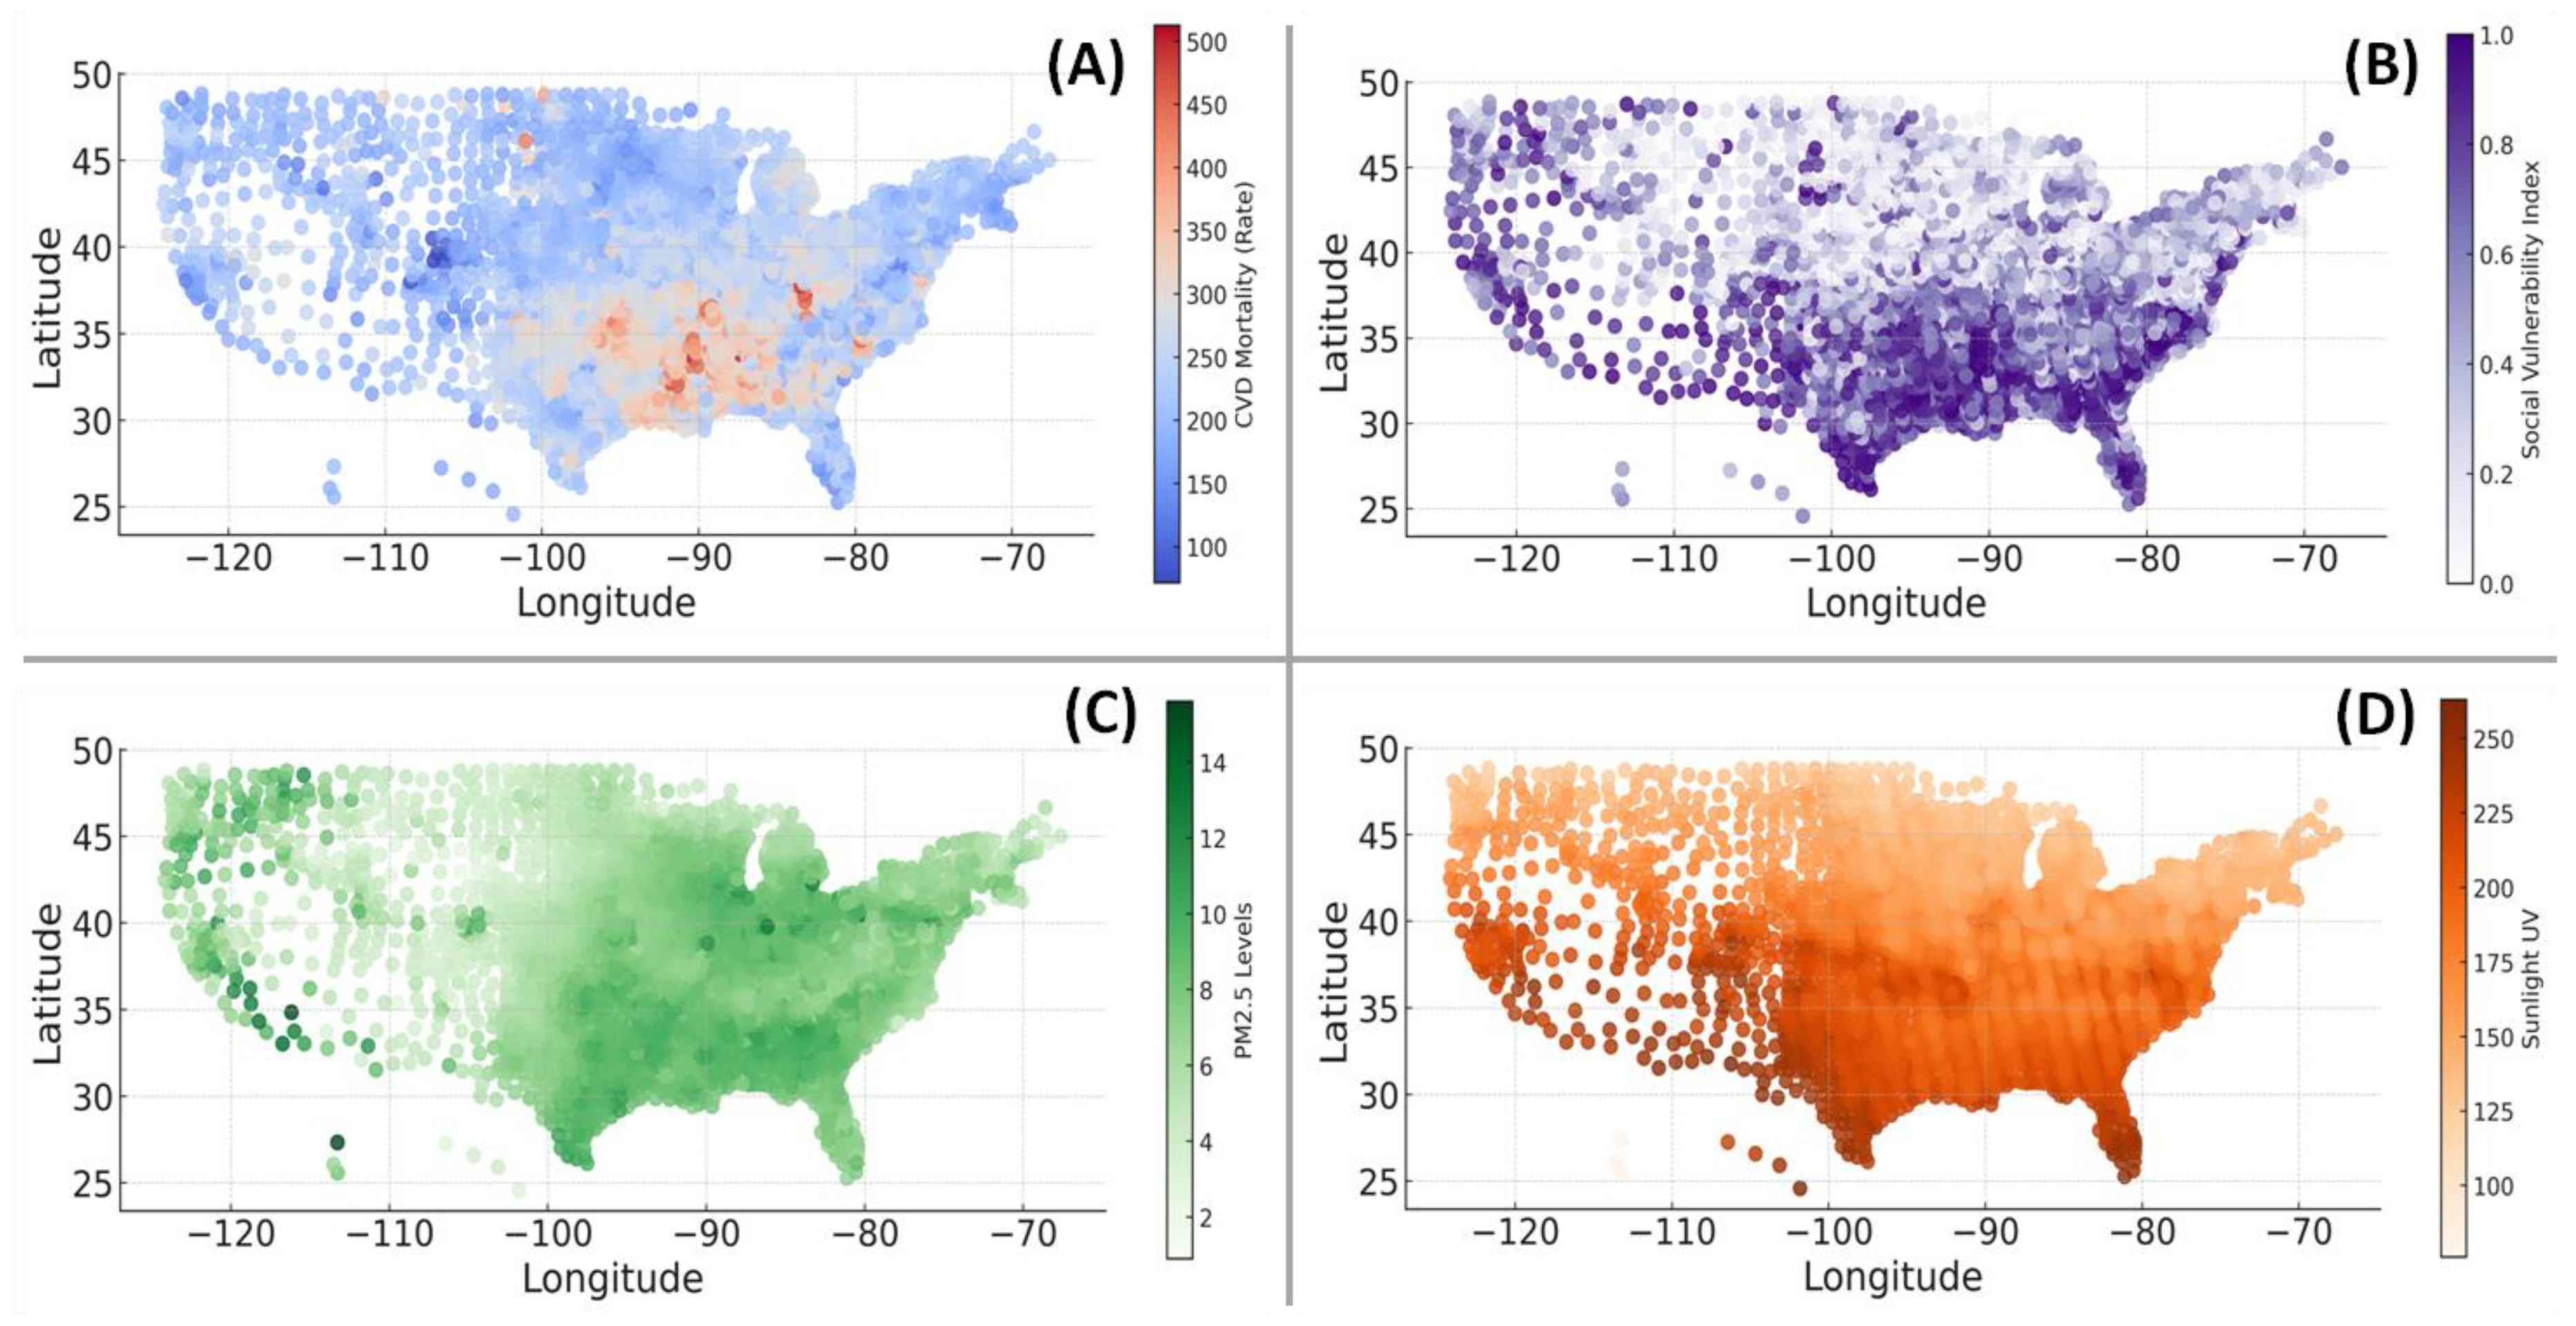
Figure 4.
Dominance of risk factors in predicting CVD mortality rates with random forest models across the U.S. counties.
Figure 4.
Dominance of risk factors in predicting CVD mortality rates with random forest models across the U.S. counties.
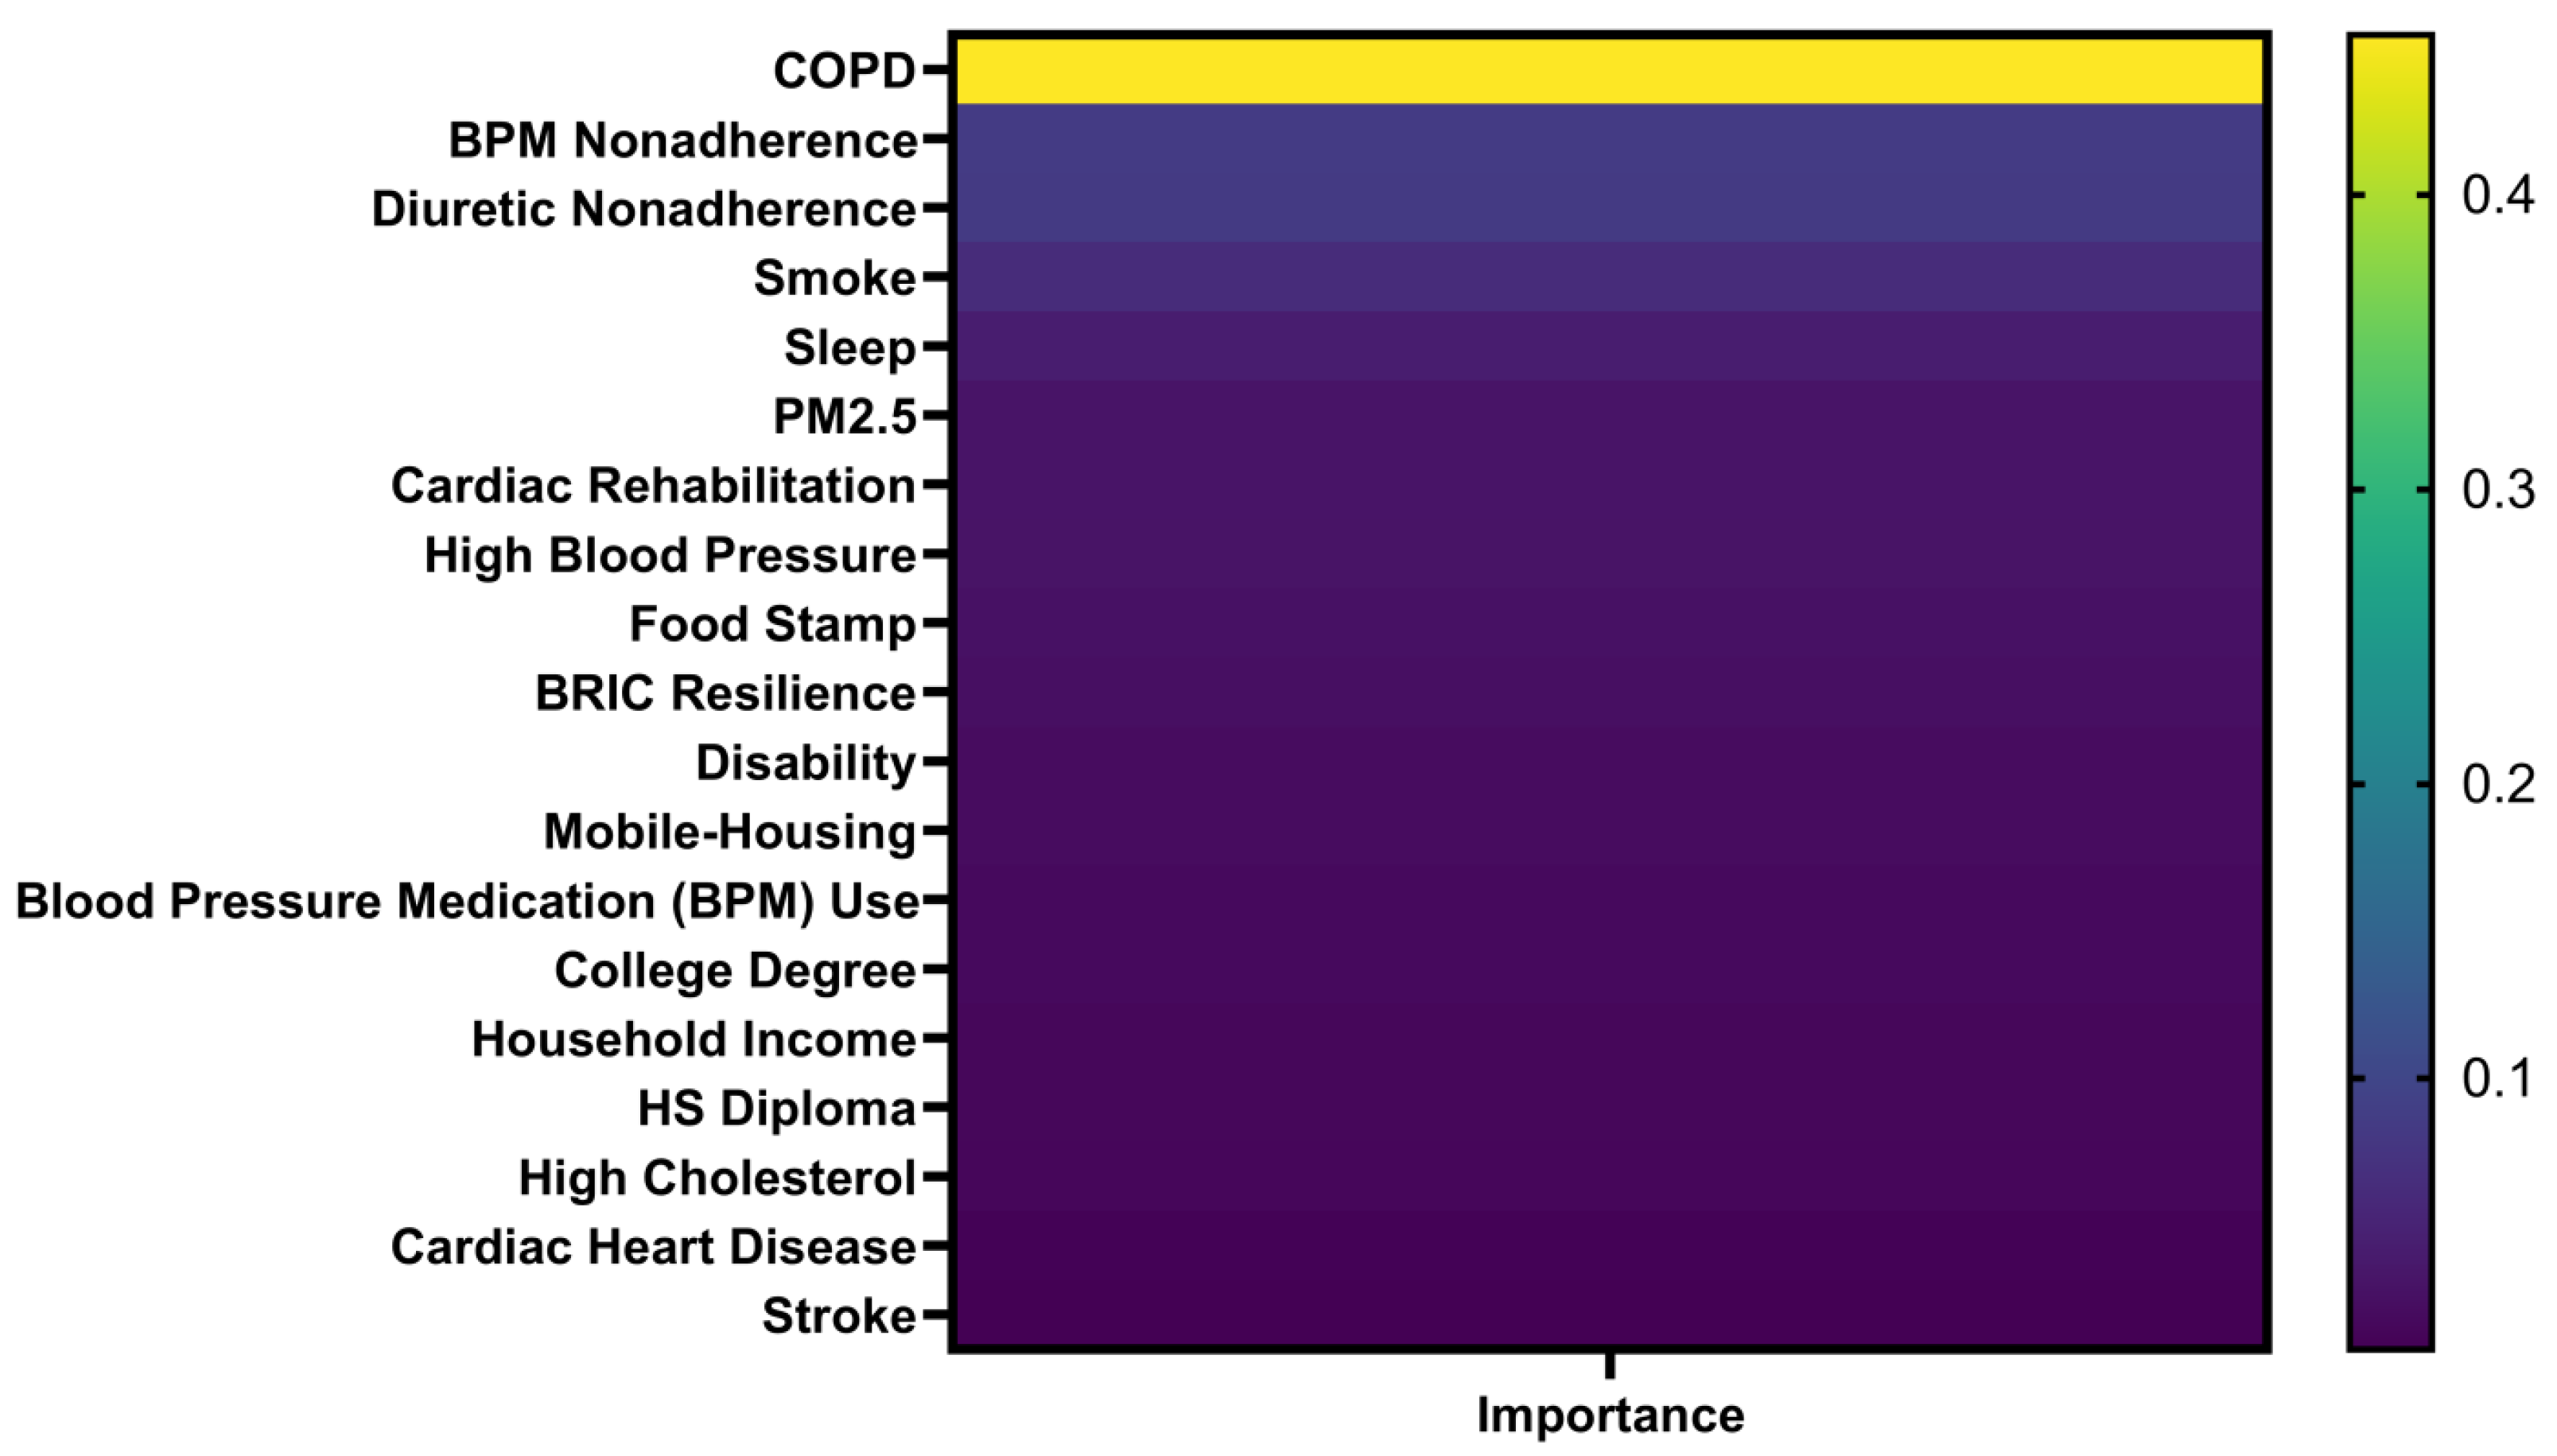

Table 1.
Correlation of various factors to CVD mortality rates across U.S. counties.
| Factor | R | P | N | Factor | R | P | N |
|---|---|---|---|---|---|---|---|
| COPD Prevalence | 0.700 | < 0.0001 | 3054 | Vehicle Crashes Involving People | 0.081 | < 0.0001 | 3121 |
| Current Smoker Status | 0.650 | < 0.0001 | 3070 | Atrazine in Water | 0.075 | 0.276 | 214 |
| High Blood Pressure | 0.644 | < 0.0001 | 3070 | Population per Neurologist | 0.073 | 0.018 | 1059 |
| Less Sleeping < 7 Hour | 0.644 | < 0.0001 | 3121 | Population per CVD Physician | 0.034 | 0.232 | 1212 |
| Population Living in Poverty | 0.591 | < 0.0001 | 3128 | Percent Cholesterol Screening | 0.028 | 0.126 | 3070 |
| Food Stamp Percentage | 0.547 | < 0.0001 | 3136 | Housing with More People than Rooms | 0.025 | 0.168 | 3122 |
| Stroke Prevalence | 0.540 | < 0.0001 | 3070 | TCE in Water | 0.014 | 0.840 | 208 |
| Socioeconomic Vulnerability | 0.534 | < 0.0001 | 3121 | Air Domain Index | 0.011 | 0.554 | 2769 |
| Population with Disability | 0.526 | < 0.0001 | 3122 | Water Domain Index | 0.009 | 0.653 | 2769 |
| Adults No College Degree | 0.513 | < 0.0001 | 3200 | Sociodemographic Vulnerability | 0.007 | 0.695 | 2769 |
| Overall Vulnerability Rank | 0.481 | < 0.0001 | 3121 | Population 65+ | 0.004 | 0.825 | 2769 |
| Social Vulnerability | 0.478 | < 0.0001 | 3113 | Environmental Quality Index | 0.004 | 0.818 | 2769 |
| Single-parent Households | 0.478 | < 0.0001 | 3122 | Group Quarters | 0.001 | 0.965 | 2769 |
| Asthma Prevalence | 0.470 | < 0.0001 | 3054 | More Units Housing | -0.000 | 0.993 | 2769 |
| Coronary Heart Disease | 0.439 | < 0.0001 | 3070 | Half Income on Housing | -0.001 | 0.975 | 3134 |
| Diuretic Non-adherence | 0.428 | < 0.0001 | 3108 | Land Domain Index | -0.001 | 0.977 | 2769 |
| Diagnosed Diabetes | 0.417 | < 0.0001 | 3070 | Community Capital Resilience | -0.003 | 0.881 | 3123 |
| Mobile Housing Units | 0.414 | < 0.0001 | 3122 | Built Domain Index | -0.005 | 0.797 | 2769 |
| Post-Acute Care Cost | 0.411 | < 0.0001 | 3199 | Physical Annual | -0.009 | 0.625 | 2769 |
| Cardiac Rehabilitation Eligibility | 0.401 | < 0.0001 | 3044 | Population 19- | -0.016 | 0.395 | 2769 |
| Blood Pressure Medication NA | 0.397 | < 0.0001 | 3161 | House Built 1980B | -0.013 | 0.452 | 3122 |
| DEHP in Water | 0.396 | < 0.0001 | 123 | Environmental Resilience Score | -0.029 | 0.103 | 3123 |
| Household Composition Disability | 0.395 | < 0.0001 | 3121 | Less English Speaker | -0.030 | 0.119 | 2769 |
| Renin Angiotensin Antagonist NA | 0.393 | < 0.0001 | 3147 | Land for Development - Open Space | -0.037 | 0.039 | 3095 |
| High Cholesterol Prevalence | 0.388 | < 0.0001 | 3070 | Land Covered by Water | -0.048 | 0.008 | 3095 |
| Air Quality PM2.5 | 0.383 | < 0.0001 | 3118 | Uranium in Water | -0.056 | 0.335 | 301 |
| Leisure-time Physical Inactivity | 0.379 | < 0.0001 | 3070 | Land for Development - L Intensity | -0.065 | 0.000 | 3095 |
| Incremental Post-Acute Care Cost | 0.374 | < 0.0001 | 3199 | Public Transportation to Work | -0.066 | 0.000 | 3113 |
| Population without HS Diploma | 0.345 | < 0.0001 | 3200 | Radium in Water | -0.069 | 0.067 | 700 |
| Family without Internet | 0.339 | < 0.0001 | 3205 | Land for Development - H Intensity | -0.079 | < 0.0001 | 3095 |
| Blood Pressure Medication Use | 0.307 | < 0.0001 | 3070 | Cancer Prevalence | -0.082 | < 0.0001 | 3054 |
| Cardiac Rehabilitation Completion | 0.283 | < 0.0001 | 1322 | Land used for Agriculture - Crop | -0.085 | < 0.0001 | 3095 |
| Total Care Cost | 0.282 | < 0.0001 | 3199 | Population per Neurosurgeon | -0.089 | 0.021 | 669 |
| Cardiac Rehabilitation Completion | 0.283 | < 0.0001 | 1322 | Hospitals with Cardiac Intensive Care | -0.090 | < 0.0001 | 3209 |
| Cardiac Rehabilitation Sessions | 0.277 | < 0.0001 | 3100 | PCE in Water | -0.091 | 0.177 | 221 |
| Sunlight and UV | 0.277 | < 0.0001 | 3200 | Developed Imperviousness | -0.097 | < 0.0001 | 3095 |
| Family without Computer | 0.268 | < 0.0001 | 3122 | Number of Hospitals | -0.104 | < 0.0001 | 3209 |
| House Built 1950A1980B | 0.260 | < 0.0001 | 3199 | Walking to Work | -0.105 | < 0.0001 | 3113 |
| Incremental Total Care Cost | 0.258 | < 0.0001 | 3121 | Economic Resilience Score | -0.108 | < 0.0001 | 3123 |
| Housing-Transportation Rank | 0.251 | < 0.0001 | 3136 | Land for Development - M Intensity | -0.113 | < 0.0001 | 3095 |
| Cholesterol Medication NA | 0.230 | < 0.0001 | 3120 | Hospitals with ER | -0.115 | < 0.0001 | 3209 |
| Population without Health Insurance | 0.228 | < 0.0001 | 2988 | Health Device Reliant Populations | -0.120 | < 0.0001 | 3122 |
| Drug Poisoning Death Rate | 0.225 | < 0.0001 | 2974 | Hospitals with Neurological Services | -0.123 | < 0.0001 | 3209 |
| Population per Primary Care Physician | 0.225 | < 0.0001 | 3122 | Nitrates in Water | -0.128 | < 0.0001 | 1440 |
| Household without Vehicle | 0.219 | < 0.0001 | 3137 | Driving to Work | -0.137 | < 0.0001 | 3113 |
| Urban-Rural Status | 0.187 | < 0.0001 | 3210 | Incremental Outpatient Care Cost | -0.140 | < 0.0001 | 3199 |
| Number of Pharmacies & Drug Store | 0.186 | < 0.0001 | 1446 | Hospitals with Cardiac Rehabilitation | -0.144 | < 0.0001 | 3209 |
| Disinfection H in Water | 0.175 | < 0.0001 | 3199 | Outpatient Care Cost | -0.156 | < 0.0001 | 3199 |
| Inpatient Care Cost | 0.174 | < 0.0001 | 3095 | Arsenic in Water | -0.168 | < 0.0001 | 770 |
| Land used for Agriculture - Pasture | 0.166 | < 0.0001 | 3112 | Working from Home | -0.180 | < 0.0001 | 3113 |
| Time Driving to Work | 0.166 | < 0.0001 | 3200 | House Built 1950B | -0.188 | < 0.0001 | 3122 |
| Income Inequality Gini Index | 0.156 | < 0.0001 | 1519 | Households with Smartphone | -0.298 | < 0.0001 | 3113 |
| Disinfection T in Water | 0.146 | < 0.0001 | 3199 | Radon Levels | -0.298 | < 0.0001 | 805 |
| Incremental Inpatient Care Cost | 0.141 | < 0.0001 | 3123 | BRIC Resilience | -0.331 | < 0.0001 | 3123 |
| Institutional Resilience Score | 0.132 | < 0.0001 | 3123 | Park Access Percent | -0.336 | < 0.0001 | 3137 |
| Minority Status Rank | 0.132 | < 0.0001 | 3121 | Housing-Infrastructural Resilience | -0.413 | < 0.0001 | 3123 |
| Unemployment Rate | 0.120 | < 0.0001 | 3207 | Cardiac Rehabilitation Participation | -0.413 | < 0.0001 | 2399 |
| Vehicle Crashes Involving No People | 0.102 | < 0.0001 | 3122 | Median Home Value | -0.453 | <0.0001 | 3197 |
| Percent of Land Covered by Forest | 0.102 | < 0.0001 | 3095 | Alcohol Use | -0.509 | < 0.0001 | 3054 |
| Obesity | 0.090 | < 0.0001 | 3070 | Social Resilience | -0.533 | < 0.0001 | 3123 |
| Renter-occupied Housing Units | 0.088 | < 0.0001 | 3122 | Median Household Income | -0.590 | < 0.0001 | 3128 |
Table 2.
Stepwise multiple regression of CVD mortality rates and highly correlated factors.
| Coefficient Term | Coef | SE Coef | T-Value | P-Value | VIF |
|---|---|---|---|---|---|
| Constant | -0.018 | 0.234 | -0.08 | 0.94 | |
| Single-parent Households | 0.593 | 0.219 | 2.71 | 0.007 | 3.03 |
| Disability | 0.434 | 0.210 | 2.07 | 0.039 | 2.73 |
| Mobile-home Housing | -0.512 | 0.0975 | -5.25 | 0 | 2.29 |
| Alcohol Use | -0.826 | 0.359 | -2.30 | 0.021 | 2.53 |
| Blood Pressure Medication Use | 1.23 | 0.256 | 4.79 | 0 | 1.93 |
| Cardiac Rehabilitation Eligibility | 1.07 | 0.129 | 8.31 | 0 | 1.31 |
| Diabetes | 1.01 | 0.496 | 2.03 | 0.042 | 1.65 |
| Food Stamp | 0.364 | 0.164 | 2.22 | 0.026 | 3.59 |
| Median Household Income | -0.458 | 0.0707 | -6.47 | 0 | 3.77 |
| No College Degree | 0.301 | 0.115 | 2.61 | 0.009 | 3.78 |
| No High School Diploma | -1.06 | 0.177 | -5.97 | 0 | 2.70 |
| Air Quality PM2.5 | 4.72 | 0.423 | 11.15 | 0 | 1.41 |
| Park Access | -0.0722 | 0.0289 | -2.50 | 0.012 | 1.65 |
| Less Sleeping < 7 H | 0.931 | 0.287 | 3.25 | 0.001 | 3.09 |
| Post-Acute Care Cost | 0.0186 | 0.00507 | 3.66 | 0 | 1.43 |
| Blood Pressure Medication Non-adherence | 0.0886 | 0.00642 | 13.79 | 0 | 3.28 |
| Smoking Status | 4.48 | 0.308 | 14.55 | 0 | 3.92 |
Disclaimer/Publisher’s Note: The statements, opinions and data contained in all publications are solely those of the individual author(s) and contributor(s) and not of MDPI and/or the editor(s). MDPI and/or the editor(s) disclaim responsibility for any injury to people or property resulting from any ideas, methods, instructions or products referred to in the content. |
© 2025 by the authors. Licensee MDPI, Basel, Switzerland. This article is an open access article distributed under the terms and conditions of the Creative Commons Attribution (CC BY) license (http://creativecommons.org/licenses/by/4.0/).
Copyright: This open access article is published under a Creative Commons CC BY 4.0 license, which permit the free download, distribution, and reuse, provided that the author and preprint are cited in any reuse.


