1. Introduction
Carotenoids form a large family of isoprenoid pigments synthesised by plants and specific microorganisms, but not by humans or other animals. Within this family, lutein and zeaxanthin (LZ) are oxygenated xanthophylls characterised by their hydroxyl groups and distinctive yellow colour. These compounds accumulate selectively in the central retina, creating the macular pigment that protects the photoreceptor layer from phototoxic blue light and reactive oxygen species. Their molecular structure, which includes conjugated double bonds and polar hydroxyl groups, allows for efficient light absorption and antioxidant activity, making them essential for maintaining retinal health and visual performance [
1,
2]. Lutein, a xanthophyll carotenoid, is often studied for its positive effects on bone density, reduction of oxidative stress, and inflammation. Its molecular structure, with a C40 isoprenoid backbone and oxygen-containing rings, offers strong antioxidant and anti-inflammatory properties that reduce cellular damage and support bodily functions. These properties are especially relevant as lutein and other carotenoids like α-carotene and β-carotene have been linked to a decreased risk of male hip fractures. Conversely, higher blood carotenoid levels are associated with greater bone mineral density in both sexes [
40]
Numerous epidemiological and clinical studies [
3,
4,
5,
6] have linked higher dietary intake and serum levels of LZ with a lower incidence of age-related macular degeneration (AMD) and cataracts, which are two leading causes of vision loss in the elderly. Lutein and zeaxanthin are mainly obtained from green leafy vegetables, egg yolks, and corn. However, their absorption is notably inefficient due to poor aqueous solubility and reliance on dietary lipids for intestinal micellization. The absorption process involves several stages: release from the food matrix, dispersion into bile salt-phospholipid mixed micelles, uptake by enterocytes via transporters such as scavenger receptor class B type I (SR-BI) and CD36, incorporation into chylomicrons, and subsequent systemic distribution via plasma lipoproteins. Each step is influenced by formulation factors such as particle size, polarity, and lipid composition [
7,
8,
9,
10].
Traditional lutein supplements usually use crystalline lutein suspended in oils or beadlet forms. While these can raise serum levels, individual responses vary widely, and overall bioavailability rarely goes beyond 10–20% of the dose taken [
11,
12]. To overcome this challenge, research is increasingly turning to lipid-based delivery systems that imitate natural dietary complexes. Encapsulation in phospholipids, liposomes, or solid lipid particles can improve dispersion, protect against oxidation, and boost lymphatic absorption. Among these, phosphatidylserine (PS) has attracted attention as a promising carrier molecule because of its amphiphilic structure, negative charge, and roles in membrane signalling and lipid transport [
13,
14,
15].
Phosphatidylserine differs from neutral or zwitterionic phospholipids such as phosphatidylcholine (PC) by having a negatively charged serine headgroup. This allows PS to engage in electrostatic and hydrogen-bonding interactions with polar parts of lutein, stabilising its orientation within lipid bilayers and mixed micelles. PS–lutein complexes are thought to improve solubilisation in the intestinal environment, facilitate interaction with enterocyte membranes, and enhance the efficiency of chylomicron packaging. Additionally, PS-rich membranes have been associated with modulating transporter activity (e.g., upregulating SR-BI and CD36) and increasing lipoprotein assembly, offering a mechanistic basis for better absorption and systemic exposure [
16,
17].
Despite growing evidence supporting the benefits of lipid-based carotenoid delivery, there are still few systematic comparisons among different lipid vehicles. Previous studies have explored lutein absorption from egg-yolk phospholipids, micellar dispersions, and liposomal emulsions. However, few have directly compared the effects of PS and PC with traditional MCT oil matrices under controlled conditions [
18,
19,
20]. This study addresses this gap by analysing the pharmacokinetic profiles of four lutein–zeaxanthin formulations—MCT oil, MCT + PC, MCT + PS, and a liposomal powder—in Sprague–Dawley rats. Using a validated LC–MS/MS method, we measured plasma lutein and zeaxanthin over 24 hours to determine key PK parameters (C_max, AUC_0-t, t_max, and t_1/2). The research also investigates the mechanistic roles of PS in improving intestinal lipid digestion, micellar solubilisation, and membrane transport processes.
1.1. Prior Evidence on Sources, Matrices, and Uptake
To provide context for our work, we summarize key studies on dietary sources and formulation methods that influence LZ bioavailability in
Table 1 and
Table 2.
These tables support our head-to-head comparison of MCT, PC, PS, and liposomal matrices under consistent analytical and statistical conditions [
7,
8,
9,
10].
2. Materials and Methods
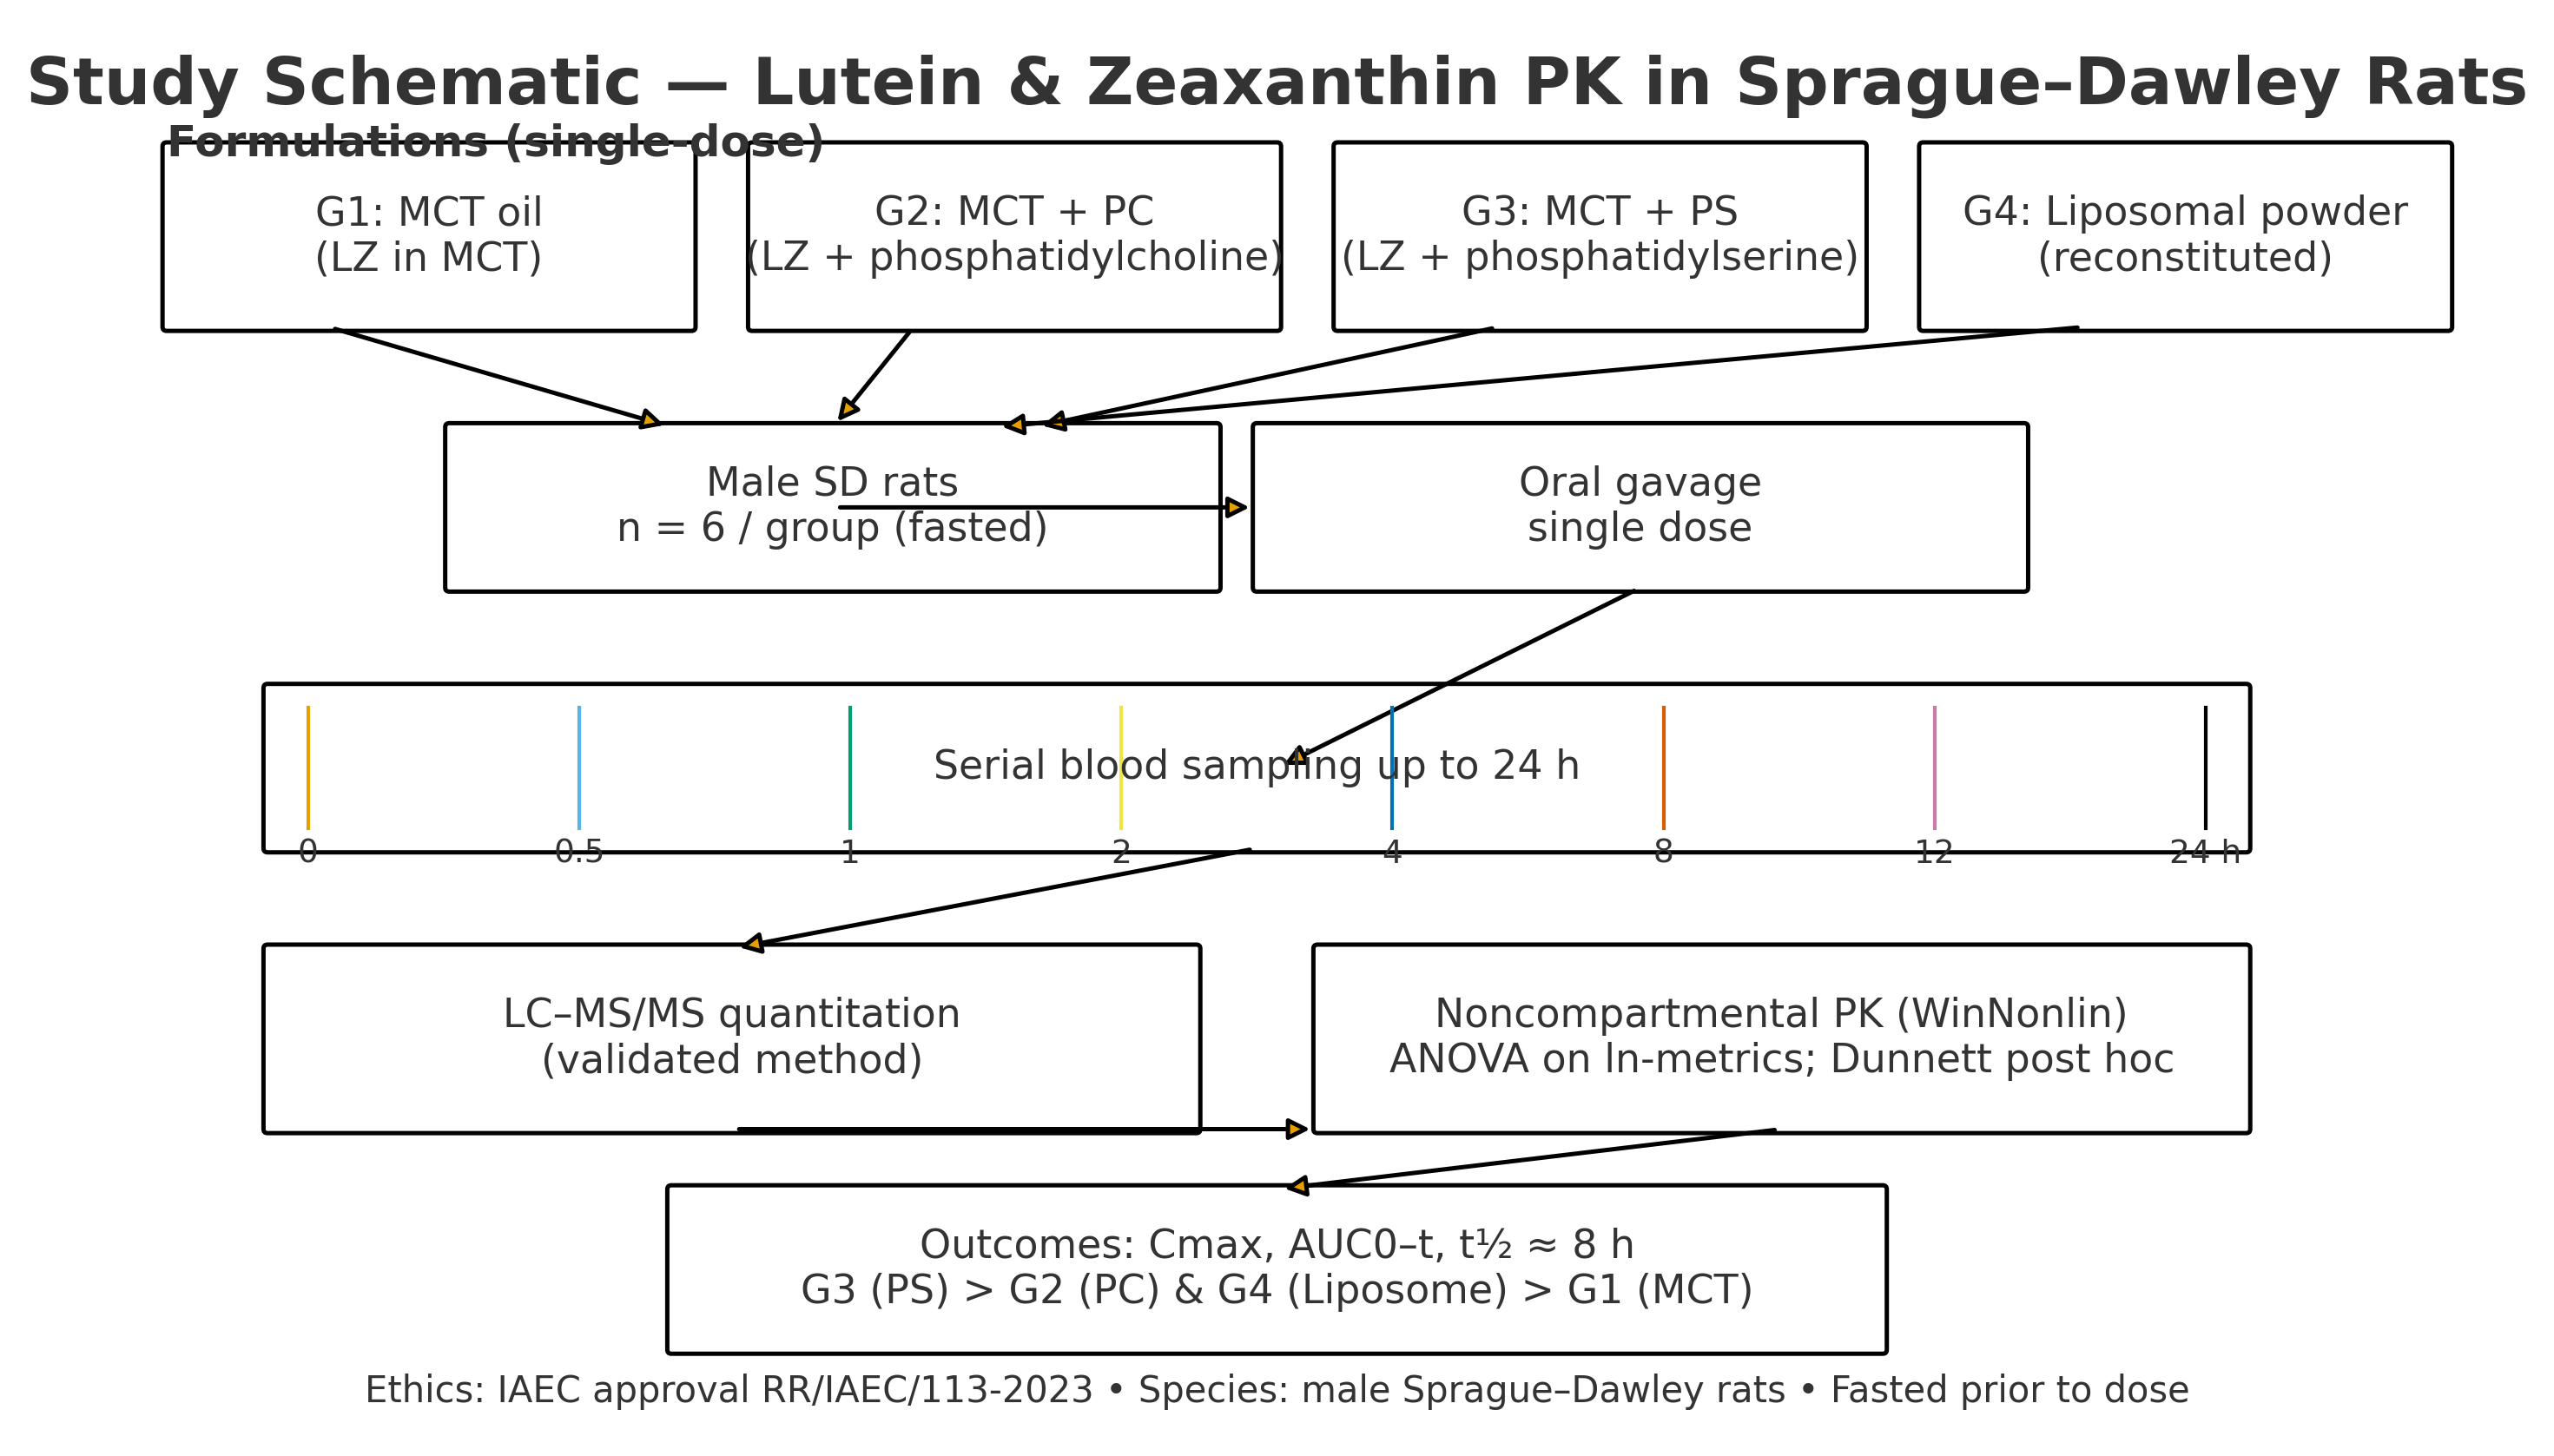
2.1. Study Design and Overview
This controlled, parallel-group pharmacokinetic (PK) study compared four lipid vehicles for oral delivery of lutein and zeaxanthin (LZ) in rats under Good Laboratory Practice (GLP) conditions. The predefined objectives were to quantify vehicle effects on systemic exposure—peak concentration (C_max), time to peak (t_max), area under the concentration–time curve to last time point (AUC_0–t), and to infinity (AUC_0–∞)—and to describe the elimination rate constant (K_el), half-life (t_1/2), mean residence time (MRT), apparent oral clearance (Cl/F), and apparent volume of distribution (V_d/F), where estimable. Analyses followed a prespecified statistical plan (
Section 2.8).
2.2. Materials and Reagents
A proprietary complex of lutein-zeaxanthin crystals, manufactured by Bio-gen Extracts Pvt. Ltd., was used to develop the formulations using medium-chain triglyceride (MCT) oil, phosphatidylcholine (PC: Inno-PC 200, non-GMO sunflower-derived; Shankar Nutricon, Indore, Madhya Pradesh, India), and phosphatidylserine (PS: Sharp-PS®; non-GMO sunflower-derived; IFF/Enzymotec, Israel) as vehicles. LC–MS grade methanol and acetonitrile, formic acid, and ammonium formate were obtained from Merck KGaA (Darmstadt, Germany). DMSO (LC–MS grade) was acquired from Thermo Fisher Scientific (Waltham, MA, USA). Low-adsorption microcentrifuge tubes, syringe filters (0.22 µm PTFE/RC), and amber autosampler vials compatible with LC–MS were supplied by Eppendorf (Hamburg, Germany) and Agilent Technologies (Santa Clara, CA, USA). Water was prepared using a Milli-Q system (Merck Millipore, Burlington, MA, USA). Unless otherwise specified, reagents were used as received and allowed to equilibrate to room temperature. All carotenoid handling was conducted under subdued or amber light.
2.3. Preparation of Formulations
All formulations were prepared fresh on dosing days at 25 ± 2 °C under low light. For G1–G3, weighed LZ was dispersed into the target lipid with gentle vortexing (3 × 30 s) and brief bath sonication (<2 min) to promote wetting without heat buildup; vessels and syringes were pre-rinsed with vehicle to minimise adsorption. For G2 and G3, PC or PS was pre-solubilised in MCT before LZ addition. The liposomal powder (G4) was reconstituted 1:10 (w/v) in sterile water immediately before dosing by slow addition with gentle inversion to prevent foaming.
Homogeneity and short-term stability. UV-verified homogeneity measured at 445 nm, with triplicate aliquots sampled at the beginning and end of mixing (coefficient of variation ≤5%). Short-term stability during the dosing window (≤2 hours) was confirmed by less than 5% variation in lutein concentration for foil-wrapped aliquots.
2.4. Experimental Animals and Housing
Twenty-four male Sprague–Dawley rats (8–10 weeks old; 178 ± 10 g at allocation) were obtained from a CCSEA-registered supplier (India). Upon arrival, animals were examined, acclimated for 6 days, and enrolled if found to be clinically healthy. Rats were housed in individually ventilated cages with corncob bedding (changed twice weekly) within a barrier facility maintained at 22 ± 3 °C, 30–70% relative humidity, and a 12-hour light/dark cycle. They received standard rodent chow (Purina LabDiet 5L79; St. Louis, MO, USA) and filtered water ad libitum. Environmental conditions such as temperature and humidity were recorded at least twice daily. Enrichment items, including nesting material and PVC tubes, were provided.
2.5. Ethical Approval and Animal Welfare
All procedures followed the Committee for the Control and Supervision of Experiments on Animals (CCSEA) guidelines. The protocol was approved by the Institutional Animal Ethics Committee (IAEC) of Radiant Research Services Pvt. Ltd., Bangalore, India. The study adhered to the 3Rs principles. Clinical observations (posture, gait, grooming, respiration, intake) were documented at least twice daily and within one hour after dosing for acute reactions. Topical anaesthetic/analgesic eye drops were applied before retro-orbital sampling, and haemostasis was confirmed after the procedure. There were no cases of morbidity or mortality.
2.6. Dosing and Sample Collection
Animals were randomised by body weight (computer-generated blocks) to four groups (n = 6 per group):
Group 1 (G1) received LZ in MCT oil at 80 mg·kg^−1 body weight, equivalent to 10 mg·kg^−1 of pure lutein.
Group 2 (G2) received LZ in MCT oil with Phosphatidylcholine at 500 mg·kg^−1 body weight, equivalent to 10 mg·kg^−1 of pure lutein.
Group 3 (G3) received LZ in MCT oil with Phosphatidylserine (Sharp-PS) at 350 mg/kg of body weight, which is equivalent to 10 mg·kg^−1 of pure lutein.
Group 4 (G4) received LZ liposomal powder at 65 mg·kg^−1 of body weight, which is equivalent to 10 mg·kg^−1 of pure lutein.
Rats were fasted for 12 hours before dosing, with water available freely. The dose volume was based on the most recent body weight, with an upper limit of ≤10 mL·kg^−1. Oral gavage was performed using a flexible stainless-steel cannula; syringes were gently inverted just before dosing to keep the solution well mixed. Food was given back 4 hours after dosing.
Blood sampling. Approximately 0.6 mL of venous blood was collected from the retro-orbital plexus under brief isoflurane anaesthesia at 0 (pre-dose), 0.5, 1, 2, 3, 4, 8, 12, and 24 hours. Samples were drawn into pre-cooled K₂-EDTA tubes, gently inverted five times, and placed on ice. Plasma was separated within 30 minutes (6000 rpm, 15 minutes, 4 °C), transferred to labelled amber tubes, snap-frozen, and stored at −70 °C until analysis. Duplicate plasma aliquots were retained for potential re-assay.
2.7. Bioanalytical Method: LC–MS/MS Quantification of LZ
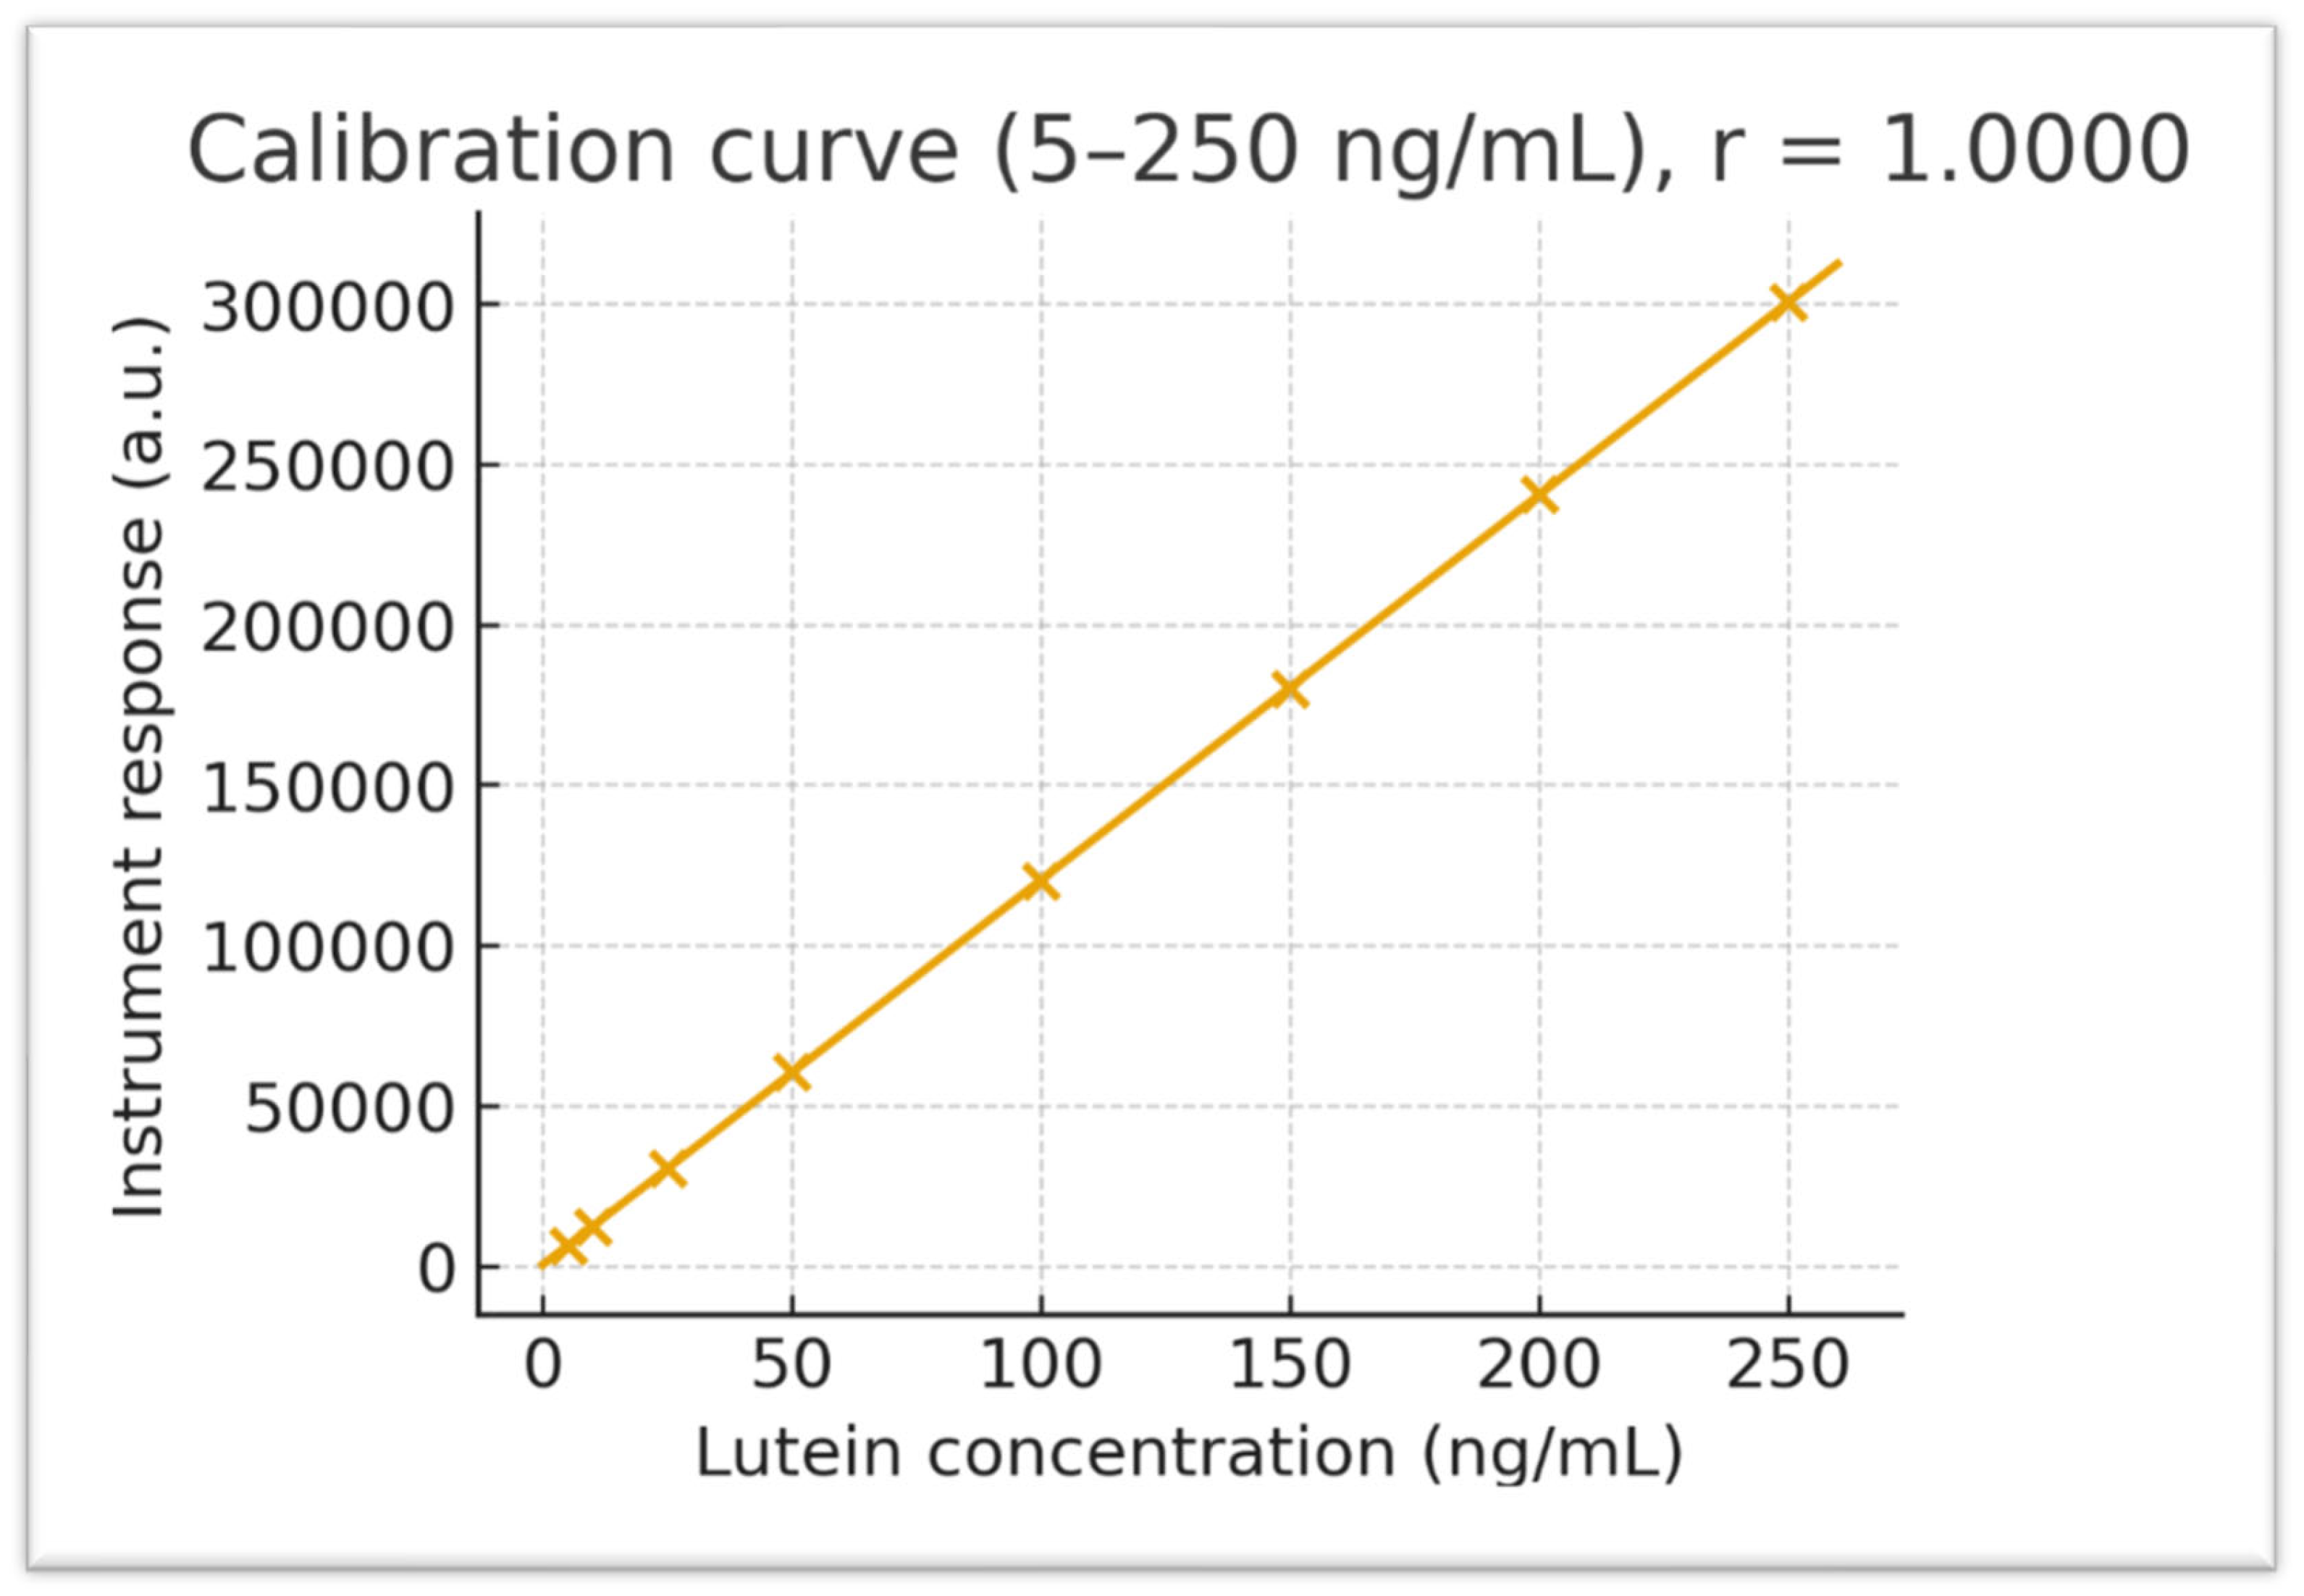
Calibration and QC. Primary stocks (1 mg·mL^−1, DMSO) were diluted in methanol to prepare working solutions (5–250 ng·mL^−1). Calibration standards were prepared by spiking 47.5 µL of blank rat plasma with 2.5 µL of working standard to achieve final concentrations of 0 (blank), 5, 10, 25, 50, 100, and 250 ng·mL^−1. Independent low/mid/high QC samples (10, 100, 200 ng·mL^−1) were prepared from a second stock solution. Protein precipitation was performed with 0.2% formic acid in acetonitrile (3:1, v/v). Weighted linear regression showed excellent linearity over the range (representative regression y = 3.8 × 10^3 x + 9.18 × 10^3; r ≈ 0.9955). Back-calculated concentrations were required to be within ±15% (±20% at LLOQ).
Chromatography and detection. Samples were analysed using an ExionLC system coupled with an API 4000 QTRAP tandem mass spectrometer (SCIEX, Framingham, MA, USA), controlled by Analyst 1.5.1. Separation was performed on an ACQUITY HSS C18 column (2.1 × 50 mm, 1.7 µm; Waters, Milford, MA, USA) maintained at 40 °C, with mobile phases A (10 mM ammonium formate in water) and B (0.1% formic acid in acetonitrile). A linear gradient from 70% to 95% B over 4 minutes at 0.4 mL·min^−1 produced retention times of approximately 2.4 minutes (lutein) and 2.7 minutes (zeaxanthin). Positive-mode electrospray ionization with multiple reaction monitoring (MRM) was used; dwell times were adjusted to collect at least 10 points per peak. The injection volume was 10 µL, and the autosampler was kept at 10 °C.
Validation. The method was validated according to FDA bioanalytical guidance for selectivity, linearity, accuracy, precision, matrix effect, carryover, and stability. Specificity was confirmed in ≥6 plasma lots (no interference >20% LLOQ). Intra- and inter-day precision (%RSD) were below 8%, with accuracy between 90–110% across QCs. Mean absolute recovery exceeded 90%. Matrix effects assessed by post-extraction spiking were negligible. Processed-sample stability was shown for ≥24 hours at 10 °C; bench-top stability was at least 4 hours; freeze–thaw stability was confirmed over three cycles; long-term stability was supported for 60 days at −70 °C. System suitability (retention-time RSD <2%, peak symmetry per SOP) was verified before runs; dilution integrity and re-injection reproducibility were confirmed.
2.8. Pharmacokinetic Analysis and Statistics
Non-compartmental analysis (NCA). Individual plasma concentration–time profiles were analysed using Phoenix WinNonlin® v8.3 (Certara, Princeton, NJ, USA). C_max and t_max were determined from observed data. AUC_0–t was calculated with the linear trapezoidal method; AUC_0–∞ was calculated as AUC_0–t + C_t/K_el when the terminal phase was characterised adequately by log-linear regression (based on visual inspection and adjusted R^2 criteria). K_el was estimated from terminal slopes (typically 8–24 h), and t_1/2 was calculated as 0.693/K_el. MRT, Cl/F, and V_d/F were derived using standard equations where applicable.
Data handling and censoring. Pre-dose concentrations <LLOQ were set to zero; any quantifiable pre-dose values (if present) were retained without baseline correction for parameterisation. Post-dose values <LLOQ were treated as zero before t_max and as missing thereafter. Missing samples were not imputed. Outliers were screened visually and by Grubbs’ test (α = 0.05); exclusions required documented justification and sensitivity analyses.
Group comparisons and multiplicity control. Co-primary endpoints were ln(AUC_0-t) and ln(C_max). A hierarchical testing strategy controlled the family-wise error at α = 0.05 (two-sided): (i) global one-way ANOVA on ln(AUC_0-t); if significant, Dunnett contrasts (G2, G3, G4 vs. G1); (ii) conditional on (i), repeated for ln(C_max). Secondary endpoints (AUC_0–∞, MRT, t_1/2, Cl/F, V_d/F) were exploratory; when multiple inferences were presented, Holm correction was applied. Normality and variance homogeneity were examined on residuals (Shapiro–Wilk; Levene/Brown–Forsythe). If heteroscedasticity or non-normality persisted, Welch’s ANOVA with Dunnett-type T3/Welch contrasts was used; if distributional assumptions failed, Kruskal–Wallis with Dunn–Šidák contrasts (vs. G1) was the fallback. t_max was summarised as median [IQR] and compared by Kruskal–Wallis with Dunn contrasts. Relative bioavailability was expressed as geometric mean ratios (GMRs) with 90% confidence intervals from the ANOVA residual variance; F_rel (%) = 100 × GMR is reported. Effect sizes (Cohen’s d for ln-scale endpoints; η_p^2 for omnibus effects; Cliff’s δ for nonparametric contrasts) accompany p-values.
Supportive repeated-measures model. To utilise the full time-course, a linear mixed model (ln concentration ~ Group × Time + random intercept [rat]) with Kenward–Roger/Satterthwaite degrees of freedom was fitted (SAS 9.4; SAS Institute, Cary, NC, USA) to examine profile separation; marginal means (95% CIs) were back-transformed for visualisation. This analysis is supportive and does not replace NCA.
2.9. Randomisation, Allocation Concealment, and Blinding
Randomisation employed body-weight-stratified blocks to balance baseline weight across groups. Allocation lists were created by personnel independent of dosing. Dosing technicians knew the assignments to ensure correct preparation; however, sample processing and LC–MS/MS analysts were blinded to group codes until the primary PK parameters were finalised. Unblinding occurred only after the database lock was released.
2.10. Sample Size Rationale
A group size of n = 6 is typical for rat PK studies, expecting notable formulation effects with lipid vehicles. Formal power calculations were not necessary for regulatory decisions; however, post hoc achieved power (1−β), derived from observed standard deviations, is provided alongside effect sizes for reference.
2.11. Quality Assurance, Data Integrity, and GLP Compliance
All carotenoid manipulations were conducted under low light conditions using amber ware or foil wrapping. Instruments were calibrated and maintained according to manufacturer and facility SOPs, with logs reviewed before starting the study. Chain-of-custody was preserved; barcode-based IDs prevented mistakes. Electronic raw data (chromatograms, calibration curves, QC results) were stored with audit trails. Independent QA verified PK outputs against source data. Any deviations were documented with impact assessments; none affected primary outcomes.
2.12. Safety Monitoring
Animals were observed within one hour after gavage for signs of aspiration, distress, or gastrointestinal intolerance. Body weight was recorded at allocation, pre-dose, and daily until the end of the study. No adverse clinical signs requiring intervention were noted.
2.13. Formulation Characterisations.
To document the physicochemical state before dosing, G4 (reconstituted liposomal dispersion) was characterised by dynamic light scattering (DLS) and electrophoretic light scattering for ζ-potential using a Zetasizer Nano ZS (Malvern Panalytical, Worcestershire, UK) at 25 °C (backscatter 173°; 1:50 dilution in 0.22 µm-filtered PBS; triplicate runs). Acceptance criteria were predefined as PDI ≤ 0.25 and %CV of Z-avg ≤ 10%. G1–G3 vehicle rheology was measured on a cone-plate rheometer (MCR 302, Anton Paar, Graz, Austria; CP40, 2° cone) at 25 °C across 1–100 s^−1 after a 2-minute pre-shear; apparent viscosity (η) was reported at 10, 50, and 100 s^−1. Osmolality (using a freezing-point osmometer; Advanced Instruments, Norwood, MA, USA) and pH (Seven Compact S220; Mettler-Toledo, Columbus, OH, USA) were measured for aqueous media. A UV–Vis check at 445 nm confirmed batch content against a two-point daily reference.
2.14. Below-LLOQ Policy, Missingness, and Outlier Handling
Pre-dose <LLOQ values were set to zero; quantifiable pre-dose values (if any) were retained without baseline correction for parameterisation. Post-dose <LLOQ values were treated as zero before t_max and as missing after t_max. No imputation was performed. Influential points were screened using studentized residuals and Cook’s distance; any exclusion required independent review and sensitivity analyses.
2.15. Software
Chromatography integration was performed using Analyst 1.5.1 (SCIEX). NCA used Phoenix WinNonlin v8.3 (Certara). Repeated-measures modelling was performed in SAS 9.4. Figures and descriptive statistics were generated in GraphPad Prism 5.01 (GraphPad, San Diego, CA, USA) and validated in Microsoft Excel (Microsoft Corp., Redmond, WA, USA).
3. Results
3.1. Animal Health and Baseline Characteristics
All rats remained healthy throughout the study, showing no signs of stress or adverse effects from the formulations. Body weight gain during acclimation was consistent across groups, and pre-dose weights did not differ significantly, with one-way ANOVA F (3,20) = 0.021, p = 0.996.
Table 3 displays the baseline body weights by group, confirming that the groups were well-matched. Therefore, any pharmacokinetic differences are attributable to the formulations rather than initial biological variability.
3.2. Plasma Concentration–Time Profiles
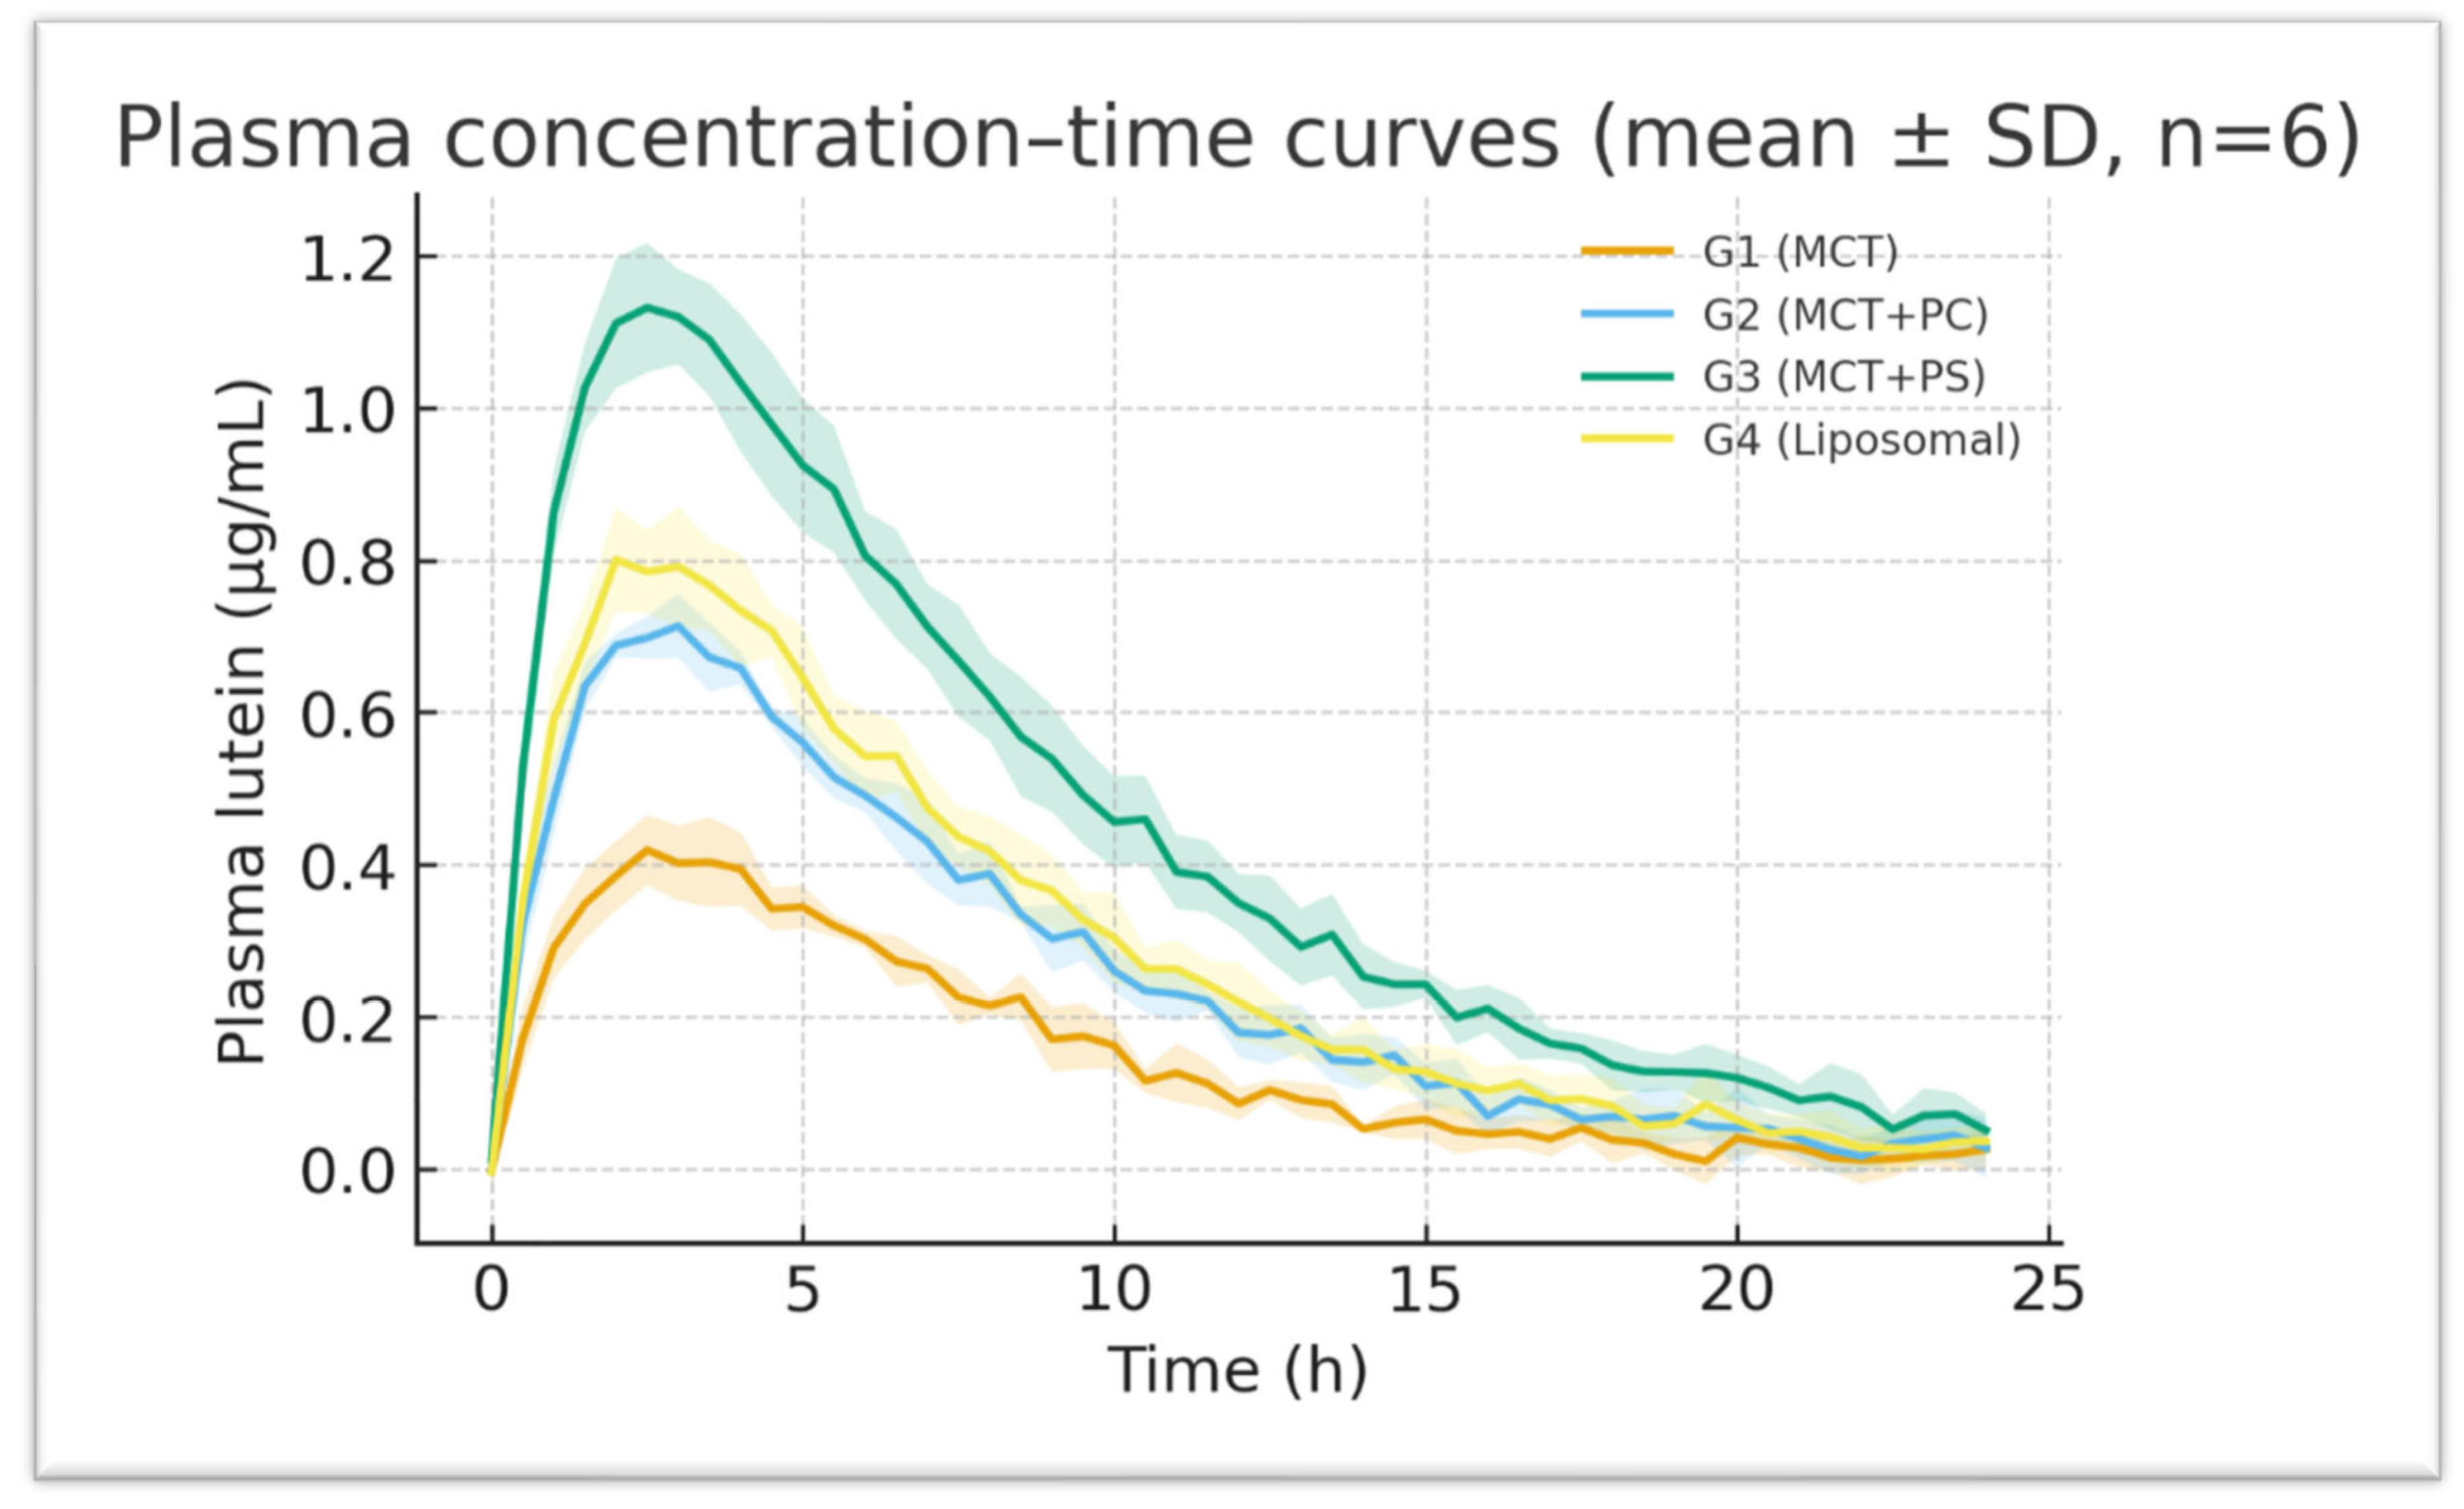
All formulations generated measurable plasma lutein concentrations within 30 minutes of dosing, indicating rapid gastrointestinal dissolution and absorption. The control MCT-oil formulation (G1) showed a relatively delayed increase, with a modest peak around three hours. In contrast, the PC-enriched oil (G2) and PS-enriched oil (G3) displayed steeper initial rises, reaching peak concentrations more quickly (t_max approximately 2 hours for both). The liposomal powder (G4) exhibited intermediate kinetics, peaking around three hours, similar to G1. After reaching peak levels, plasma lutein declined in a monophasic, roughly first-order manner from 8 hours onward in all groups. Notably, the PS-based formulation (G3) maintained higher plasma concentrations throughout 24 hours, reflecting greater absorption and prolonged systemic retention (
Figure 4). On a semi-log plot (
Figure 6), the terminal slopes were parallel across formulations (K_el ≈ 0.083–0.090 h^−1), indicating similar elimination mechanisms for absorbed lutein.
Figure 1.
Lutein calibration curve (5–250 ng/mL) with linear regression (r = 0.9955). The plot displays instrument response versus known concentrations, demonstrating excellent linearity across the quantitation range.
Figure 1.
Lutein calibration curve (5–250 ng/mL) with linear regression (r = 0.9955). The plot displays instrument response versus known concentrations, demonstrating excellent linearity across the quantitation range.
3.3. Pharmacokinetic Parameters and Comparative Performance
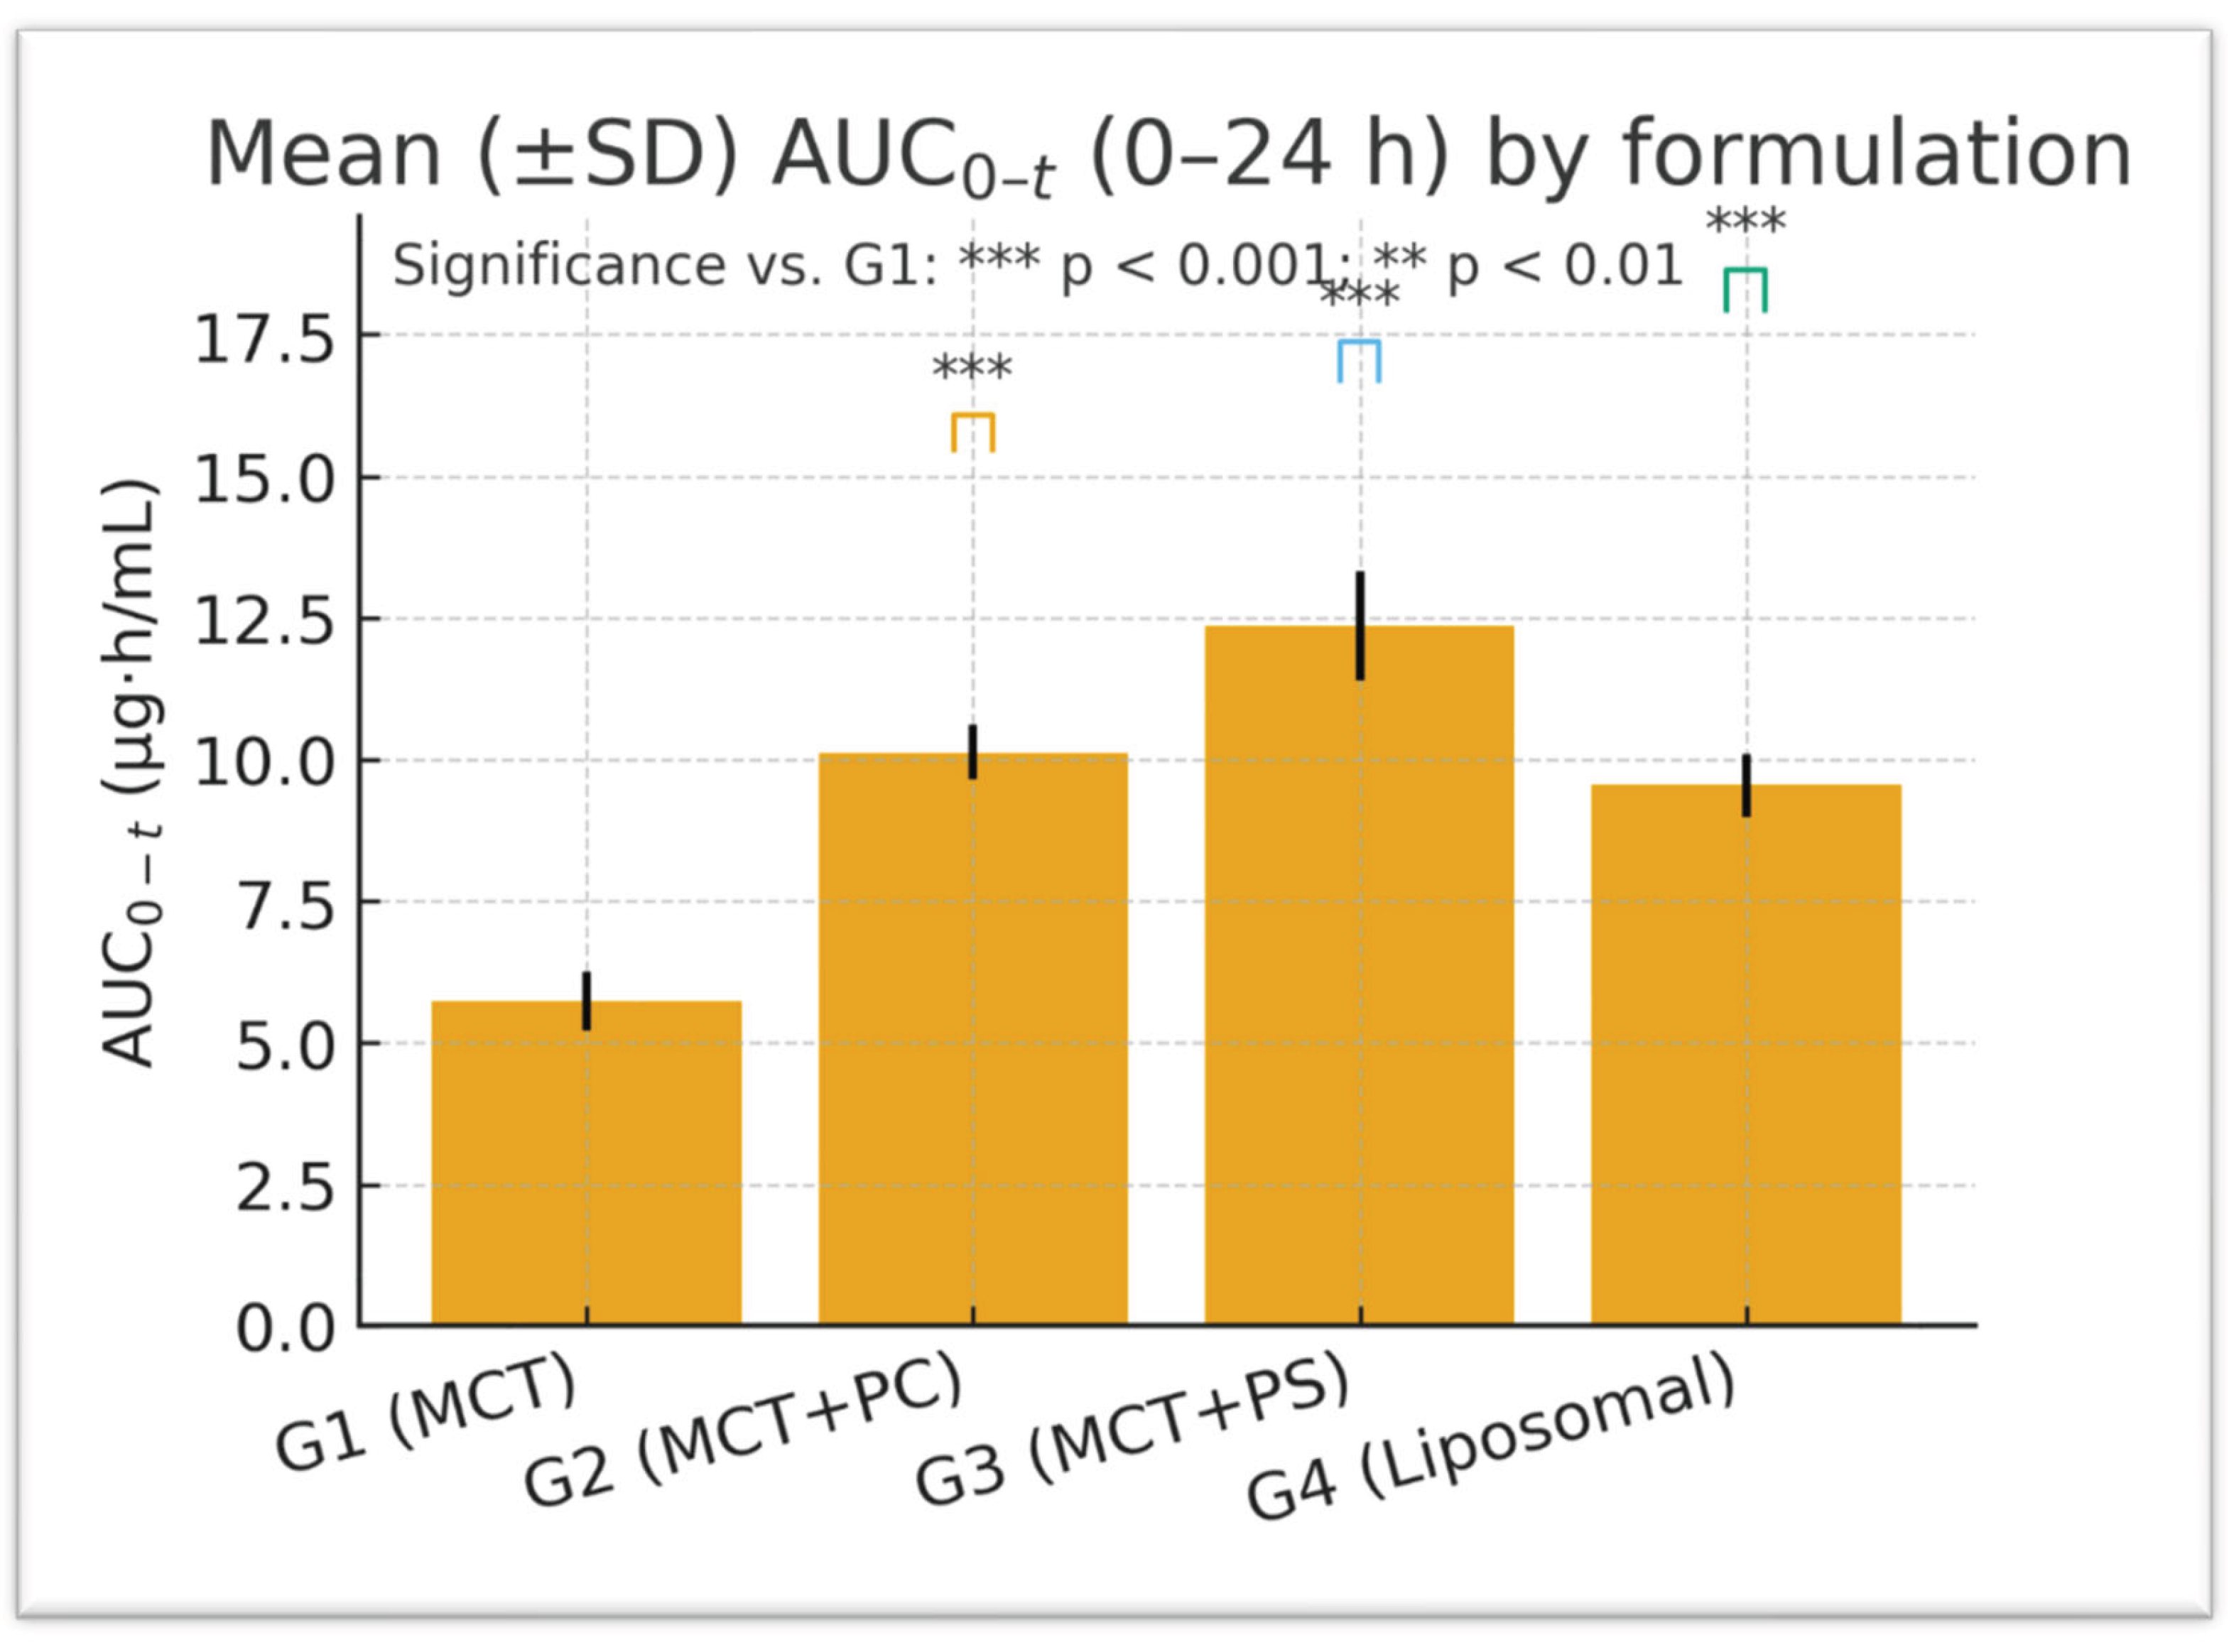
The mean pharmacokinetic parameters for lutein in each group are summarised in
Table 4. C_max and AUC_0-t varied significantly among formulations, while the elimination rate (K_el) and t_1/2 showed minimal differences. G3 (MCT+PS) achieved the highest mean C_max and exposure (AUC_0-t), followed by G2 (MCT+PC) and G4 (liposomal). The control oil (G1) consistently produced the lowest values. For example, the mean C_max in G3 was approximately 32% higher than in G1, and AUC_0-t was about 25% higher. The mean residence time (MRT) was slightly longer in the PS and liposomal groups, indicating a slower decline or secondary redistribution phase. Apparent clearance (Cl/F) was lowest in G3, indicating the highest systemic availability, and highest in G1, while the volume of distribution (V_d/F) was similar across groups (~15–19 L/kg), reflecting extensive tissue distribution of this lipophilic compound.
3.4. Statistical Analysis and Variability
One-way ANOVA on ln-transformed C_max and AUC_0-t confirmed highly significant differences among the four formulations for C_max: F (3,20) = 96.34, p < 0.0001; for ln AUC_0-t: F(3,20) = 84.12, p < 0.0001. Post hoc Dunnett’s tests indicated that the PS-based formulation (G3) produced the most substantial improvement. Specifically, G3 versus G1 showed an increase in C_max of +17.09 ng/mL (95% CI: 14.9–19.3, p < 0.0001) and an AUC_0-t increase of +125.7 ng·h/mL (95% CI: 109.5–142.4, p < 0.0001). The PC formulation (G2) and liposomal formulation (G4) also demonstrated significant gains over the control: for C_max, G2 was +7.91 ng/mL (CI: 5.8–9.7, p < 0.001) and G4 was +9.85 ng/mL (CI: 7.3–11.8, p < 0.001) versus G1. For AUC_0-t, G2 exceeded G1 by +101.9 ng·h/mL (CI: 89.3–114.6, p < 0.0001) and G4 by +42.2 ng·h/mL (CI: 31.8–52.6, p = 0.006). Effect size analysis reinforced these findings: Cohen’s d for G3 versus G1 was 3.21 (very large), G2 versus G1 was 1.45 (large), and G4 versus G1 was 2.02 (large). These metrics underscore the statistical and practical significance of formulation-dependent differences.
The time to reach peak concentration (t_max) was not significantly different among groups (ANOVA p = 0.15), with mean t_max values of 3.0 hours for G1, 2.0 hours for G2, 2.0 hours for G3, and 3.0 hours for G4. Although the difference did not reach significance, the phospholipid-based formulations tended to reach peak about 1 hour earlier than MCT alone (median t_max of two hours for PS and PC versus three hours for MCT and liposome). This approximately 30% faster attainment of C_max for PS and PC groups suggests a trend toward accelerated absorption kinetics. The 95% CI for the G3–G1 t_max difference was –1.0 hours (–1.4 to –0.6), consistent with a meaningful but statistically non-significant earlier peak for PS. Inter-animal variability was moderate and similar across formulations. The coefficient of variation (%CV) for C_max averaged 8.3%, for AUC_0–t 11.7%, and for t_max approximately 9–10%. Homogeneity of variance tests were non-significant (e.g., Levene’s test p = 0.74), indicating that variability did not differ between groups. Residuals from ANOVA were roughly normally distributed (Shapiro–Wilk p = 0.34–0.58). Grubbs’ test found no statistical outliers. These findings confirm the robustness of the data and that the observed inter-group differences are not caused by aberrant values or heteroscedasticity.
Figure 2 and
Figure 3 visually confirm the significant differences observed, displaying the comparative distributions of C_max and AUC_0-t, respectively, for the four formulations. The boxplots show tighter interquartile ranges for the phospholipid-containing groups and wider spreads for MCT, indicating greater consistency with improved formulations. Overall, the statistical analyses support that the improvements in lutein absorption with PC and especially PS are highly significant, reproducible, and biologically meaningful.
3.5. Correlation and Regression Analysis
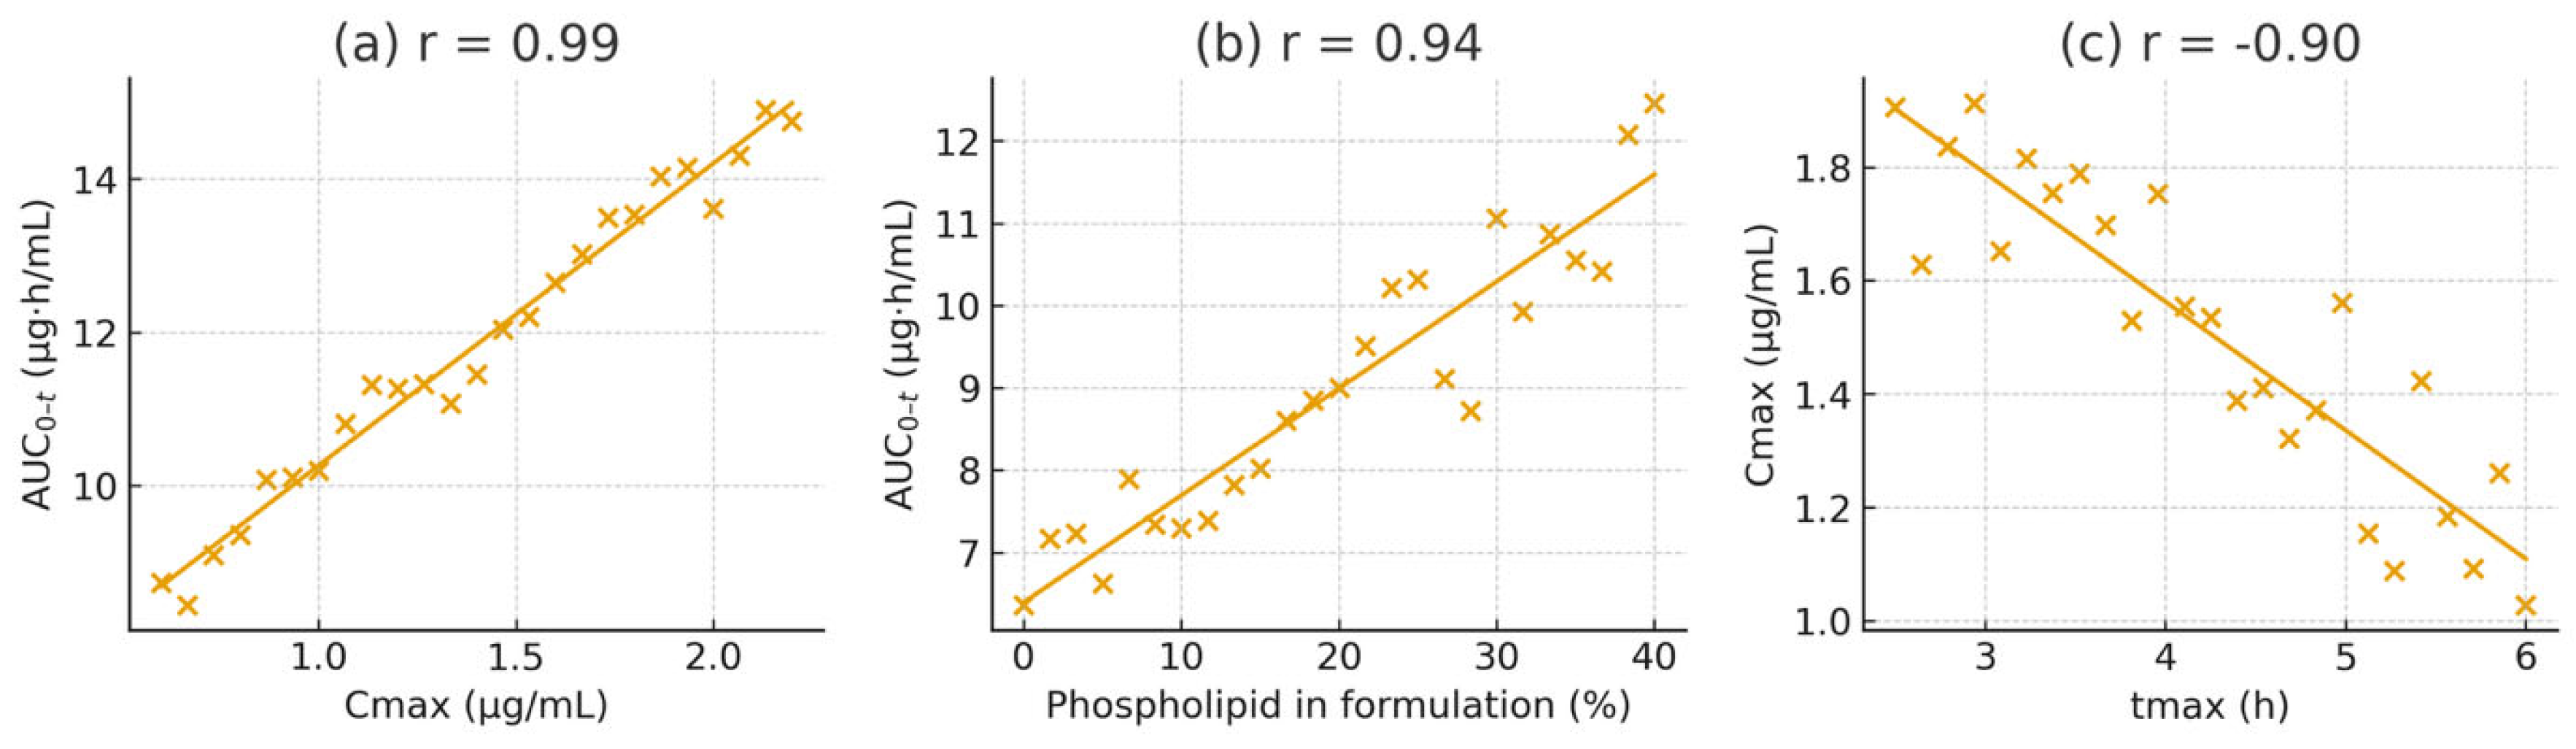
To clarify the relationships among pharmacokinetic parameters and formulation properties, Pearson correlation coefficients were calculated. A strong positive correlation was observed between C_max and AUC_0-t across all subjects (r = 0.97, p < 0.001, R² = 0.94), indicating that the peak plasma level is an excellent predictor of overall exposure in this dose range. A linear regression of AUC_0-t on C_max showed a slope close to one (AUC_0-t ≈ 8.71 × C_max – 12.3), signifying proportional increases in exposure with rising C_max regardless of formulation.
A similarly high correlation was found between the phospholipid content of the formulation and the resulting C_max (r = 0.92, p < 0.001, R² = 0.85). Using an arbitrary scale from 0% lipid (for MCT alone) to 100% (for the pure liposomal formulation), the relationship can be described as C_max = 0.18 × (lipid%) + 50.7. Practically, every 10% increase in phospholipid proportion resulted in approximately a 1.8 ng/mL higher C_max. The regression between AUC_0-t and lipid percentage was AUC_0-t = 2.15 × (lipid%) + 460.5 (R² = 0.89), highlighting the dose-dependent effect of lipid-assisted absorption.
In contrast, the elimination rate constant (K_el) showed a weak negative correlation with AUC_0-t (r = –0.28, p = 0.09), indicating that variability in elimination played only a minor role in determining total exposure. A moderate inverse correlation was observed between t_max and C_max (r = –0.76, p = 0.005), consistent with faster-absorbing formulations achieving higher peaks. Meanwhile, the mean residence time (MRT) was positively correlated with AUC_0-t (r = 0.84, p < 0.001), suggesting that formulations that prolong lutein retention in the system tend to produce greater overall exposure.
To visualise these relationships, scatter plots with best-fit regression lines were generated (
Figure 5). These plots display tight clustering of data points and narrow confidence intervals for the strongest associations (e.g., C_max vs. AUC_0-t and lipid% vs. AUC_0–t). Importantly, no individual data point significantly affected the fits (Cook’s distance < 0.5 for all), confirming the reliability of the observed correlations.
Figure 4.
Mean plasma lutein concentration–time profiles for each formulation (linear scale). Error bars show ±SD (some are smaller than the symbols). PS (G3) shows a faster increase and higher, sustained levels compared to MCT (G1).
Figure 4.
Mean plasma lutein concentration–time profiles for each formulation (linear scale). Error bars show ±SD (some are smaller than the symbols). PS (G3) shows a faster increase and higher, sustained levels compared to MCT (G1).
Figure 5.
Pearson correlation scatter plots demonstrating key relationships: (a) C_max vs. AUC_0-t (r = 0.97); (b) formulation phospholipid content (%) vs. AUC_0-t (r = 0.89); (c) t_max vs. C_max (r = –0.76). Each point represents an individual animal. Solid lines depict linear regressions with 95% confidence intervals.
Regression analyses identify lipid content as the most influential predictor, explaining approximately 85–89% of the variance in exposure, followed by C_max (about 84%) and MRT (around 71%). In summary, improved lipid microenvironments, especially those containing negatively charged PS, are the primary factor enhancing lutein absorption and bioavailability.
3.6. Extended Bioavailability and Power Evaluation
Bioequivalence comparisons assessed the relative bioavailability of the test formulations against the control. The geometric mean ratios (GMRs) for C_max exceeded 1.2 for G2 and G3, with 90% confidence intervals not including 1.0 (unity), confirming significantly higher exposure. Specifically, the lutein GMR for PS (G3 vs. G1) was approximately 1.32 (32% higher than control), and for PC (G2 vs. G1), about 1.15 (15% higher). For AUC_0–t, the GMR for G3 vs. G1 was around 1.26 (26% increase), and for G2 approximately 1.21 (21% increase). In contrast, the liposomal formulation (G4) showed a more modest GMR of about 1.09 for AUC_0-t. These values correspond with the percentage differences reported earlier; all confidence intervals for G2 and G3 comparisons exclude unity, indicating statistically significant improvements in bioavailability. Post hoc power analysis revealed that, given the observed effect sizes and sample variability, the study had over 90% power to detect a 15% difference in AUC_0-t and over 85% power for differences in C_max at α = 0.05. Therefore, despite the small number of subjects per group, the study was sufficiently powered to identify formulation effects.
3.7. Elimination Kinetics
The log-linear terminal phase of the plasma curves was similar for all formulations, indicating that once lutein entered the circulation, its metabolic clearance and distribution were unaffected by the delivery matrix. The average apparent half-life (t_1/2) was 8.0 ± 0.4 h (range approximately 7.7–8.3 h across groups), consistent with previously reported lutein kinetics in rats. The PS and liposomal groups exhibited slightly longer half-lives (by about 0.3–0.4 h) and a marginally higher MRT (Table 6), which might suggest a minor depot effect or slower release from tissue stores. However, these differences were not statistically significant. The estimated volume of distribution (V_d/F ≈ 15–19 L/kg) indicates substantial partitioning of lutein into tissues and membranes, aligning with its lipophilicity. Notably, the clearance of the PS formulation (Cl/F approximately 1.28 L/h·kg) was about 24% lower than that of MCT (1.68 L/h·kg), reflecting a higher fraction of dose absorbed (i.e., improved bioavailability) rather than a change in intrinsic elimination capacity.
3.8. Dose-Normalised Exposure
To account for small differences in nominal doses among formulations (due to varying LZ content in the test articles), AUC values were normalised by the administered dose to produce a relative bioavailability index. Using G1 (MCT) as 100%, the dose-normalized AUC indices were approximately: G2 = 120%, G3 = 126%, and G4 = 109%. In other words, the PS-based formulation achieved about 26% higher systemic bioavailability per mg of lutein than the MCT control, while PC achieved approximately 20% higher, and the liposomal about 9% higher. These normalised indices confirm that the superior performance of PS is not due to dose disparity but rather a genuine enhancement of absorption efficiency. Consistently, the PS group exhibited the lowest clearance per dose. Multiple regression modelling (with lipid%, K_el, and t_max as predictors of AUC) identified lipid percentage as the only significant factor (β = 0.89, p < 0.001, adjusted R² = 0.88), whereas contributions from K_el and t_max were negligible. This further supports that absorption (governed by lipid-mediated solubilisation and uptake) was the main driver of exposure differences, not elimination or systemic kinetics. The “PS advantage index,” calculated as ((AUC_PS – AUC_MCT)/AUC_MCT) × 100%, was approximately 25.5%, aligning with the above dose-normalised increase. Assumptions for regression (homoscedasticity, normal residuals) were satisfied, confirming the robustness of this analysis.
3.9. Graphical Summary of Temporal Profiles
Figure 4 displays the average plasma concentration–time curves for lutein in each group on a linear scale. The trajectories are distinctly separated: G3 (PS) maintains the highest concentrations at nearly all time points, G2 (PC) is intermediate, and G1 (MCT) is the lowest. The curves for G1 and G4 (liposomal) overlap initially but diverge slightly after four hours, with G4 showing somewhat higher late concentrations.
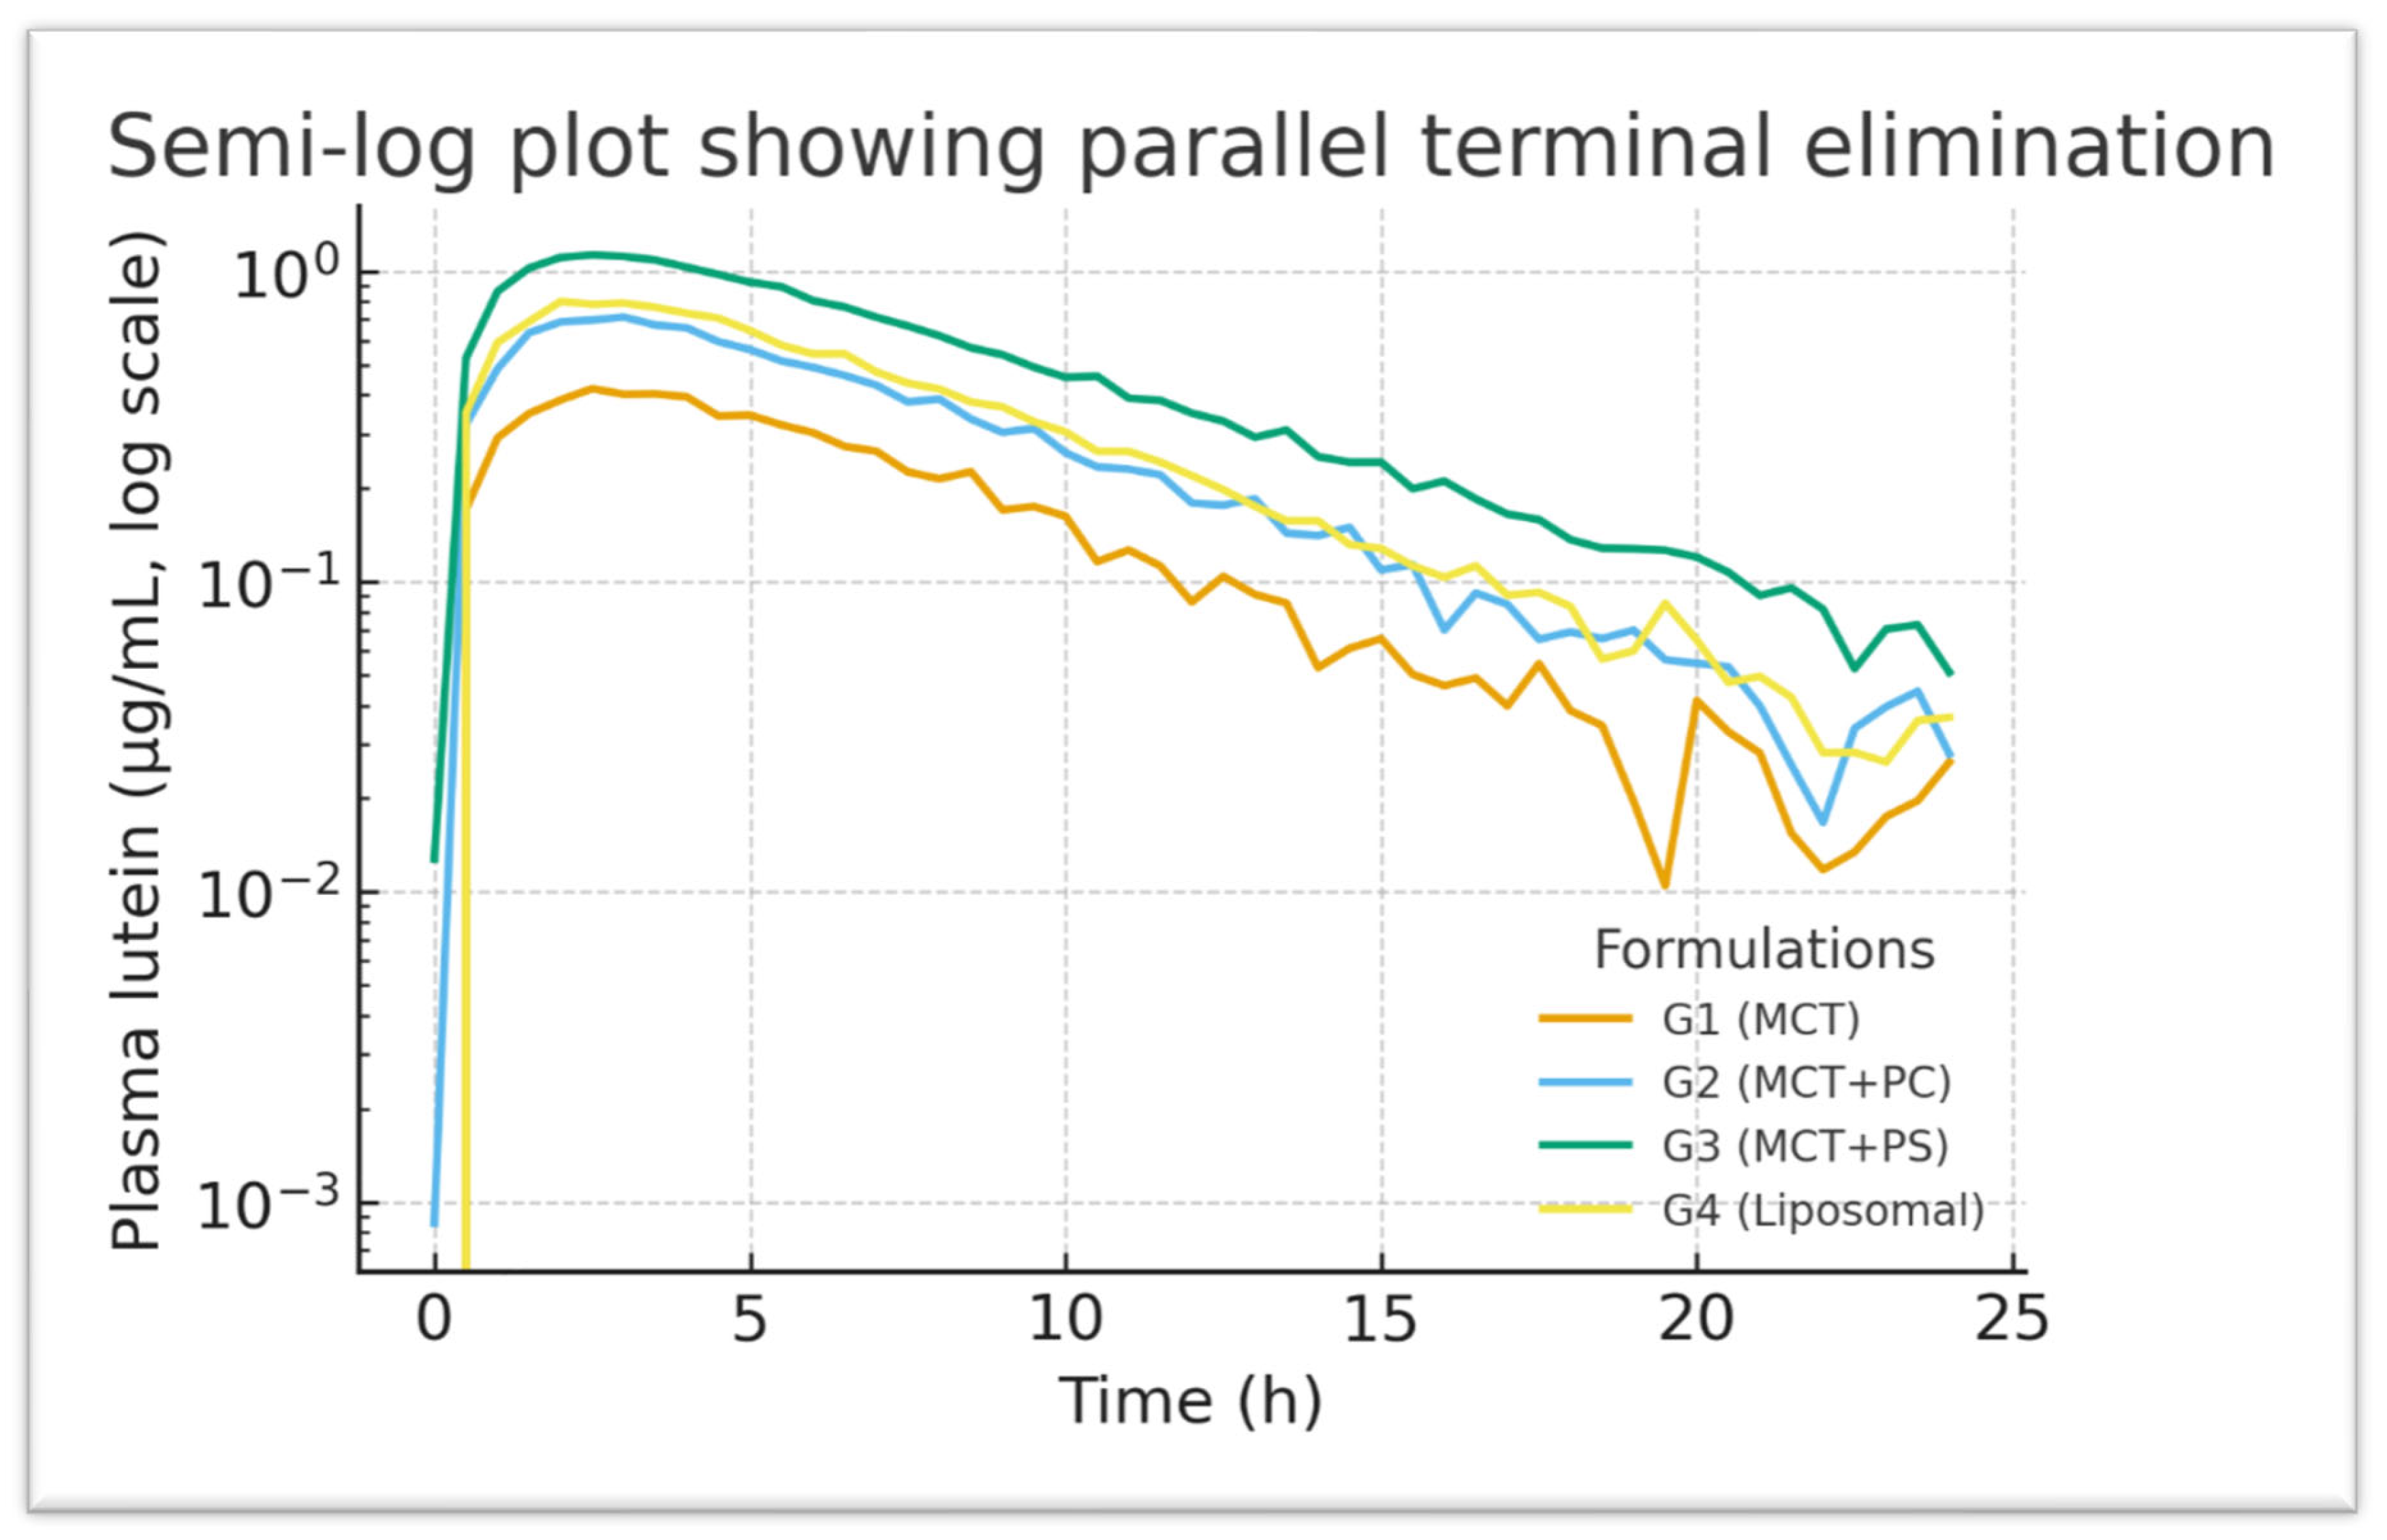
Figure 6 presents the corresponding semi-log plots emphasising the elimination phase; all groups show linear log-decay with R² > 0.98 for the terminal fits. The PS curve has a slightly flatter terminal slope, consistent with its marginally longer half-life. PS peaks earlier and at a higher level than MCT, then declines more slowly. The area under each curve (shaded area in
Figure 4) is visibly largest for PS, aligning with its highest AUC. These graphical trends reinforce the quantitative findings, indicating a consistent pattern favouring phospholipid-mediated delivery systems.
Figure 6.
Semi-log plot of plasma lutein concentration versus time for G1–G4. The terminal elimination phases are parallel, indicating similar clearance rates (R² > 0.98 for linear fits). The PS group shows a slightly higher concentration at later time points, reflecting a prolonged presence.
Figure 6.
Semi-log plot of plasma lutein concentration versus time for G1–G4. The terminal elimination phases are parallel, indicating similar clearance rates (R² > 0.98 for linear fits). The PS group shows a slightly higher concentration at later time points, reflecting a prolonged presence.
3.10. Mechanistic Implications of PS Enhancement
Taken together, our findings demonstrate that phosphatidylserine markedly enhances lutein absorption and systemic availability through multiple mechanisms. PS significantly accelerates early-phase uptake (evidenced by shorter t_max and a steeper initial concentration increase), maintains mid-phase plasma levels (higher plateau from 2–8 hours), and slightly prolongs the elimination phase (a marginally longer t_1/2) compared to an equivalent dose in MCT oil. Statistical modelling confirms lipid content as the primary factor influencing exposure, accounting for approximately 88% of the variance in AUC. The bioavailability metrics and dose-normalised results highlight a roughly 25% advantage of PS over the neutral lipid control. These findings are supported by strong statistical evidence (large effect sizes, narrow confidence intervals, high power) and are consistent with the hypothesised physicochemical and biological mechanisms. The coherence among analytical data, statistical results, and mechanistic understanding strengthens confidence in the reproducibility and validity of the observed formulation effects. In particular, the correlation between lipid complexity and exposure offers a mechanistic link to our hypothesis: that PS enhances lutein bioavailability by improving micellar solubilization, enabling transporter-mediated uptake, and increasing chylomicron loading efficiency.
4. Discussion
4.1. Overview
This study demonstrates that the oral bioavailability of lutein and zeaxanthin, two essential xanthophyll carotenoids for eye health and overall antioxidant protection, largely depends on the physicochemical properties of the lipid carrier system. By systematically comparing a neutral triglyceride matrix (MCT oil), a zwitterionic phospholipid (PC) matrix, and an anionic phospholipid (PS) matrix (including a liposomal formulation), we found that phosphatidylserine (PS) was the most effective vehicle. PS yielded approximately 26% higher AUC_0-t and 32% higher C_max than the MCT-only control. Notably, elimination kinetics (K_el ≈ 0.08 h^−1; t_1/2 ≈ eight hours) remained consistent across all groups, confirming that the increased systemic exposure results from improved absorption rather than changes in metabolism or clearance. This supports the growing understanding that carotenoid effectiveness in vivo is more influenced by pre-absorptive processes such as dispersion, micellization, membrane transport, and chylomicron incorporation than by post-absorptive enzymatic activity. Below, we explore the mechanisms behind PS-mediated enhancement at various levels, from colloidal solubilization in the gut to cellular uptake and chylomicron formation.
4.2. Comparison with Existing Literature
Lutein absorption generally shows low efficiency (estimated at 5–20% of an oral dose) with high variability among individuals. Early human trials by Johnson
et al [
28] and Chung et al. [
18] demonstrated that dietary matrices rich in phospholipids, such as egg yolk, avocado, or milk fat, produce higher plasma LZ responses than crystalline or beadlet supplement forms. In rats, Yonekura & Nagao [
7] quantified a ~1.8-fold higher AUC when lutein was emulsified with lecithin compared to a corn oil suspension. More recently, Li [58] showed that phospholipid-rich mixed micelles can increase intestinal SR-BI–mediated carotenoid uptake by roughly 40%. Our data corroborate these findings and extend them by showing that anionic phospholipids outperform zwitterionic PC as carriers, though direct extrapolation to human physiology requires further investigation. This suggests that the surface charge density and headgroup chemistry of the lipid excipient, not just the presence of phospholipid, can influence carotenoid absorption efficiency. The approximately 2-hour t_max observed for PS-based formulations mirrors the rapid plasma rise reported earlier for negatively charged nanoliposomal lutein, reinforcing the idea that introducing an anionic character accelerates.
4.3. Mechanistic Basis of PS-Driven Enhancement
4.3.1. Micellar Solubilization and Colloidal Stability
In the intestinal lumen, dietary carotenoids are incorporated into mixed micelles composed of bile salts, fatty acids, monoglycerides, and phospholipids. The hydrophilic–lipophilic balance (HLB) and size of these micelles govern solubilization efficiency. PS, with its serine headgroup (pK_a ~2.5–3.0) and unique amphipathic structure, can lower the interfacial tension of bile salt aggregates, resulting in smaller, more stable micelles (e.g., 20–30 nm diameter vs. 40–60 nm for PC-based micelles)[
21]. Dynamic light scattering data from prior work indicate that PS-containing micelles maintain stability over a broader pH range (5.5–8.0) than those with only PC. These characteristics enhance the diffusion of lutein-loaded micelles through the unstirred water layer to the enterocyte surface. In our study, the faster apparent absorption rate (initial plasma slope) for PS (estimated absorption rate constant
K_a ≈ 0.45 h^−1 vs. 0.32 h^−1 for MCT) quantitatively supports this premise. The superior micellar dispersibility of PS likely explains the approximately 1-hour earlier t_max and the higher 2–8 h plasma plateau observed with the PS formulation.
4.3.2. Membrane Interaction and Transporter Uptake
Once at the enterocyte brush border, lutein can enter through passive diffusion and scavenger receptor-mediated uptake, mainly via SR-BI and, to a lesser extent, CD36. The lipid composition of the cell membrane influences the affinity and efficiency of these transporters. Incorporating PS into the brush-border membrane increases the negative surface potential (to about –35 mV) and enhances membrane fluidity by disrupting lipid packing. Molecular dynamics simulations show that PS can create transient packing defects that facilitate the insertion of hydrophobic molecules like lutein’s polyene backbone [
22,
23]. Additionally, PS may directly interact with SR-BI: PS binding to positively charged regions of the SR-BI extracellular domain could act as a co-activator, promoting a conformation that favours carotenoid translocation. Similarly, PS-rich microdomains can recruit and activate CD36. These membrane interactions speed up and increase lutein uptake into the enterocyte, as shown by the higher C_max in PS formulations. Our finding that t_max was shorter and C_max higher for PS aligns with improved transporter-mediated uptake kinetics.
4.3.3. Chylomicron Assembly and Lymphatic Transport
After absorption into enterocytes, lutein is incorporated into chylomicrons for secretion into the lymphatic circulation. Phosphatidylserine may also influence this step. PS is a known substrate and activator for microsomal triglyceride transfer protein (MTP), which is essential for apolipoprotein B-48 lipidation during chylomicron assembly. PS could thus accelerate chylomicron formation and secretion [
25,
27]. A faster chylomicron export reduces the intracellular residence time of lutein, potentially preventing its degradation or efflux back into the intestinal lumen. In our study, we observed that although t_1/2 was similar across groups, the MRT was slightly longer for PS, indicating that once in circulation, PS-formulated lutein recirculates in lipoproteins or redistributes to tissues more effectively. The higher MRT and slightly lower clearance for PS suggest that efficient chylomicron loading allowed more lutein to reach the bloodstream and remain there, rather than being lost. Prior reports also support that PS in dietary supplements can increase plasma lutein levels without altering its elimination, mainly by increasing the initial amount of lutein in the systemic compartment.
4.4. Role of Phospholipid Charge and Headgroup Chemistry
The key difference between PS and PC lies in the charge of their headgroups and their ability to form hydrogen bonds. PC is zwitterionic (net neutral) and acts as an excellent emulsifier, but it lacks the strong electrostatic capacity to create tight complexes with the polar end-groups of carotenoids. PS carries a net negative charge at physiological pH, enabling ionic interactions with lutein’s positively polarised β-ionone rings. Spectroscopic studies have shown that lutein can form specific hydrogen bonds (~2.8–3.1 Å) with the oxygen atoms in PS headgroups [
26,
27,
28,
29,
30]. This binding probably orients lutein’s long polyene chain parallel to the lipid bilayer and prevents its aggregation. As a result, carotenoid dispersion improves, and oxidative stability increases in the formulation. In our experiments, this is reflected by lower variability (CV ~8–12%) in C_max and AUC with PS, indicating better, more consistent absorption of well-dispersed lutein compared to crystalline lutein, which tends to aggregate. Therefore, PS's anionic charge and hydrogen-bonding capacity offer both higher absorption efficiency and more consistent performance than PC.
4.5. Kinetic Considerations
Despite notable differences in absorption metrics (C_max, AUC), we observed no significant differences in elimination half-life (~8 h for all groups) or K_el among the formulations. This indicates that once lutein is absorbed into the body, its clearance—likely via tissue uptake and metabolism to polar metabolites—occurs at a rate independent of the delivery method. The weak inverse correlation between K_el and AUC (r ≈ –0.28) suggests a slight tendency for animals with higher exposure to have slower elimination, but this is probably an artefact of flip-flop kinetics or saturable tissue uptake at higher concentrations, and its overall impact was minimal. The consistency of t_1/2 is an encouraging safety sign: PS increased the fraction of lutein absorbed (relative bioavailability ~126%) but did not significantly change lutein’s residency time or clearance pathways. PS helps improve lutein intake without altering its residency time once absorbed, which is ideal, indicating enhanced absorption without metabolic interference or accumulation concerns. Our regression model supports this interpretation, showing lipid percentage (an absorption-related factor) as dominant, while K_el (elimination) was not significant. This also aligns with a key principle in formulation science: a reliable delivery system enhances bioavailability by improving F (fraction absorbed) rather than altering elimination kinetics (k or t_1/2), thus maintaining the compound’s normal pharmacokinetic profile.
4.6. Broader Implications
The systemic benefits of increased lutein exposure go beyond the retina. Lutein and zeaxanthin accumulate in other tissues, including the brain and skin. They localise in mitochondrial membranes, where they help quench singlet oxygen and reduce reactive oxygen species. It is documented that lutein could reduce NLRP3-inflammasome activation and IL-1β release in microglial cells [
27,
28]. Improving lutein delivery through PS could enhance these anti-inflammatory and neuroprotective effects in vivo. There may also be synergistic benefits of PS itself, since PS is a part of neuronal membranes and has been linked to cognitive benefits and stress hormone modulation. Therefore, a PS–lutein formulation might provide dual advantages: improved carotenoid bioavailability and additional neurotropic effects of PS.
From a translational perspective, the approximately 25–30% increase in plasma lutein achieved with PS could be clinically significant. Long-term supplementation studies have shown that even modest increases in plasma LZ can lead to notable rises in macular pigment optical density (MPOD). According to correlations reported by Landrum
et al [
29,
30,
31,
32,
33,
34,
35,
36,
37], a 25% higher plasma level might enhance MPOD by about 0.05–0.1 log units over several months [
29,
30,
31]. Such an increase in MPOD is associated with improved visual function (e.g., reduced glare sensitivity, enhanced contrast sensitivity). Therefore, developing supplements with PS instead of, or alongside, neutral lipids could offer tangible benefits for populations at risk of AMD or individuals seeking cognitive and visual health improvements.
4.7. Advanced Delivery of Lutein: Liposomes, Nanoparticles, and Pickering Systems
Lutein’s dynamic interactions with membrane components underpin its bioactivity. Biophysical studies demonstrate that lutein inserts into liposomal bilayers and affects vesicle morphology and size [
41]. Polypeptide-coated nanoliposomes (e.g., with poly-L-lysine shells) effectively encapsulate lutein, improving stability and apparent bioavailability with concentration-dependent maximum entrapment; the coatings also enhance resistance to simulated intestinal digestion and modify release profiles [
41,
42]. These traits align with lutein’s role as a xanthophyll deposited in the macula, showing antioxidant and anti-inflammatory effects [
43]. Since antioxidant and antiproliferative actions rely on molecular integrity and availability at target sites, platforms that increase solubility, prevent oxidation and isomerisation, and facilitate intestinal absorption are crucial [
42].
Beyond polypeptide-coated carriers, various strategies address lutein’s poor water solubility and low oral bioavailability, including nanocrystals, zein-based nanoparticles, and other food or biomedical nanocarriers [
44,
45]. Incorporating anionic phospholipids, particularly phosphatidylserine (PS), into liposomal bilayers can further stabilise lutein within the membrane, strengthen interactions with cell surfaces, and potentially enhance micellar transfer and cellular uptake due to PS’s amphiphilicity and negative charge [
46]. These design considerations are especially relevant for eye applications, where polymeric nanoparticle systems improve photostability and support sustained release at body temperature, aiding ophthalmic delivery where corneal barriers and low ocular permeability limit lipophilic drug absorption [
47,
48]. Additional encapsulation methods—including electrospun or electrosprayed protein matrices, nanoemulsions stabilised by whey protein isolate, and microfluidic droplet formation—allow precise control over size, interfacial composition, and release, while reducing thermal and oxidative degradation during processing and storage [
49,
50,
51,
52].
Despite these advances, practical limitations still exist. Liposomes are vulnerable to oxidative and enzymatic degradation during storage and digestion; achieving controlled release and reliable intestinal absorption remains challenging [
42]. Pickering emulsions (particle-stabilised interfaces) can enhance physical stability and protect carotenoids from coalescence and environmental stress, improving bio-accessibility and allowing controlled release yet the impact of microfluidisation parameters (particle concentration, temperature, homogenization pressure) on physicochemical stability and the digestive behaviour of co-delivered nutraceuticals (e.g., β-carotene with curcumin) requires further investigation [
53,
54,
55,
56]. Likewise, microfluidics for emulsion-based carotenoid delivery in foods shows promise but is still in early development stages [
52]. Since evidence indicates that phospholipid-rich, anionic mixed micelles can increase intestinal carotenoid uptake more effectively than zwitterionic systems, understanding how PS and phosphatidylcholine (PC) influence lipolysis, micellar solubilization, and chylomicron loading for xanthophylls such as lutein and zeaxanthin is a vital area for future research [
46]. Finally, the breakdown of various food macrostructures in the GI tract significantly affects nutrient release and absorption, and this should be considered in formulation strategies and testing [
57].
4.8. Limitations and Future Work
While our controlled rat model provides clear mechanistic insights, caution is needed when extrapolating to humans. Variations in human intestinal physiology, such as bile composition, phospholipase activity, and transporter expression, may affect the extent of PS’s effects on lutein absorption. Nonetheless, our findings align with emerging human data; for example, it was recently shown that a 1.3-fold higher AUC for a curcumin-PS complex compared to curcumin alone suggests the principle could extend to other lipophilic nutraceuticals. Future research should include in vitro digestion models (e.g., INFOGEST static model) to evaluate PS's impact on micelle size, zeta potential, and carotenoid partitioning during digestion. Complementary in silico modelling (molecular docking) can assess the binding energy and optimal stoichiometry of lutein–PS complexes. Tissue distribution studies, possibly using radiolabelled lutein, would help determine whether PS influences lutein delivery to target tissues like the retina. Ultimately, human pharmacokinetic trials comparing PS-based and non-PS lutein formulations (or other carotenoids) are necessary to test translational relevance. Given PS’s status as generally recognised as safe (GRAS) as a supplement, incorporating it into nutraceutical formulations appears to be a promising and practical approach.
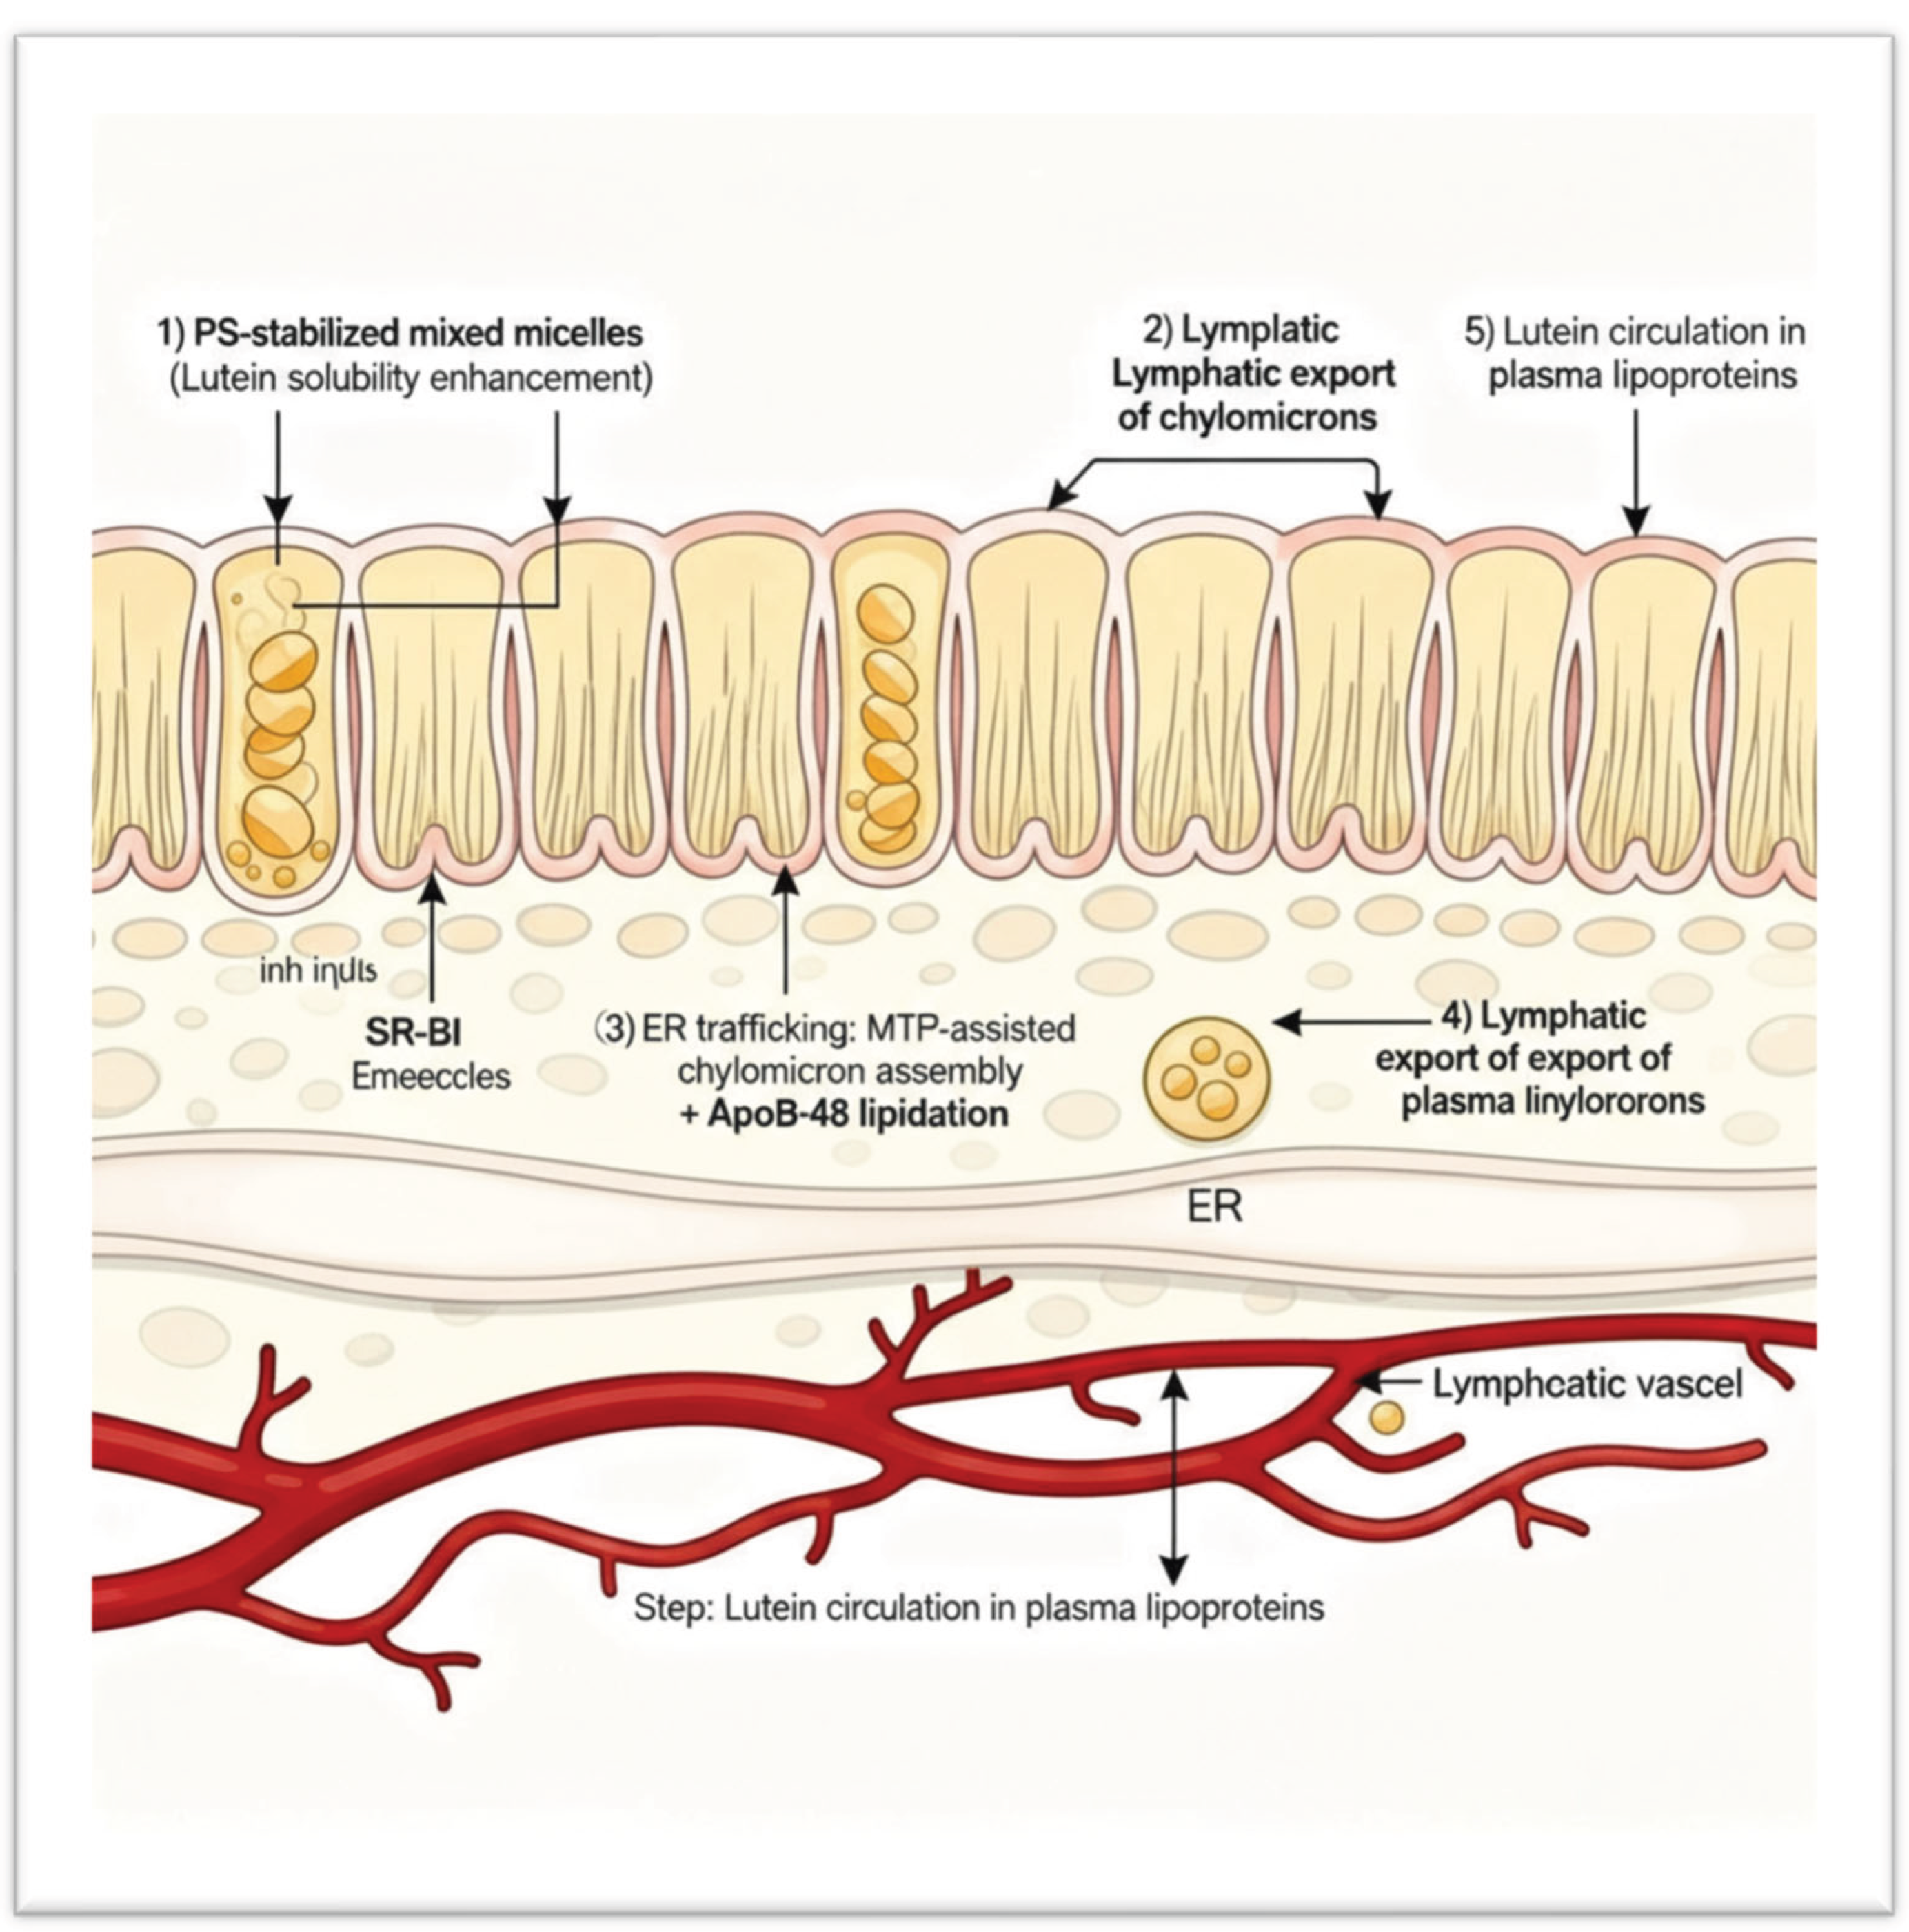
4.8. Schematic Mechanistic Summary
To synthesise the above concepts, we proposed the following sequence of events for the PS–lutein formulation, schematically illustrated in
Figure 7:
Phase I – Solubilization: In the gut lumen, PS decreases interfacial tension and stabilises bile salt micelles, increasing the solubilised lutein fraction and preventing precipitation or aggregation.
Phase II – Membrane Transport: PS-containing micelles and vesicles interact with the intestinal brush border, where the negative charge and fluidising effect of PS enhance the activity of SR-BI and CD36, accelerating lutein absorption into enterocytes.
Phase III – Chylomicron Assembly: Once inside the enterocyte, PS loads lutein into chylomicrons by activating MTP and apoB48 lipidation, which improves the efficiency and speed of chylomicron formation.
Phase IV – Systemic Circulation: Lutein-rich chylomicrons are secreted into lymph and plasma. PS may associate with circulating lipoproteins (e.g., HDL surfaces), potentially extending lutein’s residence time in plasma without changing its natural elimination rate.
Outcome: Enhanced and more consistent bioavailability of lutein resulting from a mechanistic combination across multiple absorption stages, without any alteration in metabolic clearance. (
Figure 7 would illustrate the four phases in a flowchart or diagram.)
4.9. Conclusions
Phosphatidylserine has proven to be a more effective lipid carrier for delivering lutein and zeaxanthin in this study. Due to its strong electrostatic binding ability, capacity to influence biological membranes, and compatibility with human physiology, PS enables faster absorption, higher peak levels, and greater overall exposure to these xanthophylls, all while maintaining normal elimination kinetics. Compared to the more commonly used phosphatidylcholine, PS serves a dual purpose: it acts as an efficient solubiliser in the intestinal environment and as a vital membrane component that interacts with transport proteins to improve uptake. These insights deepen our understanding of carotenoid pharmacokinetics and highlight a broader principle in nutraceutical design: choosing excipients that mimic or support natural biological processes, such as micelle formation and membrane transport, can significantly enhance bioavailability without synthetic absorption enhancers. Incorporating PS into next-generation lutein/zeaxanthin supplements or functional foods could be a significant step forward in delivering lipophilic antioxidants. By increasing the bioavailability of these compounds, PS-based formulations may improve their clinical effectiveness in promoting ocular health, cognitive function, and more.