Submitted:
18 October 2025
Posted:
20 October 2025
You are already at the latest version
Abstract
In response to Chinese liquor brewing industry's need for precise control of sorghum tannin content and the issues of low efficiency and high cost associated with traditional detection methods, this study proposes a non-destructive detection method for sorghum tannin content based on the fusion of dual hyperspectral sensor features. Based on 240 representative sorghum samples covering different varieties and production regions, visible and near-infrared (VNIR) and short-wave infrared (SWIR) hyperspectral data were sequentially collected, and the tannin content was determined using standard chemical methods as reference values. Using the competitive adaptive reweighted sampling (CARS) method, characteristic wavelength bands were extracted and fused feature subsets were constructed. Combined with partial least squares (PLS), support vector machine (SVM), and convolutional neural network (CNN) algorithms, the performance of models built from both full-data concatenation and feature fusion of VNIR and SWIR data was systematically compared. The results demonstrated that the feature-based models exhibited superior performance to the full-spectrum models, while the model incorporating dual-sensor feature fusion achieved the best overall results. And the Fused-Feature-CNN model achieved the optimal prediction performance, with values of 0.8298 for RP2, 0.2894 for RMSEP, and 2.4239 for RPDP. This study confirms that the integration of multi-sensor feature fusion with deep learning strategies can provide an effective technical pathway for the rapid, non-destructive detection of sorghum tannin content and the development of online sorting equipment.
Keywords:
sorghum
; tannin content
; hyperspectral
; feature extraction
; prediction model
1. Introduction
Chinese liquor, as one of the world's six major distilled spirits, leads globally in production and sales. It boasts a vast market scale and profound cultural heritage, being recognized as a national intangible cultural heritage, highlighting unique Eastern brewing wisdom and significant economic value [1]. Almost all Chinese famous brand liquors, such as Moutai (Sauce-aroma), Wuliangye (strong-aroma), and Fenjiu (light-aroma) are distilled spirits, and take sorghum grains as the main raw material, and its quality directly determines the yield rate and flavor profile of the base liquor.
At present, more than 80% of sorghum grains are used for liquor-brewing [2]. Biochemical and physical characteristics of sorghum grains significantly impact the flavor and taste profile of liquor. Among which, tannin (proanthocyanidins, PAs) plays a signifcant role, because tannin can produce syringic acid and syringaldehyde, both of which are necessary in the brewing process [3]. And an appropriate tannin content can inhibit the growth of harmful microorganisms and increase the yield of liquor, nevertheless, if the tannin content surpasses this optimal threshold, it can impart a bitter taste to the liquor, detracting from its overall quality. Therefore, rapid and accurate prediction of sorghum tannin content are of crucial significance for raw material selection, process adaptation, quality control, and product standardization in the liquor industry.
In order to accurately determine the tannin content in sorghum grains, researchers have employed various chemical analytical methods, such as Folin-Ciocalteu Method, Phenol-Amino Acid Method, Acid Hydrolysis Method, Colorimetric Method, and spectrophotometry [4,5,6,7,8], all these methods can provide accurate data of tannin content. However, these methods also come with some notable limitations. Firstly, the preprocessing before determination is complex, involving the drying, fine grinding, and rigorous sieving of samples. These steps are time-consuming, labor-intensive, cause irreversible damage to the natural physical structure of the sorghum grains. Furthermore, the determination process involves multiple cumbersome steps, such as extraction, filtration, concentration, dissolution, precise calibration, and potential dilution, which are not only labor-intensive but also time-consuming [9]. These traditional chemical prediction methods fail to meet the demands for online, accurate, and rapid prediction in an industrial setting.
To overcome the limitations of traditional methods, hyperspectral imaging technology has been widely used as a rapid and non-destructive prediction tool in the quality analysis of agricultural products [10]. It is an analytical technique that is based on the principle of the interaction between matter and electromagnetic radiation. By analyzing the absorption, emission, scattering, or transmission characteristics of matter towards electromagnetic radiation of different wavelengths, information about its composition, structure, and concentration can be obtained. This technique boasts advantages such as high sensitivity, strong selectivity, and non-destructiveness. Zhang et al. (2023) researched on tannin content prediction of grains, pointed out that prediction of tannin content by chemical methods is both time and manpower consuming, however, by utilizing hyperspectral imaging (HSI) technology in combination with an optimized algorithm, tannin content of grains can be detected rapidly, accurately and non-destructively [11]. Baek et al. (2023) predicted the tannin content and quality parameters in astringent persimmons, showed the possibility of using visible and near-infrared (VNIR) hyperspectral for the prediction of postharvest quality and tannin contents from intact persimmon fruit with quick, chemical-free, and low-cost assessment methods [12]. These studies all utilized data from a single hyperspectral sensor. However, a single hyperspectral sensor has limited prediction ranges. For instance, the Visible region is sensitive to color variations, while the visible and near-infrared (VNIR) and short-wave infrared (SWIR) region responds to functional groups such as C-H and O-H bonds [13].
According to a variety of studies, tannin is mainly concentrated in pericarp of sorghum grains, and there is a significant correlation between the color intensity and tannin content. Different sorghum grains exhibit variations in color and shape, usually can be effectively characterized through their distinct responses in the visible spectral regions [14,15]. Meanwhile, due to the structural complexity of tannins, their complete optical information may be distributed across a broader spectral range, including both VNIR and SWIR regions. Therefore, this study innovatively proposes a strategy based on data fusion from VINR and SWIR hyperspectral sensors. The dual sensors can cover a broader spectral range and capture more abundant and complementary information. By integrating data from both regions, the spectral features related to tannin content can be characterized more comprehensively, holding promise for achieving higher accuracy and more robust non-destructive prediction of sorghum tannin content.
The specific procedures employed in this research were as follows:
Firstly, original VNIS and SWIR hyperspectral images of sorghum samples were collected separately. Then, the tannin content was determined using chemical methods. Subsequently, two parallel processing routes were adopted: the first was an early data-layer fusion strategy, where the VNIS and SWIR spectra were directly concatenated to form a continuous spectral matrix, and then features were uniformly extracted from this concatenated data and an early fusion prediction model was established; the second was a mid-feature-layer fusion strategy, where independent feature extraction was performed on the VNIS and SWIR spectra, obtaining feature subsets representing color properties and organic molecular structure information, and then fusion was carried out through feature concatenation, and input into the final prediction model. Ultimately, this study will systematically compare the performance of the two fusion strategies and determine the optimal model for predicting sorghum tannin content, meeting the requirements of model robustness and interpretability in the brewing industry.
Through the above research, it is expected to provide an effective technical means for the rapid classification of raw materials used in liquor production, the adaptation of the process, and the quality control of the final product.
2. Materials and Methods
2.1. Experimental Materials of Sorghum Grains
The experimental materials for this study were sorghum cultivar samples collected from six different cultivation regions in Shanxi Province, namely Yanbei, Xinzhou, Lüliang, Jinzhong, Changzhi, and Yuncheng. The growing areas are located between 34°N and 40°N latitude, with elevations ranging from 300 to 1,600 meters. Each sample was collected with a weight of 1000 grams, and stored in sealed container at room temperature.
During the experiment, we captured hyperspectral images of each sample firstly, and then used the same sample for chemical analysis to determine the tannin content. Ultimately, we hope to establish a relationship between spectral data and the tannin content in sorghum.
2.2. Hyperspectral Image Acquisition and Chemical Determination of Tannin Content
2.2.1. Hyperspectral Image Acquisition
The instrument used to collect hyperspectral images is a visible-near infrared hyperspectral scanning platform (Starter Kit, Headwall Photonics, USA). The instrument has two lenses. Lens 1 has a wavelength range of 380-1000nm, a spectral resolution of 0.727nm, a total of 856 bands; and lens 2 has a wavelength ranges of 900-1700nm, a spectral resolution of 4.715nm, a total of 172 bands. Due to potential errors caused by spectral reflectance fluctuations of the lens in extreme wavelength ranges, wavelengths at the edge portions of the lens were removed. For modeling purposes, the first lens was selected to cover a wavelength range of 430 to 900nm, a total of 646 bands. The wavelength range of 430-780 nm falls within the VIS spectrum, while 780-900 nm belongs to the NIR spectrum. Lens 2 was chosen to cover a wavelength range of 950 to 1650nm, a total of 148 bands, all bands belong to the SWIR spectrum.
During the acquisition process, the first step is to calibrate the instrument, followed by placing the sorghum grain samples into the experimental dish with a diameter of 60 mm and a depth of 20 mm, ensuring that the sample surface is smooth and compact, and subsequently collect the spectral data using lens 1 and lens 2, respectively. After three times of collection, repeat the instrument calibration to ensure the accuracy of the data.
2.2.2. Chemical Determination of Tannin Content
The chemical determination method for tannin content in sorghum grains employs spectrophotometry [16,17]. By extracting the tannin components from sorghum grains and comparing them with a standard curve, the tannin content can be calculated. The operational steps are as follows:
(1) Grind each sample and sieve it through a 50-mesh screen.
(2) Accurately measure out a sample weighing 1.0 g with a precision of 1 mg and transfer it into the centrifuge tube.
(3) Transfer 20 mL of dimethylformamide solution into a hermetically sealed centrifuge tube containing the sample using a pipette, and agitate for 60 min. Subsequently, subject the mixture to centrifugation at a speed of 3000 g for 10 min.
(4) Add 6 mL of distilled water and 1 mL of ammonia solution, respectively. Vigorously agitate the mixture using a oscillator for a duration of 30 s.
(5) Add 5 mL of distilled water and 1 mL of ferric ammonium citrate solution, respectively. Vigorously agitate the mixture using a oscillator for a duration of 30 s.
(6) After 10 minutes, pour the solution into a cuvette and measure the absorbance at 525 nm using a spectrophotometer, with water as the blank control.
(7) Using a tannic acid solution to construct a standard curve enables the determination of tannin content. The calculation formula is:
Where, T represents the tannin content (%), c represents the tannic acid content obtained from the calculation of the standard curve (mg/mL); m represents the sample mass (mg); H represents the moisture content of the sample (%).
In this experiment, repeated the process for each sample three times and take the average value as the final result.
2.3. Data Fusion Strategy for Dual Hyperspectral Sensors
2.3.1. Data Layer Fusion
The spectral data collected by Lens 1 (430–900 nm, VNIR) and Lens 2 (950–1650 nm, SWIR) are directly spliced along the wavelength dimension through concatenation, constructing a continuous spectral matrix covering the range from VNIR to SWIR. Based on this integrated dataset, unified model development was performed.
2.3.2. Feature Layer Fusion
First, the spectral data collected by Lens 1 and Lens 2 are independently preprocessed to extract feature subsets representing color appearance characteristics and internal composition information, respectively. Subsequently, the two feature subsets are fused using the Feature Concatenation method and jointly input into the tannin content prediction model for analysis and modeling.
2.4. Hyperspectral Data Extraction and Dataset Partitioning
2.4.1. Spectral Data Extraction
Hyperspectral images encapsulate both spectral and image information derived from sorghum samples [18,19]. In this work, Visual Basic 6.0 was firstly adopted to develop a procedure for creating sampling point file, then loaded the generated sampling point files into Spectral View software. By above processes, the region of interest (ROI) of each image was selected. The ROI region contains over 16,000 pixels for each hyperspectral image, the reflectance of sorghum grains was obtained by calculation the average reflectance for all pixels, the calculation formula is as follows:
Where, R represents the average reflectance, Ri represents the reflectance of the i-th pixel point, and n denotes the number of pixels. The calculated average reflectance will serve as the foundational dataset for subsequent data processing.
2.4.2. Dataset Partitioning
2.5. Feature Variable Extraction
Competitive Adaptive Reweighted Sampling (CARS) algorithm was used to feature variable extraction in our work, this method simulates the principle of "survival of the fittest" by sequentially employing adaptive reweighting, cross-validation screening, and Monte Carlo iterations to optimally select feature wavelengths [22,23]. To enhance the stability of the predictive model, the Monte Carlo sampling was repeated 100 times to retain spectral bands with higher selection frequencies.
2.6. Prediction Models and Evaluation Indexes
2.6.1. Prediction Models
The method used in this study to establish the prediction models were the Partial Least Squares (PLS), Support Vector Machine (SVM) and Convolutional Neural Network (CNN), respectively.
PLS processes high-dimensional linear data by extracting latent variables, offering advantages such as robust prediction performance and strong model interpretability. SVM is designed to identify the optimal decision boundary that maximizes the margin between different classes. It is well-suited for handling high-dimensional data, offering high efficiency and strong generalization capabilities, while flexibly addressing both linear and nonlinear problems. CNN framework employs a hierarchical structure through stacked convolutional, activation, and pooling operations. High-dimensional features are flattened into a 1D vector for processing through fully connected layers, with softmax generating probability outputs. Key advantages comprise parameter sharing, sparse interactions, and automated feature extraction capabilities [24,25,26,27].
We constructed individual prediction models based on VNIR, SWIR, VNIR features, and SWIR features, as well as VNIR-SWIR concatenation and feature fusion, respectively. Through systematic comparison of the performance of each model, we identified the optimal modeling strategy for sorghum tannin prediction.
2.6.2. Evaluation Indexes
The evaluation indicators for model performance are assessed using the coefficient of determination (R2), Root Mean Squared Error (RMSE) and Residual Predictive Deviation (RPD). The calculation formula is as formula 3-5.
Generally, the predictive capability of a model can be evaluated according to the following criteria: an R² below 0.6 suggests poor reliability; an R² between 0.6 and 0.8 indicates good predictive capability; and an R² above 0.8 signifies excellent performance. The lower RMSE value, the higher the predictive accuracy of the model. For RPD, a value less than 1.5 implies insufficient predictive ability; a value between 1.5 and 2.0 suggests preliminary competence for quantitative analysis; and a value greater than 2.0 represents outstanding predictive performance and practical utility [28,29,30].
3. Results
3.1. Analysis of Chemical Measurements
3.1.1. Analysis of Chemical Measurement Results of Tannin Content
Among all the 240 sorghum samples, the minimum tannin content of was 0.05%, the maximum tannin content was 2.56%, the mean tannin content was 1.18%, the standard deviation was 0.7320%, and the coefficient variation was 62.4%, respectively. This indicates that certain variations exist in the tannin content of the sorghum samples in this experiment, which can be attributed to differences in cultivars, growing regions, and growth conditions. Figure 1 displays a combined scatter plot and frequency histogram representing the distribution of tannin content across 240 sorghum samples.
Figure 1.
Scatter plot and frequency distribution histogram of tannin content in 240 sorghum samples.
Figure 1.
Scatter plot and frequency distribution histogram of tannin content in 240 sorghum samples.
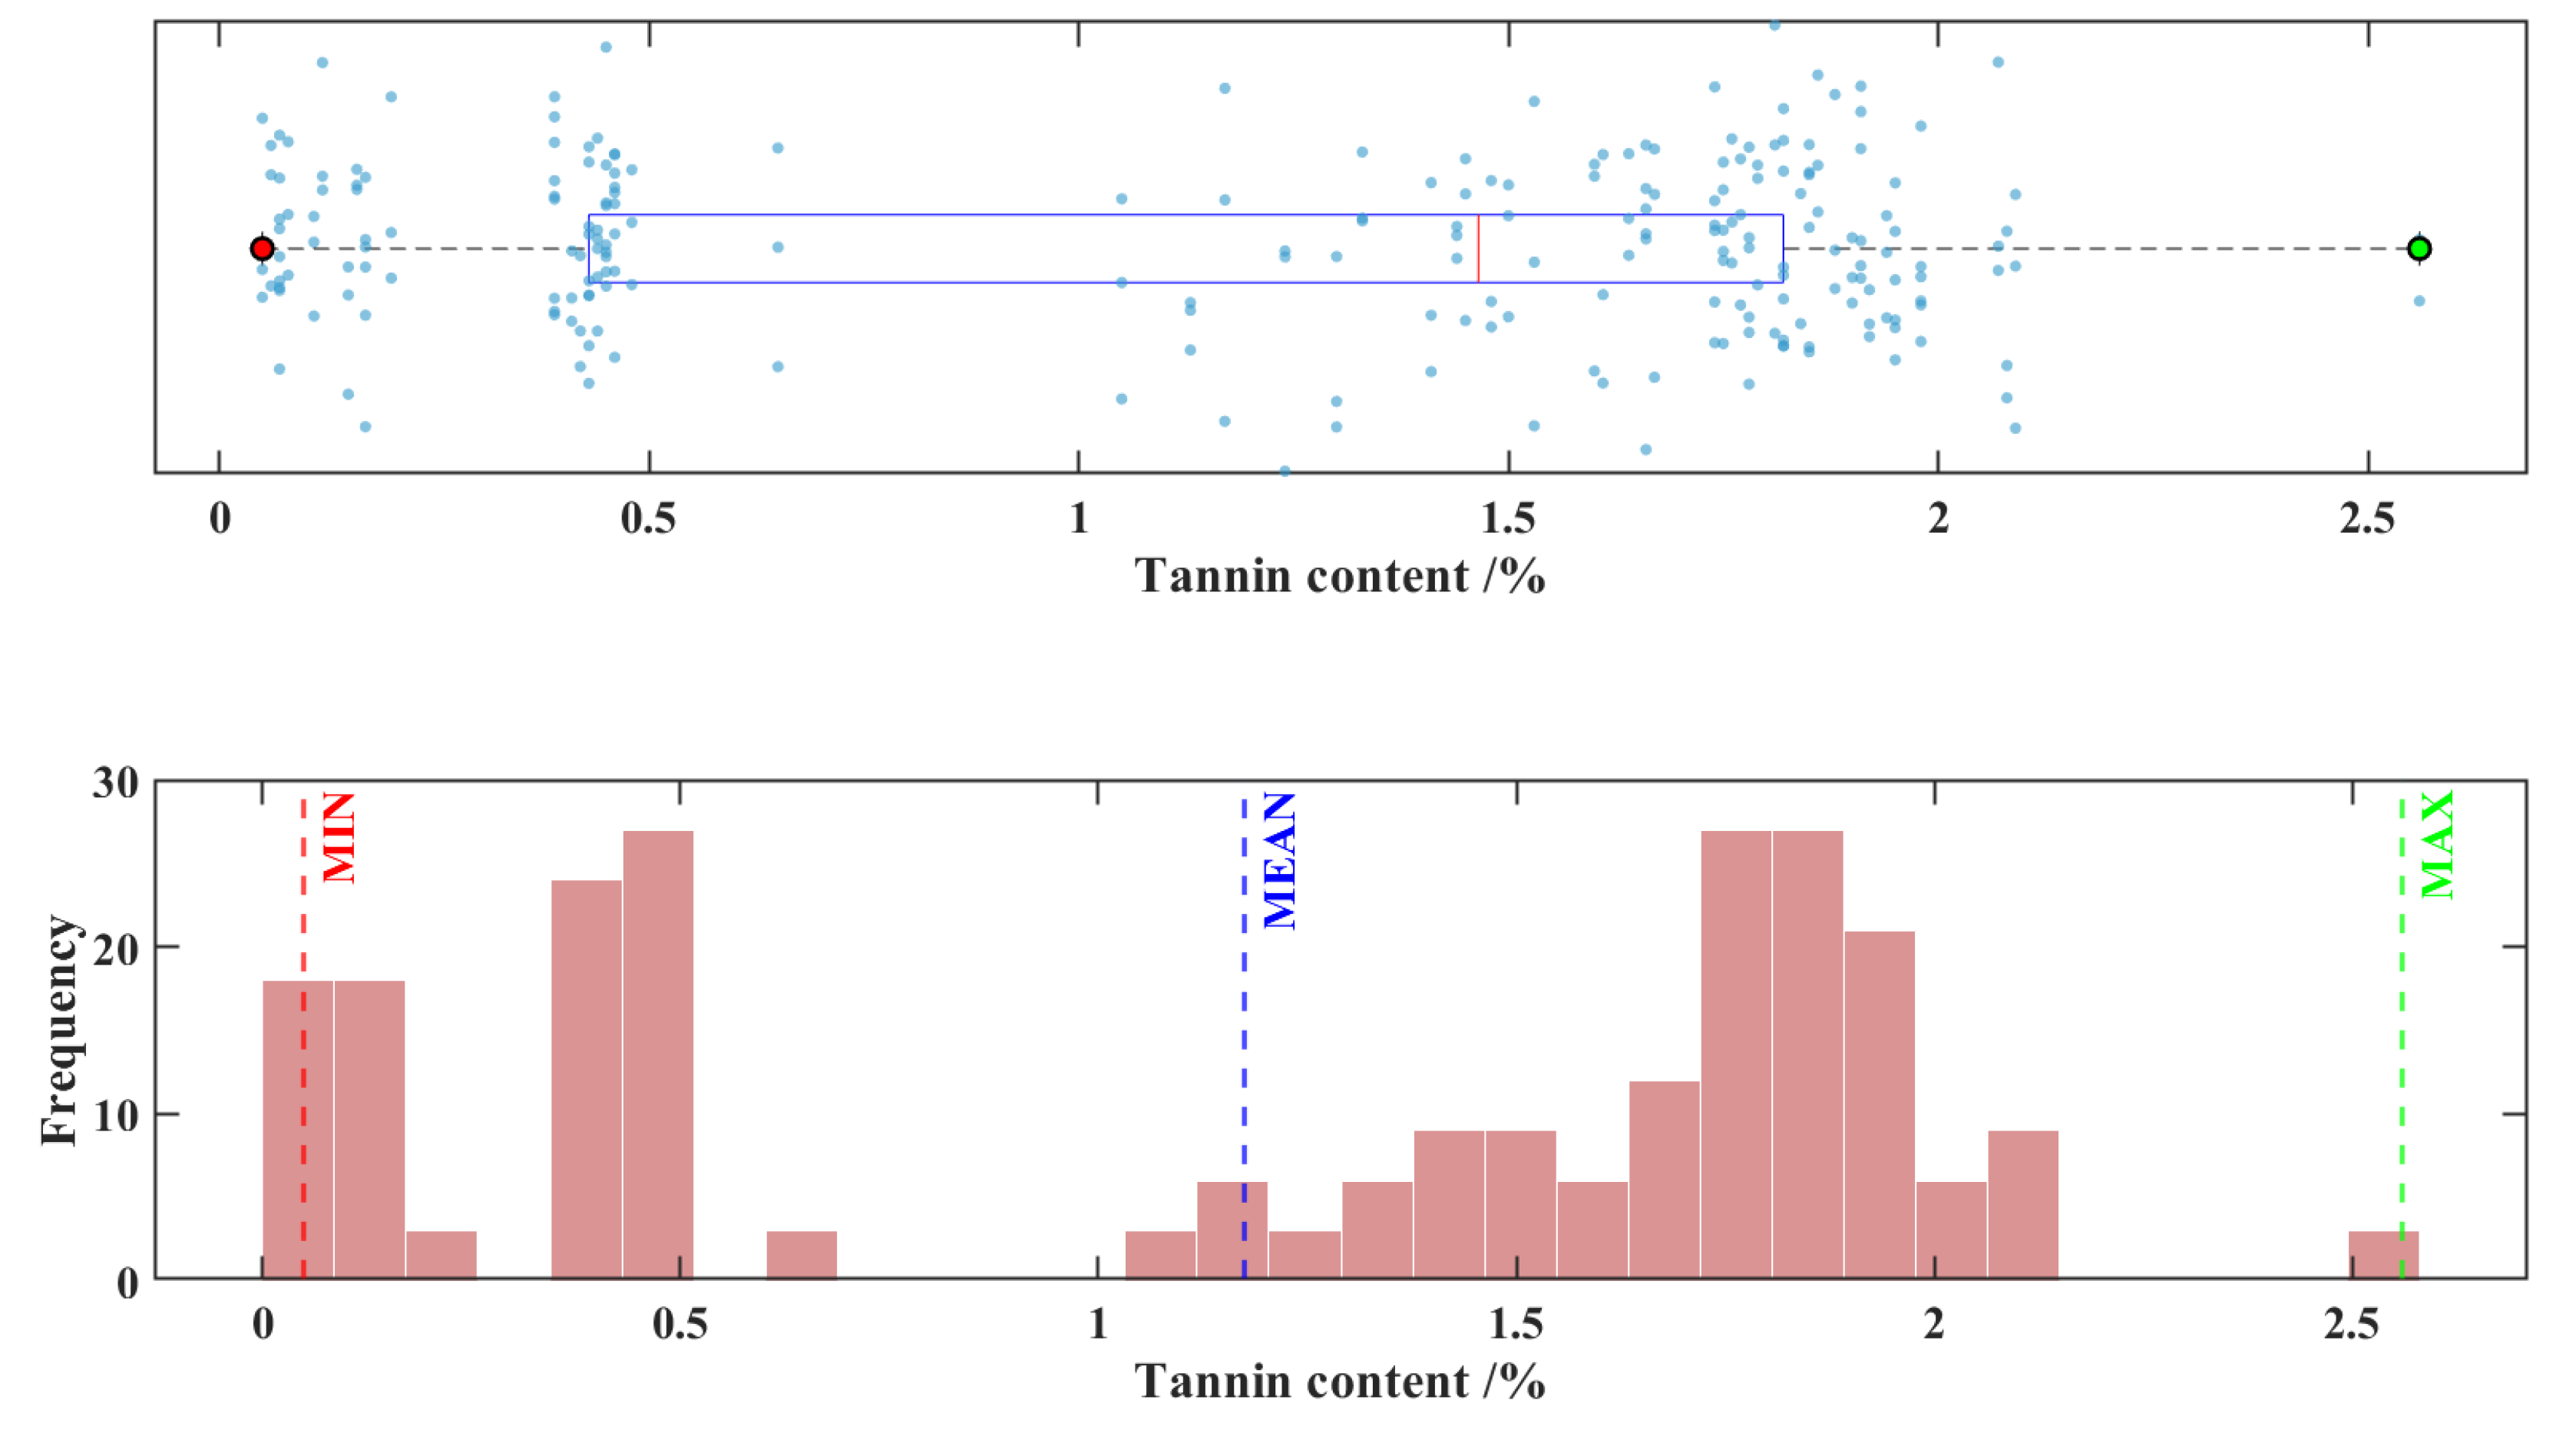
From a modeling perspective, the 2.51% difference between the maximum and minimum values in the sample indicates broad coverage of the data range. The standard deviation accounts for 61.9% of the mean, and the coefficient of variation is 62.4%, suggesting significant data dispersion with relatively uniform distribution across the entire gradient [31,32]. Such data characteristics help ensure that the model training process covers various scenarios, effectively avoiding overfitting or underfitting caused by excessive concentration of data. This lays a solid foundation for building a high-accuracy, highly robust predictive model.
3.1.2. Analysis of Dataset Partitioning Results
In this work, the hold-out validation method was employed to partition the dataset, with a split ratio of 75% for calibration set and 25% for prediction set, among the all 240 samples. Figure 2 illustrates the sample distribution of calibration set and prediction set. The figure demonstrates that the samples in both the calibration and prediction sets are appropriately and balancedly distributed.
Figure 2.
Histogram of sample distribution for the calibration set and prediction set.
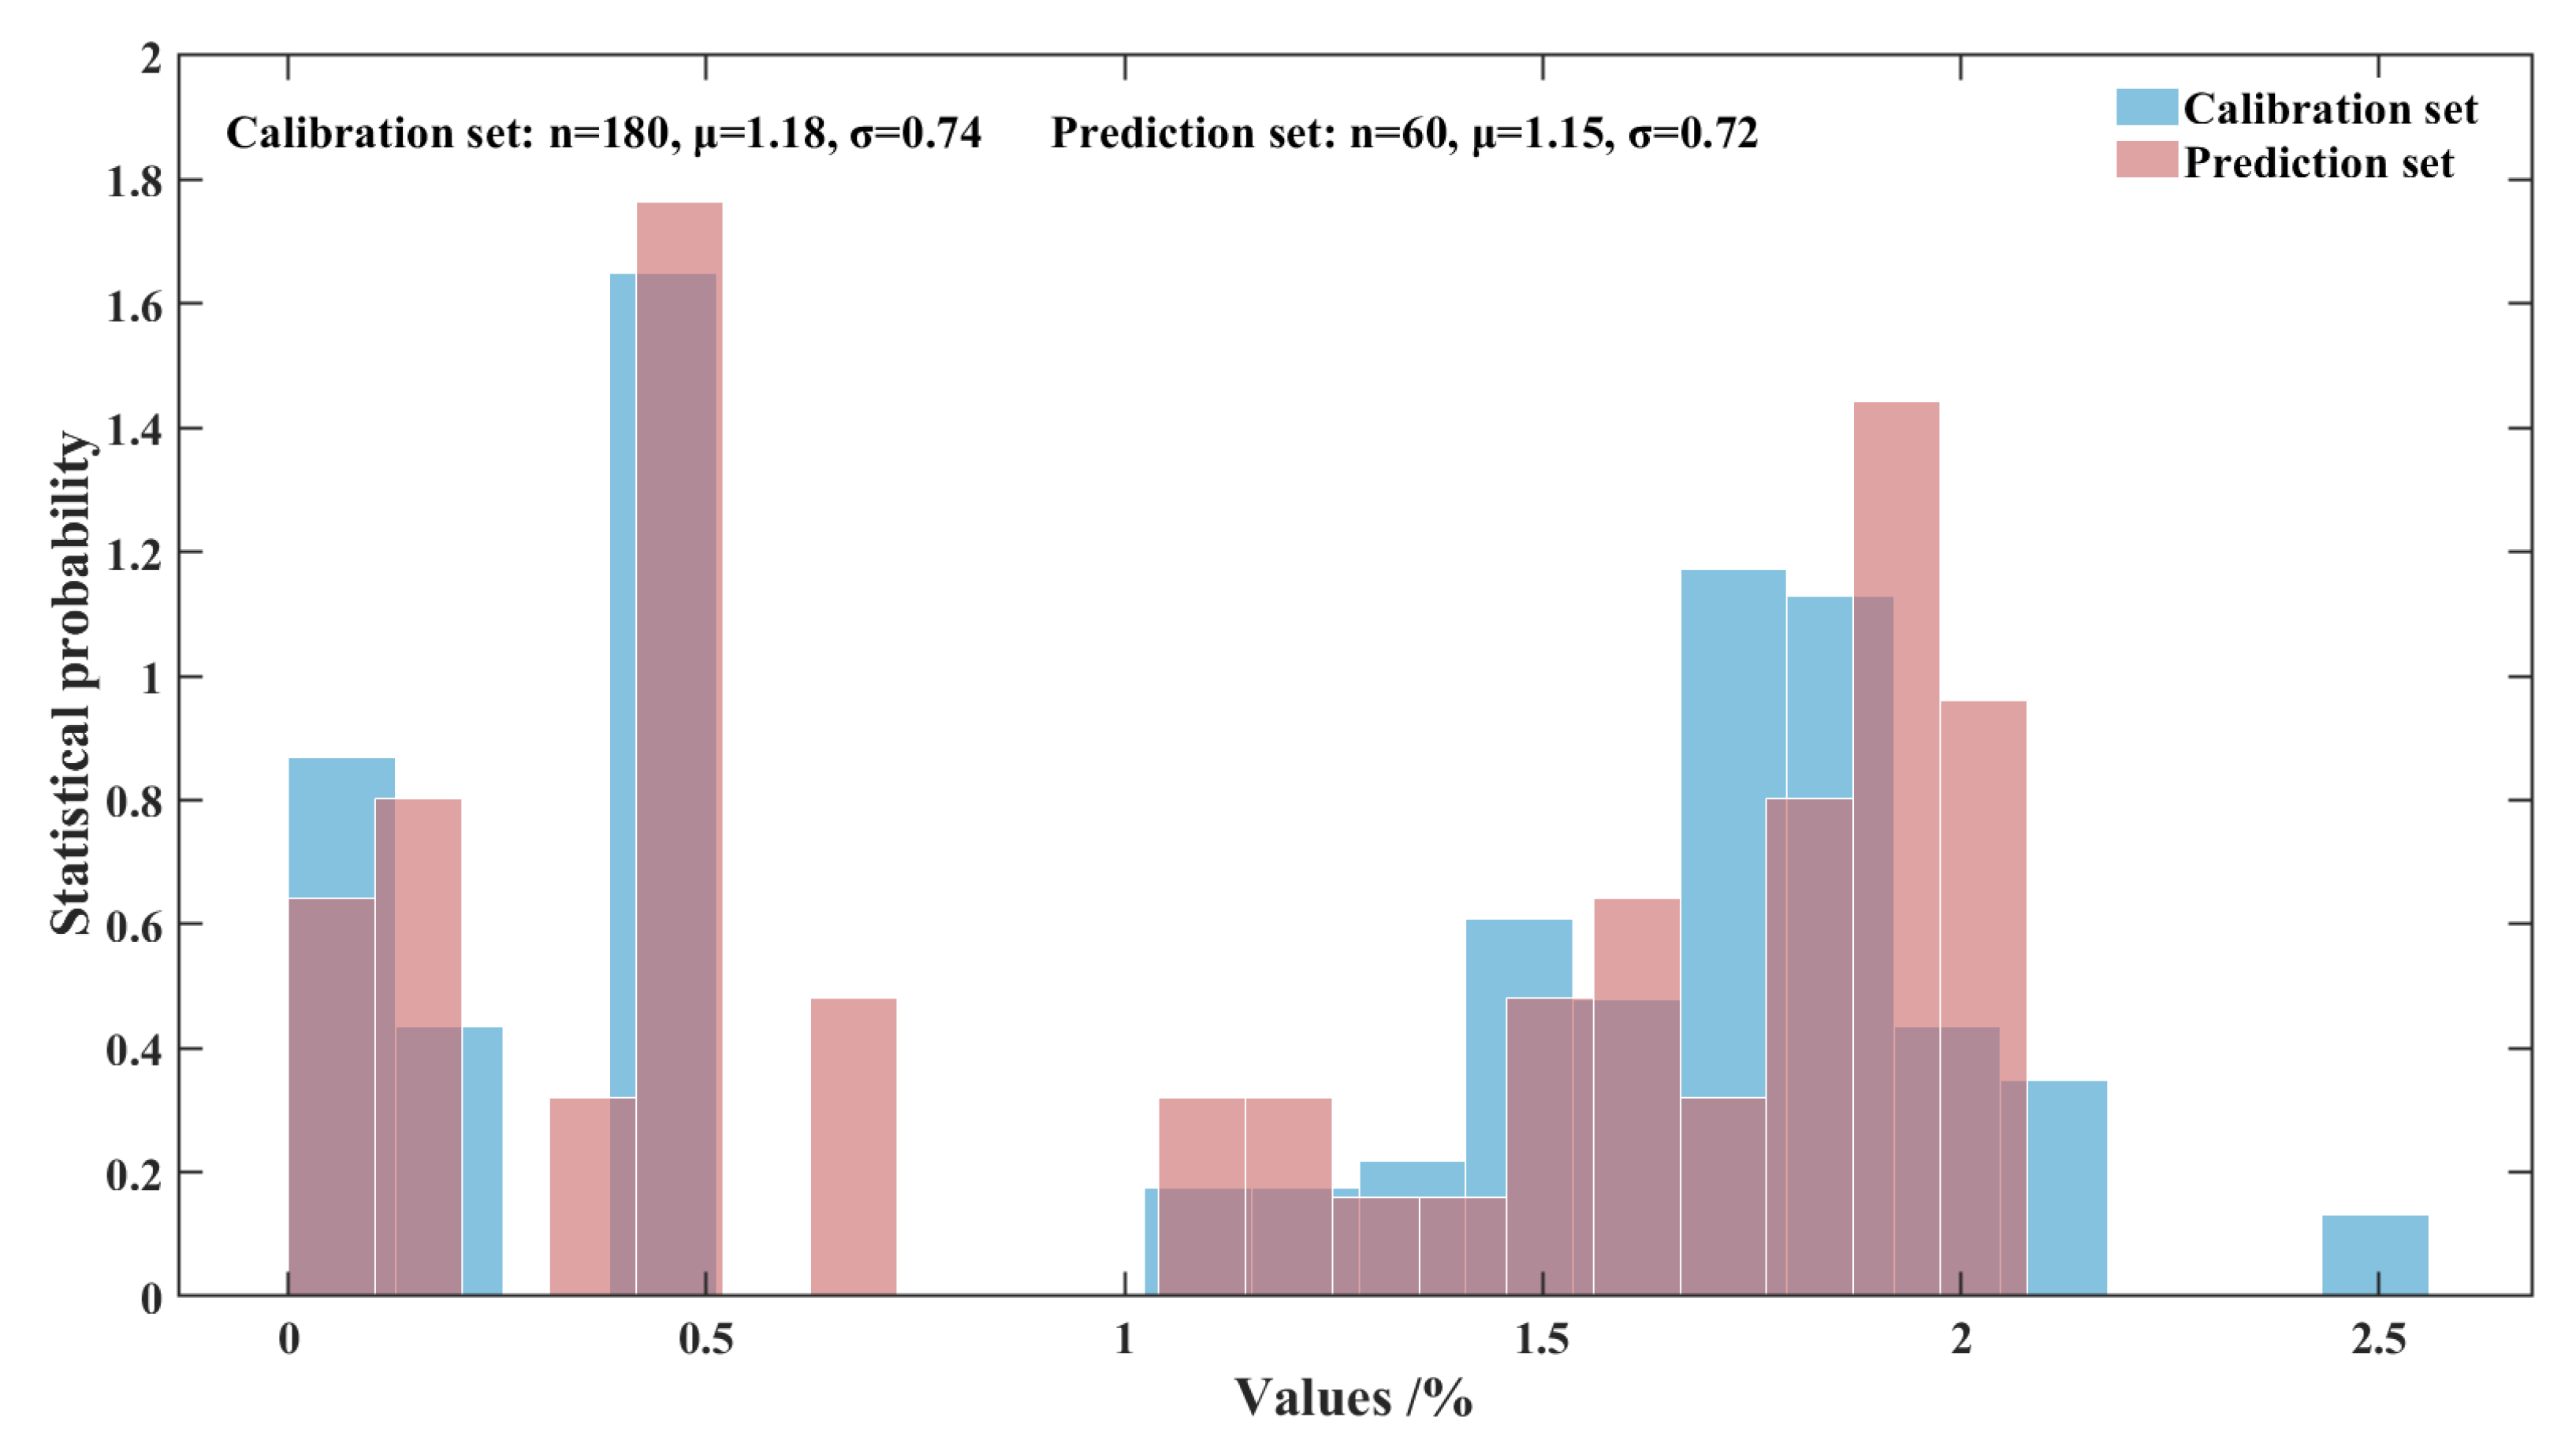
Table results of dataset partitioning are shown in Table 1. The mean values of the calibration set and the prediction set are similarity, the distribution is uniform, and the potential data distribution bias is avoided, which indicates that the division of the data set is reasonable.

Table 1.
The results of tannin content (%) dataset partitioning.
| Tannin content | Calibration set | Prediction set | |||||||||
|---|---|---|---|---|---|---|---|---|---|---|---|
| Mean | Max | Min | SD | CV | Mean | Max | Min | SD | CV | ||
| VINR | 1.1632 | 2.56 | 0.05 | 0.7437 | 0.6394 | 1.2120 | 20.9 | 0.05 | 0.7073 | 0.5836 | |
| SWIR | 1.1482 | 2.56 | 0.05 | 0.7297 | 0.6356 | 1.2570 | 2.56 | 0.05 | 0.7453 | 0.5929 | |
| VINR+SWIR | 1.1849 | 2.56 | 0.05 | 0.7384 | 0.6332 | 1.1468 | 2.07 | 0.05 | 0.7243 | 0.6315 | |
3.2. Results of Raw Spectral Data
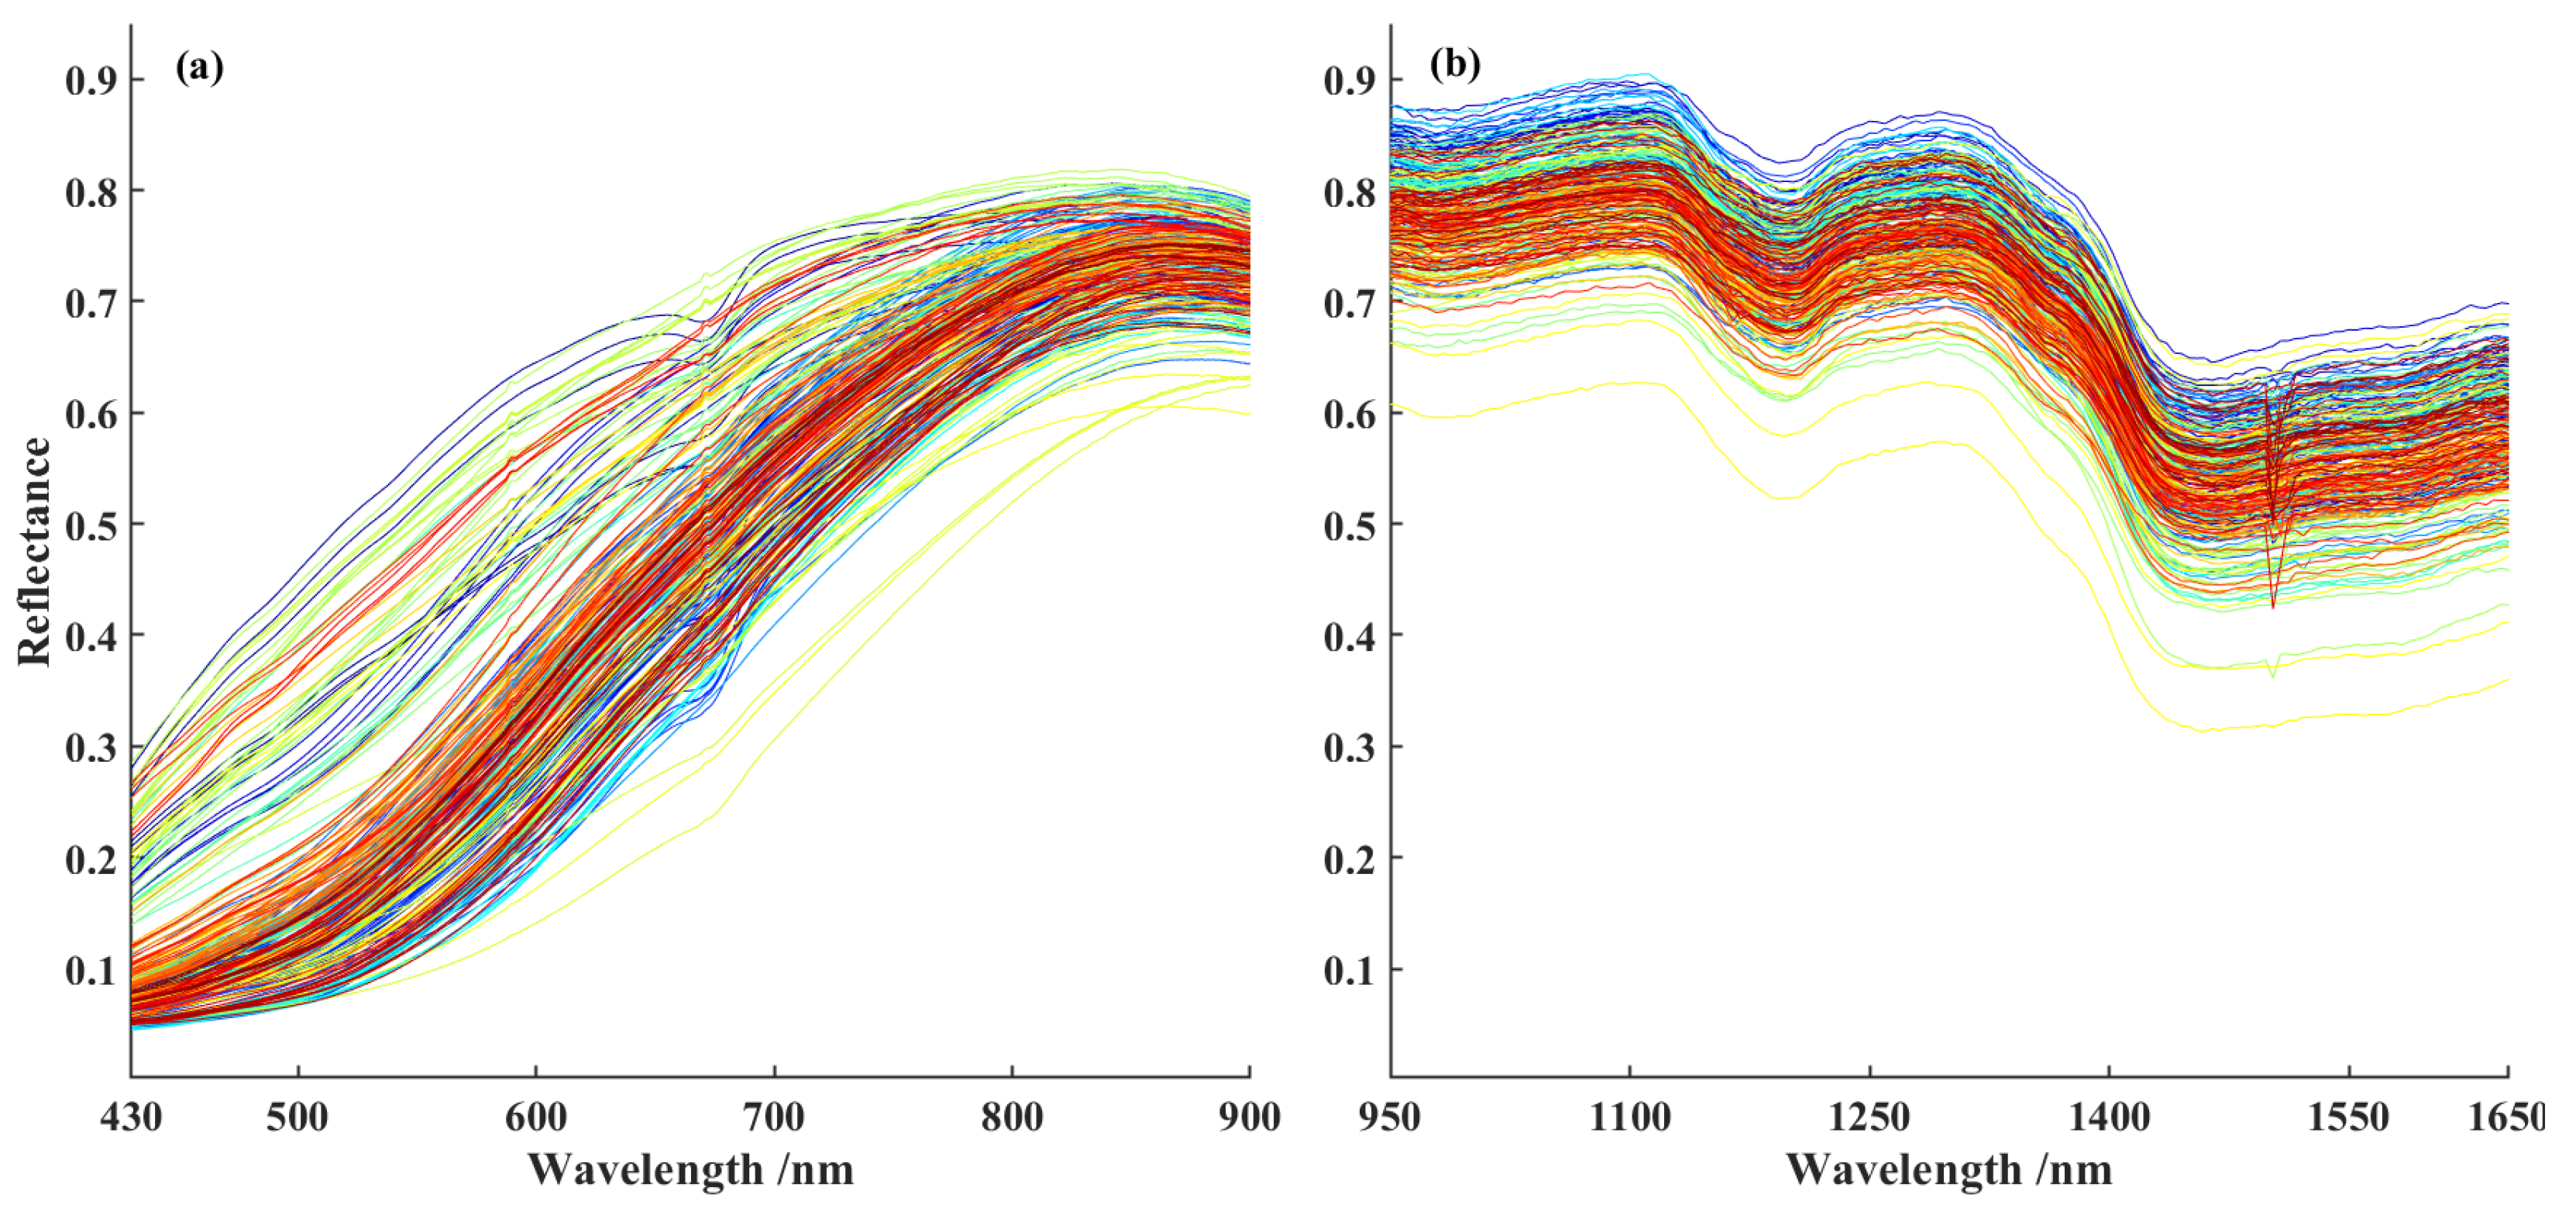
Figure 3 displays the raw average spectral curves of 240 sorghum samples. Among them, subplot (a) shows the spectrum captured by VNIR sensor within the wavelength range of 430–900 nm, while subplot (b) presents the spectrum obtained from SWIR sensor over the wavelength range of 950–1650 nm. As observed in the figure, the overall shapes of VNIR and SWIR spectral curves are generally consistent, both exhibiting typical spectral characteristics of sorghum grains. However, there are differences in reflectance characteristics of the single spectral curves. In the visible spectral range, these variations primarily stem from differences in seed color. For instance, the reflectance trough observed around 670 nm is likely attributable to enhanced light absorption by dark chromophores within the grains. In the near-infrared and short-wave infrared regions, however, changes in spectral features are more closely associated with variations in nutrient content. For example, the reflection peak near 1130 nm may be related to overtone vibrations of C-H bonds, while the absorption valley around 1480 nm is likely due to combination bands involving O-H bonds [33,34]. These differences provide an important foundation for analyzing and detecting sorghum components, offering strong support and guidance for further exploration of its chemical composition and potential applications.
Figure 3.
The average curve of raw spectra of 240 sorghum samples. (a) VNIR; (b) SWIR..
3.3. Feature Variables Analysis
For spectral data collected from VNIR and SWIR lenses, the CARS algorithm was applied in an iterative process to select the most discriminative wavelengths, constitute the feature variable subset, respectively. Figure 4 depicts the aforementioned process.
Figure 4.
(a) shows the change in the number of feature variables. As the number of Monte Carlo sampling runs increases, the number of extracted variables first decreases exponentially and then gradually stabilizes. Figure 4 (b) displays the variation of the RMSECV values. The RMSECV value first decreases to a minimum and then gradually increases. Its initial decrease indicates that irrelevant variables interfering with the target variable are effectively eliminated; whereas the subsequent increase suggests that extraneous variables are being introduced into the model, resulting in a deterioration of predictive performance. Therefore, the variable subset corresponding to the minimum RMSECV represents the optimal feature combination. Figure 4 (c) illustrates the trajectory of variable regression coefficients. The asterisk marks the point where the RMSECV reaches its minimum value and indicates the corresponding number of variables, representing the optimal variable subset. In the VNIR spectral range, the number of feature variables decreased from 646 to 33, and in the SWIR spectral range, they were reduced from 148 to 19, respectively. It effectively reduced the number of feature variables while retaining valuable information. The corresponding wavelength data are provided in Table 2.
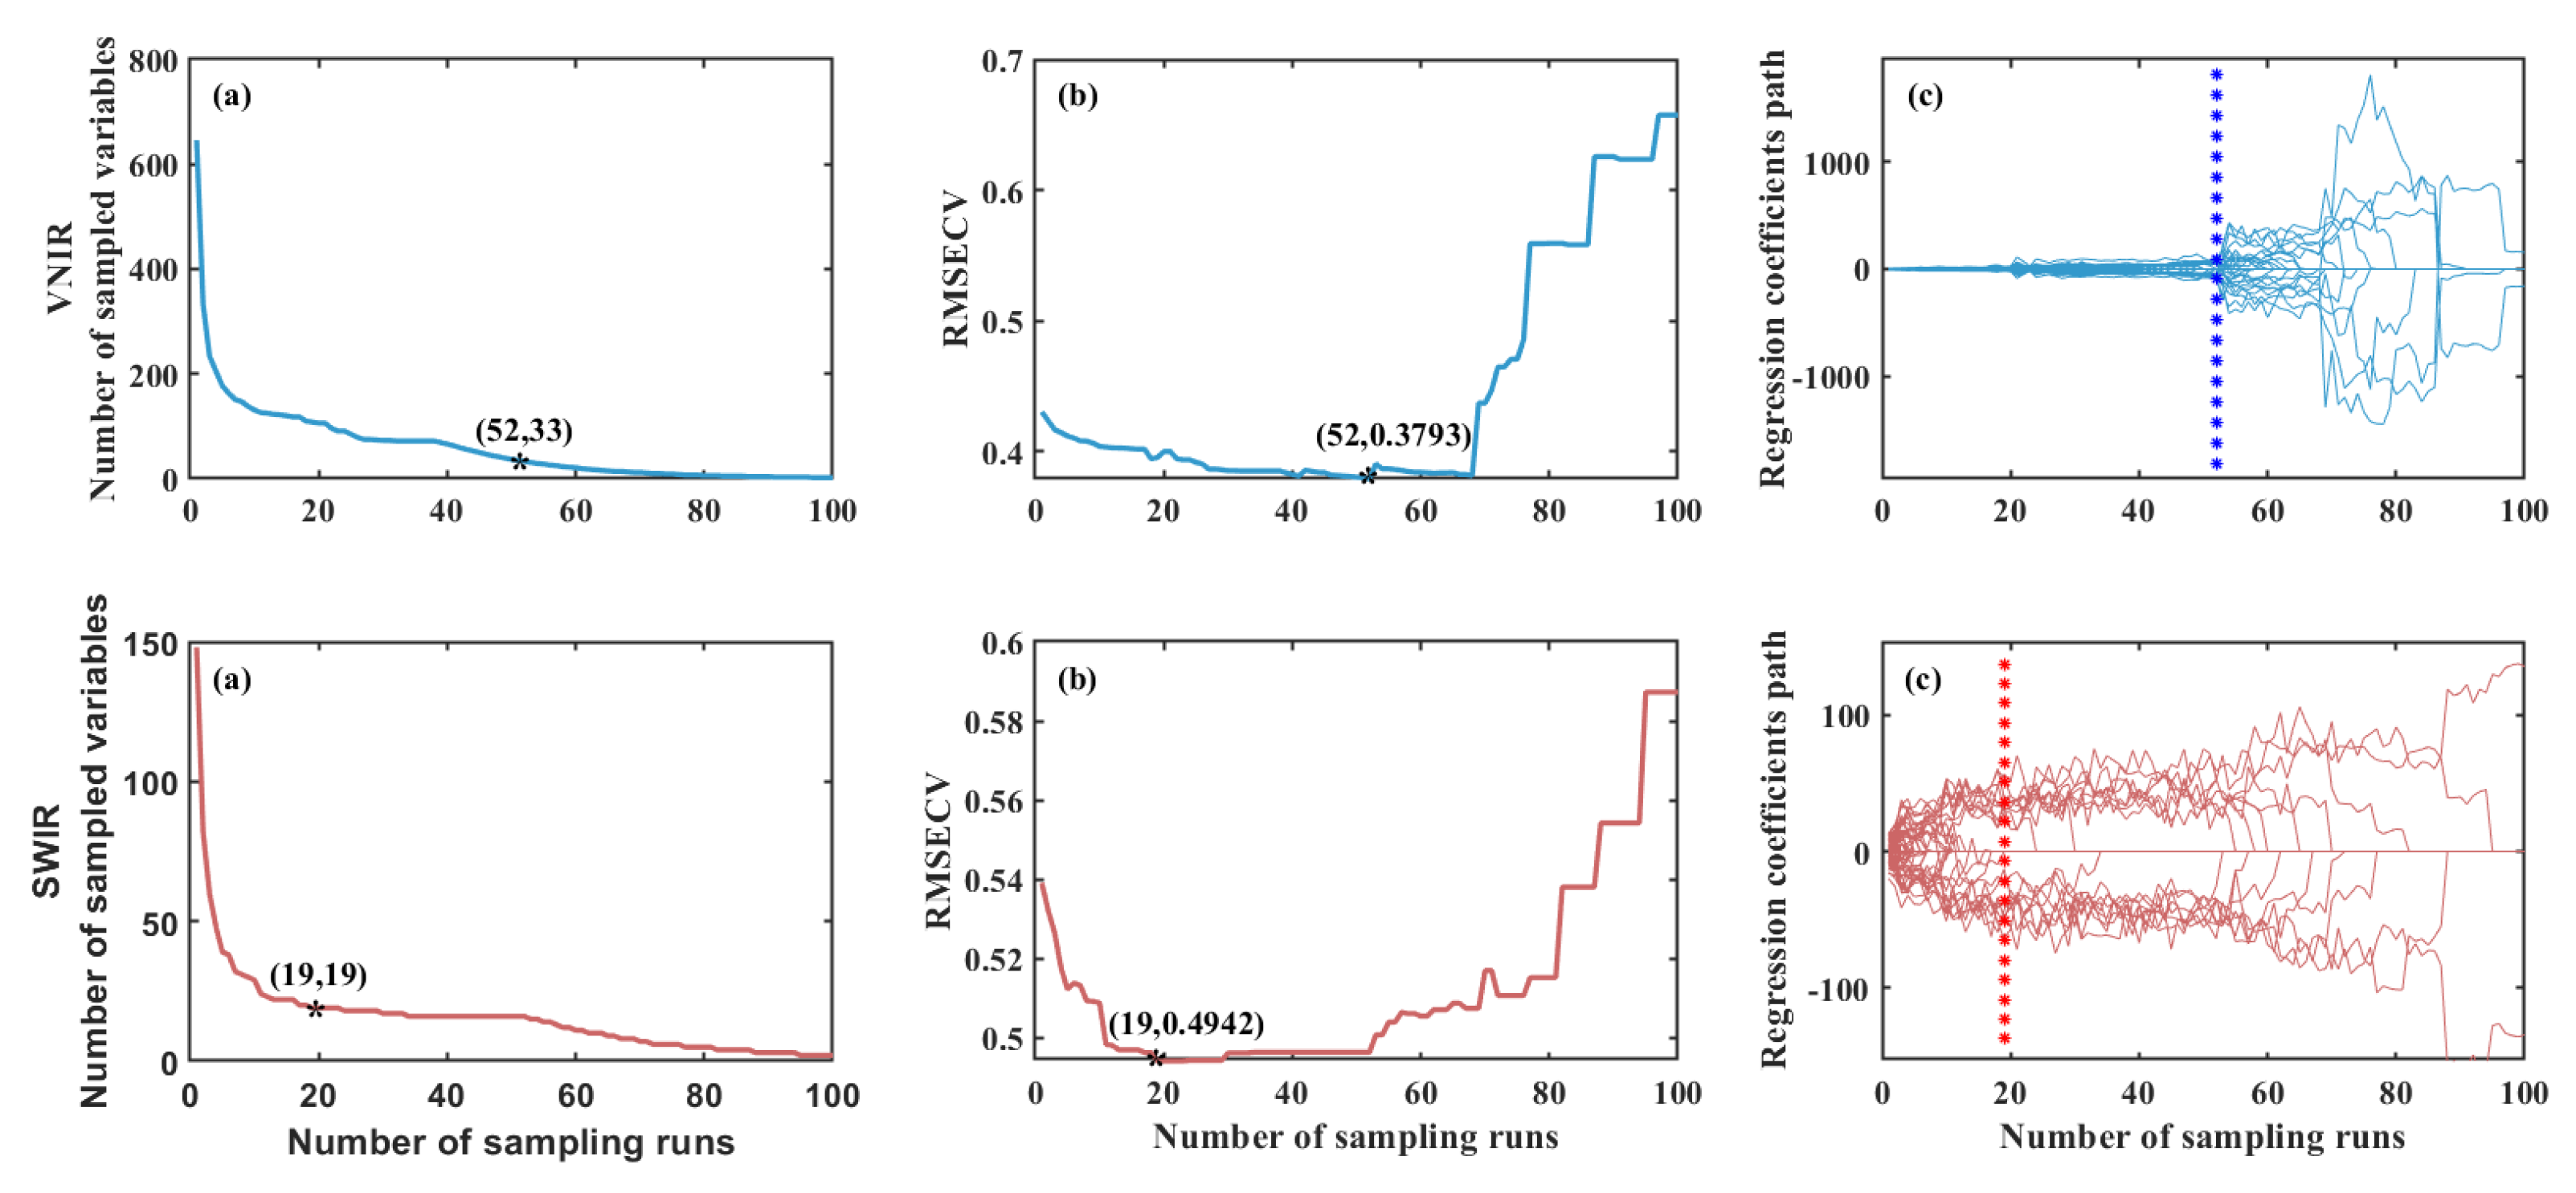
Table 2.
Wavelength of feature variables proposed by CARS algorithm.
| Sensor | Wavelength of feature variable/nm | |||||||||
|---|---|---|---|---|---|---|---|---|---|---|
| VNIR | 522.115 | 533.744 | 534.471 | 536.651 | 538.831 | 564.269 | 565.723 | 567.903 | 570.811 | 571.537 |
| 573.718 | 594.795 | 595.522 | 596.249 | 597.702 | 599.156 | 602.063 | 629.681 | 630.408 | 632.589 | |
| 633.315 | 634.769 | 648.578 | 650.032 | 652.212 | 681.284 | 703.088 | 828.824 | 843.36 | 854.989 | |
| 858.623 | 885.515 | 893.509 | ||||||||
| SWIR | 1048.94 | 1129.09 | 1133.8 | 1180.95 | 1289.39 | 1327.11 | 1350.68 | 1383.68 | 1402.54 | 1416.69 |
| 1430.83 | 1473.26 | 1482.69 | 1520.41 | 1553.41 | 1558.13 | 1572.27 | 1595.84 | 1633.56 | ||
The wavelengths of the feature variables selected in this study are consistent with those reported in references [35] and [36]. In VIS region, the feature wavelengths are primarily concentrated within the ranges of 520-540 nm, 560-600 nm, and 630-700 nm. These spectral bands reflect both the intrinsic chromophores of tannin molecules and the color effects resulting from their interactions with metal ions, which lead to visible differences in sorghum grain coloration. In NIR region, the feature wavelengths are mainly concentrated near 830-860 nm and 885-900 nm, likely associated with the stretching vibrations of C-H and C-O bonds within the grains. In SWIR region, wavelengths such as 1048, 1129, 1133, 1289, 1327, 1350, 1383, 1572, 1595, and 1633 nm may be associated with C-H bond vibrations; bands at 1180, 1402, 1416, and 1520 nm are likely related to O-H bonds. These indicators characterize the overall biochemical environment of tannin and are indirectly correlated with tannin content. The wavelengths such as 1430, 1473, 1482, 1553, and 1558nm, may correspond to N-H bond vibrations, are a direct indicator of tannin-protein complexes and strongly associated with tannin content. These feature variables effectively capture biochemical signals that co-vary with tannin content, demonstrating the advantage of hyperspectral technology in revealing core compositional indicators through the correlation of spectral features.
The PLS prediction models using whole variables and CARS variables were established, as shown in Table 3. Based on various evaluation metrics, the performance of the CARS-PLS model surpassed that of the whole-PLS model. The RC² values of CARS model for VNIR, SWIR and VNIR-SWIR increased by 0.0311, 0.0465 and 0.0422, the RMSEC decreased by 0.0312, 0.0249 and 0.0339, the RPDC increased by 0.1762, 0.0845 and 0.1994, respectively. These results indicate that the CARS algorithm effective dimensionality reduction with preserved signal integrity [37,38]. This process not only reduces model complexity but also enhances prediction accuracy.
Table 3.
Prediction results of PLS model based on whole spectrum and feature variables.
| Sensor | Method | Number of variables | Calibration set | |||||
|---|---|---|---|---|---|---|---|---|
| RC2 | RMSEC | RPDC | RCV2 | RMSECV | RPDCV | |||
| VINR | whole-PLS | 646 | 0.7401 | 0.3781 | 1.9616 | 0.6802 | 0.4194 | 1.7683 |
| CARS-PLS | 33 | 0.7812 | 0.3469 | 2.1378 | 0.7384 | 0.3793 | 1.9552 | |
| SWIR | whole-PLS | 148 | 0.5532 | 0.4864 | 1.4961 | 0.4796 | 0.5295 | 1.3862 |
| CARS-PLS | 19 | 0.5997 | 0.4615 | 1.5806 | 0.5388 | 0.4942 | 1.4725 | |
| VNIR-SWIR | Whole-PLS | 794 | 0.7462 | 0.3710 | 1.9849 | 0.6935 | 0.4077 | 1.8063 |
| CARS-PLS | 52 | 0.7904 | 0.3371 | 2.1843 | 0.7609 | 0.3600 | 2.0450 | |
3.4. Comparison of Prediction Models and Optimal Prediction Model
3.4.1. Comparison of Prediction Models
In this study, PLS, SVM, and CNN prediction models were first established using raw spectral data subset from VNIR-Raw, SWIR-Raw, and directly concatenated of VNIR and SWIR(Whole-Raw), respectively. Subsequently, three predictive models were established using the VNIR-Feature, SWIR-Feature, and Fused-Feature subsets, respectively. The prediction results of all models are presented in Figure 5-7.
Figure 5.
Radar chart for the R² of the models. (a) RC2; (b) RP2.
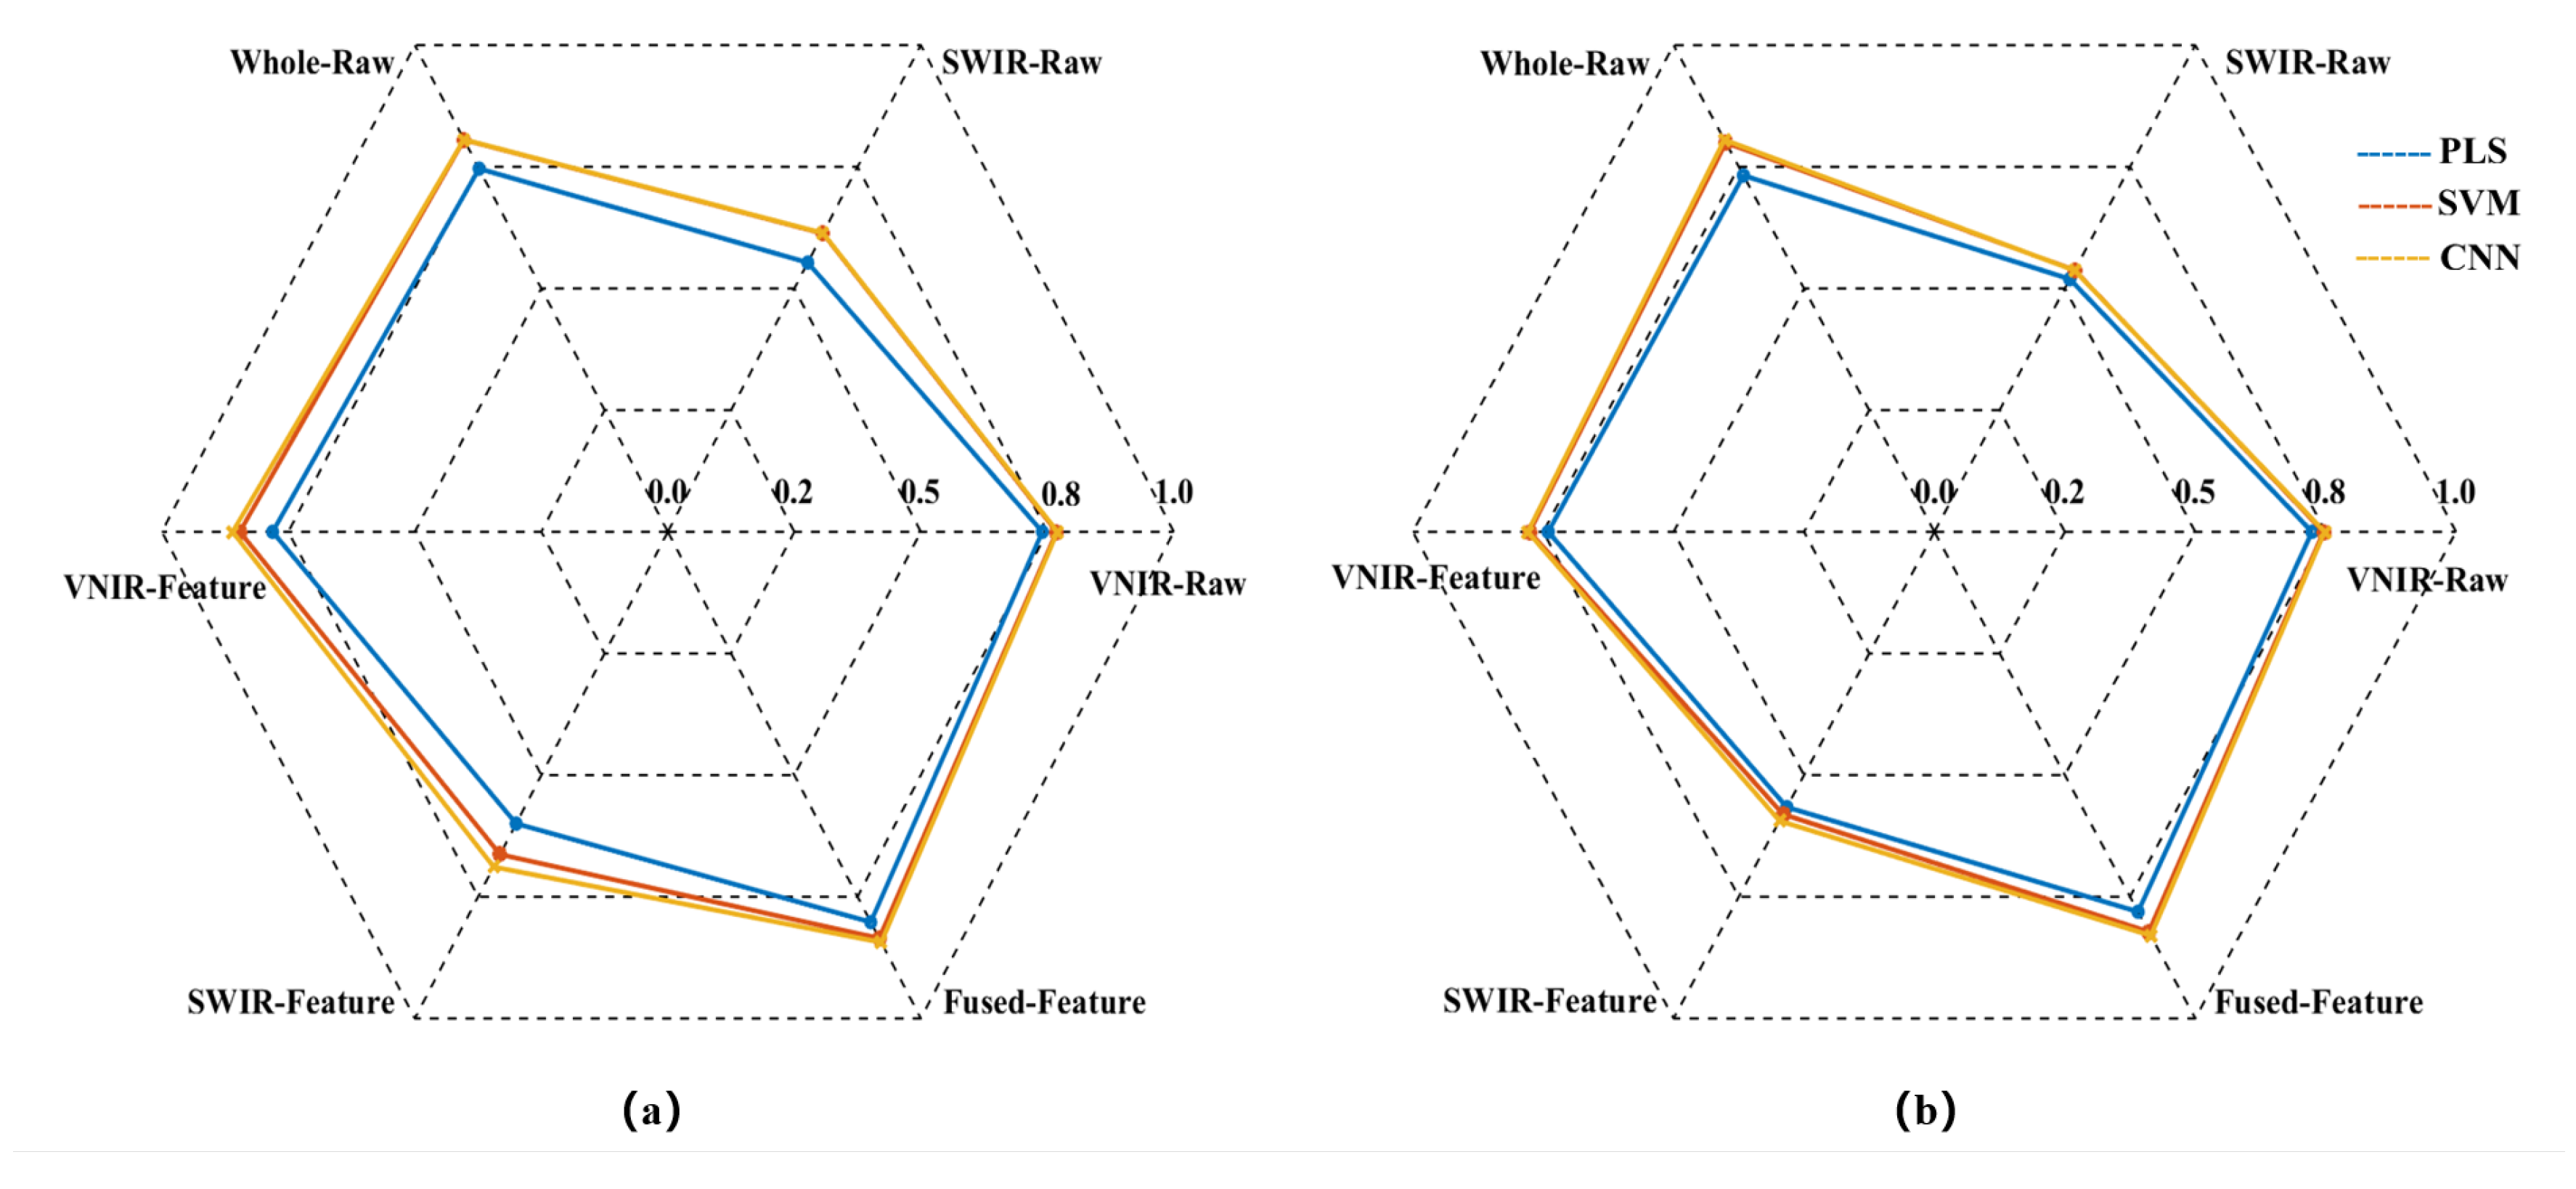
Figure 6.
Radar chart for the RMSE of the models. (a) RMSEC; (b) RMSEP.
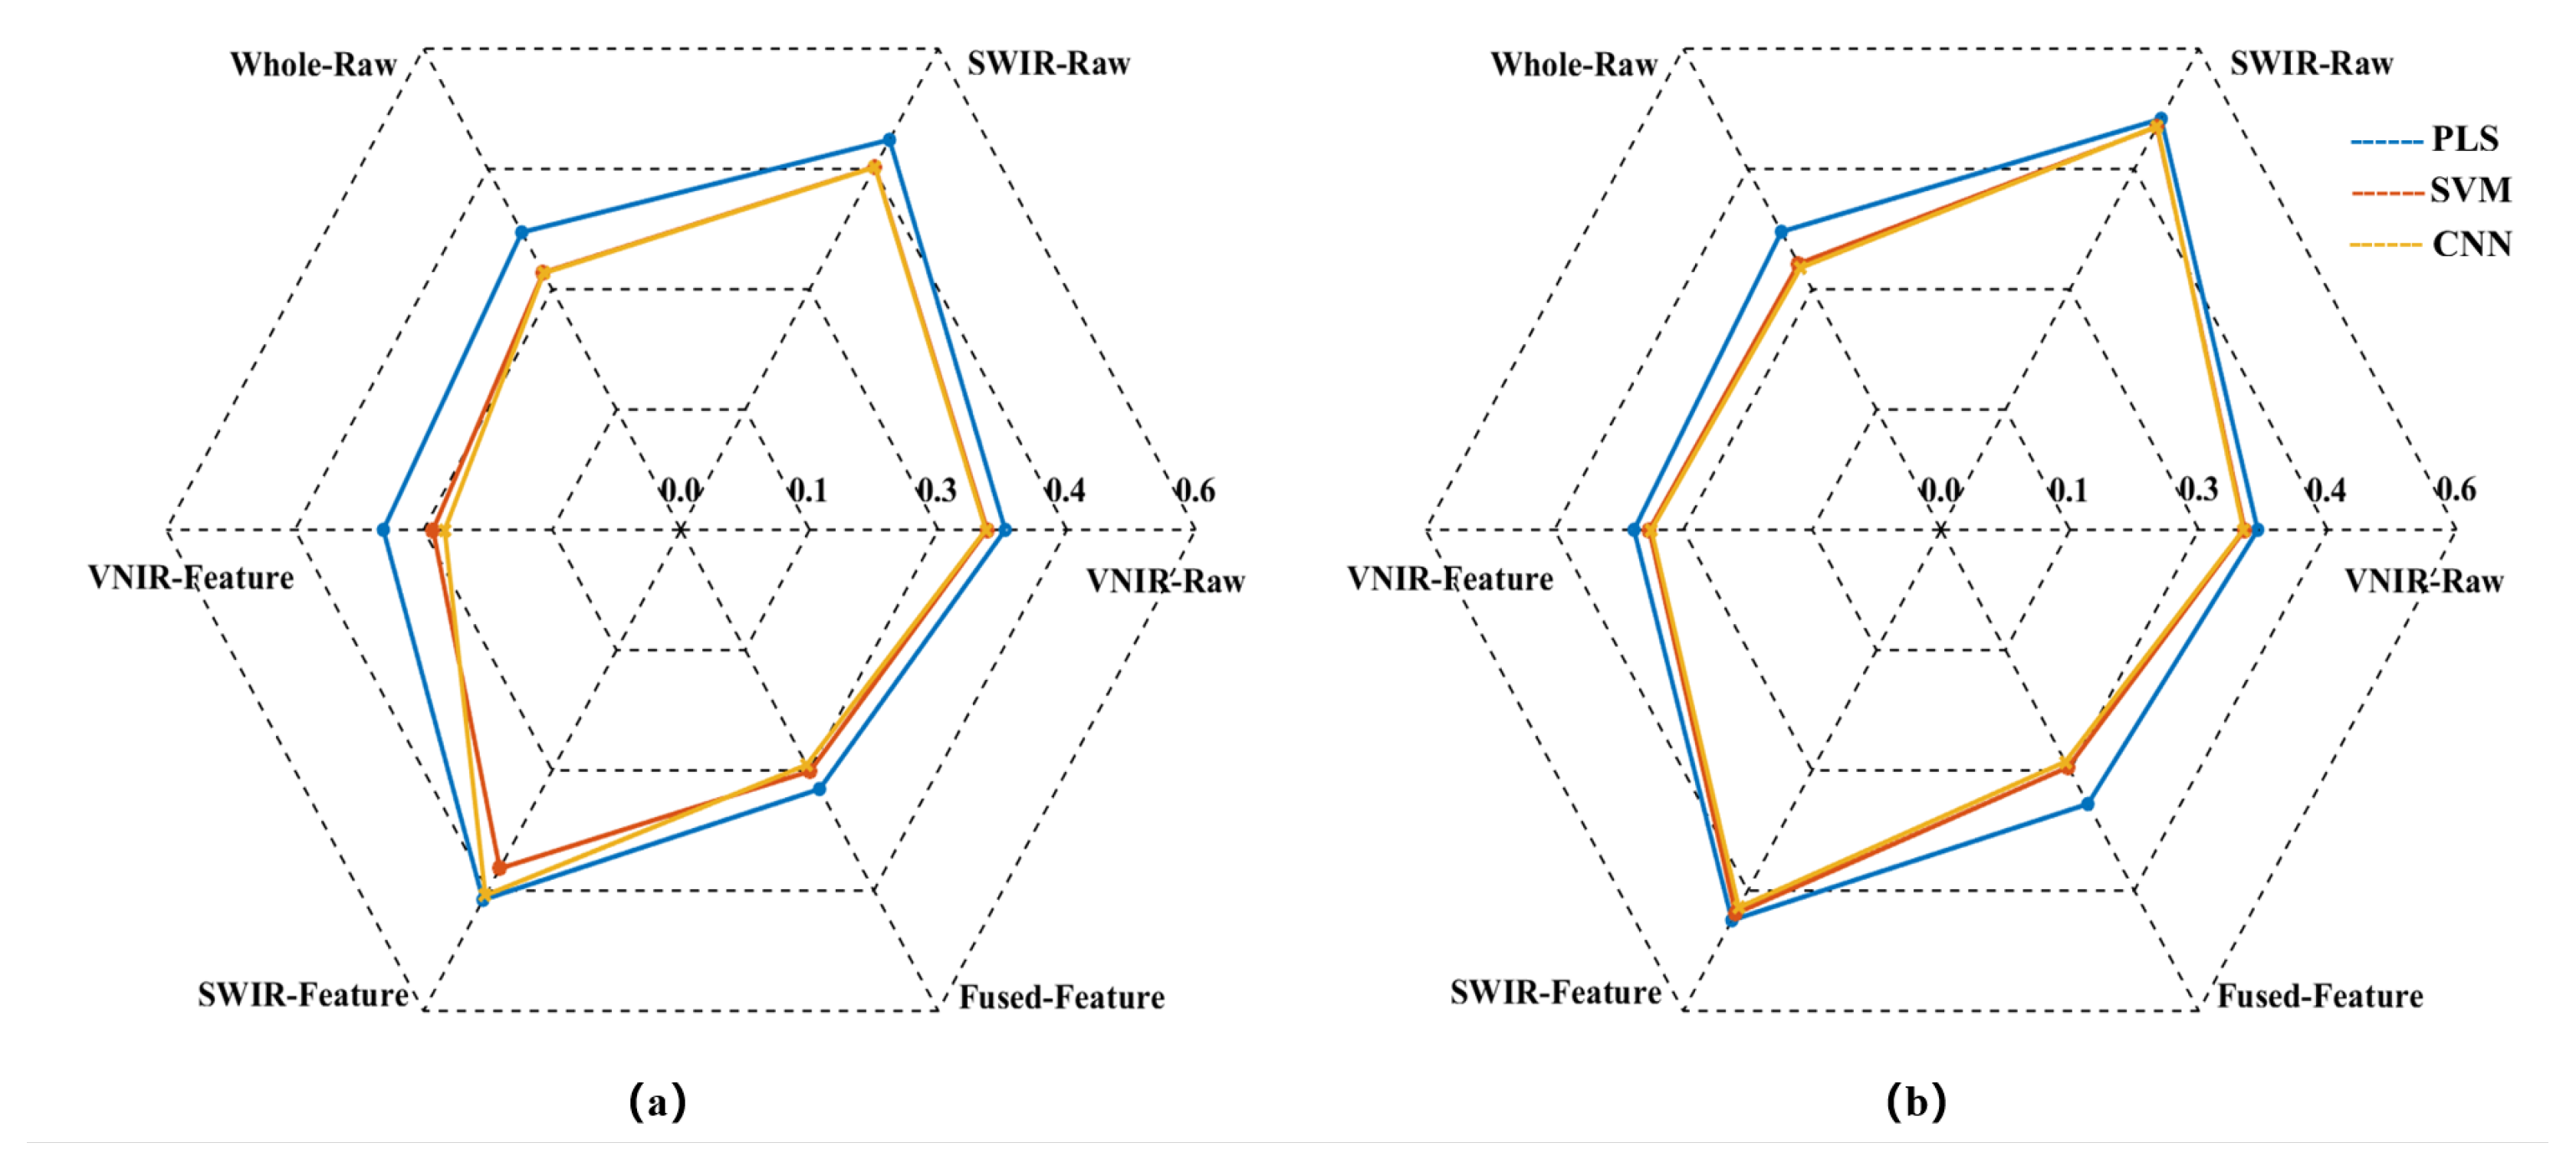
Figure 7.
Radar chart for the RPD of the models. (a) RPDC; (b) RPDP.
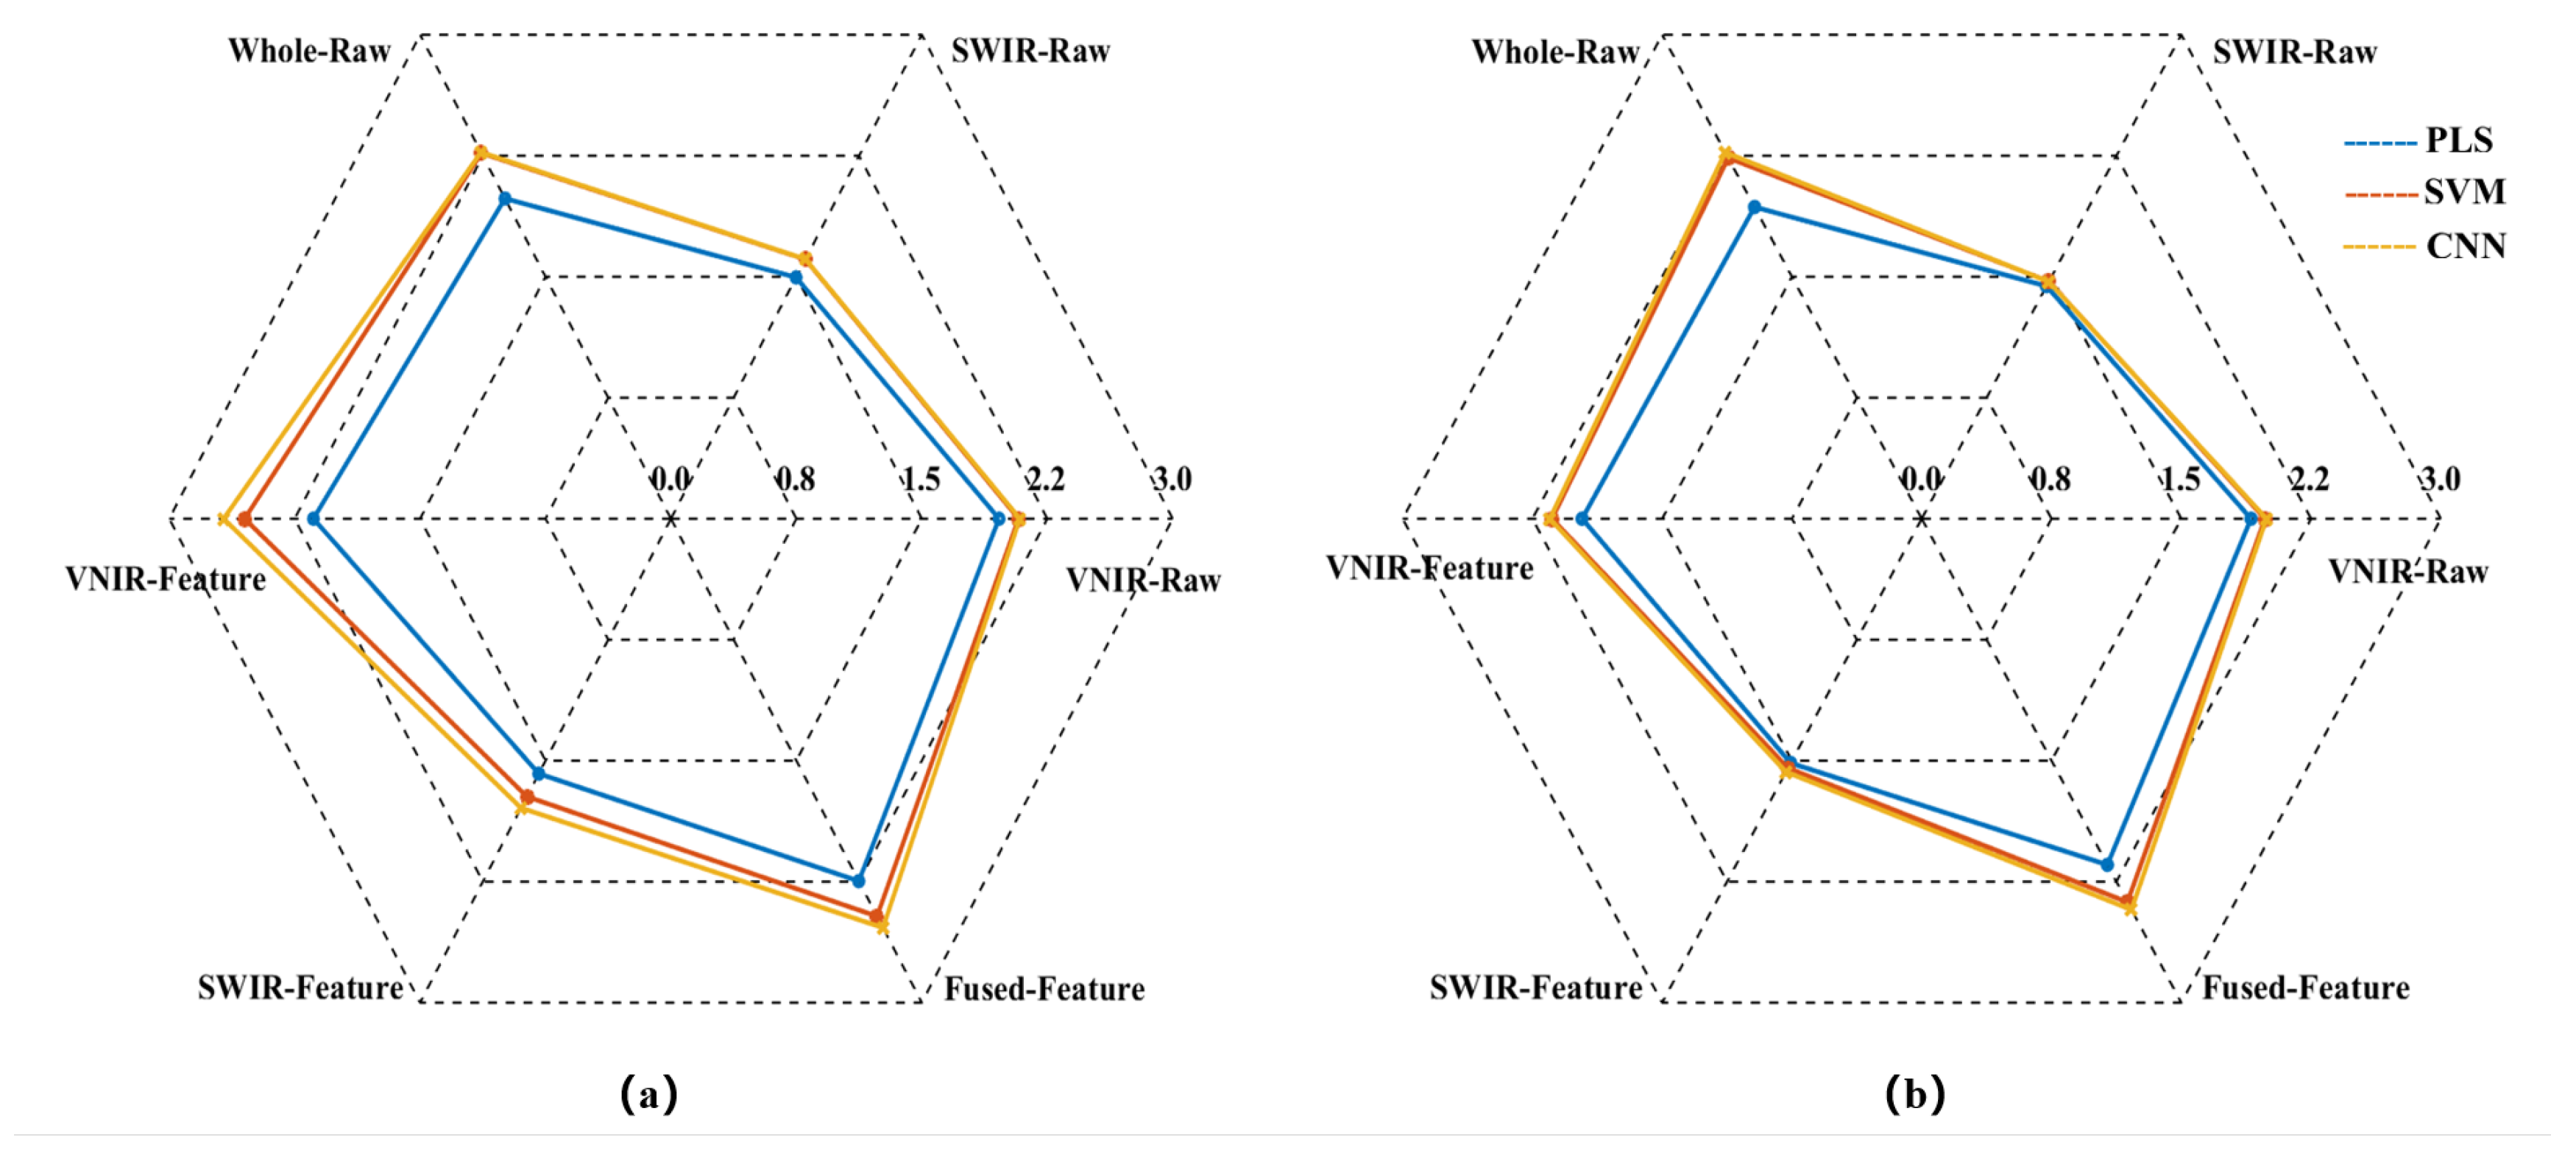
The model prediction results demonstrate that the raw spectrum model constructed by directly concatenating data from VNIR and SWIR achieved higher predictive accuracy compared to models based on either sensor alone. Taking the SVM prediction model as an example, the RP2 of the concatenated Whole-Raw model reached 0.7997, representing an improvement of 7.20% and 48.75% over the VNIR and SWIR models, respectively. The RMSEP was 0.3318, which decreased by 6.14% and 33.92% compared to the VNIR and SWIR models, respectively. Additionally, the RPDP reached 2.2369, showing an increase of 12.75% and 52.08% over the VNIR and SWIR models, respectively. Consistent trends were also observed in the PLS and CNN models, confirming that the data concatenation strategy using dual hyperspectral sensors enhances model prediction performance.
To further enhance model performance, this study employed the CARS method to extract characteristic bands from VNIR and SWIR data, constructing VNIR-Feature and SWIR-Feature subsets, and subsequently built a fused-feature subset through feature fusion technology. Predictive models were then developed using PLS, SVM, and CNN algorithms. The results demonstrated that the models built with each feature subset outperformed the full-spectrum model in predictive accuracy. Taking the SVM model as an example, the RP2 for the VNIR-Feature, SWIR-Feature, and Fused-Feature models were 0.7763, 0.5805, and 0.8219, respectively, representing improvements of 4.06%, 7.98%, and 2.78% over the raw spectral models. The RMSEP values were 0.3397, 0.4787, and 0.296, corresponding to reductions of 3.90%, 4.76%, and 10.79%, respectively. The RPDP values were 2.1366, 1.546, and 2.3769, showing increases of 7.69%, 5.11%, and 11.25%, respectively. Notably, the model built with the Fused-Feature subset comprehensively outperformed those based on single-sensor feature subsets. Again using the SVM model as an example, Fused-Feature model showed that RP2 improvements of 5.87% and 41.58% over the VNIR-Feature and SWIR-Feature models, respectively, with RMSEP reductions of 12.86% and 38.17%, and RPDP increases of 11.25% and 53.75%. The PLS and CNN models exhibited the same trend, indicating that the spectral feature fusion strategy further enhances the predictive capability of the models.
3.4.2. Optimal Prediction Model
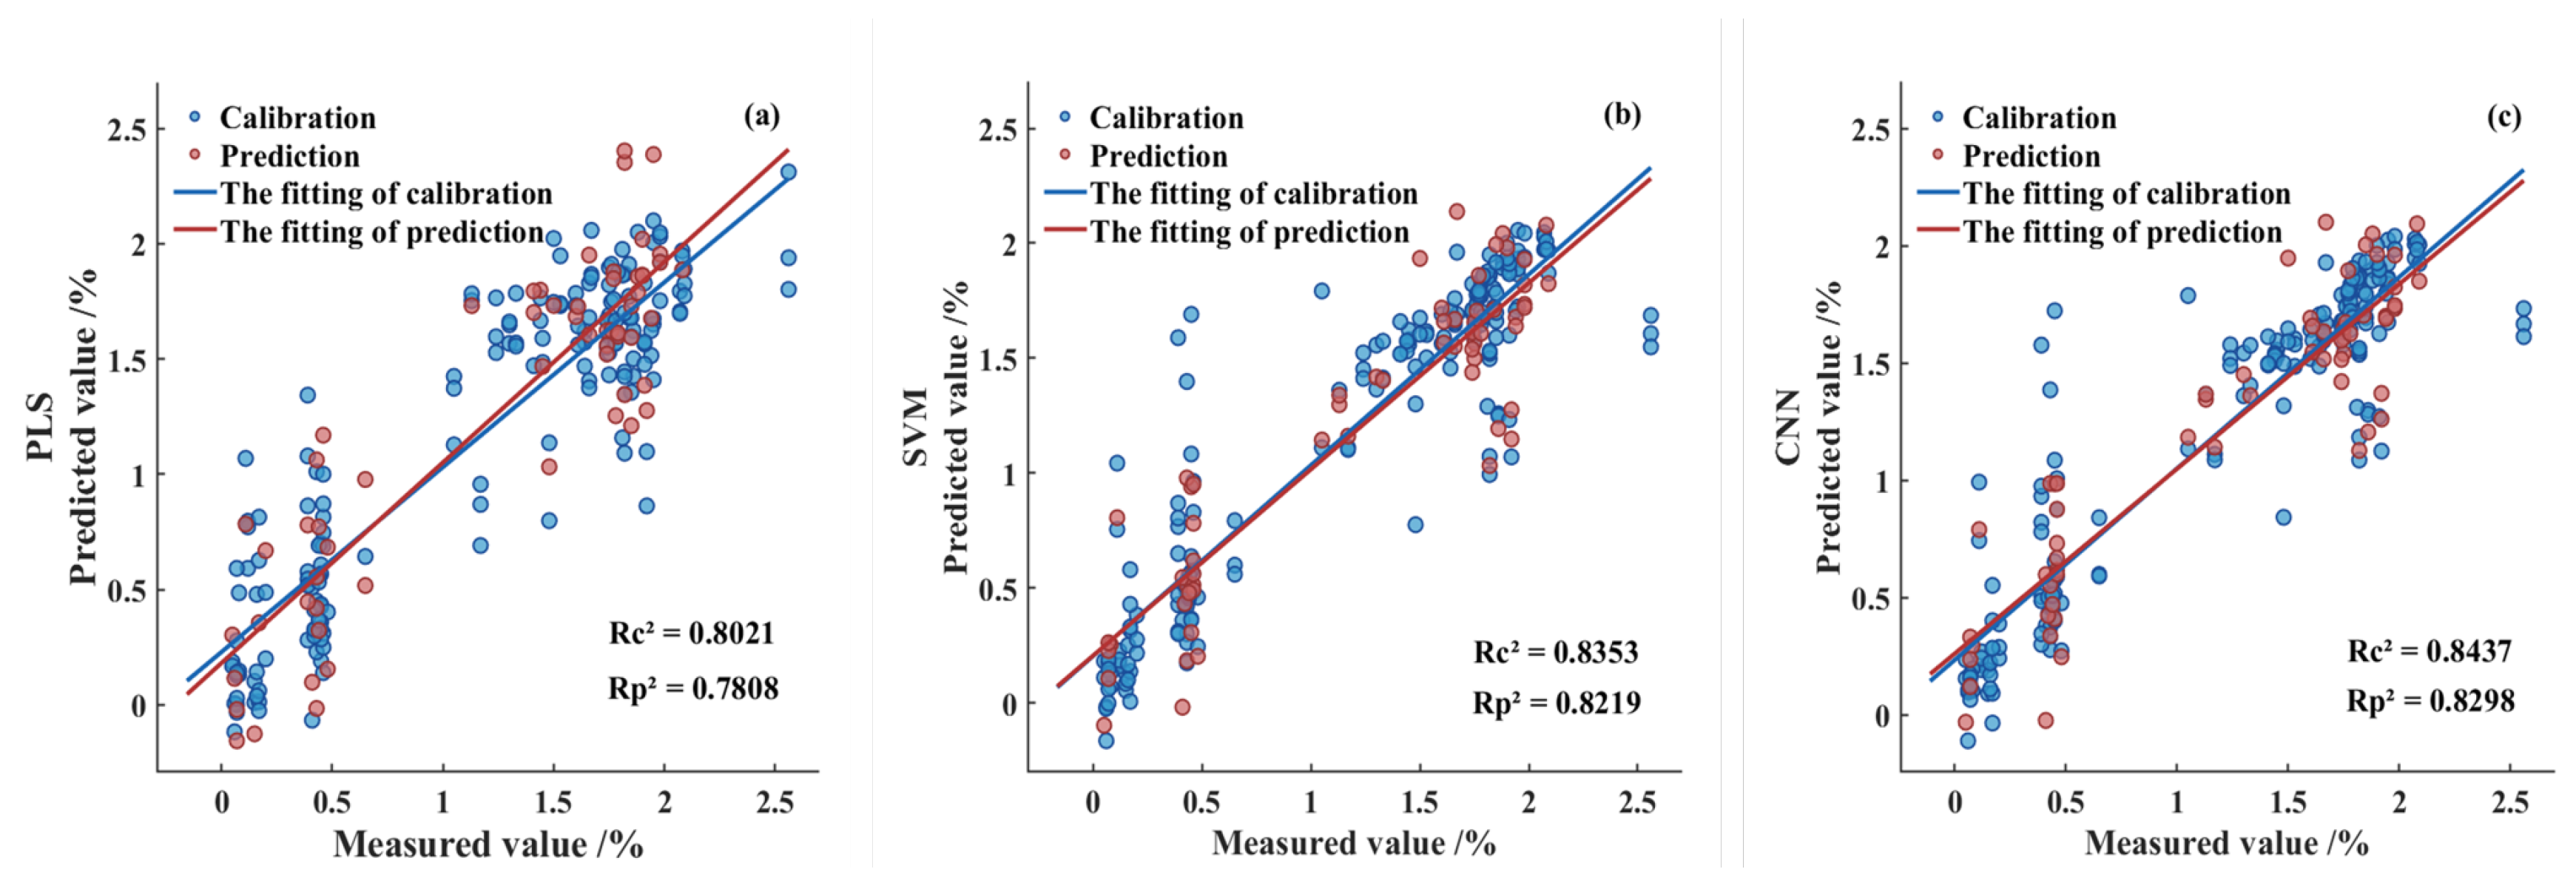
Figure 8 illustrates the fitting performance of the predictive models developed by integrating the Fused-Feature subset with the PLS, SVM, and CNN algorithms. As shown, after feature fusion, both the SVM and CNN models achieved coefficients of determination exceeding 0.8 in the prediction set, while the PLS model fell slightly below this threshold. Furthermore, all models exhibited RPDP values greater than 2.0 and maintained low RMSEP levels, indicating robust predictive capability across the three modeling approaches. Among them, the CNN model demonstrated the best overall performance metrics, with the optimal model achieving a RP2 of 0.8298, a RMSEP of 0.2894, and a RPDP of 2.4239. Therefore, the feature fusion-based CNN model developed in this study achieved the best performance, demonstrating promising application prospects and generalization potential.
Figure 8.
Fitting results of the calibration set and prediction set in the Fused-Feature prediction model. (a) PLS model; (b) SVM model; (c) CNN model.
Figure 8.
Fitting results of the calibration set and prediction set in the Fused-Feature prediction model. (a) PLS model; (b) SVM model; (c) CNN model.
4. Discussion
4.1. Discussion of Sample Representativeness and Dataset Reliability
This study collected 240 sorghum samples from six regions in Shanxi Province. These samples exhibited substantial variation in phenotypic traits including cultivar, grain color, size, and shape, thereby ensuring the diversity of the sample set. The detection model developed from this representative dataset successfully captured generalizable relationships between tannin content and spectral features. This capability enables accurate prediction for unknown sorghum samples from different geographical origins or cultivars, demonstrating strong generalization performance [39].
The tannin content in the samples was determined in strict accordance with the national standard using spectrophotometry. This method provided precise and reliable reference values, effectively avoiding systematic errors introduced by chemical measurement deviations, thereby laying a solid foundation for establishing high-precision hyperspectral quantitative analysis models.
4.2. Discussion of Dual Hyperspectral Data Sources and Feature Fusion Strategy
4.2.1. Complementarity of Dual Hyperspectral Data
Based on the aforementioned sorghum sample set, this study investigated the effectiveness of dual hyperspectral data fusion. The results demonstrate that the Whole-Raw data model outperformed any single data model. This can be attributed to the informational complementarity between different spectral regions. The VNIR region primarily captures information related to chromophores and electronic transitions, whereas the SWIR region is more sensitive to combination and overtone vibrations of molecular bonds such as O-H, C-H, and N-H. Differences in physical traits and tannin content among various sorghum varieties may thus be distinctly captured by different sensors. Thus, the fusion of dual hyperspectral data provides a more comprehensive information foundation, highlighting the complementary nature of multi-source information.
4.2.2. The Impact of Feature Extraction and Fusion on Model Performance
The application of the CARS feature extraction method reduced the dimensionality of the data. In the VNIR spectral range, the number of feature variables decreased from 646 to 33, reduced by 94.89%, and in the SWIR spectral range, they were reduced from 148 to 19, reduced by 87.16%, respectively. The performance of the feature models over the raw spectrum models indicates that the issues of collinearity and spectral redundancy inherent in hyperspectral data have been effectively mitigated. The CARS algorithm employs a competitive adaptive reweighted sampling mechanism to select the most relevant and information-rich feature bands associated with tannin content. By eliminating redundant information and noise, it simplifies the model structure, thereby enhancing both the robustness and generalization capability of the models [40].
Furthermore, the superior performance of the CARS-Fused-Feature model over both the CARS-VNIR and CARS-SWIR models indicates that the feature fusion strategy successfully extracts key information from the two sensor datasets and integrates them organically [41]. This strategy significantly enhances the density of effective information, enabling the modeling algorithm to focus more on decisive features, thereby achieving optimal predictive performance.
In summary, feature extraction and feature fusion approach constitutes a more efficient and superior data processing workflow, which enhances prediction performance while simultaneously streamlining the model.
4.3. Discussion on Predictive Model Performance
4.3.1. Comparative Analysis of Linear versus Nonlinear Models
Among the predictive models developed, the linear PLS model demonstrated inferior overall performance compared to the nonlinear SVM and CNN models. This discrepancy primarily stems from the models' differing capabilities in adapting to data characteristics and structure [42,43]. In this study, directly employed raw spectral data without preprocessing steps such as smoothing or scatter correction, aiming to preserve the complete information in the original spectra. However, the relationship between sorghum tannin content and spectral features is likely influenced by multiple factors including scattering effects and inter-component interactions, thereby exhibiting pronounced nonlinear characteristics that exceed the capacity of linear models. As a linear model, PLS struggles to capture the complex nonlinear characteristics present in raw spectral data. In contrast, SVM handles nonlinear problems by employing kernel functions to map the original data into a higher-dimensional space where the relationship becomes linear, whereas CNN leverages its architecture of multiple nonlinear activation layers and local receptive fields to automatically learn deep-level features within spectral data [44,45]. Thus, both SVM and CNN demonstrate superior adaptability when modeling such complex, unprocessed spectral data, enabling them to more accurately fit the true mapping relationship between tannin content and spectral response.
4.3.2. Comparative Analysis of SVM versus CNN
Among the nonlinear models, the CNN model achieved superior performance, while the SVM model performed slightly less effectively. This difference arises because SVM, as a shallow architecture, is critically dependent on the selection of kernel functions and parameters. In contrast, CNN possesses the capability for automated deep feature learning, enabling it to progressively extract deeper correlations through successive convolution and pooling operations applied to the selected features, thereby uncovering subtle patterns that are challenging for SVM to detect [46,47,48].
In summary, based on a high-quality sorghum sample set encompassing diverse genetic and environmental backgrounds, this study systematically demonstrated the significant advantages of multi-sensor feature fusion strategy and nonlinear deep learning models in hyperspectral quantitative inversion of tannin content. The proposed method provides a reliable and practical technical solution for rapid, non-destructive quality assessment of tannin content of sorghum.
5. Conclusions
This study systematically investigated a nondestructive detection method for tannin content in sorghum using dual hyperspectral sensor data fusion, and yielded the following main conclusions:
(1) The whole spectral model constructed by concatenating data from both VNIR and SWIR sensors demonstrated significantly superior predictive performance compared to models using individual sensor data.
(2) The variable subset models established based on CARS feature selection outperformed the whole spectrum models, while the model incorporating feature-level fusion of both sensors further enhanced the prediction performance.
(3) The nonlinear SVM and CNN models demonstrated superior adaptability compared to the linear PLS model. Among them, the Fused-Feature-CNN model achieved the optimal prediction performance, with values of 0.8298 for RP2, 0.2894 for RMSEP, and 2.4239 for RPDP.
The results of this study demonstrate that the feature fusion strategy effectively overcomes the limitations of single-sensor information dimensions. By integrating the complementary spectral characteristics of VNIR and SWIR, the model's information capture capability is significantly enhanced. Coupled with the powerful nonlinear modeling and deep feature learning capacity of the CNN algorithm, the accuracy and robustness of tannin content prediction are further improved. This research provides an effective technical pathway for achieving rapid, non-destructive, and high-precision detection of sorghum tannin content, while establishing a theoretical foundation for developing online detection equipment aimed at quality control of raw materials for Chinese liquor brewing.
Author Contributions
Conceptualization, K.W. and D.Z.; methodology, K.W. and C.H.; analysis, K.W., C.H. and W.G.; investigation, C.L. and W.G.; resources, D.Z., and Z.L.; data curation, K.W. and D.Z.; writing—original draft preparation, K.W.; writing—review and editing, D.Z., and Z.L.; supervision, C.L. and W.G. All authors have read and agreed to the published version of the manuscript.
Funding
This work was supported by University science and technology innovation promotion project,grant number CXGC2025055; Central Government Guides Local Funds for Scientific and Technological Development, grant number YDZJSX20231C009; School academic recovery project, grant number 2023XSHF2; Youth Scientific Research Project of Shanxi Province, grant number 202203021212450.
Institutional Review Board Statement
Not applicable.
Data Availability Statement
All the data mentioned in the article are included within the article, further inquiries can be directed to the corresponding author.
Acknowledgments
The author would like to express gratitude to the Sorghum Research Institute of Shanxi Agricultural University for providing raw materials and theoretical knowledge on varieties.
Conflicts of Interest
The authors declare no conflicts of interest.
Abbreviations
The following abbreviations are used in this manuscript:
| VNIR | Visible and Near-Infrared |
| SWIR | Short-Wave Infrared |
| PLS | Partial Least Squares |
| SVM | Support Vector Machine |
| CNN | Convolutional Neural Network |
| CARS | Competitive Adaptive Reweighted Sampling |
References
- Fan, W.; Xu, Y. History and Technology of Chinese Liquor. In Science and Engineering of Chinese Liquor (Baijiu) Microbiology, Chemistry and Process Technology. Singapore: Springer Nature Singapore, 2023; pp. 3–41. [CrossRef]
- Tanwar, R.; Panghal, A.; Chaudhary, G.; Kumari, A.; Chhikara, N. Nutritional, phytochemical and functional potential of sorghum: A review. Food Chemistry Advances 2023, 3, 100501. [Google Scholar] [CrossRef]
- Zhang, L.; Xu, J.; Ding, Y.; Cao, N.; Gao, X.; Feng, Z.; Li, K.; Cheng, B.; Zhou, L.; Ren, M.; Tao, Y.; Zou, G. GWAS of grain color and tannin content in Chinese sorghum based on whole-genome sequencing. Theoretical and Applied Genetics 2023, 136, 77. [Google Scholar] [CrossRef] [PubMed]
- Pérez, M.; Dominguez-López, I.; Lamuela-Raventós, R.M. The chemistry behind the folin–ciocalteu method for the estimation of (poly) phenol content in food: Total phenolic intake in a mediterranean dietary pattern. Journal of agricultural and food chemistry 2023, 71, 17543–17553. [Google Scholar] [CrossRef] [PubMed]
- Sang, M.; Liu, Q.; Li, D.; Dang, J.; Lu, C.; Liu, C.; Wu, Q. Heat stress and microbial stress induced defensive phenol accumulation in medicinal plant sparganium stoloniferum. International Journal of Molecular Sciences 2024, 25, 6379. [Google Scholar] [CrossRef] [PubMed]
- Doan, T.K. Q. , Chiang, K. Y. Characteristics and kinetics study of spherical cellulose nanocrystal extracted from cotton cloth waste by acid hydrolysis. Sustainable Environment Research 2022, 32, 26. [Google Scholar] [CrossRef]
- Oh, Y. J. , Hong, J. Application of the MTT-based colorimetric method for evaluating bacterial growth using different solvent systems. Lwt 2022, 153, 112565. [Google Scholar] [CrossRef]
- Drant, T.; Garcia-Caurel, E.; Perrin, Z.; Sciamma-O’Brien, E.; Carrasco, N.; Vettier, L.; Heng, K. Optical constants of exoplanet haze analogs from 0.3 to 30 µm: Comparative sensitivity between spectrophotometry and ellipsometry. Astronomy & Astrophysics 2024, 682, A6. [Google Scholar] [CrossRef]
- Thilakarathna, R.C. N. , Madhusankha, G. D. M. P., Navaratne, S. B. Potential food applications of sorghum (Sorghum bicolor) and rapid screening methods of nutritional traits by spectroscopic platforms. Journal of Food Science 2022, 87, 36–51. [Google Scholar] [CrossRef]
- Sun, D. W. , Pu, H., Yu, J. Applications of hyperspectral imaging technology in the food industry. Nature Reviews Electrical Engineering, 2024, 1, 251–263. [Google Scholar] [CrossRef]
- Zhang, J.; Lei, Y.; He, L.; Hu, X.; Tian, J.; Chen, M.; Huang, D.; Luo, H. The rapid detection of the tannin content of grains based on hyperspectral imaging technology and chemometrics. Journal of Food Composition and Analysis 2023, 123, 105604. [Google Scholar] [CrossRef]
- Baek, M. W. , Choi, H. R., Hwang, I. G., Tilahun, S., Jeong, C. S. Prediction of tannin content and quality parameters in astringent persimmons from visible and near-infrared spectroscopy. Frontiers in Plant Science 2023, 14, 1260644. [Google Scholar] [CrossRef]
- Savitri, K. P. , Hecker, C., van der Meer, F. D., Sidik, R. P. VNIR-SWIR infrared (imaging) spectroscopy for geothermal exploration: Current status and future directions. Geothermics 2021, 96, 102178. [Google Scholar] [CrossRef]
- Sedghi, M.; Golian, A.; Soleimani-Roodi, P.; Ahmadi, A.; Aami-Azghadi, M. Relationship between color and tannin content in sorghum grain: Application of image analysis and artificial neural network. Brazilian Journal of Poultry Science 2012, 14, 57–62. [Google Scholar] [CrossRef]
- Zhang, L.; Xu, J.; Ding, Y.; Cao, N.; Gao, X.; Feng, Z.; Li, K.; Cheng, B.; Zhou, L.; Ren, M.; Tao, Y.; Zou, G. GWAS of grain color and tannin content in Chinese sorghum based on whole-genome sequencing. Theoretical and Applied Genetics 2023, 136, 77. [Google Scholar] [CrossRef] [PubMed]
- Abera, S.; Yohannes, W.; Chandravanshi, B.S. Effect of processing methods on antinutritional factors (oxalate, phytate, and tannin) and their interaction with minerals (calcium, iron, and zinc) in red, white, and black kidney beans. International Journal of Analytical Chemistry 2023, 1, 6762027. [Google Scholar] [CrossRef] [PubMed]
- Alkowni, R.; Jaradat, N.; Fares, S. Total phenol, flavonoids, and tannin contents, antimicrobial, antioxidant, vital digestion enzymes inhibitory and cytotoxic activities of Verbascum fruticulosum. European Journal of Integrative Medicine 2023, 60, 102256. [Google Scholar] [CrossRef]
- Lim, K.; Ardekani, A. Label-free classification of nanoscale drug delivery systems using hyperspectral imaging and convolutional neural networks. International Journal of Pharmaceutics 2025, 126065. [Google Scholar] [CrossRef]
- Liu, L.; Delnevo, G.; Mirri, S. Unsupervised hyperspectral image segmentation of films: A hierarchical clustering-based approach. Journal of Big Data 2023, 10, 31. [Google Scholar] [CrossRef]
- Michelucci, U. (2024). Model validation and selection. In Fundamental mathematical concepts for machine learning in science, Cham: Springer International Publishing, 2024, 153-184. [CrossRef]
- Lal, A.; Sharan, A.; Sharma, K.; Ram, A.; Roy, D. K. , Datta, B. Scrutinizing different predictive modeling validation methodologies and data-partitioning strategies: New insights using groundwater modeling case study. Environmental Monitoring and Assessment 2024, 196, 623. [Google Scholar] [CrossRef]
- Li, Y.; Yang, X. Quantitative analysis of near infrared spectroscopic data based on dual-band transformation and competitive adaptive reweighted sampling. Spectrochimica Acta Part A: Molecular and Biomolecular Spectroscopy 2023, 285, 121924. [Google Scholar] [CrossRef]
- Xing, C.; Yuan, J.; Shi, C.; Chen, X.; Li, S. Utilizing X-ray diffraction in conjunction with competitive adaptive reweighted sampling (CARS) and principal component analysis for the discrimination of medicinal pearl powder and nacre powder. Analytical Sciences 2024, 40, 1889–1897. [Google Scholar] [CrossRef] [PubMed]
- Zeng, W.; Zhang, D.; Fang, Y.; Wu, J.; Huang, J. Comparison of partial least square regression, support vector machine, and deep-learning techniques for estimating soil salinity from hyperspectral data. Journal of Applied Remote Sensing 2018, 12, 022204–022204. [Google Scholar] [CrossRef]
- Saeed, F.; Khan, M. A. , Sharif, M., Mittal, M., Goyal, L. M., Roy, S. Deep neural network features fusion and selection based on PLS regression with an application for crops diseases classification. Applied Soft Computing 2021, 103, 107164. [Google Scholar] [CrossRef]
- Hasan, H.; Shafri, H. Z. , Habshi, M. A comparison between support vector machine (SVM) and convolutional neural network (CNN) models for hyperspectral image classification. IOP Conference Series: Earth and Environmental Science 2019, 357, 012035. [Google Scholar] [CrossRef]
- Mansuri, S. M. , Chakraborty, S. K., Mahanti, N. K., Pandiselvam, R. Effect of germ orientation during Vis-NIR hyperspectral imaging for the detection of fungal contamination in maize kernel using PLS-DA, ANN and 1D-CNN modelling. Food Control 2022, 139, 109077. [Google Scholar] [CrossRef]
- Sabanci, K.; Aslan, M. F. , Ropelewska, E., Unlersen, M. F. A convolutional neural network-based comparative study for pepper seed classification: Analysis of selected deep features with support vector machine. Journal of Food Process Engineering 2022, 45, e13955. [Google Scholar] [CrossRef]
- Jang, I. S. , Han, J., Kim, D. C., Cho, Y. DRS-based PLSR Model for Predicting Soil Organic Matter under Different Moisture Conditions in Saline and Non-saline Paddy Soils. American Society of Agricultural and Biological Engineers 2025, 1. [Google Scholar] [CrossRef]
- Singha, C.; Swain, K. C. , Sahoo, S., Govind, A. Prediction of soil nutrients through PLSR and SVMR models by VIs-NIR reflectance spectroscopy. The Egyptian Journal of Remote Sensing and Space Sciences 2023, 26, 901–918. [Google Scholar] [CrossRef]
- Seraj, A.; Mohammadi-Khanaposhtani, M.; Daneshfar, R.; Naseri, M.; Esmaeili, M.; Baghban, A.; Eslamian, S. Cross-validation. In Handbook of hydroinformatics; Elsevier, 2023, 89-105. [CrossRef]
- Bates, S.; Hastie, T.; Tibshirani, R. Cross-validation: What does it estimate and how well does it do it? Journal of the American Statistical Association 2024, 119, 1434–1445. [Google Scholar] [CrossRef]
- Oliveira, A.K.D. S. , Rizzo, R., Silva, C. A. A. C., Ré, N. C., Caron, M. L., Fiorio, P. R. Prediction of Corn Leaf Nitrogen Content in a Tropical Region Using Vis-NIR-SWIR Spectroscopy. AgriEngineering 2024, 6. [Google Scholar] [CrossRef]
- Conceição, R.R. P. , Queiroz, V. A. V., Medeiros, E. P., Araújo, J. B., Araújo, D. D. S., Miguel, R. D. A.,... & Simeone, M. L. F. Determination of fumonisin content in maize using near-infrared hyperspectral imaging (NIR-HSI) technology and chemometric methods. Brazilian Journal of Biology 2024, 84, e277974. [Google Scholar] [CrossRef]
- Lehmann, J.R. K. , Große-Stoltenberg, A., Römer, M., Oldeland, J. Field spectroscopy in the VNIR-SWIR region to discriminate between Mediterranean native plants and exotic-invasive shrubs based on leaf tannin content. Remote Sensing 2015, 7, 1225–1241. [Google Scholar] [CrossRef]
- Tziolas, N.; Ordoudi, S. A. , Tavlaridis, A., Karyotis, K., Zalidis, G., Mourtzinos, I. Rapid assessment of anthocyanins content of onion waste through visible-near-short-wave and mid-infrared spectroscopy combined with machine learning techniques. Sustainability 2021, 13, 6588. [Google Scholar] [CrossRef]
- Liu, J.; Dong, Z.; Xia, J.; Wang, H.; Meng, T.; Zhang, R.; Xie, J. Estimation of soil organic matter content based on CARS algorithm coupled with random forest. Spectrochimica Acta Part A: Molecular and Biomolecular Spectroscopy 2021, 258, 119823. [Google Scholar] [CrossRef] [PubMed]
- Bilal, M.; Arslan, M.; Samee-Ullah Iqbal, W.; Khan, S.; Tahir, H.E.; Li, Z.; Xia, S.; Xiaobo, Z. Fusion of NIR and MIR Spectroscopy With Advanced CARS-PLS Techniques for Precise Quantification of Total Polyphenols in Peanut Seeds. Phytochemical Analysis 2025. [Google Scholar] [CrossRef] [PubMed]
- Li, J.; Qian, J.; Chen, J.; Ruiz-Garcia, L.; Dong, C.; Chen, Q.; Liu, Z.; Xiao, P.; Zhao, Z. Recent advances of machine learning in the geographical origin traceability of food and agro-products: A review. Comprehensive Reviews in Food Science and Food Safety 2025, 24, e70082. [Google Scholar] [CrossRef] [PubMed]
- Zhang, K.; Zhou, R.; Adhikarla, E.; Yan, Z.; Liu, Y.; Yu, J.; Liu, Z.; Chen, X.; Davison, B.D.; Ren, H.; Huang, J.; Chen, C.; Zhou, Y.; Fu, S.; Liu, W.; Liu, T.; Li, X.; Chen, Y.; He, L.; Zou, J.; Li, Q.; Liu, H.; Sun, L. A generalist vision–language foundation model for diverse biomedical tasks. Nature Medicine 2024, 30, 3129–3141. [Google Scholar] [CrossRef]
- Ni, Q.; Ji, J. C. , Feng, K., Zhang, Y., Lin, D., Zheng, J. Data-driven bearing health management using a novel multi-scale fused feature and gated recurrent unit. Reliability Engineering & System Safety 2024, 242, 109753. [Google Scholar] [CrossRef]
- Aw, E.C. X. , Tan, G. W. H., Chuah, S. H. W., Ooi, K. B., Hajli, N. Be my friend! Cultivating parasocial relationships with social media influencers: Findings from PLS-SEM and fsQCA. Information Technology & People 2023, 36, 66–94. [Google Scholar] [CrossRef]
- SaiTeja, C.; Seventline, J.B. A hybrid learning framework for multi-modal facial prediction and recognition using improvised non-linear SVM classifier. AIP Advances 2023, 13. [Google Scholar] [CrossRef]
- Yang, C.; Oh, S. K. , Yang, B., Pedrycz, W., Wang, L. Hybrid fuzzy multiple SVM classifier through feature fusion based on convolution neural networks and its practical applications. Expert Systems with Applications 2022, 202, 117392. [Google Scholar] [CrossRef]
- Jiang, Y.; Yang, F.; Zhu, H.; Zhou, D.; Zeng, X. Nonlinear CNN: Improving CNNs with quadratic convolutions. Neural Computing and Applications 2020, 32, 8507–8516. [Google Scholar] [CrossRef]
- Yuan, X.; Qi, S.; Wang, Y.; Xia, H. A dynamic CNN for nonlinear dynamic feature learning in soft sensor modeling of industrial process data. Control Engineering Practice 2020, 104, 104614. [Google Scholar] [CrossRef]
- Ning, C.; Xie, Y.; Sun, L. LSTM, WaveNet, and 2D CNN for nonlinear time history prediction of seismic responses. Engineering Structures 2023, 286, 116083. [Google Scholar] [CrossRef]
- Wanda, P. RunMax: Fake profile classification using novel nonlinear activation in CNN. Social Network Analysis and Mining 2022, 12, 158. [Google Scholar] [CrossRef]
Disclaimer/Publisher’s Note: The statements, opinions and data contained in all publications are solely those of the individual author(s) and contributor(s) and not of MDPI and/or the editor(s). MDPI and/or the editor(s) disclaim responsibility for any injury to people or property resulting from any ideas, methods, instructions or products referred to in the content. |
© 2025 by the authors. Licensee MDPI, Basel, Switzerland. This article is an open access article distributed under the terms and conditions of the Creative Commons Attribution (CC BY) license (https://creativecommons.org/licenses/by/4.0/).
Copyright: This open access article is published under a Creative Commons CC BY 4.0 license, which permit the free download, distribution, and reuse, provided that the author and preprint are cited in any reuse.


