
Submitted:
17 October 2025
Posted:
20 October 2025
You are already at the latest version
Abstract
This study analyzes long-term trends in maximum (Tmax) and minimum (Tmin) near-surface air temperatures and precipitation across South America. The analysis focuses on Brazilian biomes and the capitals of South American countries, using ERA5 reanalysis data from 1979 to 2024. Seasonal cycles were removed using Seasonal-Trend decomposition based on Loess (STL) to isolate underlying climate signals. Temperature trends were quantified using ordinary least squares regression (OLS), with statistical significance assessed through the Student’s t-test. Precipitation trends were assessed using the Mann–Kendall test with Theil–Sen slope estimation, ensuring robustness against serial correlation. Results show a robust but spatially heterogeneous warming, with Tmax increasing more rapidly than Tmin. This asymmetry is consistent with mechanisms reported in the literature, such as reduced cloudiness and evaporative cooling. A meridional dipole is evident in precipitation: drying across central and southern regions, including the Cerrado, Pantanal, Caatinga, and Pampa, contrasted with rainfall increases in northern South America linked to ITCZ dynamics. Among Brazilian biomes, the Pantanal emerges as the most vulnerable, combining intense warming (+0.51 °C decade⁻¹) with the steepest rainfall decline (–10.45 mm decade⁻¹), while even the relatively weaker changes in the Pampa (+0.20 °C decade⁻¹ and –4.09 mm decade⁻¹) raise concerns for pasture productivity and livestock sustainability. In South American capitals, warming is widespread, though precipitation trends display a clear north–south contrast. Converging changes in temperature and rainfall are likely to intensify ecosystem stress, biodiversity loss, and threats to water and agricultural security. These impacts underscore the urgent need for biome-specific adaptation and conservation strategies under accelerating climate change.
Keywords:
climate change
; ERA5
; South America
; temperature trends
; precipitation trends
; Brazilian biomes
1. Introduction
Meteorological variables such as temperature and precipitation play a critical role in maintaining environmental balance and supporting planetary well-being. Temperature directly influences key natural processes, including water evaporation (Rojas-Sánchez and Hernández-Chaverri 2024), plant photosynthesis (Crous et al. 2022), and ecosystem thermal regulation (Zhao et al. 2023), all of which affect biodiversity and agricultural productivity. Precipitation is equally vital, as it sustains freshwater resources by replenishing rivers, lakes, and aquifers, while also supporting natural vegetation and food systems (Keune and Miralles 2019). Significant changes in these parameters, whether driven by natural variability or anthropogenic forcing, can lead to extreme events such as prolonged droughts and floods, with cascading effects on food security, public health, and ecological stability (Peng et al. 2023; Tamoffo et al. 2023; Calvin et al. 2023). Consequently, continuous monitoring and in-depth understanding of temperature and precipitation patterns are essential for advancing climate resilience and developing effective responses to global climate change.
Over the years, human activities have significantly altered precipitation and temperature patterns across the globe (Trenberth et al. 2003). The increasing emission of greenhouse gases, driven by the burning of fossil fuels, deforestation, and the intensification of agriculture, has contributed to a rise in global average temperatures and the amplification of extreme weather events (Calvin et al. 2023; Forster et al. 2025). These changes have disrupted rainfall regimes, making them more irregular, with prolonged droughts in some regions and intense, unseasonal rainfall in others. Moreover, unplanned urbanization and the degradation of natural ecosystems have diminished the environment’s ability to regulate local climate conditions, further exacerbating these impacts (Qian et al. 2022; Chai et al. 2022). Such climatic imbalances pose serious threats to water, food, and energy security, highlighting the urgent need for a global response grounded in scientific understanding, mitigation strategies, and climate adaptation efforts.
Climate change has increasingly manifested through notable shifts in temperature and precipitation patterns over recent decades, significantly affecting ecosystems, economic activities, and human livelihoods (Grimm et al. 2013; Weiskopf et al. 2020; Abbass et al. 2022; Adom 2024). Numerous global and regional studies have documented a rising frequency of extreme weather events, including more intense heatwaves, prolonged droughts, and heavy precipitation occurring over shorter durations. These trends provide compelling evidence of an ongoing shift in traditional climate regimes (Marengo et al. 2021b; Shenoy et al. 2022; Intergovernmental Panel on Climate Change (IPCC) 2023; Sanches et al. 2023). This gap underscores the need, as emphasized by the IPCC (Trenberth and others 2007; Marengo et al. 2021b), to deepen our understanding of regional climate patterns, especially within distinct biomes. Each biome possesses unique climatic, ecological, and environmental characteristics, which influence how it responds to changing climate conditions (Lyra et al. 2016; Braga and Laurini 2024a; Luna-Aranguré et al. 2025).
Scientific awareness of long-term climate change began consolidating in the latter half of the 20th century, as meteorological records revealed statistically significant warming trends across multiple regions of the globe (Jones and Moberg 2003; Hansen et al. 2006). Early observational studies, supported by improved temperature and precipitation datasets, provided some of the first consistent evidence that anthropogenic activities were influencing the global climate system beyond natural variability (Trenberth et al. 2007). Since then, multiple high-resolution reanalysis datasets and satellite observations have refined our understanding of spatial and temporal trends, enabling more precise detection of regional climatic shifts and their ecological consequences (Thorne and Vose 2010; Hersbach et al. 2020a). Long-term assessments of temperature and precipitation trends typically draw upon three complementary categories of climate data: in situ observations, reanalysis products, and satellite-derived measurements. In situ observations, obtained from ground-based meteorological stations, ocean buoys, and radiosonde networks, provide high temporal accuracy and extended historical coverage, yet often suffer from spatial gaps in remote or inaccessible regions (Xu et al. 2020; Rozante and Rozante 2024). Reanalysis datasets, such as ERA5 (Hersbach et al. 2020b), the Modern-Era Retrospective Analysis for Research and Applications, version 2 (MERRA-2) (Gelaro et al. 2017), and Japanese 55-year Reanalysis (JRA-55) (Kobayashi et al. 2015), integrate heterogeneous observations with numerical weather prediction models to produce spatially and temporally consistent reconstructions of atmospheric and surface variables at the global scale. Satellite observations, including those from Moderate Resolution Imaging Spectrometer (MODIS) (Justice et al. 2002), Tropical Rainfall Measuring Mission (TRMM) (Kummerow et al. 1998), and Global Precipitation Measurement (GPM) (Huffman et al. 2015), ensure near-global coverage and are particularly valuable for monitoring regions with sparse ground-based data, despite offering shorter time series and relying on indirect retrieval algorithms. The integration of these diverse data sources enhances the robustness of climate variability assessments and supports the reliable detection of long-term trends across multiple spatial scales.
In recent decades, climate science has increasingly emphasized the importance of downscaling global models and observations to better capture the heterogeneity of regional and local climates (Gebrechorkos et al. 2023; Lopez-Gomez et al. 2025; Cooney 2012). This is particularly relevant in South America, where climatic patterns are influenced by complex land–atmosphere interactions (Ruscica et al. 2016; Spennemann et al. 2018), vegetation–climate feedbacks (Wu et al. 2021; Souza et al. 2021), teleconnections such as the El Niño–Southern Oscillation (ENSO) (Reboita et al. 2021) and the South Atlantic Convergence Zone (SACZ) (Ambrizzi and Ferraz 2015). The regional manifestation of global warming in this context includes both gradual trends, such as increasing mean temperatures, and abrupt changes in precipitation regimes that affect the frequency and severity of hydrometeorological extremes (Feron et al. 2024a). These complex dynamics highlight the need for historical trend analyses based on observational records or reanalysis data, particularly in ecologically sensitive and socioeconomically vulnerable regions like the Brazilian biomes.
Furthermore, Brazil’s biomes, ranging from the humid Amazon rainforest to the semi-arid Caatinga and the seasonally flooded Pantanal, are not only climate-sensitive but also function as global climate regulators through their roles in carbon storage (Castro et al. 2022), evapotranspiration (Hofmann et al. 2023), and albedo dynamics (Leal Filho et al. 2025). Recent studies have shown that even modest shifts in climatic patterns can have outsized ecological impacts, including biodiversity loss (Malecha and Vale 2024), biome degradation (Braga and Laurini 2024b), and feedbacks that may accelerate regional climate change. Therefore, understanding the historical climate trajectory of these ecosystems through long-term trend analysis is essential not only for scientific knowledge, but also for informing conservation, land-use planning, and climate adaptation strategies tailored to each biome's unique vulnerability profile.
The primary objective of this study is to investigate long-term trends in temperature and precipitation from 1979 to 2024, providing a comprehensive assessment of their spatial distribution across South America, including a focused analysis of the capitals to connect large-scale climatic signals with urban contexts. In addition to this continental-scale perspective, the research provides a detailed examination of climatic trends within Brazil, with a specific focus on the country’s biomes. By exploring the distinct responses of the Amazon, Cerrado, Atlantic Forest, Caatinga, Pantanal, and Pampa biomes, the study seeks to enhance understanding of how long-term trends manifest across diverse ecological regions.
2. Materials and Methods
2.1. Study Area
This study focuses on the South American continent, with particular emphasis on Brazil and its six biomes: Amazon, Cerrado, Atlantic Forest, Caatinga, Pantanal, and Pampa (Figure 1). The continental-scale analysis presents the spatial distribution of long-term temperature and precipitation trends, while more detailed temporal and climatic assessments are conducted within each Brazilian biome. In addition, the capitals of all South American countries are investigated to provide an urban perspective on climate variability. The Brazilian biomes were selected for their ecological importance and climatic diversity, offering contrasting natural environments to evaluate ecosystem vulnerability and resilience under climate change. The South American capitals, in turn, were included for their socio-environmental relevance, as they concentrate population, infrastructure, and economic activity, providing critical insights into the impacts of climate change and the challenges of adaptation in urban settings.
Figure 1 shows South America along with the boundaries of the Brazilian biomes. The Amazon biome (dark green) is characterized by a hot and humid tropical climate (Af, Am, and Aw under Köppen), with average temperatures between 25 °C and 28 °C and annual precipitation exceeding 2,000 mm, supporting one of the most biodiverse ecosystems on Earth. The Atlantic Forest (light green) spans several climatic zones (Af, Am, Aw, Cfa, Cfb, Cwb), with high rainfall (1,200–2,800 mm/year) and moderate temperatures (20–25 °C), exhibiting strong altitudinal and coastal climatic gradients. The Cerrado (purple), known as the world’s most biodiverse savanna, experiences a marked dry-wet seasonal cycle, with annual rainfall between 800 and 2,000 mm and average temperatures from 20 °C to 26 °C. The Caatinga (brown), a semi-arid biome, presents low and irregular rainfall (300–800 mm/year), high annual temperatures (23–27 °C), and frequent droughts, being one of the driest regions in Brazil. The Pantanal (red), the world’s largest tropical wetland, follows a seasonal flood regime, with mean temperatures around 26.7 °C and precipitation between 1,000 and 1,300 mm/year, strongly influencing its aquatic-terrestrial ecosystem dynamics. Finally, the Pampa (orange) is a temperate grassland biome (Cfa), with well-defined seasons, moderate rainfall throughout the year, and average temperatures ranging from 16 °C to 18 °C.
2.2. Datasets
Near-surface air temperature at 2 meters (T2m) and total precipitation were obtained from the ERA5 reanalysis produced by the European Centre for Medium-Range Weather Forecasts (ECMWF) (Hersbach et al. 2020b). The datasets were accessed directly through the ECMWF data platform using the official Web API, which enables automated and reproducible data retrieval from the Centre’s archives. ERA5 provides hourly global atmospheric, oceanic, and land-surface variables at ≈31 km horizontal resolution and 137–139 vertical levels, using a four-dimensional variational (4D-Var) data assimilation scheme to optimally combine model forecasts with in situ and satellite observations. The dataset extends from 1940 to the present, is updated daily with a typical five-day latency, and includes uncertainty estimates from a 10-member ensemble at ≈63 km and 3-hourly intervals, all publicly available through the Copernicus Climate Data Store (https://cds.climate.copernicus.eu).
For this study, only data from 1979 to 2024 were used, coinciding with the onset of the satellite era, when observational coverage and reanalysis reliability improved substantially. This choice also avoids temporal inhomogeneities present in the earlier records (1940–1978), affected by limited observational input. ERA5 was selected as the primary dataset due to its high spatiotemporal resolution, temporal homogeneity, and demonstrated ability to represent temperature (Bazzanela et al. 2025) and precipitation (Vega-Durán et al. 2021) variability in South America. Given the sparse and uneven distribution of meteorological stations across the continent, particularly in remote regions such as the Amazon, using station-only records would lead to substantial spatial biases and incomplete climate characterization. By integrating ground-based measurements, satellite retrievals, and advanced assimilation techniques, ERA5 provides spatially continuous and physically consistent fields, making it particularly suitable for multi-decadal climate trend analysis.
2.3. Data Processing and Seasonal Adjustment
Hourly ERA5 data were retrieved, and daily maximum (Tmax) and minimum (TMin) near-surface air temperatures were derived from the diurnal cycle. For precipitation, 24-hour accumulations were computed for each day. Daily temperature records were subsequently averaged to obtain monthly mean values, whereas daily precipitation totals were summed to produce monthly accumulations. This procedure resulted in a fully processed monthly dataset for both variables, suitable for climate analysis.
Decomposing a time series into trend, seasonal, and irregular components is fundamental to uncover underlying variations. The removal of the seasonal component, and when appropriate the irregular one, reduces autocorrelation and enhances model reliability. Several methods are available for time series decomposition, including additive and multiplicative approaches (Ozaki and Thomson 2002), X-11/X-12/X-13-ARIMA-SEATS (Dagum and Quenneville 1993), (Findley et al., 1998), and Fourier decomposition. In this study, we adopt the Seasonal-Trend decomposition using Loess (STL) (Cleveland et al., 1990), chosen for its flexibility in handling non-linear seasonal patterns, robustness to missing data, and ability to separate seasonal, trend, and irregular components with precision.
where is time series, trend component, seasonal component, and remainder component.
These features are particularly valuable when analyzing climate variables such as temperature and precipitation, whose seasonal cycles evolve over time due to natural variability and external forcings. This approach enables a clearer detection of genuine long-term climate changes, free from predictable seasonal and random irregular influences.
2.4. Trend Analysis Framework
Following the seasonal adjustment process, distinct approaches were adopted for temperature and precipitation trend analysis, reflecting the statistical characteristics of each variable. For temperature, which typically exhibits smoother distributions and is closer to normality, an ordinary least squares (OLS) regression model was fitted to the deseasonalized monthly series. Let the deseasonalized temperature at time be denoted by . The OLS regression model is formulated as:
where is the temperature at time t, α the intercept, β is the slope representing the linear trend, and is the random error term with mean zero and variance . The slope β quantifies the rate of change per unit time (e.g., °C decade⁻¹). The estimators of α and β are obtained by minimizing the sum of squared residuals:
The residual variance and the standard error of the slope are given by:
To test for the statistical significance of the trend, the null and alternative hypotheses were defined as:
The test statistic is:
Which follows a Student’s t-distribution with degrees of freedom under the null hypothesis. A two-tailed test at the 95% confidence level was applied. The 95% confidence interval for β is:
where is the estimated slope and SE() its standard error. This parametric approach is appropriate for temperature because it not only provides the magnitude of the trend but also offers a direct test of whether the observed slope differs significantly from zero (Qian et al. 2019).
In contrast to temperature, precipitation records typically exhibit high variability, skewed distributions, and frequent zero values, which violate the assumptions of parametric linear regression models. To address these challenges, we employed the non-parametric Mann–Kendall test (Mann 1945; Kendall 1975), to detect the presence of monotonic trends without requiring normally distributed residuals. Given a time series , the Mann–Kendall statistic is defined as:
where sgn(⋅) denotes the sign function. The variance of S, assuming no trend, is
For large n, the statistic S approximates a normal distribution, and the standardized Z-score is:
Follows a standard normal distribution under the null hypothesis of no trend. Positive values of Z indicate an increasing trend, while negative values indicate a decreasing trend. To estimate the magnitude of the detected trend, we applied the Theil–Sen slope estimator (Sen, 1968), defined as the median of all possible pairwise slopes:
This non-parametric estimator is robust against outliers and particularly suitable for skewed or highly variable precipitation data. In this study, significance was evaluated at the 95% confidence level. To minimize the influence of autocorrelation, common in hydroclimatic time series, trend significance was tested after adjusting for serial dependence following the approach of Yue and Wang (2004).
All statistical calculations, data accumulation procedures, and graphical analyses presented in this study were performed by the authors using the Python programming language (version 3.13.6; https://www.python.org). The computational workflow was developed entirely within this environment, employing widely used scientific libraries, including NumPy, Pandas, Matplotlib, and SciPy.
3. Results
3.1. Spatial Distribution
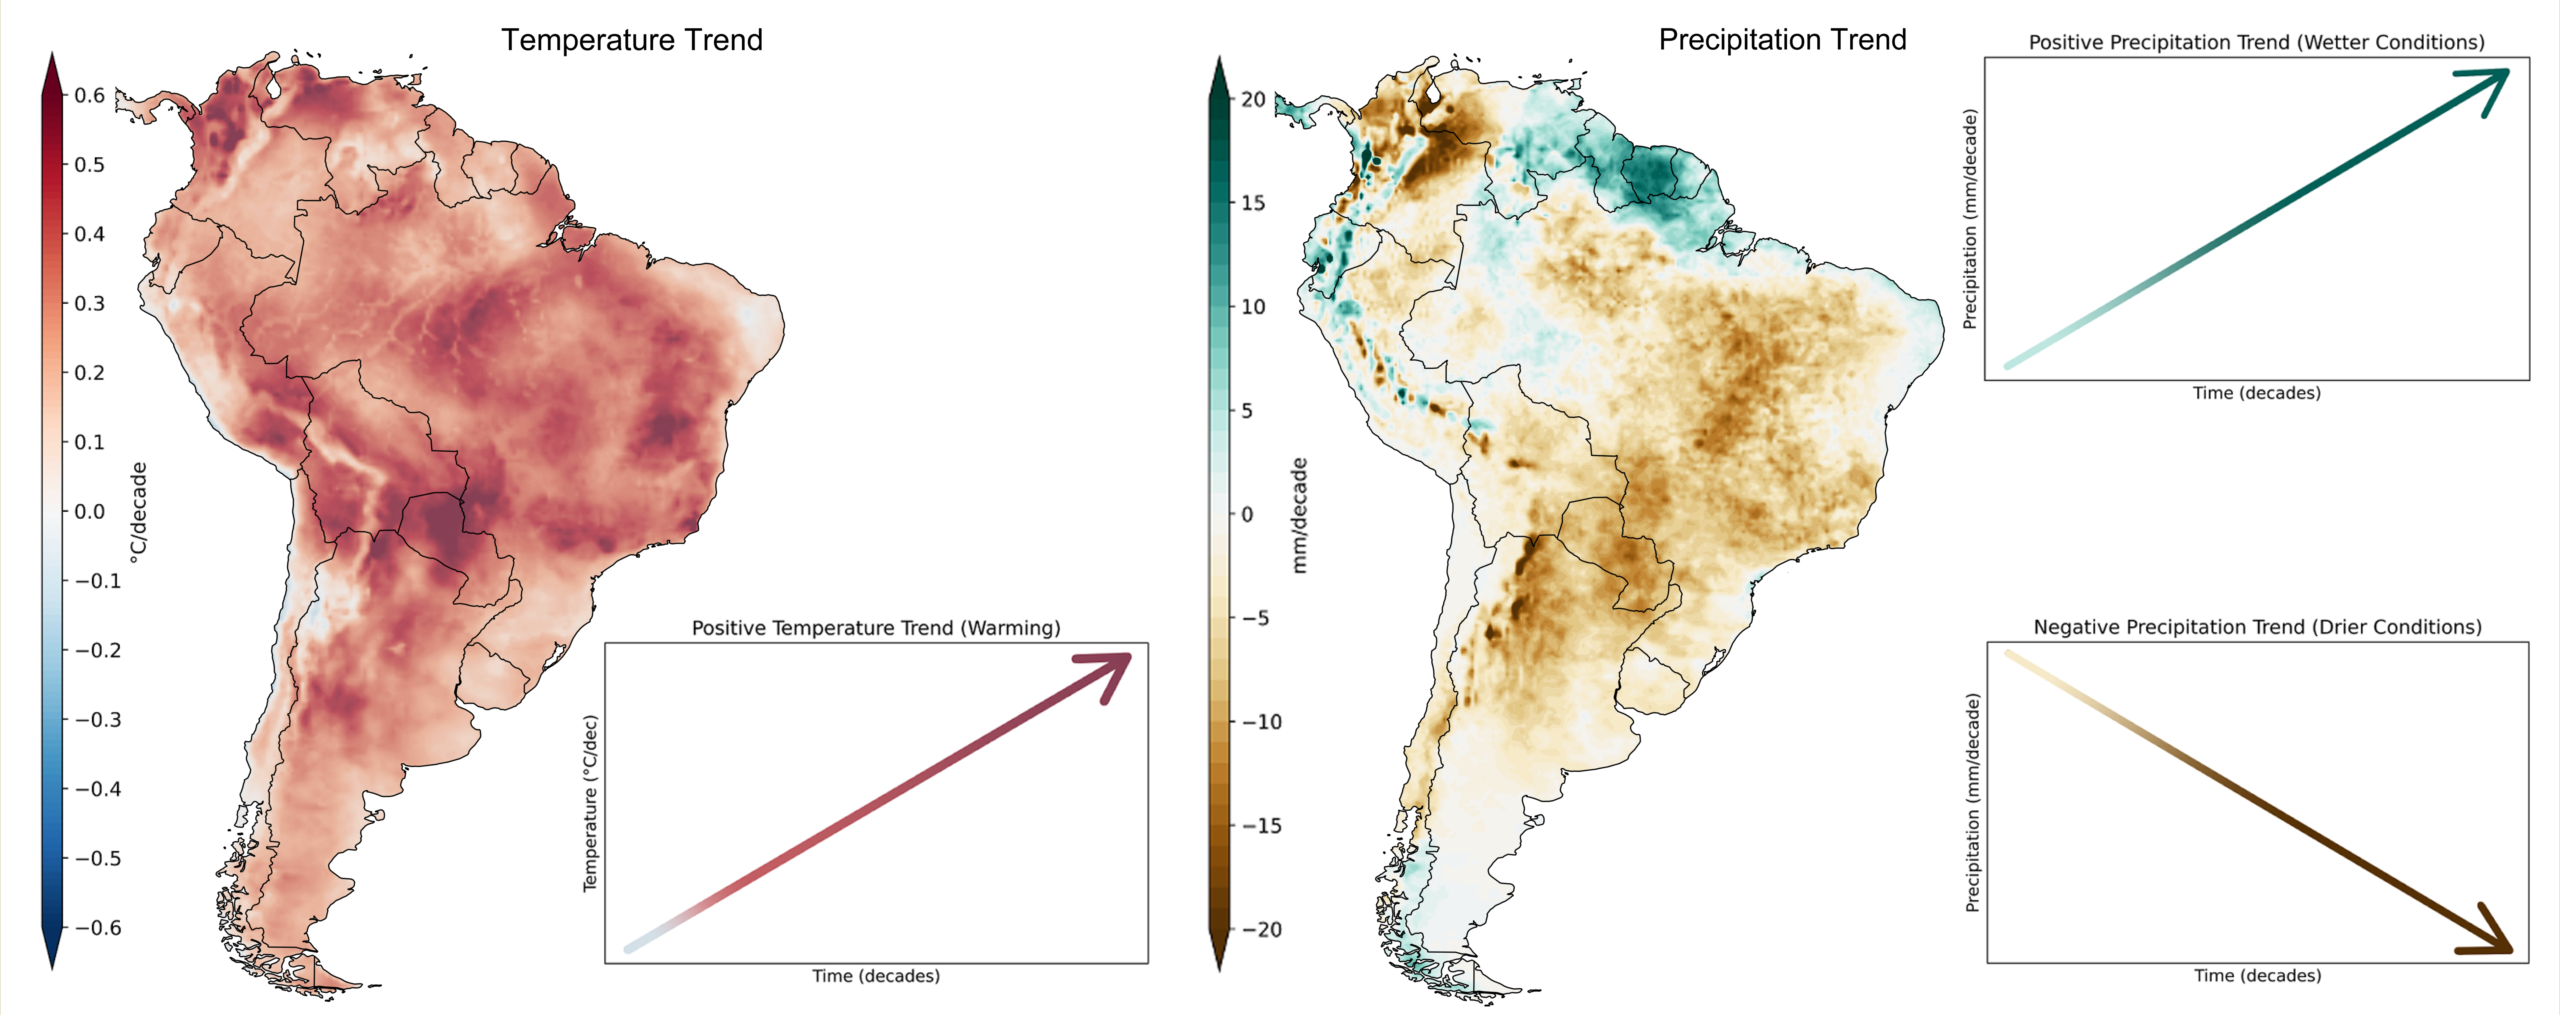
Figure 2 illustrates the spatial distribution of long-term trends in Tmax and Tmin air temperatures and precipitation, where shaded areas represent the magnitude of the trends and hatched regions denote values not statistically significant at the 95% confidence level. For air temperature, significance is assessed using the Student’s t-test, whereas precipitation trends rely on the Mann–Kendall test combined with Theil–Sen slope estimates. In the case of Tmax (Figure 2a), a pronounced positive trend is evident across much of South America, with the strongest intensification observed over continental regions, particularly the Amazon, Central-West and Southeast Brazil, as well as northern Argentina, Paraguay, and Bolivia, where trends exceed 0.4 °C decade⁻¹ and locally surpass 0.6 °C decade⁻¹. Notably, the northernmost portion of the continent, including northern Amazonia, Venezuela, and the Guianas, also displays exceptionally strong warming, highlighting the widespread intensification of Tmax across tropical latitudes. Over these continental areas, most positive trends are statistically significant, reinforcing the robustness of the observed warming pattern. Altogether, the results for Tmax reveal a clear and spatially coherent warming signal over the past four decades, consistent with previous studies reporting increased frequency and intensity of heat extremes in South America (De Araújo et al. 2022; Marengo et al. 2025). In contrast, southern South America, particularly Patagonia and the Andes of Chile and Argentina, shows weaker warming signals, generally below 0.2 °C decade⁻¹, with large hatched areas indicating lower statistical significance. Coastal regions of northeastern Brazil similarly exhibit weaker or non-significant warming. Negative trends are confined mainly to adjacent oceanic regions, especially along the southeastern Pacific and small portions of the southwestern Atlantic, where most of the trends are not statistically significant, reflecting greater uncertainty in maritime estimates.
The spatial distribution of Tmin trends (Figure 2b) reveals pronounced regional contrasts. Strong and statistically significant warming rates exceeding 0.3 °C decade⁻¹ are evident in northern Colombia, northern Chile, and southeastern Bolivia, highlighting areas of robust confidence in the observed trends. Across Brazil, warming signals are more moderate, generally ranging between 0.1 and 0.2 °C decade⁻¹. An exception occurs in the state of Rio de Janeiro, where a localized cooling signal is observed; however, this feature coincides with low statistical confidence, limiting its robustness. Over the Atlantic Ocean, weak but spatially coherent positive trends of about 0.1 °C decade⁻¹ dominate, while in the southern portion of the basin negative trends emerge, though again with low confidence. In contrast, the tropical to subtropical Pacific south of the equator exhibits weak negative trends, with an extensive region of low statistical significance, suggesting that the signal in this sector remains uncertain. Overall, the results indicate widespread warming of nighttime minimum temperatures over continental South America, punctuated by regional hotspots of stronger trends and oceanic areas where statistical confidence is markedly lower.
The analysis of precipitation trends (Figure 2c) reveals a predominantly negative signal, with statistically robust reductions in precipitation over northern Argentina, Paraguay, Bolivia, central Brazil, and parts of the Amazon, extending into Colombia and Venezuela. The strongest declines reach more than 40 mm decade⁻¹ in northern Argentina and along the Colombia–Venezuela border. However, over several other continental regions, negative tendencies are identified but their magnitudes are comparatively weaker and accompanied by low statistical significance, suggesting that these drying signals are less consistent and may be strongly influenced by interannual to decadal variability rather than by long-term climatic forcing. In contrast, positive trends are observed in the northernmost sector of the continent and adjacent oceans, with increases above 20 mm decade⁻¹ in the Intertropical Convergence Zone (ITCZ), around 15 mm decade⁻¹ in Suriname, and exceeding 20 mm decade⁻¹ over the northern Pacific. Additional statistically significant increases extend over Amapá, French Guiana, and northern Venezuela, closely aligned with the mean position of the ITCZ. Over most adjacent oceans, trends are weak and unreliable, except in the equatorial Atlantic near the northern Brazilian coast, where consistent increases are detected. Overall, the spatial pattern indicates a dipole structure, characterized by statistically robust long-term reductions in precipitation across much of the continental interior and enhanced rainfall in the northernmost sector.
This pattern could be partially related to ascent motion near the equator and subsidence to the south. Gomes et al. (2024), analyzing droughts in South America found a meridional circulation with ascent motion over the North Atlantic Ocean and subsidence over the continent. The analyses showed positive Sea Surface Temperature (SST) anomalies in the North Atlantic, favoring ascent motion. The precipitation trend pattern and the temperature trend in the present study are consistent with global warming, which indicates a temperature increase in the atmosphere and oceans (IPCC 2023). The trends are large in the North Pacific and North Atlantic Oceans (https://climate.copernicus.eu/climate-indicators/sea-surface-temperature). The Amazon and Atlantic Forest deforestation could also have contributed to the dry tendency over the continent. An updated vegetation map from PROVEG (Vieira et al. 2013), also discussed in Talamoni et al. (2024) shows a great change in the forested areas, mainly in the Atlantic Forest and Amazon.
3.2. Trends for Capital Across South America
Capitals concentrate population, infrastructure, and political decision-making, which renders them highly sensitive to variations in precipitation and temperature. Analyzing long-term trends in these urban centers provides policy-relevant insights by linking continental-scale climate signals to urban vulnerability and national adaptation strategies. For this analysis, trend values were extracted from the grid point nearest to each capital. To facilitate interpretation, capitals are ordered from south to north in the figures below, with southern cities on the left and northern cities on the right. In this section, we assess how precipitation and temperature trends manifest across South American capitals.
Temperature and precipitation trends across South American capitals during 1979–2024 reveal a pervasive but spatially heterogeneous signal (Figure 3a,b). For temperature, both Tmax and Tmin exhibit positive and mostly significant trends, though with marked differences in magnitude across cities. Tmax increases are generally stronger, surpassing 0.35 °C decade⁻¹ in Asunción, La Paz, Brasília, and Caracas (up to 0.39 °C decade⁻¹ in Caracas), while Lima shows the weakest and statistically insignificant Tmax trend (~0.03 °C decade⁻¹) and Bogotá only a modest increase (~0.05 °C decade⁻¹). Tmin trends are positive and significant in nearly all capitals, typically ranging from 0.15 to 0.25 °C decade⁻¹, with higher values in La Paz, Quito, Paramaribo, and Georgetown, although Santiago shows a much weaker increase (~0.04 °C decade⁻¹). While many cities display stronger daytime than nighttime warming, exceptions such as Quito suggest that the amplification of Tmax over Tmin is not uniform across the continent. In contrast, precipitation trends reveal a sharper regional contrast: significant declines dominate central and southern capitals, led by Asunción (−11.32 mm decade⁻¹) and Brasília (−8.66 mm decade⁻¹), followed by Santiago, Buenos Aires, and Montevideo. Northern capitals, however, exhibit notable increases, with Paramaribo (+8.60 mm decade⁻¹), Georgetown (+658 mm decade⁻¹), and Caracas (+3.93 mm decade⁻¹) standing out, while Lima and Quito display weak and statistically insignificant changes.
indicate the capitals where trends are not statistically significant.
3.3. Trends Across Brazilian Biomes
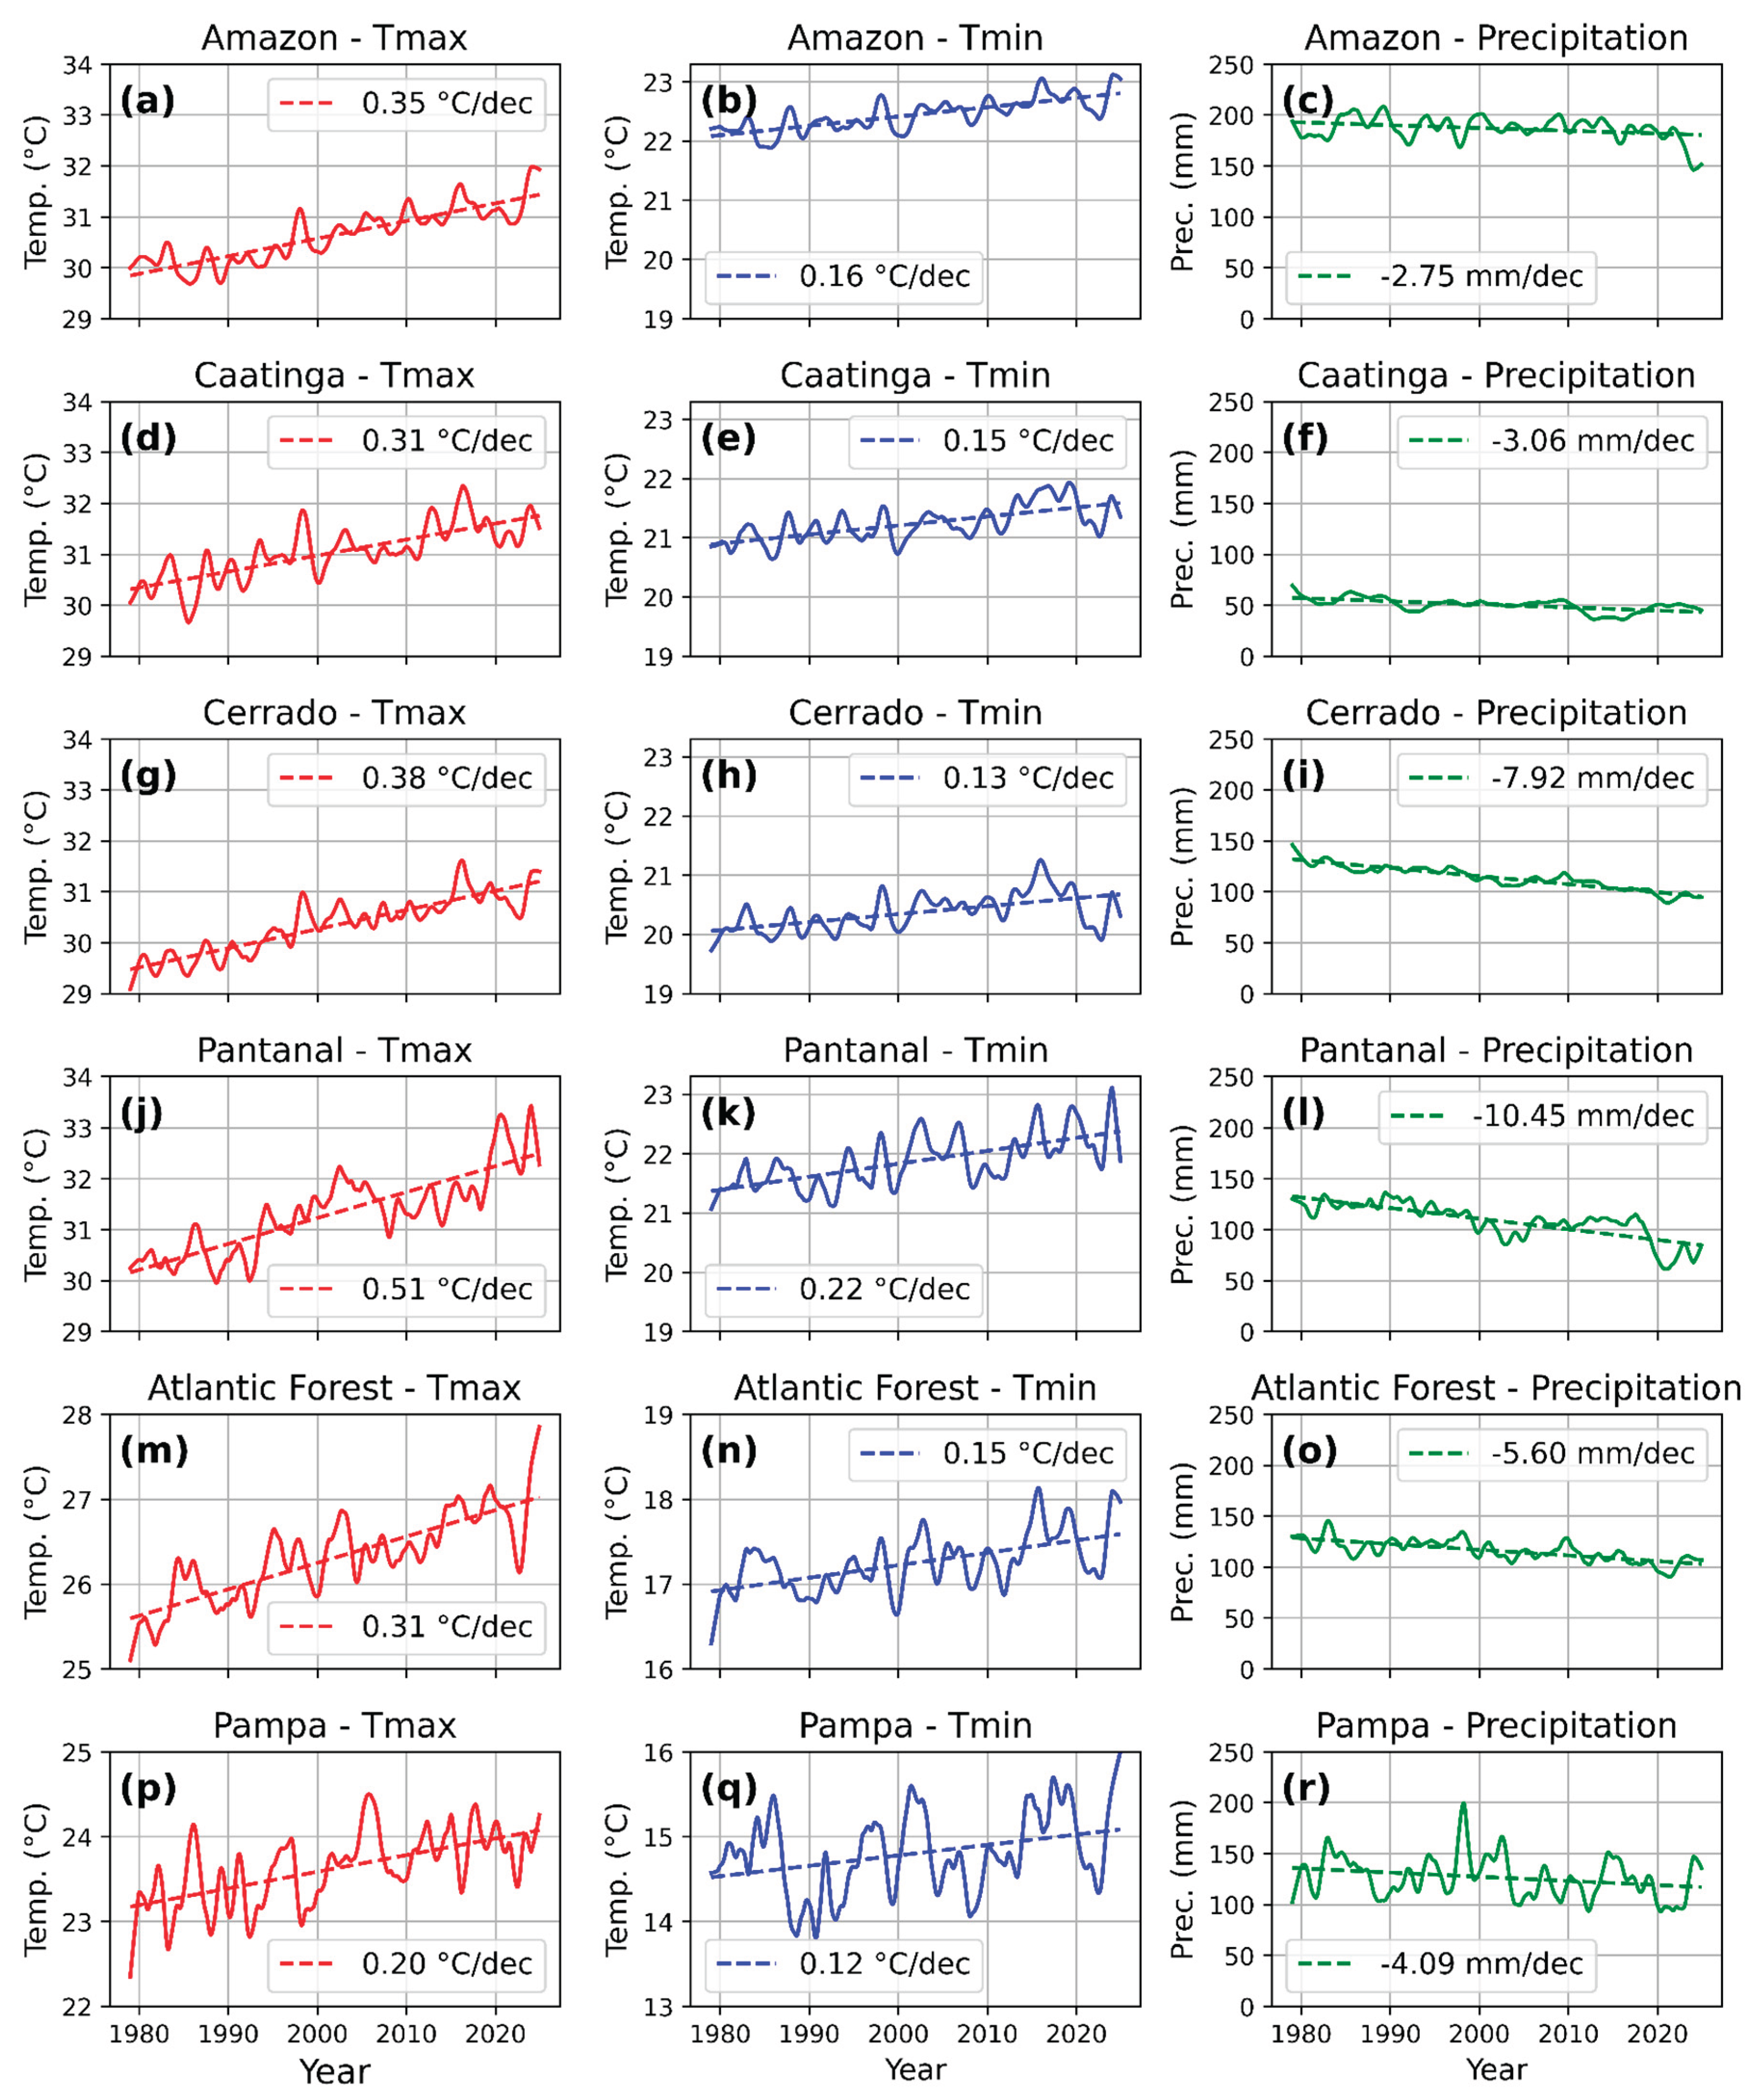
Figure 4 presents the temporal evolution of spatially averaged Tmax, Tmin, and precipitation across the six Brazilian biomes from 1979 to 2024, considering only grid points with statistical significance. In the Amazon, Tmax rose by about 0.35 °C decade⁻¹ and Tmin by 0.16 °C decade⁻¹, while rainfall declined by –2.75 mm decade⁻¹. This combination of warming and drying may exacerbate forest vulnerability to fire, biodiversity loss, and feedback to regional and global climate systems (Figure 4a–c). The Caatinga, already characterized by water scarcity, shows similar signals, with Tmax increasing at 0.31 °C decade⁻¹, Tmin at 0.15 °C decade⁻¹, and precipitation decreasing by –3.06 mm decade⁻¹ (Figure 4d–f), suggesting growing risks of desertification and socioeconomic stress for communities dependent on fragile natural resources. In the Cerrado, one of the world's great sanctuaries of biodiversity, Tmax rose at 0.38 °C decade⁻¹ and Tmin at 0.13 °C decade⁻¹, while precipitation declined sharply by –7.92 mm decade⁻¹ (Figure 4g–i), posing threats to both ecosystem resilience and the agricultural sector, which is highly dependent on stable rainfall patterns.
The Pantanal, the largest tropical wetland on Earth, emerges as the most vulnerable biome, with Tmax increasing by 0.51 °C decade⁻¹ and Tmin by 0.22 °C decade⁻¹, coupled with the steepest rainfall decline of –10.45 mm decade⁻¹ (Figure 4j–l). Such changes directly threaten its flood-pulse dynamics, with cascading impacts on biodiversity, fisheries, and water resources downstream. In the Atlantic Forest, which has already lost most of its original cover, Tmax rose at 0.31 °C decade⁻¹ and Tmin at 0.15 °C decade⁻¹, while rainfall declined by -5.60 mm decade⁻¹ (Figure 4m–o). These shifts intensify existing pressures from land-use change, potentially undermining ecosystem services vital for densely populated regions. The Pampa, though experiencing smaller climatic trends, still shows warming of 0.20 °C decade⁻¹ for Tmax and 0.12 °C decade⁻¹ for Tmin, along with a rainfall reduction of –4.09 mm decade⁻¹ (Figure 4p–r), which may compromise grassland productivity and pastoral systems central to local livelihoods.
Taken together, these results point to a pervasive warming signal across all Brazilian biomes, with Tmax rising more rapidly than Tmin, and precipitation showing consistent declines of varying intensity. The combination of hotter days, warmer nights, and diminishing rainfall increases ecosystem stress and heightens the risks of biodiversity loss, water scarcity, and reduced agricultural productivity. Particularly concerning are the trajectories in the Pantanal and Cerrado, where warming and drying trends converge most strongly. Overall, the patterns revealed in Figure 4 underscore the urgency of integrating climate adaptation strategies into biodiversity conservation, water management, and sustainable land use to safeguard both ecosystems and human well-being in Brazil under ongoing climate change.
4. Discussion
The stronger warming of Tmax relative to Tmin across South America emerges as a consistent signal in both observational records and model-based studies, and can be attributed to coupled declines in precipitation and cloud cover. Reduced cloudiness enhances surface solar radiation during the day, intensifying sensible heat fluxes and accelerating Tmax increases, while the absence of nocturnal cloud insulation allows for stronger radiative cooling, thereby moderating Tmin rises. This mechanism is consistent with recent global findings showing that cloud cover is the dominant driver of diurnal temperature range (DTR) variability (Huang et al. 2023), exerting a strong negative correlation with DTR across more than 80% of land surfaces (Wild et al. 2005; Zhong et al. 2023). Additional processes reinforce this asymmetry: reduced precipitation and soil moisture limit evaporative cooling, further amplifying Tmax under drought conditions (Dai et al. 1999; He et al. 2015). Moreover, land-use change and deforestation suppress evapotranspiration and increase sensible heating, leading to enhanced diurnal contrasts (Zhou et al. 2007; Schultz et al. 2017). Consequently, DTR expands under drier and clearer conditions, reflecting a robust continental-scale mechanism whereby declining precipitation and cloud cover disproportionately amplify daytime warming. This dynamic highlights the interplay of radiation, atmospheric circulation, and land-surface processes in shaping the distinct trajectories of Tmax and Tmin trends in South America.
In contrast to the widespread continental warming, the adjacent eastern Pacific exhibits weakly negative trends in near-surface air temperature (2 m), although the signal is relatively small in magnitude and statistically less robust in some regions. This cooling tendency is consistent with mechanisms linked to the Peru–Chile upwelling system, where stronger trade winds can enhance Ekman divergence and promote the upwelling of cold subsurface waters along the coast (Bakun 1990; Wang et al. 2015). Such ocean–atmosphere coupling may be further reinforced by a more stable lower troposphere that favors the persistence of stratocumulus decks, increasing surface albedo and amplifying local cooling (Klein and Hartmann 1993; Zheng et al. 2011). While these processes provide a plausible explanation for localized cooling adjacent to South America, caution is warranted: the signal is weak, spatially heterogeneous, and may partly reflect internal variability such as decadal modes of Pacific SST fluctuations, in addition to limited observational coverage. This combination reduces confidence in the robustness of the detected trends, in stark contrast to the strong and statistically significant warming observed inland.
The observed declines in precipitation across central and southern South America, particularly over the Amazon, Cerrado, Pantanal, and northern Argentina, are consistent with recent evidence highlighting the intensification of compound extremes in the continent. Feron et al. (2024) demonstrate that such drying and warming trends have translated into a sharp escalation of hot, dry, and high fire-risk days, with a threefold increase in the frequency of compound extremes in key hotspots such as the northern Amazon and the Gran Chaco. Similarly, Marengo et al. (2025) report a growing incidence of heatwaves and prolonged droughts in Brazil, underscoring the combined pressures of rising temperatures and diminishing rainfall on ecological systems and water resources. Together, these convergent findings indicate that South America is not only undergoing gradual climatic changes but is entering a regime of intensified compound extremes that threaten ecosystem resilience, water security, and human well-being.
Our analyses reveal widespread but spatially heterogeneous warming across South American capitals. Both Tmax and Tmin increased significantly, although Tmax trends are generally stronger, exceeding 0.35 °C decade⁻¹ in Asunción, La Paz, Brasília, and Caracas. In contrast, Lima and Bogotá display weak or statistically insignificant Tmax warming, highlighting strong local modulation. This heterogeneity is consistent with continental-scale assessments of temperature extremes (Vincent et al. 2005; Skansi et al. 2013). A clear diurnal asymmetry is observed, with daytime warming generally stronger than nighttime warming in most cities, consistent with global evidence of a renewed increase in diurnal temperature range since the 1980s (Huang et al. 2023). Local controls explain notable exceptions: Lima’s subdued Tmax trend is associated with coastal upwelling and persistent stratus cloud cover (Aliaga-Nestares et al. 2023), whereas Bogotá’s modest warming reflects its high elevation and frequent cloudiness. In addition, urbanization further enhances Tmax through urban heat island effects (Oke 1982).
Precipitation exhibits a pronounced meridional dipole. Drying trends dominate central and southern capitals (e.g., −11.32 mm decade⁻¹ in Asunción, −8.66 mm in Brasília), consistent with recent severe droughts in Brazil and the Pantanal (Marengo et al. 2021a; Lopes Ribeiro et al. 2020). In contrast, northern capitals such as Paramaribo, Georgetown, and Caracas display significant increases, reflecting shifts in the Intertropical Convergence Zone (ITCZ) and the South Atlantic Convergence Zone in response to ocean warming and anthropogenic forcing (Campos et al. 2022) . This spatial pattern represents a temporal shift relative to earlier studies that reported wetter conditions in southern South America during the late 20th century (Liebmann et al. 2004). In sum, South American capitals illustrate the dual fingerprint of climate change: robust yet uneven warming, coupled with a marked reorganization of rainfall patterns, characterized by drying in the tropics and subtropics and increased precipitation near the equator. These shifts carry far-reaching implications for water security, agricultural productivity, and urban resilience.
Across Brazil’s biomes, progressive warming has been a pervasive feature during 1979–2024, with Tmax trends varying notably among biomes. The Pantanal exhibits the strongest warming at 0.51 °C decade⁻¹, whereas the Pampa shows the weakest trend at 0.20 °C decade⁻¹, and the remaining biomes fall between 0.31 and 0.38 °C decade⁻¹. This warming pattern, although showing different magnitudes due to variations in data types, analytical methods, and time periods, has also been observed in other studies across various Brazilian biomes (Victoria et al. 1998; Marengo and others 2018; Marengo et al. 2022; Braga and Laurini 2024b). Precipitation trends, in contrast, reveal marked spatial and temporal heterogeneity. Previous studies also indicate that soil moisture responses are highly uneven, with pronounced drying in regions such as the eastern Amazonia–Cerrado transition, while other areas exhibit stable or even increasing soil moisture (Lopes Ribeiro et al. 2020; Marengo et al. 2022; Braga and Laurini 2024a). These findings underscore that long-term hydroclimatic responses are neither uniform nor linear, highlighting the need for biome-specific analyses to disentangle the mechanisms driving regional climate variability and change.
Previous studies indicate that the Amazon has not exhibited a significant long-term trend in precipitation (Marengo et al. 2024), nor have soil moisture data shown consistent trends, although sharp reductions occurred during recent droughts (e.g., 2013–2015) (Ribeiro et al. 2020; Rossi et al. 2023). In line with these findings, our results suggest that precipitation trends in the Amazon biome generally remain low (around -2.75 mm decade⁻¹). The minimum precipitation in the Amazon Biome in 2023 reveals the extreme drought that occurred in the region (Espinoza et al. 2024), further illustrating the recurrence of severe dry events despite the absence of a clear long-term trend. Evidence from the literature suggests that deforestation and forest degradation can disrupt local hydrology by reducing evapotranspiration and moisture recycling, potentially weakening convective rainfall and increasing drought risk, particularly in the southern and eastern Amazon (Souza et al. 2019; Staal et al. 2020; Marengo et al. 2022; Caballero et al. 2022). Recent studies further indicate that while deforestation contributes to regional drying, global climate change appears to be the dominant driver of recent hydroclimatic shifts, with deforestation acting as a reinforcing feedback (Staal et al. 2020).
In the Caatinga, the long-term drying trend of approximately –3.06 mm decade⁻¹ found in our results is consistent with mechanisms described in the literature. Previous studies have shown that rainfall variability in Northeast Brazil is strongly influenced by shifts in tropical Atlantic sea surface temperature gradients, which modulate the position of the Intertropical Convergence Zone (Marengo et al. 2017; Nobre and Shukla 1996). While our study does not directly analyze ocean–atmosphere dynamics, the persistence of such mechanisms under global warming provides a plausible explanation for the sustained precipitation deficits observed across the semiarid Caatinga biome.
Our study shows that over the past 4.5 decades, the Pantanal and Cerrado have experienced a concurrent climatic and hydrological trend characterized by warming and aridification. This pattern is marked by reduced water availability, rising temperatures, and intensification of droughts, driven by the interaction between climate change and extensive land-use transformations (Marengo et al. 2021a, 2022). Deforestation, dam construction, and agricultural expansion have disrupted hydrological connectivity, weakening the seasonal flood pulses that sustain biodiversity in the Pantanal and diminishing the regenerative capacity of Cerrado headwaters that supply its wetlands (Lázaro et al. 2020). These alterations generate reinforcing feedbacks of vegetation loss, soil desiccation, and fire vulnerability, leading to habitat degradation, declining agro-pastoral productivity, and the erosion of ecosystem services such as water and climate regulation (Alho 2008; Alho et al. 2019). The resulting socioecological impacts are profound: endemic species face shrinking habitats, traditional communities lose the subsistence tied to natural flood cycles, and regional economies suffer under recurring fires and declining agricultural yields (Alho 2011b; Arruda Botelho et al. 2025; Alho 2011a). Together, these interlinked processes underscore the urgency of coordinated conservation and sustainable management to preserve the ecological integrity and human well-being of these globally significant biomes.
The Atlantic Forest, spanning much of Brazil’s coastline and hosting major metropolitan centers such as São Paulo, Rio de Janeiro, Salvador, Recife, and Porto Alegre, concentrates nearly 70% of the country’s population (Rezende et al. 2018). This demographic weight explains why it is also the most studied Brazilian biome, accounting for 39% of research efforts (Malecha et al. 2025). High population density directly shapes long-term climate trends through multiple pathways, including greenhouse gas emissions, rapid urbanization and heat island effects, loss of native forest, and intensified demand for energy and water (Da Mata et al. 2007; Seto et al. 2012; Oliveira et al. 2020; De Lima et al. 2020; Duarte et al. 2021). For this global biodiversity hotspot, already reduced to a fraction of its original extent, only about 28% of its original vegetation remains (Rezende et al. 2018). Consistent with previous findings, our results also indicate a pronounced rise in temperatures accompanied by a decline in precipitation across the Atlantic Forest, reinforcing the notion that these climatic shifts act as a threat multiplier (Anjos et al., 2021). In practice, higher temperatures increase evapotranspiration rates while reduced rainfall limits water recharge, intensifying drought stress in fragmented remnants, heightening wildfire risk, and undermining both carbon storage and hydrological services essential for densely populated regions.
In the Pampa biome, our results reveal a consistent warming and drying trend that threatens the productivity of native pastures and the sustainability of local livestock systems, while also posing risks to the region’s unique biodiversity. Recent studies (Braga and Laurini 2024) reinforce this vulnerability, highlighting that the observed increases in both maximum and minimum temperatures enhance evapotranspiration and plant heat stress. Such processes are likely to disrupt phenological cycles and alter species dynamics, with potentially far-reaching ecological and socioeconomic consequences.
The use of ERA5, while highly valuable for climate research, involves uncertainties that warrant cautious interpretation. Previous studies (Vega-Durán et al. 2021; Hassler and Lauer 2021; Balmaceda-Huarte et al. 2021; Lavers et al. 2022; Jahn et al. 2025) have identified regional biases, particularly in sparsely observed areas such as the Amazon and the Andes, as well as systematic tendencies to overestimate Tmin and underestimate Tmax across South America (Rozante et al. 2022). Furthermore, large-scale spatial averaging may obscure important local variability. Future work should integrate ground-based observations and multiple reanalysis products to better constrain these uncertainties and strengthen the reliability of climate assessments.
5. Conclusions
Long-term trends in Tmax and Tmin, as well as precipitation across South America, its capital cities, and Brazilian biomes were investigated using ERA5 reanalysis from ECMWF for the period 1979–2024. To ensure statistical robustness, seasonal cycles were removed via STL, and trend estimates were derived using ordinary least squares (for temperature) and Mann–Kendall with Theil–Sen slope estimators corrected for autocorrelation following Yue–Wang (for precipitation). Results reveal a pervasive and spatially robust warming across South America, with Tmax increasing more strongly than Tmin. Precipitation exhibits a dipole pattern: drying in the continental interior and southern regions, and rainfall increases in the far north associated with the Intertropical Convergence Zone (ITCZ).
In major capitals, the warming signal is unequivocal though heterogeneous. Significant increases in Tmax exceeding ~0.35 °C decade⁻¹ are observed in Asunción, La Paz, Brasília, and Caracas, while Lima and Bogotá display weaker trends. Precipitation changes mirror the continental dipole, with drying in central–southern cities (−11.32 mm/decade in Asunción; −8.66 mm/decade in Brasília) and increases in northern capitals such as Paramaribo, Georgetown, and Caracas. Among Brazilian biomes, the Pantanal emerges as the most vulnerable hotspot, with pronounced warming (Tmax ≈ 0.51 °C/decade) and severe rainfall decline (≈ −10.45 mm/decade). The Cerrado also exhibits strong warming and drying (≈ −7.92 mm/decade). In the Amazon, Tmax increases by ~0.35 °C/decade and Tmin by ~0.16 °C/decade, accompanied by modest rainfall reduction (≈ −2.75 mm/decade). Both the Caatinga and Atlantic Forest show rainfall losses (≈ −3.06 and −5.60 mm/decade, respectively), whereas the Pampa records the weakest warming (Tmax ≈ 0.20 °C/decade) but still a notable decline in precipitation (≈ −4.09 mm/decade).
These patterns indicate mounting risks to ecosystems, water security, and agricultural productivity, with adaptation priorities in the Pantanal and Cerrado. Mechanistically, the asymmetry between Tmax and Tmin is consistent with reduced cloudiness and precipitation, enhanced solar radiation, and limited evaporative cooling, leading to an expansion of diurnal temperature range under drier, clearer-sky conditions. The results suggest a transition towards more frequent compound extremes of heat, drought, and fire. This underscores the urgency of integrated adaptation strategies encompassing water management, land use, and biodiversity conservation, alongside sustained mitigation efforts, particularly in regions where warming and drying converge.
Author Contributions
Acquisition and processing of data, J.R.R.; statistical calculations, J.R.R.; preparation of the graphical abstract and figures, G.R.; writing of the manuscript and discussion of results, J.R.R. and I.F.C.; language revision, I.F.C. and G.R. All authors have read and agreed to the published version of the manuscript.
Acknowledgments
The authors acknowledge the financial support of the Georeferenced Information Base Project (BIG) of INPE, funded by the National Fund for Scientific and Technological Development (FNDCT), with financial collaboration from the Funding Authority for Studies and Projects (FINEP) and the Foundation for Science, Applications, and Space Technology (FUNCATE), “No. 01.22.0504.00.”.
Declaration of Generative AI and AI-assisted Technologies in the Writing Process
During the preparation of this work, the authors used ChatGPT (OpenAI) to improve the clarity and accuracy of the English language. After using this tool, the authors reviewed and edited the content as needed, and take full responsibility for the final version of the manuscript.
References
- Abbass, K., M. Z. Qasim, H. Song, M. Murshed, H. Mahmood, and I. Younis, 2022: A review of the global climate change impacts, adaptation, and sustainable mitigation measures. Environ. Sci. Pollut. Res., 29, 42539–42559. [CrossRef]
- Adom, P. K., 2024: The socioeconomic impact of climate change in developing countries over the next decades: A literature survey. Heliyon, 10, e35134. [CrossRef]
- Alho, C., 2011a: Biodiversity of the Pantanal: its magnitude, human occupation, environmental threats and challenges for conservation. Braz. J. Biol., 71, 229–232. [CrossRef]
- Alho, C. J. R., S. B. Mamede, M. Benites, B. S. Andrade, and J. J. O. Sepúlveda, 2019: THREATS TO THE BIODIVERSITY OF THE BRAZILIAN PANTANAL DUE TO LAND USE AND OCCUPATION. Ambiente Soc., 22, e01891. [CrossRef]
- Alho, Cjr., 2008: Biodiversity of the Pantanal: response to seasonal flooding regime and to environmental degradation. Braz. J. Biol., 68, 957–966. [CrossRef]
- ——, 2011b: Concluding remarks: overall impacts on biodiversity and future perspectives for conservation in the Pantanal biome. Braz. J. Biol., 71, 337–341. [CrossRef]
- Aliaga-Nestares, V., G. De La Cruz, and K. Takahashi, 2023: Comparison between the Operational and Statistical Daily Maximum and Minimum Temperature Forecasts on the Central Coast of Peru. Weather Forecast., 38, 555–570. [CrossRef]
- Ambrizzi, T., and S. E. T. Ferraz, 2015: An objective criterion for determining the South Atlantic Convergence Zone. Front. Environ. Sci., 3. [CrossRef]
- Arruda Botelho, M. T. D., R. Morais Chiaravalloti, and C. Niel Berlinck, 2025: Brincando com fogo: a influência vital do conhecimento tradicional na sociobiodiversidade do Pantanal. Biodiversidade Bras., 14, 155–168. [CrossRef]
- Bakun, A., 1990: Global Climate Change and Intensification of Coastal Ocean Upwelling. Science, 247, 198–201. [CrossRef]
- Balmaceda-Huarte, R., M. E. Olmo, M. L. Bettolli, and M. M. Poggi, 2021: Evaluation of multiple reanalyses in reproducing the spatio-temporal variability of temperature and precipitation indices over southern South America. Int. J. Climatol., 41, 5572–5595. [CrossRef]
- Bazzanela, A. C., W. Luiz-Silva, J. Neres, J. R. França, L. Menezes, and F. Polifke, 2025: Assessing temperature and water vapor in the atmospheric column over South America: a synopsis of identified trends using ERA5 reanalysis. J. Atmospheric Sol.-Terr. Phys., 271, 106514. [CrossRef]
- Braga, A., and M. Laurini, 2024a: Spatial heterogeneity in climate change effects across Brazilian biomes. Sci. Rep., 14, 16414. [CrossRef]
- ——, and ——, 2024b: Spatial heterogeneity in climate change effects across Brazilian biomes. Sci. Rep., 14, 16414. [CrossRef]
- Calvin, K., and Coauthors, 2023: IPCC, 2023: Climate Change 2023: Synthesis Report. Contribution of Working Groups I, II and III to the Sixth Assessment Report of the Intergovernmental Panel on Climate Change [Core Writing Team, H. Lee and J. Romero (eds.)]. IPCC, Geneva, Switzerland. First. Intergovernmental Panel on Climate Change (IPCC), accessed July 31, 2025. [CrossRef]
- Campos, M. C., and Coauthors, 2022: South American precipitation dipole forced by interhemispheric temperature gradient. Sci. Rep., 12, 10527. [CrossRef]
- Castro, A. A. D., C. Von Randow, R. D. C. S. Von Randow, and F. G. S. Bezerra, 2022: Evaluating carbon and water fluxes and stocks in Brazil under changing climate and refined regional scenarios for changes in land use. Front. Clim., 4, 941900. [CrossRef]
- Chai, K.-C., X.-R. Ma, Y. Yang, Y.-J. Lu, and K.-C. Chang, 2022: The impact of climate change on population urbanization: Evidence from china. Front. Environ. Sci., 10, 945968. [CrossRef]
- Cooney, C. M., 2012: Downscaling Climate Models: Sharpening the Focus on Local-Level Changes. Environ. Health Perspect., 120. [CrossRef]
- Cleveland, R. B., Cleveland, W. S., McRae, J. E., & Terpenning, I. (1990). "STL: A Seasonal-Trend Decomposition Procedure Based on Loess." Journal of Official Statistics, 6(1), 3-73.
- Crous, K. Y., J. Uddling, and M. G. De Kauwe, 2022: Temperature responses of photosynthesis and respiration in evergreen trees from boreal to tropical latitudes. New Phytol., 234, 353–374. [CrossRef]
- Da Mata, D., U. Deichmann, J. V. Henderson, S. V. Lall, and H. G. Wang, 2007: Determinants of city growth in Brazil. J. Urban Econ., 62, 252–272. [CrossRef]
- Dagum, E. B., and B. Quenneville, 1993: Dynamic linear models for time series components. J. Econom., 55, 333–351. [CrossRef]
- Dai, A., K. E. Trenberth, and T. R. Karl, 1999: Effects of Clouds, Soil Moisture, Precipitation, and Water Vapor on Diurnal Temperature Range. J. Clim., 12, 2451–2473. [CrossRef]
- De Araújo, G. R. G., A. Frassoni, L. F. Sapucci, D. Bitencourt, and F. A. De Brito Neto, 2022: Climatology of heatwaves in South America identified through ERA5 reanalysis data. Int. J. Climatol., 42, 9430–9448. [CrossRef]
- De Lima, R. A. F., A. A. Oliveira, G. R. Pitta, A. L. De Gasper, A. C. Vibrans, J. Chave, H. Ter Steege, and P. I. Prado, 2020: The erosion of biodiversity and biomass in the Atlantic Forest biodiversity hotspot. Nat. Commun., 11, 6347. [CrossRef]
- Duarte, G. T., J. C. Assis, R. A. D. Silva, and A. P. D. Turetta, 2021: Interconnections among rural practices and Food-Water-Energy Security Nexus in the Atlantic Forest biome. Rev. Bras. Ciênc. Solo, 45, e0210010. [CrossRef]
- Espinoza, J.-C., J. C. Jimenez, J. A. Marengo, J. Schongart, J. Ronchail, W. Lavado-Casimiro, and J. V. M. Ribeiro, 2024: The new record of drought and warmth in the Amazon in 2023 related to regional and global climatic features. Sci. Rep., 14, 8107. [CrossRef]
- Feron, S., and Coauthors, 2024a: South America is becoming warmer, drier, and more flammable. Commun. Earth Environ., 5, 501. [CrossRef]
- Findley, D. F., Monsell, B. C., Bell, W. R., Otto, M. C., Chen, B. (1998). “New capabilities and methods of the X12-ARIMA seasonal adjustment program.” Journal of Business and Economic Statistics, 16(2).
- ——, and Coauthors, 2024b: South America is becoming warmer, drier, and more flammable. Commun. Earth Environ., 5, 501. [CrossRef]
- Forster, P. M., and Coauthors, 2025: Indicators of Global Climate Change 2024: annual update of key indicators of the state of the climate system and human influence. Earth Syst. Sci. Data, 17, 2641–2680. [CrossRef]
- Gebrechorkos, S., and Coauthors, 2023: A high-resolution daily global dataset of statistically downscaled CMIP6 models for climate impact analyses. Sci. Data, 10, 611. [CrossRef]
- Gelaro, R., and Coauthors, 2017: The Modern-Era Retrospective Analysis for Research and Applications, Version 2 (MERRA-2). J. Clim., 30, 5419–5454. [CrossRef]
- Gomes, M. S., I. F. D. A. Cavalcanti, and G. V. Müller, 2024: Droughts in Homogeneous Areas of South America and Associated Processes during the Months of Austral Spring and Summer. Adv. Atmospheric Sci., 41, 2337–2353. [CrossRef]
- Grimm, N. B., and Coauthors, 2013: The impacts of climate change on ecosystem structure and function. Front. Ecol. Environ., 11, 474–482. [CrossRef]
- Hansen, J. and others, 2006: Global temperature change. PNAS. [CrossRef]
- Hassler, B., and A. Lauer, 2021: Comparison of Reanalysis and Observational Precipitation Datasets Including ERA5 and WFDE5. Atmosphere, 12, 1462. [CrossRef]
- He, B., L. Huang, and Q. Wang, 2015: Precipitation deficits increase high diurnal temperature range extremes. Sci. Rep., 5, 12004. [CrossRef]
- Hersbach, H., and Coauthors, 2020a: The ERA5 global reanalysis. Q. J. R. Meteorol. Soc., 146, 1999–2049. [CrossRef]
- ——, and Coauthors, 2020b: The ERA5 global reanalysis. Q. J. R. Meteorol. Soc., 146, 1999–2049. [CrossRef]
- Hofmann, G. S., and Coauthors, 2023: Changes in atmospheric circulation and evapotranspiration are reducing rainfall in the Brazilian Cerrado. Sci. Rep., 13, 11236. [CrossRef]
- Huang, X., R. J. H. Dunn, L. Z. X. Li, T. R. McVicar, C. Azorin-Molina, and Z. Zeng, 2023: Increasing Global Terrestrial Diurnal Temperature Range for 1980–2021. Geophys. Res. Lett., 50, e2023GL103503. [CrossRef]
- Huffman, G. J., D. T. Bolvin, D. Braithwaite, K. Hsu, R. Joyce, P. Xie, and S. H. Yoo, 2015: NASA global precipitation measurement (GPM) integrated multi-satellite retrievals for GPM (IMERG). Algorithm theoretical basis document (ATBD) version, v. 4, n. 26, p. 2020-05.
- Intergovernmental Panel On Climate Change (Ipcc), 2023: Climate Change 2021 – The Physical Science Basis: Working Group I Contribution to the Sixth Assessment Report of the Intergovernmental Panel on Climate Change. 1st ed. Cambridge University Press. [CrossRef]
- IPCC, 2023: AR6 Synthesis Report. [CrossRef]
- Jahn, S., K. A. M. Gaythorpe, C. M. Wainwright, and N. M. Ferguson, 2025: Evaluation of the Performance and Utility of Global Gridded Precipitation Products for Health Applications and Impact Assessments in South America. GeoHealth, 9, e2024GH001260. [CrossRef]
- Jones, P. D., and A. Moberg, 2003: Surface air temperature variations: 1851–2001. J. Geophys. Res. Atmospheres. [CrossRef]
- Justice, C. O., J. R. G. Townshend, E. F. Vermote, E. Masuoka, R. E. Wolfe, N. Saleous, D. P. Roy, and J. T. Morisette, 2002: An overview of MODIS Land data processing and product status. Remote Sens. Environ., 83, 3–15. [CrossRef]
- Keune, J., and D. G. Miralles, 2019: A Precipitation Recycling Network to Assess Freshwater Vulnerability: Challenging the Watershed Convention. Water Resour. Res., 55, 9947–9961. [CrossRef]
- Klein, S. A., and D. L. Hartmann, 1993: The Seasonal Cycle of Low Stratiform Clouds. J. Clim., 6, 1587–1606. [CrossRef]
- Kobayashi, S., and Coauthors, 2015: The JRA-55 Reanalysis: General Specifications and Basic Characteristics. J. Meteorol. Soc. Jpn. Ser II, 93, 5–48. [CrossRef]
- Kummerow, C., W. Barnes, T. Kozu, J. Shiue, and J. Simpson, 1998: The Tropical Rainfall Measuring Mission (TRMM) Sensor Package. J. Atmospheric Ocean. Technol., 15, 809–817. [CrossRef]
- Lavers, D. A., A. Simmons, F. Vamborg, and M. J. Rodwell, 2022: An evaluation of ERA5 precipitation for climate monitoring. Q. J. R. Meteorol. Soc., 148, 3152–3165. [CrossRef]
- Lázaro, W. L., E. S. Oliveira-Júnior, C. J. D. Silva, S. K. I. Castrillon, and C. C. Muniz, 2020: Climate change reflected in one of the largest wetlands in the world: an overview of the Northern Pantanal water regime. Acta Limnol. Bras., 32, e104. [CrossRef]
- Leal Filho, W., M. A. P. Dinis, M. A. Canova, M. Cataldi, G. A. S. Da Costa, A. Enrich-Prast, E. Symeonakis, and F. Q. Brearley, 2025: Managing ecosystem services in the Brazilian Amazon: the influence of deforestation and forest degradation in the world’s largest rain forest. Geosci. Lett., 12, 24. [CrossRef]
- Liebmann, B., and Coauthors, 2004: An Observed Trend in Central South American Precipitation. J. Clim., 17, 4357–4367. [CrossRef]
- Lopes Ribeiro, F., M. Guevara, A. Vázquez-Lule, A. P. Cunha, M. Zeri, and R. Vargas, 2020: The Impact of Drought on Soil Moisture Trends across Brazilian Biomes. [CrossRef]
- Lopez-Gomez, I., Z. Y. Wan, L. Zepeda-Núñez, T. Schneider, J. Anderson, and F. Sha, 2025: Dynamical-generative downscaling of climate model ensembles. Proc. Natl. Acad. Sci., 122, e2420288122. [CrossRef]
- Luna-Aranguré, C., F. Estrada, J. A. Velasco, O. Calderón-Bustamante, and C. Gonzalez-Salazar, 2025: Environmental exposure of terrestrial biomes to global climate change: An n -dimensional approach. Ecosphere, 16, e70262. [CrossRef]
- Lyra, A. D. A., S. C. Chou, and G. D. O. Sampaio, 2016: Sensitivity of the Amazon biome to high resolution climate change projections. Acta Amaz., 46, 175–188. [CrossRef]
- Malecha, A., and M. M. Vale, 2024: As mudanças climáticas e a biodiversidade. Ciênc. E Cult., 76, 1–9. [CrossRef]
- ——, S. Manes, and M. M. Vale, 2025: Climate change and biodiversity in Brazil: What we know, what we don’t, and Paris Agreement’s risk reduction potential. Perspect. Ecol. Conserv., 23, 77–84. [CrossRef]
- Mann, H. B., 1945: Nonparametric Tests Against Trend. Econometrica, 13, 245. [CrossRef]
- Marengo, J. A. and others, 2018: Amazon climate and land use. Reg. Environ. Change. [CrossRef]
- Marengo, J. A., R. R. Torres, and L. M. Alves, 2017: Drought in Northeast Brazil—past, present, and future. Theor. Appl. Climatol., 129, 1189–1200. [CrossRef]
- ——, and Coauthors, 2021a: Extreme Drought in the Brazilian Pantanal in 2019–2020: Characterization, Causes, and Impacts. Front. Water, 3, 639204. [CrossRef]
- ——, P. I. Camarinha, L. M. Alves, F. Diniz, and R. A. Betts, 2021b: Extreme Rainfall and Hydro-Geo-Meteorological Disaster Risk in 1.5, 2.0, and 4.0°C Global Warming Scenarios: An Analysis for Brazil. Front. Clim., 3, 610433. [CrossRef]
- Marengo, J. A., J. C. Jimenez, J.-C. Espinoza, A. P. Cunha, and L. E. O. Aragão, 2022: Increased climate pressure on the agricultural frontier in the Eastern Amazonia–Cerrado transition zone. Sci. Rep., 12, 457. [CrossRef]
- Marengo, J. A., J.-C. Espinoza, R. Fu, J. C. Jimenez Muñoz, L. M. Alves, H. R. Da Rocha, and J. Schöngart, 2024: Long-term variability, extremes and changes in temperature and hydrometeorology in the Amazon region: A review. Acta Amaz., 54, e54es22098. [CrossRef]
- Marengo, J. A., and Coauthors, 2025: Climatological patterns of heatwaves during winter and spring 2023 and trends for the period 1979–2023 in central South America. Front. Clim., 7, 1529082. [CrossRef]
- Nobre, P., and J. Shukla, 1996: Variations of Sea Surface Temperature, Wind Stress, and Rainfall over the Tropical Atlantic and South America. J. Clim., 9, 2464–2479. [CrossRef]
- Oke, T. R., 1982: The energetic basis of the urban heat island. Q. J. R. Meteorol. Soc., 108, 1–24. [CrossRef]
- Oliveira, P. P. A., A. Berndt, A. F. Pedroso, T. C. Alves, J. R. M. Pezzopane, L. S. Sakamoto, F. L. Henrique, and P. H. M. Rodrigues, 2020: Greenhouse gas balance and carbon footprint of pasture-based beef cattle production systems in the tropical region (Atlantic Forest biome). Animal, 14, s427–s437. [CrossRef]
- Peng, T., and Coauthors, 2023: Changes in Temperature-Precipitation Compound Extreme Events in China During the Past 119 Years. Earth Space Sci., 10, e2022EA002777. [CrossRef]
- Qian, C., X. Zhang, and Z. Li, 2019: Linear trends in temperature extremes in China, with an emphasis on non-Gaussian and serially dependent characteristics. Clim. Dyn., 53, 533–550. [CrossRef]
- Qian, Y., and Coauthors, 2022: Urbanization Impact on Regional Climate and Extreme Weather: Current Understanding, Uncertainties, and Future Research Directions. Adv. Atmospheric Sci., 39, 819–860. [CrossRef]
- Reboita, M. S., and Coauthors, 2021: Impacts of teleconnection patterns on South America climate. Ann. N. Y. Acad. Sci., 1504, 116–153. [CrossRef]
- Rezende, C. L., and Coauthors, 2018: From hotspot to hopespot: An opportunity for the Brazilian Atlantic Forest. Perspect. Ecol. Conserv., 16, 208–214. [CrossRef]
- Rojas-Sánchez, C. E., and R. A. Hernández-Chaverri, 2024: Effect of temperature on water evaporation coefficient (E) in a thermobalance: A solar-driven steam generation approach. Clean Energy Sci. Technol., 2, 188. [CrossRef]
- Rozante, J. R., and G. Rozante, 2024: IMERG V07B and V06B: A Comparative Study of Precipitation Estimates Across South America with a Detailed Evaluation of Brazilian Rainfall Patterns. Remote Sens., 16, 4722. [CrossRef]
- ——, E. Ramirez, and A. de A. Fernandes, 2022: A newly developed South American Mapping of Temperature with estimated lapse rate corrections. Int. J. Climatol., 42, 2135–2152. [CrossRef]
- Ruscica, R. C., C. G. Menéndez, and A. A. Sörensson, 2016: Land surface–atmosphere interaction in future South American climate using a multi-model ensemble. Atmospheric Sci. Lett., 17, 141–147. [CrossRef]
- Sanches, F. H. C., F. R. Martins, W. R. P. Conti, and R. A. Christofoletti, 2023: The increase in intensity and frequency of surface air temperature extremes throughout the western South Atlantic coast. Sci. Rep., 13, 6293. [CrossRef]
- Schultz, N. M., P. J. Lawrence, and X. Lee, 2017: Global satellite data highlights the diurnal asymmetry of the surface temperature response to deforestation. J. Geophys. Res. Biogeosciences, 122, 903–917. [CrossRef]
- Seto, K. C., B. Güneralp, and L. R. Hutyra, 2012: Global forecasts of urban expansion to 2030 and direct impacts on biodiversity and carbon pools. Proc. Natl. Acad. Sci., 109, 16083–16088. [CrossRef]
- Shenoy, S., D. Gorinevsky, K. E. Trenberth, and S. Chu, 2022: Trends of extreme US weather events in the changing climate. Proc. Natl. Acad. Sci., 119, e2207536119. [CrossRef]
- Skansi, M. D. L. M., and Coauthors, 2013: Warming and wetting signals emerging from analysis of changes in climate extreme indices over South America. Glob. Planet. Change, 100, 295–307. [CrossRef]
- Souza, I. F. D., L. D. C. Gomes, E. I. Fernandes, and I. R. D. Silva, 2021: Hierarchical feedbacks of vegetation and soil carbon pools to climate constraints in Brazilian ecosystems. Rev. Bras. Ciênc. Solo, 45, e0210079. [CrossRef]
- Spennemann, P. C., M. Salvia, R. C. Ruscica, A. A. Sörensson, F. Grings, and H. Karszenbaum, 2018: Land-atmosphere interaction patterns in southeastern South America using satellite products and climate models. Int. J. Appl. Earth Obs. Geoinformation, 64, 96–103. [CrossRef]
- Talamoni, I. L., P. Y. Kubota, I. F. A. Cavalcanti, D. C. De Souza, J. C. A. Baker, and R. M. S. P. Vieira, 2024: Numerical assessment of changes in land–atmosphere interactions during the rainy season in South America using an updated vegetation map. Int. J. Climatol., 44, 3278–3294. [CrossRef]
- Tamoffo, A. T., T. Weber, A. A. Akinsanola, and D. A. Vondou, 2023: Projected changes in extreme rainfall and temperature events and possible implications for Cameroon’s socio-economic sectors. Meteorol. Appl., 30, e2119. [CrossRef]
- Thorne, P. W., and R. S. Vose, 2010: Reanalyses for climate trends. Int. J. Climatol. [CrossRef]
- Trenberth, K. E. and others, 2007: IPCC AR4 climate observations. Climate Change 2007: The Physical Science Basis, Cambridge University Press. [CrossRef]
- Trenberth, K. E., A. Dai, R. M. Rasmussen, and D. B. Parsons, 2003: The Changing Character of Precipitation. Bull. Am. Meteorol. Soc., 84, 1205–1218. [CrossRef]
- Vega-Durán, J., B. Escalante-Castro, F. A. Canales, G. J. Acuña, and B. Kaźmierczak, 2021: Evaluation of Areal Monthly Average Precipitation Estimates from MERRA2 and ERA5 Reanalysis in a Colombian Caribbean Basin. Atmosphere, 12, 1430. [CrossRef]
- Victoria, R. L., L. A. Martinelli, J. M. Moraes, M. V. Ballester, A. V. Krusche, G. Pellegrino, R. M. B. Almeida, and J. E. Richey, 1998: Surface Air Temperature Variations in the Amazon Region and Its Borders during This Century. J. Clim., 11, 1105–1110. [CrossRef]
- Vieira, R. M. D. S. P., A. P. M. D. A. Cunha, R. C. D. S. Alvalá, V. C. Carvalho, S. Ferraz Neto, and M. F. Sestini, 2013: Land use and land cover map of a semiarid region of Brazil for meteorological and climatic models. Rev. Bras. Meteorol., 28, 129–138. [CrossRef]
- Vincent, L. A., and Coauthors, 2005: Observed Trends in Indices of Daily Temperature Extremes in South America 1960–2000. J. Clim., 18, 5011–5023. [CrossRef]
- Wang, D., T. C. Gouhier, B. A. Menge, and A. R. Ganguly, 2015: Intensification and spatial homogenization of coastal upwelling under climate change. Nature, 518, 390–394. [CrossRef]
- Weiskopf, S. R., and Coauthors, 2020: Climate change effects on biodiversity, ecosystems, ecosystem services, and natural resource management in the United States. Sci. Total Environ., 733, 137782. [CrossRef]
- Wild, M., and Coauthors, 2005: From Dimming to Brightening: Decadal Changes in Solar Radiation at Earth’s Surface. Science, 308, 847–850. [CrossRef]
- Wu, M., B. Smith, G. Schurgers, A. Ahlström, and M. Rummukainen, 2021: Vegetation-Climate Feedbacks Enhance Spatial Heterogeneity of Pan-Amazonian Ecosystem States Under Climate Change. Geophys. Res. Lett., 48, e2020GL092001. [CrossRef]
- Xu, L., N. Chen, H. Moradkhani, X. Zhang, and C. Hu, 2020: Improving Global Monthly and Daily Precipitation Estimation by Fusing Gauge Observations, Remote Sensing, and Reanalysis Data Sets. Water Resour. Res., 56, e2019WR026444. [CrossRef]
- Yue, S., and C. Wang, 2004: The Mann-Kendall Test Modified by Effective Sample Size to Detect Trend in Serially Correlated Hydrological Series. Water Resour. Manag., 18, 201–218. [CrossRef]
- Zhao, Q., and Coauthors, 2023: Relationships of temperature and biodiversity with stability of natural aquatic food webs. Nat. Commun., 14, 3507. [CrossRef]
- Zheng, Y., T. Shinoda, J.-L. Lin, and G. N. Kiladis, 2011: Sea Surface Temperature Biases under the Stratus Cloud Deck in the Southeast Pacific Ocean in 19 IPCC AR4 Coupled General Circulation Models. J. Clim., 24, 4139–4164. [CrossRef]
- Zhong, Z., and Coauthors, 2023: Reversed asymmetric warming of sub-diurnal temperature over land during recent decades. Nat. Commun., 14, 7189. [CrossRef]
- Zhou, L., R. E. Dickinson, Y. Tian, R. S. Vose, and Y. Dai, 2007: Impact of vegetation removal and soil aridation on diurnal temperature range in a semiarid region: Application to the Sahel. Proc. Natl. Acad. Sci., 104, 17937–17942. [CrossRef]
Figure 1.
Brazilian biomes across South America (colored areas) and national capitals (black dots with ISO codes).
Figure 1.
Brazilian biomes across South America (colored areas) and national capitals (black dots with ISO codes).
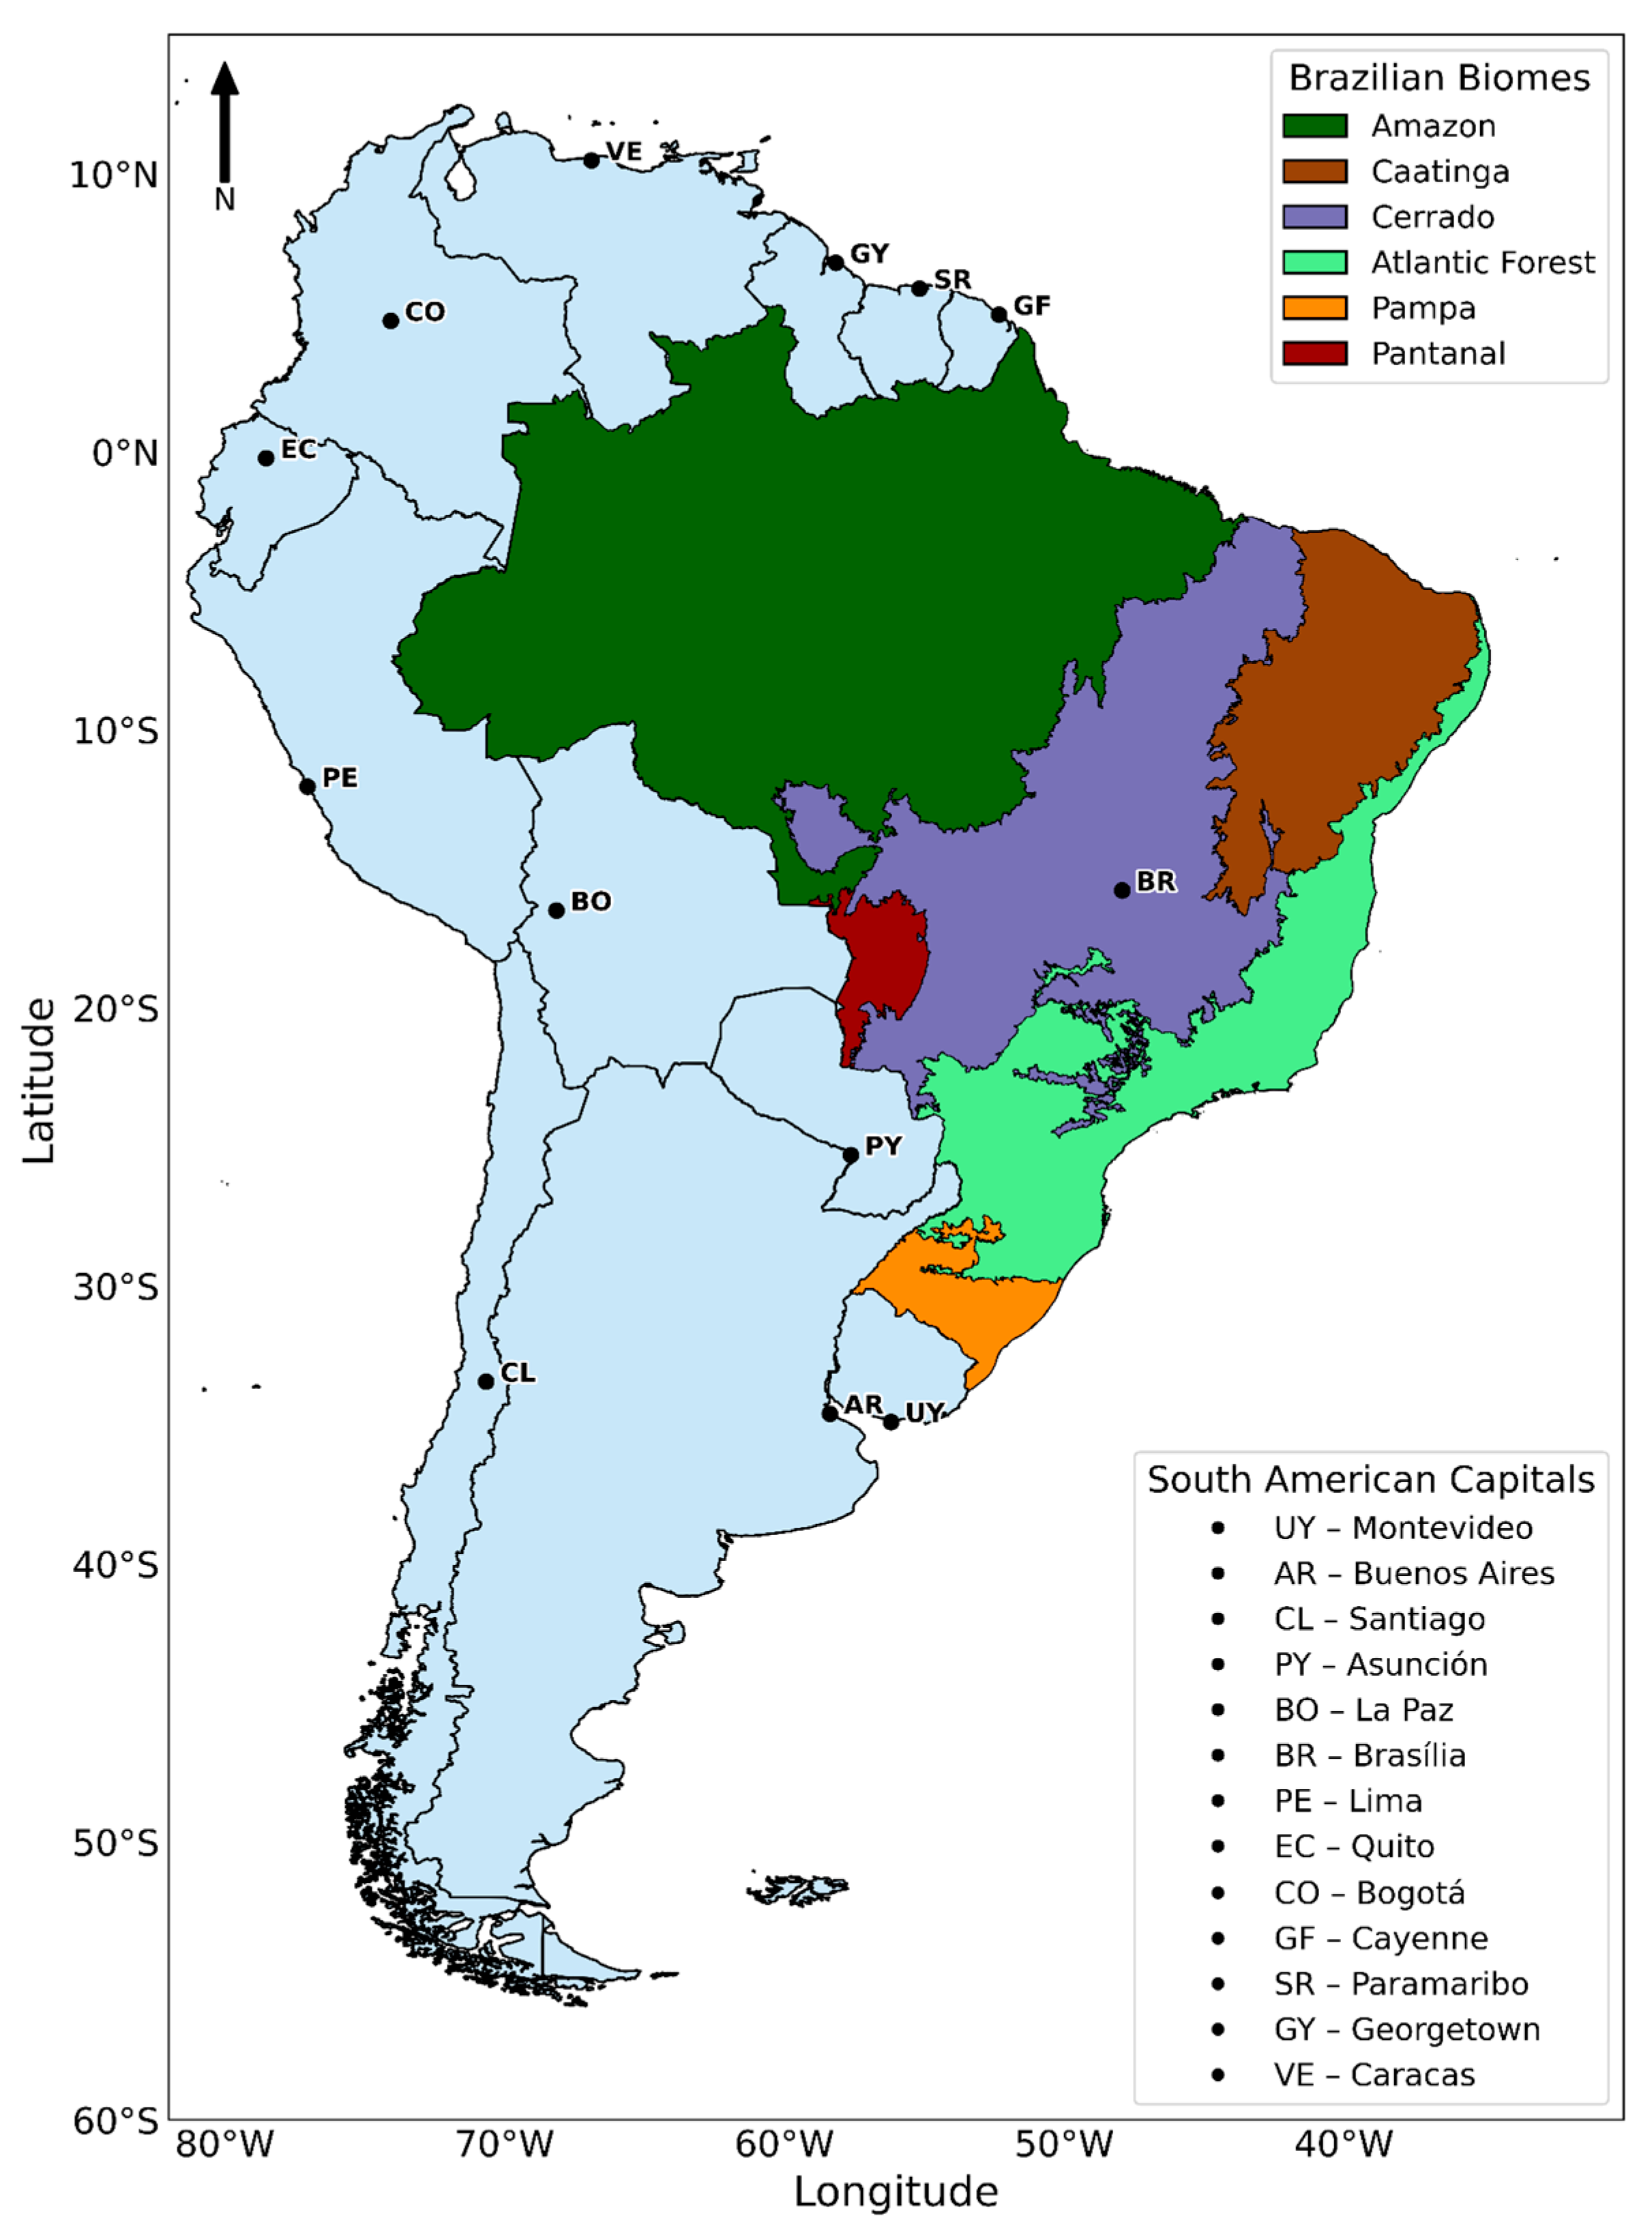
Figure 2.
Long-term trends (shaded) and statistical significance (hatched) for Tmax(a), Tmin (b), and precipitation (c). Hatching indicates areas where trends are not significant at the 95% confidence level. Black line contours over Brazil represent the division of biomes.
Figure 2.
Long-term trends (shaded) and statistical significance (hatched) for Tmax(a), Tmin (b), and precipitation (c). Hatching indicates areas where trends are not significant at the 95% confidence level. Black line contours over Brazil represent the division of biomes.
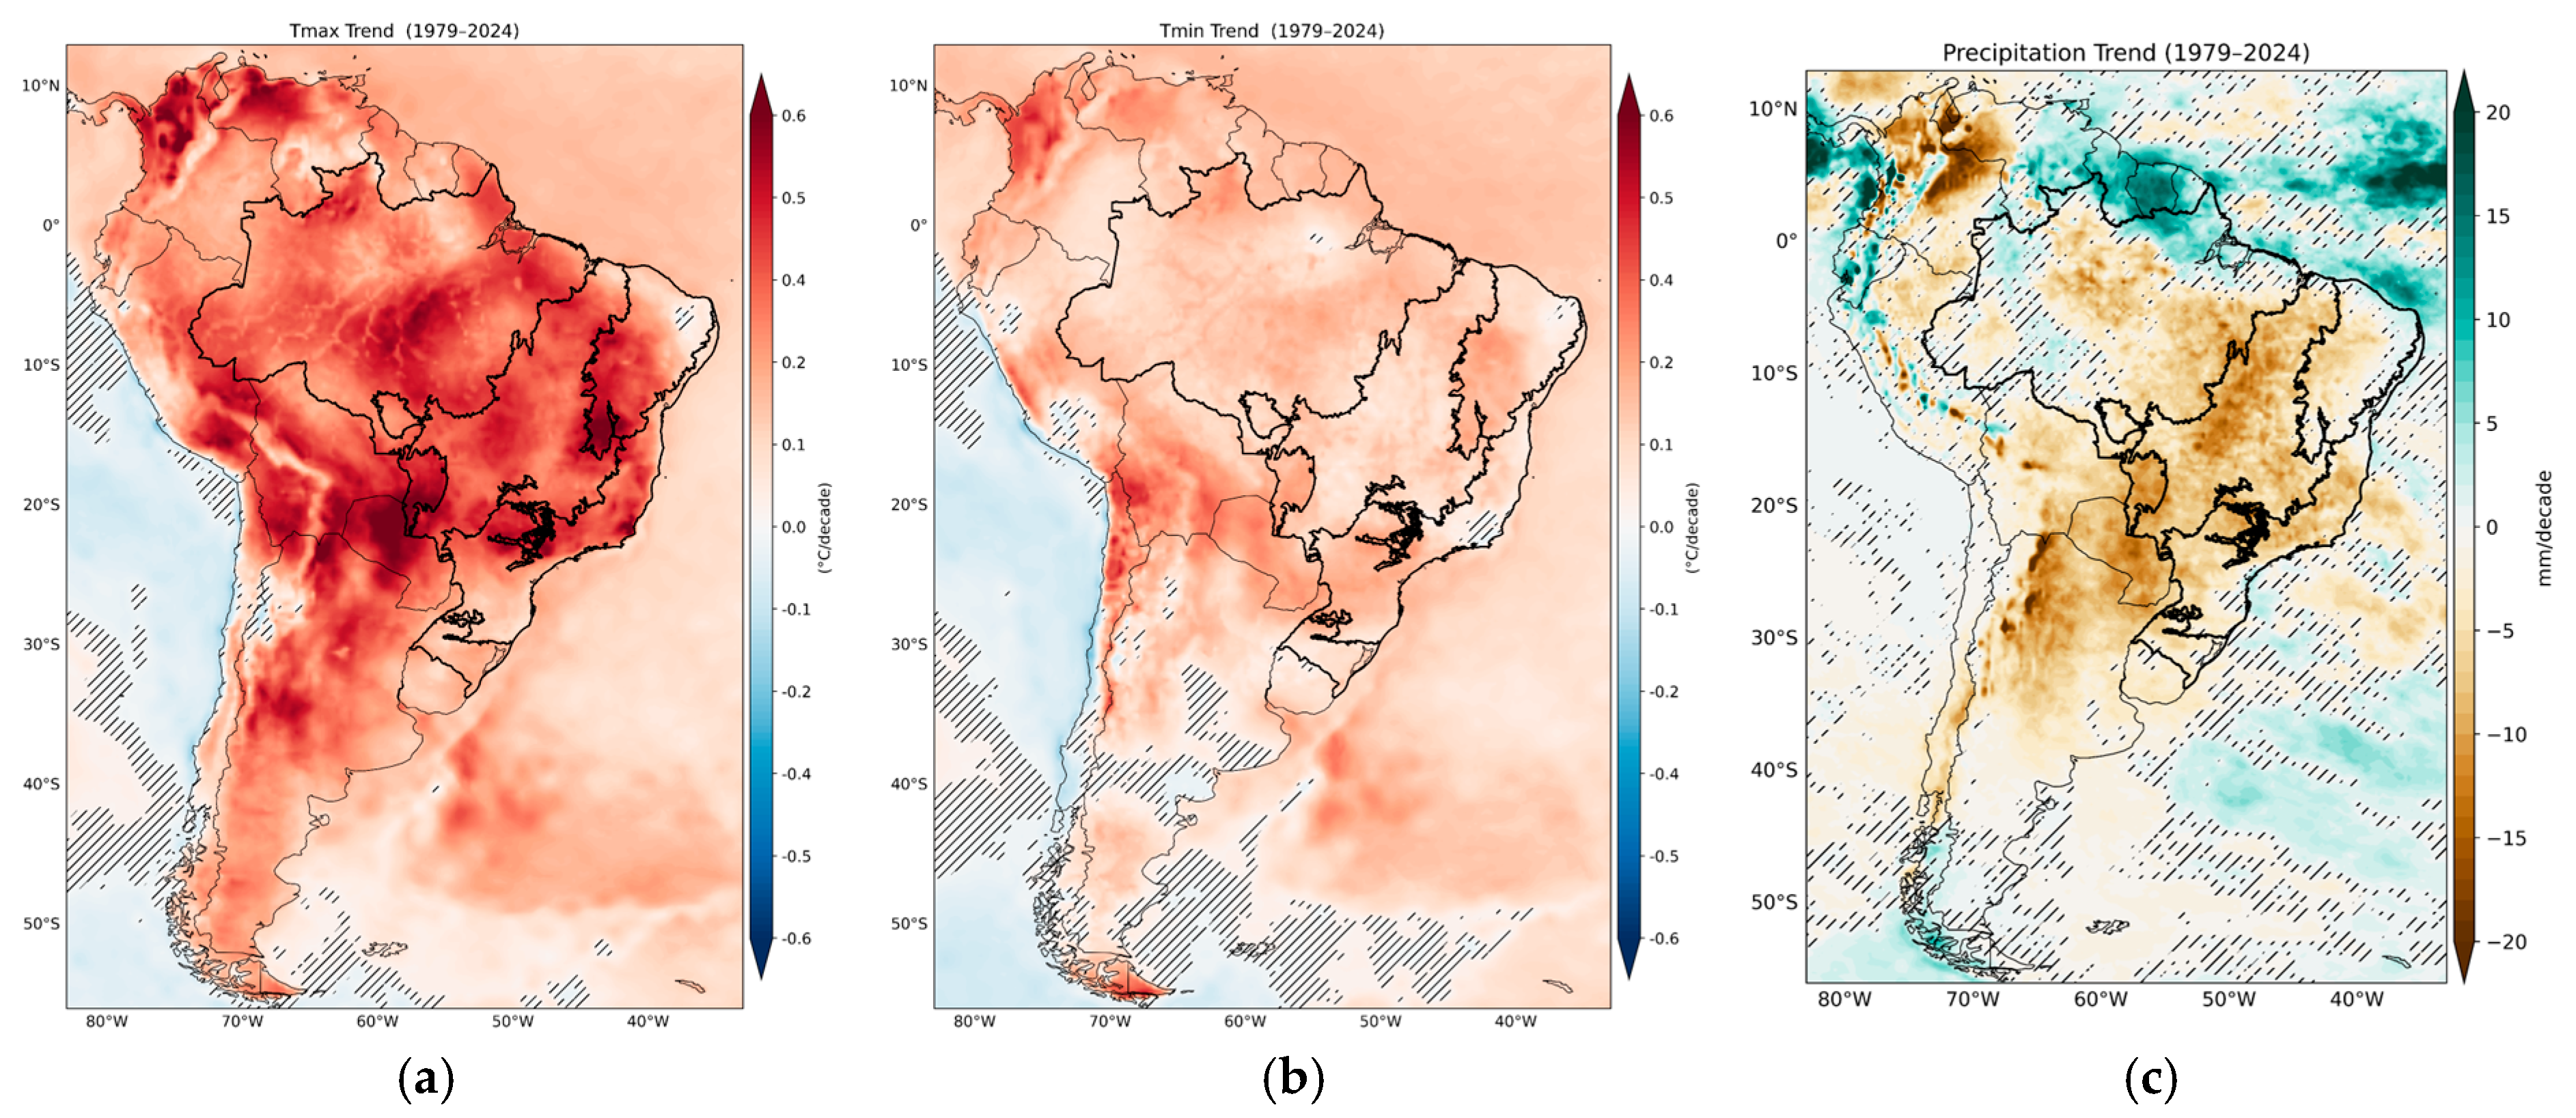
Figure 3.
Long-term trends in temperature (a) and precipitation (b) for South American capitals during 1979–2024. The stars
Figure 3.
Long-term trends in temperature (a) and precipitation (b) for South American capitals during 1979–2024. The stars

Figure 4.
Temporal evolution of spatially averaged Tmax (left column), Tmin (center column), and precipitation (right column) for the six Brazilian biomes: Amazon (a–c), Caatinga (d–f), Cerrado (g–i), Pantanal (j–l), Atlantic Forest (m–o), and Pampa (p–r). Solid lines represent monthly mean values, while dashed lines indicate linear trends fitted to the data.
Disclaimer/Publisher’s Note: The statements, opinions and data contained in all publications are solely those of the individual author(s) and contributor(s) and not of MDPI and/or the editor(s). MDPI and/or the editor(s) disclaim responsibility for any injury to people or property resulting from any ideas, methods, instructions or products referred to in the content. |
© 2025 by the authors. Licensee MDPI, Basel, Switzerland. This article is an open access article distributed under the terms and conditions of the Creative Commons Attribution (CC BY) license (http://creativecommons.org/licenses/by/4.0/).
Copyright: This open access article is published under a Creative Commons CC BY 4.0 license, which permit the free download, distribution, and reuse, provided that the author and preprint are cited in any reuse.


