Submitted:
17 October 2025
Posted:
17 October 2025
You are already at the latest version
Abstract
Most bacteriophages – the viruses of bacteria, commonly described simply as phages – use lysis to release virions from infected bacteria. Lysis releases other intracellular contents of cells and represents a process of more general bacterial-cell decomposition. Lysis also reduces the optical density of bacterial cultures, often substantially. Optical density is a measure of light scattering and absorbance, and is commonly used to quantify the turbidity of broth bacterial cultures. Turbidity-based approaches to studying phage-induced bacterial lysis have been used for roughly as long as phages have been recognized by science. This review examines the history of automated optical density-based explorations of phage impacts on bacterial cultures, with emphasis on published use of kinetic microtiter plate readers. A key conclusion is that the first published automated use of a kinetic-reading microtiter plate reader to study phage-induced bacterial lysis was that of Paddison et al. in 1998 (PMID: 9560373, PMCID: PMC1460109, DOI: 10.1093/genetics/148.4.1539). Challenges to that conclusion are encouraged.
Keywords:
96-well plate
; 96-well microtiter plate
; bacteriophage
; colorimetric
; lysis profile
; spectrophotometry
; turbidimetric
1. Introduction
“…in vitro, l'ensemencement d'une trace d'une culture de ce bactériophage à virulence exaltée dans une emulsion renfermant plusieurs milliards de bacilles, suffit pour tuer et lyser ces bacilles en l'espace de trois heures.” d'Hérelle [1], pp. 932-933, 1919
“When a drop of the lysed culture was added to a young bouillon culture of the Shiga bacilli this culture in turn became dissolved.” d'Hérelle [2], p. 19, 1922
Lysis profiles are a means of visualizing phage life cycles using optical density measurements [3]. This contrasts with the more labor-intensive one-step growth experiments [4,5,6]. Early use of the term ‘lysis profile’ for the study of phage biology can be found in the publications of Rolfe and Campbell [7,8], as applied to induced phage λ lysogens, and of Kao and McClain [9] as applied to the lytic infections by bacteriophage T4. Early use of culture turbidity to quantify the timing of phage-induced bacterial lysis [3,10,11,12], however, can be traced to at least the work of Krueger in 1930 [13,14]. Use of “Photoelectric nephelometers” to generate a true lysis profile nonetheless was not seen until 1947, as developed by Underwood and Doermann [15] (see the Appendix A for additional early history).
Here we move forward several decades to consider the use of automated microtiter plate readers to generate phage lysis profiles. These instruments have the utility of allowing high throughput lysis profile determinations as well as the performance of experiments over long time frames (Figure 1). They thus represent an important innovation for the study of phage population growth, though with the caveat that it is likely that culture aeration within 96-well microtiter plates, even with shaking, may not be as substantial as can be achieved using minimally filled flasks with gyratory shaking. Nonetheless, the presence of kinetic microtiter plate readers in phage laboratories has become extremely common. The question being asked here, though, is which publication was the first to report the use of an automated microtiter plate readers to determine a phage lysis profile? The evidence points to Paddison et al. [16] as the first published example of such an experiment. To make that determination, I employed multiple literature search approaches.
2. Materials and Methods
A Molecular Devices Thermomax microtiter plate reader was used to generate fully automated lysis profile experiments. It was set to an incubation temperature of 37°C. Prior to each time point, 30 seconds of shaking was performed. A 650 nm filter was used, which overlaps the '66' Klett-Summerson Photoelectric Colorimeter filter that possesses “a spectral range of 640-700 millimicrons”. Each curve represents the average of three technical repeats. Muller-Hinton Broth II, cation adjusted, was the growth medium.
3. Use of Kinetic Microtiter Plate Readers
Use of kinetic microtiter plate readers – ideally with associated incubating and shaking functions – can greatly ease the determination of phage lysis profiles. For this reason and others, these instruments have become a standard approach for phage characterization during the current decade (2020s). This contrasts with manual determinations using Klett-Summerson Photoelectric Colorimeters, equivalent single-tube readers (spectrophotometers), or instead by manually loading microtiter plates into plate readers at different intervals. Provided here is a literature search leading up to identification of the earliest, published phage lysis profile that employed a kinetic “microtiter plate reader” or “microplate reader” to automate its generation.
The article by Xie et al. [19] is used here to define the end point of the early use of automated microtiter plate readers to generate phage lysis profiles as this publication set the stage for subsequent, more widespread use of this technology, at least in my opinion. There, lysis profiles were used as a means of quantifying phage antibacterial virulence [17,18,19,20,21]. See also the review by myself which explores the history of the use of phage lysis profiles as a means of estimating phage titers [32]. In this latter publication, a suggestion is made that peak culture turbidities or their timings as seen with lysis profiles may represent a preferable measure of phage antibacterial virulence than the use of areas under curves, a conclusion that is similar though not quite identical to those of Blazanin et al. [33]. See also the supplementary materials of that same publication [32] for a narrative exploration of the complexities than can be associated with interpreting phage biology from lysis profile experiments.
3.1. Searching for References, Round 1
A Google Scholar search was undertaken1 (1 This is the original Google Scholar search: ("phage" OR "bacteriophage" OR "phages" OR "bacteriophages") AND ("microplate reader" OR "microtiter plate reader" OR "microtitre plate reader") AND (“lysis profile" OR "infection profile" OR "killing curve” OR “virulence assay”)) looking for combinations of variations on "phage", "microplate reader", and synonyms for phage impact on bacteria, excluding citations and patents. This yielded over 300 hits. Publications from 1989-1997 either studied non-phage systems [34,35,36,37], mentioned phages without explicitly studying lysis [38,39,40,41,42,43], or employed phage typing rather than lysis profiling [44]. Tabarya and Hoffman [44] does mention lysis profiles: “A set of 19 bacteriophage types, representative of four bacteriophage groups, was obtained from the American Type Culture Collection (Rockville, MD, USA) and was used to generate a bacteriophage lysis profile for each S aureus isolate.” However, their use of a “Microplate Reader” seems to have been limited to performing ELISAs. Interestingly, Crupper and Iandolo [36], from 1996, did employ a “kinetic microplate reader” to study lysis (a Molecular Devices Vmax), but it is not clear that its kinetic function was used to generate the killing curve shown in their sixth figure (panel A). It also was not a phage but instead a bacterium-produced antibacterial peptide that was being studied.
Among these early references, Paddison et al. [16] from 1998 is the earliest publication found in the above search containing a phage lysis profile that had been generated using a kinetic plate reader. That lysis profile, shown in the fifth figure of that publication, demonstrates automated measurement of phage-induced bacterial lysis over time. Crucial for comparison to other studies, where automation might be present but is not specified, the data points are evenly spaced throughout that experiment. By comparison, the next lysis profile in that study was based on manually acquired data with clearly inconsistent intervals between time points. The following sections examine additional searches that were conducted to identify any earlier examples.
3.2. Round 2, Earlier Than 1998 but Not Automated?
In an attempt to dig further, I used the author filter, “author:R author:Young”. This is for Ryland Young, a crucial pioneer in the study of phage-induced bacterial lysis. This revealed additional phage lysis-related publications dating from 1998 or earlier, with focus predominantly on lysis induced by cloned phage genes rather than on lysis induced by whole phages:
Smith and Young [45] from 1998 show multiple lysis profiles including of λ phage lysogens. One can see in this article, however, that there is no reference to how this absorbance, here used as an indication of optical density, was determined. Intervals between time points also appear to be varied by different amounts, especially at the beginning of the presented curves. That suggests that optical density measurements were obtained manually rather than in an automated manner. Similar patterns appear in Smith et al. [46] as well as Chang et al. [47] from 1998 and 1995, respectively.
Johnson-Boaz et al. [48] from 1994 explained their approach as: “The turbidity of bacterial cultures was followed by measuring the A550 in a Gilford Stasar spectrophotometer equipped with a liquid-sipping apparatus.” Again, however, spacing between time points is not constant. Equivalently, see Chang [49]. Thus, none of these 1998 and earlier publications associated with R. Young appear to have employed a kinetic plate reader, or automated time point acquisition.
3.3. Round 3, Later Than 1998 but Earlier Than 2018
As also was the case for many of the studies indicated in the previous section, in the 2006 and 2007 publications by Xu et al. [50] and by Li et al. [51], lysis profiles were associated with cloned phage genes rather than whole phages. Measurements by Li et al. [51] indeed used a microplate reader though without evidence of automated kinetic reading. The earliest use of automated kinetic microplate reading for cloned phage gene-induced lysis that I was able to identify instead was by Pasotti et al. [52] in 2011: “The microplate was incubated at 37°C in the Infinite F200 microplate reader and assayed every 5 min”.
From 2007 through 2018, the latter being the year of publication of the Xie et al. [19] study, a number of lysis profiles associated with infection by whole phages – all following that of Paddison et al. [16] – appear to have indeed been studied via automated data acquisition associated with a kinetic-reading plate reader including [26,53,54,55,56,57,58,59,60,61,62]. Additionally, several post-1998 studies are worth mentioning, though as examples that did not fulfill this criterion: Cooper et al. [63], from 2011, presented optical density-based comparisons of phage-containing and phage-absent cultures, though without emphasis on the lysis step; Henry et al. [64], from 2012, used optical density to infer the timing of lysis though without visualization of reductions in optical density associated with the presumed culture-wide bacterial lysis; Kulsuwan et al. [65], from 2014; used microtiter plates but examined wells visually; Ahmad et al. [66], from 2017, studied the impact of a filamentous phage on a bacterial culture using a microtiter plate reader, but data points were taken every three hours, suggesting that this was not automated; and Zhang [67], from 2017, also used a microtiter plate reader, but appears to have measured turbidities “After incubation”.
3.4. A Smorgasbord of Descriptors
Note that Xie et al. [19] describe their lysis profiles as “growth curves” while Betts et al. [61] refer just to phage growth. Goldfarb et al. [59] use the phrasing, “culture dynamics” and lysis while Galtier et al. [60], Henry et al. [57], and Maura et al. [54] used the descriptor, “lysis kinetics”. El-Arabi et al. [56] in turn tested “host specificity”, the latter as citing [68] from 2010 for their protocol. An interesting earlier effort is also that of the noted Cooper et al. [63]. They clearly measured the impact of phages on culture turbidity using kinetic means (as indicated in their third figure), but they do not explicitly show a lysis profile and otherwise performed their “lytic assessment” of the impact of phages at two endpoints, eight and 20 hours.
Unfortunately, for the sake of narrowing the above Google Scholar searches (Section 3.1), adding, e.g., “growth curve” – and not limiting to articles authored by R. Young – results in collectively well over 3,000 hits. Only about 70, however, were from 1998 and prior. In reading through the titles of all of the latter, while downloading any manuscripts that seemed in any way promising, none appeared to be sufficiently phage related. Replacing “growth curve” with “lysis kinetics” yielded only around 60 hits. This included three published 1998 and prior. One of these is the noted Paddison et al. [16] while the other two are insufficiently relevant to phage biology [35,37].
3.5. Honorable Mentions
An honorable mention goes to Maillard et al. [23]. In 1996 they employed an automated assay for studying phage lysis, as an indicator of remaining phage titers following their treatment with biocides (see [32] for review). This is a description of their approach: “A conical flask containing 150 ml of [nutrient broth] was connected to a spectrophotometer cuvette, linked to an autofill system (Autofill 11, Pharmacia LKB) and a pump (502S, Watson Marlow, Falmouth, UK) set at 20 rev min-1 and worked continuously. Every minute the culture absorbance was recorded spectrophotometrically at 500 nm (Ultrospec II, Pharmacia LKB).” This approach was clearly both automated and involved the study of phage lysis profiles. Nonetheless, their approach did not employ a microtiter plate reader.
A second honorable mention goes to Elespuru and Moore [69]. This is a β-galactosidase-release assay involving induction of phage λ lysogens, so is not a true lysis profile. Still, the assay was done in microtiter plates, though automated time points do not appear to have been taken. This study was discovered using a Claude.ai-assisted literature search using the query, “I’m looking for 1998 and earlier use of automated microtiter plate analysis of phage lysis.”
4. Conclusion
Based on the presented effort, Paddison et al. [16] could very well be the first publication to employ an automated, kinetic microtiter plate reading to generate a lysis profile. From that publication, “two-step lysis profiles” were generated for phage T4 along with two of its mutants. From that study: “Absorbance readings at 550 nm were taken every 30 sec using… a SpectraMax tunable microplate reader”. This was performed using a loaned demonstration machine.
I had previously employed a Klett-Summerson Photoelectric Colorimeters to perform equivalent lysis profile experiments [70,71]. The inspiration for doing the new phage-mutant lysis profile [16] – but instead automated using a kinetic-reading microtiter plate reader – came from my postdoctoral work at the University of Pennsylvania; there I had performed numerous ELISAs, employing a microtiter plate reader for data collection. It was not until ~25 years after the 1998 publication, however, that a microplate reader was again obtained for use in the Abedon laboratory, which was used to generate the figures found in [32] as well as Figure 1 here.
Funding
This research was funded by U.S. Public Health Service grants R21AI156304 and R01AI169865.
Acknowledgements
I am extremely grateful to Patrick Paddison for giving me – along with Elizabeth Kutter as senior author – the opportunity to publish my lysis profile experiments in their 1998 Genetics publication, on which I served as second author. This was an opportunity, apparently, to play a pioneering role in bringing this important technology to the phage world but also because that publication was very important toward my continuing as a phage biologist, as at the time I was untenured. Thank you to Lucas Moriniere and Vivek Mutalik who confirmed the genotype of the phage T1 stock used in Figure 1. Claude.ai was used to proofread this manuscript as well as for the final indicated literature search.
Conflicts of Interest
S.T.A. has consulted for and served on advisory boards for companies with phage therapy interests, has held equity stakes in a number of these companies, and maintains the websites phage.org and phage-therapy.org. No additional competing financial interests exist. The text presented represents the perspectives of the author alone, and no outside help was received in its writing.
Appendix A. Some Early History of Optical Density-Based Phage Characterization
In 1947, Underwood and Doermann [15] published a techniques article titled “A photoelectric nephelometer”. There, they generated lysis profiles for coliphages T1, T4, and T5. This publication also included a lysis profile of a genetic variant of phage T4 called an r mutant, which specifically is unable to display lysis inhibition (see similarly, the above noted experiment by Paddison et al. [16]). They in addition used this instrument to follow the growth of Escherichia coli cultures absent phage presence. Bacterial doubling times (“time of division”) and also phage latent periods were reported. More generally, “A nephelometer is described that does not require a precision optical system or an electronic amplifier.” Indeed they note that “In the bacteriophage laboratory it is desirable to have a means of measuring changes in the turbidity of bacterial cultures.”
According to Google Scholar, the Underwood and Doermann article at the time of this writing had been cited a total of 15 times, the last time being in 2018 by a thesis. A search of citing articles on “Phage” or “Bacteriophage” or their plurals yielded nine publications, including the 2009 Hyman and Abedon [4] as well as one by Adams that is in Russian. The latter presumably is a translation of his famous 1959 monograph [72] since Underwood and Doermann are cited there in the English version on p. 483. Oddly, though, the English version of the monograph didn’t show up in the Google Scholar search.
Among the remaining seven is the important Doermann [73] from 1952. Explored there was the impact of cyanide as an inducing agent of phage-mediated lysis, with the resulting artificial lysis used to release intracellular virions prematurely. This allowed a measure of when those intracellular virions first become present within phage-infected bacteria, which in turn defines the end of what subsequently became known as the phage eclipse [74].
Also citing Underwood and Doermann [15] is an Adams article [75] from 1949 which, like Underwood and Doermann [15], compares the lysis timing of phage T5 using optical-density versus one-step determinations. One-step growth-measured lysis, however, seems to occur sooner than as measured using declines in turbidity, perhaps in part because the start of such lysis as based on virion release can be determined more precisely versus the turbidity decline associated with only a few initially lysing bacteria. Both approaches, though, show similar dynamics in the absence from media of calcium, as required for phage T5’s infection process at a point that appears to follow the bacterial adsorption step. Lanni [76], also citing Underwood and Doermann, meanwhile used optical density to explore the display of a lysis inhibition phenotype seen with a mutant of phage T5, but apparently that phenotype is not also seen with the wild-type phage. These early efforts presumably all involved individual, manual turbidity determinations. As indicated in the main text, it would be multiple decades until such processes came to be automated such as by using kinetic-reading microtiter plate readers.
References
- d'Hérelle, F. Sur le rôle du microbe bactériophage dans la typhosa aviaire [On the role of the microbe bacteriophage in the avian typhoid]. Compt. rend. Acad. Sci. 1919, 169, 932–934. [Google Scholar]
- d'Hérelle, F.; Smith, G. H. The Bacteriophage: Its Role in Immunity; Williams and Wilkins Co./Waverly Press: Baltimore, 1922. [Google Scholar]
- Young, R. Bacteriophage lysis: mechanisms and regulation. Microbiol. Rev. 1992, 56, 430–481. [Google Scholar] [CrossRef]
- Hyman, P.; Abedon, S. T. Practical methods for determining phage growth parameters. Meth. Mol. Biol. 2009, 501, 175–202. [Google Scholar]
- Kropinski, A. M. Practical advice on the one-step growth curve. Meth. Mol. Biol. 2018, 1681, 41–47. [Google Scholar]
- Abedon, S.T. Dos and don'ts of bacteriophage one-step growth. Preprints.org 2025. [Google Scholar] [CrossRef]
- Rolfe, B. G.; Campbell, J. H. A relationship between tolerance to colicin K and the mechanism of phage induced host cell lysis. Molecular and General Genetics 1974, 133, 293–297. [Google Scholar] [CrossRef]
- Rolfe, B. G.; Campbell, J. H. Genetic and physiological control of host cell lysis by bacteriophage lambda. Journal of Virology 1977, 23, 626–636. [Google Scholar] [CrossRef]
- Kao, S. H.; McClain, W. H. Roles of T4 gene 5 and gene s products in cell lysis. J. Virol. 1980, 34, 104–107. [Google Scholar] [CrossRef]
- Young, R.; Wang, I.-N. Phage lysis. In The Bacteriophages, Calendar, R.; Abedon, S. T., Ed.; Oxford University Press: Oxford, 2006. [Google Scholar]
- Cahill, J.; Young, R. Phage lysis: multiple genes for multiple barriers. Adv. Virus Res. 2019, 103, 33–70. [Google Scholar]
- Dennehy, J. J.; Abedon, S. T. Phage infection and lysis. In Bacteriophages: Biology, Technology, Therapy, Harper, D., Abedon, S. T., Burrowes, B. H.; McConville, M., Ed.; Springer Nature Switzerland AG: New York City, 2021. [Google Scholar]
- Krueger, A. P. A method for the quantitative determination of bacteriophage. J. Gen. Physiol. 1930, 13, 557–564. [Google Scholar] [CrossRef]
- Krueger, A. P.; Northrop, J. H. The kinetics of the bacterium-bacteriophage reaction. J. Gen. Physiol. 1930, 14, 223–254. [Google Scholar] [CrossRef] [PubMed]
- Underwood, N.; Doermann, A. H. A photoelectric nephelometer. Rev. Scient. Instr. 1947, 18, 665–672. [Google Scholar] [CrossRef] [PubMed]
- Paddison, P.; Abedon, S. T.; Dressman, H. K.; Gailbreath, K.; Tracy, J.; Mosser, E.; Neitzel, J.; Guttman, B.; Kutter, E. The roles of the bacteriophage T4 r genes in lysis inhibition and fine-structure genetics: a new perspective. Genetics 1998, 148, 1539–1550. [Google Scholar] [CrossRef] [PubMed]
- Smith, H. W.; Huggins, M. B. Effectiveness of phages in treating experimental Escherichia coli diarrhoea in calves, piglets and lambs. Journal of General Microbiology 1983, 129, 2659–2675. [Google Scholar] [CrossRef]
- Niu, Y. D.; Johnson, R. P.; Xu, Y.; McAllister, T. A.; Sharma, R.; Louie, M.; Stanford, K. Host range and lytic capability of four bacteriophages against bovine and clinical human isolates of Shiga toxin-producing Escherichia coli O157:H7. J. Appl. Microbiol. 2009, 107, 646–656. [Google Scholar] [CrossRef]
- Xie, Y.; Wahab, L.; Gill, J. J. Development and validation of a microtiter plate-based assay for determination of bacteriophage host range and virulence. Viruses 2018, 10, 189. [Google Scholar] [CrossRef]
- Storms, Z. J.; Teel, M. R.; Mercurio, K.; Sauvageau, D. The virulence index: a metric for quantitative analysis of phage virulence. Phage. (New Rochelle. ).
- Konopacki, M.; Grygorcewicz, B.; Dołęgowska, B.; Kordas, M.; Rakoczy, R. PhageScore: A simple method for comparative evaluation of bacteriophages lytic activity. Biochemical Engineering Journal 2020, 161, 107652. [Google Scholar] [CrossRef]
- Delbrück, M. Bacterial viruses or bacteriophages. Biological Reviews 1946, 21, 30–40. [Google Scholar] [CrossRef]
- Maillard, J. Y.; Beggs, T. S.; Day, M. J.; Hudson, R. A.; Russell, A. D. The use of an automated assay to assess phage survival after a biocidal treatment. J. Appl. Bacteriol. 1996, 80, 605–610. [Google Scholar] [CrossRef]
- Bicalho, R. C.; Santos, T. M.; Gilbert, R. O.; Caixeta, L. S.; Teixeira, L. M.; Bicalho, M. L.; Machado, V. S. Susceptibility of Escherichia coli isolated from uteri of postpartum dairy cows to antibiotic and environmental bacteriophages. Part I: Isolation and lytic activity estimation of bacteriophages. J Dairy Sci.
- Ghosh, D.; Stencel, J. M.; Hicks, C. D.; Payne, F.; Ozevin, D. Acoustic emission signal of Lactococcus lactis before and after Inhibition with NaN 3 and infection with bacteriophage c2. ISRN. Microbiol. 2013, 2013, 257313. [Google Scholar] [CrossRef]
- Davidi, D.; Sade, D.; Schuchalter, S.; Gazit, E. High-throughput assay for temporal kinetic analysis of lytic coliphage activity. Anal. Biochem. 2014, 444, 22–24. [Google Scholar] [CrossRef] [PubMed]
- Rajnovic, D.; Munoz-Berbel, X.; Mas, J. Fast phage detection and quantification: An optical density-based approach. PLoS One 2019, 14, e0216292. [Google Scholar] [CrossRef] [PubMed]
- Patpatia, S.; Schaedig, E.; Dirks, A.; Paasonen, L.; Skurnik, M.; Kiljunen, S. Rapid hydrogel-based phage susceptibility test for pathogenic bacteria. Front Cell Infect. Microbiol 2022, 12, 1032052. [Google Scholar] [CrossRef] [PubMed]
- Geng, Y.; Nguyen, T. V. P.; Homaee, E.; Golding, I. Using bacterial population dynamics to count phages and their lysogens. Nat. Commun. 2024, 15, 7814. [Google Scholar] [CrossRef]
- Soro, O.; Kigen, C.; Nyerere, A.; Gachoya, M.; Georges, M.; Odoyo, E.; Musila, L. Characterization and anti-biofilm activity of lytic Enterococcus phage vB_Efs8_KEN04 against clinical isolates of multidrug-resistant Enterococcus faecalis in Kenya. Viruses 2024, 16, 1275. [Google Scholar] [CrossRef]
- Wiebe, K. G.; Cook, B. W. M.; Lightly, T. J.; Court DA; Theriault, S. S. Investigation into scalable and efficient enterotoxigenic Escherichia coli bacteriophage production. Sci Rep. 2024, 14, 3618. [Google Scholar] [CrossRef]
- Abedon, S. T. Bacteriophage titering by optical density means: KOTE assays. Open life sciences 2025. [Google Scholar]
- Blazanin, M.; Vasen, E.; Vilaro, J. C.; An, W.; Turner, P. E. Quantifying phage infectivity from characteristics of bacterial population dynamics. Proc. Natl. Acad. Sci. U. S. A 2025, 122, e2513377122. [Google Scholar] [CrossRef]
- Gardell, S. J.; Duong, L. T.; Diehl, R. E.; York, J. D.; Hare, T. R.; Register, R. B.; Jacobs, J. W.; Dixon, R. A.; Friedman, P. A. Isolation, characterization, and cDNA cloning of a vampire bat salivary plasminogen activator. J. Biol. Chem 1989, 264, 17947–17952. [Google Scholar] [CrossRef]
- Jones, A. J.; Meunier, A. M. A precise and rapid microtitre plate clot lysis assay: methodology, kinetic modeling and measurement of catalytic constants for plasminogen activation during fibrinolysis. Thromb. Haemost. 1990, 64, 455–463. [Google Scholar] [CrossRef]
- Crupper, S. S.; Iandolo, J. J. Purification and partial characterization of a novel antibacterial agent (Bac1829) Produced by Staphylococcus aureus KSI1829. Appl. Environ. Microbiol. 1996, 62, 3171–3175. [Google Scholar] [CrossRef]
- Cauci, S.; Monte, R.; Ropele, M.; Missero, C.; Not, T.; Quadrifoglio, F.; Menestrina, G. Pore-forming and haemolytic properties of the Gardnerella vaginalis cytolysin. Mol. Microbiol 1993, 9, 1143–1155. [Google Scholar] [CrossRef]
- Everest, P. H. The pathogenesis of campylobacter diarrhoea. Ph.D. University of Leicester (United Kingdom), 1992.
- Ozes, O. N. Possible involvement of p68 kinase and interferon responsive factor 1 (IRF1) in interferon gamma (IFN-gamma)-mediated induction of the indoleamine 2, 3-dioxygenase (IDO) gene. Ph.D. Indiana University, 1993.
- Buchmeier, N. A.; Libby, S. J.; Xu, Y.; Loewen, P. C.; Switala, J.; Guiney, D. G.; Fang, F. C. DNA repair is more important than catalase for Salmonella virulence in mice. J. Clin. Invest. 1995, 95, 1047–1053. [Google Scholar] [CrossRef] [PubMed]
- Batanghari, J. W. A potential role for calcium in Histoplasma parasitism. Ph.D. Washington University in St. Louis, 1996.
- Dai, Z. Regulatory factors and control of anthrax toxin gene expression. Ph.D. 1997.
- Zhang, X. Characterization of a new site-specific recombinase and a new Type IV-like pilin operon encoded in the major" pathogenicity island" of Salmonella typhi. Ph.D. Hong Kong University of Science and Technology (Hong Kong), 1997.
- Tabarya, D.; Hoffman, W. L. Staphylococcus aureus nasal carriage in rheumatoid arthritis: antibody response to toxic shock syndrome toxin-1. Ann. Rheum. Dis. 1996, 55, 823–828. [Google Scholar] [CrossRef] [PubMed]
- Smith, D. L.; Young, R. Oligohistidine tag mutagenesis of the l holin gene. J. Bacteriol. 1998, 180, 4199–4211. [Google Scholar] [CrossRef]
- Smith, D. L.; Struck, D. K.; Scholtz, J. M.; Young, R. Purification and biochemical characterization of the lambda holin. J. Bacteriol. 1998, 180, 2531–2540. [Google Scholar] [CrossRef]
- Chang, C.-Y.; Nam, K.; Young, R. S gene expression and the timing of lysis by bacteriophage lambda. J. Bacteriol. 1995, 177, 3283–3294. [Google Scholar] [CrossRef]
- Johnson-Boaz, R.; Chang, C.-Y.; Young, R. A dominant mutation in the bacteriophage lambda S gene causes premature lysis and an absolute defective plating phenotype. Mol. Microbiol. 1994, 13, 495–504. [Google Scholar] [CrossRef]
- Chang, C.-Y. Synthesis, Function and Regulation of the lambda holin. Ph.D. Texas A&M University, 1994.
- Xu, L.; Li, S.; Ren, C.; Cai, Z.; Lin, Z. Heat-inducible autolytic vector for high-throughput screening. BioTechniques 2006, 41, 319–323. [Google Scholar] [CrossRef]
- Li, S.; Xu, L.; Hua, H.; Ren, C.; Lin, Z. A set of UV-inducible autolytic vectors for high throughput screening. J. Biotechnol. 2007, 127, 647–652. [Google Scholar] [CrossRef]
- Pasotti, L.; Zucca, S.; Lupotto, M.; Cusella De Angelis, M. G.; Magni, P. Characterization of a synthetic bacterial self-destruction device for programmed cell death and for recombinant proteins release. J. Biol. Eng 2011, 5, 8. [Google Scholar] [CrossRef]
- Atterbury, R. J.; Van Bergen, M. A. P.; Ortiz, F.; Lovell, M. A.; Harris, J. A.; De Boer, A.; Wagenaar, J. A.; Allen, V. M.; Barrow, P. A. Bacteriophage therapy to reduce Salmonella colonization of broiler chickens. Appl. Environ. Microbiol. 2007, 73, 4543–4549. [Google Scholar] [CrossRef] [PubMed]
- Maura, D.; Morello, E.; du, M. L.; Bomme, P.; Le, B. C.; Debarbieux, L. Intestinal colonization by enteroaggregative Escherichia coli supports long-term bacteriophage replication in mice. Environ. Microbiol. 2012, 14, 1844–1854. [Google Scholar] [CrossRef] [PubMed]
- Turner, P. E.; Draghi, J. A.; Wilpiszeski, R. High-throughput analysis of growth differences among phage strains. J. Microbiol. Meth. 2012, 88, 117–121. [Google Scholar] [CrossRef] [PubMed]
- El-Arabi, T. F.; Griffiths, M. W.; She, Y. M.; Villegas, A.; Lingohr, E. J.; Kropinski, A. M. Genome sequence and analysis of a broad-host range lytic bacteriophage that infects the Bacillus cereus group. Virol. J. 2013, 10, 48. [Google Scholar] [CrossRef]
- Henry, M.; Lavigne, R.; Debarbieux, L. Predicting in vivo efficacy of therapeutic bacteriophages used to treat pulmonary infections. Antimicrob. Agents Chemother. 2013, 57, 5961–5968. [Google Scholar] [CrossRef]
- Zhang, J.; Ormala-Odegrip, A. M.; Mappes, J.; Laakso, J. Top-down effects of a lytic bacteriophage and protozoa on bacteria in aqueous and biofilm phases. Ecol. Evol. 2014, 4, 4444–4453. [Google Scholar] [CrossRef]
- Goldfarb, T.; Sberro, H.; Weinstock, E.; Cohen, O.; Doron, S.; Charpak-Amikam, Y.; Afik, S.; Ofir, G.; Sorek, R. BREX is a novel phage resistance system widespread in microbial genomes. EMBO J. 2015, 34, 169–183. [Google Scholar] [CrossRef]
- Galtier, M.; De Sordi, L.; Maura, D.; Arachchi, H.; Volant, S.; Dillies, M. A.; Debarbieux, L. Bacteriophages to reduce gut carriage of antibiotic resistant uropathogens with low impact on microbiota composition. Environ. Microbiol. 2016, 18, 2237–2245. [Google Scholar] [CrossRef]
- Betts, A.; Gifford, D. R.; MacLean, R. C.; King, K. C. Parasite diversity drives rapid host dynamics and evolution of resistance in a bacteria-phage system. Evolution 2016, 70, 969–978. [Google Scholar] [CrossRef]
- Yin, S.; Huang, G.; Zhang, Y.; Jiang, B.; Yang, Z.; Dong, Z.; You, B.; Yuan, Z.; Hu, F.; Zhao, Y.; et al. Phage Abp1 rescues human cells and mice from infection by pan-drug resistant Acinetobacter baumannii. Cell Physiol. Biochem. 2017, 44, 2337–2345. [Google Scholar] [CrossRef]
- Cooper, C. J.; Denyer, S. P.; Maillard, J. Y. Rapid and quantitative automated measurement of bacteriophage activity against cystic fibrosis isolates of Pseudomonas aeruginosa. J. Appl. Microbiol. 2011, 110, 631–640. [Google Scholar] [CrossRef]
- Henry, M.; Biswas, B.; Vincent, L.; Mokashi, V.; Schuch, R.; Bishop-Lilly, K. A.; Sozhamannan, S. Development of a high throughput assay for indirectly measuring phage growth using the OmniLog(TM) system. Bacteriophage 2012, 2, 159–167. [Google Scholar] [CrossRef] [PubMed]
- Kulsuwan, R.; Wongratanacheewin, S.; Wongratanacheewin, R. S.; Yordpratum, U.; Tattawasart, U. Lytic capability of bacteriophages (family Myoviridae) on Burkholderia peudomallei. Southeast Asian J. Trop. Med. Public Health 2014, 45, 1344–1353. [Google Scholar] [PubMed]
- Ahmad, A. A.; Stulberg, M. J.; Mershon, J. P.; Mollov, D. S.; Huang, Q. Molecular and biological characterization of varphiRs551, a filamentous bacteriophage isolated from a race 3 biovar 2 strain of Ralstonia solanacearum. PLoS One 2017, 12, e0185034. [Google Scholar] [CrossRef] [PubMed]
- Zhang, X. Using Lytic Bacteriophages as a Biocontrol Intervention to Eliminate Salmonella in Romaine Lettuce, Mung Bean Sprouts, Mung bean Seeds and Mung Bean Germinated Sprouts and to Prevent Shiga-toxigenic Escherichia coli Biofilm Formation on Romaine Lettuce. MS University of Manitoba, 2017.
- Anany, H. E.-S. M. Biocontrol of foodborne bacterial pathogens using immobilized bacteriophages. Ph.D. University of Guelph, 2010.
- Elespuru, R. K.; Moore, S. G. Micro-BIA, a colorimetric microtiter assay of lambda prophage induction. Mutat. Res. 1986, 164, 31–40. [Google Scholar] [CrossRef]
- Abedon, S. T. Selection for lysis inhibition in bacteriophage. J. Theor. Biol. 1990, 146, 501–511. [Google Scholar] [CrossRef]
- Abedon, S. T. Lysis of lysis inhibited bacteriophage T4-infected cells. J. Bacteriol. 1992, 174, 8073–8080. [Google Scholar] [CrossRef]
- Adams, M. H. Bacteriophages; InterScience: New York, 1959. [Google Scholar]
- Doermann, A. H. The intracellular growth of bacteriophages I. liberation of intracellular bacteriophage T4 by premature lysis with another phage or with cyanide. J. Gen. Physiol. 1952, 35, 645–656. [Google Scholar] [CrossRef]
- Doermann, A. H. The eclipse in the bacteriophage life cycle. In Phage and the Origins of Molecular Biology (expanded edition), Cairns, J., Stent, G. S.; Watson, J. D., Ed.; Cold Spring Harbor Laboratory Press: Cold Spring Harbor, NY, 1966. [Google Scholar]
- Adams, M. H. The calcium requirement of coliphage T5. J Immunol 1949, 62, 505–516. [Google Scholar] [CrossRef]
- Lanni, Y. T. Lysis inhibition with a mutant of bacteriophage T5. Virology 1958, 5, 481–501. [Google Scholar] [CrossRef]
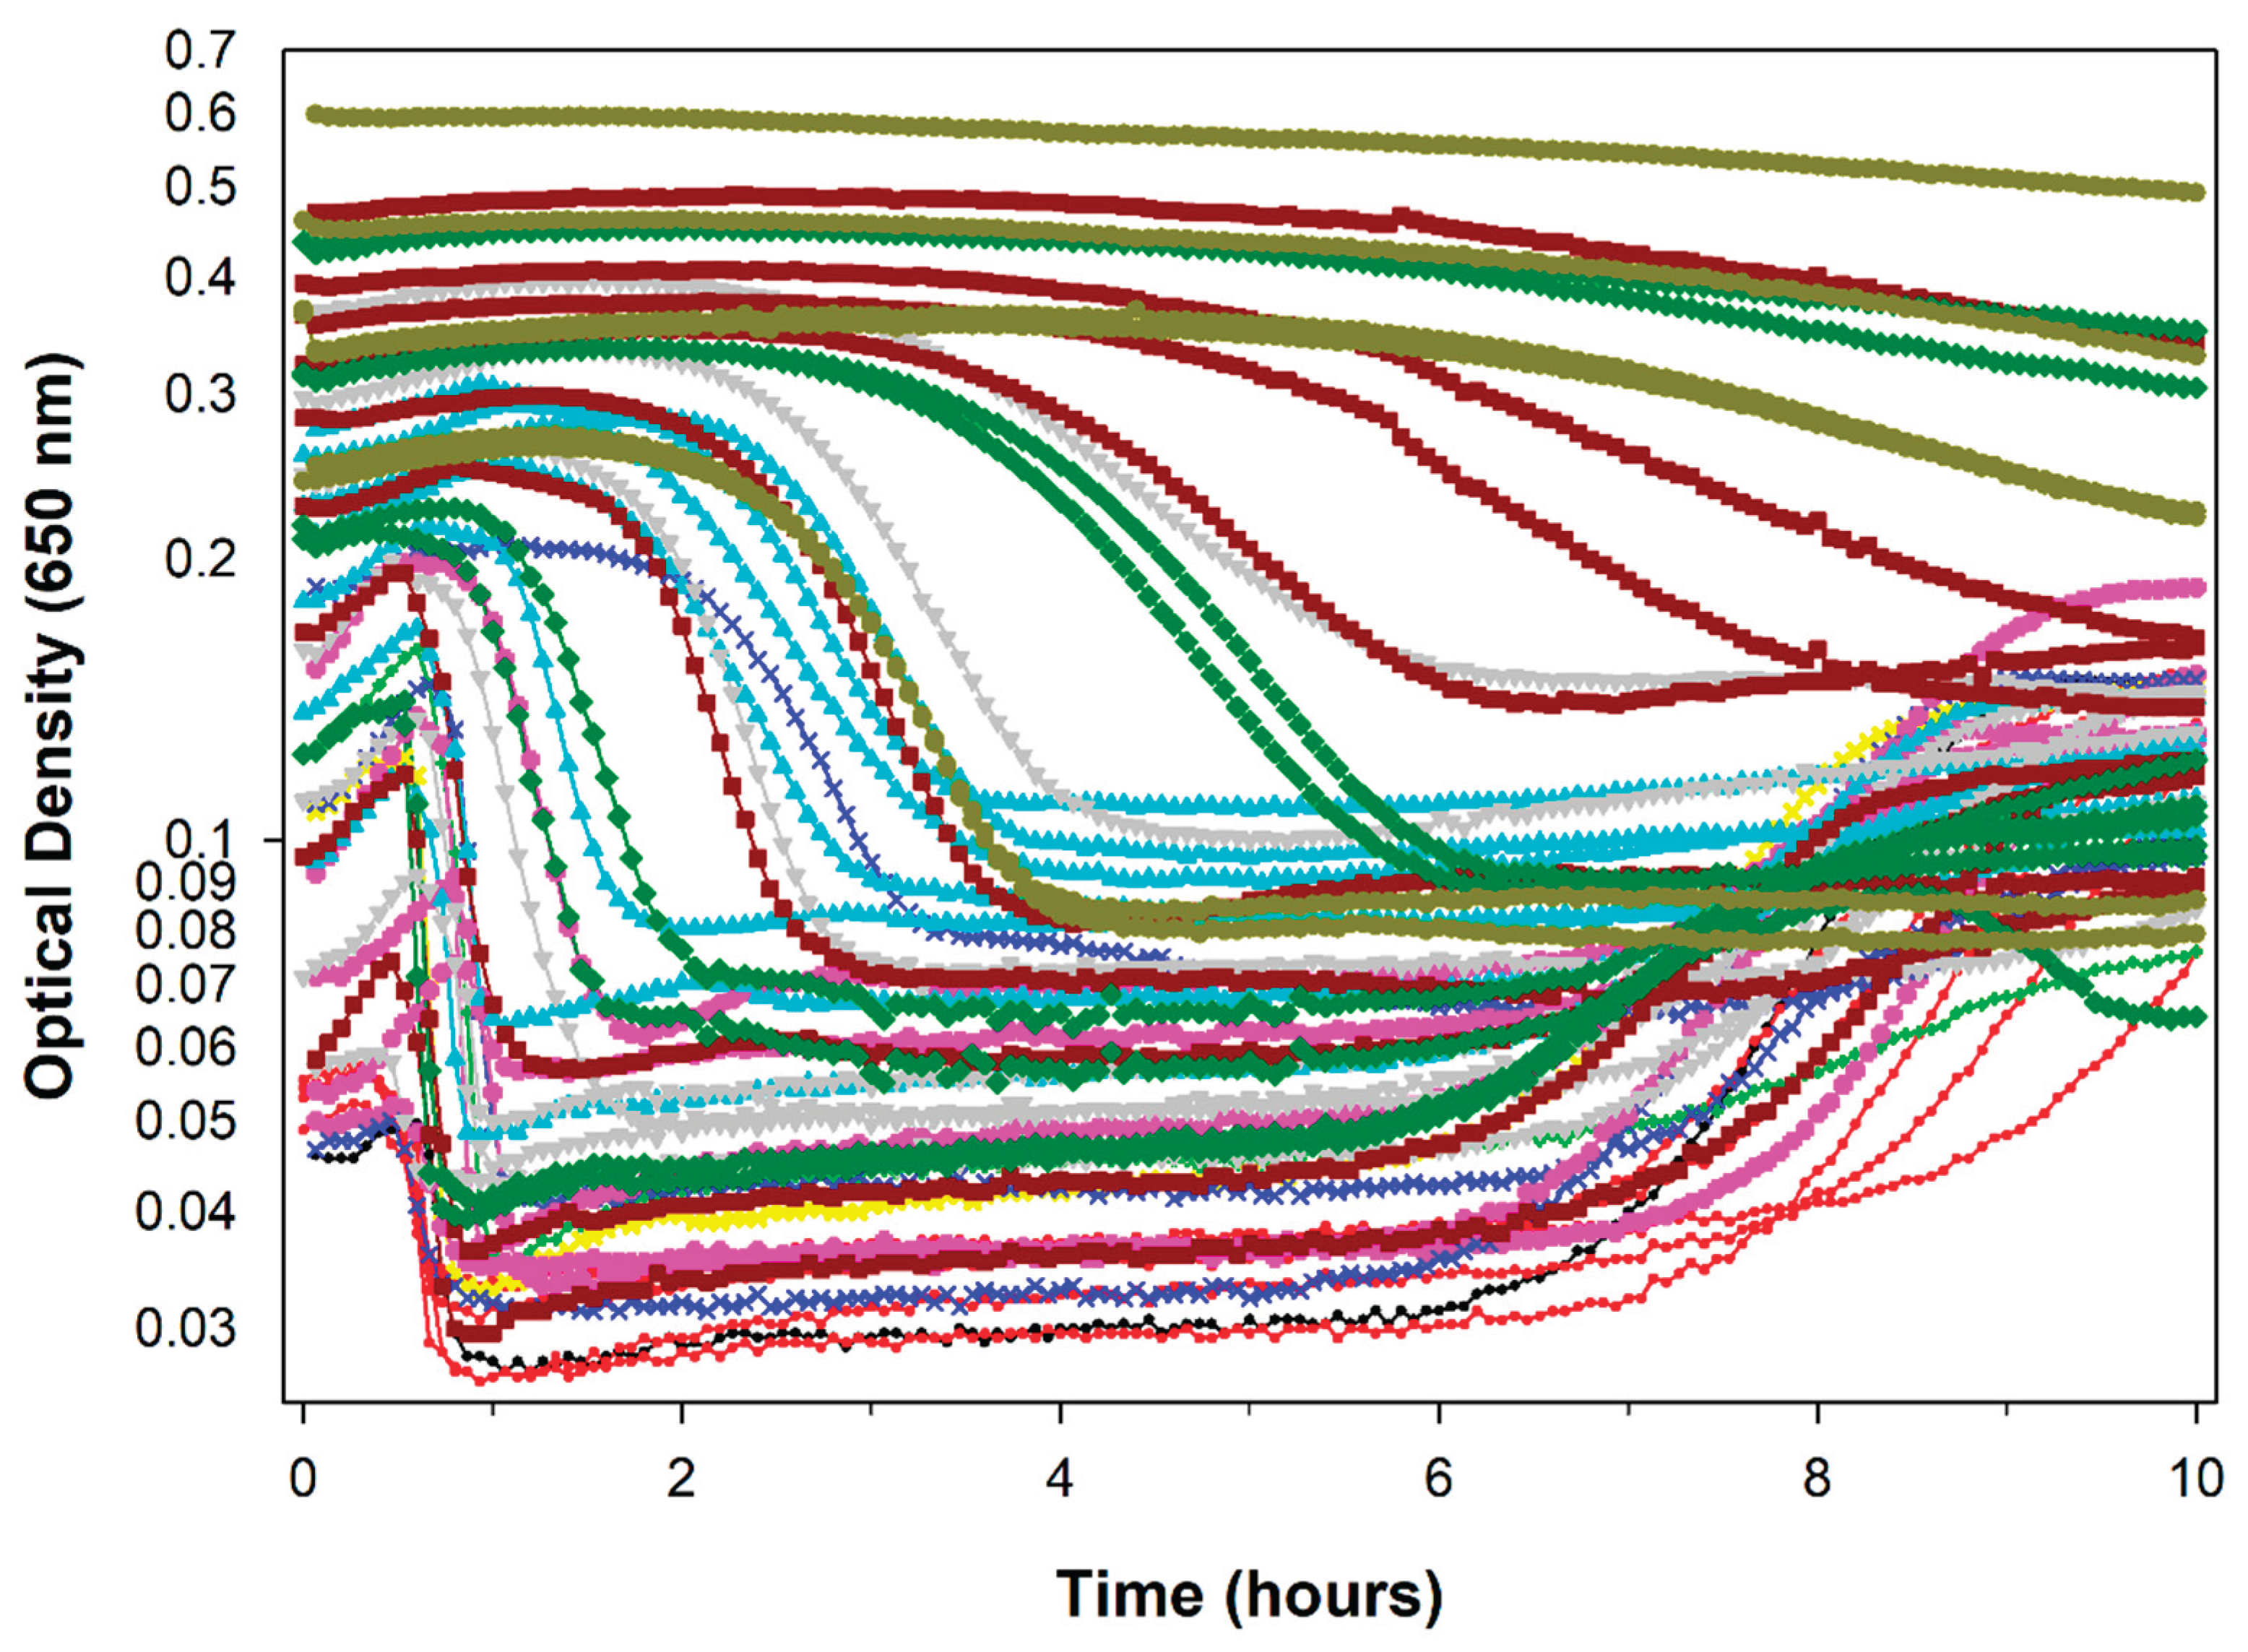
Figure 1.
Example lysis profiles. Shown is the impact of phage T1 on different starting bacterial concentrations (Escherichia coli B), with starting phage multiplicities of somewhat less than 1 (hence the observed initial rise in culture turbidities). Different colors refer to different biological repeats. The approach is equivalent to a virulence determination assay [17,18,19,20,21], though here without virulence quantification. Note the apparent latent period extension seen as initial optical densities increase, from somewhat less than one-half hour – Delbrück [22] reported 13 min for T1 – to six or more hours prior to the completion of the presumably lysis-associated culture turbidity declines. This phenomenon of apparent latent period extension at higher bacterial turbidities has been observed previously by multiple researchers [19,20,23,24,25,26,27,28,29,30,31]. .
Disclaimer/Publisher’s Note: The statements, opinions and data contained in all publications are solely those of the individual author(s) and contributor(s) and not of MDPI and/or the editor(s). MDPI and/or the editor(s) disclaim responsibility for any injury to people or property resulting from any ideas, methods, instructions or products referred to in the content. |
© 2025 by the authors. Licensee MDPI, Basel, Switzerland. This article is an open access article distributed under the terms and conditions of the Creative Commons Attribution (CC BY) license (http://creativecommons.org/licenses/by/4.0/).
Copyright: This open access article is published under a Creative Commons CC BY 4.0 license, which permit the free download, distribution, and reuse, provided that the author and preprint are cited in any reuse.


