Submitted:
16 October 2025
Posted:
17 October 2025
You are already at the latest version
Abstract
Based on data from 45 multinational projects in the telecommunications and IT sectors between 2016 and 2022, this study proposes an integrated framework combining Conditional Value-at-Risk (CVaR) robust budget allocation and Panel Quantile Regression (PQR). Uncertainty is modeled using φ-divergence and box-type support sets to ensure distributional robustness. A Financial Risk Exposure Index (FREI) is constructed to capture the transmission of external shocks—such as exchange rate fluctuations and supplier defaults—to project cost deviations. The PQR model identifies the asymmetric impact of FREI across different project quantiles. Empirical findings reveal that a 10% reduction in FREI leads to a 15.8% drop in cost overruns and a 19.4% improvement in on-time delivery. Under a 95% confidence level, CVaR is reduced by 28%, and the budget payback period is shortened by 12.4%. Global sensitivity analysis using Sobol indices further highlights supplier performance volatility and exchange rate variance as the most influential risk drivers. This framework offers a structured, data-driven approach for financial risk mitigation in complex multinational projects and supports more informed resource allocation decisions.
Keywords:
CVaR
; robust optimization
; quantile regression
; funding buffer
; budget control
1. Introduction
In recent years, the financial risk management of multinational projects has attracted extensive academic attention, particularly in the context of global uncertainty and cross-border operations. Traditional approaches such as the mean-variance model and linear regression analysis have long served as the foundation for financial decision-making, but their assumptions of normal distribution and symmetric response often limit their effectiveness in capturing tail risks. For instance, Embrechts, Schied, and Wang [1] highlight the fragility of classical risk optimization under distributional uncertainty, while Giacometti, Torri, and Paterlini [2] emphasize the inability of linear models to fully account for nonlinear tail dependencies in portfolio selection. In parallel, machine learning methods have shown promise in risk classification and prediction tasks, yet their interpretability remains a major concern, as noted by Ermolieva et al. [3]. Despite these advancements, few studies integrate robust optimization with quantile regression in a unified framework. Therefore, this paper builds upon the theoretical foundations laid by these scholars, proposing a novel two-layer structure that synergizes distributionally robust Conditional Value-at-Risk (CVaR) optimization and panel quantile regression (PQR). This approach not only addresses the limitations of previous models but also offers a practical tool for budget allocation and risk mitigation under extreme scenarios in complex multinational contexts.
2. Construction of the Integrated Framework
To effectively manage asymmetric financial risk exposures commonly observed in multinational projects—particularly those arising from exchange rate volatility and supplier performance imbalances—this study introduces a two-layer integrated risk control framework that combines robust optimization with advanced statistical modeling techniques (see Figure 1). The central aim of this framework is to control expected financial losses while enhancing decision robustness and operational efficiency.
The upper-layer model is built upon a CVaR-driven budget-buffer linkage mechanism, which dynamically aligns project payment schedules with reserve allocations to mitigate tail-end financial risks. Specifically, the model utilizes the Rockafellar-Uryasev linear reconstruction formula to accurately characterize the extreme loss tails of Conditional Value-at-Risk (CVaR). To ensure the model remains resilient under distributional ambiguity, the uncertainty scenario set is jointly constructed using ϕ-divergence spheres and boxed uncertainty sets, thereby enabling effective responses to potential deviations from unknown true distributions.
Simultaneously, the lower-layer component comprises a Panel Quantile Regression (PQR) model, designed to capture the nonlinear and quantile-specific impacts of the Financial Risk Exposure Index (FREI) on cost deviations. The PQR model incorporates fixed-effects terms to account for inter-project and inter-industry heterogeneity, and the estimation process is based on a quantile loss function. This allows the model to maintain high explanatory power across different risk quantiles, particularly in cases involving skewed and heteroscedastic data distributions.
A critical feature of this dual-layer design is the coupling mechanism between FREI and cost deviations, which transmits risk signals from the lower quantile regression layer to the upper optimization layer. This interconnection enables the framework to form a closed-loop system that integrates risk measurement, budgetary resource allocation, and strategic implementation (Figure 1). Such a design not only strengthens the analytical robustness of the overall model but also enhances its practical applicability in managing high-stakes, uncertain financial environments encountered in multinational operations. By bridging robust optimization theory with advanced econometric modeling, the proposed framework offers a holistic approach to financial risk governance that is particularly suited to modern, data-intensive project management environments.
3. Data-Driven Distribution-Robust Risk Control Methodology
3.1. Construction of the Financial Risk Exposure Index (FREI)
In multidimensional risk modeling for multinational projects, the establishment of quantifiable and traceable risk input variables is essential for enabling subsequent distributionally robust optimization and quantile regression analysis. To this end, this study designs and constructs the Financial Risk Exposure Index (FREI) as an intermediate variable that captures how external shocks—such as exchange rate fluctuations and supplier defaults—are transmitted into cost deviations during contract execution. The main objective of FREI is to create a unified and interpretable risk metric by aggregating heterogeneous data from multiple sources into a standardized composite indicator. Specifically, FREI consists of four fundamental components: (1) Exchange rate variance (σfx,i), which reflects the volatility of the currency environment and represents a major source of external financial risk; (2) Supplier default rate (rdefault,i), which measures the reliability and credit risk of key suppliers; (3) Payment rhythm deviation (Δcash,i), defined as the time gap between invoice issuance and payment receipt, capturing structural risks in cash flow alignment; and (4) Contract value volatility (σcontract,i), indicating the uncertainty associated with variations in total contract amounts, which is crucial for long-term budget planning and control.The mathematical representation of FREI is provided in equation (1):
Where σfx,i denotes the historical exchange rate volatility for project i, rdefault,i represents the default rate of primary suppliers, Δcash,i indicates the payment cycle deviation (i.e., the gap between invoicing and payment cycles), and σcontract,i reflects the periodic volatility of the project's total contract value. The weights (w₁–w₄) assigned to each component are estimated using an empirical Bayesian approach (as detailed in Section 4.2), ensuring that the relative contributions of different dimensions accurately reflect their real-world significance. Beyond standardizing multi-dimensional risk factors, FREI also establishes a nonlinear mapping interface that links risk exposure to cost deviations in the PQR model, thereby serving as a central driver in the subsequent distributionally robust optimization process.
3.2 Panel Quantile Regression (PQR) and Fixed Effects Model
To characterize the asymmetric impact pathway of FREI on project cost deviations, this study employs a Panel Quantile Regression (PQR) model combined with a fixed-effects structure to control for cross-project heterogeneity [4]. Unlike traditional OLS models that assume normally distributed error terms affecting the mean level, PQR relaxes distribution assumptions. It allows characterizing FREI's driving effects on the tails of loss distributions at different quantile levels (e.g., 25%, 50%, 75%), offering greater explanatory power and robustness. To accommodate the panel structure across years and industries, the model is specified as follows:
where Lossi,t(τ) denotes the unit cost deviation of project i at time t under the τ quantile, αi(τ) represents the project fixed effect term, FREIi,t is the financial risk exposure index, Zi,t indicates control variables (e.g., project duration, industry sector, payment structure complexity), and β(τ), γ(τ) are the parameter vectors to be estimated. The model employs the Koenker-Bassett method for multi-quantile estimation and incorporates fixed effects within the sample to mitigate omitted variable bias [5]. This PQR model not only provides an upstream risk function for CVaR robust optimization but also serves as the pivotal hub in the "measurement-response-intervention" chain within the comprehensive risk control framework.
3.3. Distribution-Robust CVaR Model Based on ϕ-Divergence
To ensure the reliability of the budget-buffer linkage under unknown true distributions, a distribution-robust CVaR model constrained by ϕ-divergence fuzzy sets is constructed. The FREI and PQR high-quantile effects serve as the driving terms of the loss kernel (Figure 2). Let the loss be defined as , where x represents the budget and buffer decisions, ξ denotes scenario perturbations, and ω(τ) is the quantile weighting function. The uncertainty set is defined as [6], centered at the empirical distribution P^N with radius ρ and constrained by the ϕ-divergence ball plus support set box. The upper-level problem is then:
where η is the VaR threshold and α is the confidence level. For decomposition convenience, we introduce the Rockafellar–Uryasev extrapolation form t(ξ) ≥ L(x,ξ) − η, t(ξ) ≥ 0, endowing the CVaR objective with upper bounding and cut generation properties. The convex dual of ϕ-divergence will be provided with computable dual renormalization in the solution algorithm, enabling resolution via Benders/column constraint generation.
3.4. Solution Algorithm: Benders Decomposition/Column Constraint Generation (C&CG) Algorithm
The nested maximin structure and uncertain distribution support set within the ϕ-dispersion-based distribution robust CVaR optimization model trigger issues of dimension explosion and uncountable scenario sets [7]. To address this, this paper employs a hybrid Benders decomposition and Cutting & Column Generation (C&CG) algorithm framework. The main problem handles decisions regarding buffer configuration variables x and CVaR threshold η, while subproblems search for the worst-case distribution within the ϕ-divergence sphere Uϕ for a given (x, η). The main problem is formulated as follows:
where θ represents the upper bound of the worst-case expected loss in the subproblem, θk denotes the cut plane returned by the kth iteration of the subproblem, and K is the cumulative iteration index set. Each iteration of the subproblem solves the following dual maximization problem based on the current (x(k), η(k)):
By utilizing the convex conjugate function of ϕ-divergence, the subproblem is dualized into a linear/conic form, generating the cutting plane θ ≥ ∇L(x, ξ(k))⊤(x − x(k)) + const. To ensure convergence and scenario sparsity, the algorithm incorporates an ε-optimal stopping rule and sample importance weighting strategy, while dynamically adjusting the divergence radius ρ_k and confidence level α_k at each iteration [8]. Figure 3 illustrates the multi-layer solution structure and master-slave interaction path of this Benders–C&CG joint algorithm, aiding understanding of its distributed robust control process.
4. Empirical Study
4.1. Data Sources and Descriptive Statistics
To validate the applicability of the FREI-driven distributed robust CVaR optimization model in practical engineering management, this study examines 45 multinational IT and telecommunications infrastructure projects undertaken by a major telecommunications equipment manufacturer between 2016 and 2022. These projects span eight currency zones including Asia-Pacific, Latin America, and Eastern Europe [9]. Raw data primarily originated from the company's ERP system (SAP), external credit rating platforms (Dun & Bradstreet), and Bloomberg API's foreign exchange time series interface. Relevant fields included: total contract value, installment payment milestones, invoicing and payment records, actual vs. estimated cost reconciliations, key supplier lists, project duration, exchange rate series for execution countries, and default records during the evaluation period. To support FREI's four-dimensional construction framework (exchange rate volatility, performance risk, payment term deviation, and contract value volatility), all raw fields underwent standardized processing using a unified rolling window. Outliers were removed while preserving the panel structure[10]. Table 1 summarizes the statistical characteristics of core indicators across the entire sample, revealing their volatility foundations across currencies and intervals. This provides a heterogeneity control dimension for the PQR fixed-effects model and supports distribution boundaries for scenario generation in CVaR model inputs. The standardized variables are used to generate the panel-form FREIi,tindex, serving as the core explanatory variable in PQR modeling. Their distribution boundaries are embedded into the ϕ-divergence/Box support set, ensuring distribution robustness and alignment with real-world scenarios in CVaR model solutions.
4.2. Model Implementation and Parameter Settings
Based on the standardized panel data constructed from the aforementioned 45 projects, the integrated joint model was implemented and deployed using Pyomo and the Gurobi 10.0.2 solver in a Python 3.11 environment. This encompassed PQR estimation, ϕ-divergence robust CVaR construction, and integrated scheduling via the Benders–C&C&G algorithm. For the PQR component, three representative quantiles τ={0.25, 0.5, 0.75} were selected to construct the distribution response path. Project IDs were incorporated as fixed effects to control for cross-industry heterogeneity. For CVaR modeling, the confidence level is set to α=0.95. The ϕ-divergence adopts the KL-type log-divergence function, whose convex conjugate form facilitates subproblem dualization. Simultaneously, the random loss function L(x,ξ) is constructed by combining the cost deviation estimation function output from quantile regression. To ensure interpretability and stability of the FREI index in practical modeling, its four-dimensional indicators are assigned empirical Bayesian risk weights as shown in Table 2. These weights are synergistically optimized through prior sensitivity structures and posterior PQR estimates, serving as weighting coefficients for indicator aggregation within the FREI index. This ensures clear structural interpretability during subsequent CVaR optimization and PQR modeling.
In algorithm implementation, the main problem uses buffer ratio x and CVaR threshold η as decision variables, initially introducing five representative disturbance scenarios. The subproblem employs sample reweighting iteration to generate the worst-case distribution until the pruning plane convergence threshold ε=10−3is satisfied. Considering the fat-tailed characteristics of exchange rate volatility and supplier performance risk in the sample, the divergence radius ρ is set to the minimum value that stabilizes CVaR convergence intervals under cross-validation. Additionally, to enhance numerical stability, all costs and contract values are linearly scaled to millions of USD to avoid issues of unequal scales in optimization variables. The above parameter settings ensure the model's stability and interpretability during practical solution-seeking, while also providing a structural foundation and reproducible pathway for the results analysis in the next section.
4.3 Results Analysis
Based on the aforementioned joint modeling and optimization process, empirical results reveal that FREI exhibits a significant nonlinear amplification effect on unit cost deviations in high-quantile intervals. Particularly at the 75th percentile, β₀.₇₅ is substantially higher than the median path (β₀.₅), validating its rationale as an input for CVaR tail structure. At the distribution-robust optimization level, the solution obtained by integrating ϕ-divergence uncertainty sets reduces the CVaR metric by 28.1% at the 95% confidence level compared to the baseline model (without robust treatment). Simultaneously, the buffer allocation is more concentrated on high-risk project phases than the mean-based method, significantly shortening the budget recovery cycle by 12.4%. Figure 4 illustrates the distribution comparison between robust and non-robust solutions in a two-dimensional strategy space, highlighting the former's superiority in tail loss control and reduced strategy dispersion. Furthermore, in scenarios where FREI decreases by 10%, project cost overrun rates drop by 15.8% and on-time delivery rates increase by 19.4%. To evaluate the statistical robustness of these improvements, a bootstrapped significance test with 1,000 replications was performed. The average treatment effects were found to be statistically significant at the 5% level, with 95% confidence intervals of [−21.3%, −10.6%] for cost overrun reduction and [+12.2%, +26.1%] for on-time delivery improvement. The associated p-values were both below 0.01, confirming that these results are unlikely to be due to random chance. This supplemental analysis enhances the empirical credibility of the FREI index as a forward-looking intervention tool and supports the causal interpretation of its impact on project outcomes. Further global sensitivity analysis using Sobol indices reveals that supplier performance volatility and exchange rate variance contribute most significantly to CVaR fluctuations (0.39 and 0.27, respectively). This outcome provides critical guidance for front-end data governance and contract phasing control, while validating the PQR–PhiDRO approach’s effectiveness in capturing structural risk sources. To translate these findings into actionable risk mitigation strategies, case-based analysis was conducted on two representative projects within the sample. In Project A, where Sobol analysis indicated a high sensitivity to supplier default rates, a dynamic supplier scoring mechanism was implemented based on rolling performance data and third-party credit updates (sourced from Dun & Bradstreet). High-risk suppliers were either replaced or required to accept stricter payment terms. As a result, the project's CVaR estimate dropped by 21.5% relative to baseline. In Project B, exposed to high exchange rate volatility (σfx > 0.25), the financial team applied a forward contract hedging policy coupled with adaptive invoicing linked to currency benchmarks. This intervention reduced the forecasted tail risk exposure by 18.2% and stabilized the FREI trajectory over three key execution phases. These practical implementations demonstrate how sensitivity analysis not only identifies dominant risk contributors but also supports the design of targeted and cost-effective mitigation mechanisms. Future risk governance frameworks in multinational contexts should incorporate such feedback loops, where quantitative diagnostics directly inform tactical decisions in procurement, contract structuring, and financial hedging.
5. Conclusion
The two-layer risk control framework combining CVaR-robust optimization with panel quantile regression demonstrates strong adaptability and empirical effectiveness in identifying and addressing asymmetric financial risks in multinational projects. By establishing a risk measurement mechanism centered on FREI, it effectively achieves forward-looking capture of tail risks and dynamic resource allocation responses. The distribution uncertainty set constructed via ϕ-divergence enhances the robustness of the CVaR optimization model under high-risk scenarios, while the PQR model reveals the nonlinear influence pathways of risk exposure variables on different quantile cost biases, addressing tail distortion issues unrecognized by traditional mean-based models. Although the joint model demonstrates strong numerical performance and interpretability, challenges remain in controlling model complexity, improving solution efficiency, and addressing the impact of multidimensional heterogeneous data on FREI stability. One notable limitation lies in the scope of the empirical sample: the current study relies on 45 projects from the telecommunications and IT industries, which may constrain the generalizability of the findings. Industry-specific factors such as rapid technology iteration, supplier concentration, and high volatility in contract execution may have influenced the observed cost behavior patterns and risk transmission pathways. To enhance the robustness and applicability of the proposed framework, future studies should consider expanding the dataset to include cross-industry projects—such as manufacturing, energy, or logistics—where financial risk structures may differ substantially. Furthermore, validation on larger-scale datasets would facilitate more stable parameter estimation and improve the external validity of the FREI-based risk control strategy. These extensions would help establish the model's broader relevance for multinational financial governance.
References
- Embrechts, P.; Schied, A.; Wang, R. Robustness in the optimization of risk measures[J]. Operations Research 2022, 70, 95–110. [Google Scholar] [CrossRef]
- Giacometti, R.; Torri, G.; Paterlini, S. Tail risks in large portfolio selection: penalized quantile and expectile minimum deviation models[J]. Quantitative Finance 2021, 21, 243–261. [Google Scholar] [CrossRef]
- Ermolieva, T.; Ermoliev, Y.; Havlik, P.; et al. Connections between robust statistical estimation, robust decision-making with two-stage stochastic optimization, and robust machine learning problems[J]. Cybernetics and systems analysis 2023, 59, 385–397. [Google Scholar] [CrossRef]
- Hu, L. (2025). Hybrid Edge-AI Framework for Intelligent Mobile Applications: Leveraging Large Language Models for On-device Contextual Assistance and Code-Aware Automation. Journal of Industrial Engineering and Applied Science, 3(3), 10-22.
- Jiang, G.; Zhao, S.; Yang, H.; et al. Research on finance risk management based on combination optimization and reinforcement learning[C]//Proceeding of the 2024 5th International Conference on Computer Science and Management Technology. 2024: 642-647.
- Jin, W.; Wang, P.; Yuan, J. Key Role and Optimization Dispatch Research of Technical Virtual Power Plants in the New Energy Era[J]. Energies 2024, 17, 5796. [Google Scholar] [CrossRef]
- Chen, Y.; Deng, L.; Peng, C. Financial Openness, Bank Systematic Risk, and Macroprudential Supervision[J]. Complexity 2024, 2024, 1798385. [Google Scholar] [CrossRef]
- Obeid, H.; Ozturk, A.T.; Zeng, W.; et al. Learning and optimizing charging behavior at PEV charging stations: Randomized pricing experiments, and joint power and price optimization[J]. Applied Energy 2023, 351, 121862. [Google Scholar] [CrossRef]
- Liu, H.; Huang, W. Sustainable financing and financial risk management of financial institutions—case study on Chinese banks[J]. Sustainability 2022, 14, 9786. [Google Scholar] [CrossRef]
- Wu, F.; Zhang, Z.; Zhang, D.; et al. Identifying systemically important financial institutions in China: New evidence from a dynamic copula-CoVaR approach[J]. Annals of Operations Research 2023, 330, 119–153. [Google Scholar] [CrossRef]
Figure 1.
Structural Diagram of the Joint CVaR-PQR Two-Layer Risk Control Framework.
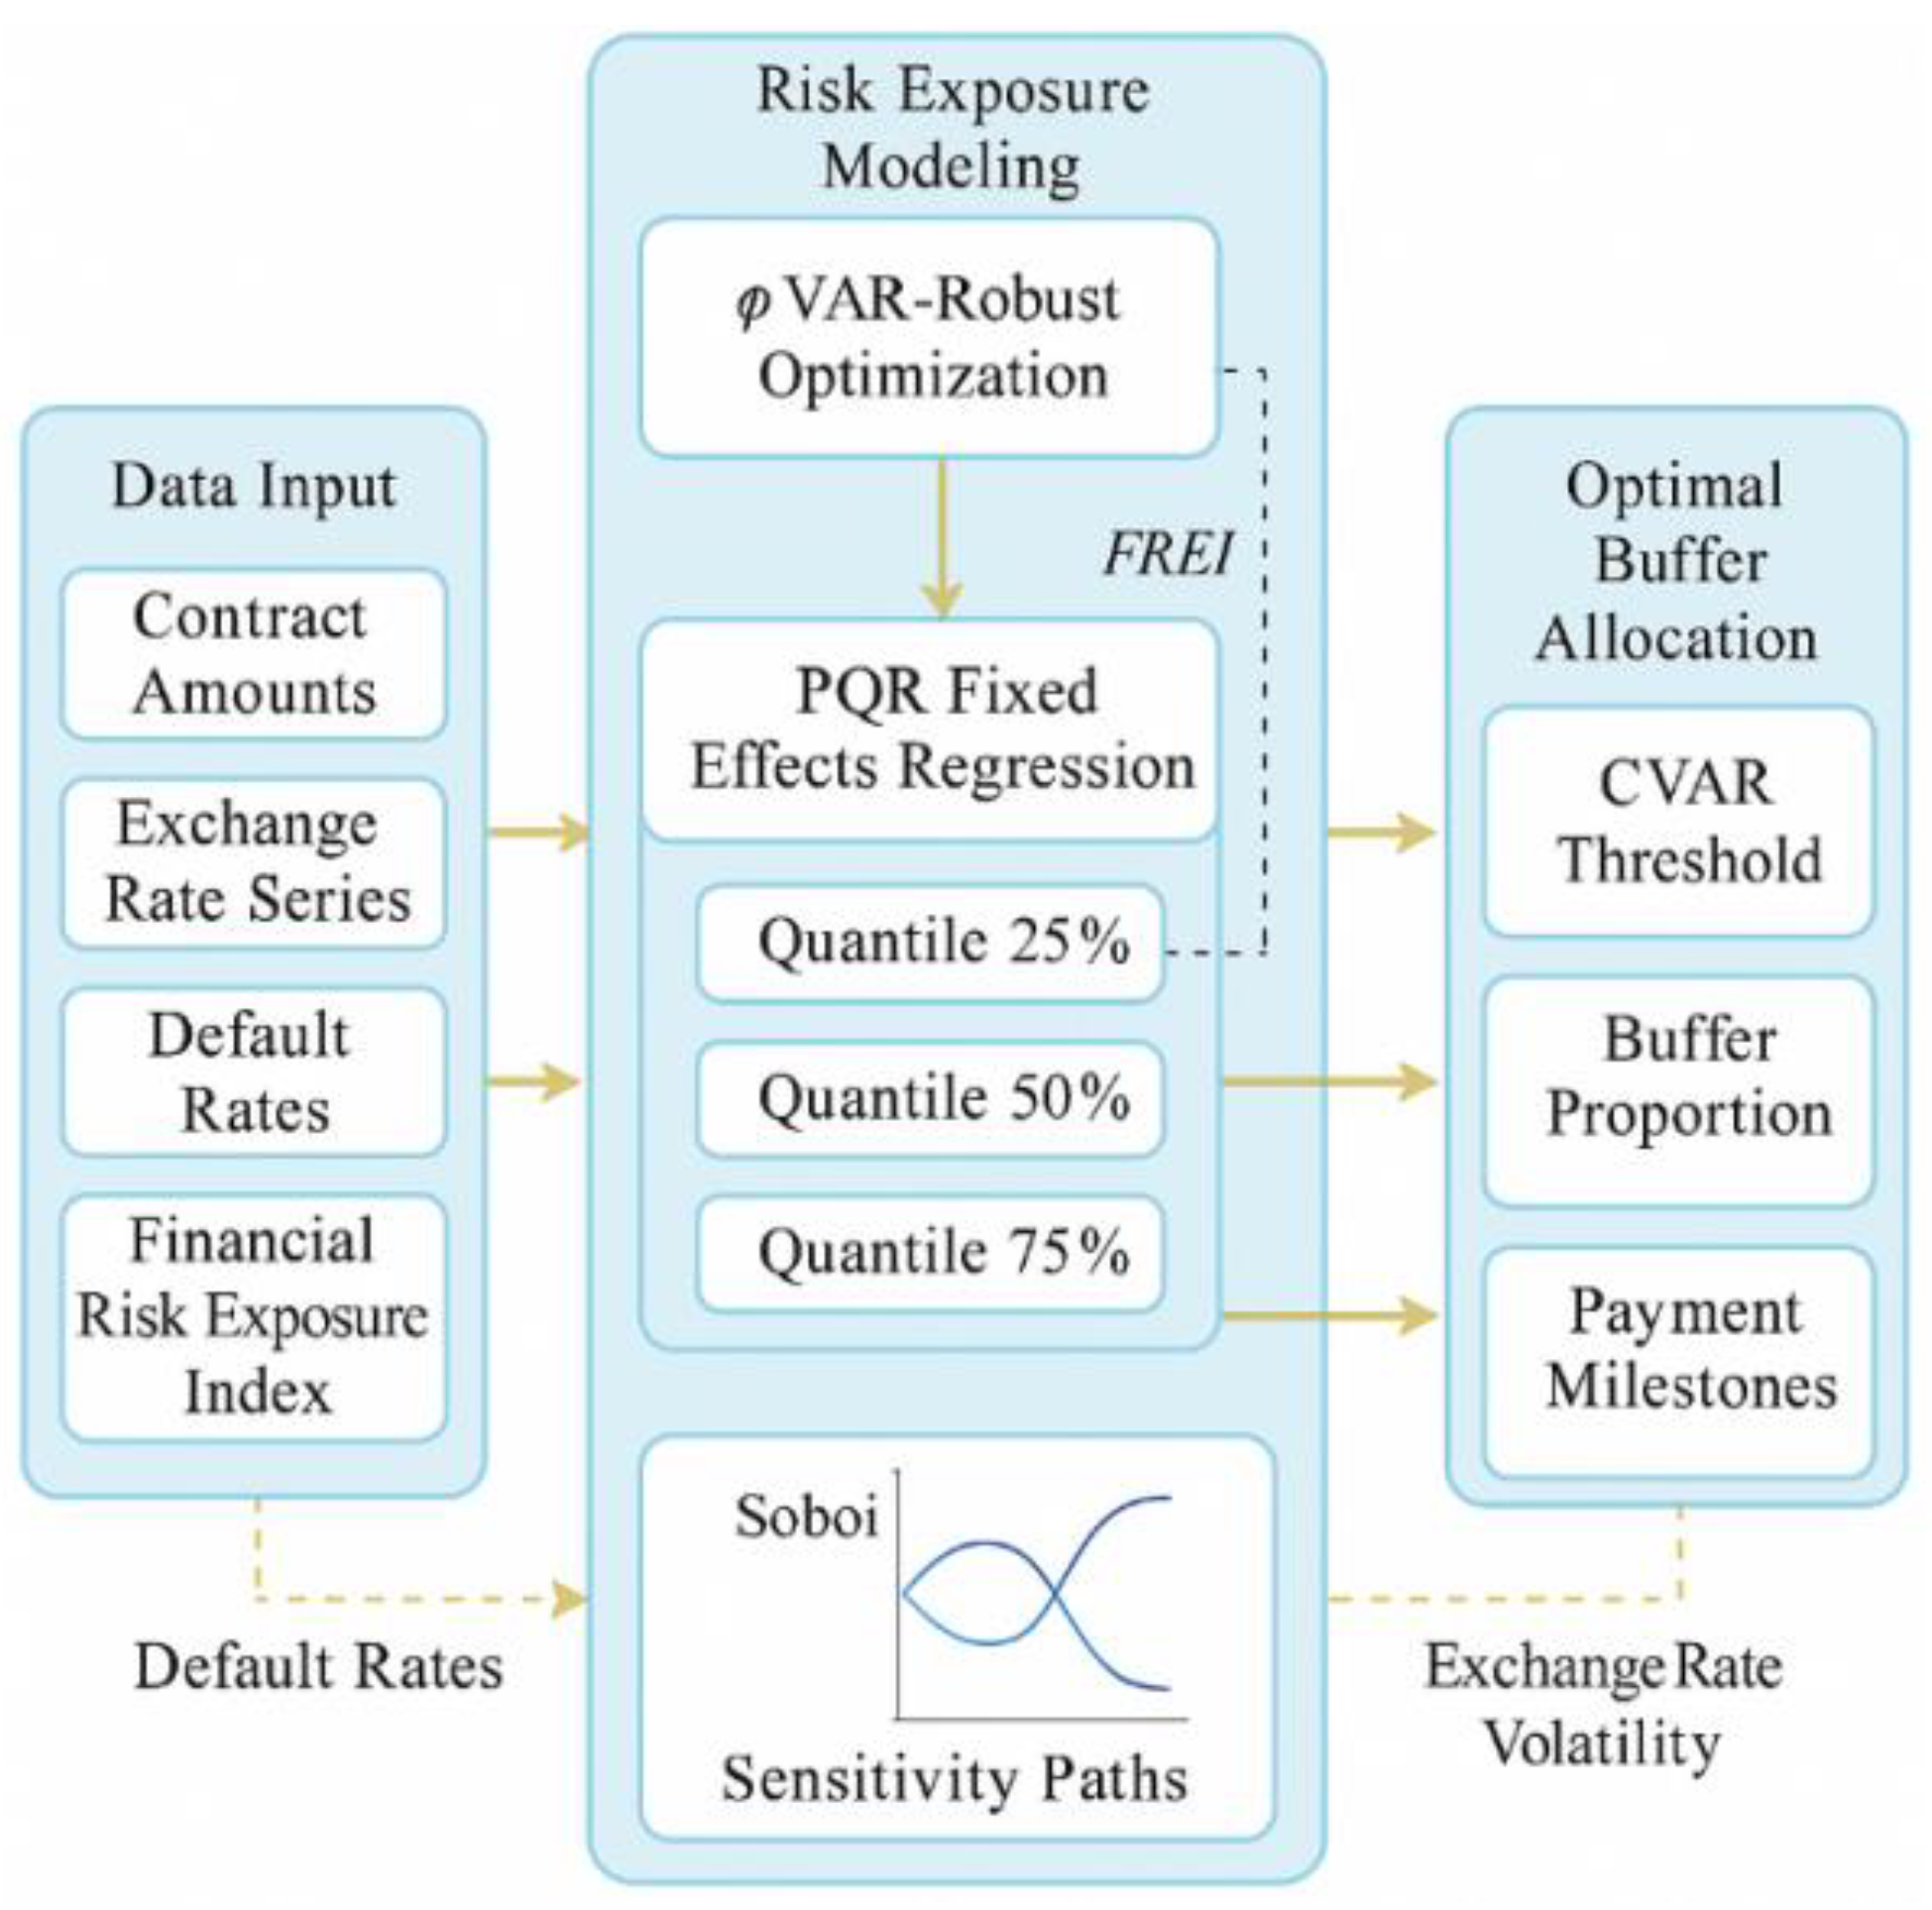
Figure 2.
Schematic of DRO-CVaR structure driven by ϕ-dispersion sphere and boxed support set.
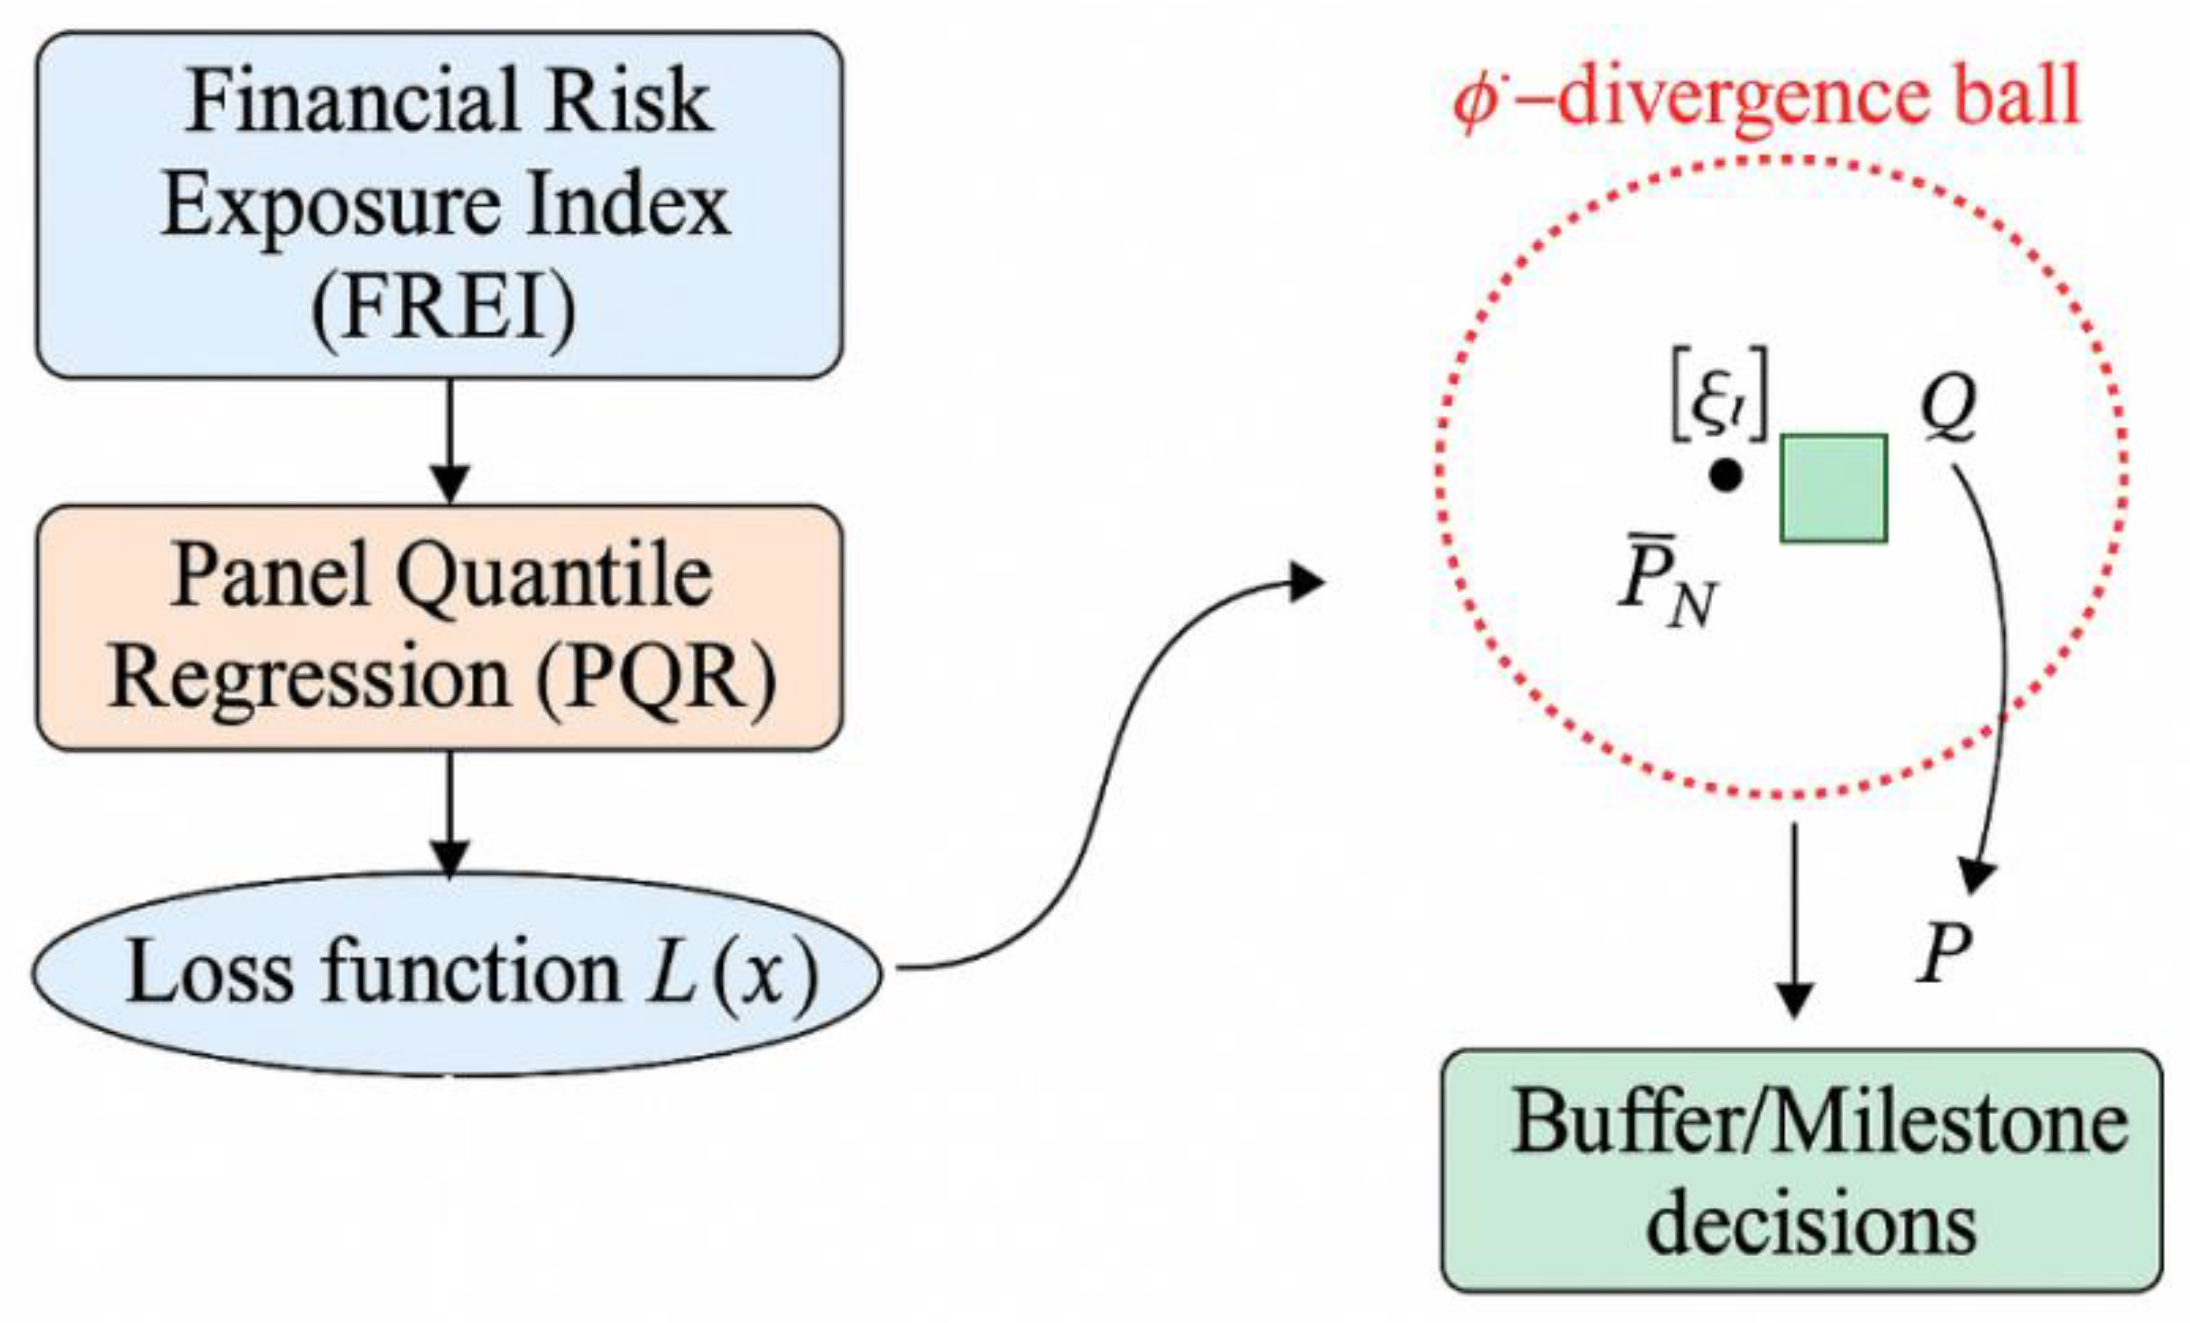
Figure 3.
Schematic diagram of the Benders–C&CG joint algorithm solution structure.
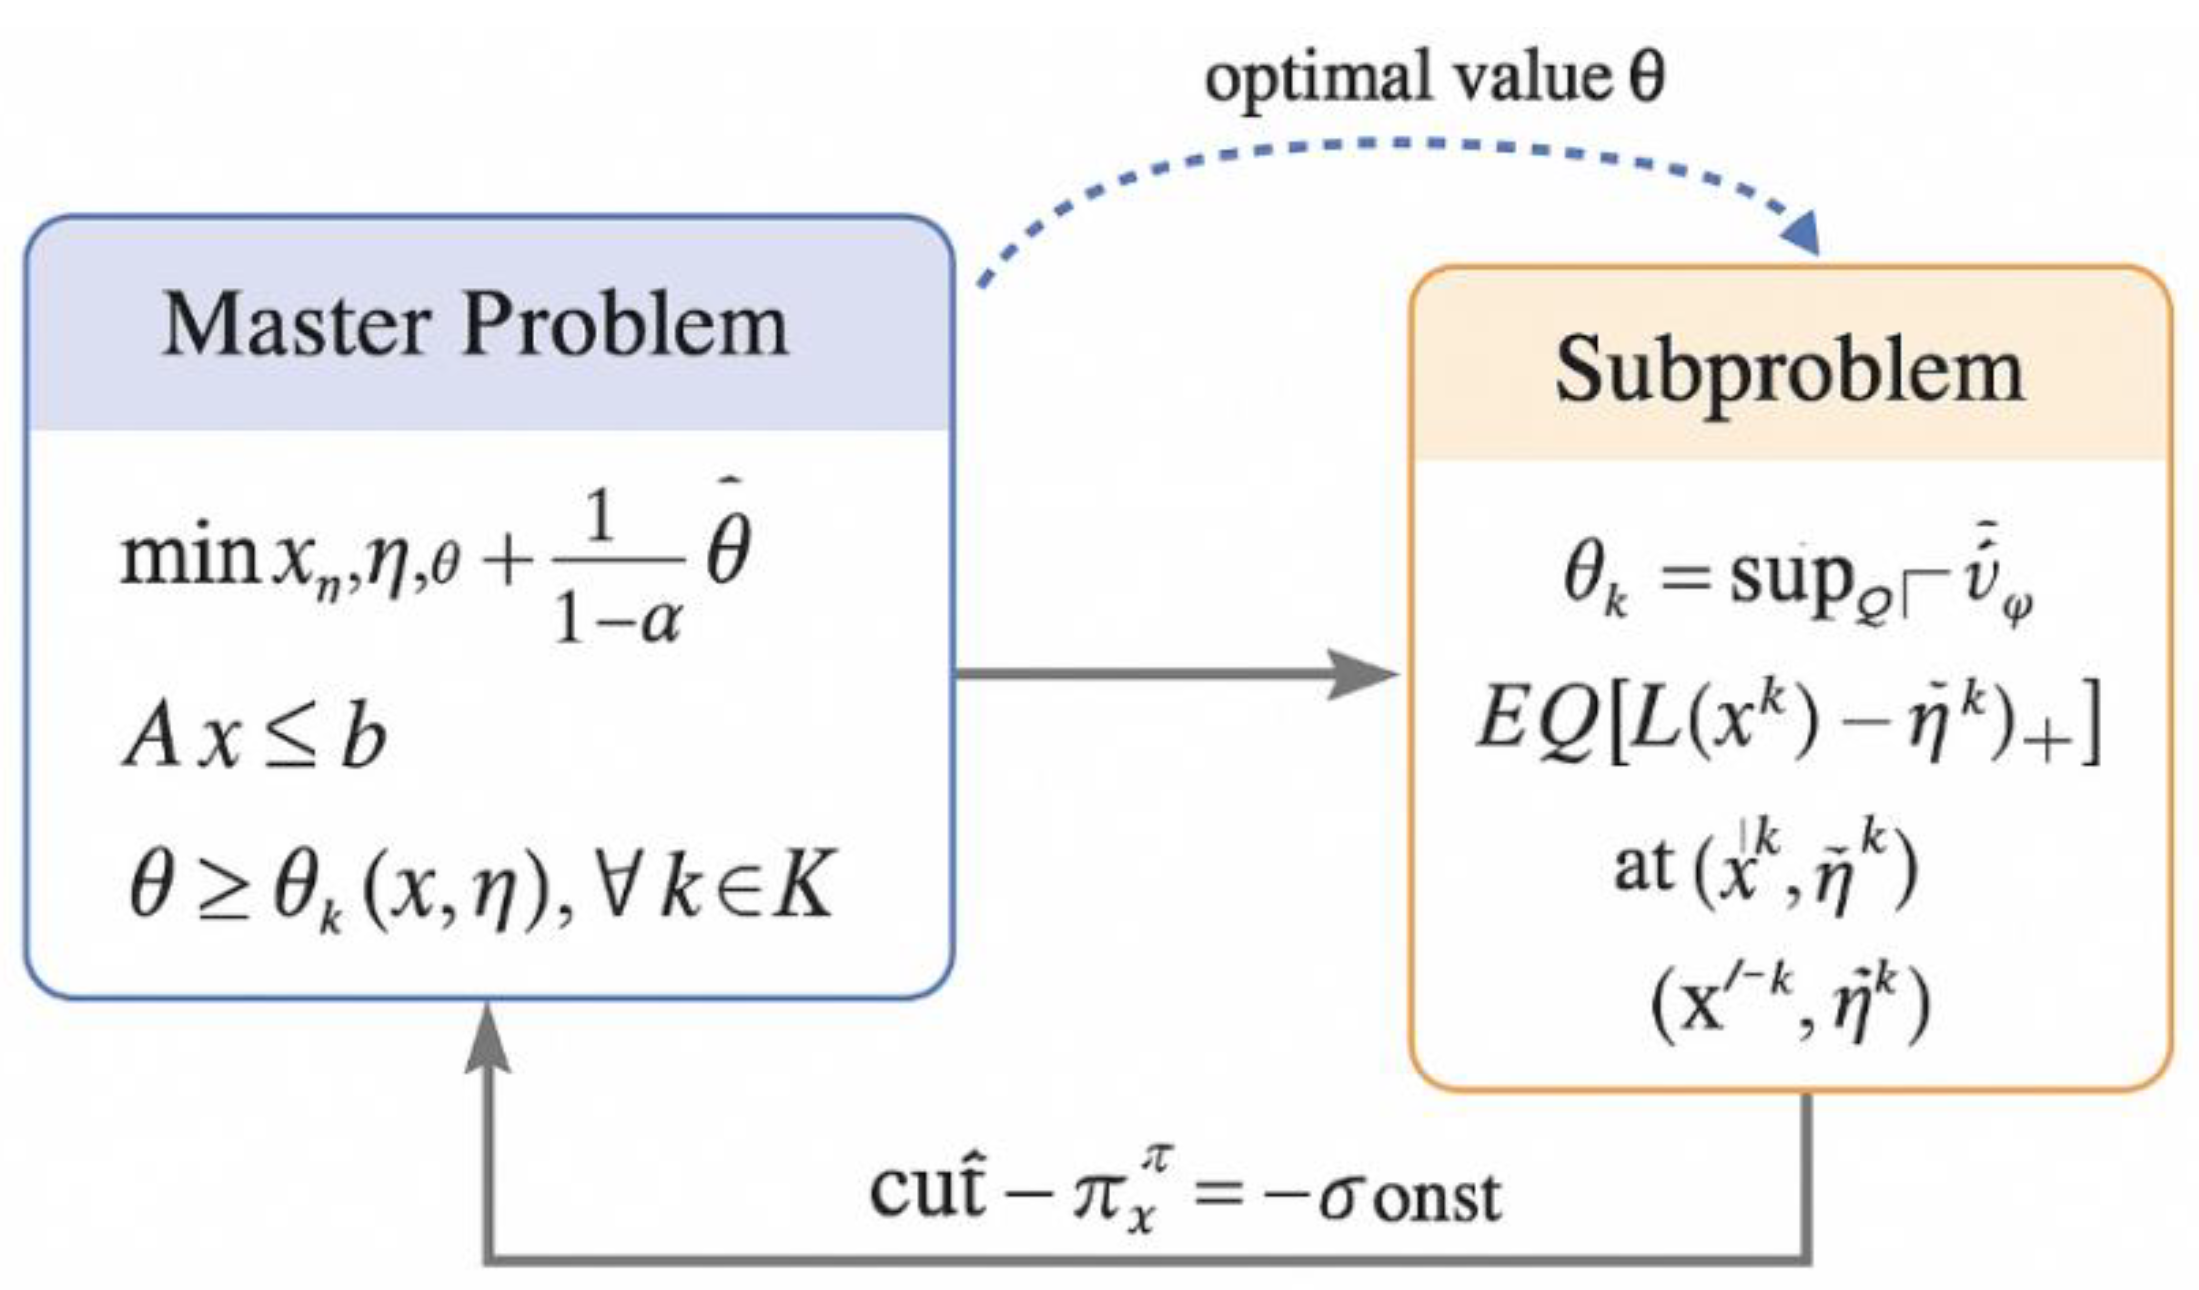
Figure 4.
Policy Distribution Maps for CVaR Robust and Non-Robust Solutions.
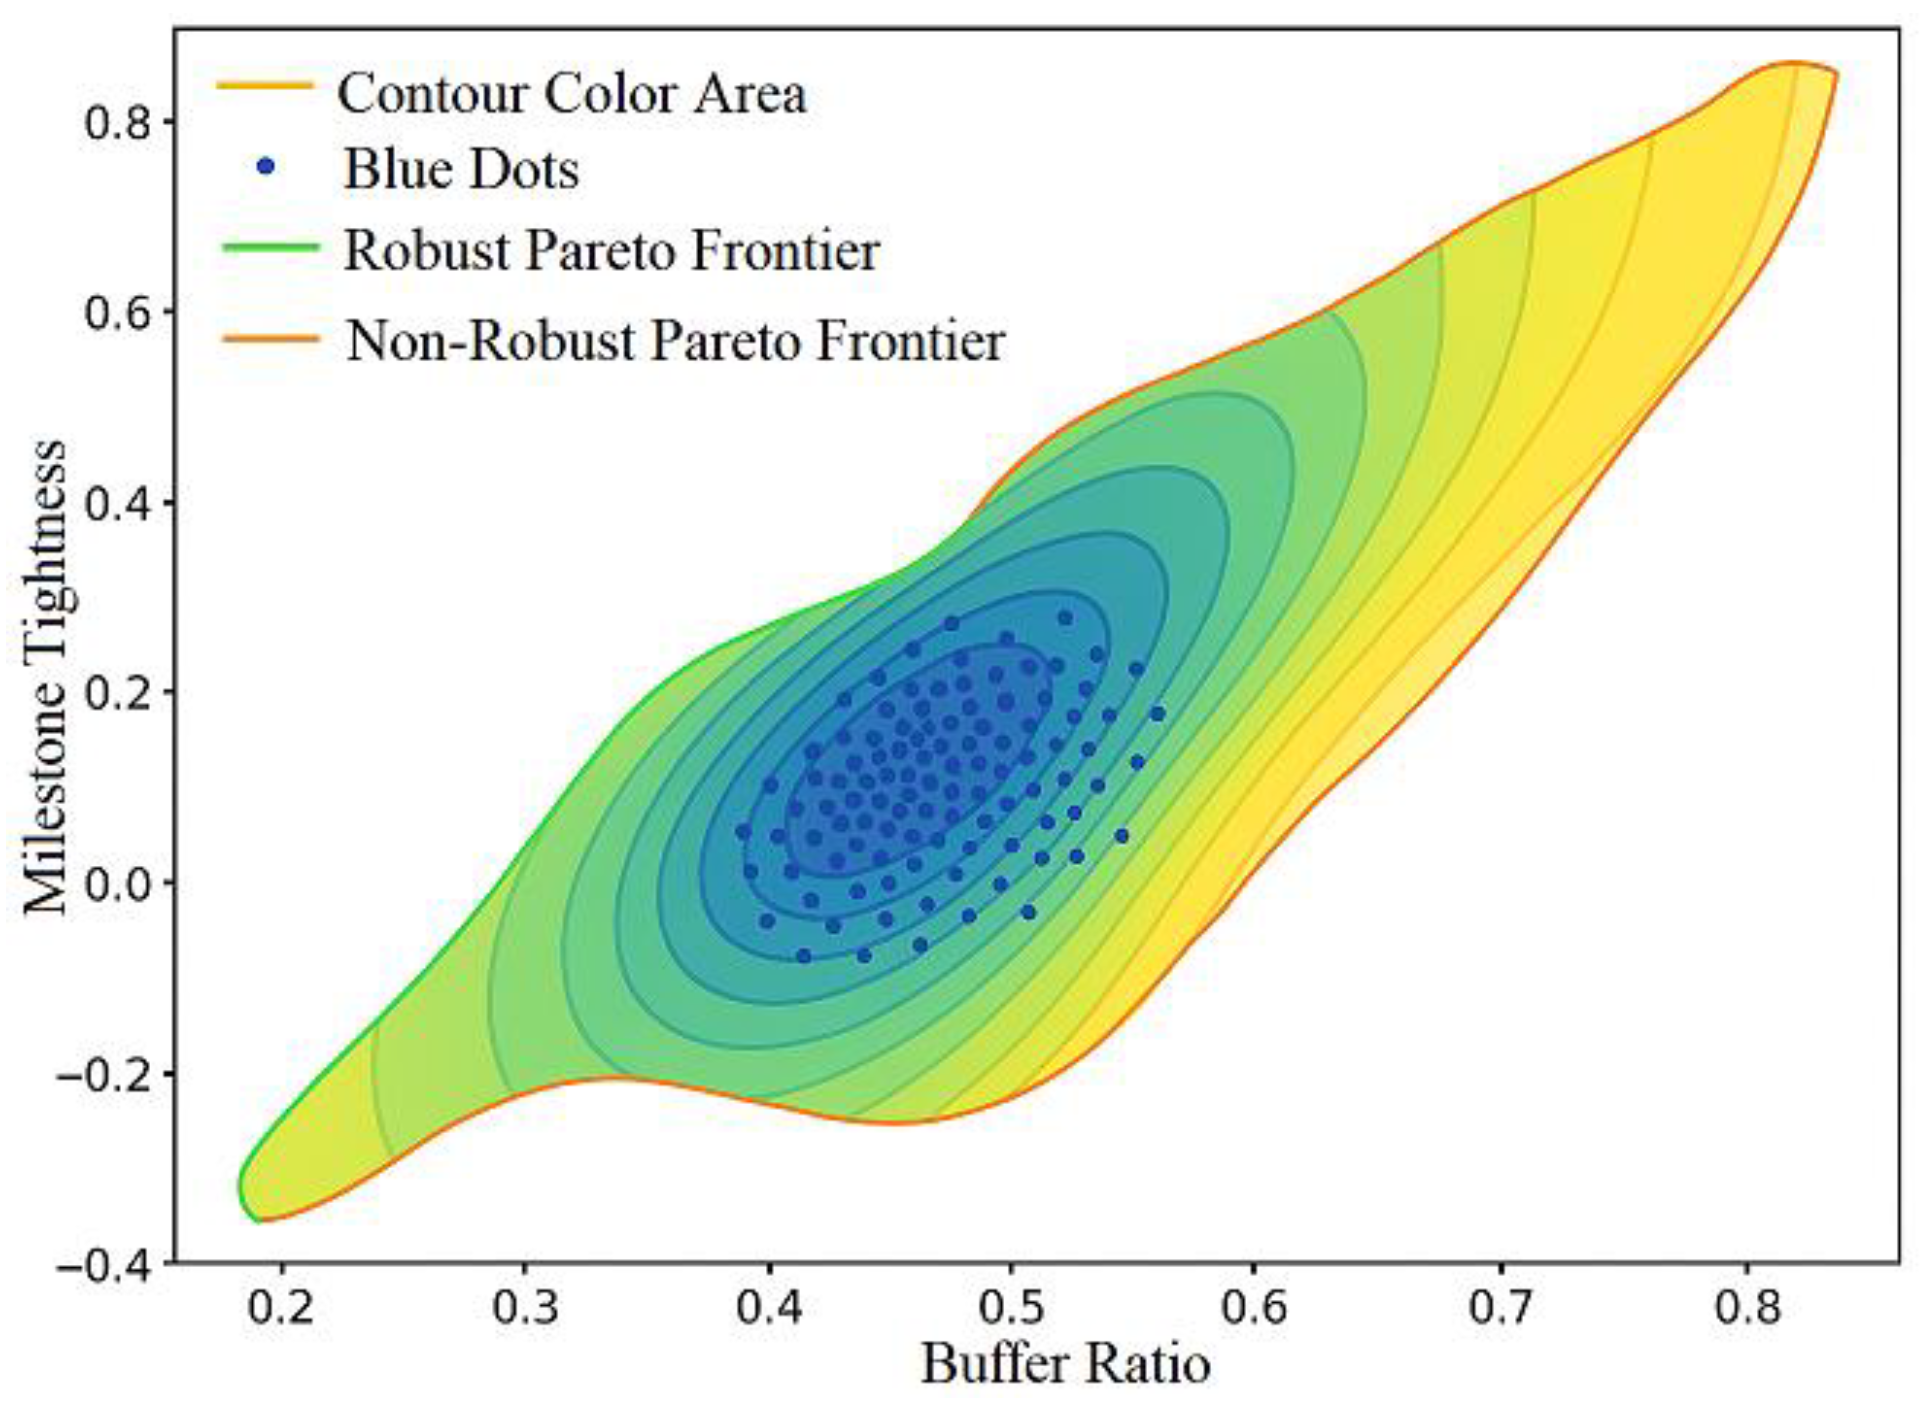

Table 1.
Descriptive Statistics of FREI Component Indicators for Sample Projects (N=45).
| Indicator Name | Symbol | Mean | Standard Deviation | Minimum value | Maximum |
| Exchange Rate Volatility (12-Month Annualized) | σfx | 0.142 | 0.067 | 0.035 | 0.324 |
| Supplier default rate (within the year) | rdefault | 0.048 | 0.026 | 0.000 | 0.122 |
| Payment Period Deviation (Days of Discrepancy Between Payment Received and Invoice Issued) | Δcash | 12.3 | 6.8 | -3.0 | 31.0 |
| Contract Value Volatility (Phase Standard Deviation) | σcontract | 0.109 | 0.053 | 0.021 | 0.254 |
Table 2.
Empirical Bayesian Risk Weights.
| Indicator | Symbol | Risk Exposure Weight (wi) | Description |
| Exchange Rate Volatility | σfx | 0.35 | Based on the highest contribution rate (0.39) in the Sobol sensitivity analysis results, reflecting its most significant impact on the tail of cost deviation |
| Supplier Default Rate | rdefault | 0.30 | Second-highest contribution rate (0.27), with strong correlations observed across multiple projects regarding delays/cost overruns |
| Payment Term Deviation | Δcash | 0.20 | Significantly impacts payment uncertainty, but its tail cost amplification effect is secondary to the preceding two factors |
| Contract Amount Volatility | σcontract | 0.15 | A structural indicator that influences long-term budget planning but has limited impact on short-term loss amplification |
Disclaimer/Publisher’s Note: The statements, opinions and data contained in all publications are solely those of the individual author(s) and contributor(s) and not of MDPI and/or the editor(s). MDPI and/or the editor(s) disclaim responsibility for any injury to people or property resulting from any ideas, methods, instructions or products referred to in the content. |
© 2025 by the authors. Licensee MDPI, Basel, Switzerland. This article is an open access article distributed under the terms and conditions of the Creative Commons Attribution (CC BY) license (http://creativecommons.org/licenses/by/4.0/).
Copyright: This open access article is published under a Creative Commons CC BY 4.0 license, which permit the free download, distribution, and reuse, provided that the author and preprint are cited in any reuse.


