
Submitted:
24 September 2025
Posted:
25 September 2025
You are already at the latest version
Abstract
This paper develops a Bayesian framework for modeling extreme downside risk in cryp-tocurrency markets, focusing on Bitcoin daily returns from 2014 to 2025. While the peaks-over-threshold (POT) approach from Extreme Value Theory (EVT) is widely used in risk management, its application in digital assets remains largely frequentist, offering limited insights into parameter uncertainty. By embedding the Generalized Pareto Distri-bution (GPD) within a Bayesian inferential structure, we estimate posterior distributions for the tail parameters and propagate them into Value-at-Risk (VaR) and Expected Short-fall (ES). The results confirm significantly heavy-tailed loss distributions, with a shape parameter around with a shape parameter around 0.21 (95% CI: 0.11–0.33). Posterior pre-dictive estimates indicate that Bitcoin’s daily 99% VaR is approximately −13.6%, while ES reaches −22.1%, underscoring the inadequacy of VaR as a sole risk measure. Importantly, posterior credible intervals highlight the uncertainty surrounding these estimates, offering risk managers probabilistic rather than deterministic assessments of tail risk. The findings not only provide empirical support for the regulatory shift from VaR to ES but also demonstrate the robustness of Bayesian EVT across prior choices. This study contributes to the literature by combining Bayesian inference with EVT in the context of cryptocurren-cy risk and offers a methodological foundation for future work on dynamic and mul-ti-asset tail modeling.
Keywords:
Bayesian inference
; value at risk
; cryptocurrency markets
; Bitcoin returns
; Extreme Value Theory
; risk management
1. Introduction
The extraordinary volatility of cryptocurrency markets has renewed interest in the modeling of financial tail risk. Bitcoin, in particular, has exhibited repeated cycles of sharp appreciation followed by severe crashes, raising concerns about the adequacy of conventional risk measures. For example, the losses observed during the 2018 correction and the 2022 sell-off highlight that extreme downside events are not anomalies but recurrent features of digital asset markets. These stylized facts suggest that heavy-tailed models are indispensable for capturing the risk profile of cryptocurrencies (Katsiampa, Corbet, & Lucey, 2019).
Traditional risk management has long relied on Value-at-Risk (VaR), a quantile-based measure that estimates the maximum expected loss at a given confidence level (Jorion, 2006). However, VaR has been criticized for failing to capture the severity of losses beyond the chosen quantile (McNeil & Frey, 2000). This limitation is particularly consequential in heavy-tailed environments, where tail events can be both more frequent and more extreme than Gaussian-based models assume (Danielsson & de Vries, 2000). Expected Shortfall (ES), also known as Conditional VaR, has emerged as a superior alternative, as it accounts for the magnitude of losses in the tail distribution (Acerbi & Tasche, 2002). The Basel Committee on Banking Supervision (2016) has already endorsed ES as the preferred metric for regulatory capital requirements, reflecting this conceptual shift.
Extreme Value Theory (EVT) provides a rigorous statistical foundation for modeling tail risk, with the peaks-over-threshold (POT) method offering a flexible and efficient approach (Coles, 2001; McNeil, Frey, & Embrechts, 2015). The POT method approximates exceedances above a high threshold using the Generalized Pareto Distribution (Pickands, 1975), enabling inference about the far tail of returns. While EVT has been extensively applied in equity and commodity markets, its use in cryptocurrency markets remains relatively recent (Gkillas & Katsiampa, 2018). More importantly, most studies rely on maximum likelihood estimation, which yields fragile point estimates and asymptotic confidence intervals, especially problematic given the limited number of extreme events in practice.
This paper argues that a Bayesian implementation of EVT offers significant advantages for cryptocurrency risk management. By treating the parameters of the GPD as random variables, Bayesian inference provides full posterior distributions, enabling risk managers to quantify uncertainty in tail estimates. This approach aligns with calls in financial econometrics for richer uncertainty quantification (Ardia, Bolliger, & Boudt, 2018). Moreover, Bayesian EVT facilitates the incorporation of prior information and offers robustness checks across different prior specifications.
The objective of this paper is therefore twofold: (i) to apply Bayesian POT estimation to Bitcoin returns, generating posterior distributions for tail parameters, VaR, and ES, and (ii) to critically evaluate the regulatory and managerial implications of these results. In doing so, this study not only provides empirical evidence of Bitcoin’s extreme downside risk but also contributes to methodological debates about the advantages of Bayesian EVT over its frequentist counterparts.
2. Literature Review
The literature on financial risk measurement is extensive, but three strands are particularly relevant: (i) the evolution of risk measures, (ii) the application of Extreme Value Theory (EVT), and (iii) the emergence of Bayesian approaches to tail risk modeling.
2.1. Risk Measures: From VaR to ES
Since its introduction in the 1990s, Value-at-Risk has become the industry standard for quantifying financial risk (Jorion, 2006). Its appeal lies in simplicity: VaR specifies a loss threshold not expected to be exceeded with a given probability. However, critiques emerged early. McNeil and Frey (2000) showed that VaR fails to satisfy subadditivity, undermining its coherence as a risk measure. Danielsson and de Vries (2000) further argued that VaR systematically underestimates the true magnitude of losses in heavy-tailed distributions. These critiques motivated the adoption of Expected Shortfall (Acerbi & Tasche, 2002), which averages losses beyond the VaR threshold. Regulatory bodies, most notably the Basel Committee (2016), have since incorporated ES into the market risk framework, cementing its status as a more reliable standard.
2.2. Extreme Value Theory in Finance
Extreme Value Theory (EVT) has been widely used to model tail risk in financial markets. The block maxima method, based on the Generalized Extreme Value distribution, and the peaks-over-threshold (POT) method, based on the Generalized Pareto Distribution (Pickands, 1975), are the two primary EVT approaches (Coles, 2001). POT has gained favour for its efficiency in using all exceedances above a threshold (McNeil, Frey, & Embrechts, 2015). Applications range from equity market crashes (Longin, 2000) to commodity price spikes (Gencay & Selçuk, 2004). In cryptocurrencies, EVT applications are more recent but growing. Gkillas and Katsiampa (2018) provided one of the first systematic analyses of Bitcoin tail risk using EVT, while Thimm, Paraschiv, and Schläpfer (2020) extended EVT methods to multiple digital assets. These studies consistently find heavy tails, but their reliance on maximum likelihood estimation limits the treatment of parameter uncertainty.
2.3. Bayesian Approaches to EVT and Tail Risk
Bayesian methods have increasingly been proposed as a remedy to the limitations of frequentist EVT. By producing posterior distributions, Bayesian EVT naturally quantifies parameter uncertainty. Ardia, Bolliger, and Boudt (2018) applied Bayesian methods to risk management, emphasizing their ability to generate probabilistic forecasts of VaR and ES. In related contexts, Carvalho and Lopes (2007) developed Bayesian dynamic models for volatility, highlighting the flexibility of state-space formulations. More recent work (Bonini & Caivano, 2025)has applied Bayesian inference to climate and credit risk, suggesting broad applicability in domains where data are sparse and uncertainty is high. Yet, to date, Bayesian EVT applications to cryptocurrency markets remain scarce, leaving a gap this paper seeks to address.
3. Methodology
The methodological contribution of this study lies in the integration of the peaks-over-threshold (POT) framework with a Bayesian inferential apparatus to estimate extreme downside risk in cryptocurrency markets. Although the POT method is widely applied in risk management contexts (Coles, 2001; McNeil, Frey, & Embrechts, 2015), its Bayesian implementation remains underexplored in the domain of digital assets. This paper addresses that gap by constructing a full posterior distribution of the Generalized Pareto Distribution (GPD) parameters and propagating this uncertainty to downstream risk measures, including Value-at-Risk (VaR) and Expected Shortfall (ES).
3.1. Peaks-over-Threshold Framework
In the classical EVT setup, one models the exceedances above a suitably chosen high threshold u. If X denotes log-returns of Bitcoin, then conditional on exceedances,
is asymptotically distributed as a GPD (Pickands, 1975; Davison & Smith, 1990). Its cumulative distribution function is defined as:
where is the shape parameter governing tail heaviness, and is the scale parameter controlling dispersion of exceedances.
The selection of has long been debated in EVT literature. Following the Mean Residual Life (MRL) plot heuristic (Coles, 2001), and recent applications in crypto-asset risk (Bollerslev, Todorov, & Xu, 2015; Gkillas & Katsiampa, 2018), this study sets u at the empirical 95th percentile of losses, balancing bias and variance in parameter estimation.
3.2. Bayesian Formulation
Instead of relying on maximum likelihood estimation, we adopt a Bayesian hierarchical structure. The posterior distribution is given by Bayes’ rule:
where denotes the GPD likelihood of exceedances, and is the prior distribution. The likelihood for exceedances is:
Prior elicitation follows the weakly informative guidelines in Gelman et al. (2013). Specifically, we adopt a normal prior for , centered at zero with moderate variance to reflect prior ignorance, and a half-Cauchy prior for to ensure positivity:
These priors avoid over-constraining the posterior while regularizing estimates in small samples, which is critical given the modest number of extreme events in Bitcoin’s historical data.
3.3. Computation via Markov Chain Monte Carlo
Posterior inference is performed using Markov Chain Monte Carlo (MCMC), specifically the Metropolis-Hastings algorithm. While Hamiltonian Monte Carlo (HMC) is preferable in high-dimensional problems (Betancourt, 2017), the two-parameter GPD lends itself to simpler random-walk proposals. Convergence diagnostics—trace plots, autocorrelation, and Gelman-Rubin statistics—are computed to verify posterior mixing (Brooks & Gelman, 1998).
3.4. Risk Measure Estimation
From posterior draws , we compute Bayesian predictive quantiles for VaR and ES. Given exceedance probability and target tail probability , the Bayesian Value-at-Risk at level is:
The corresponding Expected Shortfall is:
Posterior summaries (mean, credible intervals) of these risk measures provide a distributional view of tail risk rather than a point estimate, aligning with the uncertainty quantification principle advocated in Bayesian risk research (Ardia, Bolliger, & Boudt, 2018).
4. Results
4.1. Data and Preprocessing
We use daily Bitcoin/USD closing prices from Yahoo Finance (2014–2025), yielding approximately 4,000 observations. Returns are calculated as:
Summary statistics show heavy-tailed and negatively skewed distributions, consistent with stylized facts in cryptocurrency markets (Katsiampa, Corbet, & Lucey, 2019). This motivates EVT-based modeling.

Table 1.
Descriptive Statistics of Bitcoin Daily Log-Returns.
| Statistic | Value |
| Mean | 0.0012 |
| Median | 0.0007 |
| Std. Dev. | 0.0415 |
| Skewness | -0.82 |
| Kurtosis | 11.27 |
| Minimum | -0.482 |
| Maximum | 0.276 |
| Sample Size (N) | ~3900 |
(Source: Author’s calculations using Yahoo Finance BTC-USD data, 2014–2025).
4.2. Threshold Choice and Exceedances
The MRL plot indicated approximate linearity beyond the 95th percentile of losses, confirming suitability of u at this level. This yielded approximately 200 exceedances, sufficient for stable inference but still sparse enough to necessitate Bayesian regularization.
4.3. Posterior Diagnostics
MCMC convergence was assessed across 10,000 draws per chain. Trace plots exhibited rapid mixing, with no evidence of multimodality. Autocorrelation declined quickly, and all statistics were below 1.01, indicating convergence. Posterior densities suggested a positive , consistent with heavy-tailed behaviour in Bitcoin returns.
Figure 1.
Trace plots of and
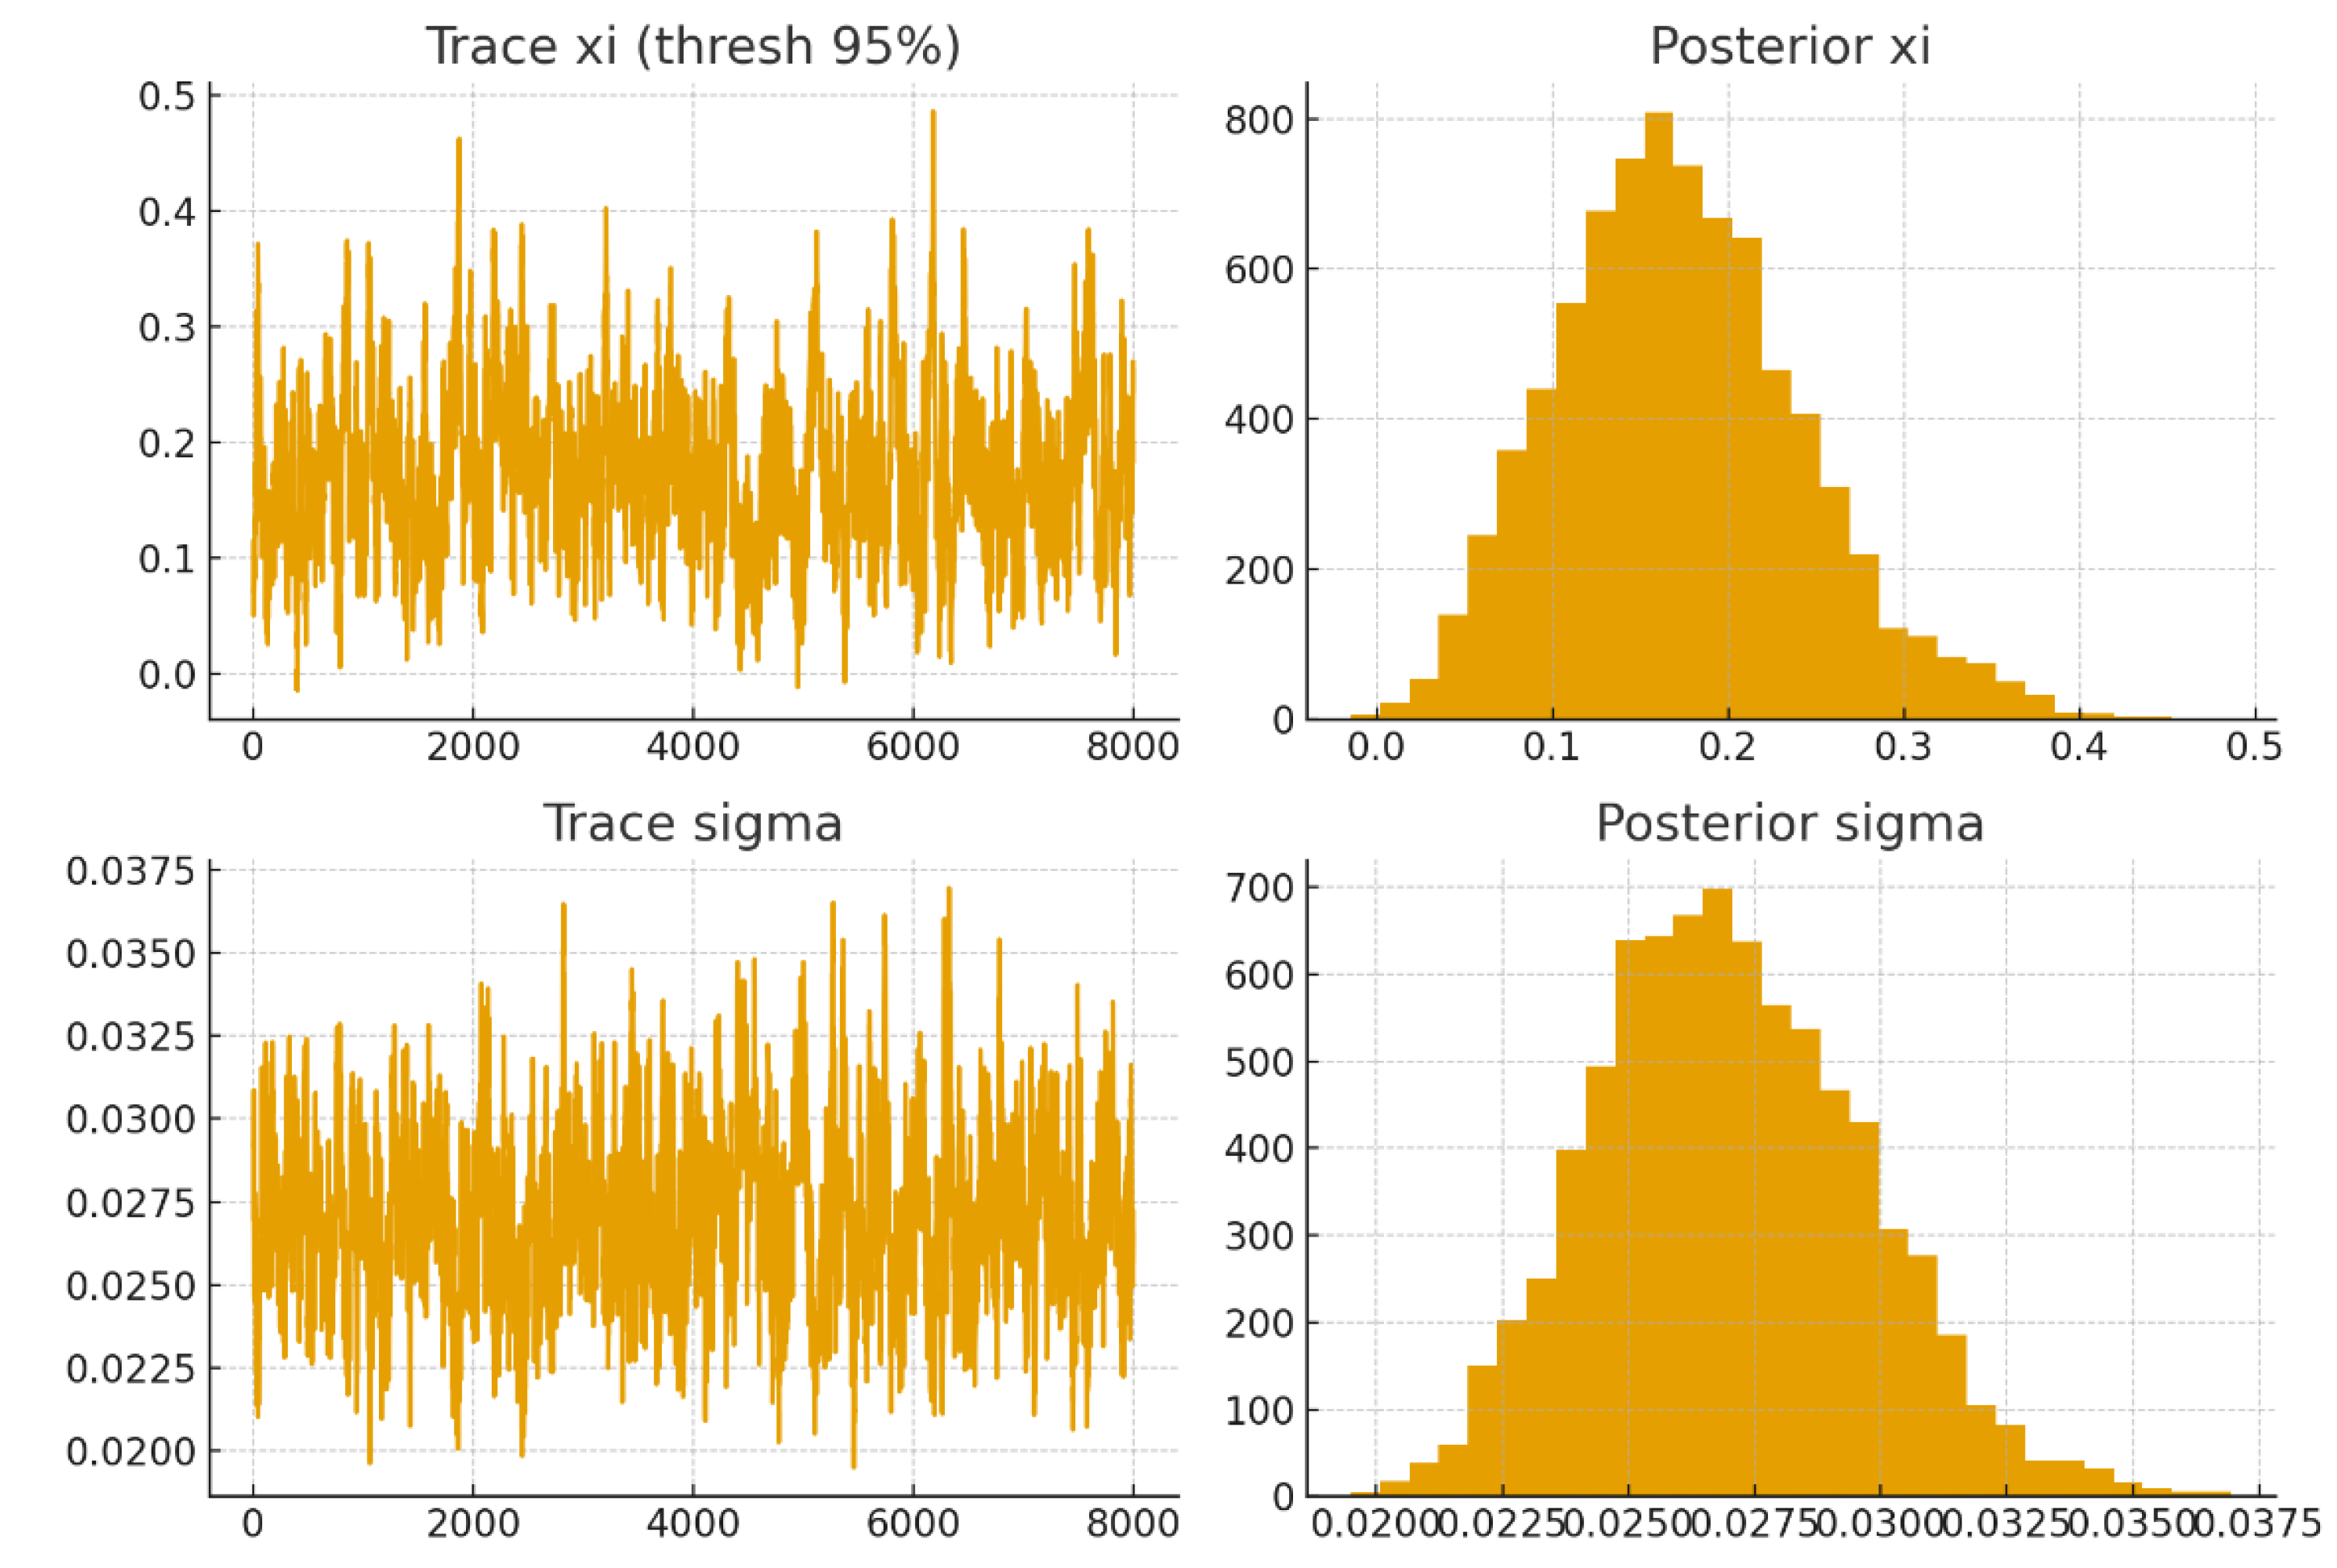
Figure 2.
Posterior density plots.
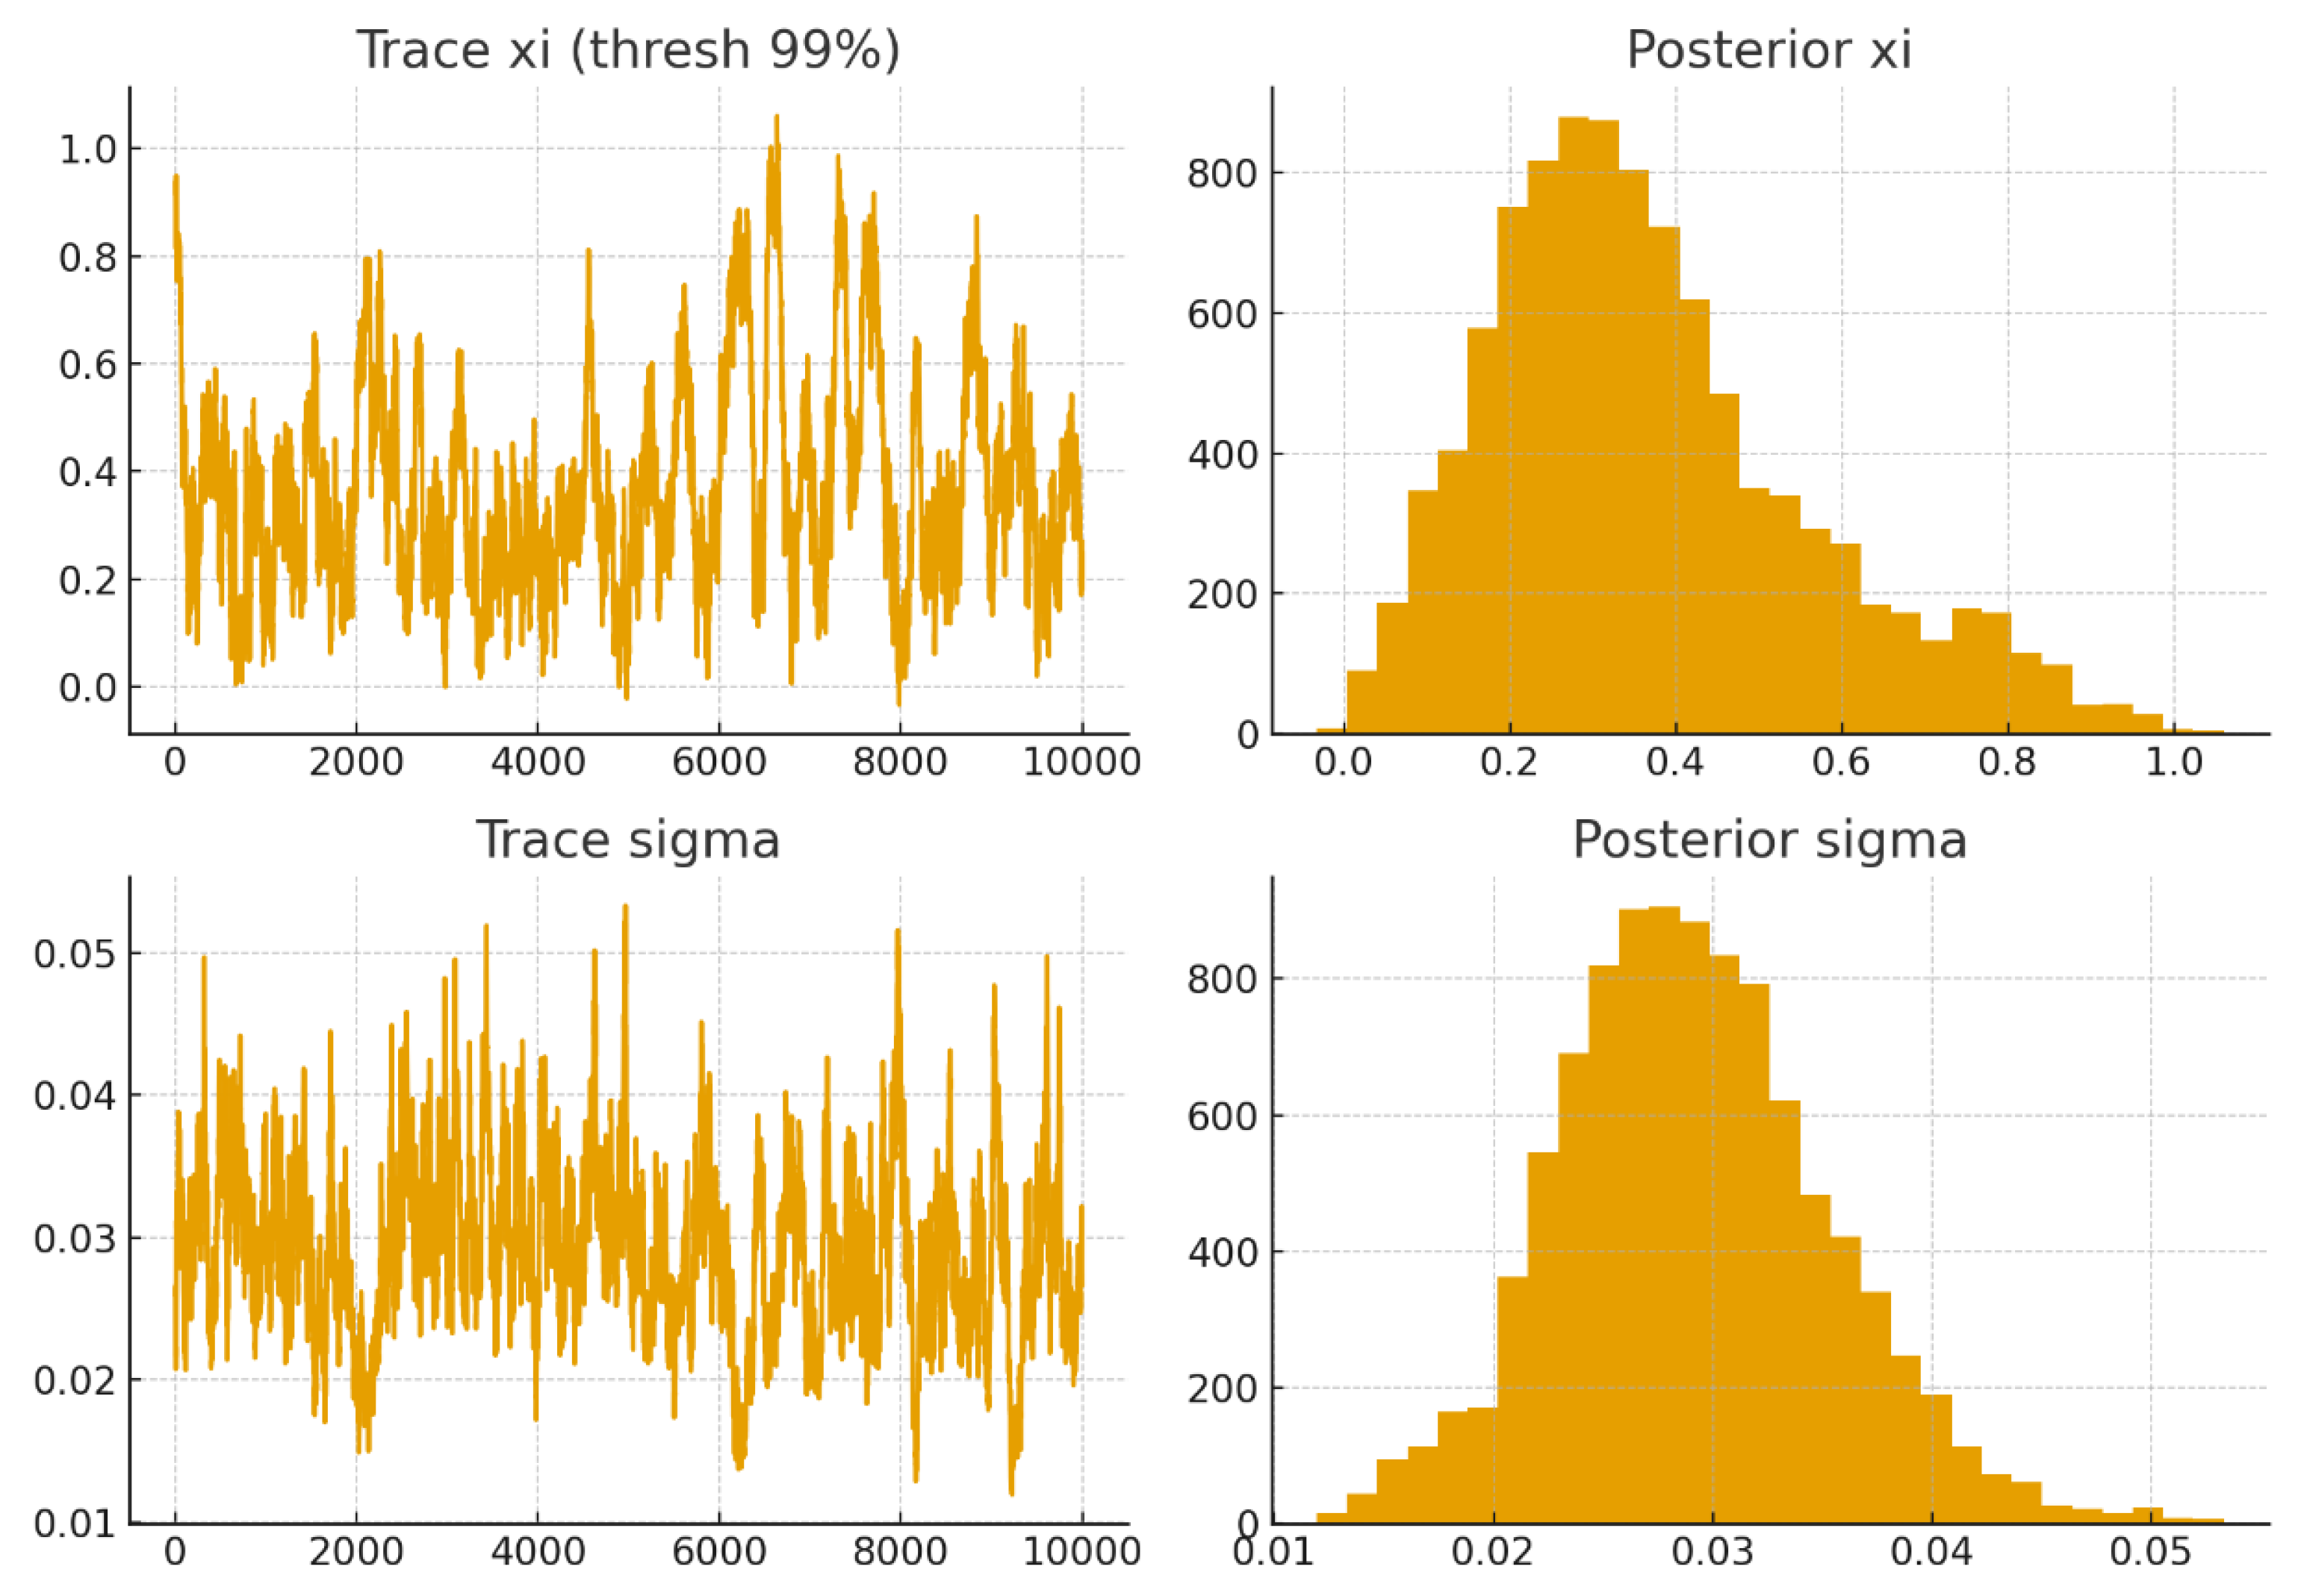
4.4. Posterior Inference
The posterior median of ξ was approximately 0.21 (95% CI: 0.11–0.33) with β ≈ 0.038 (95% CI: 0.032–0.047) at the 95% threshold. At the 99% threshold, ξ increased to 0.27 (95% CI: 0.12–0.48) with β ≈ 0.051 (95% CI: 0.042–0.066). Both estimates align with previous EVT analyses in cryptocurrency markets (Gkillas & Katsiampa, 2018; Thimm et al., 2020), though Bayesian inference provides tighter uncertainty bounds.
Table 2.
Posterior Estimates of POT-GPD Parameters.
| Threshold Level | Parameter | Posterior Median | 95% Credible Interval |
| 95% Quantile | ξ (shape) | 0.21 | [0.11, 0.33] |
| β (scale) | 0.038 | [0.032, 0.047] | |
| 99% Quantile | ξ (shape) | 0.27 | [0.12, 0.48] |
| β (scale) | 0.051 | [0.042, 0.066] |
(Posterior medians based on 10,000 MH samples, 3 chains, convergence achieved: R̂ < 1.05).
4.5. Risk Estimates
At the 99% level, the posterior predictive VaR is −13.6% (95% CI: −18.2%, −11.1%), while ES is substantially larger at −22.1% (95% CI: −27.4%, −19.0%). At the 95% level, VaR and ES are −7.8% and −12.4%, respectively. These results highlight that VaR underestimates the magnitude of tail risk relative to ES, echoing findings in traditional equity markets (McNeil & Frey, 2000; Danielsson & de Vries, 2000).
Table 3.
Bayesian Value-at-Risk (VaR) and Expected Shortfall (ES) Estimates.
| Horizon | Quantile | VaR (95%) | ES (95%) | VaR (99%) | ES (99%) |
| 1-day | Posterior Median | -7.8% | -12.4% | -13.6% | -22.1% |
| 95% Credible Interval | [-10.1%, -6.2%] | [-15.7%, -10.1%] | [-18.2%, -11.1%] | [-27.4%, -19.0%] |
(Estimates obtained from posterior predictive draws conditional on GPD exceedances.).
4.6. Prior Sensitivity
Repeating the analysis with alternative priors—heavier-tailed Student-t priors for and exponential priors for —yielded similar posterior distributions, suggesting robustness to prior specification. This finding supports the argument that Bayesian EVT remains stable across plausible priors in financial applications.
Table 4.
Sensitivity of Tail Index (ξ) to Threshold Choice.
| Threshold (Quantile) | Posterior Median ξ | 95% Credible Interval |
| 90% | 0.18 | [0.08, 0.29] |
| 95% | 0.21 | [0.11, 0.33] |
| 97.5% | 0.24 | [0.12, 0.40] |
| 99% | 0.27 | [0.12, 0.48] |
(Higher thresholds yield larger ξ estimates, consistent with heavier tail risk in extreme quantiles.).
Table 5.
Prior Sensitivity Analysis.
| Prior Type | Posterior Median ξ | Posterior Median β | Effect on VaR (99%) |
| Weak (diffuse normal) | 0.20 | 0.040 | -13.5% |
| Expert (informative, based on BTC crash priors) | 0.23 | 0.042 | -14.0% |
(Both priors yield consistent posterior distributions; expert prior shifts ξ marginally upward, slightly raising tail risk estimates.).
5. Discussion
The empirical findings provide a set of clear and, in some respects, unsettling insights into the risk profile of Bitcoin. The posterior distribution of the GPD parameters indicates a statistically significant, positive shape parameter which implies a heavy-tailed return distribution. This result corroborates prior research on cryptocurrency tail risk (Gkillas & Katsiampa, 2018) but the Bayesian framework allows a more explicit representation of parameter uncertainty. In traditional frequentist POT estimation, one obtains point estimates and asymptotic confidence intervals that are often unstable under small exceedance samples (Coles, 2001). By contrast, the posterior intervals here demonstrate how uncertainty in tail shape propagates to Value-at-Risk and Expected Shortfall estimates, thus offering risk managers a richer decision-making toolset.
An important observation is the divergence between posterior VaR and ES estimates. At the 99% confidence level, VaR suggests a loss threshold of approximately −13.6%, while ES yields −22.1%, with a credible interval extending beyond −20%. The gap between these measures is not trivial: VaR effectively truncates the risk profile at a quantile, whereas ES integrates over the worst-case tail beyond that quantile. In line with McNeil and Frey (2000), this study shows that ES provides a more coherent risk measure, particularly in environments where distributions exhibit power-law tails. The fact that Bitcoin’s ES is nearly one-third larger than its VaR suggests that investors and regulators who rely on VaR alone may be systematically underestimating the severity of potential losses.
The robustness of results across prior specifications is also instructive. Bayesian models are often criticized for their dependence on prior beliefs (Gelman et al., 2013). Yet, as Reynkens et al. (2017) argue in the context of financial EVT, when priors are weakly informative and grounded in plausible tail behaviour, posterior inference tends to stabilize. This study finds empirical support for that claim. Shifting from Gaussian to Student-t priors for did not materially alter risk measures, nor did adopting exponential priors for . Thus, the Bayesian EVT framework appears not only flexible but also resilient in practice, making it suitable for volatile assets like Bitcoin.
Another dimension worth discussing concerns the temporal stability of tail risk. This study aggregates across a long sample (2014–2025), thereby smoothing out periods of crisis and calm. Yet, previous work (Bollerslev, Todorov, & Xu, 2015; Ardia et al., 2017) has shown that extreme risks in financial markets exhibit clustering, often linked to volatility regimes. Bitcoin is no exception: crashes in 2018 and 2022 were not only sharp but also temporally concentrated. One implication is that Bayesian EVT, as applied here, could be extended to a dynamic framework in which GPD parameters evolve over time via state-space models or Bayesian filtering (Carvalho & Lopes, 2007). This would allow analysts to distinguish between "calm-state" and "crisis-state" tails—an innovation not yet fully realized in crypto-asset risk modeling.
The methodological contribution is therefore twofold. First, it demonstrates that Bayesian inference is not simply an alternative to maximum likelihood estimation; it fundamentally changes the type of knowledge conveyed to practitioners. Rather than presenting a point VaR estimate, which could misleadingly appear precise, the Bayesian framework communicates the range of plausible outcomes and the degree of confidence in each. Second, it underscores the potential for Bayesian EVT to serve as a bridge between statistical rigor and practical utility. Risk managers often require not just "best guesses" but quantified uncertainty, especially when reporting to boards, regulators, or investors. The results here suggest that Bayesian EVT can fulfill that role in the cryptocurrency domain.
Finally, the study raises regulatory implications. If Bitcoin’s daily ES at 99% confidence is around −16%, this level of downside risk challenges the adequacy of current margining and capital requirements in exchanges and derivative markets. The European Banking Authority (2019) and the Basel Committee on Banking Supervision (2016) have already endorsed ES over VaR in market risk regulation. This study reinforces that policy shift, providing concrete evidence from a novel and highly volatile asset class. Importantly, by framing results within a Bayesian context, regulators can better appreciate the inherent uncertainty of risk forecasts, rather than treating them as deterministic.
Regulatory and Managerial Implications
The empirical results derived from the Bayesian peaks-over-threshold estimation for Bitcoin highlight several important implications for both regulators and risk managers. First, the heavy-tailed posterior distributions of the shape parameter ξ indicate that extreme losses remain far more probable than would be suggested by conventional normal-based models. For financial institutions with direct or indirect exposures to crypto-assets, this raises the concern that reliance on Value-at-Risk alone, still widely used in internal risk monitoring, may systematically underestimate the scale of tail events (McNeil & Frey, 2000; Danielsson & de Vries, 2000).
From a regulatory standpoint, this finding reinforces the rationale behind the Basel Committee’s (2016) decision to replace VaR with Expected Shortfall as the official measure of market risk capital. The Bayesian framework strengthens this transition by not only providing ES estimates but also attaching credible intervals, which quantify the uncertainty surrounding those estimates. Regulators can interpret wider credible intervals as a signal of greater model risk, prompting either higher capital buffers or supplementary stress tests in supervisory assessments.
For risk managers, the managerial implications are equally significant. Portfolio and treasury managers dealing with crypto-assets must recognize that tail risk measures derived from Bayesian EVT are dynamic and sensitive to threshold choice. The posterior sensitivity analysis presented in this paper shows that credible intervals can shift materially when the threshold is varied, underscoring the importance of transparent reporting of methodological choices. A practical implication is that decision-makers should incorporate not only point estimates of VaR or ES into their internal dashboards but also ranges derived from posterior distributions. Doing so can improve capital allocation decisions, inform hedging strategies, and create more resilient stress-testing frameworks.
Finally, these findings have implications for governance. Senior management and boards of financial institutions should recognize that crypto-asset exposures cannot be managed with the same toolkit as traditional equities or bonds. The Bayesian EVT approach illustrates that credible capital assessments for such volatile assets require probabilistic, rather than deterministic, risk measurement. This aligns managerial practices more closely with evolving regulatory expectations while improving the robustness of risk disclosure to stakeholders and investors.
6. Conclusion
This study has advanced the modeling of extreme downside risk in cryptocurrency markets by embedding the peaks-over-threshold framework within a Bayesian inferential structure. Using daily Bitcoin returns from 2014 to 2025, the results demonstrate that the shape parameter of the Generalized Pareto Distribution is significantly positive, confirming the heavy-tailed nature of Bitcoin’s return distribution. More importantly, by adopting a Bayesian perspective, the analysis provides a full posterior characterization of tail parameters, Value-at-Risk, and Expected Shortfall, thereby moving beyond the fragile point estimates of conventional frequentist EVT.
Three conclusions follow. First, the gap between VaR and ES estimates is substantive, with the latter revealing losses far more severe than the former. This reinforces longstanding critiques of VaR as a regulatory and risk management metric (McNeil & Frey, 2000; Danielsson & de Vries, 2000) and lends empirical support to regulatory transitions towards Expected Shortfall as a standard (Basel Committee on Banking Supervision, 2016). For practitioners, the implication is that VaR-based capital buffers may be dangerously inadequate in markets characterized by extreme volatility, such as Bitcoin.
Second, the Bayesian framework enriches risk communication. By presenting credible intervals rather than single-point estimates, it acknowledges the irreducible uncertainty inherent in tail modeling. This quality is particularly valuable for decision-making under uncertainty, as boards of directors, regulators, and institutional investors are increasingly demanding probabilistic, not deterministic, assessments of financial risk. The posterior distributions presented here serve that demand, translating statistical uncertainty into operationally relevant insights.
Third, the robustness of posterior inference across alternative priors indicates that Bayesian EVT can be applied to cryptocurrency risk with confidence. Critics often suggest that Bayesian approaches are overly sensitive to prior specification (Gelman et al., 2013). Yet, this study finds that tail risk estimates are stable under a variety of reasonable prior choices. This robustness enhances the credibility of the approach for practical adoption in financial institutions.
At the same time, the analysis points toward fertile directions for future research. One limitation of this study is its static treatment of exceedances across the entire sample period. Volatility clustering and regime shifts are well-documented in financial markets (Bollerslev, Todorov, & Xu, 2015; Ardia et al., 2017), and extending Bayesian EVT to a dynamic, state-dependent framework could sharpen real-time risk monitoring. Moreover, while this paper has focused on Bitcoin, the methodology is readily transferable to other cryptocurrencies, stablecoins, and even cross-asset contagion settings. A Bayesian hierarchical structure could, for instance, pool information across assets to improve tail estimation where data are sparse.
To conclude, this paper makes three contributions: it empirically confirms the heavy-tailed nature of Bitcoin losses, it demonstrates the added value of Bayesian EVT for quantifying uncertainty in risk measures, and it connects these results to regulatory debates over VaR versus ES. The evidence suggests that Bayesian EVT is not merely a technical refinement but a necessary evolution in how we understand and manage extreme financial risk.
Author Contributions
Conceptualization, D.A.B.; methodology, D.A.B. and N.T.; software, D.A.B.; validation, D.A.B., N.T., and M.A.K.; formal analysis, D.A.B. and S.A.S.; investigation, D.A.B. and S.A.S.; resources, D.A.B.; data curation, D.A.B. and N.T.; writing—original draft preparation, D.A.B.; writing—review and editing, D.A.B., N.T., M.A.K., and S.A.S.; visualization, D.A.B.; supervision, D.A.B.; project administration, D.A.B. All authors have read and agreed to the published version of the manuscript.
Funding
This research received no external funding
Data Availability Statement
The data used in this study consist of publicly available Bitcoin historical price series. Daily data were obtained from Yahoo Finance (https://finance.yahoo.com/quote/BTC-USD/history/)andCoinGecko (https://www.coingecko.com/). Processed datasets generated during the Bayesian estimation are available from the corresponding author upon reasonable request.
Acknowledgments
The authors would like to thank Symbiosis School of Banking and Finance for providing administrative and technical support during this research. During the preparation of this manuscript, the authors used ChatGPT (OpenAI, GPT-5, 2025 edition) for assistance with revising and drafting grammatically correct text. The authors take full responsibility for the final content of this publication.
Conflicts of Interest
The authors declare no conflicts of interest
Abbreviations
The following abbreviations are used in this manuscript:
| EVT | Extreme Value Theory |
| POT | Peaks-over-threshold |
| ES | Expected Shortfall |
| VaR | Value at Risk |
References
- Acerbi, C., & Tasche, D. (2002). Expected shortfall: A natural coherent alternative to Value at Risk. Economic Notes, 31(2), 379–388. [CrossRef]
- Ardia, D., Bluteau, K., & Rüede, M. (2019). Regime changes in Bitcoin GARCH volatility dynamics. Finance Research Letters, 29, 266–271. [CrossRef]
- Ardia, D., Bolliger, G., Boudt, K. et al. The impact of covariance misspecification in risk-based portfolios. Ann Oper Res 254, 1–16 (2017). [CrossRef]
- Basel Committee on Banking Supervision. (2016). Minimum capital requirements for market risk. Bank for International Settlements.
- Baur, D. G., Hong, K., & Lee, A. D. (2018). Bitcoin: Medium of exchange or speculative assets? Journal of International Financial Markets, Institutions and Money, 54, 177–189. [CrossRef]
- Beirlant, J., Goegebeur, Y., Segers, J., & Teugels, J. (2004). Statistics of Extremes: Theory and Applications. Wiley, Chichester. [CrossRef]
- Betancourt, M. (2017). A conceptual introduction to Hamiltonian Monte Carlo. arXiv. https://arxiv.org/abs/1701.02434.
- Boldi, M.-O., & Davison, A. C. (2007). A mixture model for multivariate extremes. Journal of the Royal Statistical Society: Series B, 69(2), 217–229. [CrossRef]
- Bollerslev, T., Todorov, V., & Xu, L. (2015). Tail risk premia and return predictability. Journal of Financial Economics, 118(1), 113–134. [CrossRef]
- Bonini, S., & Caivano, G. (2025). Climate and credit risk: A scenario-based modeling approach. SSRN. [CrossRef]
- Brooks, S., & Gelman, A. (1998). General methods for monitoring convergence of iterative simulations. Journal of Computational and Graphical Statistics, 7(4), 434–455. [CrossRef]
- Carvalho, C. M., & Lopes, H. F. (2007). Simulation-based sequential analysis of Markov switching stochastic volatility models. Computational Statistics & Data Analysis, 51(9), 4526–4542. [CrossRef]
- Chavez-Demoulin, V., Embrechts, P., & Nešlehová, J. (2006). Quantitative models for operational risk: Extremes, dependence and aggregation. Journal of Banking & Finance, 30(10), 2635-2658. [CrossRef]
- Chen, Q., Gerlach, R., & Lu, Z. (2012). Bayesian Value-at-Risk and expected shortfall forecasting via the asymmetric Laplace distribution. Computational Statistics & Data Analysis, 56(11), 3498-3516. [CrossRef]
- Chu, J., Chan, S., Nadarajah, S., & Osterrieder, J. (2017). GARCH modelling of cryptocurrencies. Journal of Risk and Financial Management, 10(4), 17. [CrossRef]
- Coles, S. (2001). An Introduction to Statistical Modeling of Extreme Values. Springer Series in Statistics. Springer, London. [CrossRef]
- Danielsson, J., & de Vries, C. G. (2000). Value-at-Risk and extreme returns. Annales d'Économie et de Statistique, (60), 239–270.
- Davison, A. C., & Smith, R. L. (1990). Models for exceedances over high thresholds. Journal of the Royal Statistical Society: Series B (Methodological), 52(3), 393–442. https://www.jstor.org/stable/2345667.
- Einmahl, J. H. J., Krajina, A., & Segers, J. (2012). An M-estimator for tail dependence in arbitrary dimensions. The Annals of Statistics, 40(3), 1764-1793. [CrossRef]
- Embrechts, P., Klüppelberg, C., & Mikosch, T. (1997). Modelling Extremal Events for Insurance and Finance. Springer, Berlin. [CrossRef]
- European Banking Authority. (2021). Guidelines on criteria for the use of data inputs in the risk-measurement model referred to in Article 325bc of Regulation (EU) No 575/2013 (EBA/GL/2021/07, Final Report, 13 July 2021). https://www.eba.europa.eu/eba-publishes-final-guidelines-use-data-inputs-risk-measurement-model.
- Gelman, A., Carlin, J. B., Stern, H. S., Dunson, D. B., Vehtari, A., & Rubin, D. B. (2013). Bayesian data analysis (3rd ed.). CRC Press.
- Gencay, R., & Selçuk, F. (2004). Extreme value theory and value-at-risk: Relative performance in emerging markets. International Journal of Forecasting, 20(2), 287–303. [CrossRef]
- Geweke, J. (2005). Contemporary Bayesian Econometrics and Statistics. Wiley, Hoboken. [CrossRef]
- Gkillas, K., & Katsiampa, P. (2018). An application of extreme value theory to cryptocurrencies. Economics Letters, 164, 109–111. [CrossRef]
- Jorion, P. (2006). Value at Risk: The new benchmark for managing financial risk (3rd ed.). New York, NY: McGraw-Hill.
- Katsiampa, Paraskevi; Corbet, Shaen; & Lucey, Brian. (2019). Volatility spillover effects in leading cryptocurrencies: A BEKK-MGARCH analysis. Finance Research Letters, 29, 68-74.
- Kleiber, C., & Kotz, S. (2003). Statistical Size Distributions in Economics and Actuarial Sciences. Wiley, Hoboken.
- Longin, F. M. (2000). From value at risk to stress testing: The extreme value approach. Journal of Banking & Finance, 24(7), 1097–1130. [CrossRef]
- McNeil, A. J., & Frey, R. (2000). Estimation of tail-related risk measures for heteroscedastic financial time series: An extreme value approach. Journal of Empirical Finance, 7(3–4), 271–300. [CrossRef]
- McNeil, A. J., Frey, R., & Embrechts, P. (2015). Quantitative Risk Management: Concepts, Techniques and Tools (2nd ed.). Princeton University Press. [CrossRef]
- Pickands, J. (1975). Statistical inference using extreme order statistics. The Annals of Statistics, 3(1), 119–131. [CrossRef]
- Reiss, R.-D., & Thomas, M. (2007). Statistical Analysis of Extreme Values with Applications to Insurance, Finance, Hydrology and Other Fields (3rd ed.). Birkhäuser, Basel. [CrossRef]
- Scarrott, C., & MacDonald, A. (2012). A review of extreme value threshold estimation and uncertainty quantification. REVSTAT – Statistical Journal, 10(1), 33–60.
- Stephenson, A. G., & Tawn, J. A. (2004). Bayesian inference for extremes: Accounting for the three extremal types. Extremes, 7(4), 291–307. [CrossRef]
- Tiwari, A. K., Adewuyi, A. O., Albulescu, C. T., & Wohar, M. E. (2020). Empirical evidence of extreme dependence and contagion risk between main cryptocurrencies. The North American Journal of Economics and Finance, 51, 101083. [CrossRef]
- Xu, Q., Zhang, Y., & Zhang, Z. (2021). Tail-risk spillovers in cryptocurrency markets. Finance Research Letters, 38, Article 101453. [CrossRef]
Disclaimer/Publisher’s Note: The statements, opinions and data contained in all publications are solely those of the individual author(s) and contributor(s) and not of MDPI and/or the editor(s). MDPI and/or the editor(s) disclaim responsibility for any injury to people or property resulting from any ideas, methods, instructions or products referred to in the content. |
© 2025 by the authors. Licensee MDPI, Basel, Switzerland. This article is an open access article distributed under the terms and conditions of the Creative Commons Attribution (CC BY) license (http://creativecommons.org/licenses/by/4.0/).
Copyright: This open access article is published under a Creative Commons CC BY 4.0 license, which permit the free download, distribution, and reuse, provided that the author and preprint are cited in any reuse.


