
Submitted:
16 October 2025
Posted:
17 October 2025
You are already at the latest version
Abstract
Caffeine contamination poses significant risks to both ecosystems and human health. Conventional remediation approaches, including adsorption and extraction, remain costly and lack substrate specificity, emphasizing the relevance of microbial degradation. The fungal species Desarmillaria tabescens demonstrated strong caffeine-degrading capacity under optimized conditions: malt extract medium supplemented with 900 mg/L caffeine at 28 °C and pH 8. HPLC and UPLC-MS/MS analyses revealed critical intermediates such as theobromine and 3-methylxanthine, indicating a branched catabolic route involving N-demethylation and C8 oxidation. Transcriptomic profiling identified stage-specific differential expression, with nine cytochrome P450 genes consistently upregulated. On this basis, a three-phase regulatory framework—“Stress-Degradation-Homeostasis”—was proposed, delineating the coordination of detoxification, energy metabolism, and secondary metabolic pathways. The elucidation of this mechanism not only advances understanding of D. tabescens caffeine metabolism but also provides genetic resources for bioremediation and the development of low-caffeine products.
Keywords:
caffeine degradation
; Desarmillaria tabescens
; fungi
; transcriptome analysis
; cytochrome P450
; detoxification-energy-secondary metabolism
1. Introduction
Caffeine (1,3,7-trimethylxanthine or 3,7-dihydro-1,3,7-trimethyl-1H-2,6-dione) is categorized as a purine alkaloid and constitutes a principal flavor determinant in widely consumed beverages, particularly tea and coffee. Beyond its contribution to taste, caffeine exerts physiological effects, including modulation of the central nervous system, enhancement of metabolic activity, and diuretic action. Its applications extend to medicine and cosmetics; however, excessive intake has been associated with adverse outcomes such as hypertension, osteoporosis, sleep disturbances, and impaired learning capacity [1]. The widespread use of caffeine has generated substantial quantities of caffeine-containing waste, and inappropriate disposal presents considerable environmental risks [2]. Conventional removal methods, including adsorption, extraction, and membrane filtration, demonstrate limitations due to high cost, secondary pollution, or insufficient selectivity. Bioremediation has therefore gained increasing attention as an efficient and sustainable strategy to mitigate caffeine contamination. In particular, microbial degradation of caffeine has emerged as a promising avenue, offering potential not only for the safe treatment of caffeine-laden waste but also for the development of low-caffeine functional food products [3].
At least 68 bacterial strains belonging to 24 genera have been identified as capable of degrading caffeine, with Pseudomonas putida being the most extensively investigated species [4]. Two principal bacterial pathways for caffeine degradation have been fully characterized: N-demethylation and C-8 oxidation [5]. Among these, N-demethylation is the most widespread, and its mechanism in Pseudomonas putida CBB5 has been comprehensively examined. This strain carries a 14-kb cluster of alkyl xanthine (Alx) degradation genes, which encodes several monooxygenases responsible for catalyzing caffeine breakdown [6,7]. Functional reconstruction of operons in E. coli has demonstrated that five Alx genes (NdmA, NdmB, NdmC, NdmD, and NdmE) mediate the conversion of caffeine into xanthine [8]. The C-8 oxidation pathway has been documented in genera such as Klebsiella and Pseudomonas [9]. In this route, the C-8 carbon of caffeine undergoes oxidation, typically catalyzed by enzymes such as caffeine dehydrogenase, yielding 1,3,7-trimethyluric acid (1,3,7-TMUA) as a key intermediate [10]. This compound is subsequently subjected to further oxidative or hydrolytic reactions, ultimately generating metabolites such as allantoin and other low-molecular-weight derivatives that can be assimilated or excreted by the host organism. The enzymes and genetic determinants underlying both the N-demethylation and C-8 oxidation pathways in bacteria have been systematically elucidated [11].
In comparison with caffeine-degrading bacteria, relatively few fungal strains capable of metabolizing caffeine have been reported. Documented examples include two Penicillium strains and five Aspergillus strains isolated from soil and leaf litter in coffee cultivation areas, all exhibiting caffeine-degrading activity [12]. Brand et al. evaluated fungal strains from Rhizopus, Phanerochaete, and Aspergillus in solid-state fermentation and decaffeination experiments using coffee shells, demonstrating that R. arrhizus, P. chrysosporium, and several Aspergillus species possess caffeine-degrading capacity [13].. Similarly, Carrasco-Cabrera et al. observed caffeine degradation during Pleurotus ostreatus cultivation on coffee grounds [14], while Aspergillus sydowii isolated from Pu’er tea by Zhou displayed strong caffeine-degrading potential [15]. Although several functional fungal strains have been identified, subsequent research has focused primarily on optimizing fermentation conditions, clarifying metabolic pathways, and developing solid-state fermentation techniques [16]. Investigations addressing the enzymes and genetic determinants involved in fungal caffeine metabolism remain limited. Identifying the enzymatic systems and genetic basis underlying fungal caffeine degradation is essential for elucidating its molecular mechanisms and for advancing the design of low-caffeine functional foods. However, the specific enzymes and genes associated with these pathways have not yet been characterized, leaving the fundamental mechanisms largely undefined.
Desarmillaria tabescens is a widely distributed edible and medicinal fungus occurring in forests, parks, and other habitats [17]. It obtains nutrients from plant tissues, produces fleshy mycelial structures, develops dense clusters around infected hosts, and generates sexual spores [18]. Both large-scale liquid deep fermentation and solid-state fermentation systems have been established for D. tabescens [19]. These culture methods have enabled the isolation of bioactive compounds such as leuconin and polysaccharides, which have been incorporated into pharmaceutical formulations, including leuconin injections and leucobacter tablets. D. tabescens exhibits strong anti-inflammatory activity and has been extensively applied in the management of chronic hepatitis, cholecystitis, and related disorders [20]. Polysaccharides extracted from D. tabescens have been reported to provide hepatoprotective, intestinal mucosal protective, and antitumor effects [21]. Recent studies have examined biosynthetic gene clusters involved in honey cyclide [19] and sesquiterpenoid [22] biosynthesis in D. tabescens, whereas its potential role in caffeine degradation has not been clarified.
In this study, twenty edible and medicinal fungal strains were screened to identify species capable of degrading caffeine. Results indicated that D. tabescens exhibited marked caffeine biodegradation activity. The effects of D. tabescens on caffeine metabolism were systematically investigated. Although the genome sequence of D. tabescens is available and its gene functions and metabolic pathways have been annotated using advanced methodologies [23], the molecular basis of its caffeine degradation remains poorly understood. To address this knowledge gap, RNA sequencing (RNA-Seq) was employed to characterize the global transcriptional responses of D. tabescens under caffeine exposure. The analysis revealed intricate regulatory networks associated with detoxification and elevated energy metabolism. Notably, nine cytochrome P450 genes were significantly upregulated, suggesting their involvement in caffeine catabolism. The dataset generated provides a valuable genetic resource for elucidating the molecular mechanisms governing caffeine degradation in fungi.
2. Materials and Methods
2.1. Screening and Preparation of Functional Strains for Caffeine Degradation
The fungal strains were initially reactivated and preserved under controlled conditions. For each strain, a plate exhibiting vigorous mycelial growth was selected and transferred into potato dextrose agar (PDA) liquid medium containing caffeine. Cultures were agitated for 15 days, after which the fermentation broth was collected for high-performance liquid chromatography (HPLC) analysis. Strains producing marked reductions in caffeine concentration within the broth were designated as functional strains capable of caffeine degradation.
A compact mycelial block of D. tabescens (0.8 cm × 0.8 cm × 0.6 cm) was transferred into liquid wort medium and maintained at 28 °C under dark conditions with continuous agitation at 160 rpm for 15 days. The culture was then homogenized at 12,000 rpm for 15 seconds using a high-speed homogenizer, followed by a 24-hour incubation period to enable mycelial regrowth. Mycelia were subsequently harvested by centrifugation at 11,000 rpm for 10 minutes at 16 °C, washed three times with sterile water, and resuspended in sterile water to obtain the seed inoculum.
2.2. Fermentation of D. tabescens in Caffeine-Enriched Liquid Media
Two milliliters of the prepared D. tabescens seed suspension were inoculated into six separate caffeine-supplemented liquid media (200 mL per flask). Samples were withdrawn on days 8, 12, 16, 20, and 24 of fermentation, followed by HPLC analysis to monitor caffeine degradation.
2.3. Optimization of Caffeine Degradation Conditions
Fermentation assays were carried out using initial caffeine concentrations of 300, 600, 900, 1200, and 1500 mg/L. Samples were withdrawn on days 8, 12, 16, 20, and 24 to evaluate residual caffeine and degradation efficiency, which were used to determine the optimal initial concentration. Temperature-dependent fermentations were subsequently conducted at 20, 22, 24, 26, 28, and 30 °C, with identical sampling intervals to establish the most effective temperature for caffeine degradation. The influence of pH was examined by performing fermentations at pH values of 5, 6, 7, 8, 9, and 10, and the optimal condition was identified according to caffeine concentration and degradation rate.
2.4. Preparation of Fermentation Broth Samples
For sample preparation, 1 mL of fermentation broth was mixed with 6 mL of a cold acetonitrile:methanol solution (1:1, v/v), achieving a final ratio of 3:3:1 (acetonitrile:methanol:broth). The suspension underwent sonication for 10 minutes and vortexing for 45 seconds, repeated three times. Protein precipitation was induced by incubation at −20 °C for 2 hours, followed by centrifugation at 15,000 rpm at 4 °C for 20 minutes. The supernatant was collected and evaporated to dryness in a vacuum drying oven. The residue was reconstituted in 5 mL of acetonitrile, sonicated for 5 minutes, and centrifuged at 12,500 rpm at 15 °C for 18 minutes. The final supernatant was filtered and transferred into HPLC vials for analysis.
2.5. Sample Analysis
2.5.1. HPLC Analysis
Chromatographic separation was performed on an Agilent liquid chromatography platform fitted with a Yuexu Ulimate® Plus C18 column (1.8 µm particle size, 2.1 mm × 100 mm). The HPLC parameters are summarized in Table 1. The column was maintained at 34 ℃, with an injection volume of 15 μL and detection at 280 nm.
2.5.2. UPLC-MS/MS Analysis
Ultra-performance liquid chromatography coupled with tandem mass spectrometry was conducted on an ExionLC™ AD system interfaced with an Applied Biosystems 4500 QTRAP mass spectrometer. Chromatographic separation utilized an Agilent SB-C18 column (1.8 µm, 2.1 mm × 100 mm). The operating conditions are summarized in Table 2. The column was maintained at 49 °C, and the injection volume was set to 4 μL.
2.5.3. Data Analysis
Processing of mass spectrometric data adhered to the procedure outlined by Ma [24]. Subsequent analyses were performed using Excel 2019, Origin 2022, and GraphPad Prism 8.
2.6. Preparation of RNA Sequencing Samples
Mycelia of D. tabescens cultured in wort medium with caffeine supplementation were harvested at 10, 16, and 22 days, constituting the Caffeine Treated Group (CT). In parallel, mycelia grown in wort medium without caffeine were collected at identical time points to form the None-Caffeine Treated Group (NCT). These samples were subjected to RNA sequencing for downstream transcriptomic profiling.
2.7. RNA Extraction, Library Preparation, and Sequencing
Total RNA was extracted from tissue specimens using TRIzol® Reagent in strict adherence to the manufacturer’s instructions. RNA integrity was evaluated with the 5300 Bioanalyzer (Agilent Technologies), and concentration was determined using the ND-2000 spectrophotometer (NanoDrop Technologies). Only samples fulfilling rigorous quality thresholds—OD260/280 ratios between 1.8 and 2.2, OD260/230 ≥ 2.0, RNA Quality Number (RQN) ≥ 6.5, 28S:18S rRNA ratio ≥ 1.0, and a minimum yield of 1 μg total RNA—were advanced to library construction. Subsequent purification, reverse transcription, library assembly, and sequencing were carried out at Shanghai Majorbio Bio-pharm Biotechnology Co., Ltd. (Shanghai, China) in accordance with standardized operating procedures. RNA-seq transcriptome libraries were constructed with the Illumina® Stranded mRNA Prep, Ligation kit (San Diego, CA) using 1 μg of input RNA. Poly(A) selection with oligo(dT) beads was applied for mRNA enrichment, followed by fragmentation in fragmentation buffer. Double-stranded cDNA was synthesized with random hexamer primers, and the resulting products underwent end-repair, phosphorylation, and adapter ligation as specified in the library preparation protocol. cDNA fragments of 300–400 bp were isolated using magnetic beads and subsequently amplified by PCR for 10–15 cycles. Final libraries were quantified on the Qubit 4.0 fluorometer and sequenced on the NovaSeq X Plus platform with paired-end 150 bp reads using the NovaSeq Reagent Kit.
2.8. Quality Control and Read Mapping
Raw paired-end reads were processed with fastp software [25] to remove low-quality sequences and adapter contamination under default settings. Clean reads were aligned to the reference genome in a strand-specific mode using HISAT2 [26]. Transcript assembly for each sample was then conducted through a reference-guided strategy employing StringTie [27].
2.9. Differential Expression Analysis and Functional Enrichment
Differentially expressed genes (DEGs) between sample groups were identified by quantifying transcript abundance with the transcripts per million (TPM) metric. Gene expression levels were estimated using RSEM [28]. Differential expression analysis was performed through the DESeq package [29], applying a threshold of |log2 fold change| ≥ 1 and a false discovery rate (FDR) < 0.001 to define significant expression differences. Functional enrichment analyses, including Gene Ontology (GO) and Kyoto Encyclopedia of Genes and Genomes (KEGG) pathway analyses, were subsequently employed to evaluate the overrepresentation of DEGs within specific GO categories and metabolic pathways. Statistical significance was determined using Bonferroni-corrected p-values < 0.05 against the transcriptome background. GO enrichment and KEGG pathway analyses were conducted with Goatools (https://github.com/tanghaibao/GOatools) and Python’s SciPy library (https://scipy.org/install/), respectively.
2.10. Time-Series Gene Expression Analysis
To characterize transcriptional changes induced by caffeine at different fermentation stages, DEGs were grouped into eight expression profiles using the Short Time-series Expression Miner (STEM) software [30]. STEM, specifically designed for short time-series microarray data, applies a clustering algorithm in which profiles are defined by predetermined temporal trends. DEGs assigned to the same profile were expected to exhibit comparable expression dynamics.
2.11. Secondary Metabolism Genes and Clusters Analysis
The secondary metabolic gene clusters of D. tabescens were predicted using antiSMASH fungal v8.0 software [31]. This platform identifies secondary metabolic gene clusters with high accuracy when appropriate profile hidden Markov models (HMMs) are available. To refine the predicted clusters, Blastp analysis and functional annotation were conducted through the NCBI Genome Portal Software Platform. The secondary metabolic gene clusters of D. tabescens were subsequently classified and summarized based on the integrated results of these analyses.
2.12. qRT-PCR Validation
Validation of the transcriptome sequencing results of D. tabescens was performed through quantitative real-time PCR (qRT-PCR). Twelve genes were selected, including six consistently up-regulated and six consistently down-regulated across three comparative groups (Treated_10d vs. Control_10d, Treated_16d vs. Control_16d, and Treated_22d vs. Control_22d). β-tubulin served as the internal reference gene [19] (Table 3). qRT-PCR was carried out on the BIO-RAD platform, with all reactions conducted in triplicate. Mean cycle threshold (Ct) values were calculated, and relative expression levels were determined using the 2^−ΔΔCt method [32].
3. Results
3.1. Compilation of Fungal Resources and Identification of Functional Strains Capable of Caffeine Degradation
Activation of strains from culture collections, along with acquisition through purchase, exchange, and wild isolation, yielded 20 species of edible and medicinal fungi (Supplementary Table S1). All strains were cultivated in PDA liquid medium supplemented with caffeine. After 15 days of fermentation, the broth was subjected to HPLC analysis. A marked reduction in caffeine concentration was detected in the broth of D. tabescens CGMCC 40115, confirming its caffeine-degrading ability and thereby broadening microbial resources for caffeine biotransformation. In 2005, Salmones et al. [33] proposed that basidiomycetes might possess caffeine-degrading properties; however, evidence was not reported until 2019, when Pleurotus ostreatus was identified with such activity [34]. Interestingly, caffeine degradation by P. ostreatus occurred only under solid-state fermentation, with no detectable activity in liquid culture. In contrast, D. tabescens demonstrated effective degradation in liquid fermentation, indicating its comparatively greater potential for practical applications in caffeine biotransformation.
3.2. Screening for the Optimal Culture Medium
Six fungal culture media commonly employed for cultivation were evaluated for D. tabescens, and clear differences in growth performance were observed. Bacterial ball formation was more evident in wheat bran and GPC media, while carrot medium yielded compact, smooth-surfaced bacterial balls. In contrast, malt juice and PDA media promoted greater bacterial ball density. The introduction of caffeine suppressed bacterial ball development and induced an increased number of spines relative to the original media (Figure 1). In all liquid culture systems, supplementation with caffeine markedly reduced the mycelial biomass of D. tabescens compared with the corresponding controls (Figure 2A). Caffeine concentration in D. tabescens cultures was quantified after 8, 12, 16, 20, and 24 days of fermentation in the six liquid media to determine degradation rates (Figure 2B). A uniform temporal trend was recorded across all media. During the early phase (days 8–12), degradation progressed slowly, likely reflecting the adaptation and growth initiation of the microorganisms. The intermediate phase (days 12–20) was characterized by a rapid increase in degradation rate, corresponding to active microbial proliferation and intensified metabolic processes. In the late phase (days 20–24), degradation decelerated, consistent with entry into a mature growth stage accompanied by reduced metabolic activity. D. tabescens displayed an extended growth cycle in which degradation rates were strongly associated with metabolic intensity. Among the tested media, malt extract medium supported the highest degradation rate, whereas carrot medium exhibited the lowest, with outcomes aligning positively with mycelial biomass levels. Collectively, the data reveal that growth characteristics of D. tabescens are highly dependent on medium composition, influencing biomass yield and caffeine degradation dynamics. Comparative analysis indicates that malt extract medium provides the most effective conditions for achieving rapid and efficient caffeine degradation.
3.3. Optimization of Degradation Conditions
3.3.1. Optimization of Caffeine Concentration Parameters
Caffeine was incorporated into malt extract medium at concentrations of 300 (Figure 3A), 600 (Figure 3B), 900 (Figure 3C), 1200 (Figure 3D), and 1500 (Figure 3E) mg/L. Fermentation with D. tabescens was monitored at 8, 12, 16, 20, and 24 days, and caffeine degradation rates were determined accordingly (Figure 3). At 300 and 600 mg/L, D. tabescens exhibited strong degradative capacity, with rates exceeding 90% by day 20. At 900 mg/L, the degradation potential reached its highest level, approaching 50% by day 16 and 85% by day 24. At elevated concentrations (1200 and 1500 mg/L), degradation efficiency declined markedly, with rates falling below 40% by day 16 and total degraded caffeine not exceeding 500 mg/L, comparable to the levels observed at 900 mg/L. By day 24, the cumulative degradation was approximately 900 mg/L, indicating no further enhancement relative to the 900 mg/L treatment. The degradative capacity of D. tabescens declined progressively with increasing caffeine concentration. At lower concentrations, caffeine metabolism was highly efficient, whereas higher concentrations impaired both growth and metabolic activity, leading to reduced degradation. Among the tested conditions, supplementation with 900 mg/L caffeine yielded the most favorable balance between degradative capacity and inhibitory effects, thereby representing the optimal concentration for caffeine metabolism.
3.3.2. Optimization of Temperature Conditions
D. tabescens was cultivated under six temperature regimes (20 ℃, 22 ℃, 24 ℃, 26 ℃, 28 ℃, and 30 ℃). Caffeine concentrations were measured at fermentation periods of 8, 12, 16, 20, and 24 days, and corresponding degradation rates were determined (Figure 4). At 20 ℃, degradation reached approximately 30% after 16 days and remained below 70% even after 24 days, suggesting that limited microbial proliferation and metabolic activity at lower temperatures restricted caffeine degradation. In contrast, cultivation at 30 ℃ resulted in degradation rates below 80% after 24 days, possibly due to an accelerated microbial life cycle that constrained the buildup of degradation capacity. Within the intermediate temperature range of 22–28 ℃, degradation rates rose steadily with increasing temperature. After 16 days, rates varied between 40% and 50%, and by 24 days, all conditions within this range exceeded 80%. The highest value, 88.25%, was recorded at 28 ℃. These observations indicate reduced degradation efficiency at both low and high temperature extremes, while moderate conditions enhanced degradation performance. Notably, in the 22–28 ℃ interval, degradation efficiency improved consistently as temperature increased. Among the six treatments, 28 ℃ yielded the most effective degradation. This result diverges from the report of Chen et al., which identified 22–25 ℃ as optimal for honey ring fungus growth, a variation likely attributable to strain-specific cultivation characteristics [35].
3.3.3. Optimization of pH Conditions
D. tabescens was cultivated across a pH gradient (5, 6, 7, 8, 9, and 10) to assess the influence of pH on caffeine degradation. Caffeine concentrations were measured after 8, 12, 16, 20, and 24 days of fermentation, and degradation rates were subsequently determined (Figure 5). Under alkaline conditions (pH 9 and 10), the degradation rate remained below 40% at day 16 and did not exceed 60% at pH 10 even after 24 days, likely due to impaired growth of D. tabescens in high-pH environments, which restricted its metabolic capacity for caffeine breakdown. In contrast, near-neutral pH values (6, 7, and 8) supported markedly higher degradation activity. After 16 days, degradation rates ranged from 40% to 50%, and by day 24, all three pH levels yielded rates above 80%, with the maximum value of 89.20% recorded at pH 8. These results demonstrate that caffeine degradation efficiency is attenuated under both acidic and alkaline conditions but markedly enhanced near neutrality, with pH 8 identified as the most favorable condition for maximizing degradation.
3.4. Analysis of Caffeine Degradation Products
3.4.1. HPLC Analysis
Fermentation was carried out in malt extract medium containing 900 mg/L caffeine, maintained at 28 °C and pH 8. Samples were collected on days 8, 12, 16, 20, and 24 for HPLC analysis, through which both caffeine and its demethylated derivatives were identified and quantified (Figure 6). The data demonstrated a continuous decline in caffeine concentration (compound 6) from day 8 to day 24, with the most rapid degradation occurring between days 12 and 20, leading to an overall reduction of approximately 90% by day 24. Theobromine (compound 4), the primary metabolite, appeared by day 8 and accumulated progressively until day 20, followed by a decrease at day 24, consistent with its early accumulation and subsequent enhanced turnover exceeding formation in later stages. Secondary metabolites, including 3-methylxanthine (compound 3) and 7-methylxanthine (compound 2), exhibited a gradual early increase followed by a sharper rise in concentration. The tertiary metabolite xanthine (compound 1) became detectable at day 12 and continued to increase thereafter. The metabolic trajectory suggests that fermentation of caffeine by Daldinia tabescens generates multiple intermediate products, and additional metabolites present at low concentrations, unresolved by HPLC, are likely involved. Samples from day 20 were selected for further detailed characterization.
3.4.2. UPLC-MS/MS Analysis
To characterize the metabolic profile of D. tabescens during caffeine degradation, fermentation samples collected on day 20 under identical culture conditions (malt extract medium, 900 mg/L caffeine, 28 °C, pH 8) were subjected to ultra-performance liquid chromatography–tandem mass spectrometry (UPLC-MS/MS). The total ion chromatogram is shown in Figure 7. Theobromine, 3-methylxanthine, and 7-methylxanthine were identified as the primary demethylation derivatives of caffeine. Additional demethylated products, including theophylline, 1,7-dimethylxanthine, 1-methylxanthine, and xanthine, were also detected, reflecting their participation in the caffeine catabolic route. Oxidative metabolism was indicated by the formation of 1,3,7-trimethyluric acid and 1,3-dimethyluric acid, both consistently present during the fermentation process (Table 4). Collectively, the metabolic profile demonstrates that caffeine degradation by D. tabescens in liquid fermentation involves an extensive network of intermediates. The present analysis focused on compounds linked to the caffeine metabolic pathway catalogued in the KEGG database. Because intermediate metabolites were not isolated or purified, the possibility of uncharacterized degradation routes mediated by D. tabescens cannot be excluded.
3.5. RNA-Seq Analysis
The degradation of caffeine by D. tabescens proceeds over a prolonged period, with rates varying in close correlation with the organism’s growth and developmental phases. Analysis of liquid fermentation degradation dynamics identified three representative stages for investigation: day 10, corresponding to early growth with relatively slow degradation; day 16, reflecting the logarithmic growth phase with the highest degradation rate; and day 22, representing the late growth phase when the rate declined. To examine transcriptional responses to caffeine exposure, six groups of sequencing libraries were generated from non-caffeine treated (NCT, n = 9) and caffeine treated (CT, n = 9) samples.
Transcriptome sequencing of all 18 samples yielded 127.42 Gb of clean data, averaging 6.08 Gb per sample. The sequencing output was of high quality, with approximately 97% of bases exceeding the Q20 threshold and 93% surpassing Q30, ensuring reliability for downstream analyses. Clean reads from each sample were mapped to the reference genome Armillaria_tabescens_CCBAS_213 (https://genome.jgi.doe.gov/portal/ArmtabStandDraft_FD/ArmtabStandDraft_FD.info.html), with alignment efficiencies ranging from 65.03% to 74.57%. A detailed overview of RNA-Seq output and mapping statistics is provided in Table S2, validating the robustness of the sequencing data for transcriptomic profiling. In total, 15,479 expressed genes were identified, including 14,992 with functional annotations and 487 predicted as novel genes.
The analysis of differentially expressed genes (DEGs) between caffeine-treated samples and their corresponding controls revealed extensive transcriptional alterations. A total of 4381 genes exhibited significant differential expression [|log2 Fold Change| ≥ 1 and p-value < 0.01], with 4798, 3605, and 6800 DEGs identified at 10, 16, and 22 days post-fermentation, respectively (Figure 8A). The comparatively higher number of DEGs detected at the early (10 days) and late (22 days) stages indicates that intensive fungal metabolic activity reduces the apparent impact of caffeine stress at the mid-stage (16 days). Transcriptomic profiling further demonstrated a temporal shift in regulatory patterns: downregulated DEGs predominated during the early and middle stages, whereas upregulated DEGs became dominant in the late stage. This dynamic pattern suggests a transition in fungal adaptive strategies across sequential phases of stress exposure, shifting from an initial passive state characterized by stress defense and metabolic suppression toward a later active phase defined by repair processes, recovery of resistance, and broader environmental adaptation. Across the three comparative groups (CT10_NCT10, CT16_NCT16, and CT22_NCT22), 1090 DEGs were identified as shared, with 122 genes consistently upregulated at all time points, representing the core functional set active throughout the stress period. These genes were predominantly enriched in pathways associated with caffeine efflux via Peroxisome, Starch and sucrose metabolism, Longevity regulating pathway, Pentose and glucuronate interconversions, and MAPK signaling. Their sustained expression under stress conditions supports resistance to toxic damage and ensures basal survival, establishing them as a central regulatory framework for fungal caffeine tolerance. In contrast, 93 genes consistently downregulated across the three time points were mainly linked to processes involving growth and reproduction, including Amino sugar and nucleotide sugar metabolism and Glycerophospholipid metabolism, as well as other energy-intensive pathways. Persistent suppression of these genes indicates a resource reallocation strategy, in which nonessential activities are suppressed to preserve energy and materials for the effective operation of fundamental defense systems. In addition, stage-specific expression profiles revealed 1549, 908, and 3350 DEGs at 10, 16, and 22 days, respectively (Figure 8B). The 1549 DEGs specific to day 10 likely reflect the early stress response of D. tabescens to caffeine, whereas the 908 DEGs detected at the mid-stage appear to be associated with accelerated caffeine degradation during this phase.
3.6. Functional Annotation, Classification, and Enrichment Analysis
For functional annotation, all assembled genes were aligned against six major databases, including the National Center for Biotechnology Information (NCBI) non-redundant (Nr), EggNOG, GO, KEGG, Swiss-Prot, and Pfam, using BLAST with an E-value cutoff of 10⁻⁵. Among 15,479 genes, 14,985 (96.81%) showed significant matches in the Nr database. The annotation rates for the other databases were as follows: 1,679 genes (10.85%) in EggNOG, 11,231 genes (72.56%) in GO, 5,234 genes (33.81%) in KEGG, 7,981 genes (51.56%) in Swiss-Prot, and 10,258 genes (66.27%) in Pfam (Figure S1).
To elucidate the biological functions of DEGs, functional classification and enrichment analyses were performed. Based on the GO database, 11,231 DEGs (72.56%) were annotated to at least one GO term across three domains: biological process, cellular component, and molecular function. Comparative GO annotation revealed that 3,814 (75.73%), 2,864 (75.75%), and 5,585 (77.48%) DEGs were assigned in CT10 vs NCT10 (Caffeine-Treated_10 days vs Non-Caffeine Treated_10 days), CT16 vs NCT16, and CT22 vs NCT22, respectively (Figure 9). In CT10 vs NCT10, 2,355, 2,995, and 1,969 DEGs were enriched in cellular component (CC), molecular function (MF), and biological process (BP), respectively. In CT16 vs NCT16, enrichment comprised 1,759, 2,221, and 1,359 DEGs in CC, MF, and BP, respectively. In CT22 vs NCT22, enrichment reached 3,637, 4,314, and 3,129 DEGs in CC, MF, and BP, respectively. Subcategorization of these domains further refined the classification. Within GO categories, “metabolic process” and “cellular process” in BP, “membrane part” and “cell part” in CC, and “catalytic activity” and “binding” in MF consistently represented the predominant subcategories relative to the whole transcriptome background across all three comparisons.
All DEGs associated with caffeine degradation were analyzed using the KEGG database. At the early fermentation stage (10 days), 1,520 DEGs were mapped to 116 KEGG pathways, with enrichment concentrated in “Translation” (146), “Carbohydrate metabolism” (161), “Amino acid metabolism” (143), and “Lipid metabolism” (106). At the middle stage (16 days), 939 DEGs were distributed across 109 KEGG pathways, where enrichment was primarily observed in “Carbohydrate metabolism” (151), “Amino acid metabolism” (106), and “Lipid metabolism” (82). In the late stage, 2,339 DEGs corresponded to 114 KEGG pathways, and enrichment became more extensive, involving “Carbohydrate metabolism” (224), “Amino acid metabolism” (184), “Transport and catabolism” (192), “Folding, sorting and degradation” (162), and “Translation” (218), with “Translation” remaining the dominant category (Figure 10). Moreover, distinct pathways—including Biosynthesis of cofactors (map01240), Pentose and glucuronate interconversions (map00040), Purine metabolism (map00230), Glyoxylate and dicarboxylate metabolism (map00630), and Tryptophan metabolism (map00380)—were markedly upregulated under caffeine treatment. Collectively, the enriched KEGG pathways reflect metabolic reprogramming in response to caffeine exposure.
Putative protein functions of DEGs were inferred using the EggNOG database, an extended version of the COG database incorporating a broader range of species and larger protein sequence datasets. Homologous gene clustering, functional annotation, and classification were conducted (Figure S2; Table S3). In the early stage, 666 DEGs (56.52%) were annotated and distributed across 20 EggNOG categories based on sequence homology. The most abundant clusters included “Carbohydrate transport and metabolism” (79, 11.9%), “Amino acid transport and metabolism” (33), “Energy production and conversion” (32), “Secondary metabolites biosynthesis” (31), and “Posttranslational modification, protein turnover, chaperones” (30). In the middle stage, 540 DEGs were annotated and assigned to 19 EggNOG categories, with major clusters comprising “Carbohydrate transport and metabolism” (80, 11.9%), “Secondary metabolites biosynthesis” (30), “Amino acid transport and metabolism” (26), “Inorganic ion transport and metabolism” (23), and “Posttranslational modification, protein turnover, chaperones” (21). In the late stage, 909 DEGs were annotated and classified into 21 EggNOG categories, where dominant clusters included “Carbohydrate transport and metabolism” (83, 11.9%), “Posttranslational modification, protein turnover, chaperones” (57), “Energy production and conversion” (46), “Secondary metabolites biosynthesis” (41), and “Amino acid transport and metabolism” (36). These results suggest that caffeine exposure activated complex stress response mechanisms in D. tabescens, particularly during the initial growth phase.
3.7. Gene Expression Pattern Analysis of DEGs
Gene expression in CT (Caffeine Treated) and NCT (Non-Caffeine Treated) groups across developmental stages was examined using RNA sequencing. Distinct stage-dependent transcriptional responses to caffeine exposure were observed. A modular analysis was then performed to identify DEGs specifically associated with caffeine degradation. Based on temporal expression dynamics, DEGs were partitioned into eight profiles (0–7) using Short Time-series Expression Miner (STEM) software (Figure 11A). Among them, profile 0 (progressive decline from day 10 to 22), profile 2 (lowest expression at day 16), and profile 4 (peak expression at day 22) exhibited significant enrichment (p < 0.05). Functional annotation of transcriptional shifts within these profiles was subsequently characterized through GO classification.
In Profile 0 (Figure 11B), enriched biological processes (BP) included organonitrogen compound biosynthesis, translation, peptide biosynthesis and metabolism, and cellular amide metabolism. Overrepresented cellular component (CC) terms comprised ribosome and non-membrane-bounded intracellular organelles. For molecular function (MF), structural constituent of ribosome and structural molecule activity were highly represented. Profile 2 (Figure 11C) exhibited BP enrichment in RNA-mediated gene silencing, negative regulation of gene expression, and metabolism of phenol- and catechol-containing compounds. Dominant CC terms involved fungal-type cell wall, external encapsulating structures, and integral membrane components, while MF terms were characterized by oxidoreductase activities (including monooxygenase), iron ion binding, and tetrapyrrole/heme binding. In Profile 4 (Figure 11D), BP enrichment was centered on carbohydrate metabolism, particularly trehalose and disaccharides. CC terms again emphasized integral or intrinsic membrane components, and MF categories overlapped with Profile 2, including oxidoreductase functions, iron/heme binding, and glycosyl hydrolase activities. Collectively, the profiles indicated distinct transcriptional patterns: genes associated with oxidoreductase, iron binding, and hydrolase activities, which are directly involved in caffeine catabolism, were consistently upregulated, whereas ribosome- and biosynthesis-related genes, particularly those involved in translation and organonitrogen compound biosynthesis, were markedly downregulated. Ribosomal and biosynthetic pathways exhibited a progressive decline from days 10 to 22 (Profile 0), while metabolism-related pathways such as pentose/glucuronate interconversions, starch and sucrose metabolism, tryptophan metabolism, and glycolysis displayed overall increases with minor fluctuations (Profiles 2 and 4).
The transcriptomic analysis indicates that fungi employ an integrated molecular strategy to degrade caffeine and withstand its toxicity, involving metabolic reprogramming, redistribution of cellular resources, and epigenetic modulation. Upregulation of genes encoding oxidoreductases (such as monooxygenases), iron-binding proteins, and hydrolases (including glycosyl hydrolases) addresses the enzymatic requirements of caffeine catabolism, whereas suppression of ribosome- and biosynthesis-associated genes reflects a deliberate reallocation of resources toward detoxification under caffeine stress. Sustained activation of central metabolic pathways, including pentose/glucuronate interconversions and glycolysis, secures energy and cofactors for degradation. Concurrent enrichment of gene silencing functions and cell envelope-related components suggests epigenetic adjustment and structural remodeling to enhance stress resilience. Collectively, the transcriptomic evidence refines current knowledge of fungal caffeine-degradation strategies, highlights candidate functional genes for the development of high-efficiency strains, and provides a conceptual basis for bioremediation of caffeine-polluted environments.
3.8. Candidate Genes Involved in the Pathways
Candidate genes associated with caffeine degradation were inferred from DEG analysis and corroborated by prior studies. Previous research has suggested the involvement of cytochrome P450 proteins in caffeine metabolism [36]. In the CT10 vs NCT10, CT16 vs NCT16, and CT22 vs NCT22 groups, 48 cytochrome P450 genes exhibited differential expression, among which 9 were transcriptionally upregulated (Table 5), potentially contributing to the caffeine degradation capacity of D. tabescens. Functional validation of these candidate genes in caffeine catabolism will be undertaken in subsequent investigations.
3.9. Analysis of Secondary Metabolite Biosynthetic Gene Clusters
The secondary metabolites (SMs) secreted by fungi are essential for nutrient acquisition, chemical defense, intercellular signaling, and ecological adaptation. AntiSMASH was employed to predict biosynthetic gene clusters (BGCs) associated with SM production in the genome of D. tabescens [31]. A total of 109 BGCs were identified, comprising 9 fungal-RiPP-like, 2 NRPS, 2 NI-siderophore, 10 NRPS-like, 1 hybrid NRPS-like + fungal-RiPP-like, 1 hybrid NRPS-like + terpene, 4 hybrid NRPS-like + T1PKS, 1 T1PKS, 1 terpene + T1PKS, and 18 terpene clusters. AntiSMASH analysis further revealed that genes within regions 7.1, 19.1, and 40.1 exhibited strong BLAST similarity to the (+)-δ-cadinol biosynthetic cluster of Coniophora puteana RWD-64-598 SS2. Coniophora puteana has been verified to degrade caffeine, and one study systematically examined its ability to biodegrade caffeine, theobromine, and theophylline. In that experiment, mycelia of Coniophora puteana were incubated in an aqueous solution containing caffeine (1 g/L) at 22 ± 2℃ for 28 days. Metabolic changes were analyzed by liquid chromatography-mass spectrometry, which revealed an initial accumulation of caffeine in the mycelia during the first 14 days, followed by a marked decline. Concurrently, caffeine was converted into theophylline and theobromine, both of which increased rapidly within the first 7 days and subsequently decreased to undetectable levels. These results demonstrated that Coniophora puteana possessed the capacity to degrade caffeine through transformation into intermediate metabolites such as theophylline and theobromine.
Figure 12.
AntiSMASH Result of Secondary Metabolite Biosynthetic Gene Clusters.
Among the 17 genes located in regions 7.1, 19.1, and 40.1, gene_10561 displayed consistent down-regulation across all caffeine-treated samples at the three examined time points. Gene_10562 and gene_10563 were down-regulated at 16 and 22 days, respectively, whereas gene_10564 showed up-regulation at 22 days. Gene_10566 exhibited marked up-regulation at 10 and 16 days, followed by significant down-regulation at 22 days. GO annotation (GO:0006066; GO:0050660; GO:0016614; GO:0008812) suggests that Alcohol oxidase may participate in the metabolism of specific intermediates, such as aldehyde or alcohol derivatives, during caffeine degradation. The functional association with FAD binding implies that related enzymes depend on FAD as a coenzyme to mediate redox reactions. Although the activity of choline dehydrogenase is not directly connected to caffeine degradation, it may contribute to the metabolism of other methylated compounds within the cell.
3.10. Metabolic Pathways Involved in Energy Production
During caffeine degradation, multiple energy-yielding metabolic pathways were strongly activated, including the TCA cycle, oxidative phosphorylation, several amino acid metabolic routes, and fatty acid β-oxidation (FAO). Within the TCA cycle, 75.9% and 82.8% of DEGs were upregulated at 10 and 16 days, respectively, whereas 69% were downregulated at 22 days (Table S4). At day 10, Cytochrome c oxidase subunit VIIc (gene_6972) exhibited an 11.05-fold increase, while Citrate synthase (gene_8011) and Aconitase (gene_15760) increased 5.20-fold and 4.84-fold, respectively. The pronounced upregulation of Cytochrome c oxidase subunit VIIc, a central component of oxidative phosphorylation, together with citrate synthase and Aconitase, key enzymes in the TCA cycle, indicates that fungi intensify core energy metabolism during the early phase of caffeine stress. This adjustment accelerates ATP production through enhanced tricarboxylic acid cycle flux and improved mitochondrial respiratory efficiency. For oxidative phosphorylation, 63.8% and 85% of DEGs were upregulated at 10 and 16 days, while 72.5% were downregulated at 22 days. Notably, NADH-quinone oxidoreductase (gene_6550) showed a 4.24-fold increase at day 10, and ATPase F1 complex alpha subunit (gene_5481) increased 2.24-fold at day 16. These transcriptional patterns indicate that additional energy was allocated to support caffeine detoxification and associated defense processes.
3.11. Genes Involved in Phase II Detoxification
Glutathione S-transferases (GSTs) represent a key enzyme family involved in phase II detoxification of a wide range of xenobiotics. These enzymes catalyze the conjugation of reduced glutathione (GSH) with electrophilic groups of xenobiotics, thereby enabling detoxification. In this study, gene_444 and gene_14875, both associated with GSTs, were up-regulated by 7.44-fold and 3.22-fold, respectively, at the early stage of caffeine exposure (10 days), indicating their potential involvement in phase II detoxification of caffeine. In parallel, the Hydantoinase/oxoprolinase N-terminal region, a functional domain critical for oxoprolinase activity, was linked to the up-regulation of gene_10123 and gene_12643 (3.23-fold and 3.96-fold), which contribute to GSH biosynthesis (Table S4). Beyond serving as a substrate for GSTs, GSH functions as an antioxidant through its thiol group, protecting vital cellular structures against ROS-induced damage.
3.12. Experimental Validation
A total of six up-regulated genes (DT_22397, DT_14597, DT_10255, DT_13148, DT_3381, and DT_9081) and six down-regulated genes (DT_15188, DT_18708, DT_3595, DT_4877, DT_9523, and DT_9657) were subjected to quantitative real-time PCR (qRT-PCR) to assess expression profiles. The qRT-PCR results corresponded with transcript abundance changes revealed by DEG analysis (Figure 13), thereby confirming the reliability of the transcriptome dataset.
4. Discussion
In this study, D. tabescens CGMCC 40115 was identified as a strain with caffeine-degrading activity, thereby expanding the available microbial resources for caffeine biodegradation. The degradation characteristics of this strain were systematically examined, and transcriptomic analyses were employed to elucidate its caffeine metabolic pathways. Compared with bacterial systems and other fungal degraders, this mechanism represents a distinct pattern, offering an alternative framework for investigating the molecular basis of fungal caffeine degradation.
4.1. Innovation and Functional Adaptability of the Caffeine-Degrading Metabolic Network in D. tabescens
This study revealed that D. tabescens departed from the strictly linear bacterial routes of “N-demethylation” or “C8 oxidation” [9], establishing instead an intersecting and branched “N-demethylation–C8 oxidation” metabolic network. This network enables adaptation to environments with fluctuating caffeine concentrations. In substrate liquid culture, two distinct degradation pathways operate under the influence of D. tabescens: the N-demethylation pathway, which predominates, and the oxidation pathway (Figure 14). Caffeine, as the initial substrate, undergoes degradation to theobromine (1,3-dimethylxanthine), which then diverges into multiple branches. One route involves successive N-demethylation reactions mediated by the CYP450 system, producing 3-methylxanthine, 7-methylxanthine, paraxanthine, and 1-methylxanthine, ultimately yielding xanthine. In parallel, a C8 oxidation branch generates intermediates such as 1,3-dimethyluric acid and 1,3,7-trimethyluric acid, with certain metabolites undergoing reciprocal interconversion within the network. Additionally, theophylline may serve as an auxiliary intermediate influencing flux distribution. The integration of N-demethylation and C8 oxidation establishes a branched metabolic framework that ensures continuous caffeine degradation while preventing toxic accumulation of single intermediates through pathway diversification, thereby reflecting the adaptive strategy of D. tabescens for efficient caffeine catabolism.
Previous research has indicated the potential involvement of cytochrome P450 proteins in caffeine metabolism [37,38,39]. Functional analysis of enzyme system differentiation revealed that nine core CYP450 genes displayed a precise stage-specific allocation of functions: gene_3381 (log₂FC=6.18) and gene_3396 (log₂FC=5.92) dominated the initial demethylation phase; gene_14597 (log₂FC=1.81) and gene_22397 (log₂FC=2.89) mediate intermediate transformations during the middle stage; and gene_7614 (log₂FC=3.61) sustains the oxidation of terminal products in the late stage. Unlike the “differentiated yet lacking distinct temporal partitioning” CYP450 family reported in the nicotine-degrading fungus Aspergillus oryzae [40], the CYP450 superfamily in D. tabescens demonstrates dual functional advantages, characterized by both broad substrate adaptability and high reaction specificity. This duality enables adaptation to structural variations in caffeine during degradation while simultaneously minimizing unnecessary energy expenditure through temporally regulated expression.
4.2. Physiological Significance of the “Stress-Degradation-Homeostasis” Three-Stage Transcriptional Regulation Model
Analysis of the 10/16/22-day time-series transcriptome data established a regulatory framework describing the adaptive response of D. tabescens to caffeine stress:
At the Stress Detoxification Stage (10 d), rapid induction of the MAPK signaling cascade (Catalase-like domain genes such as gene_12413, gene_12438, and gene_20704, log₂FC≈5) together with members of the GSTs family (gene_444, log₂FC=7.44) formed the primary defense against caffeine cytotoxicity. The MAPK pathway mediated stress signaling [41,42], while GSTs executed Phase II detoxification through conjugation with oxidized intermediates, including 1,3,7-trimethyluric acid [3]. Concurrent upregulation of TCA cycle genes (gene_8011, log₂FC=5.20) and oxidative phosphorylation genes (gene_6972, log₂FC=11.05) supplied sufficient energy for CYP450-dependent oxidation, which requires one NADPH molecule per step. This concurrent activation of defense and energy supply contrasts with the bacterial strategy of sequential energy utilization, where degradation precedes energy replenishment [43]. At the Efficient Degradation Stage (16 d), 3605 DEGs primarily targeted intermediate metabolism. Sustained high expression of CYP450 genes coincided with the conversion peak of theobromine to 3-methylxanthine, reflecting tight coordination between transcriptional control and metabolic flux. At the Metabolic Homeostasis Stage (22 d), 69% of TCA genes and 72.5% of oxidative phosphorylation genes were downregulated, while glycogen synthesis genes were activated, indicating a shift toward energy conservation through demand-based allocation. The terminal degradation product xanthine entered the purine metabolic cycle, serving as an alternative energy source and enabling recycling of degradation outputs. This progression from stress adaptation to resource-efficient utilization illustrates the capacity of D. tabescens to integrate xenobiotic metabolism into broader cellular homeostasis.
4.3. Coupling Mechanism of Detoxification-Energy-Secondary Metabolism
This study provides the first evidence of the functional involvement of GSH in caffeine degradation by D. tabescens, with activation of the GSH-associated gene (gene_10123, log₂FC=3.23). GSH functions not only as a substrate for GSTs to conjugate with oxidized intermediates such as 1,3,7-trimethyluric acid to complete Phase II detoxification but also as a source of NADPH via the pentose phosphate pathway, thereby supplying reducing power for CYP450 and establishing a coordinated detoxification–coenzyme system [44]. In the context of bidirectional regulation of secondary metabolic clusters, AntiSMASH analysis predicted 109 clusters, among which regions 7.1, 19.1, and 40.1 shared homology with the (+)-δ-cadinol cluster of Coniophora puteana. Early-stage metabolism involves gene_10566 (alcohol oxidase), which catalyzes the oxidation of formaldehyde to formic acid, preventing toxic accumulation. During the mid-stage, FAD-binding proteins contribute cofactors for CYP450 activity, while in the late stage, terpene synthesis genes mitigate ROS stress. This regulatory sequence establishes equilibrium between degradation processes and ecological defense mechanisms.
4.4. Inter-Species Mechanistic Differences: Evolutionary Divergence Between Fungi, Bacteria, and Other Degrading Fungi
Microorganisms exhibit distinct strategies for caffeine degradation (Table 6). Bacteria rely on fixed gene clusters and a single metabolic route, characterized by consistently high energy expenditure. Nicotine-degrading fungi depend on specialized P450 families and linear pathways, with energy mobilization occurring in the initial stage [40]. In contrast, D. tabescens forms intricate metabolic networks through stage-specific CYP450 deployment, coordinates energy utilization with temporal precision, and simultaneously counters oxidative stress and engages in ecological competition through secondary metabolites. This adaptive framework represents a distinctive evolutionary trajectory for caffeine degradation in fungi.
4.5. Research Limitations and Future Directions
Mechanistic validation remains incomplete. Verification of the demethylation sequence requires CRISPR-mediated gene knockout, while substrate specificity demands in vitro expression of CYP450 proteins. In addition, subcellular fractionation is needed to confirm peroxisome-associated metabolism. Comprehensive elucidation will further depend on integrated multi-omics approaches.
Supplementary Materials
The following supporting information can be downloaded at the website of this paper posted on Preprints.org, Table S1: Summary table of fungal strains collected; Table S2: Summary of RNA-seq quality control statistics; Table S3: EggNOG functional annotation of DEGs; Table S4: Genes of Metabolic pathways involved in energy production. Figure S1: Functional annotation of all assembled genes against six widely used Databases. Figure S2: Bar Chart of EggNOG Classification of DEGs.
Author Contributions
Conceptualization, J.W. (Junrui Wang) and J.W. (Jinzi Wang); methodology, Y.H. (Yongqiang Hu); software, J.W. (Junrui Wang) ,Y.H., Y.C., Y.J. and M.P.; formal analysis and investigation, J.W. (Junrui Wang); resources, M.J. (Mingguo Jiang); data curation, Y.H.; writing—original draft preparation, J.W. (Junrui Wang); writing—review and editing, J.W. (Jinzi Wang) and P.S. (Peihong Shen); supervision, P.S.; project administration, M.J., P.S. and J.W. (Jinzi Wang); funding acquisition, J.W. (Jinzi Wang). All authors have read and agreed to the published version of the manuscript.
Funding
This research was funded by the Scientific Research Project for Introducing Talents of Guangxi Minzu University (funding code: 2020KJQD21), Guangxi Key Research and Development Program (Guike: AB23075147).
Institutional Review Board Statement
Not applicable.
Informed Consent Statement
Not applicable.
Data Availability Statement
The original contributions presented in this study are included in the article/Supplementary Material. Further inquiries can be directed to the corresponding authors.
Conflicts of Interest
The authors declare no conflict of interest.
References
- Higdon, J.V.; Frei, B. Coffee and Health: A Review of Recent Human Research. Crit Rev Food Sci Nutr 2006, 46, 101–123. [Google Scholar] [CrossRef]
- Ngueta, G. Caffeine and Caffeine Metabolites in Relation to Hypertension in U.S. Adults. Eur J Clin Nutr 2020, 74, 77–86. [Google Scholar] [CrossRef] [PubMed]
- Isolation, Characterization and Application of Theophylline-Degrading Aspergillus Fungi | Microbial Cell Factories | Full Text. Available online: https://microbialcellfactories.biomedcentral.com/articles/10.1186/s12934-020-01333-0 (accessed on 15 September 2025).
- Microbial Degradation of Caffeine Using Himalayan Psychrotolerant Pseudomonas Sp.GBPI_Hb5 (MCC 3295) | Current Microbiology. Available online: https://link.springer.com/article/10.1007/s00284-021-02644-0 (accessed on 15 September 2025).
- Gutierrez, A.E.; Shah, P.; Rex, A.E.; Nguyen, T.C.; Kenkare, S.P.; Barrick, J.E.; Mishlera, D.M. Bioassay for Determining the Concentrations of Caffeine and Individual Methylxanthines in Complex Samples. Applied and Environmental Microbiology 2019, 85. [Google Scholar] [CrossRef]
- Genetic Characterization of Caffeine Degradation by Bacteria and Its Potential Applications. - Abstract - Europe PMC. Available online: https://europepmc.org/article/PMC/4408171 (accessed on 15 September 2025).
- Summers, R.M.; Mohanty, S.K.; Gopishetty, S.; Subramanian, M. Genetic Characterization of Caffeine Degradation by Bacteria and Its Potential Applications. Microb Biotechnol 2015, 8, 369–378. [Google Scholar] [CrossRef]
- Quandt, E.M.; Hammerling, M.J.; Summers, R.M.; Otoupal, P.B.; Slater, B.; Alnahhas, R.N.; Dasgupta, A.; Bachman, J.L.; Subramanian, M.V.; Barrick, J.E. Decaffeination and Measurement of Caffeine Content by Addicted Escherichia Coli with a Refactored N-Demethylation Operon from Pseudomonas Putida CBB5. ACS Synth Biol 2013, 2, 301–307. [Google Scholar] [CrossRef]
- Summers, R.M.; Louie, T.M.; Yu, C.L.; Subramanian, M. Characterization of a Broad-Specificity Non-Haem Iron N-Demethylase from Pseudomonas Putida CBB5 Capable of Utilizing Several Purine Alkaloids as Sole Carbon and Nitrogen Source. Microbiology (Reading) 2011, 157, 583–592. [Google Scholar] [CrossRef]
- Madyastha, K.M.; Sridhar, G.R. A Novel Pathway for the Metabolism of Caffeine by a Mixed Culture Consortium. Biochem Biophys Res Commun 1998, 249, 178–181. [Google Scholar] [CrossRef] [PubMed]
- Kim, J.H.; Kim, B.H.; Brooks, S.; Kang, S.Y.; Summers, R.M.; Song, H.K. Structural and Mechanistic Insights into Caffeine Degradation by the Bacterial N-Demethylase Complex. Journal of Molecular Biology 2019, 431, 3647–3661. [Google Scholar] [CrossRef]
- Salmones, D.; Mata, G.; Waliszewski, K.N. Comparative Culturing of Pleurotus Spp. on Coffee Pulp and Wheat Straw: Biomass Production and Substrate Biodegradation. Bioresource Technology 2005, 96, 537–544. [Google Scholar] [CrossRef]
- Brand, D.; Pandey, A.; Roussos, S.; Soccol, C.R. Biological Detoxification of Coffee Husk by Filamentous Fungi Using a Solid State Fermentation System. Enzyme and Microbial Technology 2000, 27, 127–133. [Google Scholar] [CrossRef]
- Caffeine Metabolism during Cultivation of Oyster Mushroom (Pleurotus Ostreatus) with Spent Coffee Grounds | Applied Microbiology and Biotechnology. Available online: https://link.springer.com/article/10.1007/s00253-019-09883-z (accessed on 15 September 2025).
- Zhou, B.; Ma, C.; Ren, X.; Xia, T.; Li, X. LC-MS/MS-Based Metabolomic Analysis of Caffeine-Degrading Fungus Aspergillus Sydowii during Tea Fermentation. J Food Sci 2020, 85, 477–485. [Google Scholar] [CrossRef] [PubMed]
- Dash, S.S.; Gummadi, S.N. Catabolic Pathways and Biotechnological Applications of Microbial Caffeine Degradation. Biotechnol Lett 2006, 28, 1993–2002. [Google Scholar] [CrossRef] [PubMed]
- Sipos, G.; Prasanna, A.N.; Walter, M.C.; O’Connor, E.; Bálint, B.; Krizsán, K.; Kiss, B.; Hess, J.; Varga, T.; Slot, J.; et al. Genome Expansion and Lineage-Specific Genetic Innovations in the Forest Pathogenic Fungi Armillaria. Nat Ecol Evol 2017, 1, 1931–1941. [Google Scholar] [CrossRef] [PubMed]
- Mihail, J.D.; Bilyeu, L.; Lalk, S.R. Bioluminescence Expression during the Transition from Mycelium to Mushroom in Three North American Armillaria and Desarmillaria Species. Fungal Biol 2018, 122, 1064–1068. [Google Scholar] [CrossRef]
- A Combination of Genome Mining with an OSMAC Approach Facilitates the Discovery of and Contributions to the Biosynthesis of Melleolides from the Basidiomycete Armillaria Tabescens | Journal of Agricultural and Food Chemistry. Available online: https://pubs.acs.org/doi/10.1021/acs.jafc.2c04079 (accessed on 15 September 2025).
- Yang, R.; Li, Y.; Mehmood, S.; Yan, C.; Huang, Y.; Cai, J.; Ji, J.; Pan, W.; Zhang, W.; Chen, Y. Polysaccharides from Armillariella Tabescens Mycelia Ameliorate Renal Damage in Type 2 Diabetic Mice. International Journal of Biological Macromolecules 2020, 162, 1682–1691. [Google Scholar] [CrossRef]
- Yang, R.; Li, Y.; Cai, J.; Ji, J.; Wang, Y.; Zhang, W.; Pan, W.; Chen, Y. Polysaccharides from Armillariella Tabescens Mycelia Ameliorate Insulin Resistance in Type 2 Diabetic Mice. Food Funct 2020, 11, 9675–9685. [Google Scholar] [CrossRef]
- Zhang, T.; Feng, J.; He, W.; Rong, X.; Lv, H.; Li, J.; Li, X.; Wang, H.; Wang, L.; Zhang, L.; et al. Genomic and Transcriptomic Approaches Provide a Predictive Framework for Sesquiterpenes Biosynthesis in Desarmillaria Tabescens CPCC 401429. Journal of Fungi 2023, 9, 481. [Google Scholar] [CrossRef]
- Fitri Faradilla, Rh.; Tamrin, T.; Nuh Ibrahim, M.; Rejeki, S.; Siala, A.; Firmansyah, F. Chemical, Mechanical, Antioxidant, and Antimicrobial Properties of Paper Prepared from Cocoa Bean Shell Using Polyethylene Glycol. JFNR 2019, 7, 579–583. [Google Scholar] [CrossRef]
- Ma, C.; Li, X.; Zheng, C.; Zhou, B.; Xu, C.; Xia, T. Comparison of Characteristic Components in Tea-Leaves Fermented by Aspergillus Pallidofulvus PT-3, Aspergillus Sesamicola PT-4 and Penicillium Manginii PT-5 Using LC-MS Metabolomics and HPLC Analysis. Food Chemistry 2021, 350, 129228. [Google Scholar] [CrossRef]
- Fastp: An Ultra-Fast All-in-One FASTQ Preprocessor | Bioinformatics | Oxford Academic. Available online: https://academic.oup.com/bioinformatics/article/34/17/i884/5093234?login=true (accessed on 15 September 2025).
- HISAT: A Fast Spliced Aligner with Low Memory Requirements | Nature Methods. Available online: https://www.nature.com/articles/nmeth.3317 (accessed on 15 September 2025).
- StringTie Enables Improved Reconstruction of a Transcriptome from RNA-Seq Reads | Nature Biotechnology. Available online: https://www.nature.com/articles/nbt.3122 (accessed on 15 September 2025).
- Li, B.; Dewey, C.N. RSEM: Accurate Transcript Quantification from RNA-Seq Data with or without a Reference Genome. BMC Bioinformatics 2011, 12, 323. [Google Scholar] [CrossRef]
- Wang, L.; Feng, Z.; Wang, X.; Wang, X.; Zhang, X. DEGseq: An R Package for Identifying Differentially Expressed Genes from RNA-Seq Data. Bioinformatics 2010, 26, 136–138. [Google Scholar] [CrossRef] [PubMed]
- STEM: A Tool for the Analysis of Short Time Series Gene Expression Data | BMC Bioinformatics | Full Text. Available online: https://bmcbioinformatics.biomedcentral.com/articles/10.1186/1471-2105-7-191 (accessed on 23 September 2025).
- antiSMASH 8.0: Extended Gene Cluster Detection Capabilities and Analyses of Chemistry, Enzymology, and Regulation - Wageningen University & Research. Available online: https://research.wur.nl/en/publications/antismash-80-extended-gene-cluster-detection-capabilities-and-ana (accessed on 16 September 2025).
- Arocho, A.; Chen, B.; Ladanyi, M.; Pan, Q. Validation of the 2-DeltaDeltaCt Calculation as an Alternate Method of Data Analysis for Quantitative PCR of BCR-ABL P210 Transcripts. Diagn Mol Pathol 2006, 15, 56–61. [Google Scholar] [CrossRef]
- Salmones, D.; Mata, G.; Waliszewski, K.N. Comparative Culturing of Pleurotus Spp. on Coffee Pulp and Wheat Straw: Biomass Production and Substrate Biodegradation. Bioresource Technology 2005, 96, 537–544. [Google Scholar] [CrossRef]
- Carrasco-Cabrera, C.P.; Bell, T.L.; Kertesz, M.A. Caffeine Metabolism during Cultivation of Oyster Mushroom (Pleurotus Ostreatus) with Spent Coffee Grounds. Appl Microbiol Biotechnol 2019, 103, 5831–5841. [Google Scholar] [CrossRef]
- Biological characteristics of three Armillaria species from Northeast China and artificial cultivation of A.ostoyae. Available online: https://d.wanfangdata.com.cn/Periodical/jwxt202301028 (accessed on 17 September 2025).
- Cloning and Function Analysis of CYP82Ds Genes from Camellia Sinensis. Available online: https://d.wanfangdata.com.cn/Thesis/D02821474 (accessed on 23 September 2025).
- Chung, W.G.; Cha, Y.N. Oxidation of Caffeine to Theobromine and Theophylline Is Catalyzed Primarily by Flavin-Containing Monooxygenase in Liver Microsomes. Biochem Biophys Res Commun 1997, 235, 685–688. [Google Scholar] [CrossRef]
- Theobromine, Caffeine, and Theophylline Metabolites in Human Plasma and Urine after Consumption of Soluble Cocoa Products with Different Methylxanthine Contents | Article Information | J-GLOBAL. Available online: https://jglobal.jst.go.jp/en/detail?JGLOBAL_ID=201402272030823259 (accessed on 25 September 2025).
- Grzegorzewski, J.; Bartsch, F.; Köller, A.; König, M. Pharmacokinetics of Caffeine: A Systematic Analysis of Reported Data for Application in Metabolic Phenotyping and Liver Function Testing. bioRxiv - Pharmacology and Toxicology 2021. [CrossRef]
- He, C.; Huang, Y.; Liu, P.; Wei, J.; Yang, Y.; Xu, L.; Xiao, M. Transcriptome Analysis of Genes and Metabolic Pathways Associated with Nicotine Degradation in Aspergillus Oryzae 112822. BMC Genomics 2019, 20, 86. [Google Scholar] [CrossRef]
- MAPK Signal Pathways in the Regulation of Cell Proliferation in Mammalian Cells | Cell Research. Available online: https://www.nature.com/articles/7290105 (accessed on 25 September 2025).
- Kyriakis, J.M.; Avruch, J. Mammalian MAPK Signal Transduction Pathways Activated by Stress and Inflammation: A 10-Year Update. Physiol Rev 2012, 92, 689–737. [Google Scholar] [CrossRef] [PubMed]
- Fungal Stress Responses and the Importance of GPCRs. Available online: https://www.mdpi.com/2309-608X/11/3/213 (accessed on 25 September 2025).
- Cnubben, N.H.P.; Rietjens, I.M.C.M.; Wortelboer, H.; van Zanden, J.; van Bladeren, P.J. The Interplay of Glutathione-Related Processes in Antioxidant Defense. Environmental Toxicology and Pharmacology 2001, 10, 141–152. [Google Scholar] [CrossRef] [PubMed]
Figure 1.
Growth of D. tabescens on six liquid media. A1: PDA medium; A2: PDA caffeine enriched medium; B1: carrot medium; B2: carrot caffeine enriched medium; C1: wort medium; C2: wort caffeine enriched medium; D1: GPY medium; D2: GPY caffeine enriched medium; E1: wheat bran medium; E2: wheat bran caffeine enriched medium; F1: GPC medium; F2: GPC caffeine enriched medium.
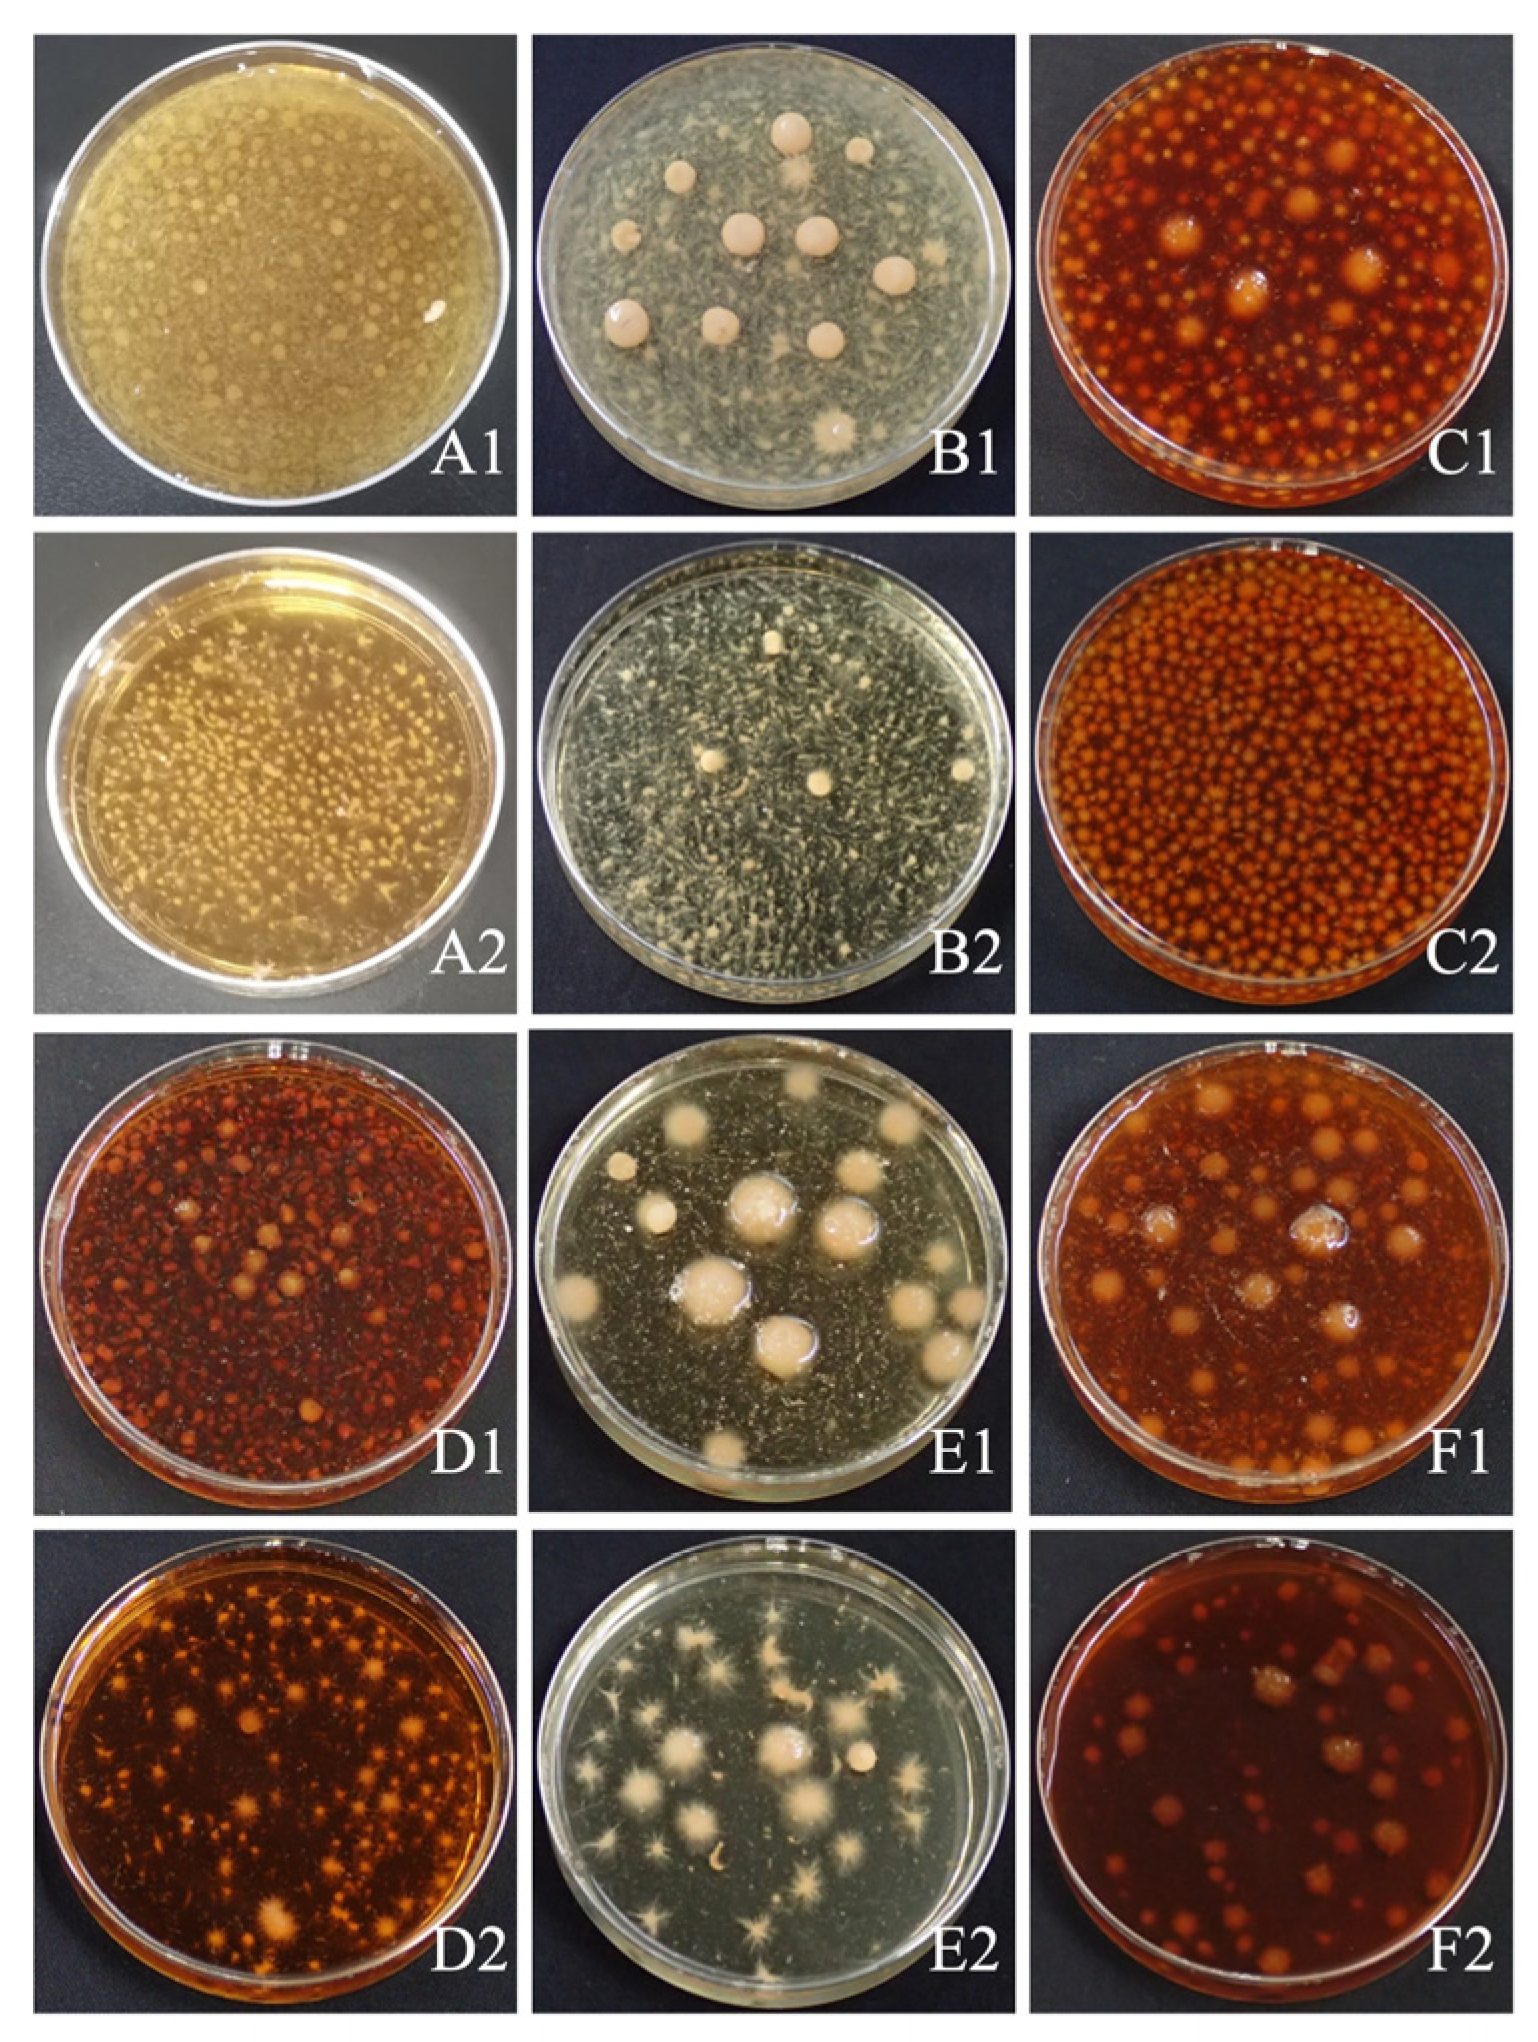
Figure 2.
A. Statistics of mycelial biomass (dry weight) of D. tabescens in six liquid culture media B. Statistics on Caffeine Degradation by D. tabescens in Six Liquid Culture Media.
Figure 2.
A. Statistics of mycelial biomass (dry weight) of D. tabescens in six liquid culture media B. Statistics on Caffeine Degradation by D. tabescens in Six Liquid Culture Media.
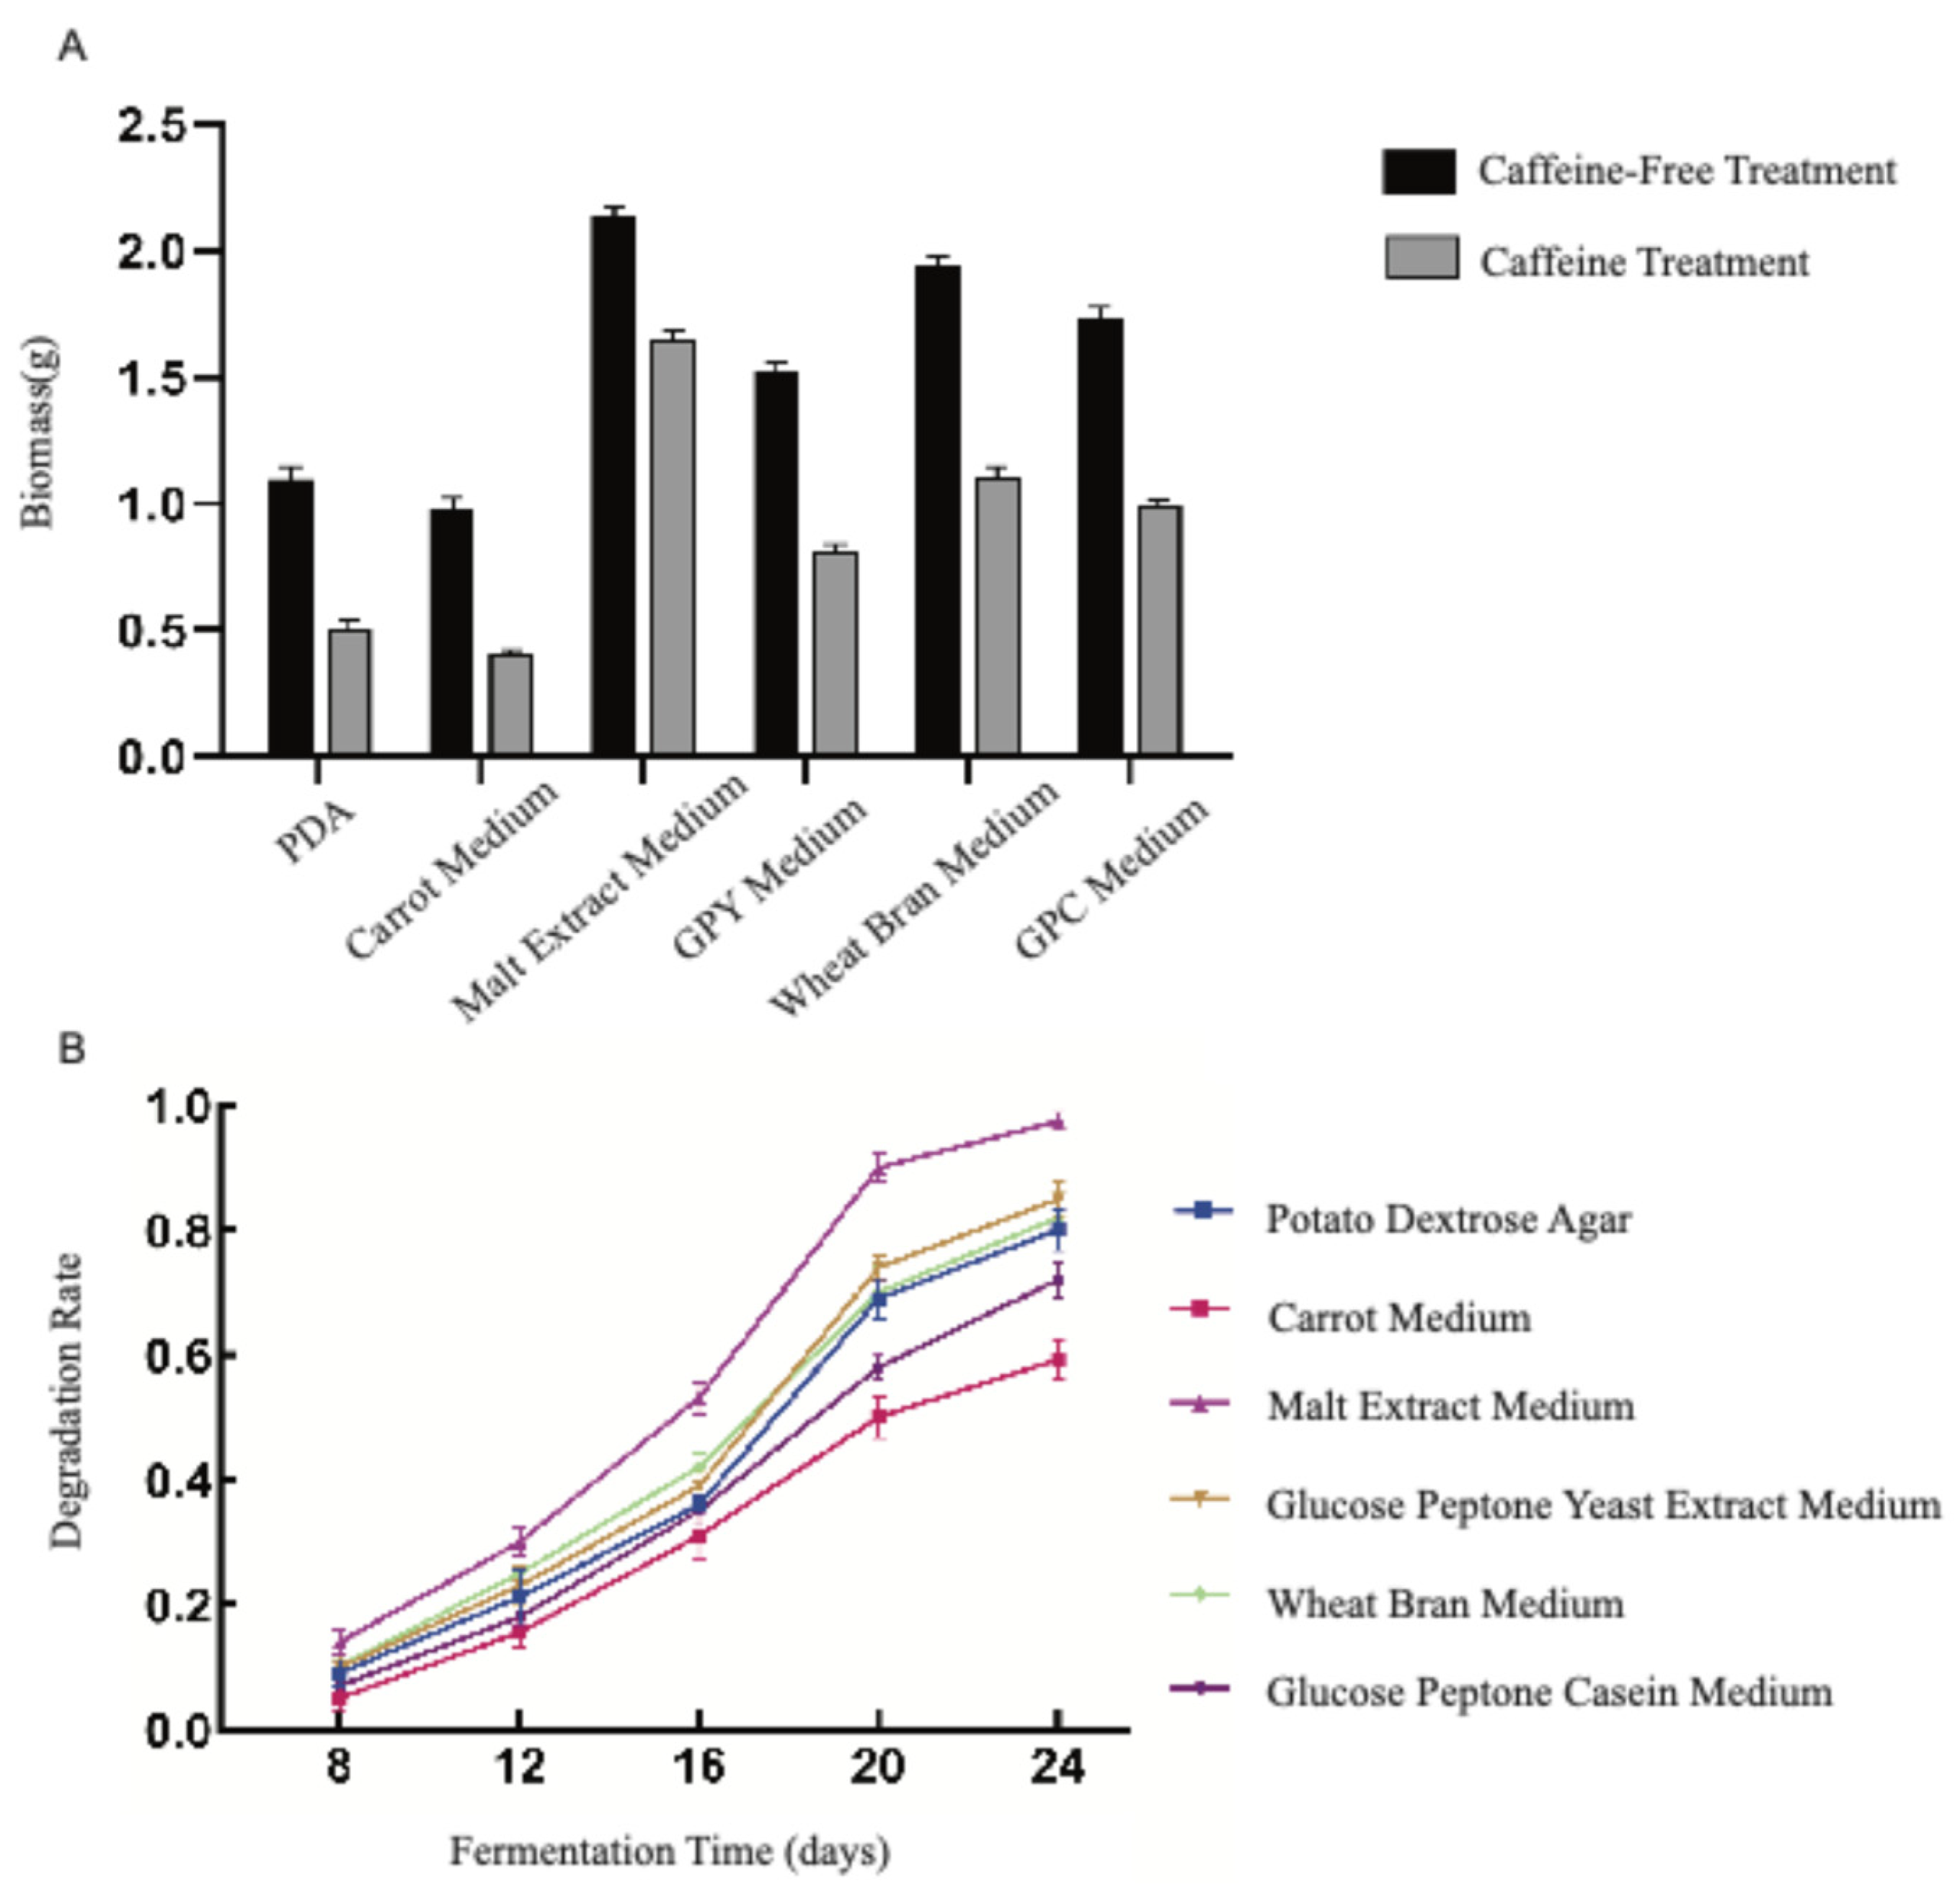
Figure 3.
Caffeine degradation by D. tabescens in different caffeine concentrations.Note: Theanine concentration A: 300 mg/L; B: 600 mg/L; C: 900 mg/L; D: 1200 mg/L; E: 1500 mg/L.
Figure 3.
Caffeine degradation by D. tabescens in different caffeine concentrations.Note: Theanine concentration A: 300 mg/L; B: 600 mg/L; C: 900 mg/L; D: 1200 mg/L; E: 1500 mg/L.
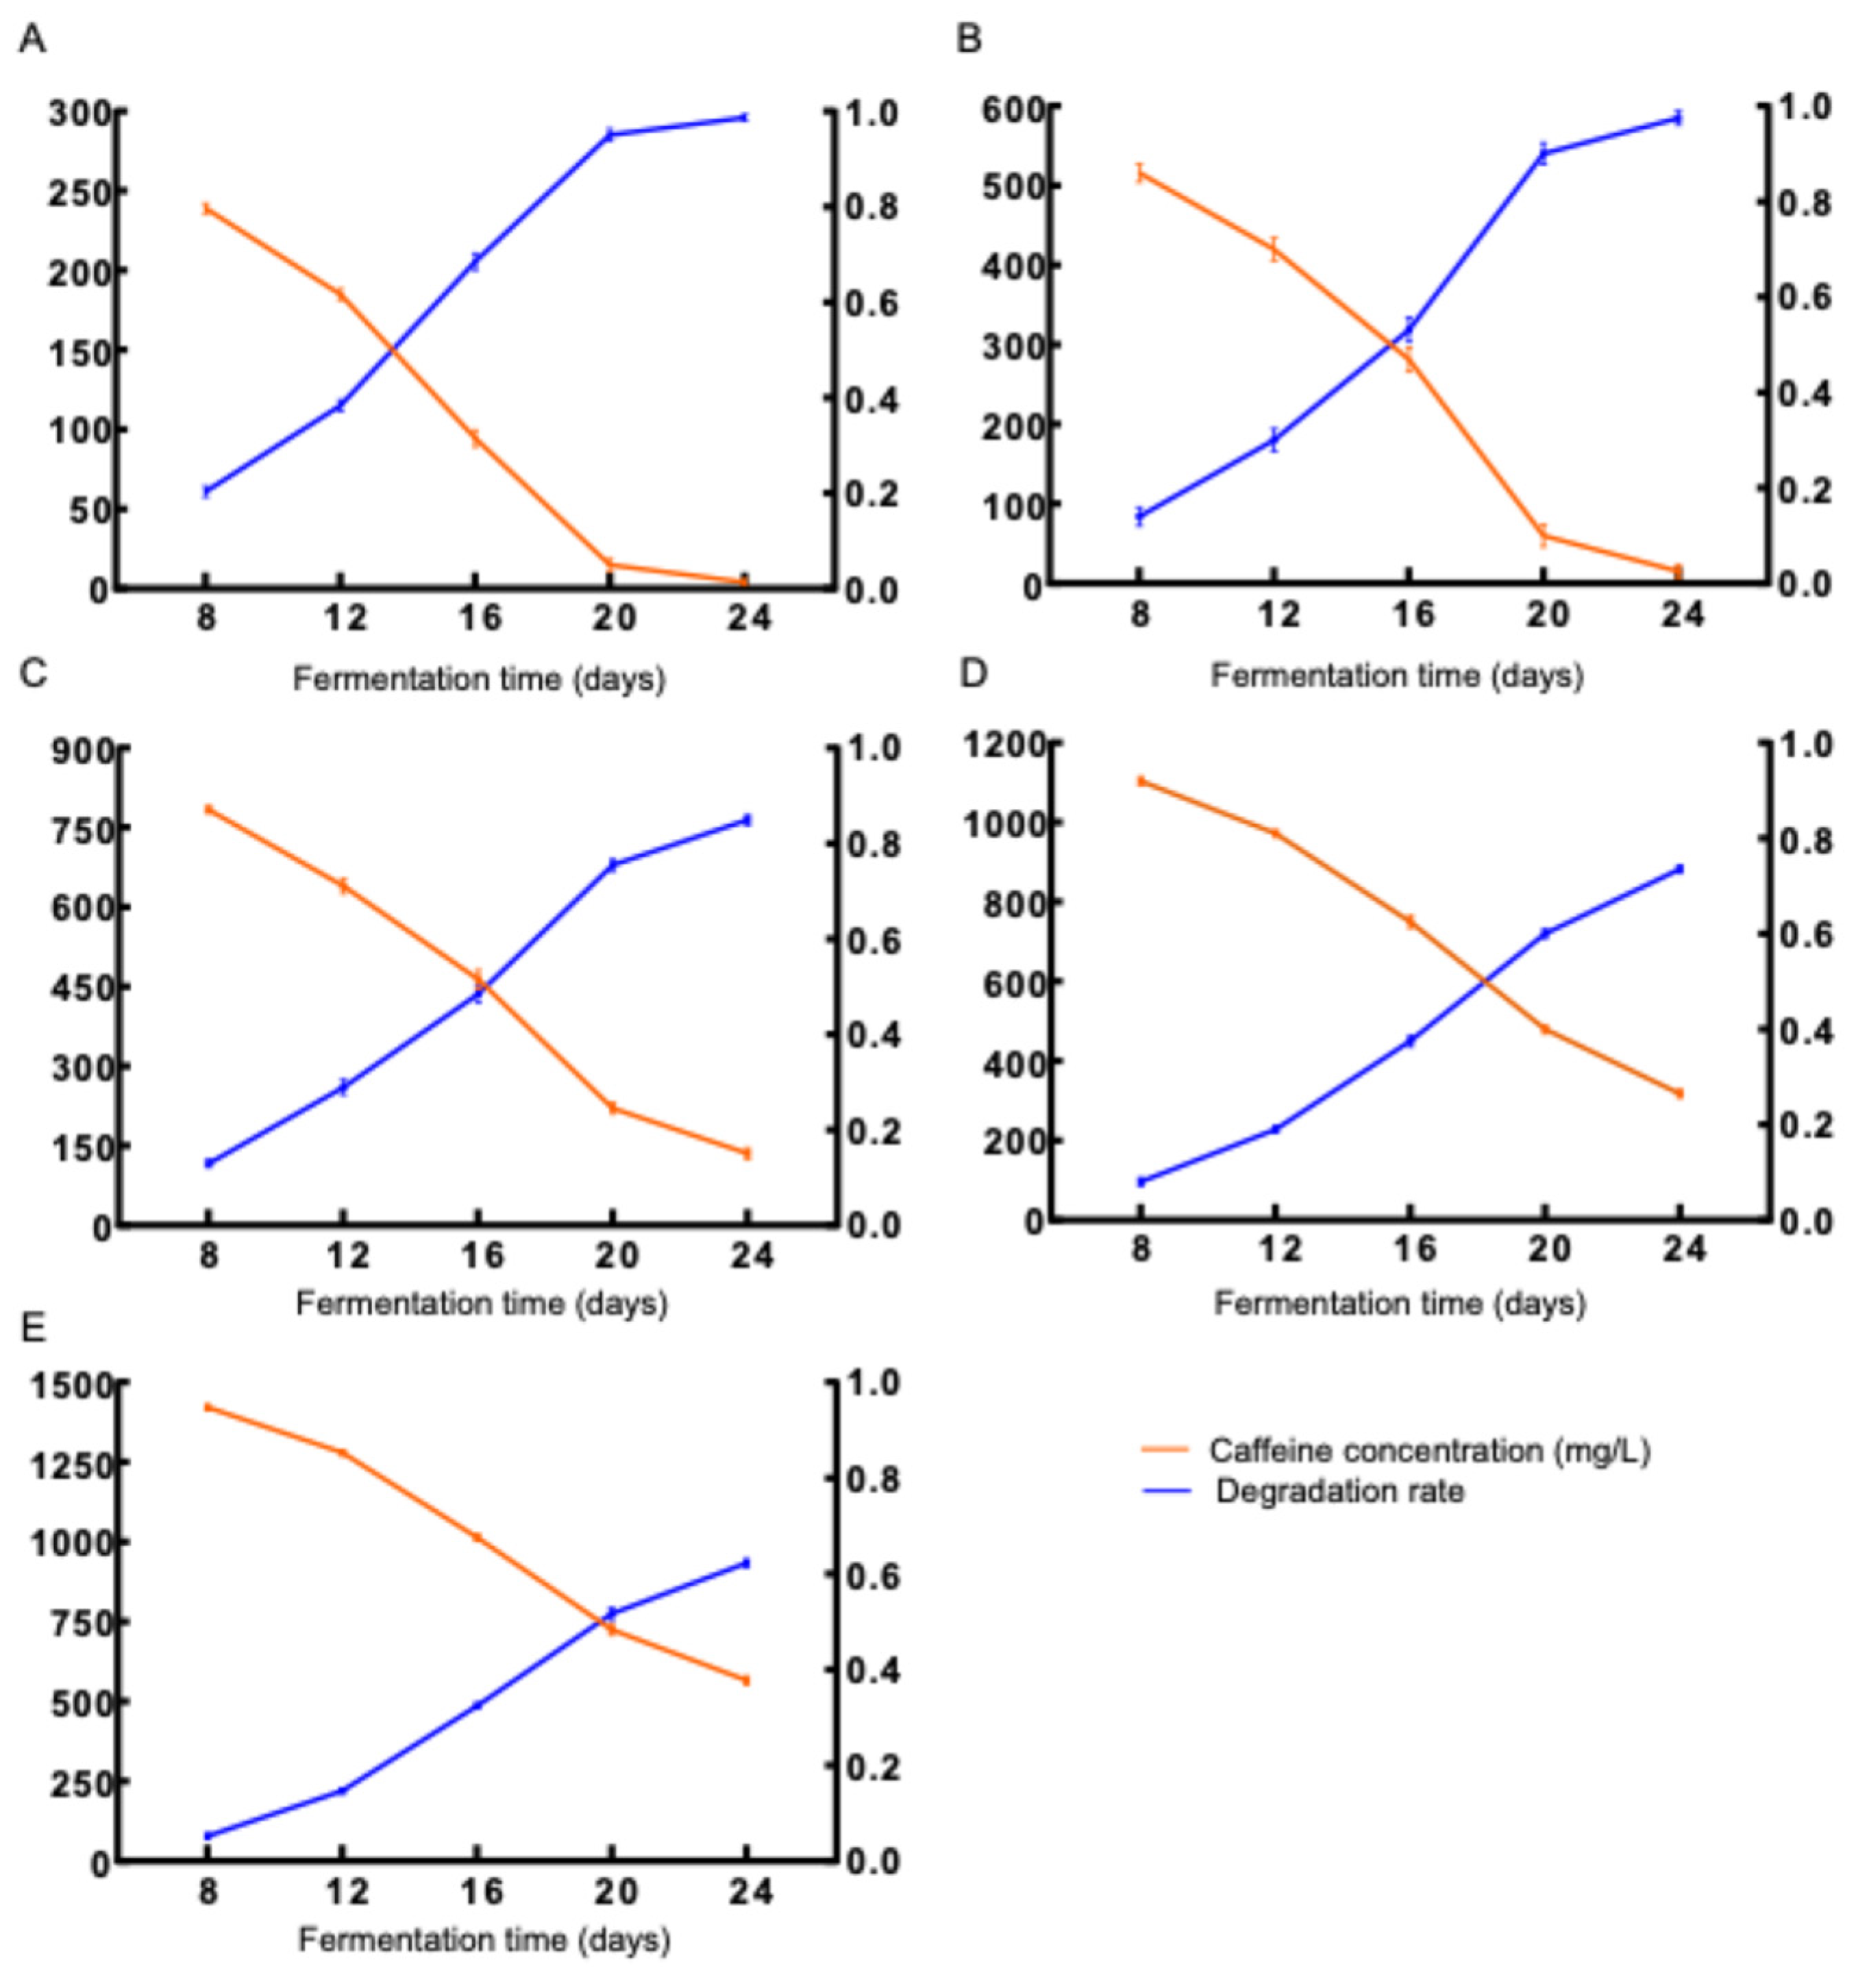
Figure 4.
Caffeine degradation by D. tabescens at different temperature conditions.
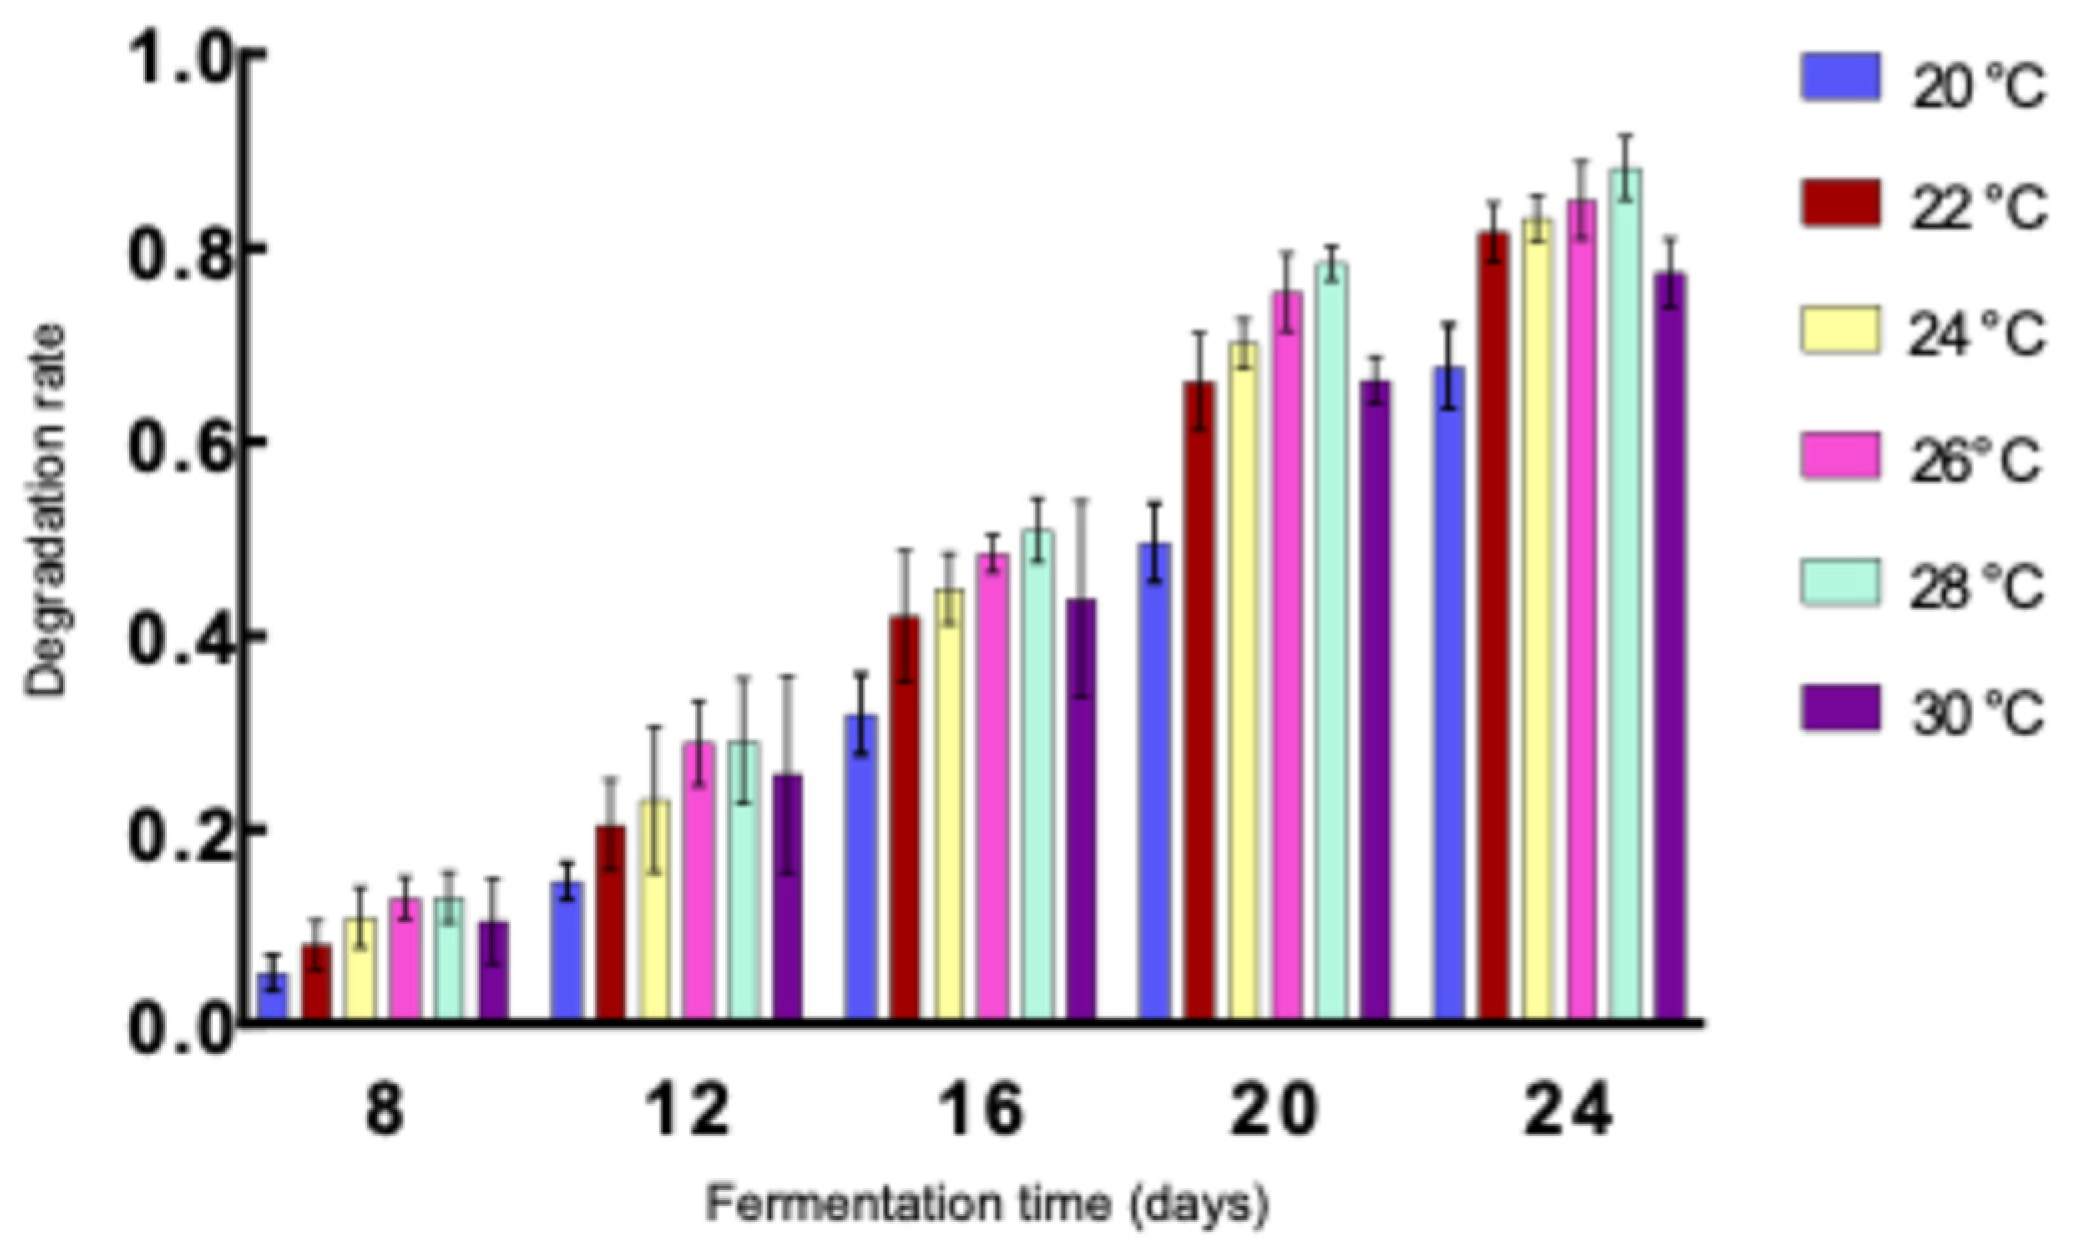
Figure 5.
Caffeine degradation by D. tabescens under different pH conditions.
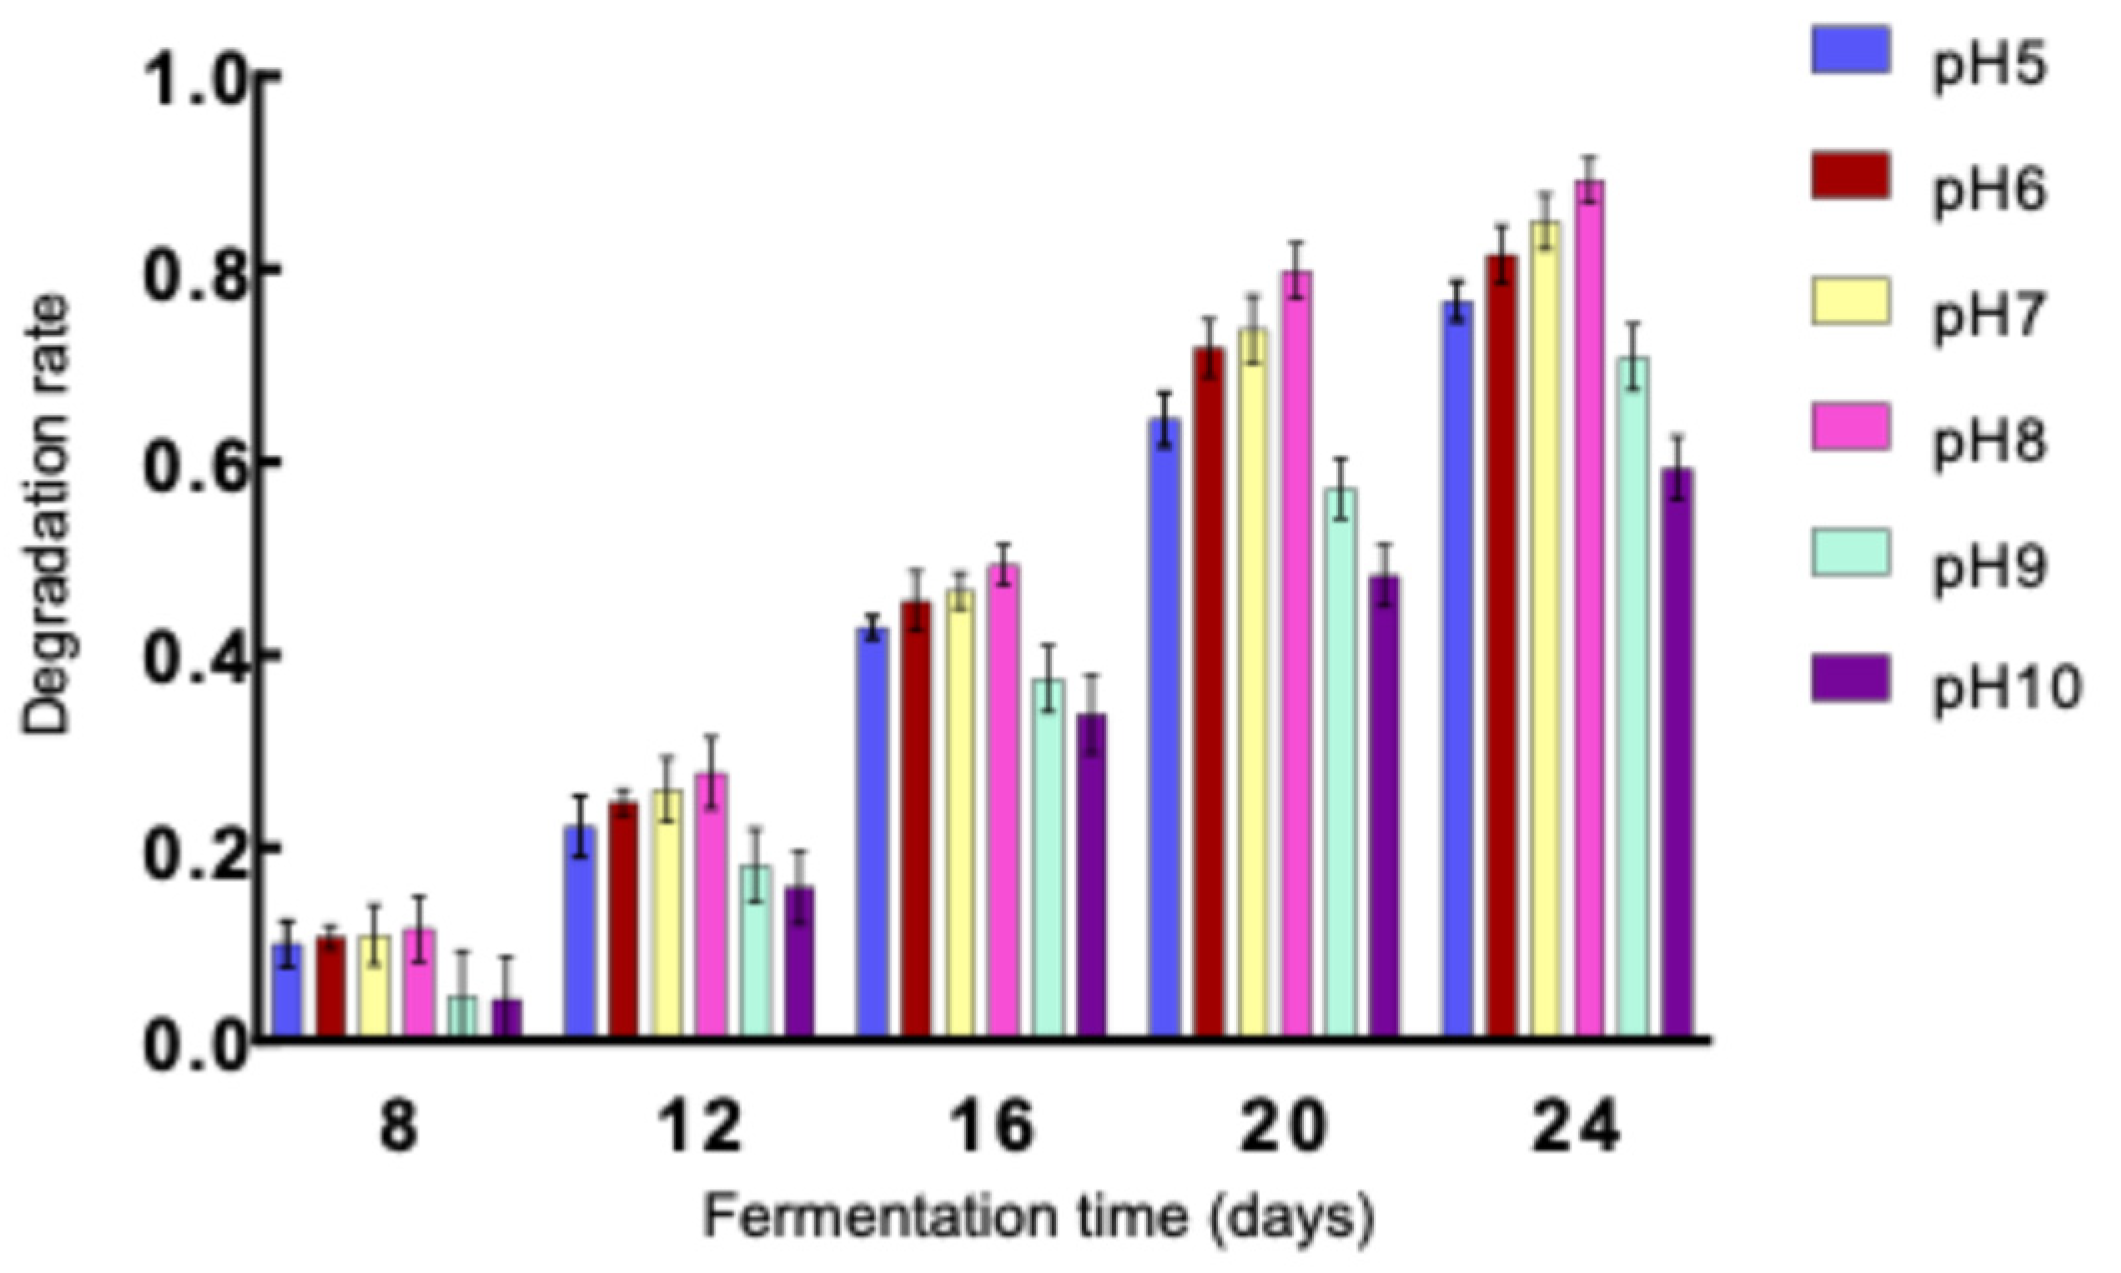
Figure 6.
Calibration of caffeine and its metabolites in D. tabescens at different fermentation times. Note: 1: xanthine; 2: 7-methylxanthine; 3: 3-methylxanthine; 4: theobromine; 5: theophylline; 6: caffeine.
Figure 6.
Calibration of caffeine and its metabolites in D. tabescens at different fermentation times. Note: 1: xanthine; 2: 7-methylxanthine; 3: 3-methylxanthine; 4: theobromine; 5: theophylline; 6: caffeine.
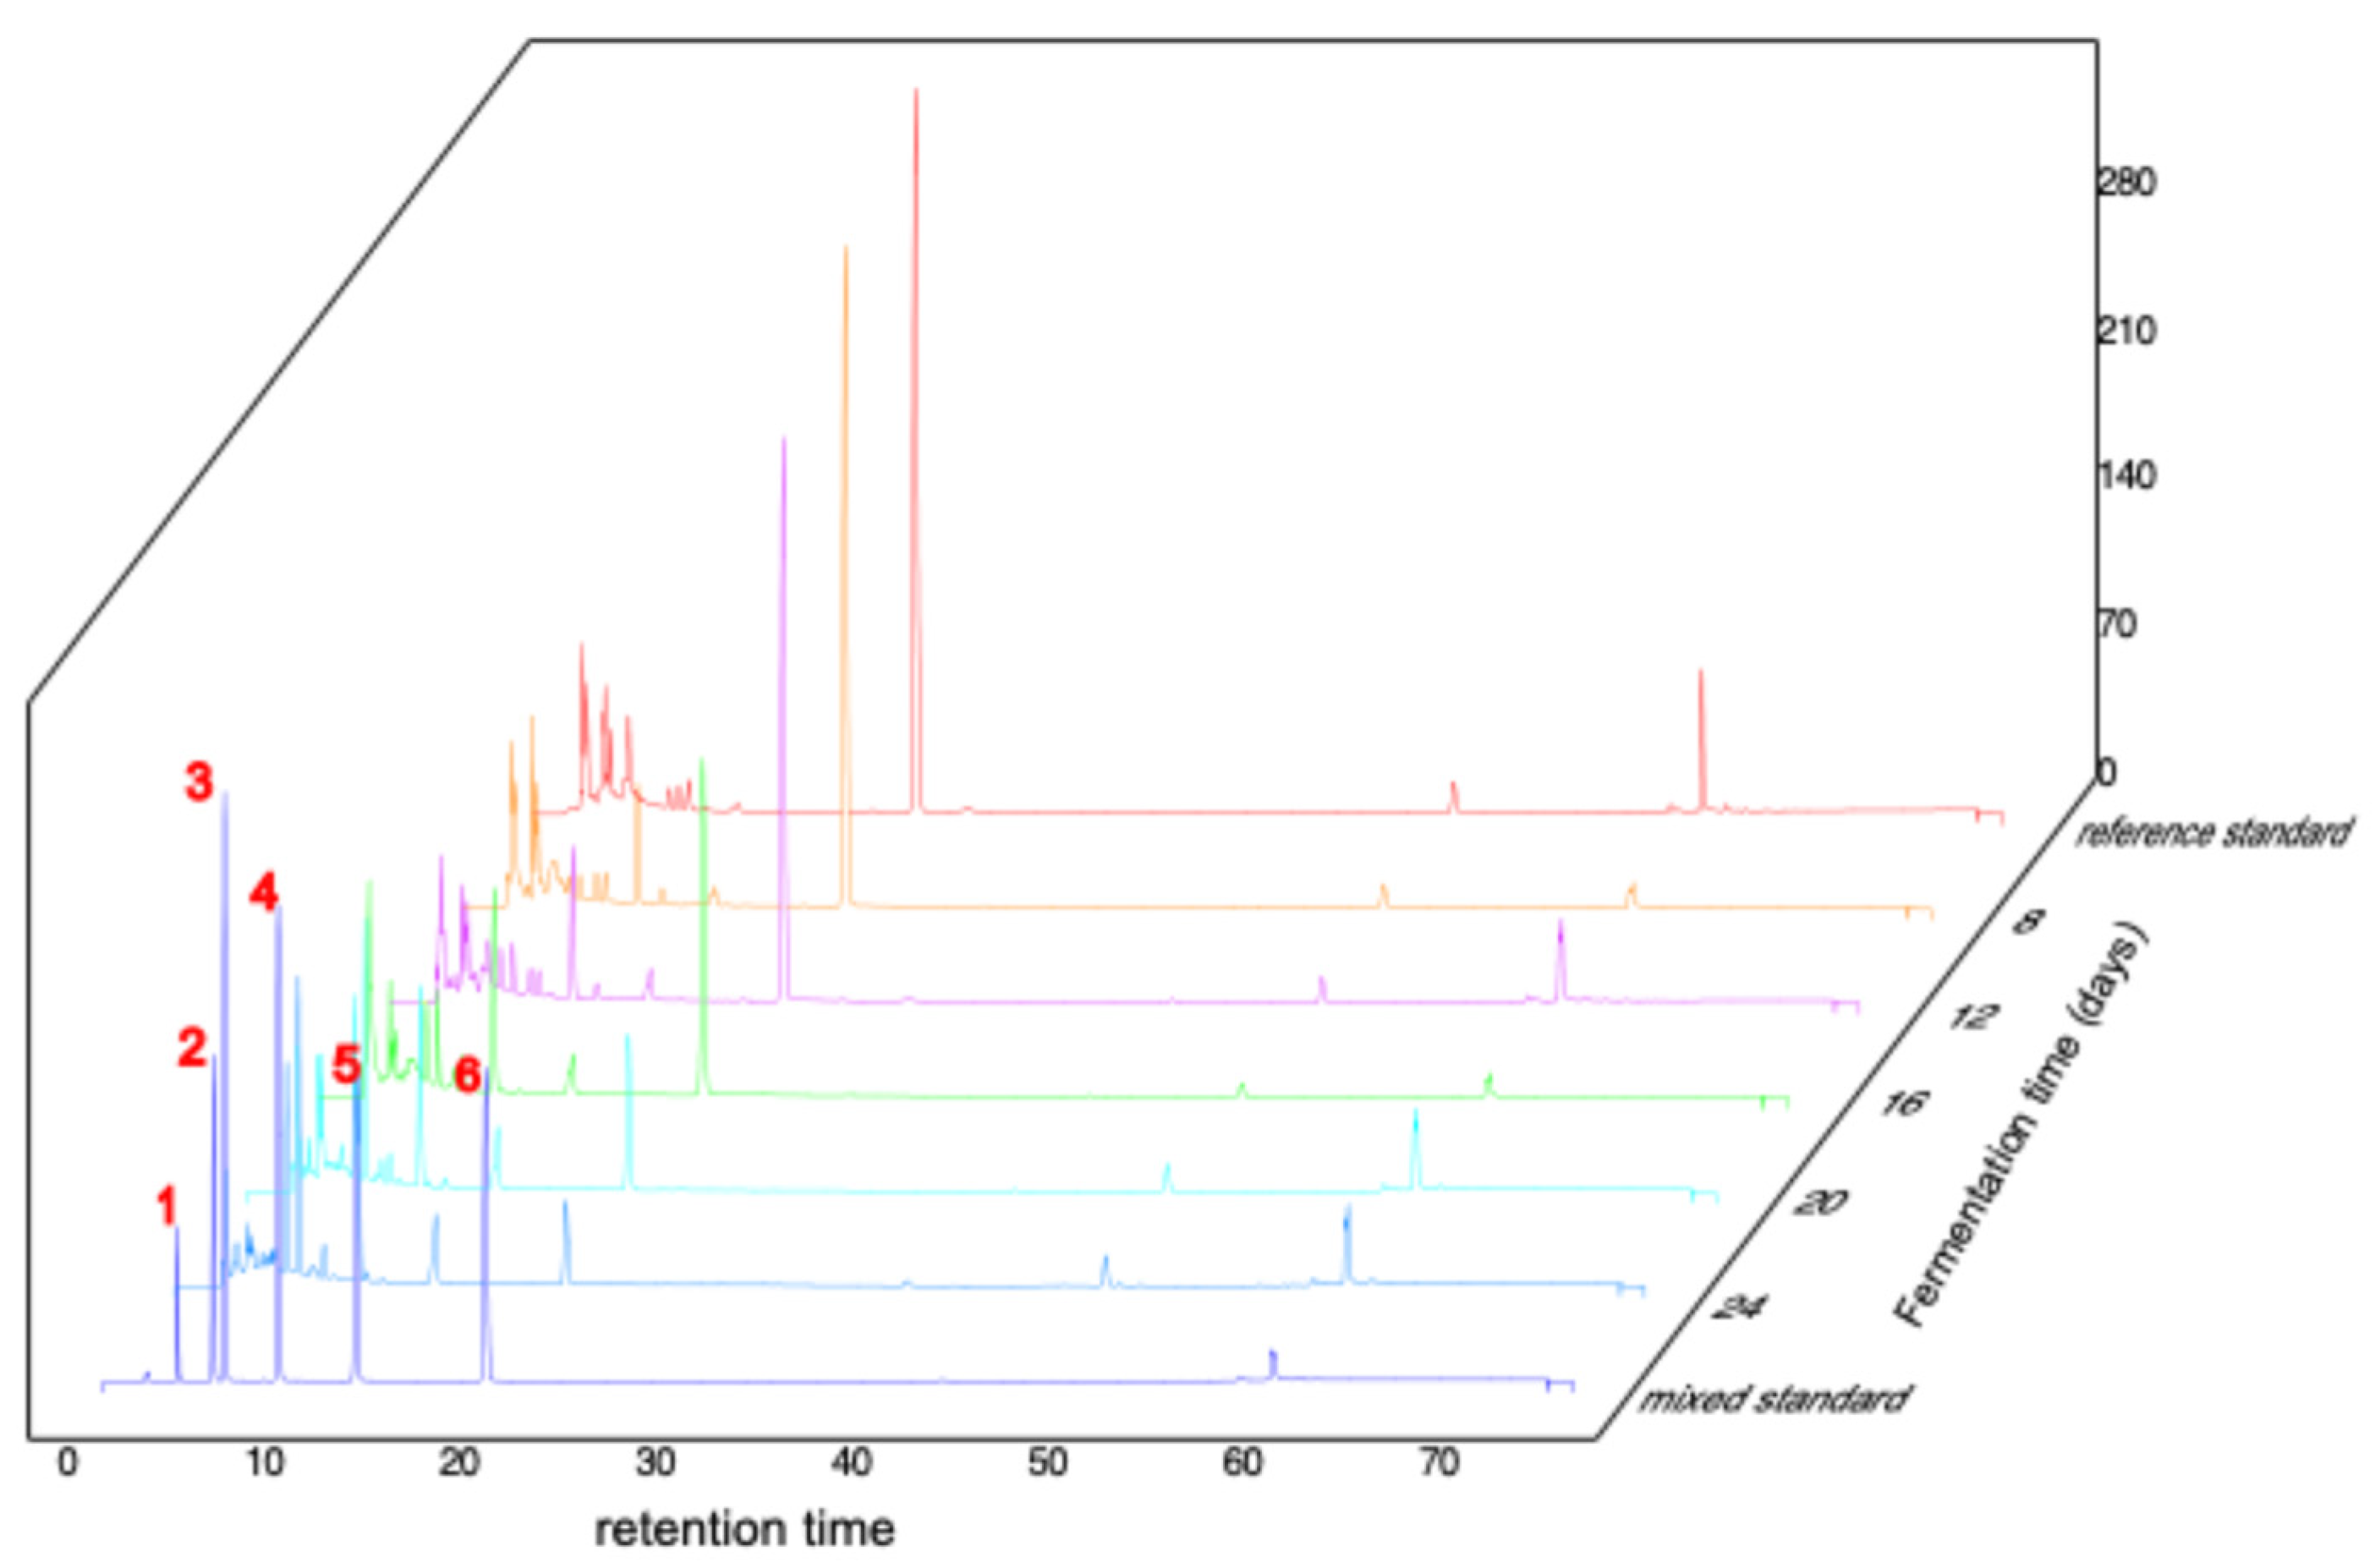
Figure 7.
D. tabescens fermentation 20 day sample UPLC-MS/MS detection of positive/negative (A/B) ion mode TIC stacking diagram.
Figure 7.
D. tabescens fermentation 20 day sample UPLC-MS/MS detection of positive/negative (A/B) ion mode TIC stacking diagram.
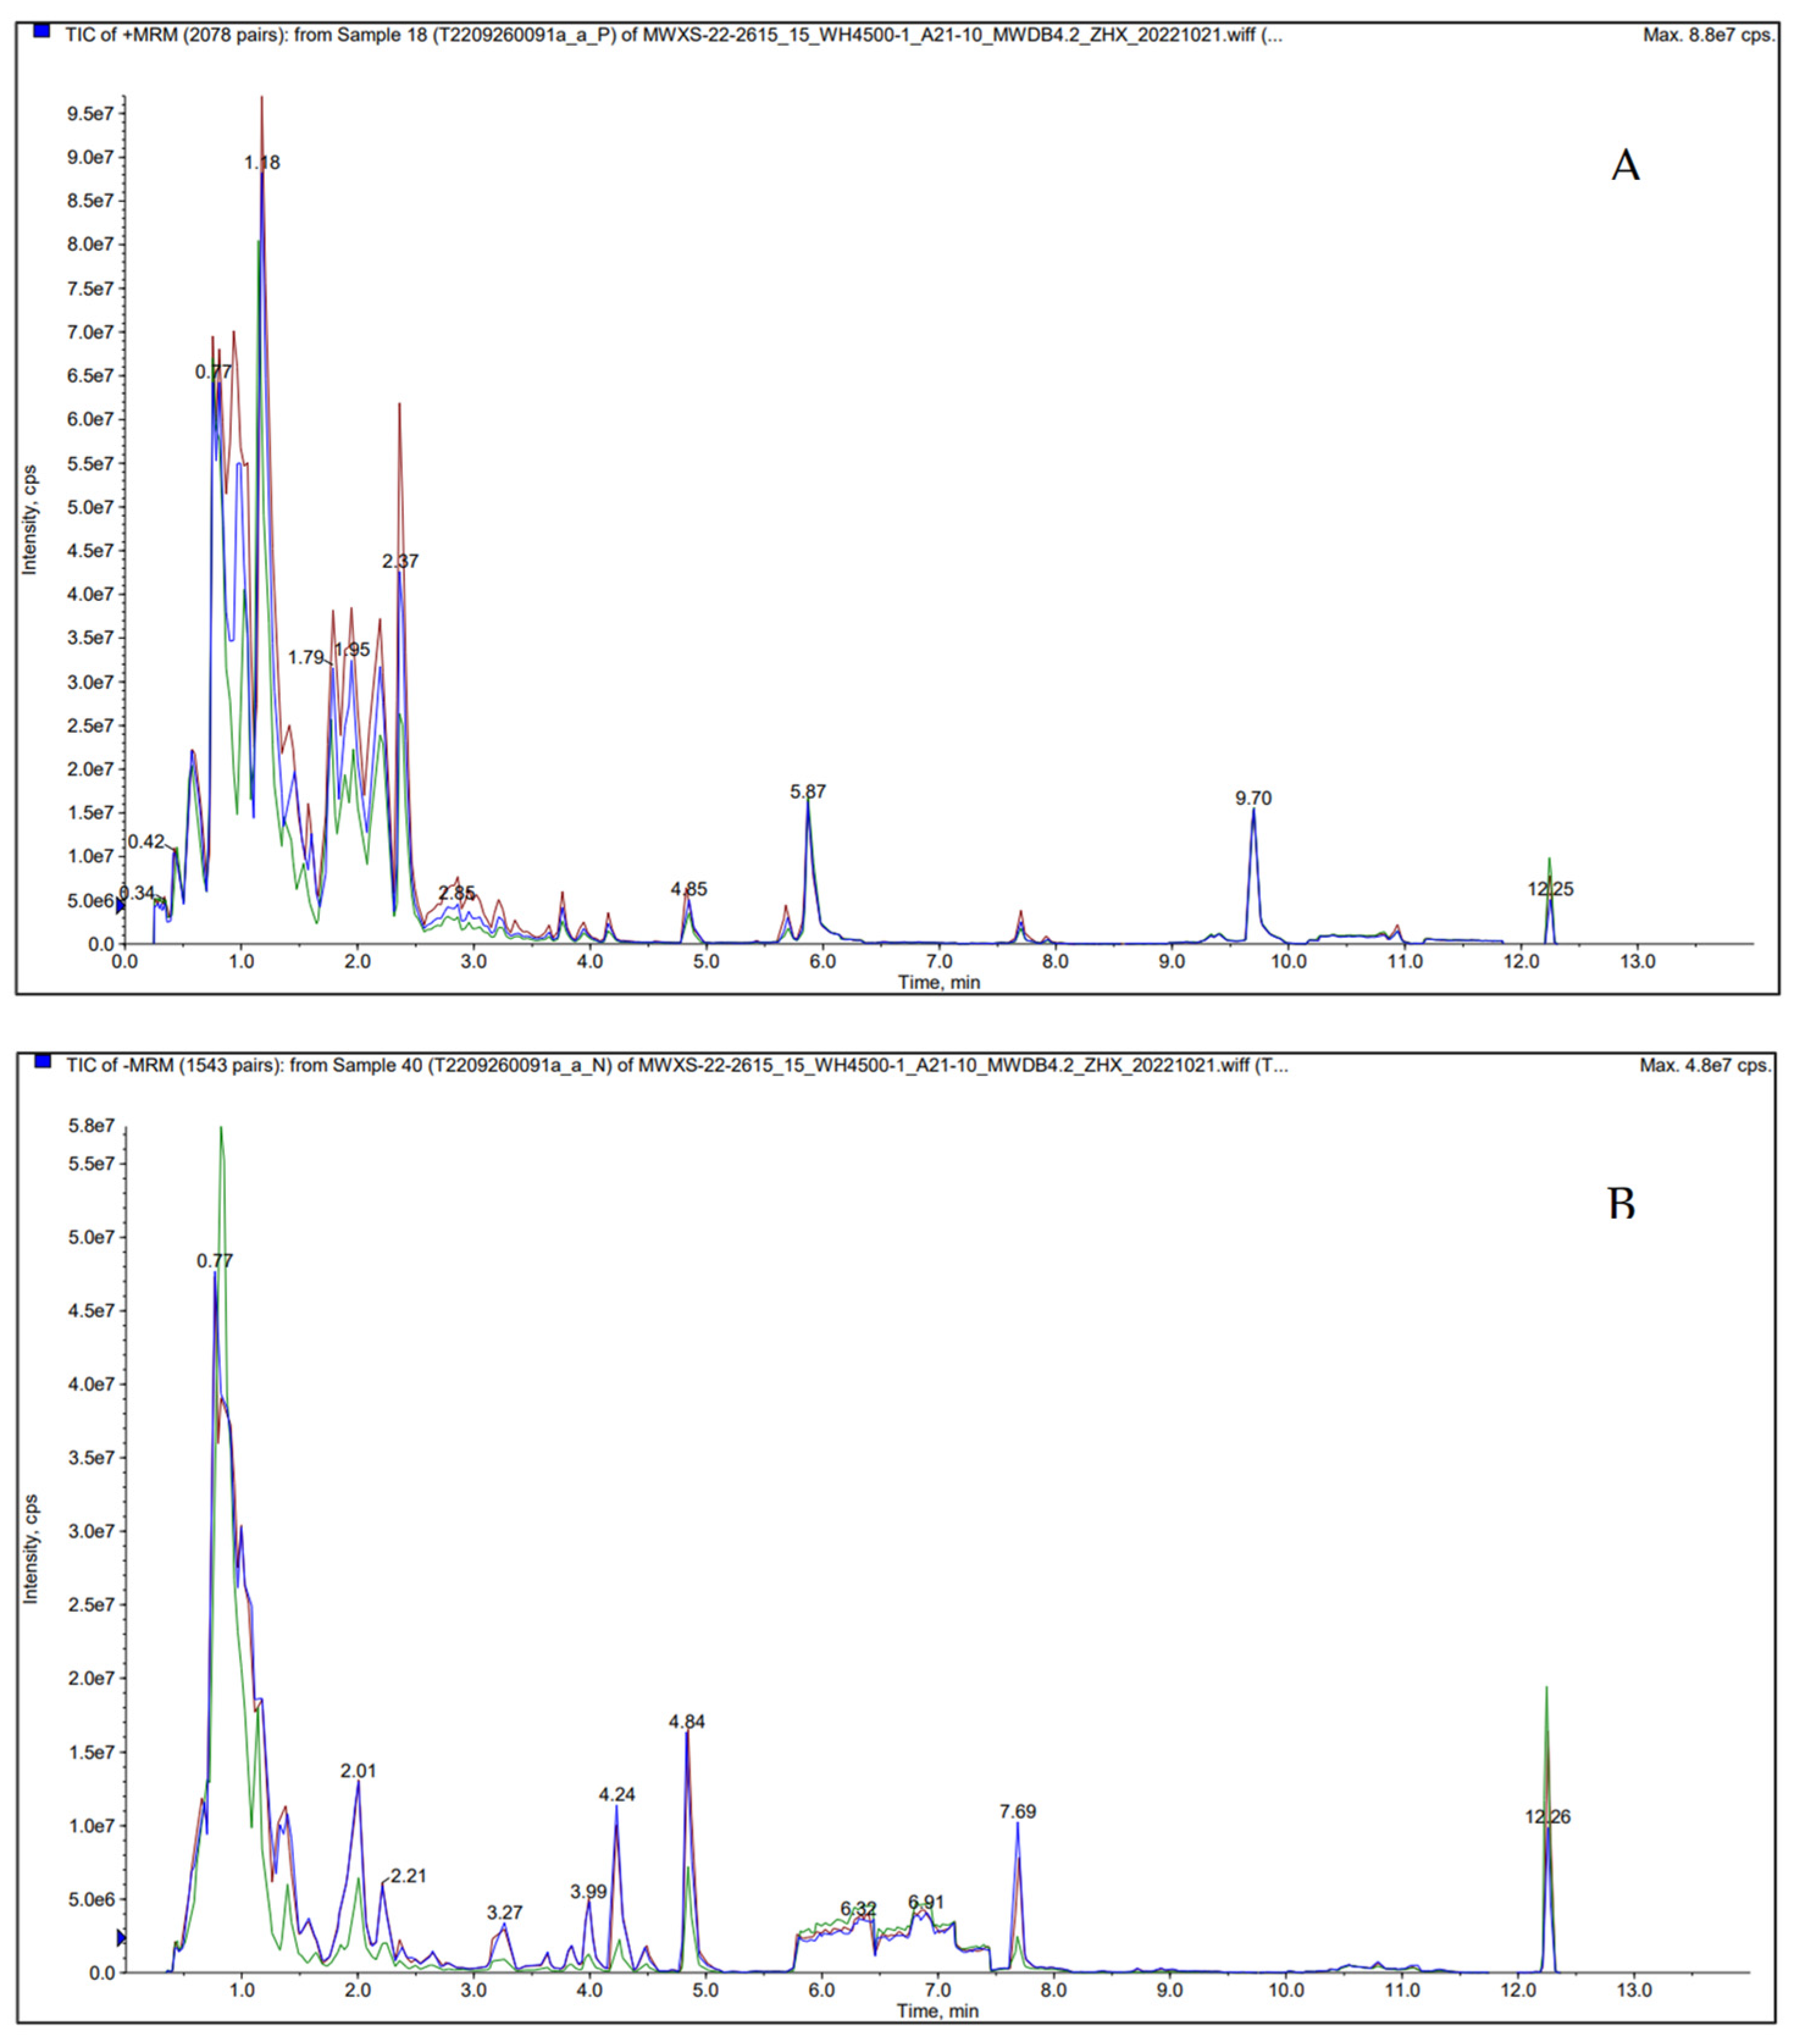
Figure 8.
A. Bar chart of DEG counts B. Venn Diagram of DEG Counts.
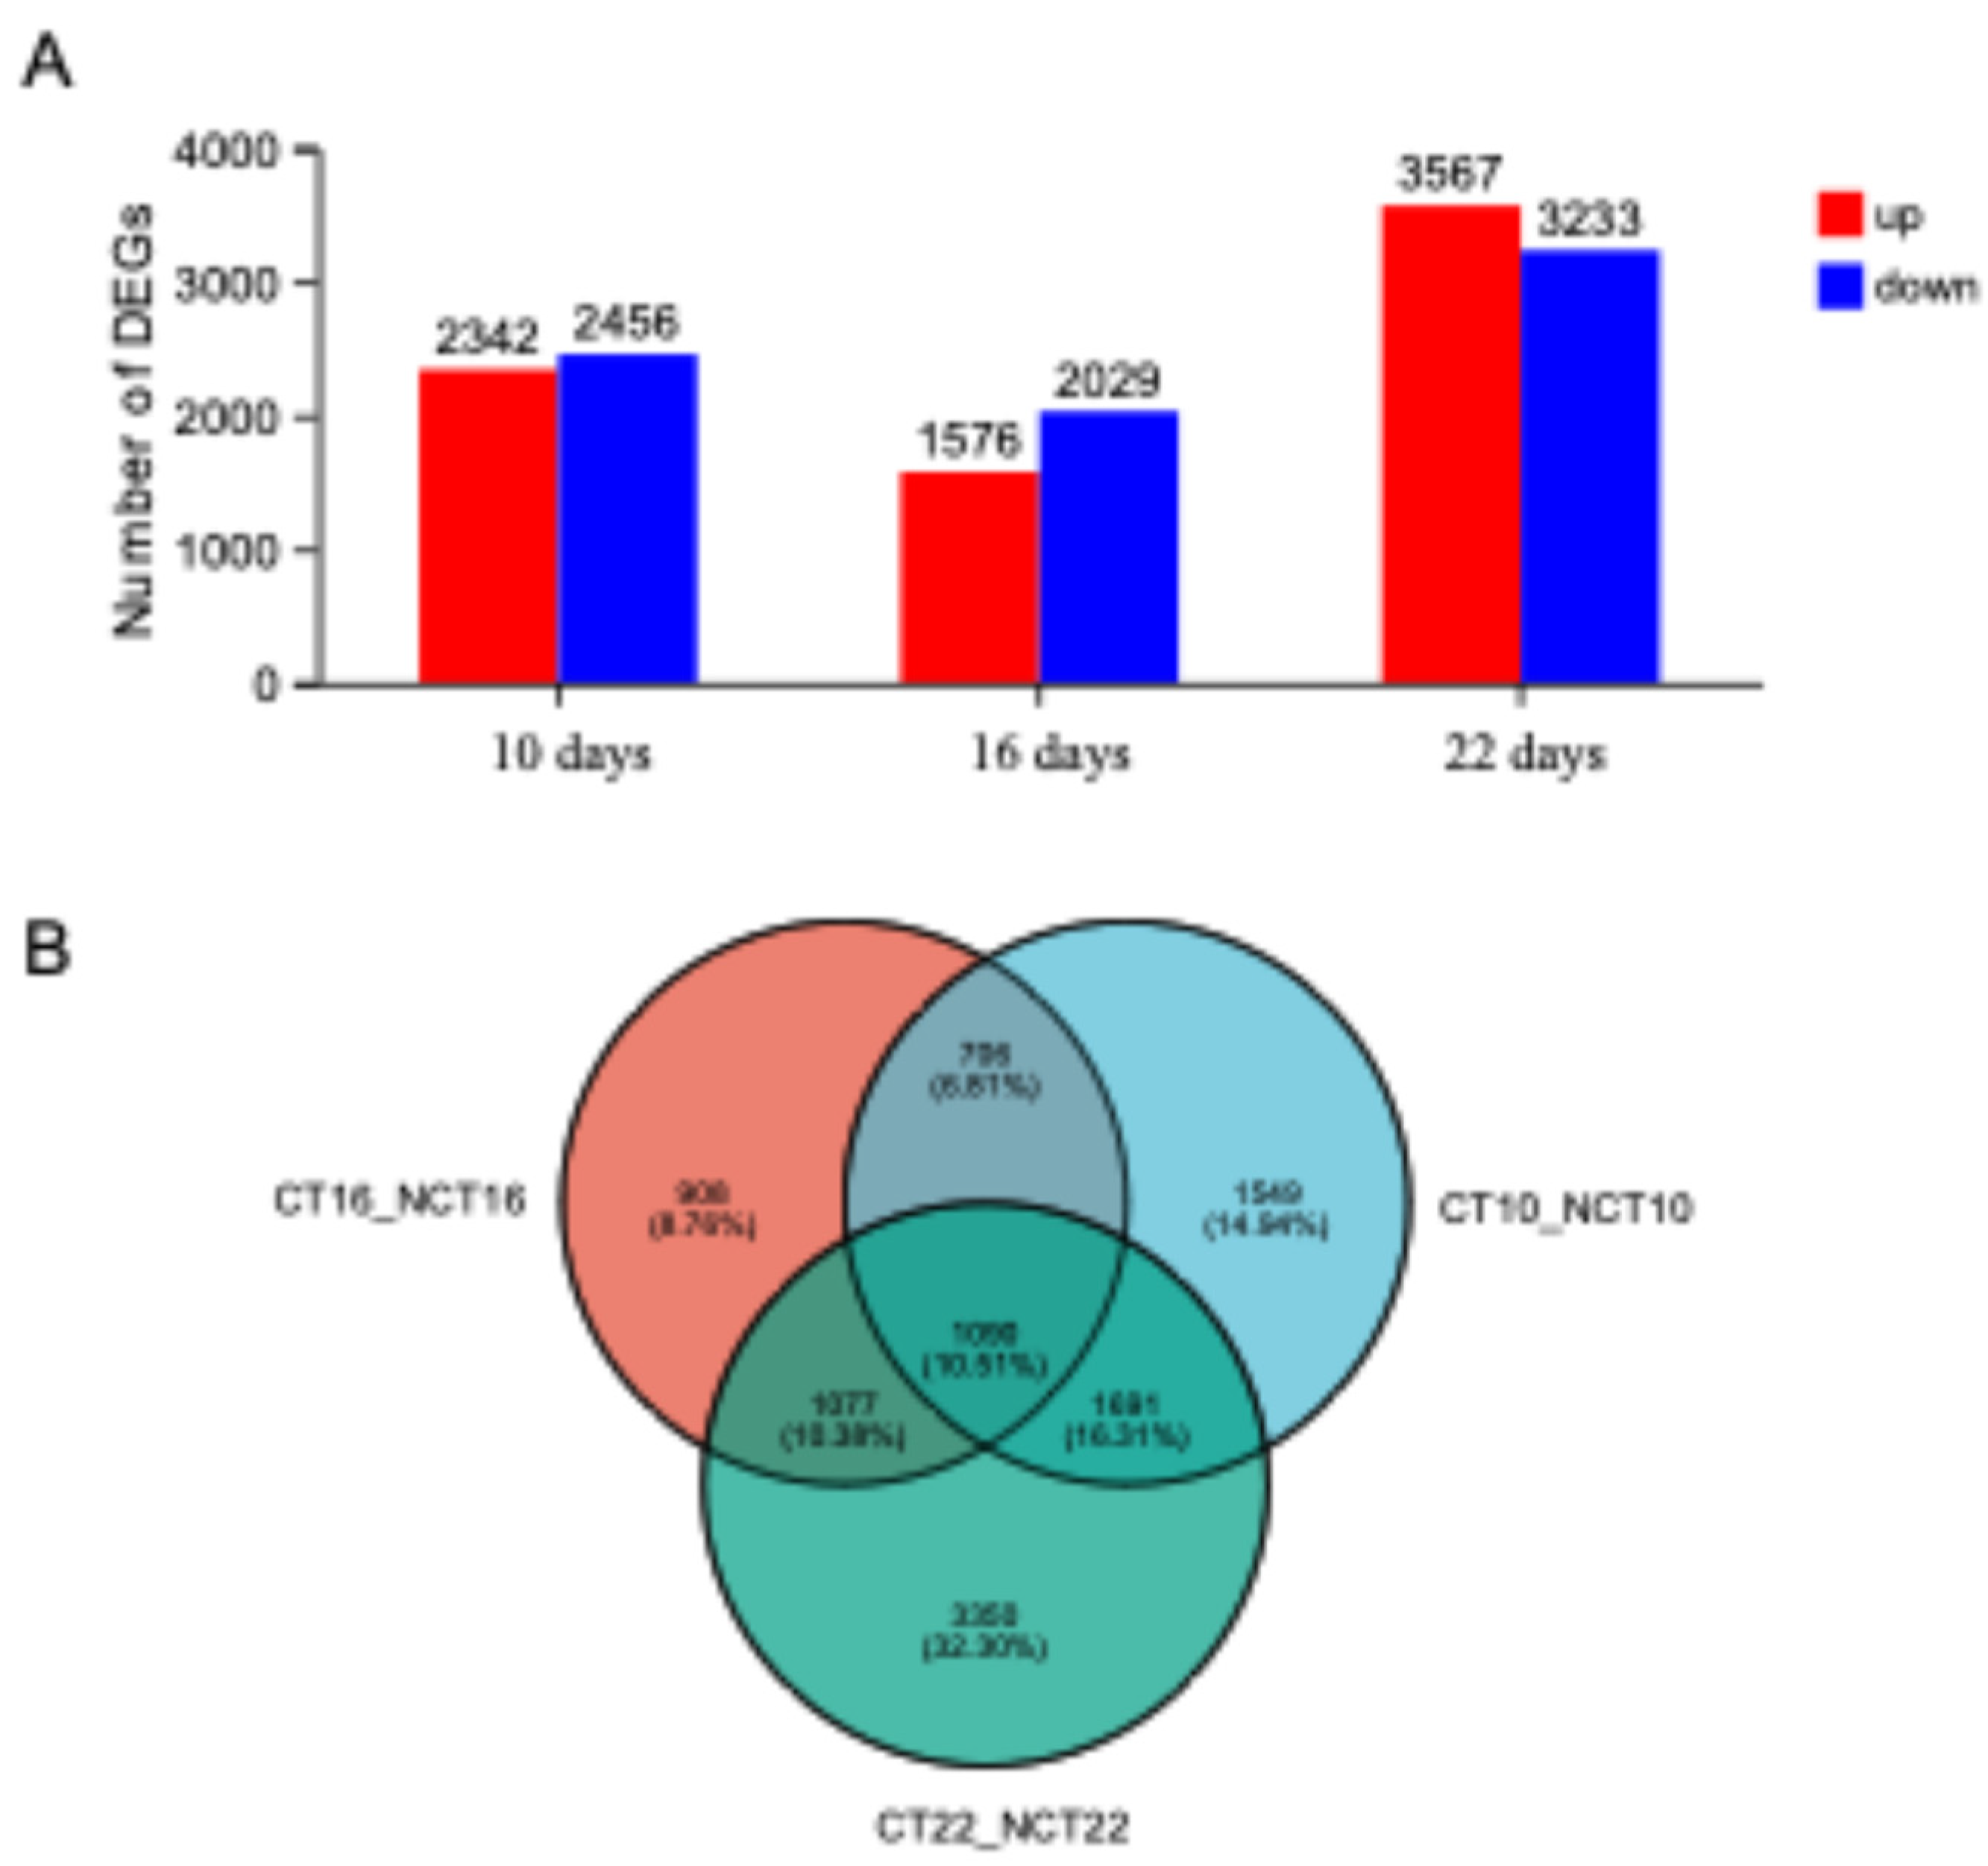
Figure 9.
GO classification of DEGs. The x-axis indicates the number of DEGs, and the y-axis indicates the specific GO term.
Figure 9.
GO classification of DEGs. The x-axis indicates the number of DEGs, and the y-axis indicates the specific GO term.
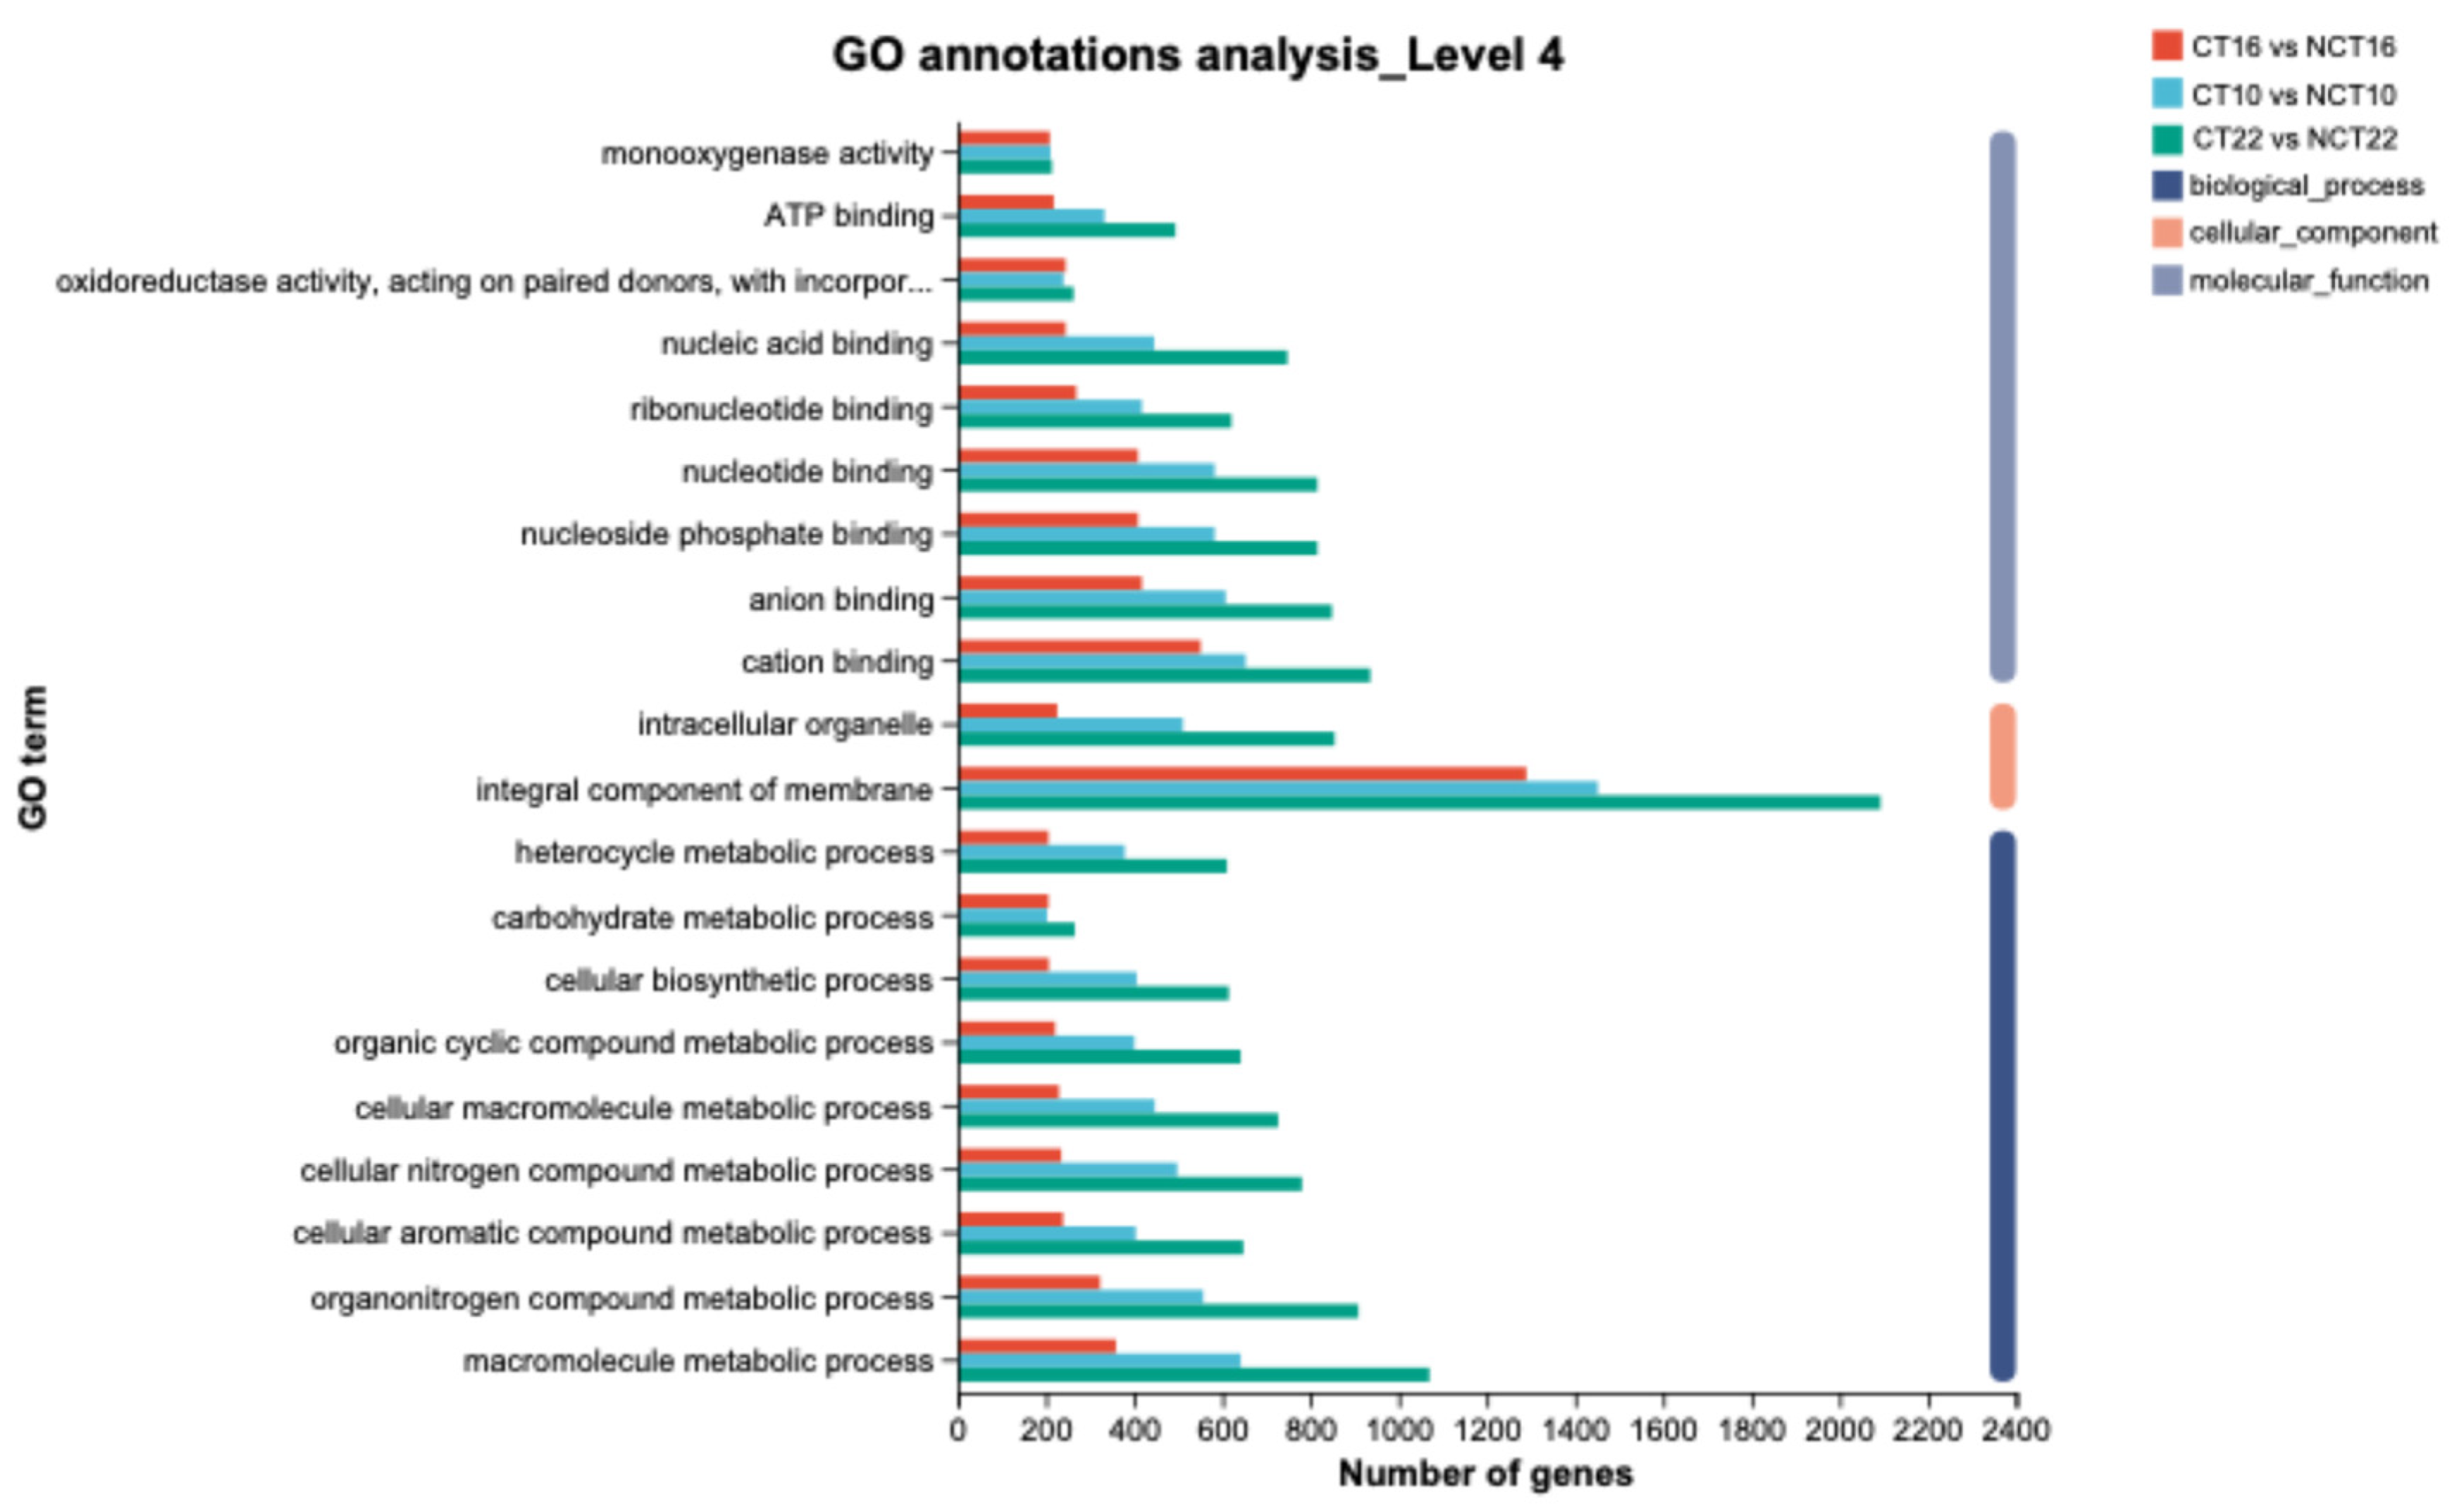
Figure 10.
KEGG enrichment analyses of DEGs. The x-axis represents the most enriched pathways; the y-axis represents the number of DEGs.
Figure 10.
KEGG enrichment analyses of DEGs. The x-axis represents the most enriched pathways; the y-axis represents the number of DEGs.
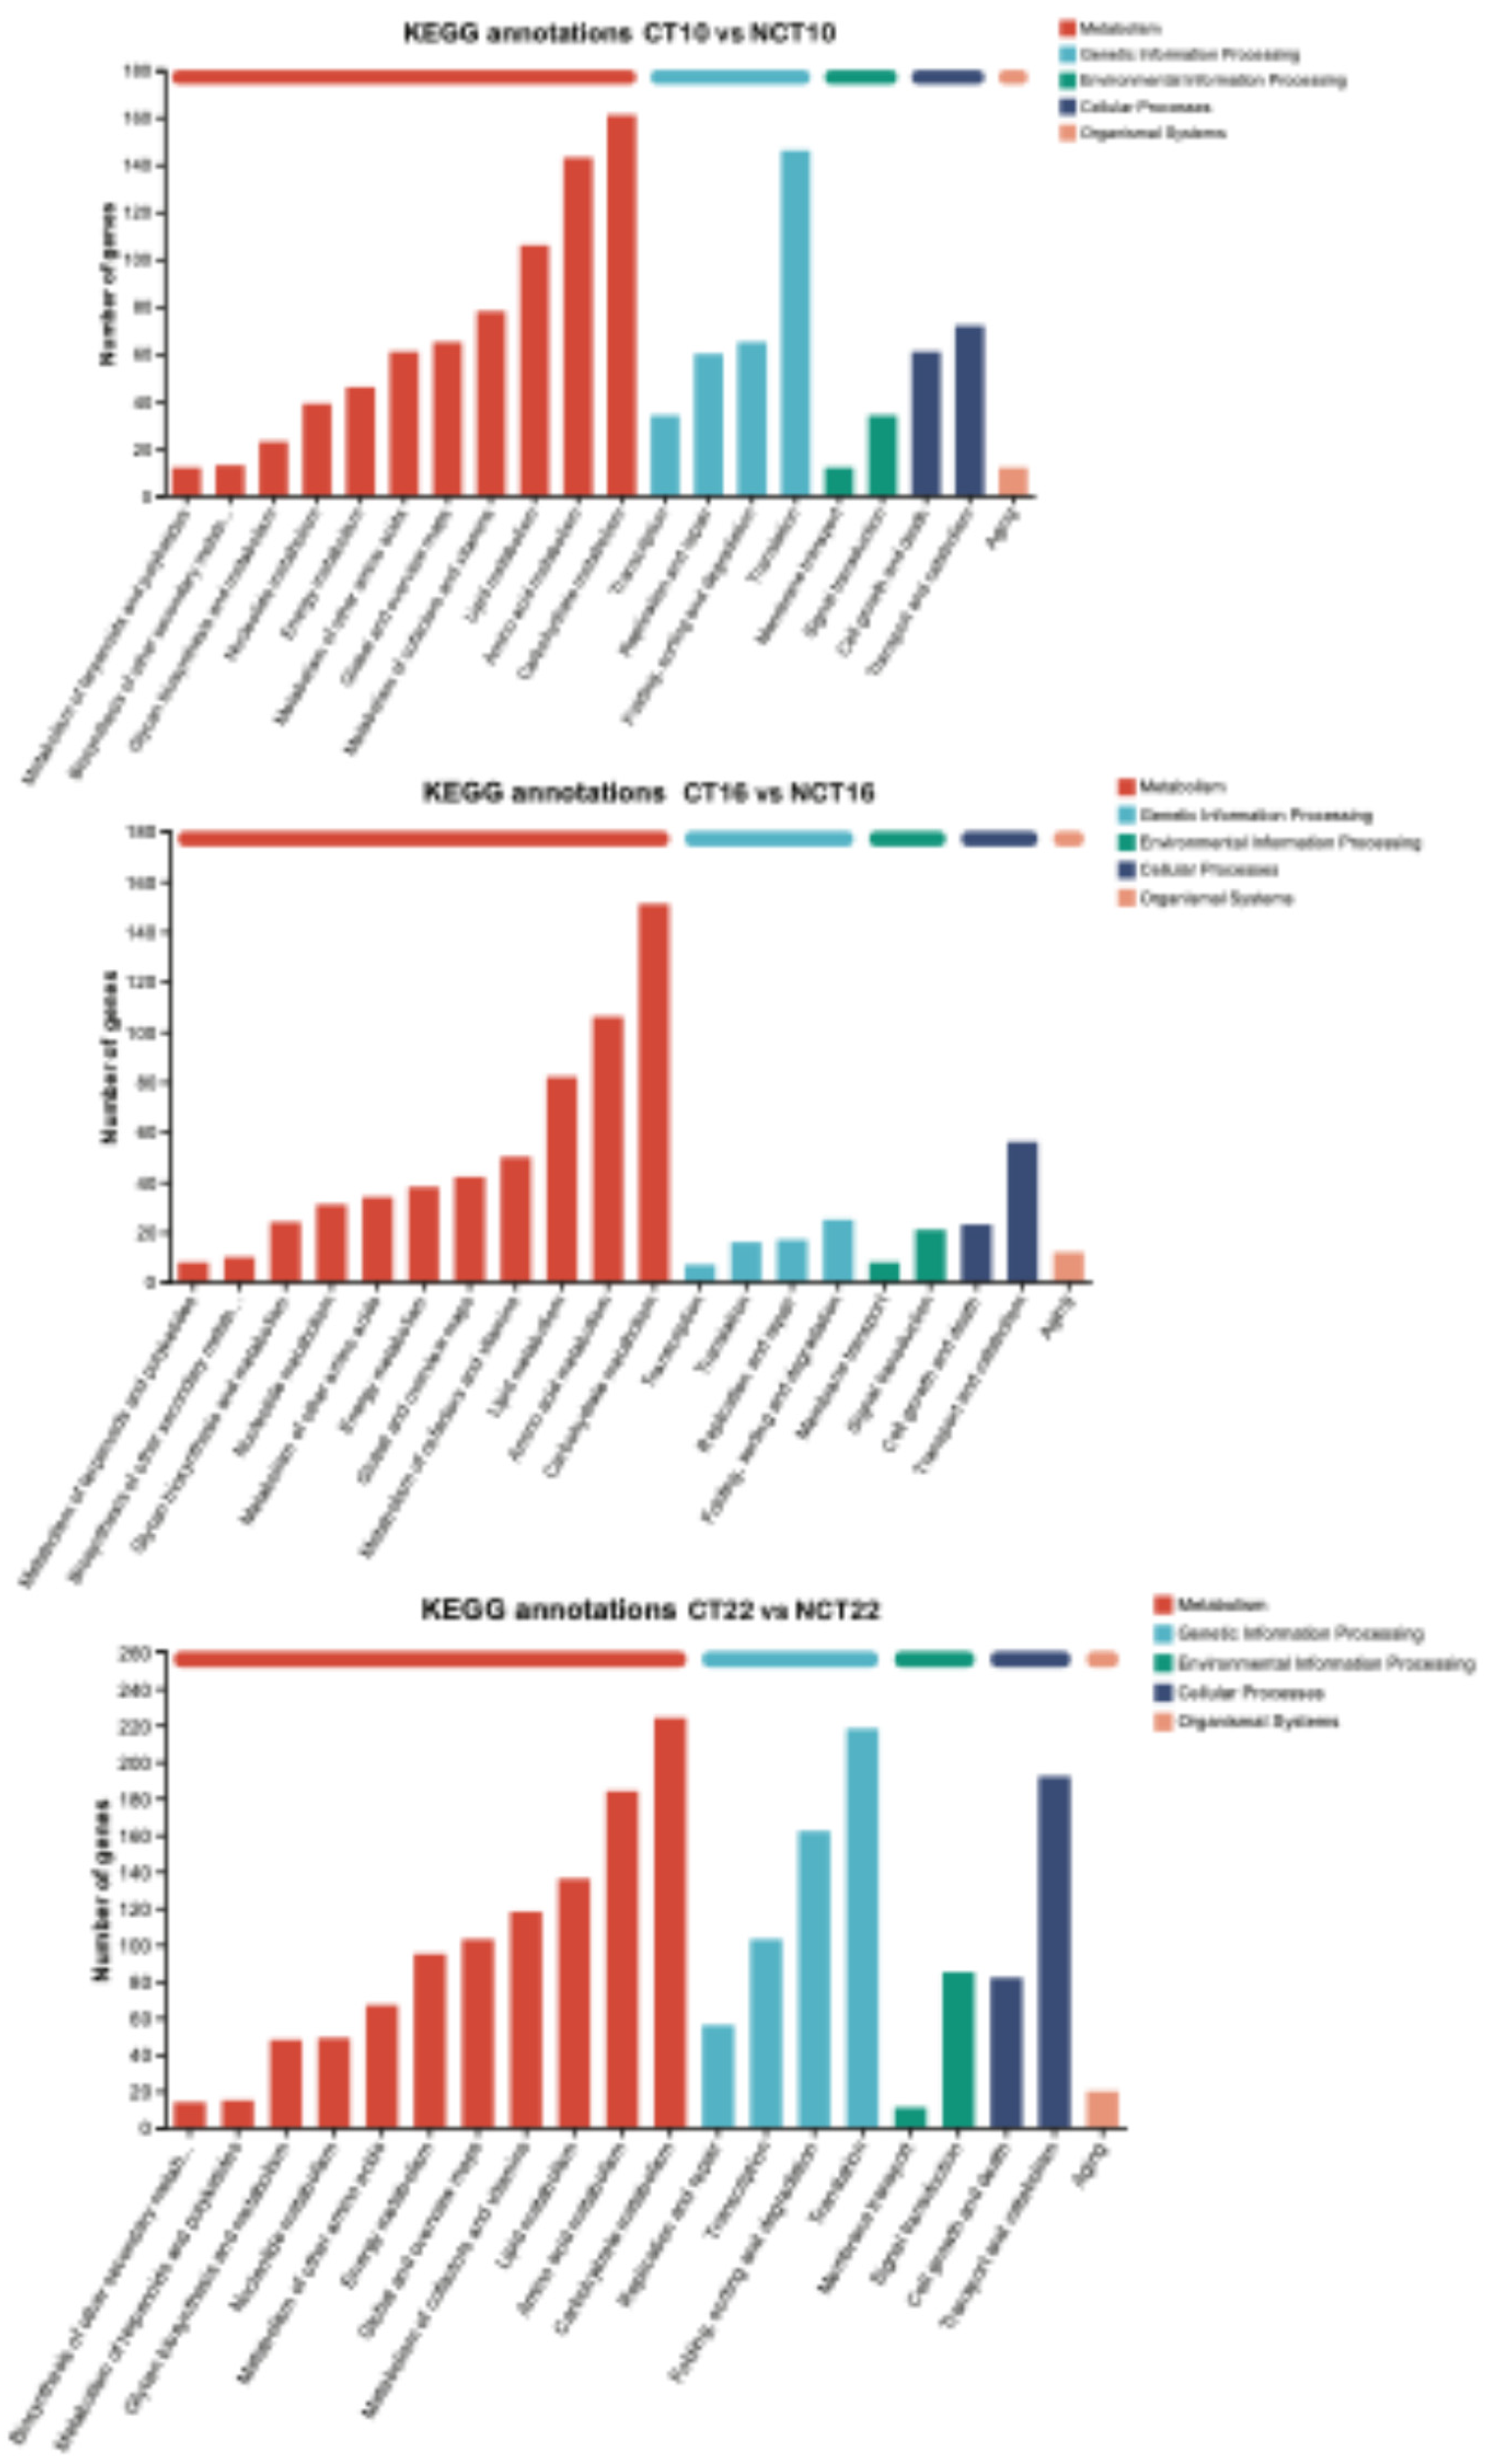
Figure 11.
A. Trend analysis chart of DEGs B. GO enrichment analyses of Profile0. C. GO enrichment analyses of Profile2. D GO enrichment analyses of Profile4. Note: Each profile is represented by a rectangle, with the profile number (starting from 0) in the top-left corner. The line inside the rectangle represents the expression trend over time, and the P-value indicating significance is displayed in the bottom-left corner. Colored Trend Profiles: These indicate that the temporal pattern of the profile follows a significant trend. Profiles with the same color belong to the same cluster (profiles with similar trends are grouped together). Uncolored Trend Profiles: These indicate that the temporal pattern of the profile is statistically non-significant.
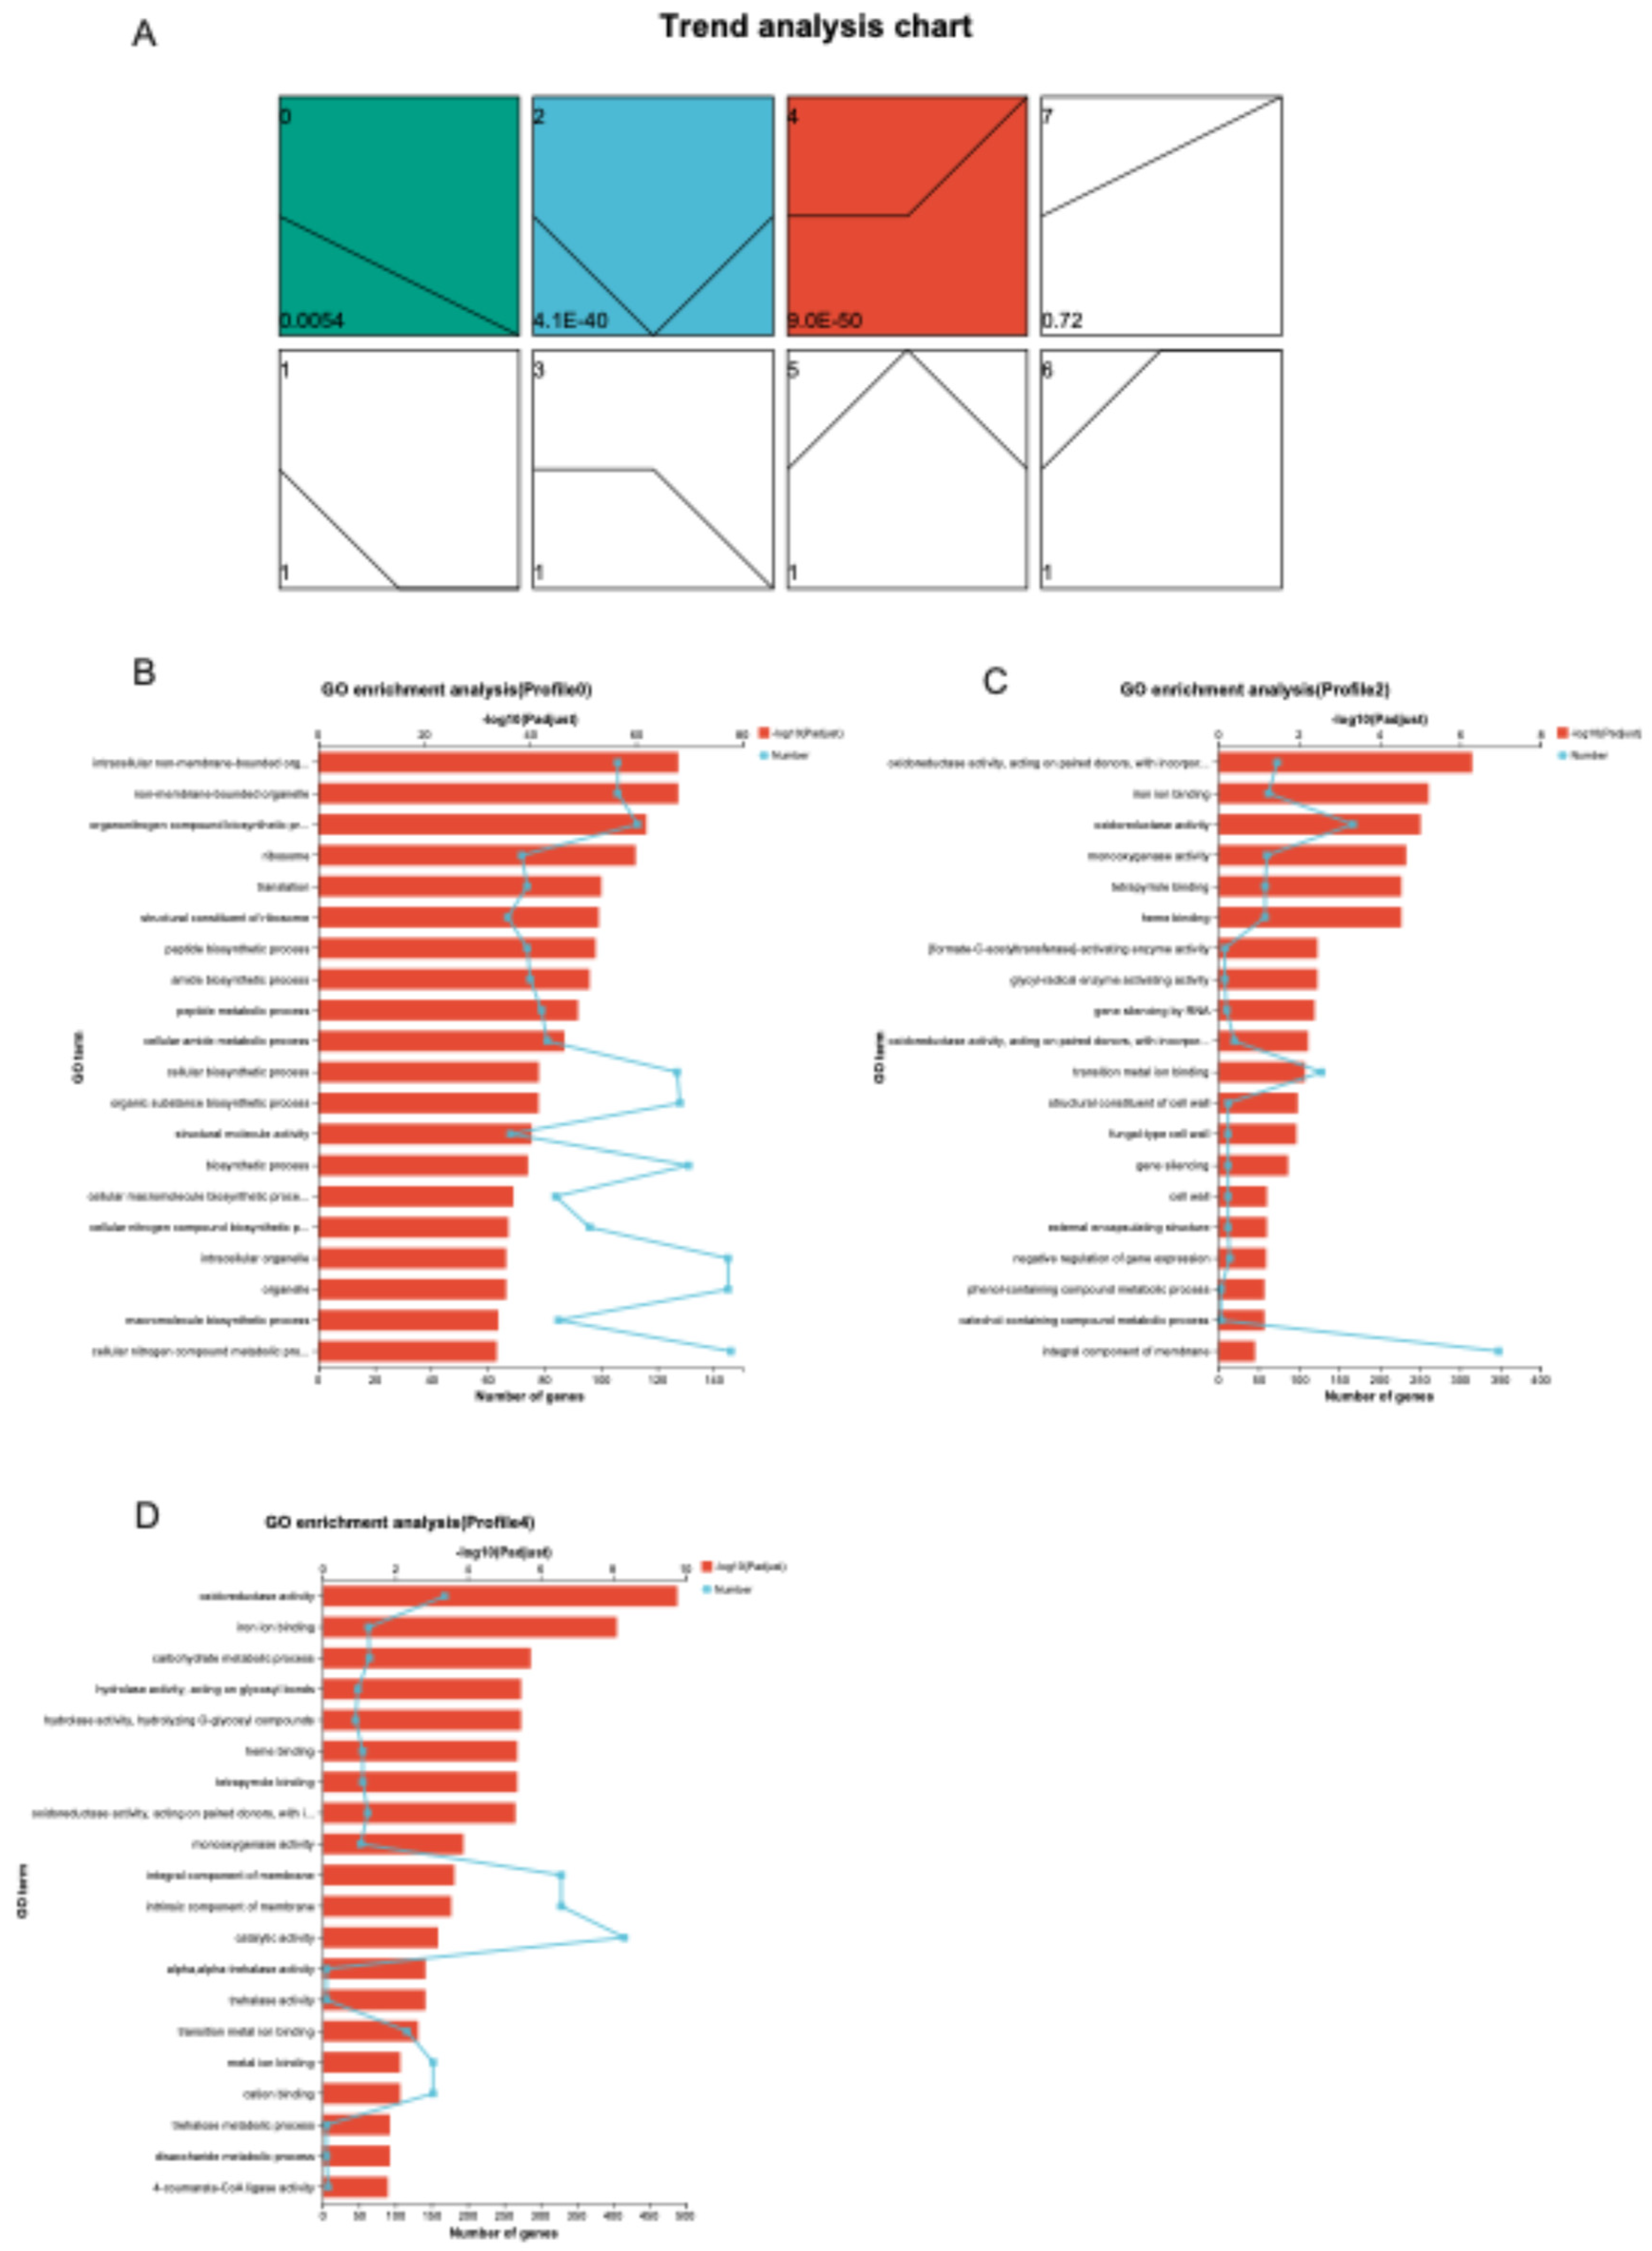
Figure 13.
Expression profile validation of 12 selected DEGs by qRT-PCR analysis. The left y-axis indicates relative expression levels quantified by qRT-PCR, with error bars representing the mean deviations of three replicates. The right y-axis depicts transcript abundance derived from DEG analysis.
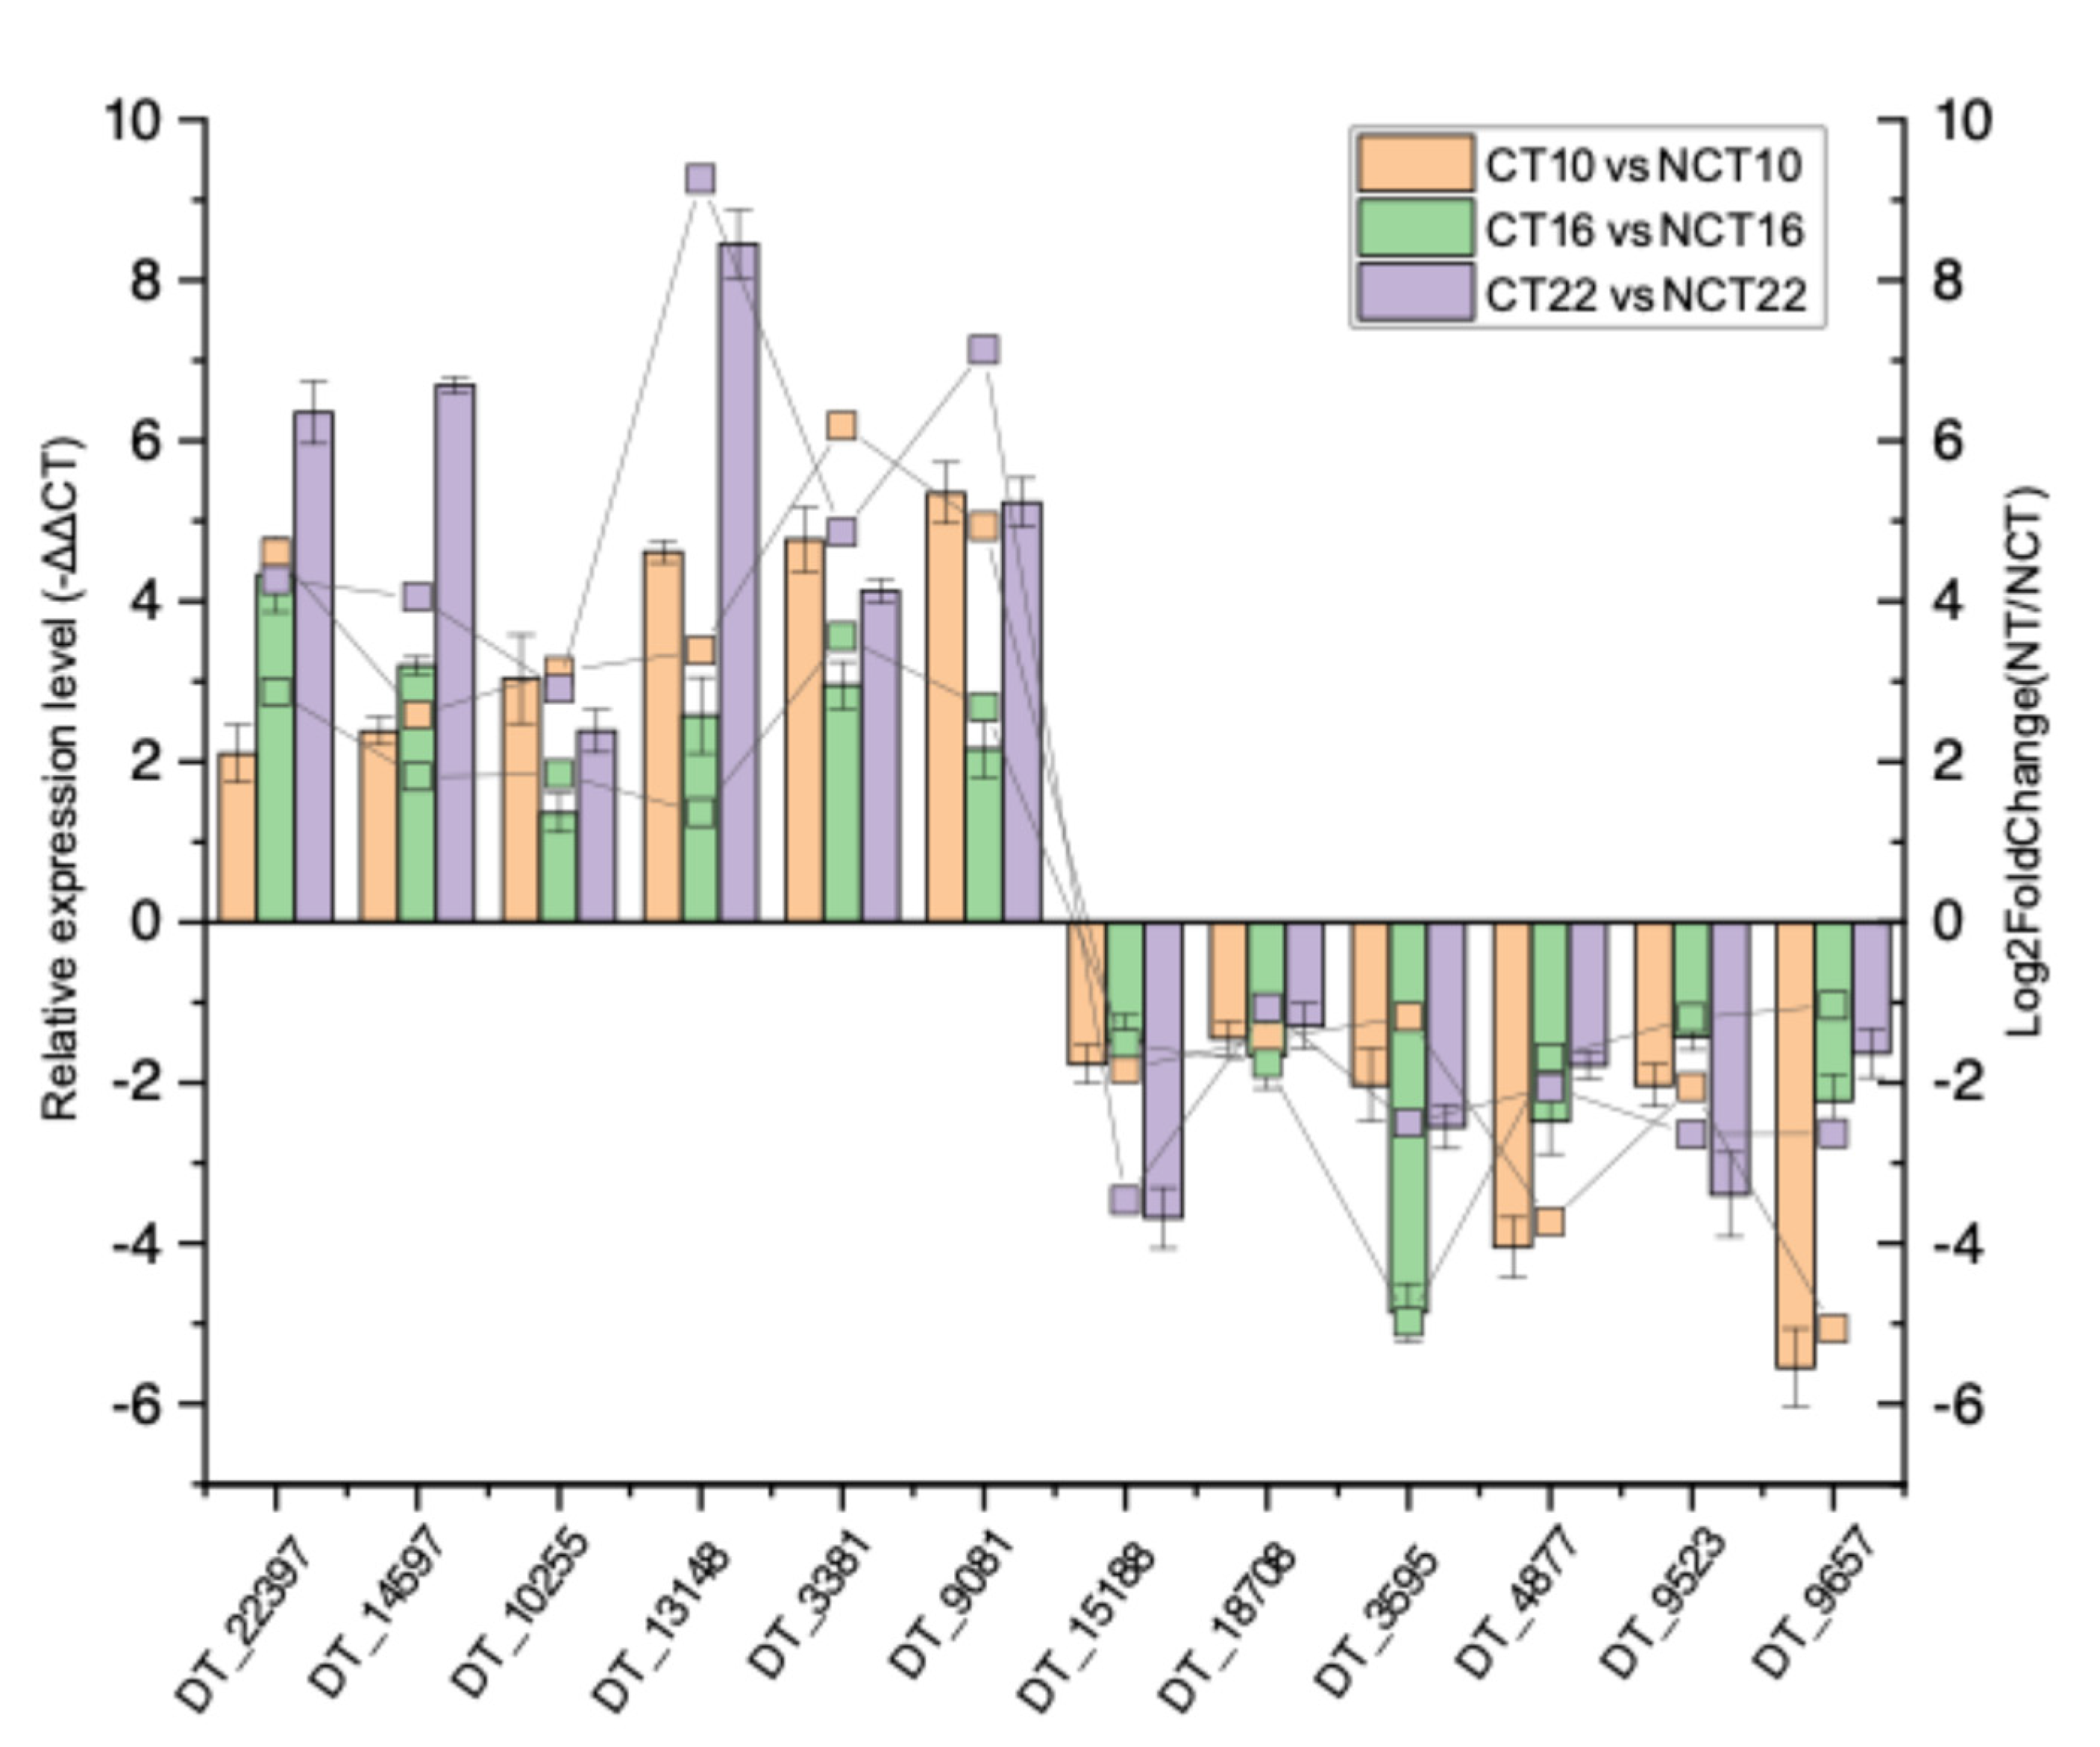
Figure 14.
A. Two metabolic pathways for caffeine degradation in D. tabescens. Red lines denote the dominant N-demethylation route, black lines the secondary N-demethylation route, and blue dashed lines the oxidation pathway. B. Caffeine metabolic pathway map in KEGG. Red markers indicate genes or enzymes associated with the N-demethylation pathway, while green markers indicate those linked to the oxidation pathway.
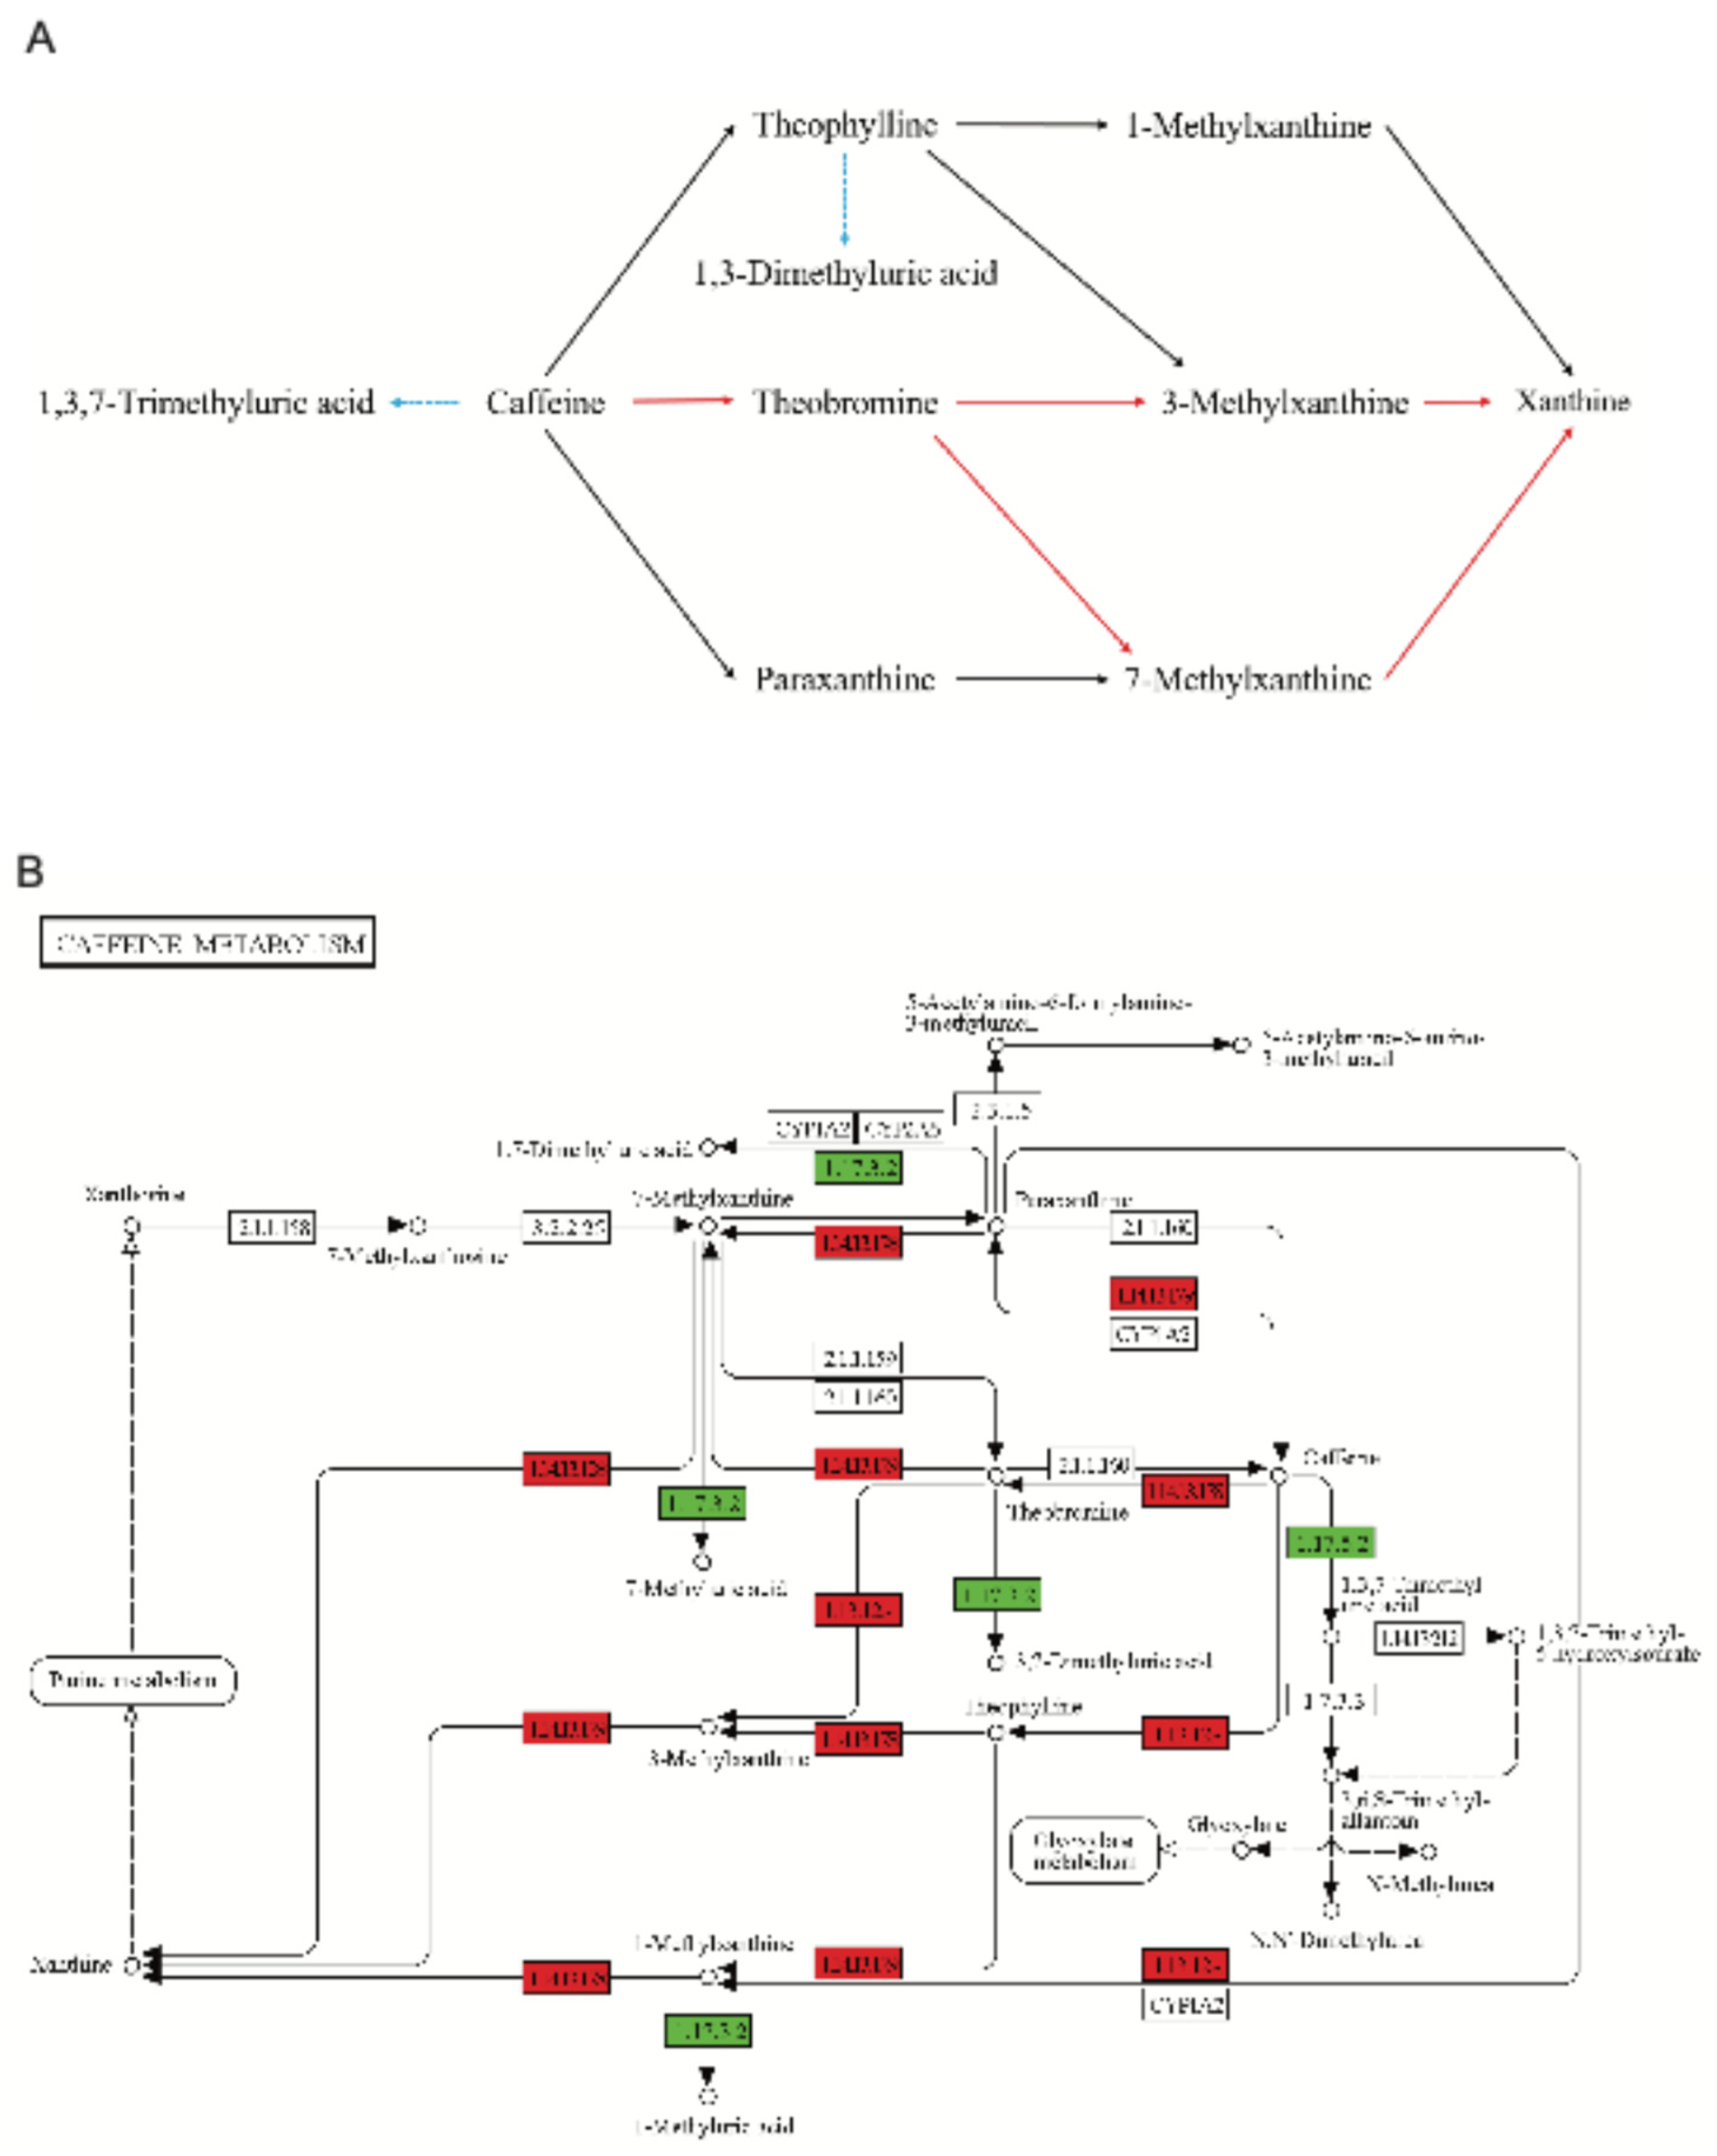

Table 1.
HPLC mobile phase gradient elution ratio.
| Time | A% | B% | Flow Velocity (mL/min) |
|---|---|---|---|
| 0.00 | 95 | 5 | 1.00 |
| 15.00 | 90 | 10 | 1.00 |
| 40.00 | 80 | 20 | 1.00 |
| 50.00 | 65 | 35 | 1.00 |
| 55.00 | 15 | 85 | 1.00 |
| 65.00 | 5 | 95 | 1.00 |
| 70.00 | 5 | 95 | 1.00 |
A: Ultrapure water (containing 0.1% phosphoric acid), B: Acetonitrile.
Table 2.
UPLC mobile phase gradient elution ratio.
| Time | A% | B% | Flow Velocity (mL/min) |
|---|---|---|---|
| 0.00 | 95 | 5 | 0.35 |
| 9.00 | 5 | 95 | 0.35 |
| 10.00 | 5 | 95 | 0.35 |
| 11.00 | 95 | 5 | 0.35 |
| 14.00 | 95 | 5 | 0.35 |
A: Ultrapure water (containing 0.1% formic acid), B: Acetonitrile (containing 0.1% formic acid). Mass Spectrometry Conditions: Nitrogen served as the collision gas. Ion spray voltages were 5500 V in positive mode and −4500 V in negative mode. Nebulizer gas pressure (GS1), auxiliary gas pressure (GS2), and curtain gas pressure (CUR) were maintained at 50 psi, 60 psi, and 25 psi, respectively.
Table 3.
Sequence list of primers for qPCR analysis of differentially expressed genes in D. tabescens.
Table 3.
Sequence list of primers for qPCR analysis of differentially expressed genes in D. tabescens.
| Primer | Sequence (5′-3′) | Product Size (bp) |
|---|---|---|
| β_tub for | CTGGTTTCGCACCTTTGA | 241 bp |
| β_tub rev | TTGTTGGGAATCCACTCG | |
| DT_22397-F | TTGCGTTTCTTATTGCGGGATCAG | 75 bp |
| DT_22397-R | GCGTGCGTGCCAGGTAGTAG | |
| DT_14597-F | ATAGTGCGGCTGTGGCGAAG | 148 bp |
| DT_14597-R | GCTTCATCAGGATTCTCCAACACG | |
| DT_10255-F | GAATTGAAGGATGGAGTGGCAGAC | 138 bp |
| DT_10255-R | TAGAGGCAGGAAGGCGAAGTTG | |
| DT_13148-F | ACGGTTTCACACTCTCGCTTAATG | 132 bp |
| DT_13148-R | GCACATCAGATTCCACAGAGACATC | |
| DT_3381-F | CCGCATGTACGCAGTTATGTCAG | 119 bp |
| DT_3381-R | AGCCTTCCATCACGACCTGTC | |
| DT_9081-F | GGCGTCCTCTTCTCCGATAACC | 125 bp |
| DT_9081-R | GTGACATTGAGCGAAGCGAAGG | |
| DT_15188-F | ATGGTCTGGCGGGTCAAAGG | 101 bp |
| DT_15188_R | GCAAGTGTGGCGGATCGTAAC | |
| DT_18708-F | TTTCCCTTGCCTGCCTCCTC | 114 bp |
| DT_18708-R | GTCGTCGGTTCATCGCTTGG | |
| DT_3595-F | GCTTGTGCGGCTTACCTTCTAC | 86 bp |
| DT_3595-R | ATCCCTGTGACATGACCCTTGG | |
| DT_4877-F | GCTCTCAGTACCCGCCCTTTG | 87 bp |
| DT_4877-R | CGATCCGCCAGTCCGTTCTC | |
| DT_9523-F | GCAAGACCAACAGGATGGATACG | 116 bp |
| DT_9523-R | GCGGCGAAGCGAAGACATAG | |
| DT_9657-F | TGGCAACAACAGCAAGCAGAAG | 124 bp |
| DT_9657-R | GTGACCATCCGCTATACCTCCTAC |
Table 4.
Statistics on the results of UPLC-MS/MS assays related to caffeine metabolism.
| Compounds | Relative Content | ||
|---|---|---|---|
| LF-1 | LF-2 | LF-3 | |
| Xanthosine | 3061085.97 | 3308773.83 | 1728570.43 |
| 1,7-Dimethylxanthine | 1149491.50 | 1491768.33 | 1582676.97 |
| 7-Methylxanthine | 25714920.16 | 27103545.14 | 28155343.82 |
| Caffeine | 444244.67 | 588329.20 | 595120.38 |
| Theobromine | 432153.50 | 632932.68 | 715049.52 |
| 1,3,7-Trimethyluric acid | 22816.60 | 31955.41 | 41885.54 |
| Theophylline | 1032014.26 | 1025524.47 | 550688.88 |
| 3-Methylxanthine | 1707194.76 | 2194741.14 | 2747530.71 |
| 1-Methylxanthine | 14255941.68 | 17777575.01 | 17462626.23 |
| Xanthine | 13933801.87 | 12351831.46 | 9415550.65 |
| 1,3-Dimethyluric acid | 690080.00 | 709655.94 | 333344.06 |
Table 5.
Statistical table of CYPs genes that were transcriptionally upregulated at all three time points.
Table 5.
Statistical table of CYPs genes that were transcriptionally upregulated at all three time points.
| Gene ID | Gene Length | Log2FC (CT/ NCT) | ||
|---|---|---|---|---|
| 10 days | 16 days | 22 days | ||
| gene_670 | 2486 | 3.71 | 1.09 | 3.13 |
| gene_3381 | 1936 | 6.18 | 3.56 | 4.86 |
| gene_3390 | 2409 | 2.07 | 3.30 | 1.04 |
| gene_3396 | 2222 | 5.92 | 3.31 | 4.46 |
| gene_7614 | 2826 | 1.74 | 1.05 | 3.61 |
| gene_14597 | 543 | 2.58 | 1.81 | 4.06 |
| gene_14794 | 2459 | 1.13 | 1.05 | 1.65 |
| gene_16566 | 2547 | 2.64 | 1.64 | 4.11 |
| gene_22397 | 2154 | 4.60 | 2.89 | 4.26 |
Table 6.
Degradation Differences Between Fungi, Bacteria, and Other Degrading Fungi.
| Comparison | Bacteria (e.g., Pseudomonas putida) | Nicotine-Degrading Fungus (A. oryzae) | D. tabescens |
|---|---|---|---|
| Core Enzyme System | Fixed NdmA-E gene cluster | Differentiated P450 family | stage-specific CYP450 (further verification) |
| Metabolic Pathway | Single N-demethylation/C8 oxidation | Linear degradation pathway | Branched and intersecting network (synergy of dual pathways) |
| Energy Regulation | Continuous high-energy consumption mode | Early-stage energy upregulation | Temporal “on-demand allocation” (precise regulation) |
| Environmental Adaptation | Dependence on external nutrients | GSTs-mediated detoxification + involvement of transporters | Secondary metabolic cluster-mediated defense + ecological competition |
Disclaimer/Publisher’s Note: The statements, opinions and data contained in all publications are solely those of the individual author(s) and contributor(s) and not of MDPI and/or the editor(s). MDPI and/or the editor(s) disclaim responsibility for any injury to people or property resulting from any ideas, methods, instructions or products referred to in the content. |
© 2025 by the authors. Licensee MDPI, Basel, Switzerland. This article is an open access article distributed under the terms and conditions of the Creative Commons Attribution (CC BY) license (http://creativecommons.org/licenses/by/4.0/).
Copyright: This open access article is published under a Creative Commons CC BY 4.0 license, which permit the free download, distribution, and reuse, provided that the author and preprint are cited in any reuse.


