Submitted:
15 October 2025
Posted:
16 October 2025
You are already at the latest version
Abstract
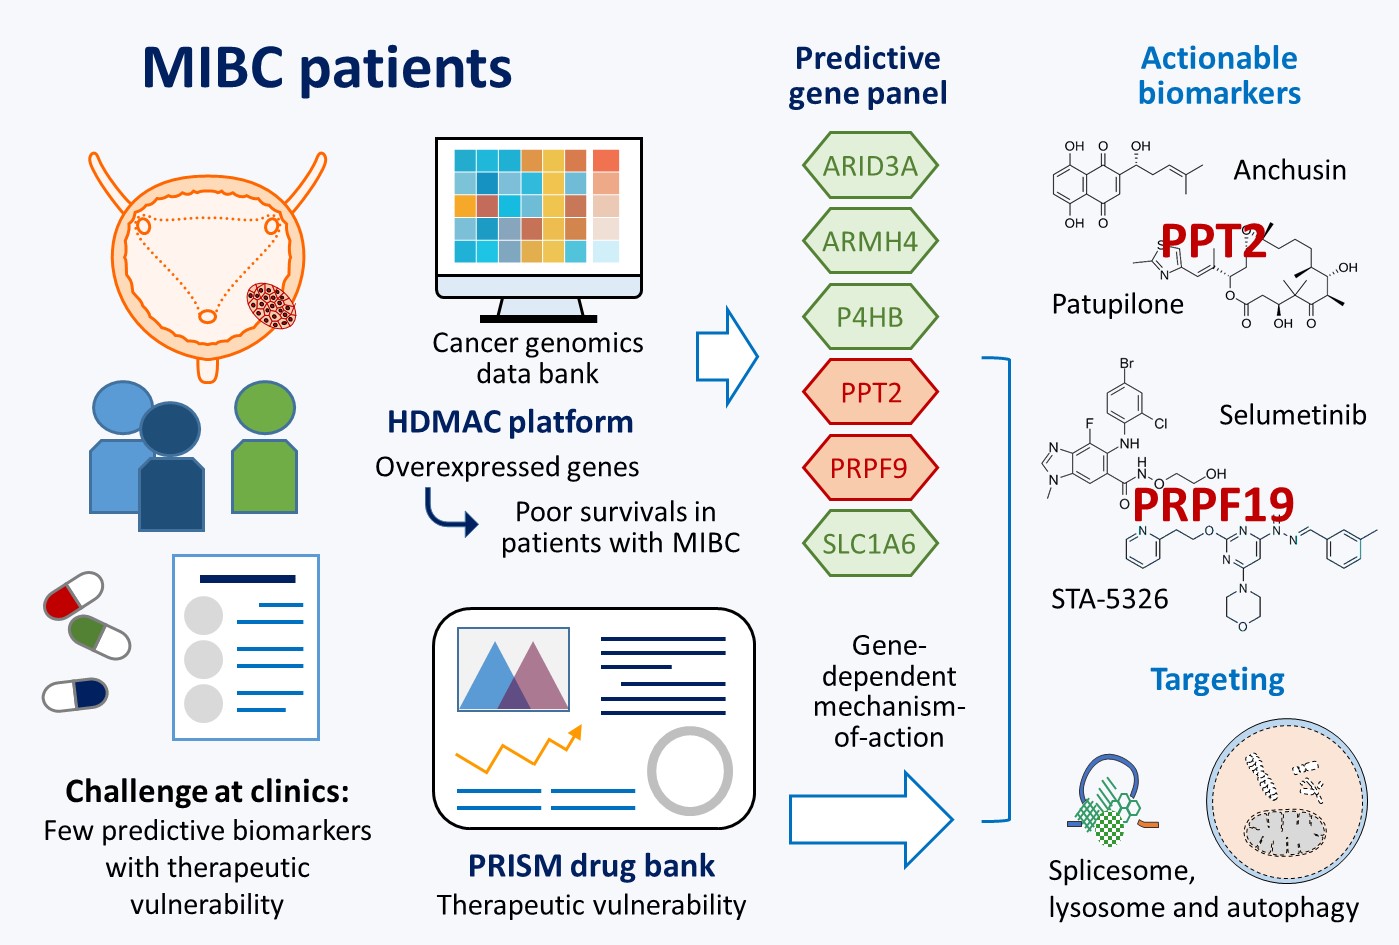
Despite advances in molecular characterization and drug development, identifying predictive biomarkers with therapeutic potentials remains challenging in the management of muscle-invasive bladder cancer (MIBC). To address this, we applied high-dimensional regression analysis using the HDMAC platform to overexpressed genes in MIBC which associated with poor overall survivals. A unique six-gene panel (ARID3A, ARMH4, P4HB, PPT2, PRPF19, and SLC1A6) was defined exhibiting additive prognostic value for determining MIBC aggressiveness. This panel was cross-validated in independent cohorts using a generalized additive model, and its transcriptomic profiles were linked to neuronal and luminal molecular subtypes. Among these genes, PPT2 and PRPF19 were identified as novel, druggable targets which showed gene-dependent cell vulnerabilities. PPT2 participates in lysosome/autophagy-mediated protein degradation, whereas PRPF19 serves as a central hub connecting the spliceosome, DNA replication machinery, and proteasome. Using PRISM drug bank data, potential lead compounds were identified through mechanism-of-action matching: anchusin and patupilone (targeting PPT2), and selumetinib and STA-5326 (targeting PRPF19). This integrated approach revealed PPT2 and PRPF19 as actionable predictive biomarkers for aggressive MIBC and suggests that protein degradation mediated by autophagosome/lysosome or proteasome pathways plays a critical role in MIBC progression.
Keywords:
muscle-invasive bladder cancer (MIBC)
; high-dimensional analysis of molecular alterations in cancer (HDMAC)
; therapeutic vulnerability
; PPT2
; PRPF19
; protein degradation
; spliceosome
1. Introduction
According to the GLOBOCAN Cancer Statistics 2020, bladder cancer ranks as the tenth most common cancer worldwide, with respective incidence and mortality rates of 11.9 and 4.2 per 100,000 persons [1]. Men are approximately 4 times more commonly diagnosed than women, and thus bladder cancer is the 9th leading cause of cancer death among men. Tobacco smoking, occupational exposures in the aluminum, painting or rubber industries and drinking of arsenic contamination water are major risk factors of bladder cancer in several populations [2]. Histologically, the majority of bladder cancer is characterized as urothelial carcinoma (95% incidence), which could be further classified into non-muscle invasive (NMIBC) and muscle invasive (MIBC) bladder cancer. To determine the treatment and predict the outcomes, the tumor aggressiveness in a patient is usually staged and graded according to the extent and spread of the cancer cells by using transurethral resection of bladder tumor (TURBT) and radiologic imaging such as CT and MRI.
For patients with NMIBC, the lesions can be easily ‘‘shaved off’’ by TURBT. The follow-up treatments like adjuvant intravesical chemotherapy or Bacillus-Calmette-Guerin (BCG) instillation have much improved the clinical outcomes [3], and the mortality rates have been declining in most developed settings. Nevertheless, such treatment is insufficient for cases with MIBC due to the limitation that TURBT may not screen the whole organ, leading to a false diagnosis. Most patients at this stage eventually experience recurrence easily after receiving curative-intent treatment and start to develop metastatic disease [4]. The 5-year overall survival (OS) rate for patients with metastatic tumor is only 6%, in comparison with 90% in patients with NMIBC [1,5]. One standard treatment for MIBC is radical cystectomy to remove part of or the whole bladder. For patients in selected situations, chemotherapy may be applied. Although pivotal trials published decades ago have set first-line platinum-based combinations as the standard of care for patients at advanced stages, the median OS still remains 12-16 months, even treated with a second-line chemotherapy [6]. In recent years, immune checkpoint inhibitors (ICIs) in the neoadjuvant setting have emerged as another antitumor strategy for treating MIBC with some encouraging outcomes reported [7,8,9]. Nevertheless, only around 15% to 25% of patients with advanced BCs showed response to ICI treatment [10,11]. Therefore, it is highly desirable to find a good diagnostic strategy to predict aggressive MIBC with druggable targets.
Several attempts by genome-wide screening have advanced our understanding of molecular mechanisms involved in bladder cancer progression [12,13,14]. Overexpression of certain genes have been frequently linked with MIBC, such as EGFR, ERBB2/3, FGFR3, PPAR, E2F1, EZH2 and YWHAZ [12,13,14,15,16,17]. Although those findings provide opportunities for clinical applications, most of the suggested cancer-associated genes were defined based on candidate-oriented studies. Some other independent biomarkers which show higher clinical relevance may be still missing, awaiting further investigation. To this end, we have previously developed a novel platform, known as HDMAC (High-Dimensional Analysis of Molecular Alterations in Cancer), to facilitate multivariate regression study with a huge number of altered genes during cancer development [18]. Through HDMAC platform, several penalized regression models like ridge, lasso and adaptive lasso are offered for high-dimensional data analysis with Cox regression for survival and logistic regression for binary outcomes. In addition to the increased statistical strength, HDMAC also provides a method to control the false discovery rate (FDR) as the first-step screening. Newly defined biomarkers could be found for predicting aggressive bladder cancer through high-dimensional analyses on alterations of entire annotated genes.
In this study, we aimed to define a new panel of novel biomarkers of which overexpression can predict poor clinical outcomes in patients with MIBC by using HDMAC platform. The prognostic values of those biomarkers can be validated in two independent study cohorts. Furthermore, additive effects can be found that patients with more biomarkers positive show much shorter survival times than those with only one or none. Although no direct molecular interactions were defined, overexpression of those genes contribute to several similar down-stream pathways, suggesting common features involved in aggressiveness of MIBC. Therapeutics based on those target genes provide another opportunity to develop better treatments for patients with aggressive MIBC. Through matching the molecular features of drug responses in cancer cells with gene dependent cell vulnerabilities [19,20,21], several novel drugs were also defined for possible applications against aggressive MIBC.
2. Results
This section may be divided by subheadings. It should provide a concise and precise description of the experimental results, their interpretation, as well as the experimental conclusions that can be drawn.
2.1. Potential Biomarkers for Aggressive MIBC Based on HDMAC Analysis
To find new biomarkers associated with shorter overall survival (OS) times in MIBC patients, we performed high-dimensional regression of alterations in gene expression (z-scores > 2.0 or <-2.0) in MIBC (Cell 2017, TCGA; n = 367) [14] by using HDMAC platform [18]. The data processing included univariate analysis with Cox-regression (1279 genes showed p-value < 0.05), followed by FDR correction (p-value < 1.0e-7) to delete false discovery univariates, resulting in 145 genes selected (Figure 1A). Then, those selected candidates were further filtered by using penalized regression models, lasso (L) (from 145 to 54 genes) and adaptive lasso (AL) (from 54 to 26 genes), to delete unrelated covariates (Figure 1B). Among the 26 selected genes, the expression of TCEANC, DOK7, C6ORF62, CTU1, BCL2L14, PDCL3 in MIBC showed negative AL coefficients, indicating their possible roles in tumor suppression [28,29,30]. Positive AL coefficients were detected for other 20 genes, suggesting their associations with worse clinical outcomes (Figure 1C). Such conclusion was further confirmed by comparing the tendency between AL coefficients with univariate coefficients (Figure 1D). We also noticed that overexpression of other known bladder cancer genes were highly associated with the expression of these selected genes (Supplementary Figure S1), whereas they were eliminated after FDR correction and penalized regression. Our data therefore suggest diagnostic potentials of overexpression in 26 genes in MIBC (Supplementary Table S1).
2.2. A Six-Gene Panel Serves as Novel Biomarkers for Predicting Poor Clinical Outcomes in Patients with MIBC
To further evaluate the clinical relevance of the selected 26 genes, we analyzed their associations with different clinical features. As shown in Figure 2A, overexpression of the selected genes were found frequently associated with tumor stage, subtype, histological grade and nodal status, suggesting their potent roles in promoting aggressive MIBC. To validate prognostic potentials of those genes, gene expression data from a Korean cohort study (GSE13507; n = 62) [12] were utilized to correlate gene expression levels with the hazard ratios by using a generalized additive model (GAM). As compared to the TCGA cohort, 18 out of the selected 24 genes (75.0 %) (PCLO and TCEANC were not annotated in the GSE13507 study) showed consistent tendency with patient overall survivals in the Korean cohort (Figure 2B, Supplementary Figure S2). Considering possible false conclusion for data with zero inflated, a panel of six genes (ARID3A, ARMH4, P4HB, PPT2, PRPF19 and SLC1A6) was suggested for further investigation. Although PPT2 overexpression did not show any association with the defined clinical features, it was still selected due to its significant p-values of GAM analyses in both cohorts (p = 0.0001 in TCGA, 0.0296 in Korean).
Based on the expression levels, we can successfully predict the significant differences in OS outcomes in both cohorts (Supplementary Figure S3). Strikingly, this six-gene panel also exhibits strong additive effects that patients negative to anyone of those biomarkers show much longer OS times than the ones positive to the defined biomarkers (Figure 3A). Furthermore, patients positive to more biomarkers (> 2) have shorter OS times (with median OS times of 8.94 and 6.87 months in TCGA and Korean cohorts, respectively) than the ones positive to only one or two biomarkers (19.78 months in TCGA and 15.40 months in Korean) (Figure 3B). Those results indicate high prognostic values of this six-gene panel for predicting outcomes of MIBC patients.
2.3. The Six-Gene Panel Shares Common Functional Features/Pathways
To confirm the key pathways governed by the six-gene panel in MIBC, gene-set enrichment analysis (GSEA) was performed using the transcriptome data (Supplementary Tables S2–S7). Interestingly, several functional features/pathways were commonly shared by different biomarkers, even though HDMAC selected candidates usually do not show direct molecular connection after high-dimensional regression (Supplementary Figure S4A). In addition, patients with positive scores to each biomarker seldom overlap with each other (Supplementary Figure S4B). Based on the top-20 enriched functions/pathways shared at least by two biomarkers, they can be classified into five major categories, including energy/nutrition homeostasis, ER-Gogi transportation & ER stress, glutamate & neuronal signaling, cancer-related signaling, and glycome alterations for tumor micro-environment (TME) remodeling (Figure 4A). Most of biomarkers participate in energy/nutrition homeostasis, cancer-related signaling, and glycome alterations for TME remodeling, which were also the top-3 categories activated in MIBC with poor clinical outcomes (Figure 4B). Of note, alterations in N-glycosylation profiles have been emerging as an important topic for developing diagnostic and therapeutic agents [31,32]. Glutamate & neuronal signaling is another interesting finding for MIBC, suggesting the neuronal features of aggressive MIBC [13,14,33]. Using the six-gene panel as the indicator, patients who show positive to this panel (30.1 %) highly express gene markers for neuronal and luminal subtypes, but they are negative to gene markers for basal squamous subtype (Figure 4C), suggesting different etiologies between neuronal/luminal and basal squamous subtypes.
2.4. PPT2 Levels Determine Vulnerabilities of Cancer Cells
To know whether expression of the six-gene panel determine vulnerabilities of cancer cells, we analyzed gene dependency scores after Crispr/Cas9 gene knock-out in different cell lines (Depmap; https://depmap.org/portal/) and correlated the effects with expression levels of the defined genes. As shown in Figure 5A, PPT2 was found as the only gene whose expression levels determined cell survivals (p = 0.0263), suggesting the potential addiction to PPT2 expression in bladder cancer cells. Using PPT2 as a target, four potential drugs by AUC (area under the curve) and two by IC50 analyses were screened out from Cancer Cell Line Encyclopedia database (CCLE; https://sites.broadinstitute.org/ccle/) based on their differential therapeutic effects on cells with different PPT2 levels (Figure 5B,C). Anchusin (also known as alkannin or shikonin; a chemokine receptor inhibitor) and patupilone (EPO906 or epothilone B; a microtubule-stabilizing agent) were considered as useful drug candidates for clinical applications due to their wider ranges of differential AUC values or effective drug concentrations. Notably, the expression levels of CCL7 and CCR3 correlate with PPT2 expression levels in MIBC (Figure 5D). Thus, one of possible targeting pathways associated with anchusin treatment would be the CCL7-CCR3 axis, an axis which has been previously reported to drive cancer metastasis [30,31,32,33,34,35,36]. On the other hand, PPT2 expression also correlated with enhancement of several beta-tubulins, including TUBB2A, TUBB3, TUBB4B and TUBB6 (Figure 5E), which could be the targets of patupilone.
2.5. PRPF19 and Its Network Is a Potent Target for Treating Aggressive MIBC
Among those selected genes, PRPF19 (also known as PSO4) was found highly expressed in all bladder cancer cell lines tested, and all the cell lines show high gene dependency on PRPF19 (Figure 5A). The mean gene dependency score was significantly lower (less than -2.0; p < 0.0001) as compared to other genes (Figure 6A). Since the median dependency score of known oncogenes is around −1.0 [27,37], our data highlight the potency of PRPF19 overexpression in MIBC development. PRPF19 is a key gene that can form a variety of PRPF19 complexes in cells. Among the defined binding partners, PRPF19 is best known to form the core component of spliceosome with PRPF8, CDC5L, BCAS2, PLRG1, and CDC40 [38,39]. Interestingly, Crispr/Cas9 knock-out on those complex partners also showed high essentiality for cell survival, especially for PRPF8 and CDC5L (Figure 6B). Clinical study indicated that PRPF19 expression levels were significantly higher in bladder cancer tissues than in adjacent normal counterparts (Figure 6C; p < 0.0001). In addition, PRPF19 expression showed high biological relevance that the DNA content correlated nicely with its gene expression levels in MIBC samples (Figure 6D; p < 0.0001). Those features strongly suggest PRPF19 as a potent cancer driver, which can serve as an ideal target for new drug development.
To address molecular bases of the selective dependency on PRPF19 overexpression, we screened cell-killing patterns of genes that were co-upregulated with PRPF19 in MIBC (Spearman's correlation > 5.0; Supplementary Table S8). As shown in Figure 6E, PRPF19 expression levels negatively correlated with gene effect scores of POLA2 knockout, suggesting these two proteins are functionally relevant [40]. In addition to a strong association with PRPF19 expression (Figure 6F), POLA2 expression level also correlate with its DNA copy number (Figure 6G). Furthermore, patients with overexpressed POLA2 levels showed shorter overall survivals as compared to patients with low POLA2 levels (Figure 6H), suggesting a similar pro-cancer role as PRPF19 does.
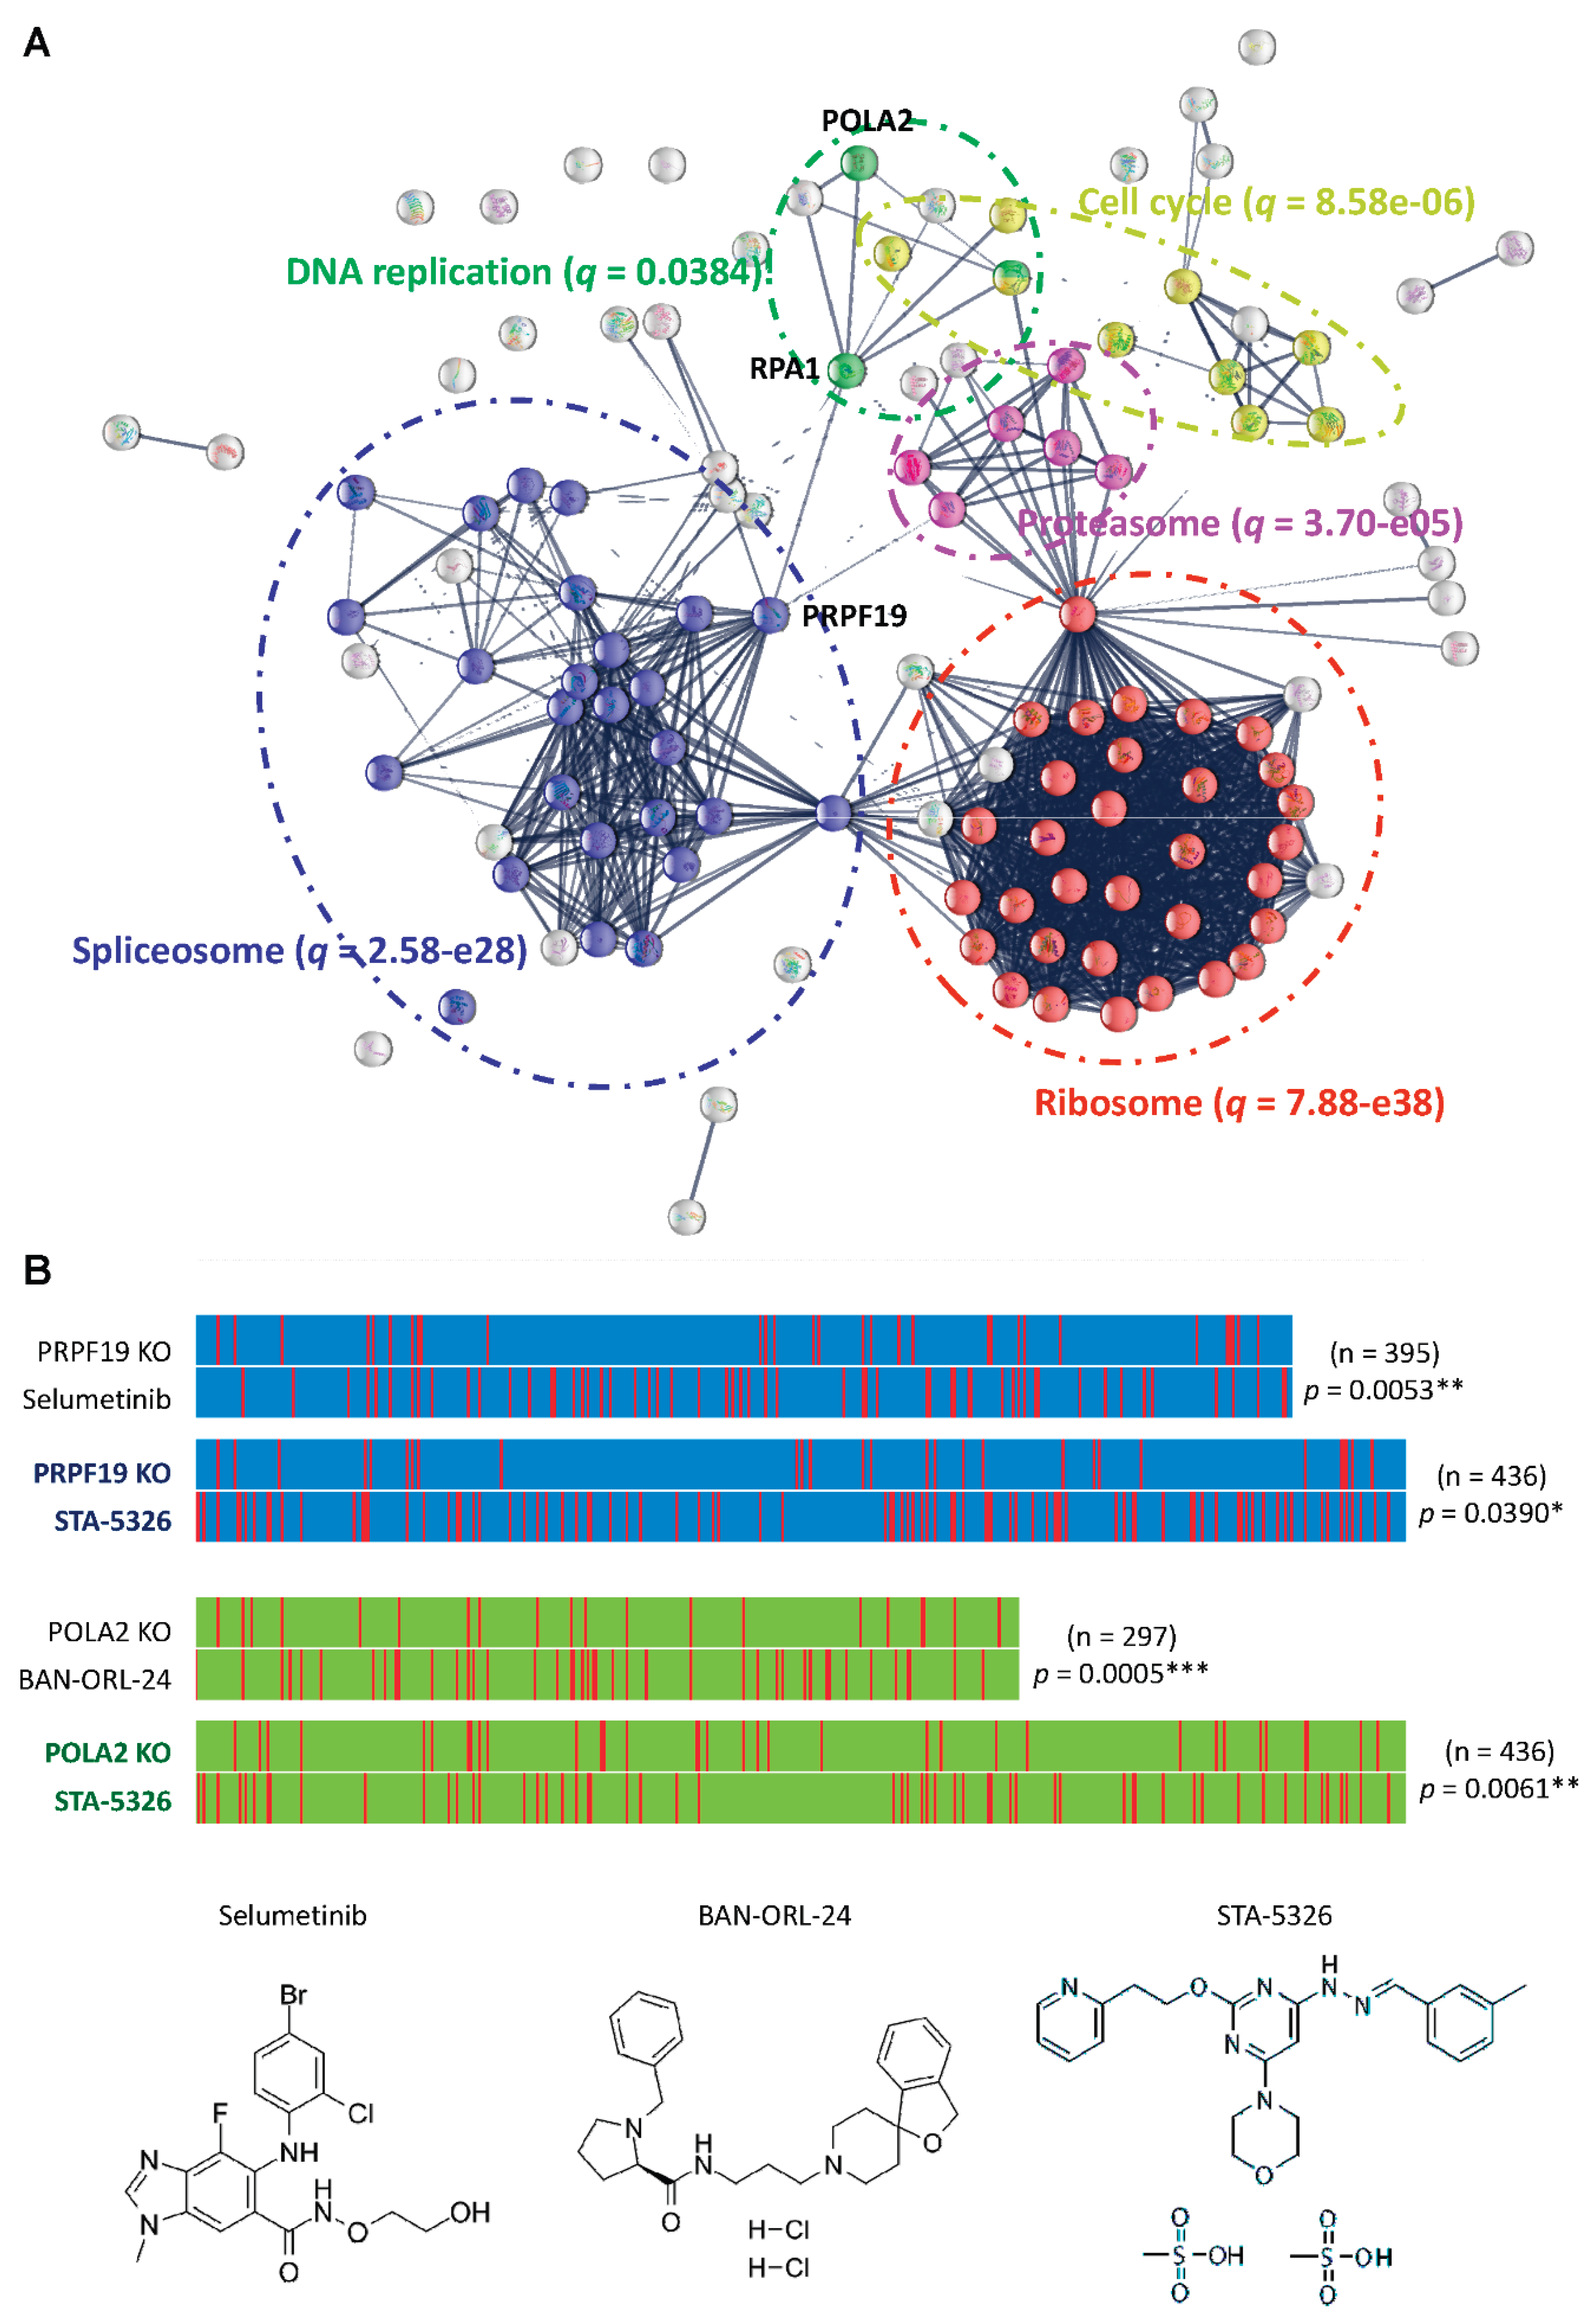
Interestingly, we noticed that the essential genes with gene effect scores less than 2.0 in human bladder cancer cells contribute to five major complexes/functions, including ribosome, spliceosome, cell cycle, proteasome, and DNA replication (Figure 7A). Of note, PRPF19 plays an important role to physically link spliceosome with DNA replication complex in the essential gene network via PRA1, where POLA2 is one of key genes in the DNA replication complex. To explore possible drug candidates with the molecular actions of anti-PRPF19 or anti-POLA2, we correlated the gene effect patterns with drug-killing profiles across 578 human cancer cell lines by using PRISM dataset with 4,694 compounds (https://depmap.org/repurposing) [19,20,21]. Through supervised linear regression analyses, our study revealed selumetinib and STA-5326 (also known as apilimod) as possible therapeutic leads against aggressive MIBC overexpressing PRPF19 as well as BAN-ORL-24 and STA-5326 for the ones overexpressing POLA2 (Figure 7B). Among them, STA-5326 treatment was found effective for both of PRPF19 or POLA2-overexpressing cells, suggesting the involvement of STA-5326 effects on spliceosome and DNA replication complexes.
3. Discussion
In this study, we have identified 26 genes whose overexpression can define aggressive MIBC in the TCGA cohort (Cell 2017) by using a statistic platform, HDMAC, for high dimensional regression analyses (Figure 1) [18]. Through clinical association study and cross-validation with a Korean cohort (GSE13507), a six-gene panel (ARID3A, ARMH4, P4HB, PPT2, PRPF19 and SLC1A6) was further defined as a novel signature for MIBC patients with shorter survivals (Figure 2 and Figure 3). Five major pathways were commonly shared by those six genes in MIBC, which show molecular features more similar to neuronal and luminal, but not basal squamous subtypes as defined by transcriptome classification (Figure 4) [13,14,33]. Gene dependency scores based on Crispr/Cas9 gene knock-out studies indicated PPT2 and PRPF19 as ideal targets for therapeutic interventions whose expression can determine vulnerabilities of cancer cells (Figure 5 and Figure 6). Anchusin and patupilone were identified as candidate leads for treating patients with PPT2 overexpression (Figure 5). POLA2 was found co-upregulated with PRPF19 overexpression with functional consequences by gene knockout (Figure 6). In addition, both genes were amplified and overexpressed in MIBC with a clear biological relevance from DNA copy numbers to gene expression levels, which can determine clinical outcomes of the patients (Figure 6). Notably, gene knockout of either genes contributed to strong vulnerabilities of cancer cells, suggesting the involvement of the interplay between splicesome and DNA replication complex in MIBC development of (Figure 7). Through drug mechanism-of-action investigations, Selumetinib and STA-5326 were suggested as good lead compounds for treating patients with PRPF19 overexpression (Figure 7B). STA-5326 was also found feasible for treating patients with POLA2 overexpression. Our findings therefore provide novel biomarkers for patient stratification and possible strategies for clinical interventions.
PPT2 is a lysosomal enzyme with thioesterase activity that removes fatty acyl groups from both long and short chain fatty acyl CoA substrates [41]. With homologous sequence to LTBP (latent transforming growth factor-beta-binding protein) as well as the binding capability toward EGFL8 and FGFR2 [42,43], PPT2 has been proposed to participate in a variety of oncogenic signaling, including TGF-β, β-catenin/WNT and EGF signaling [44]. In addition, PPT2 can also interact with the ILF2/ILF3 complex [45], which is required for mitotic progression and cytokinesis by regulating the expression of a cluster of mitotic genes by competing with staufen-mediated mRNA decay [46]. Notably, this complex was recently reported to play roles in cancer metabolic reprograming through inflammatory signaling cascades, especially enriched in phosphatidylcholine (PC) biosynthesis, fatty acid metabolism, and amino acid metabolism pathways [47]. In our study, we also found that patients with higher PPT2 levels show upregulated FGFR2 signaling, cell cycle activity and PC biosynthesis (Figure 4A). These findings may explain the potential benefits of patupilone (as a microtubule stabilizer) and anchusin (a suppressor of CCL7-CCR3 axis) treatments for cancer patients with PPT2 overexpression, which promotes cell cycle progression and inflammation associated metabolic adaptions.
PRPF19 forms a core complex with CDC5L, known as Prp19C, inside the spliceosome complex crucial for spliceosome assembly and catalytic activation of RNA splicing process [48,49]. Emerging evidence indicate multifaceted roles of this complex in diverse cellular processes, including DNA repair/genome maintenance, DNA replication/cell division, transcription elongation, protein ubiquitination, and lipid droplet biosynthesis [38,39,50,51,52,53]. Upregulation of PRPF19 overexpression is therefore linked with the development of several types of cancers [54,55,56,57,58], and the PRPF19/p38MAPK axis was found as the key pathway to enhance tumor aggressiveness via promoting EMT [57]. In fact, p38MAPK also plays an important role to balance the growth and death signals in response to cellular stresses, including blockage of autophagy-lysosomal system [59,60,61]. This may explain the effectiveness of Selumetinib, a potent MAPK inhibitor, for treating cancer cells with upregulated PRPF19 (Figure 7B).
On the other hand, PRPF19 can function as an E3 ligase to promote ATR-mediated DNA repair and homologous recombination, leading to chemo-/radio-resistance [54,62,63,64,65]. At clinics, co-upregulation of both PRPF19 and POLA2 was found as an important signature for mesothelioma patients with platinum resistance [66]. Our study revealed that PRPF19 overexpression in MIBC was found associated with the enrichment of proteasome activity, protein degradation during mitosis and chromosomal segregation (Figure 4A), supporting the potent roles of PRPF19 as being an E3 ligase during cancer development. STA 5326 (Apilimod) was originally discovered as an IL-12/IL-23 inhibitor [67], whiles this compound was later on identified as a PIKfyve inhibitor that can suppresses the formation and function of lysosomes, leading to impaired energy homeostasis and mitotic autophagy during cytokinesis [68,69,70]. Since PRPF19 controls the turnover of several proteins involved in DNA repair, replication and chromosome segregation through a phosphorylation-and-ubiquitylation circuitry, STA 5326 is therefore a good drug candidate for treating MIBC with PRPF19 and POLA2 (Figure 7B). Interestingly, combination of p38MAPK and PIKfyve inhibitors can synergistically reduce tumor growth of colon cancer in mice by disrupting autophagy, whiles no obvious effects were found on the viability of normal cells [61]. The potential benefits of combined therapy of Selumetinib and STA 5326 for MIBC cells are under investigation.
Significantly, both druggable targets suggested in this study, PPT2 and PRPF19, are involved in protein degradation pathways, highlighting the crucial roles of autophagy-lysosomal and proteasomal systems in malignant transformation and development of MIBC. Increased numbers of lysosomes or enhanced activity of lysosomal/proteasomal enzymes have been previously reported as an important feature to increase the invasiveness and drug resistance in bladder cancer cells [71,72,73,74]. Several proteins involved in protein degradation, such as Nedd4 like E3 ligases, have been proposed as ideal targets for new drug development against bladder cancer [60,73,75]. PRPF19 contains WD40 repeats, enabling it to function as a RNA-binding ubiquitin ligase. Through connecting post-transcriptional regulation with the ubiquitin system, PRPF19 participates in diverse sub-complexes to regulate gene expression and protein translation [38,39]. With more potent roles than other E3 ligases in oncogenesis, PRPF19 may serve as a novel and efficient lethal target for cancer treatment, especially for MIBC. Compounds that block the interface of WD40 repeats in PRPF19 (PDB 4LG8) with its substrates might be potential leads for PRPF19-based therapy [39] which will be investigated in our future study.
In this study, the proposed six-gene panel is highly associated with neuronal subtype with neuroendocrine-like features, even in the absence of neuroendocrine histology (Figure 4C). Previously, similar high-content drug screening was performed by using PRISM Repurposing dataset to define subtype-stratified novel lead compounds against MIBC [76]. Although several novel options were suggested with subtype-specific actions for basal, luminal and mesenchymal-like subtypes, none was suggested for treating MIBC neuronal subtype. Interestingly, Kim et al. indicated that MIBC patients defined as neuronal subtype showed extraordinarily high respond rate toward ICI-based therapy [77]. However, such conclusion was not supported by immune scores of TME with some concerns in the reliability of prediction with a small sample size (n = 11) [78,79,80]; in reverse, MIBC patients with neuronal phenotype likely obtained less benefits from immunotherapy due to immune-excluded features and low PD-L1 expression [13,33,78]. Investigations of ICI-based clinical trials also support the point of view that tumors with neuroendocrine features have been associated with an immune-desert TME, limiting the therapeutic effects of ICI-based therapy [81,82,83]. The findings from our study thus provide a novel strategy for treating patients with aggressive MIBC who might be ICI-non-responders by targeting PPT2 or PRPF19.
While our study has uncovered novel prognostic biomarkers for the most aggressive subtype of MIBC, along with several proposed therapeutic strategies, it is essential to acknowledge certain limitations. Firstly, our research identified racial disparities in the gene expression of selected biomarkers and their associated cancer outcomes. To validate these suggested biomarkers, it is imperative to include more study cohorts with diverse ethnic backgrounds. Furthermore, the determination of the cut-off point for each biomarker may vary according to race and ethnicity. Additionally, the functional impacts of the selected biomarkers, as well as the therapeutic potentials of the suggested lead compounds in our study, require further confirmation through gene knock-in/out cell-based or animal-based studies. Particularly, the underlying mechanisms behind the enhanced activity of protein degradation machineries in determining the aggressiveness of MIBC remain unclear and necessitate further exploration through additional studies.
4. Materials and Methods
4.1. Patients and Gene Expression Data
Clinical data and gene expression data of patients diagnosed as MIBC were collected from TCGA cohort (Cell, 2017) [14] and an Asian cohort (GSE13507) [12]. Patients with incomplete gene expression data, clinical information, and survival statuses were excluded. For TCGA cohort (n = 413), 367 patients were diagnosed as MIBC with complete genetic and clinical information. The RNAseq data normalized with diploid samples as z-scores were downloaded from cBioportal (https://www.cbioportal.org/). To compare the differential expression levels of a defined gene between cancer and normal tissues, normalized RNA-seq data were obtained from TCGA and GTEx projects via GEPIA2 server (http://gepia2.cancer-pku.cn/#index). For the GSE13507 cohort (n =165), 62 patients were diagnosed as MIBC with complete genetic and clinical information. Gene expression data based on Illumina human-6 v2.0 gene beadchip platform were downloaded from GEO databank (https://www.ncbi.nlm.nih.gov/geo/). LIMMA (Linear Models for Microarray Data) R package was utilized to estimate the expression level of each gene by averaging data from multiple probes. The resultant data were converted to z-scores through quantile normalization using data from normal tissues as the references and log2 transformation.
4.2. Potential Biomarkers for Aggressive MIBC Based on HDMAC Analysis
The HDMAC platform (https://ripsung26.shinyapps.io/rshiny/) was utilized to define new biomarkers for MIBC patients [18]. Alterations in gene expression (z-scores > 2.0 as overexpression or <-2.0 as down-regulation) with frequencies more than 5% among the patients were considered as the key events. In this HDMAC package, the platform can compute the significance between the expression level and patients’ survival, and select the most significant candidate genes through univariate analysis by proportional hazards Cox model with the FDR-adjusted p-values less than 5% [22], followed by multivariate analyses with lasso and adaptive lasso Cox’s proportional hazards models [23]. A generalized additive model was used to investigate the linear/nonlinear effect of gene expression on patients’ survival [24]. This approach enables us to identify target genes highly relevant to patients’ survival.
4.3. Clinical Association Study and Statistical Analyses
Clinical data of MIBC patients, including gender, age, smoke, stage, subtype, nodal status, etastasis status, histological grade and angiolymphatic invasion were retrieved from TCGA dataset. GraphPad Prism (GraphPad software, La Jolla, CA) was utilized for statistical analyses. Statistical differences between two groups were estimated by independent sample t-test and differences among more than two groups were estimated by one-way analysis of variance (ANOVA). Kaplan–Meier method was used to analyze the survival curves, and a log-rank test was performed for statistical comparison. To obtain an easily explainable multivariate survival model for clinical use, we identified the optimal cutoff point for gene expression levels of each target gene by Cox proportional hazard model [25]. The optimal cutoff points were defined as the ones with the most significant (likelihood ratio test or log-rank test) split. Pearson coefficient (r) and Spearman's rank correlation were used to measure a linear correlation of gene expression levels between two genes.
4.4. Gene Set Enrichment Analysis (GSEA)
To map the key pathways associated with overexpression of the defined biomarkers, TCGA cohort was divided into altered (with gene overexpression) and unaltered (without gene overexpression in any gene of the 6-gene panel) groups. Normalized gene expression data were applied for enriched pathway analyses by using GSEA Java (version 4.1.0) from Broad Institute, Cambridge, MA [26]. The significance of enrichment scores (ES) were normalized by permutation test, followed by FDR and FWER corrections. Over-representation analysis was performed to analyze the molecular linkage of target genes with genes enriched in the defined pathways.
4.5. Gene-Dependent Cell Vulnerabilities
The gene expression levels of candidate genes in 38 BLCA CCLE cell lines were downloaded from the Cancer Dependency Portal (DepMap) (https://depmap.org/portal/ccle/). Cell viability data after CRISPR–Cas9 knock-out were assessed based on the genome-scale data from the Project Achilles (DepMap Public 22Q4). Gene effect scores were calculated and converted to CERES score by normalizing the effects with gene copy number using the CERES algorithm [27]. The dependency scores less than -1.0 were identified as essential for cell survival. For genes with dependency scores larger than -1.0, gene-dependent cell vulnerabilities were analyzed based on the correlations between gene expression level of a particular candidate gene and the associated gene effect score in each cell line. A correlation plot with a Pearson coefficient (r) less than -0.3 was considered as positive for gene-dependent cell vulnerability.
4.6. High-Content Drug Screening
The drug response data including AUC (319 anti-cancer drugs) and IC50 values (206 drugs) were accessed by using drug dilution curves of the CCLE Cancer Dependency Portal (DepMap; GDSC1). The AUC values were presented on a scale between 0 and 1, where lower AUC values indicate increased sensitivity to drug treatment. Through fitting the curves to cell viability for each drug and cell line, the gene-drug response relationships were plotted and calculated according to expression levels of the defined candidate gene in different BLCA cell lines. Effective drugs were ranked by their differential AUC or IC50 values and tested for significance by unpaired two-tailed Student’s t-test with Welch correction. Effective drugs with wider ranges of differential AUC values (> 0.6) or effective drug concentrations (>10 digits) were considered as potential leads in this study.
4.7. Drug Screening by Mechanism-of-Action Matching
The drug responses of 578 human cancer cell lines to 4,694 compounds were assessed fromPRISM drug databank (https://depmap.org/repurposing). Supervised linear regression was performed to fit the best association between the cell viability and the gene effect scores by CRISPR knockout (DepMap Public 22Q4). Positive compounds (p < 0.05) were selected and subjected to likelihood ratio test or log-rank test to define the optimal cutoff points with the most significant split. In this study, the selected cutoff points for gene effect score were -2.40 for PRPF19 and -1.80 for POLA2; the cutoff points for cell viability were -1.78 for Selumetinib, -1.37 for STA-5326 and -0.75 for BAN-ORL-24. The matching association was further analyzed by 2 x 2 chi-square by using the defined cutoff points.
5. Conclusions
Utilizing the HDMAC platform, we have identified a six-gene panel capable of predicting worse clinical outcomes in patients with MIBC, which has been subsequently validated in an independent cohort. Patients exhibiting higher expression levels of these biomarkers experienced significantly shorter survival times compared to those with fewer biomarkers. Our functional screening efforts pinpointed PPT2 and PRPF19 as potential druggable targets involved in protein degradation via autophagosome/lysosome or proteasome pathways. Consequently, our study offers a promising diagnostic strategy for identifying aggressive MIBC cases, along with actionable targets for therapeutic intervention.
Supplementary Materials
The following supporting information can be downloaded at the website of this paper posted on Preprints.org, Figure S1: Co-expression correlations of candidate genes selected by HDMAC platform with known bladder cancer-associated genes; Figure S2: Hazard ratios associated with gene expression of HDMAC-selected candidate genes; Figure S3: Prognostic values of the six HDMAC-selected genes for patients with MIBC; Figure S4: Molecular interactions of the six-gene panel selected by HDMAC for aggressive MIBC; Table S1: HDMAC selected genes whose overexpression correlate with poor overall survivals in patients with MIBCa; Table S2: Gene set enrichment analyses of top 20 up-regulated pathways by ARID3A overexpression in MIBCa; Table S3: Gene set enrichment analyses of top 20 up-regulated pathways by ARMH4 overexpression in MIBCa. Table S4: Gene set enrichment analyses of top 20 up-regulated pathways by P4HB overexpression in MIBCa; Table S5: Gene set enrichment analyses of top 20 up-regulated pathways by PPT2 overexpression in MIBCa; Table S6: Gene set enrichment analyses of top 20 up-regulated pathways by PRPF19 overexpression in MIBCa; Table S7: Gene set enrichment analyses of top 20 up-regulated pathways by SLC1A6 overexpression in MIBCa; Table S8: Top 15 genes whose expression correlate with PRPF19 overexpression in patients with MIBCa.
Author Contributions
Conceptualization, C.C., C.C.Y., I.H.A.C. and J.J.C.S.; methodology, C.C., S.C.L., B.C.L. and M.T.L.; software, C.C. and B.C.L.; validation, C.C.Y., J.T., T.H., C.M.C., I.H.A.C. and J.J.C.S.; formal analysis, B.C.L, M.T.L. and J.C.; investigation, C.C., C.C.Y., B.C.L., I.H.A.C. and J.J.C.S.; resources, C.C.Y., S.C.L., I.H.A.C. and J.J.C.S.; data curation, C.C., B.C.L., J.T. and J.C.; writing—original draft preparation, C.C., C.C.Y., B.C.L., J.T., I.H.A.C. and J.J.C.S.; writing—review and editing, C.C., I.H.A.C. and J.J.C.S.; supervision, C.C., S.C.L., B.C.L., M.T.L. and J.T.; project administration, T.H. and C.M.C.; funding acquisition, C.C.Y., M.T.L., I.H.A.C. and J.J.C.S. All authors have read and agreed to the published version of the manuscript.
Funding
This study was funded by grants from the National Science and Technology Council (NSTC)/Taiwan (109-2314-B-110-003-MY3, 111-2811-B-110-005), the Ministry of Health and Welfare/Taiwan (MHW 11126), the NSYSU-KVGH joint research projects (KSVNSU110-003, KSVGH110-044, KSVGH110-079, KSVGH111-091), Zheng De-Ling foundation (21020347-00111003), and the NSYSU-KMU joint research projects (110-P019).
Data Availability Statement
Data presented in this study are included in this published article and its Supplementary Information file. Other data generated or analyzed during this study are also available from the corresponding authors on request.
Acknowledgments
The authors thank technical assistance from Ms. Han Hsiao and Mr. You-Jun Lai at National Sun Yatsen University/Taiwan. The authors also thank critical comments from Prof. Chee-Yin Chai and Prof. Shu-Pin Huang at Kaohsiung Medical University, Taiwan.
Conflicts of Interest
All the authors declare no competing interests in this study.
Abbreviations
The following abbreviations are used in this manuscript:
| NMIBC | Non-muscle invasive bladder cancer |
| MIBC | Muscle invasive bladder cancer |
| TURBT | Transurethral resection of bladder tumor |
| BCG | Bacillus-Calmette-Guerin |
| ICI | Immune checkpoint inhibitor |
| HDMAC | High-dimensional analysis of molecular alterations in cancer |
| FDR | False discovery rate |
References
- Sung, H.; Ferlay, J.; Siegel, R.L.; Laversanne, M.; Soerjomataram, I.; Jemal, A.; Bray, F. Global Cancer Statistics 2020: GLOBOCAN Estimates of Incidence and Mortality Worldwide for 36 Cancers in 185 Countries. CA Cancer J. Clin. 2021, 71, 209–249. [Google Scholar] [CrossRef]
- Antoni, S.; Ferlay, J.; Soerjomataram, I.; Znaor, A.; Jemal, A.; Bray, F. Bladder Cancer Incidence and Mortality: A Global Overview and Recent Trends. Eur. Urol. 2017, 71, 96–108. [Google Scholar] [CrossRef]
- Clin, B.; "RecoCancerProf" Working Group; Pairon, J. C. Medical follow-up for workers exposed to bladder carcinogens: the French evidence-based and pragmatic statement. BMC Public Health 2014, 14, 1155. [Google Scholar] [CrossRef] [PubMed]
- Stecca, C.; Abdeljalil, O.; Sridhar, S.S. Metastatic Urothelial Cancer: a rapidly changing treatment landscape. Ther. Adv. Med. Oncol. 2021, 13, 17588359211047352. [Google Scholar] [CrossRef] [PubMed]
- Audisio, A.; Buttigliero, C.; Delcuratolo, M.D.; Parlagreco, E.; Audisio, M.; Ungaro, A.; Stefano, R.F.D.; Prima, L.D.; Turco, F.; Tucci, M. New Perspectives in the Medical Treatment of Non-Muscle-Invasive Bladder Cancer: Immune Checkpoint Inhibitors and Beyond. Cells 2022, 11, 357. [Google Scholar] [CrossRef]
- Reulen, R.C.; Kellen, E.; Buntinx, F.; Brinkman, M.; Zeegers, M.P. A meta-analysis on the association between bladder cancer and occupation. Scand. J. Urol. Nephrol. Suppl. 2008, 218, 64–78. [Google Scholar] [CrossRef]
- Rouanne, M.; Bajorin, D.F.; Hannan, R.; Galsky, M.D.; Williams, S.B.; Necchi, A.; Sharma, P.; Powles, T. Rationale and Outcomes for Neoadjuvant Immunotherapy in Urothelial Carcinoma of the Bladder. Eur. Urol. Oncol. 2020, 3, 728–738. [Google Scholar] [CrossRef]
- Hu, J.; Chen, J.; Ou, Z.; Chen, H.; Liu, Z.; Chen, M.; Zhang, R.; Yu, A.; Rui Cao; Zhang, E. ; et al. Neoadjuvant immunotherapy, chemotherapy, and combination therapy in muscle-invasive bladder cancer: A multi-center real-world retrospective study. Cell Rep. Med. 2022, 3, 100785. [Google Scholar] [CrossRef]
- Patel, V.G.; Oh, W.K.; Galsky, M.D. Treatment of muscle-invasive and advanced bladder cancer in 2020. CA Cancer J. Clin. 2020, 70, 404–42. [Google Scholar] [CrossRef]
- van der Heijden, M.S.; Loriot, Y.; Durán, I.; Ravaud, A.; Retz, M.; Vogelzang, N.J.; Nelson, B.; Wang, J.; Shen, X.; Powles, T. Atezolizumab Versus Chemotherapy in Patients with Platinum-treated Locally Advanced or Metastatic Urothelial Carcinoma: A Long-term Overall Survival and Safety Update from the Phase 3 IMvigor211 Clinical Trial. Eur. Urol. 2021, 80, 7–11. [Google Scholar] [CrossRef] [PubMed]
- Bamias, A.; Merseburger, A.; Loriot, Y.; James, N.; Choy, E.; Castellano, D.; Lopez-Rios, F.; Calabrò, F.; Kramer, M.; de Velasco, G.; et al. New prognostic model in patients with advanced urothelial carcinoma treated with second-line immune checkpoint inhibitors. J. Immunother. Cancer 2023, 11, e005977. [Google Scholar] [CrossRef]
- Lee, J.S.; Leem, S.H.; Lee, S.Y.; Kim, S.C.; Park, E.S.; Kim, S.B.; Kim, S.K.; Kim, Y.J.; Kim, W.J.; Chu, I.S. Expression signature of E2F1 and its associated genes predict superficial to invasive progression of bladder tumors. J. Clin. Oncol. 2010, 28, 2660–2667. [Google Scholar] [CrossRef]
- Sjödahl, G.; Eriksson, P.; Liedberg, F.; Höglund, M. Molecular classification of urothelial carcinoma: global mRNA classification versus tumour-cell phenotype classification. J. Pathol. 2017, 242, 113–125. [Google Scholar] [CrossRef]
- Robertson, A.G.; Kim, J.; Al-Ahmadie, H.; Bellmunt, J.; Guo, G.; Cherniack, A.D.; Hinoue, T.; Laird, P.W.; Hoadley, K.A.; Akbani, R.; et al. Comprehensive Molecular Characterization of Muscle-Invasive Bladder Cancer. Cell. [CrossRef]
- Lee,S. R.; Roh, Y.G.; Kim, S.K.; Lee, J.S.; Seol, S.Y.; Lee, H.H.; Kim, W.T.; Kim, W.J.; Heo, J.; Cha, H.J.; et al. Activation of EZH2 and SUZ12 Regulated by E2F1 Predicts the Disease Progression and Aggressive Characteristics of Bladder Cancer. Clin. Cancer Res. 2015, 21, 5391–5403. [Google Scholar] [CrossRef]
- Kiselyov, A.; Bunimovich-Mendrazitsky, S.; Vladimir Startsev, V. Key signaling pathways in the muscle-invasive bladder carcinoma: Clinical markers for disease modeling and optimized treatment. Int. J. Cancer 2016, 138, 2562–2569. [Google Scholar] [CrossRef]
- Chia-Cheng Yu; Chien-Feng Li; I-Hsuan Chen; Ming-Tsung Lai; Zi-Jun Lin; Praveen K Korla; Chee-Yin Chai; Grace Ko; Chih-Mei Chen; Tritium Hwang; et al. YWHAZ amplification/overexpression defines aggressive bladder cancer and contributes to chemo-/radio-resistance by suppressing caspase-mediated apoptosis. J. Pathol. 2019, 248, 476–487. [Google Scholar] [CrossRef]
- Chang, C.; Sung, C.Y.; Hsiao, H.; Chen, J.; Chen, I.S.; Kuo, W.T.; Cheng, L.F.; Korla, P.K.; Chung, M.J.; Wu, P.J.; et al. HDMAC: A Web-Based Interactive Program for High-Dimensional Analysis of Molecular Alterations in Cancer. Sci. Rep. 2020, 10, 3953. [Google Scholar] [CrossRef]
- Corsello, S.M.; Nagari, R.T.; Spangler, R.D.; Rossen, J.; Kocak, M.; Bryan, J.G.; Humeidi, R.; Peck, D.; Wu, X.; Tang, A.A.; et al. Discovering the anti-cancer potential of non-oncology drugs by systematic viability profiling. Nat. Cancer 2020, 1, 235–248. [Google Scholar] [CrossRef] [PubMed]
- Vazquez, F.; Boehm, J.S. The Cancer Dependency Map enables drug mechanism-of-action investigations. Mol. Syst. Biol. 2020, 1. [Google Scholar] [CrossRef]
- Gonçalves E; Segura-Cabrera A; Pacini C; Picco G; Behan FM; Jaaks P; Coker EA; van der Meer D; Barthorpe A; Lightfoot H; et al. Drug mechanism-of-action discovery through the integration of pharmacological and CRISPR screens. Mol. Syst. Biol. 2020, 16, e9405. [Google Scholar] [CrossRef]
- Gonçalves, E.; Segura-Cabrera, A.; Pacini, C.; Picco, G.; Behan, F.M.; Jaaks, P.; Coker, E.A.; van der Meer, D.; Barthorpe, A.; Lightfoot, H.; et al. False discovery rate control is a recommended alternative to Bonferroni-type adjustments in health studies, J. Clin. Epidemiol. 2014, 67, 850–857. [Google Scholar] [CrossRef]
- Zhang, H.H.; Lu, W. Adaptive Lasso for Cox's proportional hazards model. Biometrika 2007, 94, 691–703. [Google Scholar] [CrossRef]
- T Hastie, T.; Tibshirani, R. Generalized additive models for medical research, Stat. Methods Med. Res. 1995, 4, 187–196. [Google Scholar] [CrossRef]
- Chang, C.; Hsieh, M.K.; Chang, W.Y.; Chiang, A.J.; Chen, J. Determining the optimal number and location of cutoff points with application to data of cervical cancer. PLoS One 2017, 12, e0176231. [Google Scholar] [CrossRef]
- Subramanian, A.; Tamayo, P.; Mootha, V.K.; Mukherjee, S.; Ebert, B.L.; Gillette, M.A.; Paulovich, A.; Pomeroy, S.L.; Golub, T.R.; Lander, E.S.; et al. Gene set enrichment analysis: a knowledge-based approach for interpreting genome-wide expression profiles. Proc. Natl. Acad. Sci. U. S. A. 2005, 102, 15545–15550. [Google Scholar] [CrossRef]
- Meyers, R.M.; Bryan, J.G.; McFarland, J.M.; Weir, B,A,; Sizemore, A. E.; Xu, H.; Dharia, N.V.; Montgomery, P.G.; Cowley, G.S. ; Pantel, S.; et al. Computational correction of copy number effect improves specificity of CRISPR-Cas9 essentiality screens in cancer cells. Nat. Genet. 2017, 49, 1779–1784. [Google Scholar] [CrossRef]
- Lin, M.L.; Park, J.H.; Nishidate, T.; Nakamura, Y.; Katagiri, T. Involvement of maternal embryonic leucine zipper kinase (MELK) in mammary carcinogenesis through interaction with Bcl-G, a pro-apoptotic member of the Bcl-2 family. Breast Cancer Res. 2007, 9, R17. [Google Scholar] [CrossRef]
- Hill, S.J.; Rolland, T.; Adelmant, G.; Xia, X.; Owen, M.S.; Dricot, A.; Zack, T. I.; Sahni, N.; Jacob, Y.; Hao, T.; et al. Systematic screening reveals a role for BRCA1 in the response to transcription-associated DNA damage. Genes Dev. 2014, 28, 1957–1975. [Google Scholar] [CrossRef] [PubMed]
- Yue, C.; Bai, Y.; Piao, Y.; Liu, H. DOK7 Inhibits Cell Proliferation, Migration, and Invasion of Breast Cancer via the PI3K/PTEN/AKT Pathway. J. Oncol. 2021, 2021, 4035257. [Google Scholar] [CrossRef]
- Yang, G.; Tan, Z.; Lu, W.; Guo, J.; Yu, H.; Yu, J.; Sun, C.; Qi, X.; Li, Z.; Guan, F. Quantitative glycome analysis of N-glycan patterns in bladder cancer vs normal bladder cells using an integrated strategy. J. Proteome Res. 2015, 14, 639–653. [Google Scholar] [CrossRef] [PubMed]
- Toshikazu Tanaka; Tohru Yoneyama; Daisuke Noro; Kengo Imanishi; Yuta Kojima; Shingo Hatakeyama; Yuki Tobisawa; Kazuyuki Mori; Hayato Yamamoto; Atsushi Imai; et al. Aberrant N-Glycosylation Profile of Serum Immunoglobulins is a Diagnostic Biomarker of Urothelial Carcinomas. Int. J. Mol. Sci. 2017, 18, 2632. [Google Scholar] [CrossRef]
- Batista da Costa, J.; Gibb, E.A.; Bivalacqua, T.J.; Liu, Y.; Oo, H.Z.; Miyamoto, D.T.; Alshalalfa, M.; Davicioni, E.; Wright, J.; Dall'Era, M.A.; et al. Molecular Characterization of Neuroendocrine-like Bladder Cancer. Clin. Cancer Res. 2019, 25, 3908–3920. [Google Scholar] [CrossRef] [PubMed]
- Lee, Y.S.; Kim, S.Y.; Song, S.J.; Hong, H.K.; Lee, Y.; Oh, B.Y.; Lee, W.Y.; Cho, Y.B. Crosstalk between CCL7 and CCR3 promotes metastasis of colon cancer cells via ERK-JNK signaling pathways. Oncotarget 2016, 7, 36842–36853. [Google Scholar] [CrossRef] [PubMed]
- Qi, S,; Perrino, S. ; Miao, X.; Lamarche-Vane, N.; Brodt, P. The chemokine CCL7 regulates invadopodia maturation and MMP-9 mediated collagen degradation in liver-metastatic carcinoma cells. Cancer Lett. 2020, 483, 98–113. [Google Scholar] [CrossRef]
- Guérar, A.; Laurent, V.; Fromont, G.; Estève, D.; Gilhodes, J.; Bonnelye, E.; Gonidec, S.L.; Valet, P.; Malavaud, B.; Reina, N.; et al. The Chemokine Receptor CCR3 Is Potentially Involved in the Homing of Prostate Cancer Cells to Bone: Implication of Bone-Marrow Adipocytes. Int. J. Mol. Sci. 2021, 22, 1994. [Google Scholar] [CrossRef]
- Pacini, C.; Dempster, J.M.; Boyle, I.; Gonçalves, E.; Najgebauer, H.; Karakoc, E.; van der Meer, D.; Barthorpe, A.; Lightfoot, H.; Jaaks, P.; et al. Integrated cross-study datasets of genetic dependencies in cancer. Nat. Commun. 2021, 12, 1661. [Google Scholar] [CrossRef]
- Hildebrandt, A.; Alanis-Lobato, G.; Voigt, A.; Kathi Zarnack, K.; Andrade-Navarro, M.A.; Beli, P.; König, J. Interaction profiling of RNA-binding ubiquitin ligases reveals a link between posttranscriptional regulation and the ubiquitin system. Sci. Rep. 2017, 7, 16582. [Google Scholar] [CrossRef]
- Idrissou, M.; Alexandre Maréchal, A. The PRP19 Ubiquitin Ligase, Standing at the Cross-Roads of mRNA Processing and Genome Stability. Cancers 2022, 14, 878. [Google Scholar] [CrossRef]
- Bondeson, D.P.; Paolella, B.R.; Asfaw, A.; Rothberg, M.V.; Skipper, T.A.; Langan, C.; Mesa, G.; Gonzalez, A.; Surface, L.E.; Ito, K.; et al. Phosphate dysregulation via the XPR1-KIDINS220 protein complex is a therapeutic vulnerability in ovarian cancer. Nat. Cancer 2022, 3, 681–695. [Google Scholar] [CrossRef] [PubMed]
- Calero, G.; Gupta, P.; Nonato, M.C.; Tandel, S.; Biehl, E.R.; Hofmann, S.L.; Clardy, J. The crystal structure of palmitoyl protein thioesterase-2 (PPT2) reveals the basis for divergent substrate specificities of the two lysosomal thioesterases, PPT1 and PPT2. J. Biol. Chem. 2203, 78, 37957–37964. [Google Scholar] [CrossRef]
- Soyombo, A.A.; Yi, W.; Hofmann, S.L. Structure of the human palmitoyl-protein thioesterase-2 gene (PPT2) in the major histocompatibility complex on chromosome 6p21.3. Genomics 1999, 56, 208–216. [Google Scholar] [CrossRef]
- Huttlin, E.L.; Bruckner, R.J.; Navarrete-Perea, J.; Cannon, J.R.; Baltier, K.; Gebreab, F.; Gygi, M.P.; Thornock, A.; Zarraga, G.; Tam, S.; et al. Dual Proteome-Scale Networks Reveal Cell-Specific Remodeling of the Human Interactome. Cell 2021, 184, 3022–3040. [Google Scholar] [CrossRef] [PubMed]
- Yuan, C.F.; Xiong, Z.Y.; Shi, J.; Peng, J.T.; Meng, X.G.; Wang, C.; Hu, W.J.; Ru, Z.Y.; Xie, K.R.; Yang, H.M.; et al. Overexpression of PPT2 Represses the Clear Cell Renal Cell Carcinoma Progression by Reducing Epithelial-to-Mesenchymal Transition. J. Cancer 2020, 11, 1151–1161. [Google Scholar] [CrossRef]
- Havugimana, P.C.; Hart, G.T.; Nepusz, T.; Yang, H.; Turinsky, A.L.; Li, Z.; Wang, P.I.; Boutz, D.R.; Fong, V.; Phanse, S.; et al. A Census of Human Soluble Protein Complexes. Cell 2012, 150, 1068–1081. [Google Scholar] [CrossRef]
- Nourreddine, S.; Lavoie, G.; Paradis, J.; Ben El Kadhi, K.; Méant, A.; Aubert, L.; Grondin, B.; Gendron, P.; Chabot, B.; Bouvier, M.; et al. NF45 and NF90 Regulate Mitotic Gene Expression by Competing with Staufen-Mediated mRNA Decay. Cell Rep. 2020, 31, 107660. [Google Scholar] [CrossRef]
- Zang, B.; Wang, W.; Wang, Y.; Li, P.; Xia, T.; Liu, X.; Chen, D.; Piao, H.-L.; Qi, H.; Ma, Y.; et al. Metabolomic Characterization Reveals ILF2 and ILF3 Affected Metabolic Adaptions in Esophageal Squamous Cell Carcinoma. Front. Mol. Biosci. 2021, 8, 721990. [Google Scholar] [CrossRef]
- Ohi, M.D.; Vander Kooi, C.W.; Rosenberg, J.A.; Ren, L.; Hirsch, J.P.; Chazin, W.J.; et al. Structural and Functional Analysis of Essential Pre-mRNA Splicing Factor Prp19p. Mol. Cell. Biol. 2005, 25, 451–460. [Google Scholar] [CrossRef]
- Chan, S.P.; Kao, D.I.; Tsai, W.Y.; Cheng, S.C. The Prp19p-Associated Complex in Spliceosome Activation. Science 2003, 302, 279–282. [Google Scholar] [CrossRef] [PubMed]
- Chanarat, S.; Sträßer, K. Splicing and Beyond: The Many Faces of the Prp19 Complex. Biochim. Biophys. Acta 2013, 1833, 2126–2134. [Google Scholar] [CrossRef] [PubMed]
- Abbas, M.; Shanmugam, I.; Bsaili, M.; Hromas, R.; Shaheen, M. The Role of the Human Psoralen 4 (hPso4) Protein Complex in Replication Stress and Homologous Recombination. J. Biol. Chem. 2014, 289, 14009–14019. [Google Scholar] [CrossRef]
- Mahajan, K. hPso4/hPrp19: A Critical Component of DNA Repair and DNA Damage Checkpoint Complexes. Oncogene 2016, 35, 2279–2286. [Google Scholar] [CrossRef]
- Khan, A.; Dellago, H.; Terlecki-Zaniewicz, L.; Karbiener, M.; Weilner, S.; Hildner, F.; Grillari, J. SNEVhPrp19/hPso4 Regulates Adipogenesis of Human Adipose Stromal Cells. Stem Cell Reports 2017, 8, 21–29. [Google Scholar] [CrossRef]
- He, Y.; Huang, C.; Cai, K.; Liu, P.; Chen, X.; Xu, Y.I.; Ming, Z.; Liu, Q.; Xie, Q.; Xia, X.; et al. PRPF19 Promotes Tongue Cancer Growth and Chemoradiotherapy Resistance. Acta Biochim. Biophys. Sin. 2021, 53, 893–902. [Google Scholar] [CrossRef]
- Pudova, E.A.; Krasnov, G.S.; Kobelyatskaya, A.A.; Savvateeva, M.V.; Fedorova, M.S.; Pavlov, V.S.; Nyushko, K.M.; Kaprin, A.D.; Alekseev, B.Y.; Trofimov, D.Y.; et al. Gene Expression Changes and Associated Pathways Involved in the Progression of Prostate Cancer Advanced Stages. Front. Genet. 2021, 11, 613162. [Google Scholar] [CrossRef]
- Kessler, T.; Berberich, A.; Sadik, A.; Sahm, F.; Gorlia, T.; Meisner, C.; Stupp, R. Methylome Analyses of Three Glioblastoma Cohorts Reveal Chemotherapy Sensitivity Markers within DDR Genes. Cancer Med. 2020, 9, 8373–8385. [Google Scholar] [CrossRef]
- Yin, J.; Wang, L.; Zhu, J.M.; Yu, Q.; Xue, R.Y.; Fang, Y.; Zhang, Y.A.; Chen, Y.J.; Liu, T.T.; Dong, L.; et al. Prp19 Facilitates Invasion of Hepatocellular Carcinoma via p38 Mitogen-Activated Protein Kinase/Twist1 Pathway. Oncotarget 2016, 7, 21939–21951. [Google Scholar] [CrossRef]
- Zhou, J.; Wang, W.; Xie, Y.; Zhao, Y.; Chen, X.; Xu, W.; Zhang, Y. Proteomics-Based Identification and Analysis of Proteins Associated with Helicobacter pylori in Gastric Cancer. PLoS ONE 2016, 11, e0146521. [Google Scholar] [CrossRef] [PubMed]
- Sui, X.; Kong, N.; Ye, L.; Han, W.; Zhou, J.; Zhang, Q.; He, C.; Pan, H. p38 and JNK MAPK Pathways Control the Balance of Apoptosis and Autophagy in Response to Chemotherapeutic Agents. Cancer Lett. 2014, 344, 174–179. [Google Scholar] [CrossRef] [PubMed]
- Chen, L.; Wang, G.; Luo, Y.; Wang, Y.; Xie, C.; Jiang, W.; Xiao, Y.; Qian, G.; Wang, X. Downregulation of LAPTM5 Suppresses Cell Proliferation and Viability Inducing Cell Cycle Arrest at G0/G1 Phase of Bladder Cancer Cells. Int. J. Oncol. 2017, 50, 263–271. [Google Scholar] [CrossRef] [PubMed]
- O'Connell, C.E.; Vassilev, A. Combined Inhibition of p38MAPK and PIKfyve Synergistically Disrupts Autophagy to Selectively Target Cancer Cells. Cancer Res. 2021, 81, 2903–2917. [Google Scholar] [CrossRef]
- Dubois, J.-C.; Yates, M.; Gaudreau-Lapierre, A.; Clément, G.; Cappadocia, L.; Gaudreau, L.; Zou, L.; Maréchal, A. A Phosphorylation-and-Ubiquitylation Circuitry Driving ATR Activation and Homologous Recombination. Nucleic Acids Res. 2017, 45, 8859–8872. [Google Scholar] [CrossRef]
- Maréchal, A.; Li, J.M.; Ji, X.Y.; Wu, C.S.; Yazinski, S.A.; Nguyen, H.D.; Zou, L. PRP19 Transforms into a Sensor of RPA-ssDNA after DNA Damage and Drives ATR Activation via a Ubiquitin-Mediated Circuitry. Mol. Cell 2014, 53, 235–246. [Google Scholar] [CrossRef]
- Lu, X.; Legerski, R.J. The Prp19/Pso4 Core Complex Undergoes Ubiquitylation and Structural Alterations in Response to DNA Damage. Biochem. Biophys. Res. Commun. 2007, 354, 968–974. [Google Scholar] [CrossRef]
- Mahajan, K.N.; Mitchell, B.S. Role of Human Pso4 in Mammalian DNA Repair and Association with Terminal Deoxynucleotidyl Transferase. Proc. Natl. Acad. Sci. U.S.A. 2003, 100, 10746–10751. [Google Scholar] [CrossRef] [PubMed]
- Røe, O.D.; Szulkin, A.; Anderssen, E.; Flatberg, A.; Sandeck, H.; Amundsen, T; Erlandsen, S. E.; n Dobra, K.; Stein Harald Sundstrøm, S.H. Molecular Resistance Fingerprint of Pemetrexed and Platinum in a Long-Term Survivor of Mesothelioma. PLoS ONE 2012, 7, e40521. [Google Scholar] [CrossRef] [PubMed]
- Billich, A. Drug Evaluation: Apilimod, an Oral IL-12/IL-23 Inhibitor for the Treatment of Autoimmune Diseases and Common Variable Immunodeficiency. IDrugs 2007, 10, 53–59. [Google Scholar]
- Cai, X.; Xu, Y.; Cheung, A.K.; Tomlinson, R.C.; Alcázar-Román, A.; Murphy, L.; Billich, A.; Zhang, B.; Feng, Y.; Klumpp, M.; et al. PIKfyve, a class III PI kinase, is the target of the small molecular IL-12/IL-23 inhibitor apilimod and a player in Toll-like receptor signaling. Chem. Biol. 2013, 20, 912–921. [Google Scholar] [CrossRef] [PubMed]
- Gayle, S.; Landrette, S.; Beeharry, N.; Conrad, C.; Hernandez, M.; Beckett, P.; Martin, A.; Smith, J.; Jones, K.; Lee, H.; et al. Identification of Apilimod as a First-in-Class PIKfyve Kinase Inhibitor for Treatment of B-Cell Non-Hodgkin Lymphoma. Blood 2017, 129, 1768–1778. [Google Scholar] [CrossRef]
- Sharma, G.; Guardia, C.M.; Roy, A.; Vassilev, A.; Saric, A.; Griner, L.N.; Marugan, J.; Ferrer, M.; Bonifacino, J.S.; DePamphilis, M.L. A Family of PIKFYVE Inhibitors with Therapeutic Potential Against Autophagy-Dependent Cancer Cells Disrupt Multiple Events in Lysosome Homeostasis. Autophagy 2019, 15, 1694–1718. [Google Scholar] [CrossRef]
- Alroy, J.; Gould, V.E. Epithelial-Stromal Interface in Normal and Neoplastic Human Bladder Epithelium. Ultrastruct. Pathol. 1980, 1, 201–210. [Google Scholar] [CrossRef]
- Weiss, R.E.; Liu, B.C.; Ahlering, T.; Dubeau, L.; Droller, M.J. Mechanisms of Human Bladder Tumor Invasion: Role of Protease Cathepsin B. J. Urol. 1990, 144, 798–804. [Google Scholar] [CrossRef]
- Chen, C.; Matesic, L.E. The Nedd4-Like Family of E3 Ubiquitin Ligases and Cancer. Cancer Metastasis Rev. 2007, 26, 587–604. [Google Scholar] [CrossRef]
- Makridakis, M.; Gagos, S.; Petrolekas, A.; Roubelakis, M.G.; Bitsika, V.; Stravodimos, K.; Pavlakis, K; Anagnou N. P.; Coleman, J.; Vlahou, A. Chromosomal and Proteome Analysis of a New T24-Based Cell Line Model for Aggressive Bladder Cancer. Proteomics 2009, 9, 287–298. [Google Scholar] [CrossRef]
- Hou, D.Y.; Wang, M.D.; Zhang, N.Y.; Xu, S.; Wang, Z.J.; Hu, X.J.; Lv, G.T.; Wang, J.Q.; Lv, M.Y.; Yi, L.; et al. A Lysosome-Targeting Self-Condensation Prodrug-Nanoplatform System for Addressing Drug Resistance of Cancer. Nano Lett. 2022, 22, 3983–3992. [Google Scholar] [CrossRef]
- Rinaldetti, S.; Zhou, Q.; Abbott, J.M.; de Jong, F.C.; Esquer, H.; Costello, J.C.; Theodorescu, D.; LaBarbera, D.V. High-Content Drug Discovery Targeting Molecular Bladder Cancer Subtypes. Int. J. Mol. Sci. 2022, 23, 10605. [Google Scholar] [CrossRef] [PubMed]
- Kim, J.; Kwiatkowski, D.; McConkey, D.J.; Meeks, J.J.; Freeman, S.S.; Bellmunt, J.; Getz, G; Seth P Lerner, S. P. The Cancer Genome Atlas Expression Subtypes Stratify Response to Checkpoint Inhibition in Advanced Urothelial Cancer and Identify a Subset of Patients with High Survival Probability. Eur. Urol. 2019, 75, 961–964. [Google Scholar] [CrossRef]
- Jin, K.; He, M.; Chen, B.; Zhou, X.; Zhang, C.; Zhang, Z.; Hu, D; Jiang, Z; Wei, Q; Qiu, S; et al. A Single-Sample mRNA Molecular Classification of Bladder Cancer Predicting Prognosis and Response to Immunotherapy. Transl. Androl. Urol. 2022, 11, 943–958. [Google Scholar] [CrossRef] [PubMed]
- Todenhöfer, T.; Seiler, R. Molecular Subtypes and Response to Immunotherapy in Bladder Cancer Patients. Transl. Androl. Urol. 2019, 8, S293–S295. [Google Scholar] [CrossRef] [PubMed]
- Crabb, S.J. Personalised Medicine for Advanced Urothelial Cancer: What is the Right Way to Identify the Right Patient for the Right Treatment? Eur. Urol. 2019, 75, 965–966. [Google Scholar] [CrossRef]
- Hegde, P.S.; Chen, D.S. Top 10 Challenges in Cancer Immunotherapy. Immunity 2020, 52, 17–35. [Google Scholar] [CrossRef]
- Carvajal-Hausdorf, D.; Altan, M.; Velcheti, V.; Gettinger, S.N.; Herbst, R.S.; Rimm, D.L.; et al. Expression and Clinical Significance of PD-L1, B7-H3, B7-H4 and TILs in Human Small Cell Lung Cancer (SCLC). J. Immunother. Cancer 2019, 7, 65. [Google Scholar] [CrossRef] [PubMed]
- Al-Toubah, T.; Cives, M.; Strosberg, J. Novel Immunotherapy Strategies for Treatment of Neuroendocrine Neoplasms. Transl. Gastroenterol. Hepatol. 2020, 5, 54. [Google Scholar] [CrossRef] [PubMed]
Figure 1.
Discovery of new biomarkers for more aggressive MIBC by using HDMAC platform. The RNA transcriptome data from TCGA cohort (Cell, 2017; n = 367) were utilized for high-dimension regression analysis to define new biomarkers whose altered expression (z-scores > 2.0 or < -2.0) correlate with shorter overall survival times in patients with MIBC. By using the HDMAC platform (https://ripsung26.shinyapps.io/rshiny/), the most significant genes were filtered out by (A) univariate analysis with Cox-regression and FDR correction, followed by (B) penalized regression models, including lasso (L) (left) and adaptive lasso (AL) (right). (C) The resultant genes were presented in a bar chart according to their AL coefficients. (D) The dot plot shows consistent tendency of the selected genes between AL coefficients with univariate coefficients.
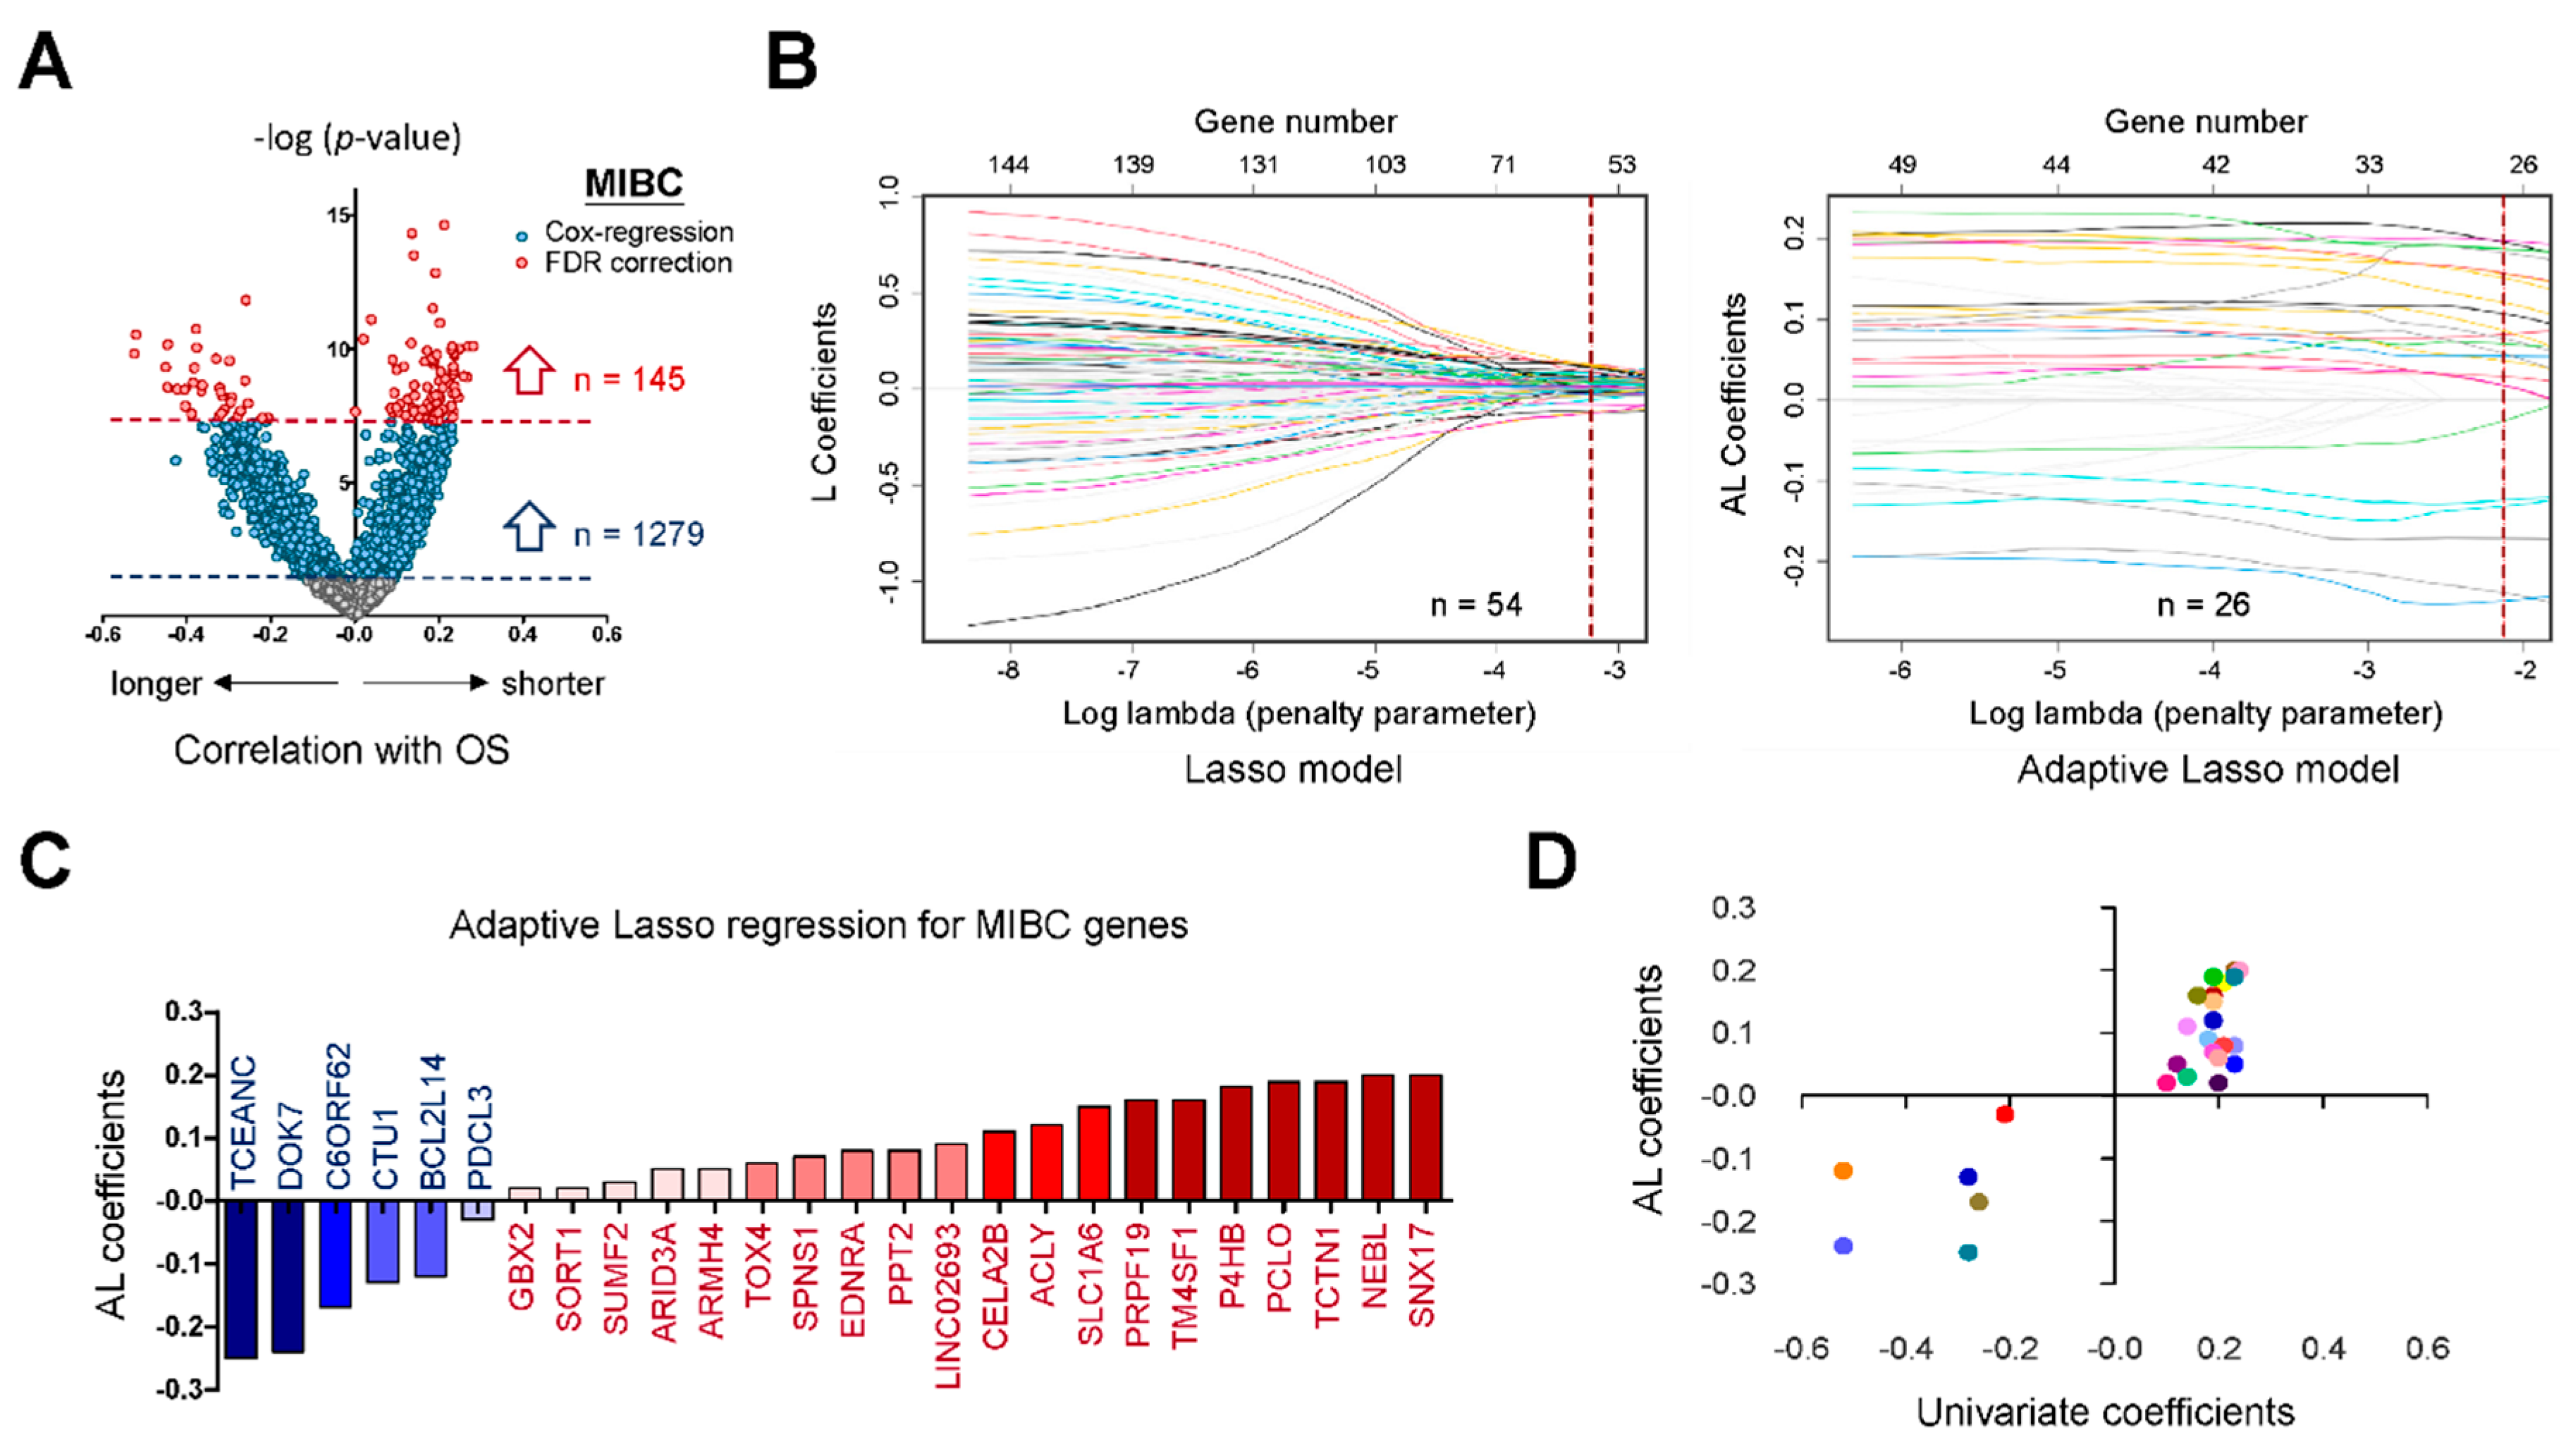
Figure 2.
Clinical significance of HDMAC-selected biomarkers in MIBC. (A) Gene expression levels of HDMAC-selected biomarkers (TCGA cohort, n = 367) were subjected to clinical association study. The clinical parameters include gender, age, smoke, stage, subtype, nodal status, metastasis status, histological grade, and angiolymphatic invasion. (B) The hazard ratios (for shorter overall survival times) among HDMAC-selected biomarkers were compared according to their gene expression levels. A six-gene panel (ARID3A, ARMH4, P4HB, PPT2, PRPF19 and SLC1A6) was finalized that shows consistent aggressiveness between TCGA (Cell 2017) and Korean (GSE13507) cohorts.
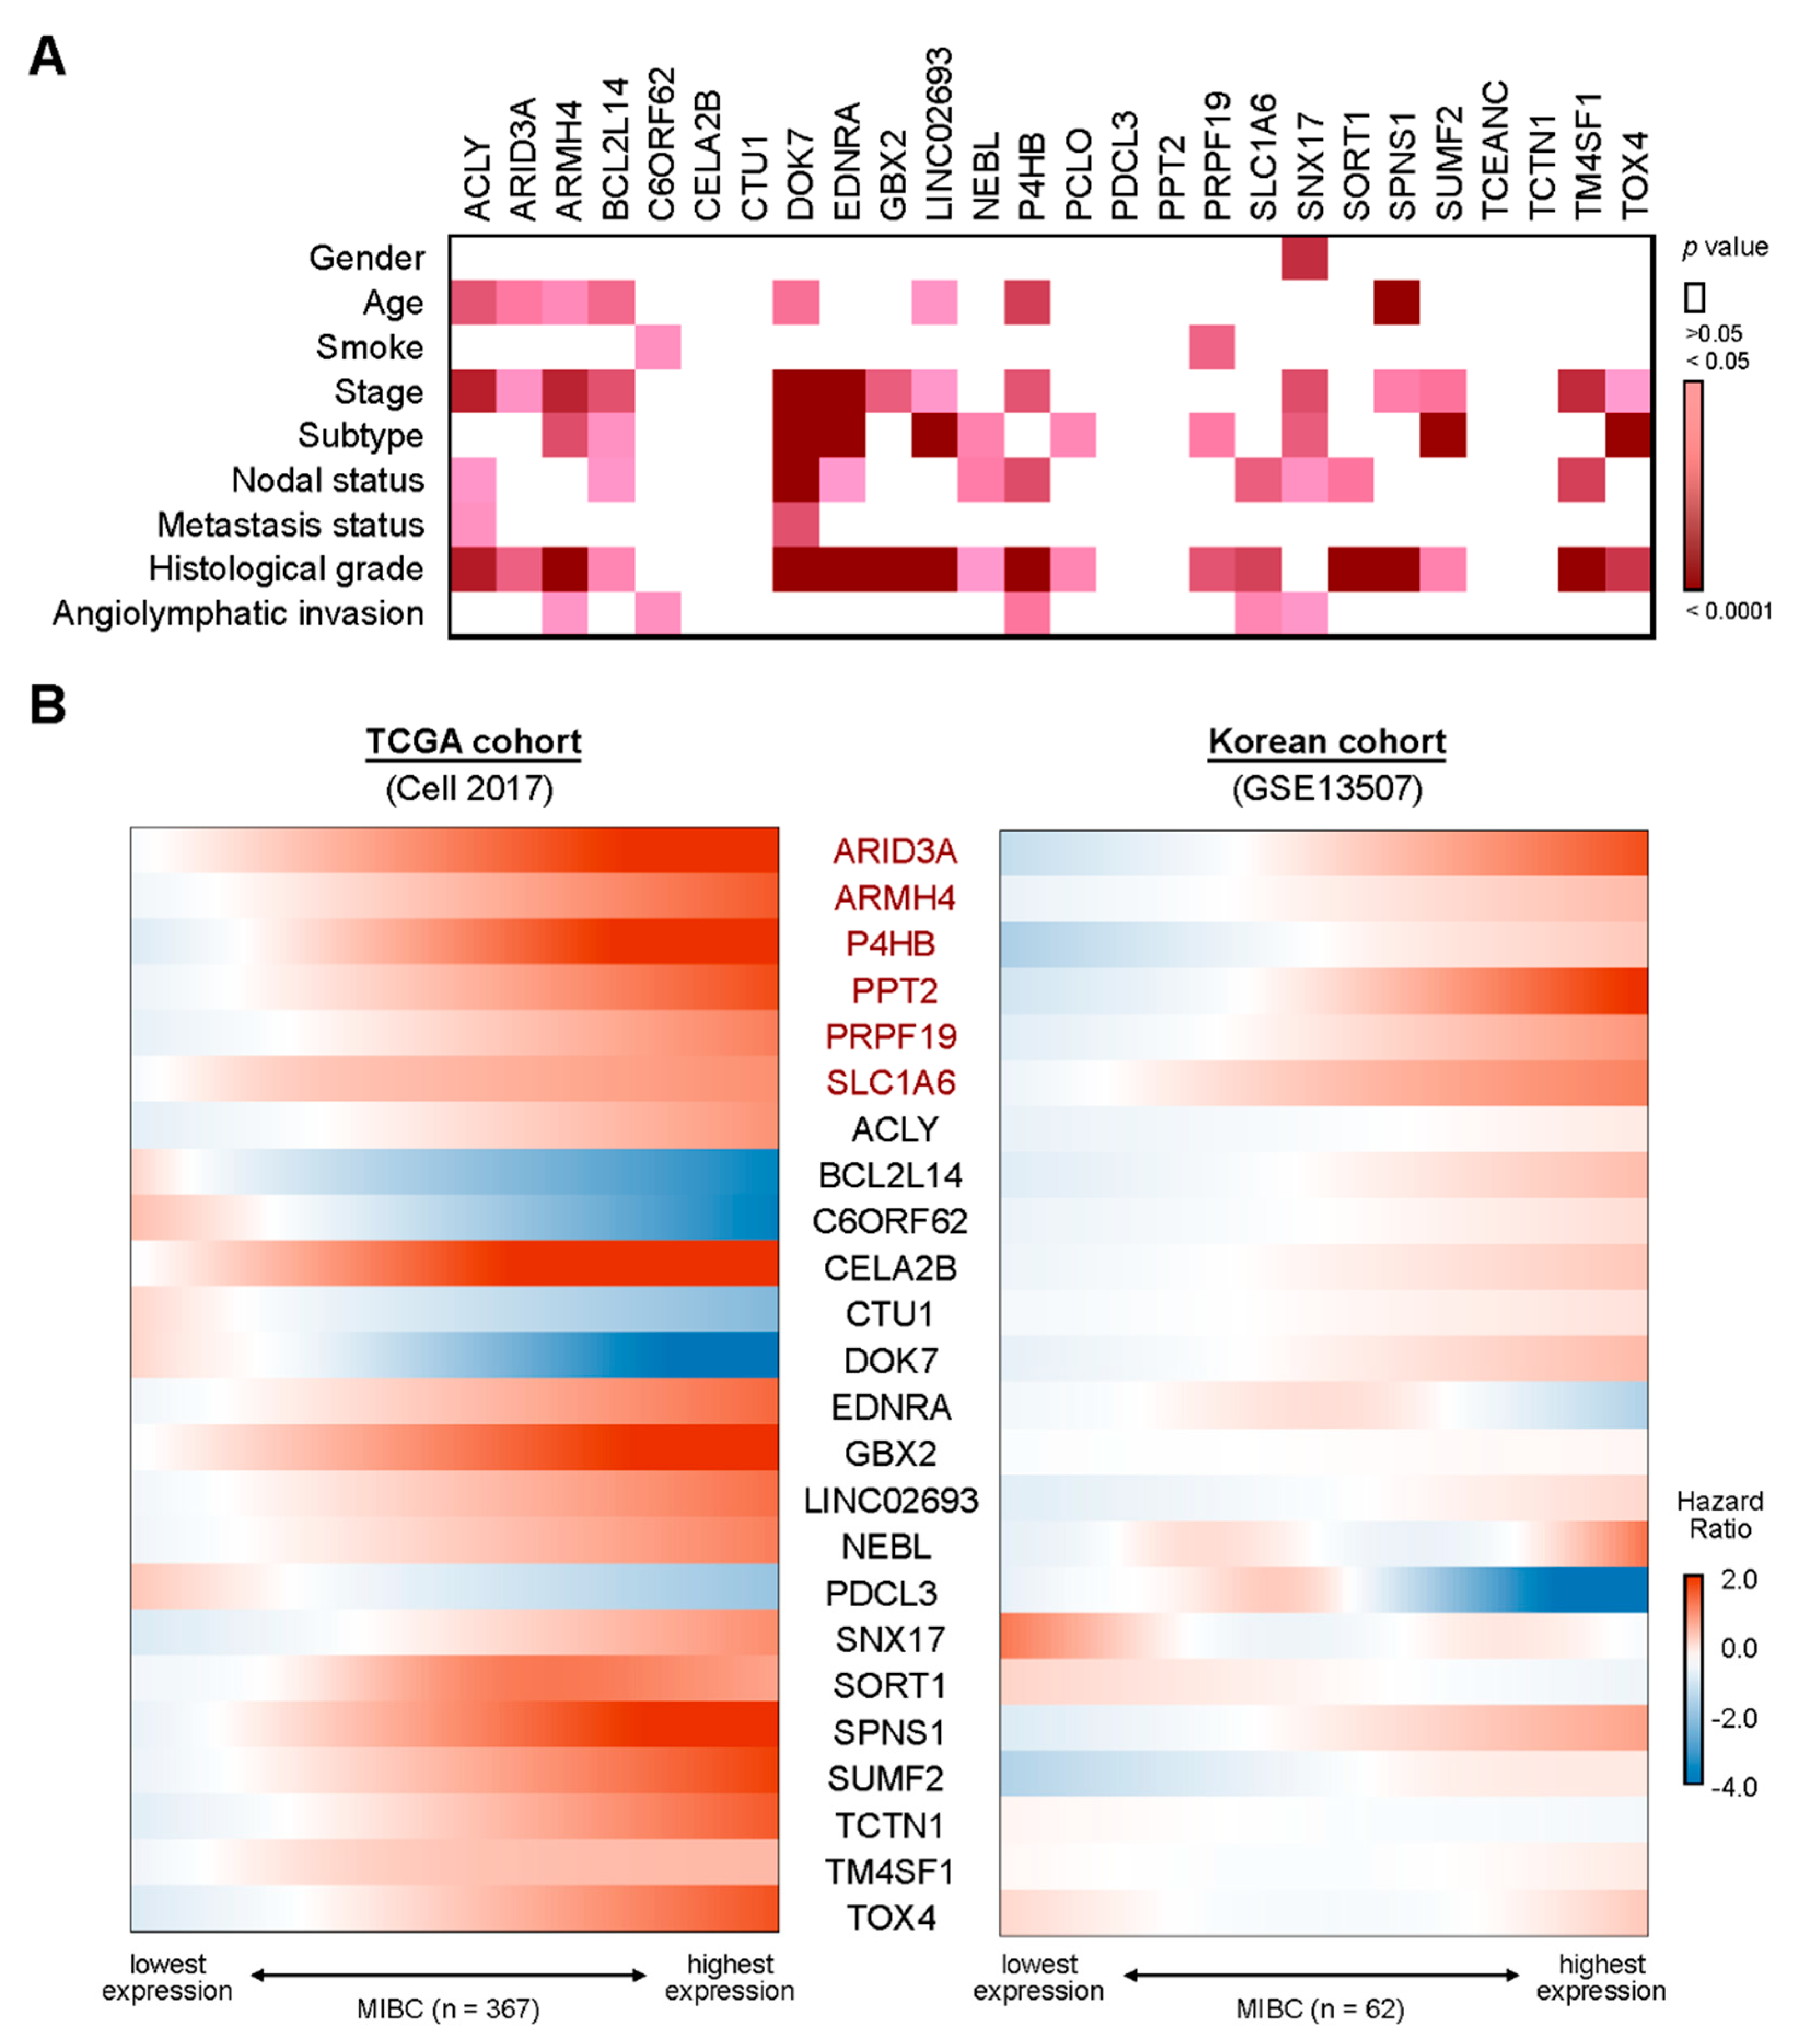
Figure 3.
Prognostic values of the six-gene panel for patients with aggressive MIBC. (A) Cox proportional hazard model was applied to define the optimal cutoff points of the selected six genes according to their expression levels. The best cutoff points (red rectangles) defined in the MIBC patients of TCGA cohort (left) also show statistical significance in Korean cohort (right), and vice versa. (B) MIBC patients were divided into patients with or without the six-gene panel signature. Kaplan–Meier survival analyses were performed to study the prognostic values of selected genes individually (left) or additively (right) by using the optimal cutoff points defined in (A). Log-rank tests were performed for statistical comparisons. (C) Median survival times of MIBC patients with overexpression of one or more suggested biomarkers were compared with patients who show negative to all the biomarkers.
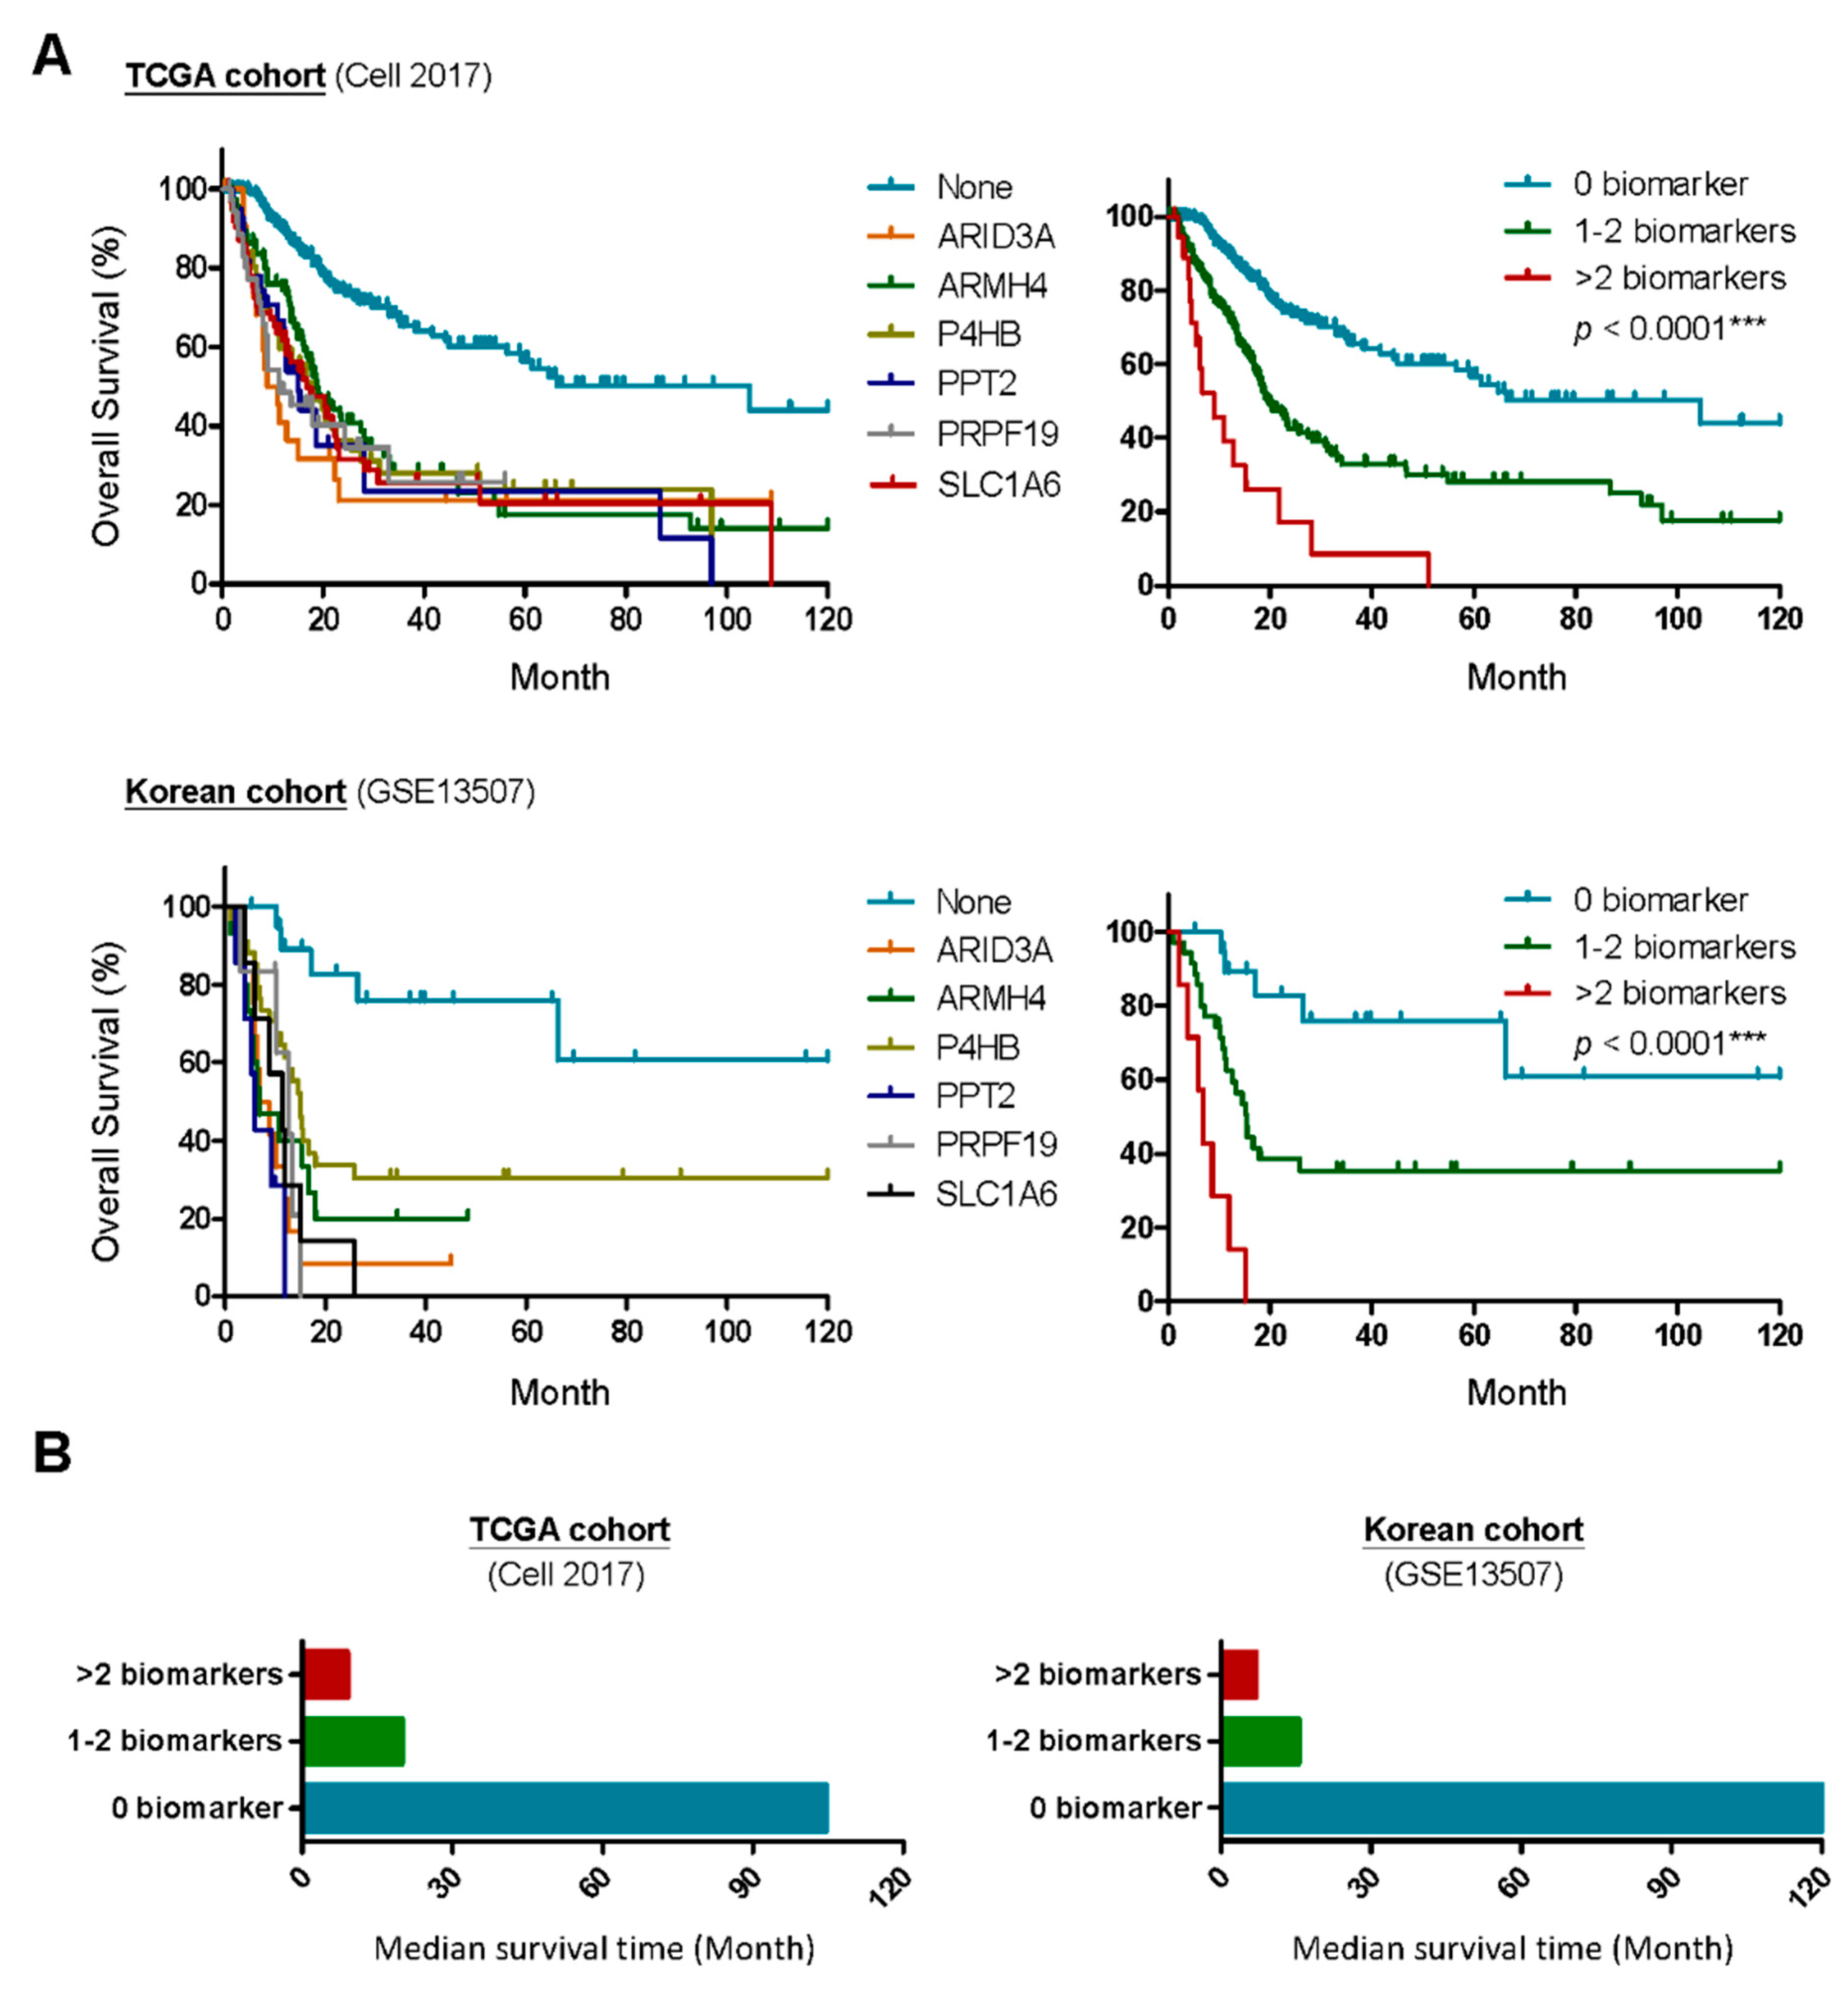
Figure 4.
Commonly enriched pathways associated with overexpression of the six-gene panel in patients with MIBC. (A) The top-20 downstream pathways enriched by overexpression of the six-gene panel were analyzed by gene set enrichment analysis (GSEA) (normalized p < 0.05) (Supplementary Tables S2–S7). The selected pathway databases in this study include B: Biocarta, K: KEGG and R: Reactome. Those enriched pathways can be further subgrouped into five major categories. (B) The bar chart indicate the numbers of enriched pathways in each key category. (C) Differentially expressed genes in MIBC patients with (Pro) or without (Con) were plotted by a dot plot. The genes of the six-gene panel and key biomarkers for different molecular subtypes [13,14,33] were colored with different colors.
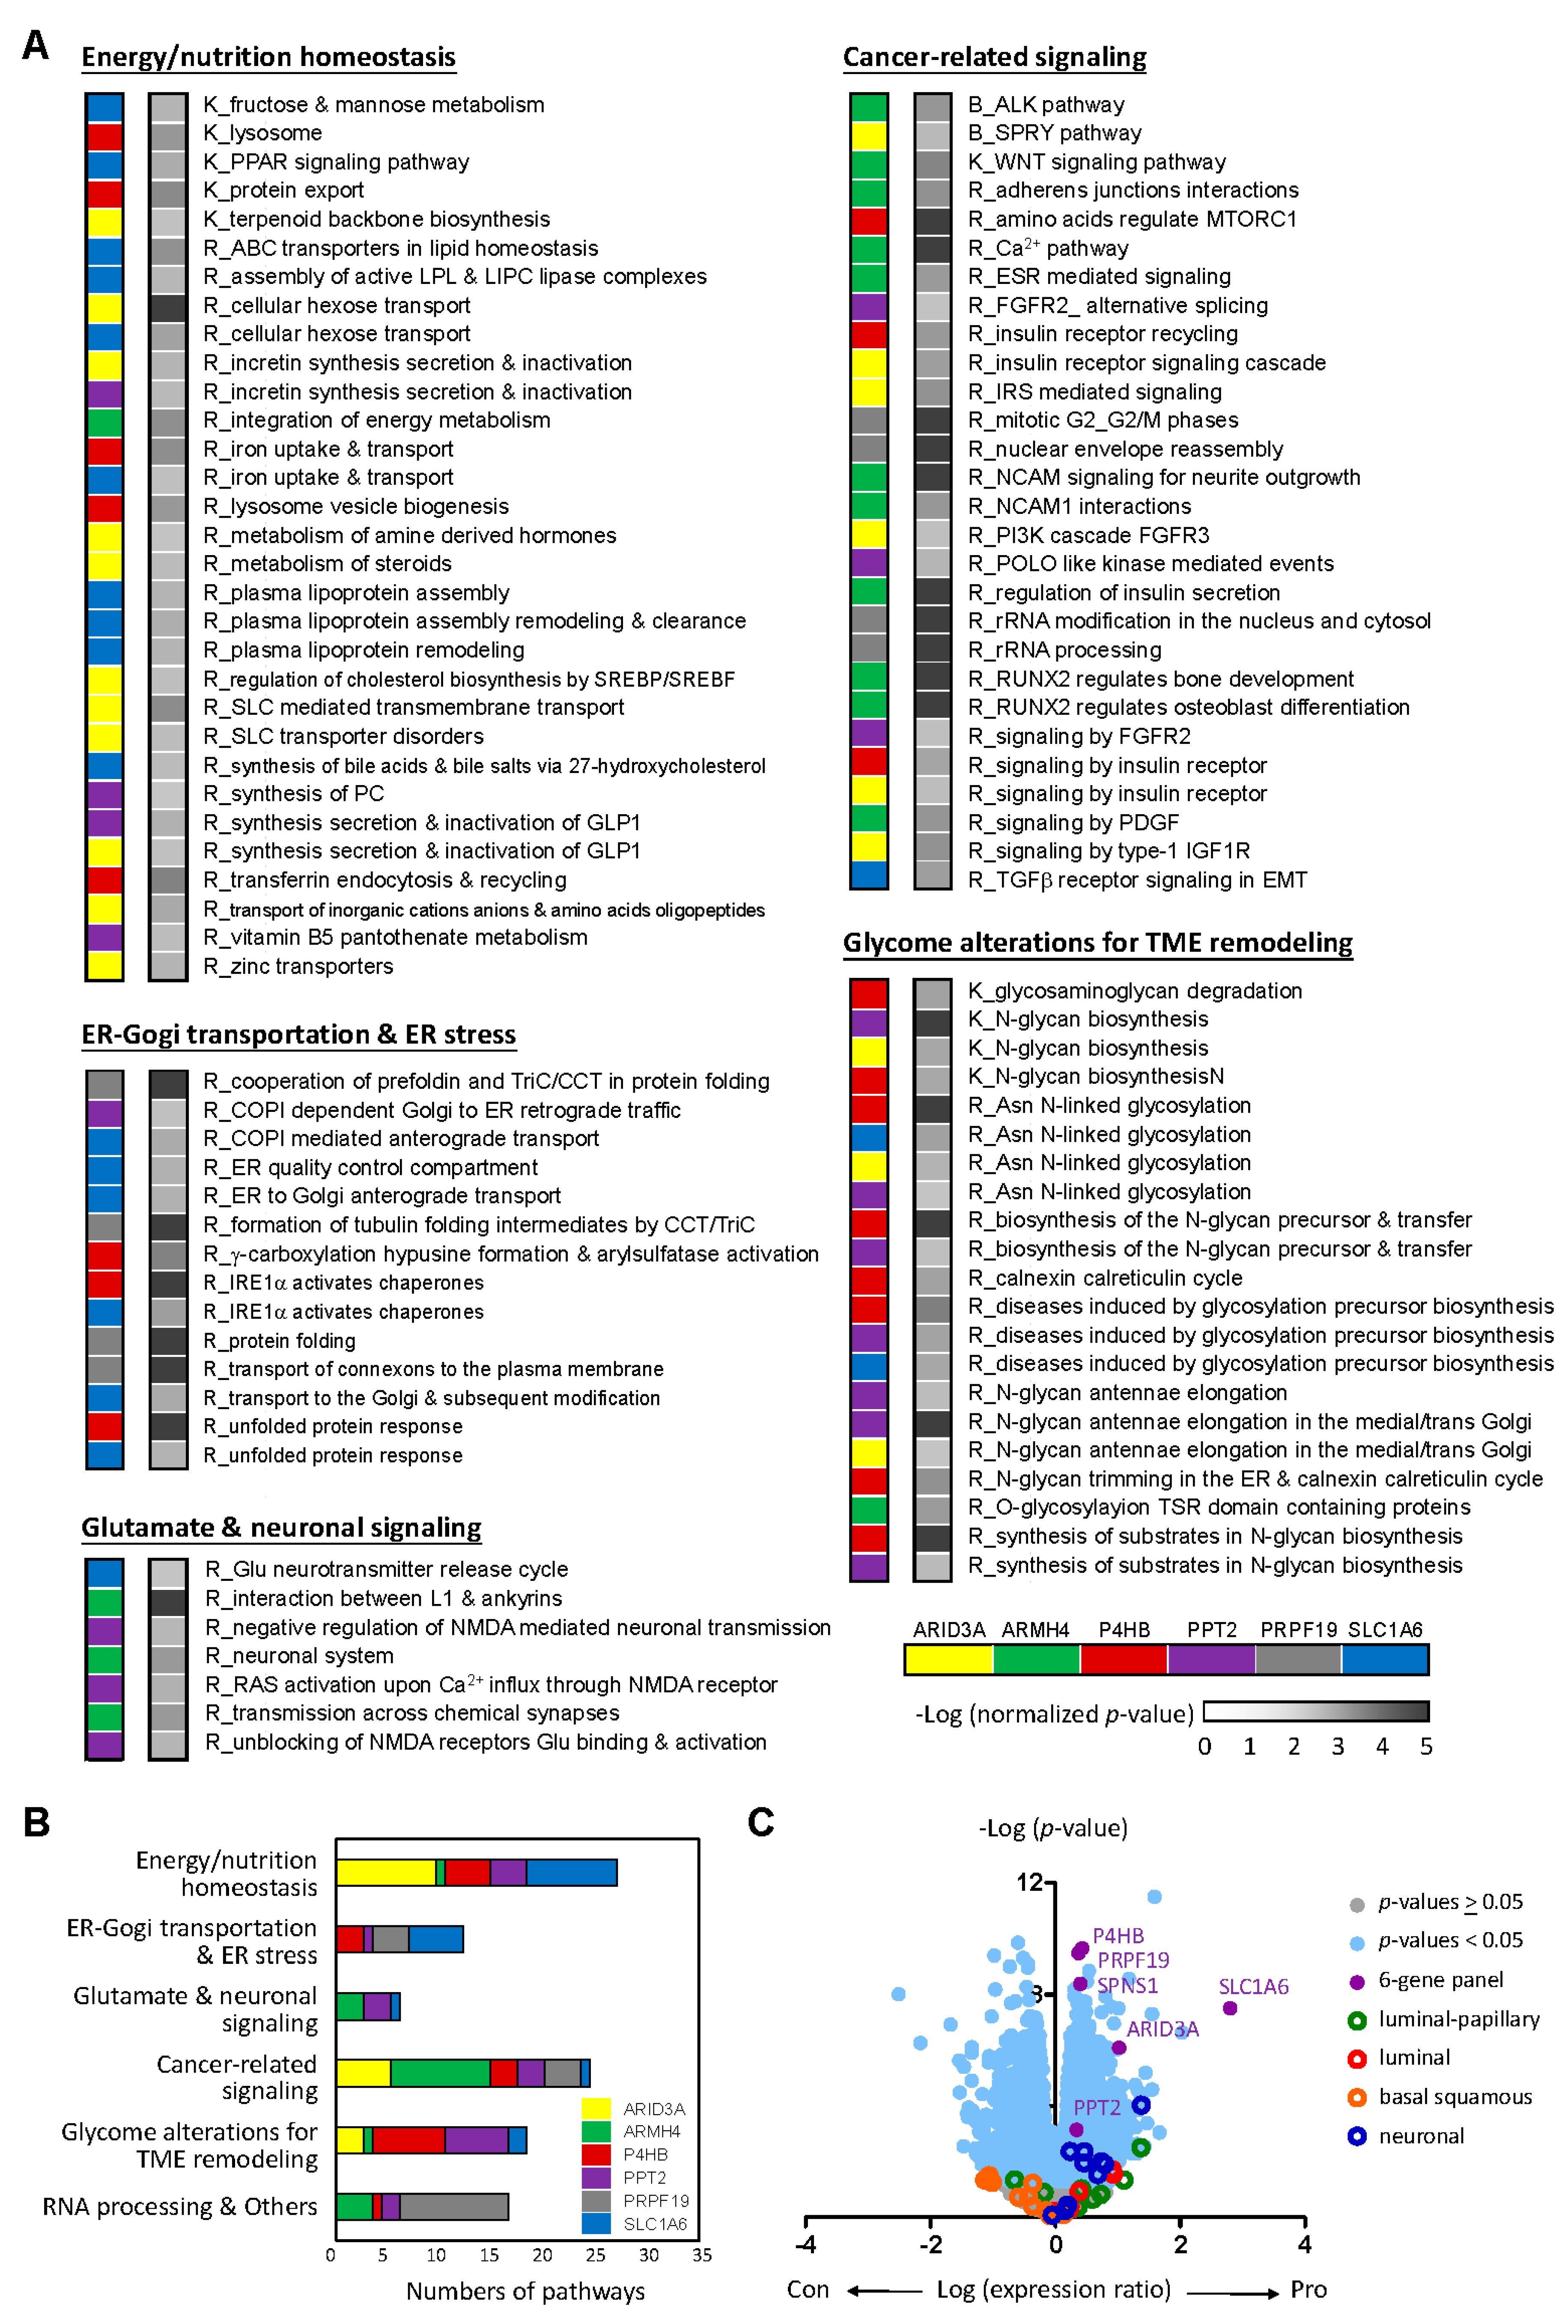
Figure 5.
PPT2 serves as an idea target for treating patients with aggressive MIBC. (A) Gene-dependent cell vulnerabilities were performed by comparing the gene effect scores after Crispr-Cas9 gene knockout with gene expression levels of selected biomarkers in 38 BLCA CCLE cell lines. High-content drug screening was performed to define potential compounds that show differential sensitivity to BLCA CCLE cell lines based on the gene expression levels of selected biomarkers by using (B) area under curve (AUC) and (C) IC50. (D) The association plots between the gene expression levels of PPT2 and CCL7 or CCR3 in MIBCs. (E) The association plots between the gene expression levels of PPT2 and tubulin genes in MIBCs, including TUBB2A, TUBB3, TUBB4B and TUBB6. Pearson coefficient (r) was used to measure the linear correlation between two genes in (D) and (E).
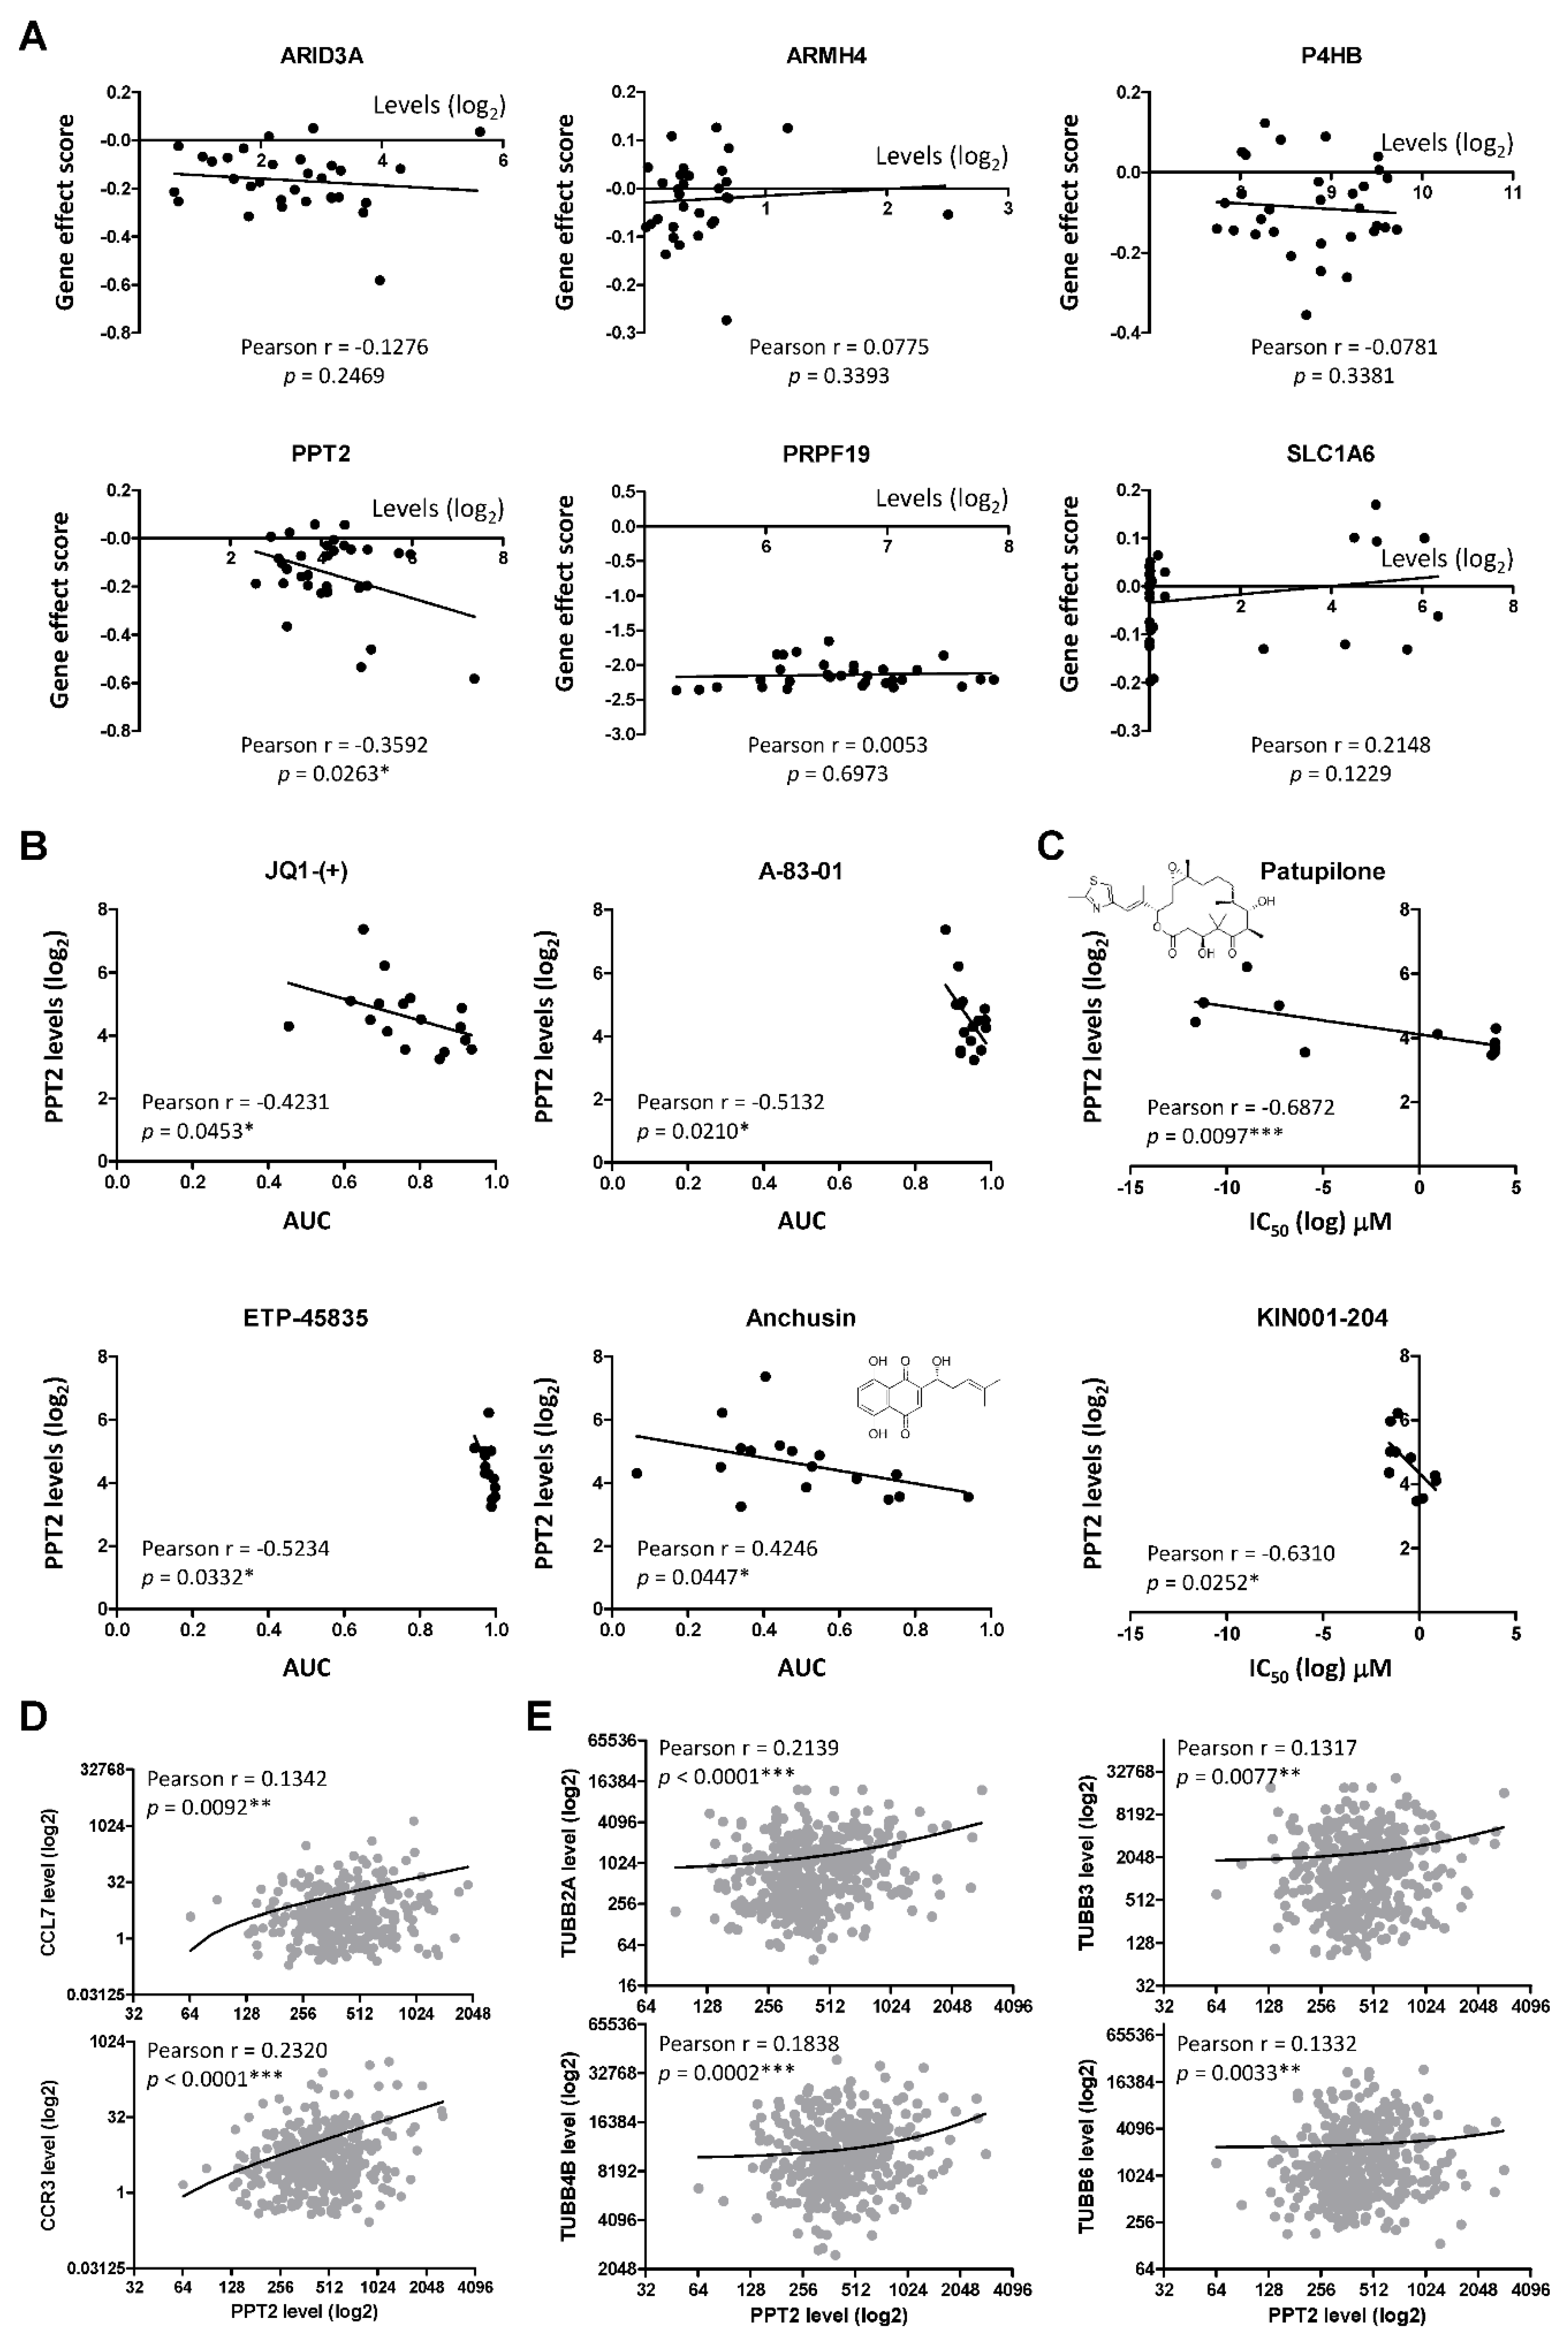
Figure 6.
PRPF19 serves as an idea target for treating patients with aggressive MIBC. (A) Gene effect scores of selected biomarkers in BLCA CCLE cell lines were plotted and compared. PRPF19 was identified as essential for cell survival due to its averaged dependency score less than -1.0. (B) PRPF18 forms a compact interactome with genes involved in the core complex of the spliceosome, PRPF19 complex (left). Gene effect scores of genes involved in PRPF19 complex in BLCA CCLE cell lines were plotted and compared (right). (C) Gene expression levels of genes involved in PRPF19 complex were compared between MIBCs and the normal counterparts by using data from GEPIA2 (http://gepia2.cancer-pku.cn/#index). Statistical differences between two groups were estimated by independent sample t-test. (D) The genetic content of PRPF19 in MIBC was compared with its gene expression levels in TCGA cohort. (E) The selective dependency of genes co-upregulated with PRPF19 overexpression (Supplementary Table S8) was analyzed by comparing their gene effect scores with PRPF19 expression levels in BLCA CCLE cell lines. A correlation plot with a Pearson coefficient (r) less than -0.3 and a p-value less than 0,05 was considered as positive for PRPF19 dependency. (F) The association between PRPF19 and POLA2 expression was analyzed by dot plot. (G) The genetic content of POLA2 in MIBC was compared with its gene expression levels in TCGA cohort. (H) Kaplan–Meier survival analysis was performed to study the difference in survivals between MIBC patients with POLA2 high (z-score > 2.0) and patients with POLA2 low (z-score < 2.0) in TCGA cohort. One-way ANOVA was utilized to measure the statistical difference among different groups in (D) and (G).
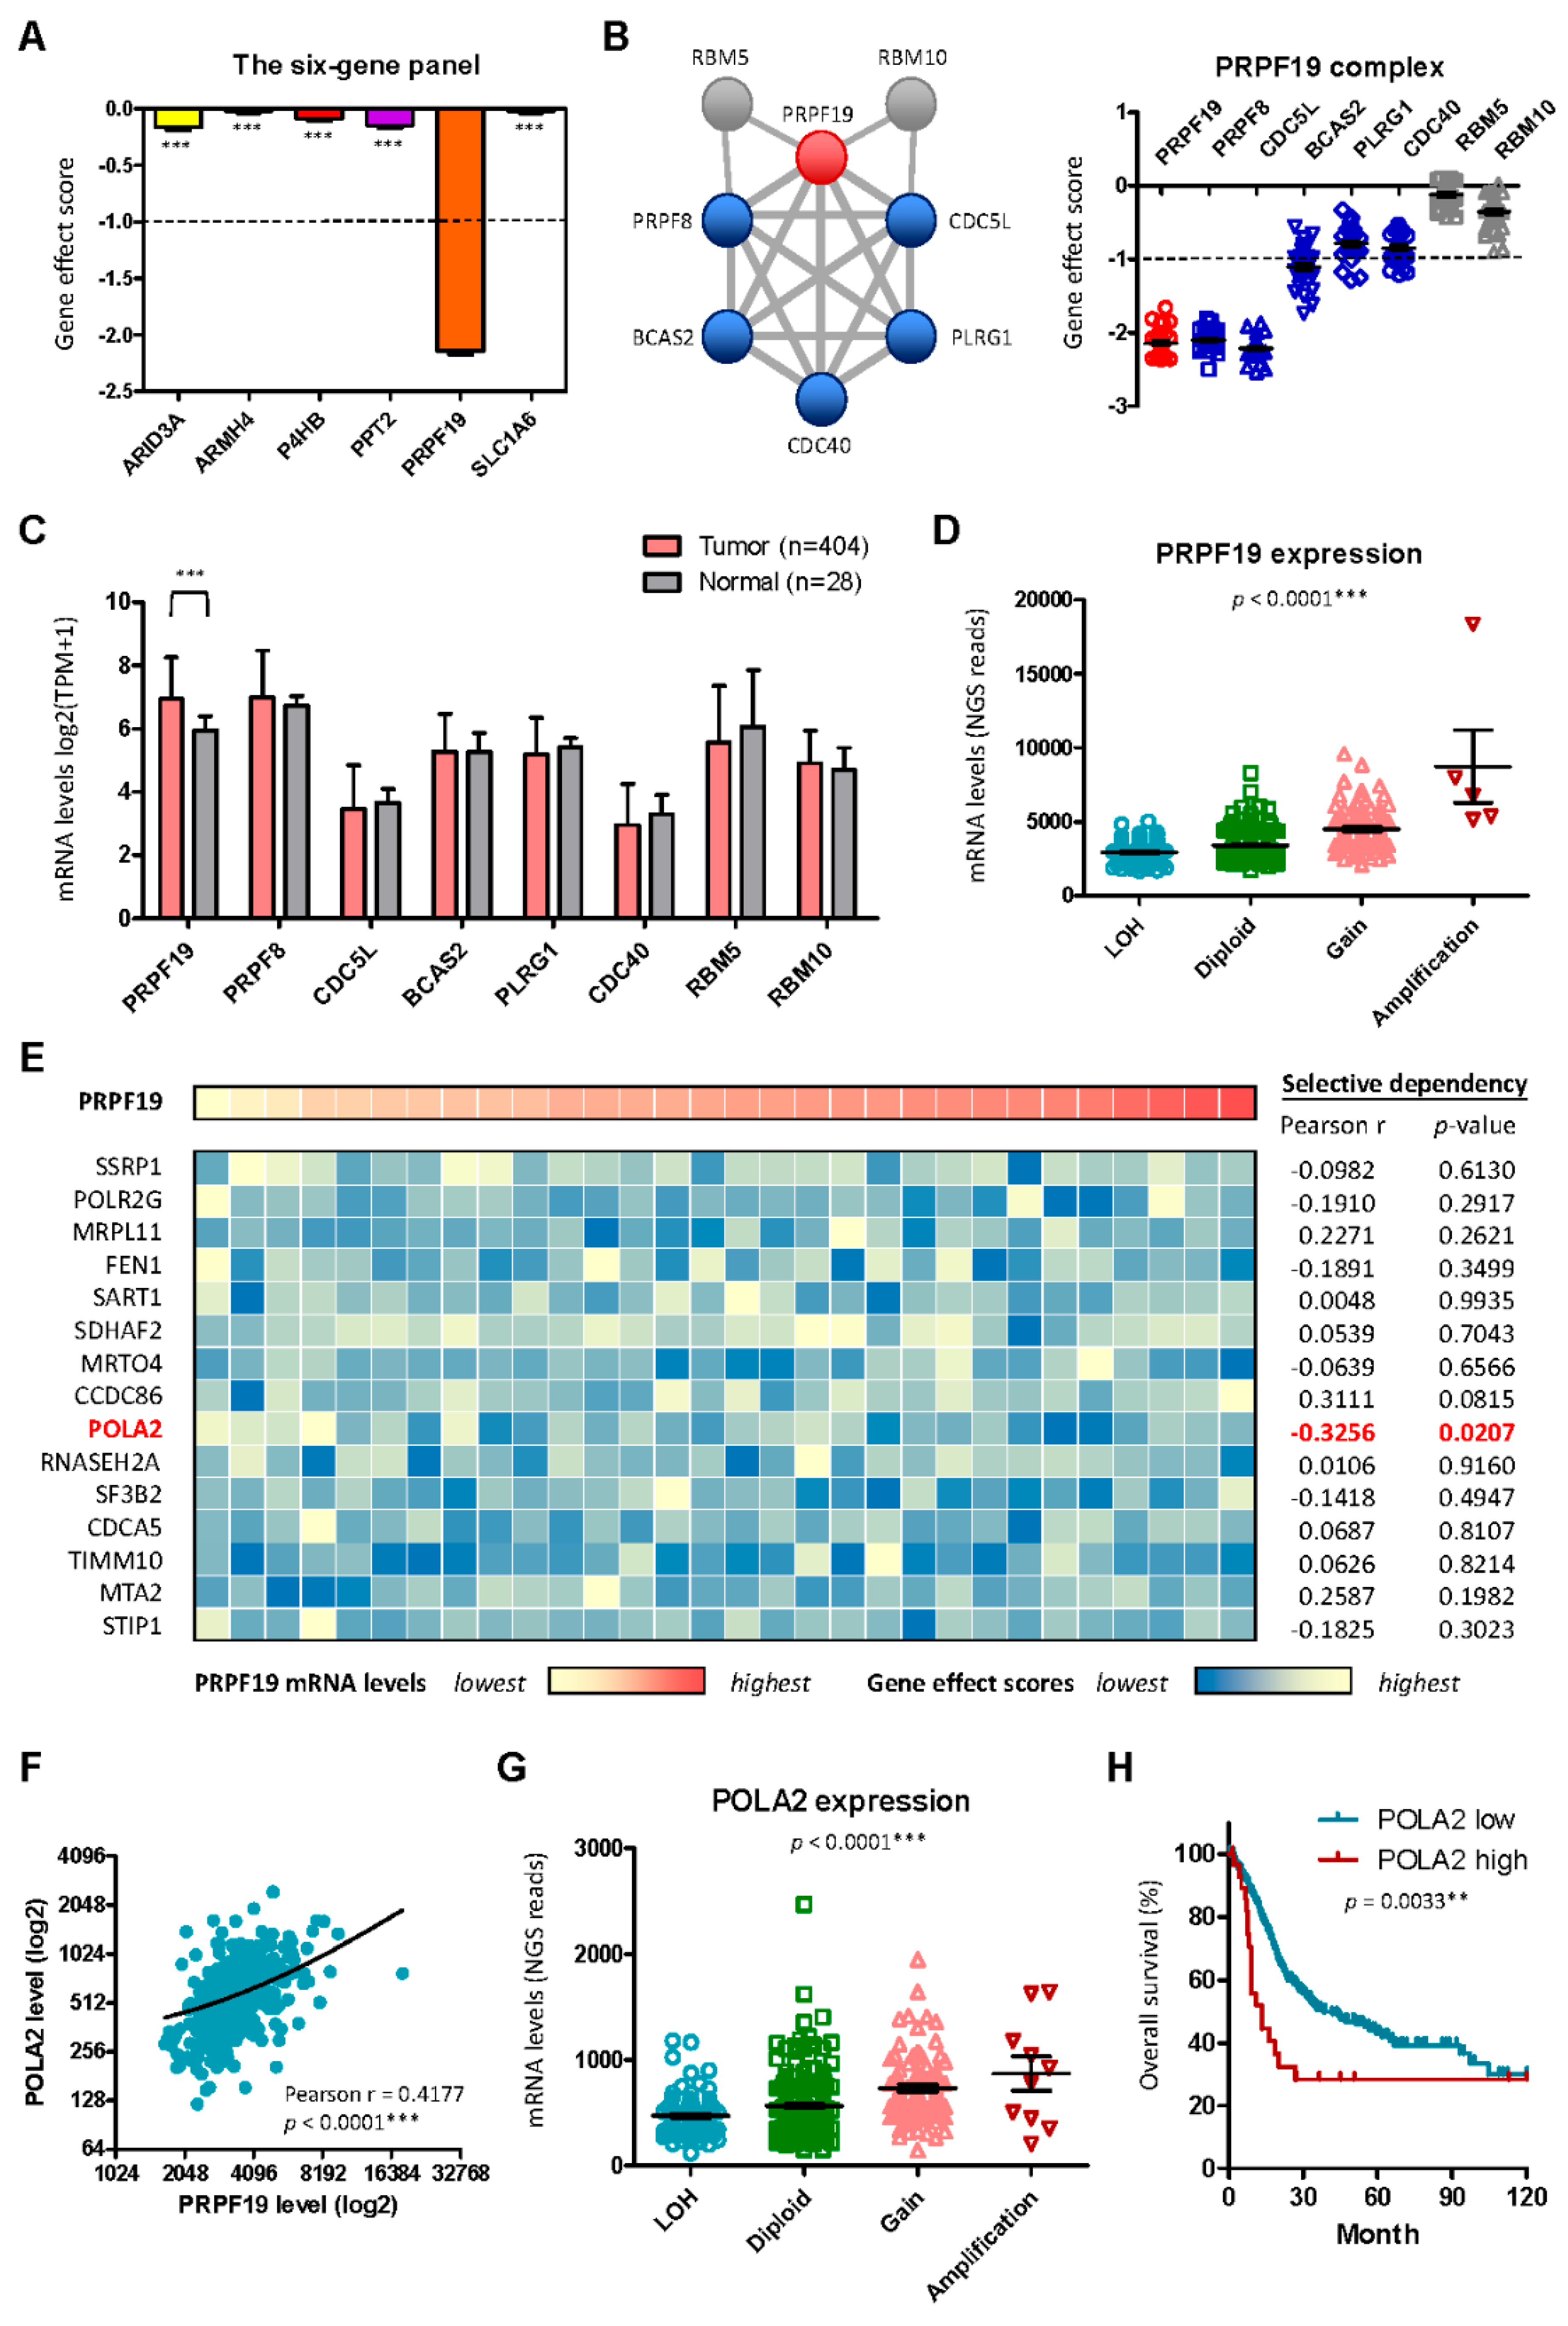
Figure 7.
Key complexes that determine cancer cell vulnerability and the anti-PRPF19 therapy for treating MIBC. (A) Genes with gene effect scores less than 2.0 in BLCA CCLE cell lines were filtered out and the interactome map was generated by using STRING (https://string-db.org/). Five major complexes contributing to ribosome, spliceosome, cell cycle, proteasome, and DNA replication were revealed with q-values less than 0.05. (B) Anti-PRPF19 compounds were screened out by using PRISM drug databank (https://depmap.org/repurposing) through mechanism-of-action matching strategy. The matching association was analyzed by 2 x 2 chi-square by using the defined cutoff points (see the Material and Method section).
Disclaimer/Publisher’s Note: The statements, opinions and data contained in all publications are solely those of the individual author(s) and contributor(s) and not of MDPI and/or the editor(s). MDPI and/or the editor(s) disclaim responsibility for any injury to people or property resulting from any ideas, methods, instructions or products referred to in the content. |
© 2025 by the authors. Licensee MDPI, Basel, Switzerland. This article is an open access article distributed under the terms and conditions of the Creative Commons Attribution (CC BY) license (http://creativecommons.org/licenses/by/4.0/).
Copyright: This open access article is published under a Creative Commons CC BY 4.0 license, which permit the free download, distribution, and reuse, provided that the author and preprint are cited in any reuse.


