
Submitted:
15 October 2025
Posted:
16 October 2025
You are already at the latest version
Abstract
Hypoglycin A is a plant-derived protoxin that causes atypical myopathy in equids. Its toxic metabolites have been well characterised, but the potential contribution of the gut microbiota in its transformation remains unresolved. In atypical myopa-thy-affected-horses, metabolomic and microbiome studies have reported alterations in metabolic markers and faecal microbiota composition, pointing to a potential disruption of microbial homeostasis. However, in vivo observations are strongly confounded by host-related factors, underscoring the need for controlled in vitro approaches. To address this, we used a static batch fermentation model simulating the equine colon to investigate the direct effects of hypoglycin A on microbiota composition and activity. Faecal inocula from healthy horses were incubated in control and hypoglycin A-treated fermenters for 48 h, with serial analyses of hypoglycin A concentration, short-chain fatty acids, and 16S rRNA gene profiles. Results showed significant microbial-associated hypoglycin A degradation without evidence of toxic metabolite formation. Analysis of α- and β-diversity revealed effects of both incubation time and hypoglycin A exposure, with specific taxa such as Paraclostridium affected. This study provides the first in vitro evidence that the equine microbiota contributes to hypoglycin A degradation.
Keywords:
equine atypical myopathy
; microbiota
; intestinal microbiota
; horses
; equine
; hypoglycin A
; Methylenecyclopropylacetyl-carnitine
; MCPA-CoA
; 16S rRNA gene sequencing
; next generation sequencing
; NGS
; toxin
; poisoning
; in vitro batch fermentation
; short chain fatty acids
1. Introduction
Atypical myopathy (AM) is a commonly fatal pasture-associated intoxication of equids, that occurs predominantly during the autumn and spring in temperate European regions. The disease is strongly linked to ingestion of seeds or seedlings of the sycamore maple (Acer pseudoplatanus), which contain plant-derived protoxins [1].
The analysis of plant materials from the sycamore maple tree showed that seedlings [2] and seeds [3] contain hypoglycin A (HGA) as well as methylenecyclopropylglycine (MCPrG) in seeds which is another protoxin involved in AM [4,5]. Both MCPrG and HGA are non-proteinogenic amino acids sharing structural features with branched chain amino acids (BCAAs), which likely allows them to enter the same metabolic pathways [6,7].
Although both HGA and MCPrG are present in the sycamore maple tree, HGA is considerably more abundant in seeds [4,8] and is therefore considered as the principal toxic compound involved in AM cases. Moreover, HGA intoxication has been reported in humans and other animal species and consequently has been more extensively characterised in the literature [9,10,11,12,13,14,15,16].
Currently, the detection of HGA in blood is considered as evidence of exposure to the protoxin [17]. Indeed, not toxic per se [18], HGA is metabolised into the toxic compound methylenecyclopropylacetyl-Coenzyme A (MCPA-CoA) (Von Holt, 1966), which is responsible for the pathogenesis. The diagnosis of AM includes the detection of its conjugated metabolites (i.e., methylenecyclopropylacetic acid-carnitine (MCPA-carnitine) and -glycine(MCPA-glycine)) combined with severe alterations of the acylcarnitines profile in serum and urine of AM horses [17,20,21,22,23] resulting from inhibition of β-oxidation of fatty acids [24,25] and inhibition of isovaleryl-CoA-dehydrogenase [21,24,25].
The gut microbiota constitutes a complex microbial ecosystem capable of metabolising a wide range of substrates, including plant secondary metabolites and toxins [26,27,28]. Depending on the enzymatic pathways involved, microbial activity can lead either to detoxification, reducing the harmful potential of xenobiotics, or to bioactivation into more toxic derivatives. In this context, the structural properties of HGA, a non-proteinogenic amino acid, suggest that it could be susceptible to microbial transformation or degradation.
The potential role of the microbiota in HGA poisoning has been raised several times in animals. Renaud et al., (2022) hypothesised that ruminal transformation of HGA may occur, as herbivorous species with a fermentation chamber located proximally to the small intestine (i.e., the primary site of amino acid absorption in mammals) and with longer retention times appear less likely to suffer from sycamore poisoning [11]. Supporting this hypothesis, an in vitro study using sheep ruminal fluid reported a decrease in HGA concentrations after both incubation of pure HGA or sycamore maple seeds. However, this effect was also observed, though to a lesser extent, in autoclaved ruminal fluid, suggesting that at least part of the decrease was attributable to abiotic processes. Furthermore, the microbial markers used to assess community activity did not demonstrate significant differences [29]. Nevertheless, these markers may be insufficient to assess the microbiota [30].
In horses, which are hindgut fermenters, differences in faecal microbiota composition have been reported between AM-affected animals and healthy co-grazers [31,32]. In particular, an in vivo study comparing the faecal microbiota of AM-affected horses, co-grazers and a group of protoxin-free control horses revealed significant differences (1) in α-diversity, evenness, and β-diversity, and (2) in the relative abundance of several bacterial genera, especially Clostridia_ge, Bacteria_ge, Firmicutes_ge, and NK4A214_group (i.e., increased in intoxicated horses) and also Fibrobacter (i.e., increased in control horses) [32]. Metabolomic analyses further suggest disruption of microbial homeostasis in diseased animals [21]. All together, these findings reinforce the possible role of the gut microbiota in AM. Nonetheless, these in vivo studies are observational and subject to significant confounding by host factors such as diet, clinical condition, and environment [33,34].
Controlled in vitro approaches are therefore essential to dissociate host and microbial contributions. Batch fermentation models using equine faecal inocula are a well-established method to investigate microbial activity under defined conditions [35,36]. In the AM context, in vitro systems enable isolation and characterisation of microbial responses directly attributable to HGA exposure.
Previous studies and in vivo observations support the hypothesis that the equine gut microbiota may contribute to the fate of HGA, either through its degradation or by influencing its bioavailability. Although bioavailability cannot be assessed in a batch fermentation model, such systems allow investigation of both the fate of HGA and the activity of the microbiota. Given the robust biochemical evidence linking HGA exposure to equine AM, the present study focuses specifically on HGA as the primary protoxin of interest, while recognising that co-exposure to MCPrG may occur in the natural setting.
We therefore hypothesised that faecal microbial communities from healthy horses (i.e., clinically healthy horses with HGA and MCPA-carnitine blood levels below the detection limit of the quantification method and spending at least 6 h a day at pasture) would be capable of transforming HGA in vitro, resulting in measurable decreases in protoxin concentration without the production of known toxic metabolites, and that HGA exposure would be associated with specific changes in microbial diversity, potentially reflecting some of the trends observed in vivo in horses exposed to HGA.
Using a static batch fermentation system, the objectives of this study were (i) to investigate, under in vitro conditions free from host influence, the modifications in colonic bacterial populations induced by HGA exposure compared with unexposed controls, and (ii) to characterise the temporal dynamics of HGA concentration within the batch fermentation system.
2. Materials and Methods
2.1. Selection of Donor Horses and Sampling
The selected horses were clinically healthy horses, with normal general examination parameters that spent at least 6 h a day at pasture. Sampling occurred in spring 2022. Horses were considered as non-exposed horses as they had no detectable levels of HGA or MCPA-carnitine in their blood serum.
All procedures in this study adhered to both national and international guidelines on animal welfare. The Animal Ethics Committee of the University of Liege had confirmed that the sampling process was part of routine veterinary practice to establish a diagnosis. As a result, formal ethical approval was not required. Informed consent was obtained from horse owners prior to their inclusion in the study.
Blood samples were obtained via jugular venipuncture, aliquoted within one hour of collection, and stored at −80 °C until analysis. The quantification of blood HGA and MCPA-carnitine were performed using aTRAQ® kit for amino acid analysis of physiological fluids [37] and ultra-performance liquid chromatography combined with subsequent mass spectrometry (UPLC-MS/MS) [38] respectively. The lower limit of quantification (LOQ) associated was 0.090 μmol/L for HGA measurement [37] and, the limit of detection (LOD) was approximately 0.001 nmol/L for MCPA-carnitine measurement [38].
Faecal samples were collected directly from the rectum in anaerobic jars and anaerobiosis was ensured using AnaeroGenTM bags (Oxoid, Basingstoke, UK). The samples were transported in cooled conditions and stored at −80 °C until batch analysis. The pool of faeces was prepared by mixing equal proportions of samples from the two donors [39]. A phosphate buffer solution containing per litre: 8.8 g of K2HPO4, 6.8 g of KH2PO4 and 0.1 g of sodium thioglycolate was used to prepare a 20% w/v faecal homogenate. Mechanical homogenisation was achieved in a Stomacher VWR® Star-Blender LB400. Double-coated sterile stomacher bags (300 × 190 mm) were used to collect and filter the faecal suspensions.
2.2. Static In Vitro Batch Model Derived from SHIME® System
2.2.1. Determination of HGA Concentration in Batch System
An estimated maximum tolerated dose (MTD) of HGA in horses was determined thanks to a human equivalent dose (HED) of the MTD values for HGA of rats. The MTD of HGA in rats was determined with control diets over a 30-day period and the result was 1.50 ± 0.07 mg HGA/kg BW/day [40].
The human equivalent dose (HED) was determined as previously described with the following mathematical formula [41] with Km as a correction factor:
HED (mg/kg) = Animal dose (mg/kg) x (Animal Km/Human Km)
Then, the HED was used to find the equivalent for horses using the same formula, with the average height and weight of horses being 1.61 ± 0.073 m and 565.08 ± 69.81 kg respectively, and as previously described [42] to calculate Km.
The Km was calculated by dividing the average body weight (BW - kg) of species to its body surface area (BSA - m2) as followed [41]:
KM = BW (kg) / BSA (m2)
The BSA calculation is based on height and weight with the following mathematical formula [43]:
BSA (m2) = √ (Height (cm) x Weight (kg) / 3600)
Consequently, the estimated MTD of HGA in horses was 0.08 mg HGA/kg BW/day or 45.4 mg HGA/day with the same average weight used (i.e., 565.08 ± 69.81 kg) [42]. The digestive volume of the gastro-intestinal tract of an adult horse is around 200 L [44]: the concentration of HGA representing the MTD of HGA in horses’ digestive system is 227 ng HGA/mL. Considering the acute exposure context of our in vitro fermentation system (i.e., 48 h), a 2-fold increase in HGA concentration (i.e., 454 ng HGA/mL) was tested. This concentration of HGA (purity 85%, Toronto Research Chemicals, Canada) was used in the three HTF fermenters of the batch system.
2.2.3. Chemical Reagents and Consumable Materials
All consumable materials and nutritional media used were obtained from ProDigest company (Ghent, Belgium). The nutritional medium called “feed” used for simulation of the gastrointestinal environment contained per litre of distilled water: arabinogalactan (1.2 g), pectin (2.0 g), xylan (0.5 g), glucose (0.4 g), yeast extract (3.0 g), special peptone (1.0 g), mucin (3.0 g), L-cystein-HCl (0.5 g) and starch (4.0 g). The prepared feed was autoclaved (121 °C for 30 minutes, Tuttnauer®).
2.2.4. Static Batch Model
The batch model is a short-term in vitro fermentation that uses the SHIME® model to mimic the descending colon of the human intestinal tract [45,46]. For this study, the system was adapted to represent the descending colon in horses, maintaining a constant temperature of 38 °C and a pH range of 6.6-6.9 [44,47]. Indeed, the colon is the part of the digestive tract where most fermentation occurs in horses [47] and humans [48]. It is therefore the most appropriate environment in which to study the changes in the microbiota linked with the compounds ingested during feeding. Specifically, six double-jacketed fermenters were filled with 300 mL of feed and inoculated with the faecal homogenate (5% v/v). The fermenters were connected to a water bath that kept the system at a constant temperature. The pH was automatically controlled by adding either acid (0.5 M HCl) or base (0.5 M NaOH) as required to maintain values between 6.6 and 6.9. Anaerobic conditions were guaranteed by a N2 flush. Three fermenters served as “control fermenters” (CF) containing only the nutritional media and faecal inoculate while the other three additionally received a single addition of HGA (454 µg/L) and acted as “HGA-treated fermenters” (HTF). This configuration allowed to obtain triplicates results for each studied group. Samples were taken at different time points (see Appendix A), with the entire procedure being carried out over a period of 48 hours.
2.2.5. Sampling Procedure
Samples were obtained from each fermenters every 2 hours for the first 24 hours of the experiment, and every 6 hours thereafter until reaching 48 hours. Consequently, the sampling time points were T0, T2, T4, T6, T8, T10, T12, T14, T16, T18, T20, T22, T24, T30, T36, T42 and T48. An additional time point was included 10 minutes after the system start-up when HGA was added to the HTF vessels (T0*).
Several samples were taken for different analysis as shown in the Appendix A: HGA and MCPA-carnitine quantification, short-chain fatty acids (SCFAs) quantification and microbiota analysis. In practice, only a subset of samples was analysed to balance analytical depth and sample coverage.
2.3. Microbiota Assessment
2.3.1. Bacterial DNA Extraction and High-Throughput Sequencing
Total bacterial DNA was extracted from faecal samples using the PSP Spin Stool DNA Plus Kit 00310 (Invitek, Berlin, Germany), following the manufacturer’s instructions. PCR amplification of the 16S rDNA V1–V3 hypervariable region and library preparation were performed using the following primers with Illumina overhang adapters: forward (5′-GAGAGTTTGATYMTGGCTCAG-3′) and reverse (5′-ACCOGCOGGCTGCTGGCAC-3′).
PCR products were purified using the Agencourt AMPure XP bead kit (Beckman Coulter, Pasadena, CA, USA), followed by a second PCR round for indexing with Nextera XT index primers 1 and 2. After purification, amplicons were quantified with Quant-IT PicoGreen (ThermoFisher Scientific, Waltham, MA, USA) and diluted to 10 ng/μL.
Final quantification was conducted using the KAPA SYBR® FAST qPCR Kit (Kapa Biosystems, Wilmington, MA, USA) before normalisation, pooling, and sequencing on a MiSeq platform with V3 reagents (Illumina, San Diego, CA, USA). The sequencing run included commercial mock community positive controls containing DNA from 10 defined bacterial species (ATCC MSA-1000, ATCC, Manassas, VA, USA) as well as negative controls from the extraction and PCR steps [49].
Raw amplicon sequencing libraries were submitted to the NCBI database under bioproject number PRJNA1335877.
2.3.2. Sequence Analysis and 16S rDNA Profiling
Sequence read processing was performed as previously described [49] using the Mothur software package v1.48 [50] and the VSEARCH algorithm for chimera detection [51]. For operational taxonomic unit (OTU) generation, a clustering distance of 0.03 was used. 16S reference alignment and taxonomical assignment, from phylum to genus, were performed with mothur and were based upon the SILVA database (v1.38.1) of full-length 16S rDNA sequences [52].
2.3.3. Microbiota Statistical Analysis
Subsampled datasets with 10,000 cleaned reads per sample were obtained and used to evaluate α-diversity (i.e., measuring diversity within the community) and β-diversity (i.e., measuring diversity between communities or within the same community at different time points by considering sequence abundances or by considering only the presence–absence of sequences) using a vegan package (v 2.6-6.1) [53,54,55].
Indicators of α-diversity computed are the reciprocal Simpson microbial diversity index, Chao richness index (i.e., richness which quantifies the number of species present within a community), and Simpson-derived evenness index (i.e., evenness which describes how uniformly individuals are distributed among the species, highlighting the presence or dominance of certain species) [54,55,56]. Normality and lognormality tests (D’Agostino & Pearson, Anderson-Darling, Shapiro-Wilk and Kolmogorov-Smirnov tests) were performed. Differences in α-diversity between groups (CF vs. HTF) were evaluated with an ANOVA test followed by paired post hoc tests corrected with a two-stage linear step-up procedure of Benjamini, Krieger and Yekutieli using PRISM 10 (GraphPad Software; San Diego, CA, USA), and were considered significant for a p and q-value of 0.05 or less. As no treatment (i.e., addition of HGA) was applied at T0: this time point was excluded of the α-diversity analysis.
The β-diversity was analysed using vegan and vegan3d packages (v 1.3-0) in R [57]. A principal coordinate ordination analysis (PCoA) based on Bray–Curtis dissimilarity matrix was used to visualised samples in β-diversity analysis. Differences between groups were assessed with a PERMANOVA (Adonis2) and post hoc pairwise comparisons (pairwise adonis package v 0.4.1) [58] with a significance threshold p of 0.05. These analyses were conducted both on the complete dataset and after T0 exclusion. A distance-based redundancy analysis (dbRDA) was further applied as a constrained ordination model to assess the effect of the variables Time and Treatment on the β-diversity. This step of the statistical analysis was also realised without the T0. The significance of the model and axes were assessed with ANOVA.
Finally, a differential abundance analysis was performed using the Deseq2 package in R (v1.44.0) to examine statistically significant changes in microbial abundance between treatments and across time points. This step was also carried out after excluding T0.
2.4. Quantification of Short Chain Fatty Acids and Statistical Analysis
A previously validated method of solid-phase microextraction (SPME) followed by gas chromatography coupled to mass spectrometry (GC–MS) [59] was used to quantify simultaneously the SCFAs produced in each fermenter at T0, T12, T24, T36 et T48. The analytical technique has the following lower and upper limits of quantification (LLOQ and ULOQ, respectively): acetic acid (C2): 2.00 – 99.90 mmol/L, propionic acid (C3): 0.97 – 48.60 mmol/L, butyric acid (C4): 0.57 - 28.37 mmol/L, isobutyric acid (iC4): 0.16 - 7.94 mmol/L, isovaleric acid (iC5): 0.10 - 4.90 mmol/L, valeric acid (C5): 0.29 - 14.69 mmol/L, caproic acid (C6): 0.0086 - 0.43 mmol/L, heptanoic acid (C7): 0.008 – 0.04 mmol/L and octanoic acid (C8): 0.0007 – 0.03 mmol/L.
The proportion of each SCFA as the percentage of the total of SCFAs was calculated. The statistical analyses of SCFAs concentration were performed using GraphPad Prism 10 (GraphPad Software; San Diego, CA, USA) with a p threshold value of 0.05. The values which were under the LLOQ of the methods, were replaced by the value of the LLOQ for the statistical analysis. The D’Agostino & Pearson, Anderson-Darling, Shapiro-Wilk and Kolmogorov-Smirnov tests were used to assess the normality or lognormality of the data distribution. A two-way ANOVA was performed for each SCFA with a Greenhouse-Geisser correction followed by a multiple comparison test with a Tukey correction of Tukey.
2.5. Quantification of Hypoglycin A and Statistical Analysis
Hypoglycin A concentrations were quantified using liquid chromatography coupled with mass spectrometry, without derivatisation, as previously described by González-Medina et al. (2021) [60]. The LOD of this method is 0.055 ng/mL. Statistical analyses of HGA concentrations were conducted using GraphPad Prism 10 (GraphPad Software, San Diego, CA, USA), with a significance threshold set at p < 0.05.
2.5.1. Preliminary Assessment of Hypoglycin A Stability in the Nutritional Medium
To evaluate possible degradation of HGA, two additional fermenters containing 300 mL of autoclaved nutritional medium were prepared and HGA was added (i.e., 150 µg HGA/L). The temperature (i.e., 38 °C) was maintained by a water bath. The pH was controlled before each sampling and adjusted manually if needed by the addition of 0.5 M NaOH or 0.5 M HCl. For this parallel experience, sampling points were: T0*, T6, T12, T20 and, T24. These fermenters are designed as “nutritional medium fermenters” or NMF.
2.5.2. Hypoglycin A Stability in the Nutritional Medium: Data Analysis
Normality and lognormality tests (D’Agostino & Pearson, Anderson-Darling, Shapiro-Wilk and Kolmogorov-Smirnov tests) were performed. An ANOVA with a Greenhouse-Geisser correction was made followed by a multiple comparisons test which compared the mean of concentration of HGA of each time point to the T0* considered as “the control time point” with a correction of False Discovery Rate (FDR) of Benjamini, Krieger and Yekutieli (q = 0.05).
2.5.3. Hypoglycin A Concentration in the Batch Fermenters: Data Analysis
Changes in HGA concentration over time (T0, T12, T24, T36) was analysed within the CF. Normality and lognormality were assessed using the D’Agostino & Pearson, Anderson-Darling, Shapiro-Wilk, and Kolmogorov-Smirnov tests. Data were log-transformed when required to meet distribution assumptions. A repeated measures one-way ANOVA was then performed, applying the Greenhouse-Geisser correction. Multiple comparisons were first carried out using Dunnett’s test to compare each time point to the baseline (T0). When statistically significant differences were detected, additional pairwise comparisons were performed using Tukey’s correction to assess differences between all the time points.
The same statistical approach was subsequently applied to the HTF, analysing HGA concentrations at T0, T0*, T2, T4, T6, T12, T16, T20, T24, T36, and T48. However, the one-way ANOVA was replaced by a Mixed-effects analysis as one data was missing at T6.
Finally, a two-way ANOVA was performed to compare both groups (CF vs. HTF) at the time points common for both group (T0, T0*, T12, T24, and T36) and a multiple comparison test with Tukey’s correction was applied. The values at T0* for the CF were supposed to be the same than values at T0: this made analysis between the two groups possible (CF vs. HTF).
2.5.4. Normalised HGA Degradation Kinetics
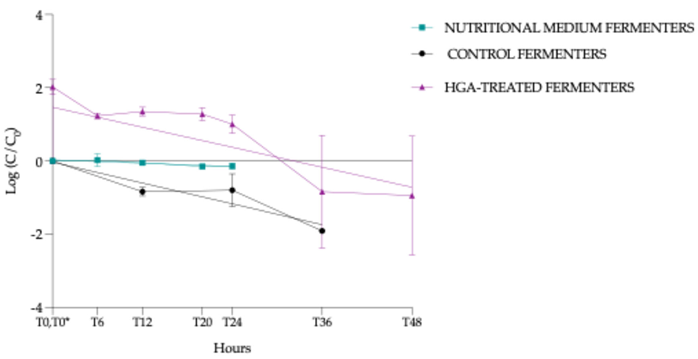
Hypoglycin A concentrations in each fermenter were normalised to their initial value at T0 (or T0*) (C/C0) and log transformed. Linear regression of log (C/C0 or C0*) versus was then used to estimate the apparent first-order degradation rate (slope, −k). Comparisons of slopes between groups (NMF, CT and HTF) were performed to assess whether the rate of HGA degradation differed significantly.
2.6. Quantification of Methylenecyclopropylacetyl-Carnitine
An ultra-performance liquid chromatography combined with subsequent tandem mass spectrometry (UPLC-MS/MS) was used for MCPA-carnitine quantification, as previously described [38]. The LOD is 0.01 nmol/L. The MCPA-carnitine was quantified only in HTF.
3. Results
3.1. Donor Horses
Two horses were involved in the study.
Horse 1: The horse was an 8-years old Zangersheide female with a 5/9 body-score. The horse lived at pasture for more than 6 hours a day and received hay (12 kg/1 time a day). The horse had access to salt block. The horse is a leisure horse and was riding 3 times/week for 1 hour session each time.
Horse 2: The horse was a 3-years old Haflinger and Spanish breed crossed female with a 5/9 body-score. The horse lived at pasture for more than 6 hours a day and received ad libitum hay. The horse had access to salt block. The horse is a leisure horse.
3.2. Microbiota Statistical Analysis
3.2.1. Composition of Microbiota
Starting with 2,760,444 raw reads, 2,050,624 reads were kept after read cleaning and chimera removal. We proceeded with 10,000 reads per sample to taxonomic identification, leading to a table of 3,489 OTUs. The determination of α- and β-diversities of the bacterial populations were assessed at the genus level.
3.2.2. α-Diversity Analysis
The α-diversity indexes (i.e., richness, diversity and evenness) were compared between treatment groups (Treatment effect) and within group (Time effect). Concerning the Reciprocal Simpson Index (i.e., diversity), significant differences were found between T12 vs. T48 (q = 0.0500, *) and T24 vs. T48 (q = 0.0265, *) for both groups. A significant effect of Time was also observed (p = 0.0052, **). The richness (i.e., Chao1 richness Index) was significantly different between T12 vs. T48 (q = 0.0039, **) and T24 vs. T48 (q = 0.0159, *) in the CF. The analysis of the source of variation was significant for the parameter “Treatment” (p = 0.0371, *). The evenness (i.e., Simpson Evenness Index) was significantly different between T12 vs. T48 (q = 0.0143, *) in the HTF and between CF vs. HTF at T12 (q = 0.0200, *) (Figure 1).
3.2.3. β-Diversity Analysis
A first PERMANOVA β-diversity analysis was applied with a model including the interaction (Time × Treatment), which allowed to detect a significant effect of both factors as well as their interaction (p = 0.001, ***), explaining 66.8% of the variance (R2 = 0.6681). The analysis of a PCOA model including the T0 samples shows that this group was skewing the model (Figure 2).
To further investigate the effects of the experimental factors independently from baseline, a second PCoA model was constructed after excluding T0 samples (Figure 3).
PERMANOVA analysis performed to assess the full model (i.e., including the effects of Time, Treatment, and their interaction “Time x Treatment”) revealed a significant global effect (p = 0.014, *) explaining 33.6% of the total variance in microbial community structure. The factor Time alone explained 26.2% of the total variance and had a significant impact on β-diversity (p = 0.001, ***), whereas Treatment explained only 6.6% of the variance and was not significant. Further analysis using a permutation design ensuring that each time point was assessed for Treatment effects separately (i.e., stratified by Time) showed no significant impact of Treatment on β-diversity (p = 0.264). Consistent with these results, pairwise comparisons for Time factor are shown in Table 1.
The influence of Treatment and of Time (as a numeric factor) was further highlighted with a dbRDA constrained ordination model (Figure 4). Axis significance of the model was obtained only for dbRDA1 axis (p = 0.002, **) as well as for the Time factor (p = 0.002, **).
3.2.4. Differences in Microbiota Composition Between Groups
Differences in microbial population abundance were assessed between CF vs. HTF with Deseq2. The analysis revealed a significant higher abundance of Paraclostridium genus in CF group compared to HTF (p = 2.5136E-10, ***) (Figure 5). Pairwise comparisons between Treatment group for each sampling time highlight several genera as shown in volcano plots (Figure 5).
3.3. Quantification of Short Chain Fatty Acids and Statistical Analysis
The proportion of acetate, propionate and butyrate was 85 ± 13.7%, 16 ± 5.8% and 8 ± 2.1% respectively in CF and 79 ± 14.4%, 19 ± 9.4% and 10 ± 4.1% in HTF, respectively, and all time combined.
Two-way ANOVA analysis of SCFAs all time combined revealed a significant effect of “SCFAs” (p = <0.0001, ****) and Treatment (p = 0.0207, *)
Two-way ANOVA analysis of acetate concentrations revealed a significant effect of Time (p = 0.0002, ***). Post hoc comparisons showed significant differences: (1) in the CF, between T0 and T36 (p = 0.0279, *) and between T0 and T48 (p = 0.0178, *); (2) in the HTF, between T0 and T12 (p = 0.0294, *), T0 and T24 (p = 0.0099, **), and T0 and T36 (p = 0.0241, *).
Two-way ANOVA analysis of propionate concentrations indicated a significant effect of Time (p = 0.0016, **). Post hoc comparisons showed significant differences in the HTF, between T0 and T36 (p = 0.0090, **), T0 and T48 (p = 0.0050, **), T12 and T36 (p = 0.0090, **) and between T12 and T48 (p = 0.0050, **).Two-way ANOVA analysis of butyrate concentrations presented a significant effect of Time (p = 0.0038, **) and Fermenter (p = 0.0241, *). Post hoc comparisons showed a significant difference in the CF between T0 and T48 (p = 0.0300, *) (Figure 6).
3.4. Quantification of Hypoglycin A and Statistical Analysis
3.4.1. Stability of Hypoglycin A in the Nutritional Medium and Statistical Analysis
No statistical difference was found at the sampling time points, indicating that HGA remains stable in the autoclaved nutritional medium when the pH and temperature are kept constant.
3.4.2. Hypoglycin A Concentration Within the Control Fermenters
A repeated measures one-way ANOVA was performed with the Dunnett or the Tukey correction. The multiple comparison test with the Dunnett correction was applied to compare each time point to the control reference (i.e., T0) and revealed a significant difference between T0 and T12 (p = 0.0128, *) and between T0 and T36 (p = 0.0001, ***). The multiple comparison test with the Tukey correction was applied to identify specific time points that differed significantly from others. This second test revealed significant differences between T0 vs. T12 (p = 0.0167, *) and T36 (p = <0.0001, ****) but also between T12 vs. T36 (p = 0.0095, **) (Figure 7)
3.4.3. Hypoglycin A Concentration Within the Hypoglycin A-Treated Fermenters
Considering T0 as the reference time, the multiple comparison test with the Dunnett’s correction revealed that T0 was significantly different from T0* (p = 0.0110, *), T2 (p = 0.0207, *), T4 (p = 0.0418, *), T12 (p = 0.0085, **), T16 (p = 0.0143, *) and T20 (p = 0.0196, *).
Considering T0* (i.e., after adding HGA) as the reference time, the multiple comparison test with the Dunnett’s correction revealed that T0* was significantly different from T0 (p = 0.0110, *), T2 (p = 0.0087, **), T4 (p = 0.0002, ***), T6 (p = 0.0189, **), T16 (p = 0.0078, **), and T20 (p = 0.0043, **) (Figure 9)
The Tukey multiple comparison test identified significant differences between all the time points without using a reference time: T0 vs. T0* (p = 0.0176, *), T0 vs. T2 (p = 0.0341, *), T0 vs. T12 (p = 0.0142, *), T0 vs. T16 (p = 0.0232, *), T0 vs. T20 (p = 0.0322, *), T0* vs. T2 (p = 0.0145, *), T0* vs. T4 (p = < 0.0001, ****), T0* vs. T6 (p = 0.0036, **), T0* vs. T16 (p = 0.0134, *), T0* vs. T20 (p = 0.0089, **), and T4 vs. T20 (p = 0.0424, *). Tukey test results are presented to emphasize significant differences between time points that were not identified by the Dunnett test (Figure 8).
3.4.4. Hypoglycin A Concentration Comparison Between “Control Fermenters” and “Hypoglycin A-Treated Fermenters”
The two-way ANOVA on log-transformed data revealed a significant effect of Time (p = <0.0091, **) and Treatment (p = 0.0056, **). Moreover, the source of variation is explained by Time for 40.38%, by Treatment for 33.85%, by the interaction of “Time x Treatment” for 10.92% and, finally, by the factor Fermenter for 4.62%.
Moreover, the Tukey’s multiple comparison test revealed that (1) the HGA concentration was significatively different between CF and HTF at T0* (p = <0.0001, ****), T12 (p = <0.0001, ****), and T24 (p = 0.0067, **), (2) within the CF, the significant differences were T0 vs. T12 (p = 0.0204, *) T0 vs. T36 (p = <0.0001, ****) and T12 vs. T36 (p = 0.0117,*) and (3) within the HTF, the significant differences were T0 vs. T0* (p = 0.0110, *), T0 vs. T12 (p = 0.0087, **) and T0* vs. T12 (p = 0.0499, *) (Figure 9).
3.4.5. Normalised HGA Degradation Kinetics
After log-transformation and normalisation of HGA concentrations (log(C/C0)), linear regression analysis revealed a negative slope significantly different from zero for all groups (i.e., a significant decrease of HGA)
- (i)
- NMF: slope - 0.00749 (95% confidence interval (Cl) = -0.013 à -0.0020, p = 0.0111, *)
- (ii)
- CF: slope -0.0474 (95% Cl = -0.063 à -0.0315, p < 0.0001, ***)
- (iii)
- HTF: slope -0.0455 (95% Cl= -0.073 à -0.0181, p = 0.0024, **)
The corresponding half-life values (i.e., 1/slope) were 133.5, 21.08 and 21.96 for NMF, CF and HTF, respectively. This indicates a very slow kinetic in NMF, consistent with the stability of HGA, and a comparable rapid disappearance in CF and HTF. However, comparison of slopes revealed no significant differences among fermenters (F = 1.41, p = 0.25), supporting the use of a pooled slope (–0.0413) to describe the overall decay rate. The regression model provided a strong fit for CF (R2 = 0.82), while greater variability was observed in NMF and HTF (R2 = 0.40 and 0.36, respectively) (Figure 10).
3.5. Quantification of Methylenecyclopropylacetyl-Carnitine and Statistical Analysis
The results of MCPA-carnitine quantification in HTF were <LOD (i.e., 0.001 nmol/L) at T0, T2, T6 and, T10: consequently, no further analyses were performed.
4. Discussion
This study represents the first in vitro investigation of the equine colonic microbiota conducted under conditions that exclude any host–microbiota interactions, providing a controlled system to explore microbial mechanisms potentially relevant to equine AM. First, this model reveals differences in colonic bacterial populations between HGA-exposed and non-exposed conditions. Second, the study demonstrates that the protoxin HGA is specifically degraded by the descending colon microbiota of horses, as HGA remains stable in the sterile nutritive medium, without any detectable production of the toxic metabolite MCPA-carnitine.
The α-diversity analysis revealed significant differences in bacterial community diversity, richness, and evenness over the course of the experiment, indicating both a change in the number of taxa and in how they were distributed within the community. In both groups, diversity increased at T48 compared to earlier time points, reflecting a more diversified community. This trend was supported by the significant effect of the factor Time of the ANOVA analysis and was consistent with the intrinsic functioning of the in vitro batch technique. The increase in diversity in the CF group was partially explained by a significant rise in richness (i.e., number of detected taxonomic groups), whereas in the HTF group, the higher Simpson index suggested a less even community, possibly reflecting the dominance of a few bacterial taxa. This increase in richness (i.e., based on relative abundance) in the CF was explained by the detection of previously low-abundance taxa that were not detected at earlier time points, rather than the emergence of new taxonomic groups. Significant differences in richness were observed only in the CF group. This contrast between groups was also highlighted by the significant effect of the factor Treatment for this index in the ANOVA analysis. Among the diversity indices, evenness was the only one that exhibited significant differences between groups (i.e., CF vs. HTF), suggesting that HGA exposure mainly altered the relative distribution of taxa rather than community membership. At T12, the distribution of abundance (i.e., evenness) was significantly more uniform in the CF compared to the HTF reflecting a more balanced representation of populations in the CF and suggesting that exposure to HGA may have selectively promoted or inhibited particular taxa early in the incubation. This pattern is consistent with in vivo observations, where horses classified as controls exhibited a more uniform distribution of microbial populations compared to co-grazers or intoxicated horses [32].
The β-diversity (i.e., between community) analysis including T0 revealed that 66.8% of the microbial variation was significantly explained by the factor Time, the factor Treatment applied (i.e., adding HGA) and the interaction of both factors. Among these factors, Time exerted the strongest influence, consistent with the batch fermentation model where faecal inocula evolve in a closed environment mimicking part of the gastro-intestinal tract. Moreover, the experimental design and the inclusion of T0 samples (i.e., representing a single baseline condition shared by all fermenters prior to any treatment) artificially inflated the explained variance and limited the ability of the permutation design to detect treatment-specific differences. When T0 samples were excluded, temporal variation remained the dominant factor structuring microbial communities. The PERMANOVA confirmed that Time alone significantly accounted for the largest share of variance (i.e., 26.2%), while the contribution of Treatment was comparatively small (i.e., 6.6%) and was not significant. This finding indicates that community changes over time were largely driven by intrinsic microbial succession rather than by direct HGA effects at specific sampling points. Consistent with these results, the Bray–Curtis distance-based RDA confirmed a strong and significant effect of Time on the first canonical axis, reinforcing the predominant role of temporal evolution in shaping the community structure. To minimize the confounding influence of temporal dynamics and to better disentangle treatment-specific effects from the natural evolution of the microbial communities, DESeq2 analyses were therefore performed by contrasting CF and HTF samples within each individual time point. The Deseq 2 analysis exploring the CF vs. HTF at each time point (i.e., T12, T24 and T48) and also all-time combined revealed that some bacterial populations are significantly different. Notably, the genus Paraclostridium was consistently more abundant in CF than in HTF samples at T12, T48, and when all times were combined. This genus is known to perform Stickland fermentation using leucine and BCAAs. The Stickland reaction is an anaerobic fermentation pathway in which one amino acid is oxidised as an electron donor while another is reduced as an electron acceptor, thereby maintaining redox balance and generating ATP through substrate-level phosphorylation [61,62,63,64]. Hypoglycin A has a molecular weight close to that of BCAAs and can interfere with BCAA metabolic pathways [7]. Moreover, its structural similarity to leucine accounts for the chromatographic challenges in separating the two compounds [7]. Based on these properties, we hypothesise that Paraclostridium may have incorporated HGA instead of leucine or other BCAAs in Stickland fermentation, leading to an energy deficit and population collapse in the fermenters exposed to the toxin. To further validate these findings, the use of absolute quantification approaches, such as qPCR, would be valuable for determining whether the observed relative changes in bacterial populations genuinely reflect true increases or decreases in abundance. It is important to note that Paraclostridium was detected at low relative abundance, suggesting that its direct impact on the overall community dynamics is likely limited. However, the Stickland reaction, a key metabolic pathway potentially involved in HGA utilisation, is not exclusive to Paraclostridium and can be carried out by other bacterial taxa as well. This raises the possibility that additional, more abundant populations could contribute substantially to the observed metabolic shifts in the fermenters. Consequently, a targeted investigation focusing on bacteria capable of performing Stickland fermentation could help identify the key taxa driving these functional responses and better elucidate the microbial mechanisms underlying HGA metabolism in this system. Such an approach would provide a more comprehensive understanding of both the compositional and functional impacts of the toxin and could guide future studies aimed at mitigating its effects in vivo.
The proportion of acetate, propionate and butyrate are similar to those described in horses in the literature: 70–80%, 10–20% and 5–10% respectively in the caecum and the colon [65]. Moreover, these concentrations of SCFA indicate that the batch system works as expected without a significant difference between CF and HTF. The significant effect of Time observed for all three SCFAs reflects the natural progression of microbial fermentation in the batch model. The donor’s faeces were introduced into the system under conditions mimicking the colonic environment, and the microbiota required to adapt to these conditions. Acetate appeared as early as T12 in all fermenters, whereas propionate and butyrate became detectable at T36 and T48, respectively — a pattern consistent with previous findings [35]. Propionate formation from pyruvate involves two major microbial pathways: the succinate pathway, which proceeds via oxaloacetate and succinate, and the acrylate pathway. These multi-step conversions likely contribute to the delayed accumulation of propionate in the system [65]. Butyrate is synthesised by strictly anaerobic bacteria and many of these anaerobic bacteria rely on acetate as a co-substrate or precursor via the butyryl-CoA/acetate CoA-transferase pathway. The delayed detection of butyrate and its higher fermenter-to-fermenter variability may reflect the complex microbial interactions and slower establishment of cross-feeding relationships required for its production [66,67,68]. Moreover, the multiple comparisons for each SCFA also revealed some interesting facts despite the presence of significant differences between CF and HTF. The acetate post hoc comparisons showed early significant differences in HTF compared to CF which can be explained by the fact that HGA modifies the microbial composition. The post hoc comparisons for propionate revealed a significant change only in HTF suggesting the potential influence of HGA through metabolic pathways oriented to propionate synthesis. Finally, the post hoc comparisons test for butyrate reflects the necessary time to produce this SCFA, but only in CF, suggesting a possible impact of HGA on butyrate-producing anaerobic bacteria. However, no significant difference was observed between groups (i.e., CF vs. HTF)
Hypoglycin A remained stable in the autoclaved nutritional medium at constant pH and temperature. In contrast, one study reported no change in HGA concentration after incubation with equine gastric or ovine rumen fluid for two hours. However, this study did not consider the retention time in the sheep rumen, nor the fact that in horses, the majority of the gut microbiota is located in the colon rather than in the stomach (González-Medina et al., 2021). In the study of Engel et al., (2025), the HGA concentration decreased in an autoclaved ruminal fluid (i.e., so considered as exempt of bacteria) probably due to abiotic process such as modification of pH and/or temperature. This conclusion is reinforced by the observation that HGA is stable in pure water [29]. The chemical structure of HGA is composed - as amino acids - by one carboxyl group (-COOH) and one amine group (-NH2) linked to the same alpha carbon (Cα) and by a radical group composed of a methylene group (=CH2) adjacent to a cyclopropyl cycle composed of three carbon atoms. The carboxyl group and the amine group which make HGA an hydrophilic molecule, can also influence its acid-base character. Indeed, the carboxyl group can release a proton (H+) making HGA a weak acid molecule. The pKa of the carboxyl group is generally between 2 and 3, as for most amino acids, indicating that it is dissociated (and therefore deprotonated) at physiological pH (~7.4). The amine group (-NH2) has a higher pKa, usually around 9-10, meaning it remains mostly protonated (NH3+) at physiological pH. Accordingly, at physiological pH, HGA exists primarily as a zwitterion, with the carboxyl group deprotonated (-COO-) and the amine group protonated (NH3+), giving it overall neutrality but with polar sites [70,71,72]. These polar sites could be potential sites for attracting with other molecules. Consequently, the hypothesis of abiotic processes influencing the detection of HGA is a possibility. Especially since the concentration of HGA in our model of stability in an autoclaved media with constant pH and temperature was stable during the experiment.
Within the CF, the HGA concentrations drop to values close to or below LOD from T12 to T36. This significant decrease of HGA in parallel with the stability in the nutritional medium confirms that HGA is decreasing due the activity of the microbiota in the batch system. In the HTF, post hoc comparisons (Dunnett and Tukey) identified numerous significant differences between T0 (or T0*, immediately following HGA addition) and subsequent time points up to T20, indicating a progressive decline in HGA concentration as confirmed by the kinetic analysis. This trend, in parallel with the stability of HGA in the NMF, also suggests a microbial involvement. In the HTF, the kinetic profile of HGA degradation shows a first decrease, followed by a plateau phase, and then a second decline. This biphasic pattern may reflect a mechanism of catabolite repression. Catabolite repression is a regulatory process in which microorganisms preferentially metabolise easily available carbon or nitrogen sources, repressing the expression of genes involved in the degradation of alternative or less favourable substrates. In our system, the initial decrease in HGA may result from its direct utilisation by microorganisms, but the subsequent plateau suggests that once other nutrients in the medium are still readily available, microbial metabolism may shift away from HGA. The second decline observed after T20 could then indicate that, as preferred substrates become depleted, the microbial community resumes the degradation of HGA. This phenomenon is well described in microbial ecology and supports the idea that HGA degradation is not only possible but also subject to regulation depending on the nutritional context [73]. The two-way ANOVA comparing the CF and the HTF revealed significant effects of Time and Treatment. These findings collectively demonstrate a temporal evolution of HGA concentrations and a difference between CF and HTF. As expected, HGA levels differed significantly between groups at T0*, T12, and T24, consistent with the timing of HGA exposure and subsequent microbial transformation. Moreover, HGA levels were not significantly different at T0 between CF and HTF (i.e., before adding HGA). The article from Engel et al., (2025) reporting the decrease of HGA concentrations in ruminal fluid batch cultures can provide an interesting point of comparison for the present results. Indeed, the incubation of HGA in ruminal fluid batch cultures revealed a decrease in HGA over time with a significant decrease after 8 hours and undetectable levels after 24 hours [29]. In the present study, within the HTF, the significant difference was already noted after 2 hours and values <LOD after 48 hours. Despite an initial concentration of HGA being relatively similar (i.e., 564 ± 133 ng/mL HGA in the sheep ruminal fluid and 411 ± 46 ng/mL HGA in the equine colonic fluid), the difference between the first time point of significant decrease of HGA (i.e., 8 hours in sheep ruminal fluid and 2 hours in equine colonic fluid) underlines the “Time x Treatment” effect observed. Moreover, this difference may be due to the difference in microbial composition between sheep ruminal fluid and horse colonic fluid. Indeed, the authors explained that the decrease in HGA in the active ruminal fluid was due to the activity of microbial enzymes in this medium via the integration of HGA (i.e., an amino acid) into microbial protein [29].
The degradation kinetics of HGA in the present in vitro system revealed important differences between conditions. Linear regression of normalised HGA concentrations demonstrated a significant negative slope in all fermenters, confirming that HGA was consistently degraded over time. However, the rate of degradation varied markedly, with an almost negligible slope in NMF compared to the much steeper slopes observed in CF and HTF. The calculated half-lives further highlighted this contrast: while HGA persisted with a very slow kinetic in NMF (133.5 h), its disappearance was more rapid in both CF and HTF (approximately 21 h). These results indicate that HGA is relatively stable in the absence of microbial activity but undergoes a more efficient and comparable degradation in the presence of complex microbial communities. Nevertheless, the absence of statistically significant differences among slopes across fermenters suggests that the overall kinetics can be adequately represented by a pooled decay rate. Interestingly, the regression model provided an excellent fit for CF, whereas greater variability was observed in NMF and HTF, possibly reflecting heterogeneity in microbial activity or experimental conditions.
The absence of MCPA-carnitine was expected as previously described in the literature in sheep ruminal fluid batch cultures (as well as MCPA-glycine) [29]. The absence of toxic metabolites in the sheep ruminal fluid (i.e., MCPA-carnitine, MCPA-glycine, MCPF-carnitine, and MCPF-glycine) [29] and in the present horse colonic batch system (i.e., MCPA-carnitine) demonstrates the absence of toxic metabolism (in the sense that conjugation with glycine and carnitine does not take place) of HGA (or MCPrG) in the digestive tract of herbivores. In the present study, HGA concentrations decreased markedly during incubation in the faecal batch cultures, while remaining stable in the corresponding sterile nutritive medium, thereby confirming that its degradation was microbially mediated. Therefore, it might be supposed that if the digestive microbiota played a role in HGA poisoning, this role might be more “protective”, supporting the hypothesis that microbial activity promotes detoxification rather than activation into toxic metabolites. However, this detoxification occurs in the distal part of the digestive tract, suggesting that such microbial degradation may occur too late to prevent the host’s systemic uptake of the protoxin, which primarily happens in the small intestine. This was part of the conclusions formulated in the study of Renaud et al., (2022) about proximal fermenters species: “Their gut morphophysiology may act as a protection as toxins may be transformed in the rumen. Indeed, the degree of protection against A. pseudoplatanus may be directly linked to the rumen retention time of soluble molecules”. These findings reinforce the hypothesis that the site and timing of microbial fermentation are critical determinants of susceptibility to HGA poisoning. Species in which fermentation occurs before the small intestine (e.g., ruminants) may inactivate HGA before absorption, whereas in hindgut fermenters like horses, the protoxin is likely absorbed upstream of microbial degradation. Moreover, this “protection” conferred by the proximal position of the fermentation tank could explain the greater number of HGA intoxication in horses compared to other herbivores, even considering differences in species management (i.e., the fact that horses are more often at pasture in autumn or spring compared to other herbivores as cattle or sheep)”. The implication of intestinal microbiota as a “protective actor” is already known for other phyto-protoxins as illustrated by mimosine metabolism in ruminants [74,75]. This parallel highlight that the ability of certain microbial communities to metabolize plant protoxins can evolve as an adaptive mechanism, conferring host tolerance to otherwise harmful compounds. Such examples illustrate the potential ecological and evolutionary relevance of microbial detoxification in herbivorous species. Despite its toxic effects, ruminants in certain regions tolerate mimosine ingestion due to microbial degradation of its goitrogenic and toxic metabolite [76,77]. Transfaunation experiments confirmed that ruminal microbiota confer resistance to mimosine toxicity [76,78]. Notably, Synergistes jonesii, an anaerobic bacterium isolated from Hawaiian goats, utilises the toxic metabolite for growth, demonstrating microbial adaptation to detoxification [79,80].
Gut microbiota is known to vary from one individual to another due to age or physiological status, but also due to several factors such as diet, nutritional supplements, exercise, seasons, and medications [33]. To limit the individual impact on the faecal microbiota used in this study, two horses were selected, and faecal samples pooled. Nevertheless, the number of horses in the present study could have be greater (n=4) as suggested for in vitro fermentation studies [39]. Considering “age”, the two horses are considered adult horses and not mature or elderly horses; consequently, they did not exhibit a microbiome rearrangement observed in horses over 20 years of age [81] or a decline in bacterial α and β-diversity observed with advancing age [81,82]. The impact of sex is not clearly established in the literature with contradictory results in horses [82,83]. Moreover, the horses involved in this study were not pregnant or lactating, cancelling out the possible impact of this specific physiological status on their intestinal microbiota [33]. Horses developing AM were at pasture for at least 6 hours a day and some of them were supplemented with hay [84,85]. Consequently, selected horses encountered this condition and received no grain or supplement: thus, their diet was a forage-based diet (i.e., grass and hay). Although differences exist in α-diversity of faecal microbiota between grass diet or grass/hay diet [86,87], these differences are less important compared to a diet partially composed of grains [88]. Fibrolytic bacteria are therefore expected as these bacteria help break down fibre with the production of SCFAs [65,88]. The bacterial community in forage-based diet is dominated by two phyla, Firmicutes and Bacteroidetes, which both account for more than 80% of the overall abundance of bacterial phyla [87]. Finally, seasonal variation also influences faecal microbiota [82,87,89] either via the composition of the bacterial community in the environment (soil, grass, …) or via the nutrient composition of the pasture [87,90]. The main seasons at risk for AM are autumn and spring; horses involved in this study were sampled during spring 2022.
The use of in vitro systems to study equine microbiota has already been scientifically approved and is considered reflective of in vivo conditions [35,36]. However, the absorption of amino acids such as HGA (i.e., a small non-proteogenic amino acid [7,72]) mainly takes place in the jejunum and ileum, with a net disappearance of nitrogen (N) from 16% to 58% pre-caecally [47,91,92]. Consequently, the possibility that HGA reaches the colon in horses could be challenged by the distal location of this fermentation tank. However, studies about the strictly kinetics of N in the equine gastro-intestinal tract indicate that 11 to 30% of the apparent N digestion occurs in the small intestine vs. 40% to 70% to the hindgut [93,94,95]. Both cationic and neutral amino acid transporter genes are expressed in the equine large intestine, suggesting their potential role in microbial and dietary amino acids absorption [96]. In the caecal compartment, an injection of 15N isotope of nitrogen led to the appearance of labelled essential and non-essential amino acids, urea, ammonia, and lysine in the caecal veins. This supports evidence of the ability of the horse to digest and absorb microbial protein from the large intestine [97]. In humans, the microbiota is greater in the more distal part of the intestine compared to the proximal part of the intestine where the concentrations of proteins, peptides, and amino acids are relatively high. Amino acids are not significantly absorbed by the colonic mucosa but are intensively metabolised by the large intestinal microbiota. The preferred amino acid substrates of human colonic bacteria include lysine, arginine, glycine, and the branched chain amino acids (i.e., leucine, valine, and isoleucine) resulting in the generation of a complex mixture of metabolic end products including among others ammonia, SCFAs (acetate, propionate, and butyrate), and branched-chain fatty acids (valerate, isobutyrate, and isovalerate) [98]. Moreover, the unexpected presence of HGA in the faeces of the horses used in the present study (i.e., considered as control and toxin-free horses, since neither protoxin nor toxic metabolites were detected in their blood analysis) indicates that HGA does reach the distal part of the digestive tract and comes into contact with the colonic microbiota in vivo. This finding could be explained by the difference in sensitivity between the LOQ (i.e., 0.090 μmol/L) of the method used to quantify HGA in the blood of horses and the LOD (i.e., 0.055 ng/mL) of the method used to quantify HGA in the batched faecal samples and/or by the fact that part of the ingested amino acid is not absorbed in the small intestine and thus reaches the colon. Therefore, it appears reasonable to hypothesise that the amino acids ingested – as HGA - by the horse can encounter the caecal and colonic microbiota. Nevertheless, the presence of HGA in the faeces of horses selected as “toxin-free” may have already influenced the composition of their colonic microbiota, potentially introducing a bias in the present experimental design.
Future research should aim to fully unravel the fate of HGA within the gut ecosystem and its interactions with microbial communities. Radiolabelled carbon tracing could provide decisive insights into the metabolic pathways involved and clarify whether HGA is transformed, assimilated, or detoxified by specific microbial taxa. Beyond mechanistic understanding, the identification of bacterial groups with protective potential would pave the way for innovative interventions, ranging from microbial transfaunation strategies to the rational design of next-generation probiotics. Such approaches hold the promise not only of mitigating the risks associated with HGA exposure in equids but also of advancing our broader comprehension of host–microbiota interactions in the context of xenobiotic metabolism.
5. Conclusions
For the first time, an in vitro experiment confirmed that the equine intestinal microbiota is modified by the presence of HGA. Moreover, the decrease in the protoxin concentration during the experiment supports the protective role of the microbiota, given that HGA remains stable in autoclaved nutritive media without faecal inocula. Similar observations have also been reported previously in sheep ruminal content. In particular, one genus, Paraclostridium, was identified as having a significant impact on the system. Further investigations are needed to confirm which genera or species are involved in HGA degradation. Understanding which microorganisms participate in this process could pave the way for potential therapeutic strategies.
Author Contributions
Conceptualization, A.-C.F.; methodology, A.C.F., B.T., and V.D.; validation, A.-C.F., B.T., and V.D.; formal analysis, A.-C.F., B.T., M.C., C.H., R.J.P., and C.D.; investigation, A.-C.F., B.R., and I.E.G.-Q.; resources, D.-M.V., P.G., B.T.,V.D. and M.-L.S.; data curation, B.T.; writing—original draft preparation, A.-C.F.; writing—review and editing, B.T., B.R., I.E.G.-Q., C.M., R.J.P., C.D., G.D., V.D., and D.-M.V.; visualization, A-C.F. and B.T.; supervision, A.-C.F., and D.-M.V.; project administration, A.-C.F.; funding acquisition, D.-M.V. All authors have read and agreed to the published version of the manuscript.
Funding
This research was funded by Wallonie agriculture SPW (Service public de Wallonie, Belgium) Grant No. D31-1381/S1-SAMA.
Institutional Review Board Statement
Ethical review and approval were waived for this study because all procedures complied with both national and international guidelines for animal welfare. The Animal Ethics Committee of the University of Liège was consulted and confirmed that the sampling procedure was part of routine veterinary practice for diagnostic purposes or annual health check-ups.
Informed Consent Statement
Informed consent was obtained from the owner of the horses included in the study.
Data Availability Statement
Raw amplicon sequencing libraries were submitted to the NCBI database under bioproject number PRJNA1335877.
Acknowledgments
The authors thank Benjamin Klein for technical support.
Conflicts of Interest
The authors declare no conflicts of interest.
Abbreviations
The following abbreviations are used in this manuscript:
| AM | Atypical myopathy |
| HGA | Hypoglycin A |
| MCPrG | Methylenecyclopropylglycine |
| BCAA | Branched chain amino acids |
| MCPA-CoA | Methylenecyclopropylacetyl-Coenzyme A |
| MCPA-carnitine | Methylenecyclopropylacetic acid-carnitine |
| MCPA-glycine | Methylenecyclopropylacetic acid-glycine |
| UPLC-MS/MS | Ultra-performance liquid chromatography with mass spectrometry |
| LOQ | Limit of quantification |
| LOD | Limit of detection |
| MTD | Maximum tolerated dose |
| HED | Human equivalent dose |
| BSA | Body surface area |
| CF | Control fermenters |
| HTF | HGA-treated fermenters |
| SCFAs | Short-chain fatty acids |
| PCR | Polymerase Chain Reaction |
| ANOVA | Analysis Of Variance |
| PERMANOVA | Permutational Multivariate Analysis of Variance |
| dbRDA | Distance-based redundancy analysis |
| SPME | Solid phase microextraction |
| GC-MS | Gas chromatography coupled to mass spectrometry |
| LLOQ | Lower limits of quantification |
| ULOQ | Upper limits of quantification |
| NMF | Nutritional medium fermenters |
| FDR | False Discovery Rate |
Appendix A
Sampling Design and Analysis
T0*: 10 minutes after adding HGA in HGA-treated fermenters - ✓ indicates the samples taken - gray cells indicate unanalysed samples - white cells indicate analysed samples- HGA: hypoglycin A - MCPA-carnitine: methylenecyclopropylacetyl- carnitine - SCFAs: short-chain fatty acids.
References
- Votion, D.M.; van Galen, G.; Sweetman, L.; Boemer, F.; de Tullio, P.; Dopagne, C.; Lefère, L.; Mouithys-Mickalad, A.; Patarin, F.; Rouxhet, S.; et al. Identification of Methylenecyclopropyl Acetic Acid in Serum of European Horses with Atypical Myopathy. Equine Vet J 2014, 46, 146–149. [Google Scholar] [CrossRef]
- Baise, E.; Habyarimana, J.A.; Amory, H.; Boemer, F.; Douny, C.; Gustin, P.; Marcillaud-Pitel, C.; Patarin, F.; Weber, M.; Votion, D.M. Samaras and Seedlings of Acer Pseudoplatanus Are Potential Sources of Hypoglycin A Intoxication in Atypical Myopathy without Necessarily Inducing Clinical Signs. Equine Vet J 2016, 48, 414–417. [Google Scholar] [CrossRef]
- Unger, L.; Nicholson, A.; Jewitt, E.M.; Gerber, V.; Hegeman, A.; Sweetman, L.; Valberg, S. Hypoglycin A Concentrations in Seeds of Acer Pseudoplatanus Trees Growing on Atypical Myopathy-Affected and Control Pastures. J Vet Intern Med 2014, 28, 1289–1293. [Google Scholar] [CrossRef]
- Fowden, L.; Pratt, H.M. Cyclopropylamino Acids of the Genus Acer. Phytochemistry 1973, 12, 1677–1681. [Google Scholar] [CrossRef]
- Bochnia, M.; Sander, J.; Ziegler, J.; Terhardt, M.; Sander, S.; Janzen, N.; Cavalleri, J.M.V.; Zuraw, A.; Wensch-Dorendorf, M.; Zeyner, A. Detection of MCPG Metabolites in Horses with Atypical Myopathy. PLoS One 2019, 14. [Google Scholar] [CrossRef]
- Black, D.K.; Landor, S.R. A New Synthesis of Hypoglycin a; Pergamon Press Ltd., 1963. [Google Scholar]
- Billington, D.; Sherratt, H.S. Hypoglycin and Metabolically Related Inhibitors. 1981, 72, 610–616. [Google Scholar] [CrossRef]
- El-Khatib, A.H.; Engel, A.M.; Weigel, S. Co-Occurrence of Hypoglycin A and Hypoglycin B in Sycamore and Box Elder Maple Proved by LC-MS/MS and LC-HR-MS. Toxins (Basel) 2022, 14. [Google Scholar] [CrossRef] [PubMed]
- Feng, P.C.; Patrick, S.J. Studies of the Action of Hypoglycin-A, an Hypoglycaemic Substance. J. Pharmacol 1958, 13, 125–130. [Google Scholar] [CrossRef] [PubMed]
- Bunert, C.; Langer, S.; Votion, D.M.; Boemer, F.; Müller, A.; Ternes, K.; Liesegang, A. Atypical Myopathy in Père David’s Deer (Elaphurus Davidianus) Associated with Ingestion of Hypoglycin A. J Anim Sci 2018, 96, 3537–3547. [Google Scholar] [CrossRef]
- Renaud, B.; Kruse, C.J.; François, A.C.; Grund, L.; Bunert, C.; Brisson, L.; Boemer, F.; Gault, G.; Ghislain, B.; Petitjean, T.; et al. Acer Pseudoplatanus: A Potential Risk of Poisoning for Several Herbivore Species. Toxins (Basel) 2022, 14. [Google Scholar] [CrossRef] [PubMed]
- Chen, K.K.; Anderson, R.C.; Mccowen, M.C.; Harris, P.N. PHARMACOLOGIC ACTION OF HYPOGLYCIN A AND B. J Pharmacol Exp Ther. 1957, 121, 272–285. [Google Scholar] [CrossRef]
- Hassall, C.H.; Reyle, K.; Feng, P. Hypoglycin A,B- Biologically Active Polypeptides from Blighia Sapida. Nature 1954, 173, 356–357. [Google Scholar] [CrossRef]
- Hirz, M.; Gregersen, H.A.; Sander, J.; Votion, D.M.; Schänzer, A.; Köhler, K.; Herden, C. Atypical Myopathy in 2 Bactrian Camels. Journal of Veterinary Diagnostic Investigation 2021, 33, 961–965. [Google Scholar] [CrossRef]
- Jordan, E.O.; Burrows, W. The Vomiting Sickness of Jamaica, B. W. I. and Its Relation to Akee Poisoning. Am J Epidemiol 1937, 25, 520–545. [Google Scholar] [CrossRef]
- Tanaka, K.; Kean, E.A.; Johnson, B. Jamaican Vomiting Sickness: Biochemical Investigation of Two Cases. N Engl J Med. 1976, 295, 461–467. [Google Scholar] [CrossRef]
- Renaud, B.; Kruse, C.-J.; François, A.-C.; Cesarini, C.; van Loon, G.; Palmers, K.; Boemer, F.; Luis, G.; Gustin, P.; Votion, D.-M. Large-Scale Study of Blood Markers in Equine Atypical Myopathy Reveals Subclinical Poisoning and Advances in Diagnostic and Prognostic Criteria. Environ Toxicol Pharmacol 2024, 104515. [Google Scholar] [CrossRef] [PubMed]
- Kruse, C.-J.; Stern, D.; Mouithys-Mickalad, A.; Niesten, A.; Art, T.; Lemieux, H.; Votion, D.-M. In Vitro Assays for the Assessment of Impaired Mitochondrial Bioenergetics in Equine Atypical Myopathy. Life 2021, 11, 1–12. [Google Scholar] [CrossRef]
- Von Holt, C. Methylenecyclopropaneacetic Acid, a Metabolite of Hypoglycin. Biochim Biophys Acta 1966, 3, 1–10. [Google Scholar] [CrossRef] [PubMed]
- Boemer, F.; Detilleux, J.; Cello, C.; Amory, H.; Marcillaud-Pitel, C.; Richard, E.; Van Galen, G.; Van Loon, G.; Lefère, L.; Votion, D.M. Acylcarnitines Profile Best Predicts Survival in Horses with Atypical Myopathy. PLoS One 2017, 12. [Google Scholar] [CrossRef]
- Karlíková, R.; Široká, J.; Jahn, P.; Friedecký, D.; Gardlo, A.; Janečková, H.; Hrdinová, F.; Drábková, Z.; Adam, T. Equine Atypical Myopathy: A Metabolic Study. Veterinary Journal 2016, 216, 125–132. [Google Scholar] [CrossRef]
- Mathis, D.; Sass, J.O.; Graubner, C.; Schoster, A. Diagnosis of Atypical Myopathy Based on Organic Acid and Acylcarnitine Profiles and Evolution of Biomarkers in Surviving Horses. Mol Genet Metab Rep 2021, 29. [Google Scholar] [CrossRef]
- Bochnia, M.; Ziegler, J.; Sander, J.; Uhlig, A.; Schaefer, S.; Vollstedt, S.; Glatter, M.; Abel, S.; Recknagel, S.; Schusser, G.F.; et al. Hypoglycin a Content in Blood and Urine Discriminates Horses with Atypical Myopathy from Clinically Normal Horses Grazing on the Same Pasture. PLoS One 2015, 10. [Google Scholar] [CrossRef]
- Westermann, C.M.; Dorland, L.; Votion, D.M.; de Sain-van der Velden, M.G.M.; Wijnberg, I.D.; Wanders, R.J.A.; Spliet, W.G.M.; Testerink, N.; Berger, R.; Ruiter, J.P.N.; et al. Acquired Multiple Acyl-CoA Dehydrogenase Deficiency in 10 Horses with Atypical Myopathy. Neuromuscular Disorders 2008, 18, 355–364. [Google Scholar] [CrossRef] [PubMed]
- Westermann, C.M.; de Sain-van der Velden, M.G.M.; van der Kolk, J.H.; Berger, R.; Wijnberg, I.D.; Koeman, J.P.; Wanders, R.J.A.; Lenstra, J.A.; Testerink, N.; Vaandrager, A.B.; et al. Equine Biochemical Multiple Acyl-CoA Dehydrogenase Deficiency (MADD) as a Cause of Rhabdomyolysis. Mol Genet Metab 2007, 91, 362–369. [Google Scholar] [CrossRef] [PubMed]
- Kuziel, G.A.; Lozano, G.L.; Simian, C.; Li, L.; Manion, J.; Stephen-Victor, E.; Chatila, T.; Dong, M.; Weng, J.K.; Rakoff-Nahoum, S. Functional Diversification of Dietary Plant Small Molecules by the Gut Microbiome. Cell 2025, 188, 1967–1983.e22. [Google Scholar] [CrossRef]
- Tan, Y.; An, K.; Su, J. Review: Mechanism of Herbivores Synergistically Metabolizing Toxic Plants through Liver and Intestinal Microbiota. Comparative Biochemistry and Physiology Part - C: Toxicology and Pharmacology 2024, 281. [Google Scholar] [CrossRef]
- Rogowska-van der Molen, M.A.; Berasategui-Lopez, A.; Coolen, S.; Jansen, R.S.; Welte, C.U. Microbial Degradation of Plant Toxins. Environ Microbiol 2023, 25, 2988–3010. [Google Scholar] [CrossRef]
- Engel, A.M.; El-Khatib, A.H.; Bachmann, M.; Wensch-Dorendorf, M.; Klevenhusen, F.; Weigel, S.; Pieper, R.; Zeyner, A. Release of Hypoglycin A from Hypoglycin B and Decrease of Hypoglycin A and Methylene Cyclopropyl Glycine Concentrations in Ruminal Fluid Batch Cultures. Toxins (Basel) 2025, 17, 46. [Google Scholar] [CrossRef]
- Costa, M.; Weese, J.S. Methods and Basic Concepts for Microbiota Assessment. Veterinary Journal 2019, 249, 10–15. [Google Scholar] [CrossRef]
- Wimmer-Scherr, C.; Taminiau, B.; Renaud, B.; van Loon, G.; Palmers, K.; Votion, D.; Amory, H.; Daube, G.; Cesarini, C. Comparison of Fecal Microbiota of Horses Suffering from Atypical Myopathy and Healthy Co-Grazers. Animals 2021, 11, 1–17. [Google Scholar] [CrossRef] [PubMed]
- François, A.-C.; Cesarini, C.; Taminiau, B.; Renaud, B.; Kruse, C.-J.; Boemer, F.; van Loon, G.; Palmers, K.; Daube, G.; Wouters, C.P.; et al. Unravelling Faecal Microbiota Variations in Equine Atypical Myopathy: Correlation with Blood Markers and Contribution of Microbiome. Animals 2025, 15, 354. [Google Scholar] [CrossRef] [PubMed]
- Garber, A.; Hastie, P.; Murray, J.A. Factors Influencing Equine Gut Microbiota: Current Knowledge. J Equine Vet Sci 2020, 88, 1–12. [Google Scholar] [CrossRef]
- Boucher, L.; Leduc, L.; Leclère, M.; Costa, M.C. Current Understanding of Equine Gut Dysbiosis and Microbiota Manipulation Techniques: Comparison with Current Knowledge in Other Species. Animals 2024, 14. [Google Scholar] [CrossRef]
- Leng, J.; Walton, G.; Swann, J.; Darby, A.; Ragione, R. La; Proudmana, C. “Bowel on the Bench”: Proof of Concept of a Three-Stage, in Vitro Fermentation Model of the Equine Large Intestine. Appl Environ Microbiol 2020, 86, 1–16. [Google Scholar] [CrossRef]
- Lowman, R.S.; Theodorou, M.K.; Hyslop, J.J.; Dhanoa, M.S.; Cuddeford, D. Evulation of an in Vitro Batch Culture Technique for Estimating the in Vivo Digestibility and Digestible Energy Content of Equine Feeds Using Equine Faeces as the Source of Microbial Inoculum. Anim Feed Sci Technol 1999, 80, 11–27. [Google Scholar] [CrossRef]
- Boemer, F.; Deberg, M.; Schoos, R.; Baise, E.; Amory, H.; Gault, G.; Carlier, J.; Gaillard, Y.; Marcillaud-Pitel, C.; Votion, D. Quantification of Hypoglycin A in Serum Using ATRAQ® Assay. J Chromatogr B Analyt Technol Biomed Life Sci 2015, 997, 75–80. [Google Scholar] [CrossRef]
- Valberg, S.J.; Sponseller, B.T.; Hegeman, A.D.; Earing, J.; Bender, J.B.; Martinson, K.L.; Patterson, S.E.; Sweetman, L. Seasonal Pasture Myopathy/Atypical Myopathy in North America Associated with Ingestion of Hypoglycin A within Seeds of the Box Elder Tree. Equine Vet J 2013, 45, 419–426. [Google Scholar] [CrossRef]
- Aguirre, M.; Ramiro-Garcia, J.; Koenen, M.E.; Venema, K. To Pool or Not to Pool? Impact of the Use of Individual and Pooled Fecal Samples for in Vitro Fermentation Studies. J Microbiol Methods 2014, 107, 1–7. [Google Scholar] [CrossRef]
- Blake, O.A.; Bennink, M.R.; Jackson, J.C. Ackee (Blighia Sapida) Hypoglycin A Toxicity: Dose Response Assessment in Laboratory Rats. Food and Chemical Toxicology 2006, 44, 207–213. [Google Scholar] [CrossRef] [PubMed]
- Nair, A.B.; Jacob, S. A Simple Practice Guide for Dose Conversion between Animals and Human. J Basic Clin Pharm 2016, 7, 27. [Google Scholar] [CrossRef] [PubMed]
- Leśniak, K.; Whittington, L.; Mapletoft, S.; Mitchell, J.; Hancox, K.; Draper, S.; Williams, J. The Influence of Body Mass and Height on Equine Hoof Conformation and Symmetry. J Equine Vet Sci 2019, 77, 43–49. [Google Scholar] [CrossRef]
- Smith, L.S. Take a Deeper Look into Body Surface Area. Nursing (Brux) 2019, 49, 51–54. [Google Scholar] [CrossRef]
- Hintz, H.F. Digestive Physiology of the Horse. J S Afr Vet Assoc 1975, 46, 13–17. [Google Scholar]
- Molly, K.; Woestyne, M. Vande; Smet, I. De; Verstraete, W. Validation of the Simulator of the Human Intestinal Microbial Ecosystem (SHIME) Reactor Using Microorganism-Associated Activities. Microb Ecol Health Dis 1994, 7, 191–200. [Google Scholar] [CrossRef]
- Goya-Jorge, E.; Bondue, P.; Gonza, I.; Laforêt, F.; Antoine, C.; Boutaleb, S.; Douny, C.; Scippo, M.L.; de Ribaucourt, J.C.; Crahay, F.; et al. Butyrogenic, Bifidogenic and Slight Anti-Inflammatory Effects of a Green Kiwifruit Powder (Kiwi FFG®) in a Human Gastrointestinal Model Simulating Mild Constipation. Food Research International 2023, 173. [Google Scholar] [CrossRef] [PubMed]
- Merritt, A.M.; Julliand, V. Gastrointestinal Physiology. In Equine Applied and Clinical Nutrition; Geor, R.J., Harris, P.A., Coenen, M., Eds.; W.B. Saunders: Philadelphia, 2013; pp. 3–32. [Google Scholar]
- Joskow, R.; Belson, M.; Vesper, H.; Backer, L.; Rubin, C. Ackee Fruit Poisoning: An Outbreak Investigation in Haiti 2000-2001, and Review of the Literature. Clin Toxicol 2006, 44, 267–273. [Google Scholar] [CrossRef]
- Cerri, S.; Taminiau, B.; de Lusancay, A.H.C.; Lecoq, L.; Amory, H.; Daube, G.; Cesarini, C. Effect of Oral Administration of Omeprazole on the Microbiota of the Gastric Glandular Mucosa and Feces of Healthy Horses. J Vet Intern Med 2020, 34, 2727–2737. [Google Scholar] [CrossRef]
- Schloss, P.D.; Westcott, S.L.; Ryabin, T.; Hall, J.R.; Hartmann, M.; Hollister, E.B.; Lesniewski, R.A.; Oakley, B.B.; Parks, D.H.; Robinson, C.J.; et al. Introducing Mothur: Open-Source, Platform-Independent, Community-Supported Software for Describing and Comparing Microbial Communities. Appl Environ Microbiol 2009, 75, 7537–7541. [Google Scholar] [CrossRef] [PubMed]
- Rognes, T.; Flouri, T.; Nichols, B.; Quince, C.; Mahé, F. VSEARCH: A Versatile Open Source Tool for Metagenomics. PeerJ 2016, 2016. [Google Scholar] [CrossRef]
- Quast, C.; Pruesse, E.; Yilmaz, P.; Gerken, J.; Schweer, T.; Yarza, P.; Peplies, J.; Glöckner, F.O. The SILVA Ribosomal RNA Gene Database Project: Improved Data Processing and Web-Based Tools. Nucleic Acids Res 2013, 41. [Google Scholar] [CrossRef]
- Oksanen, J.; Simpso, G.L.; Blanchet, F.G.; Kindt, R.; Legendre, P.; Minchin, P.R.; O’Hara, R.B.; Solymos, P.; Stevens, M.H.M.; Szoecs, E.; et al. Package “vegan” - Community Ecology Package Available online:. Available online: https://cran.r-project.org/web/packages/vegan/vegan.pdf (accessed on 9 October 2024).
- Kers, J.G.; Saccenti, E. The Power of Microbiome Studies: Some Considerations on Which Alpha and Beta Metrics to Use and How to Report Results. Front Microbiol 2022, 12. [Google Scholar] [CrossRef]
- Morris, E.K.; Caruso, T.; Buscot, F.; Fischer, M.; Hancock, C.; Maier, T.S.; Meiners, T.; Müller, C.; Obermaier, E.; Prati, D.; et al. Choosing and Using Diversity Indices: Insights for Ecological Applications from the German Biodiversity Exploratories. Ecol Evol 2014, 4, 3514–3524. [Google Scholar] [CrossRef]
- Chao, A.; Chazdon, R.L.; Shen, T.J. A New Statistical Approach for Assessing Similarity of Species Composition with Incidence and Abundance Data. Ecol Lett 2005, 8, 148–159. [Google Scholar] [CrossRef]
- Oksanen, J.; Kindt, R.; Simpson, G. Package “vegan3d” - Static and Dynamic 3D and Editable Interactive Plots for the “Vegan” Package Available online:. Available online: https://cran.r-project.org/web/packages/vegan3d/vegan3d.pdf (accessed on 9 October 2024).
- Martinez Arbizu, P. PairwiseAdonis: Pairwise Multilevel Comparison Using Adonis_. R Package Version 0.4. Available online: https://github.com/pmartinezarbizu/pairwiseAdonis (accessed on 9 October 2024).
- Douny, C.; Dufourny, S.; Brose, F.; Verachtert, P.; Rondia, P.; Lebrun, S.; Marzorati, M.; Everaert, N.; Delcenserie, V.; Scippo, M.L. Development of an Analytical Method to Detect Short-Chain Fatty Acids by SPME-GC–MS in Samples Coming from an in Vitro Gastrointestinal Model. J Chromatogr B Analyt Technol Biomed Life Sci 2019, 1124, 188–196. [Google Scholar] [CrossRef]
- González-Medina, S.; Hyde, C.; Lovera, I.; Piercy, R.J. Detection of Hypoglycin A and MCPA-Carnitine in Equine Serum and Muscle Tissue: Optimisation and Validation of a LC-MS–Based Method without Derivatisation. Equine Vet J 2021, 53, 558–568. [Google Scholar] [CrossRef]
- Pavao, A.; Graham, M.; Arrieta-Ortiz, M.L.; Immanuel, S.R.C.; Baliga, N.S.; Bry, L. Reconsidering the in Vivo Functions of Clostridial Stickland Amino Acid Fermentations. Anaerobe 2022, 76. [Google Scholar] [CrossRef] [PubMed]
- Britz, M.L.; Wilkinson, R.G. Leucine Dissimilation to Isovaleric and Isocaproic Acids by Cell Suspensions of Amino Acid Fermenting Anaerobes: The Stickland Reaction Revisited. Can J Microbiol 1981, 28, 291–300. [Google Scholar] [CrossRef]
- Dai, Z.-L.; Wu, G.; Zhu, W.Y. Amino Acid Metabolism in Intestinal Bacteria- Links between Gut Ecology and Host Health. Front Biosci 2011, 16, 1768–1786. [Google Scholar] [CrossRef] [PubMed]
- Davila, A.M.; Blachier, F.; Gotteland, M.; Andriamihaja, M.; Benetti, P.H.; Sanz, Y.; Tomé, D. Intestinal Luminal Nitrogen Metabolism: Role of the Gut Microbiota and Consequences for the Host. Pharmacol Res 2013, 68, 95–107. [Google Scholar] [CrossRef]
- Bergman, E.N. Energy Contributions of Volatile Fatty Acids From the Gastrointestinal Tract in Various Species. Physiol Rev 1990, 70, 567–590. [Google Scholar] [CrossRef] [PubMed]
- Pryde, S.E.; Duncan, S.H.; Hold, G.L.; Stewart, C.S.; Flint, H.J. The Microbiology of Butyrate Formation in the Human Colon. FEMS Microbiol Lett 2002, 217, 133–139. [Google Scholar] [CrossRef]
- Duncan, S.H.; Holtrop, G.; Lobley, G.E.; Calder, A.G.; Stewart, C.S.; Flint, H.J. Contribution of Acetate to Butyrate Formation by Human Faecal Bacteria. British Journal of Nutrition 2004, 91, 915–923. [Google Scholar] [CrossRef] [PubMed]
- Louis, P.; Flint, H.J. Diversity, Metabolism and Microbial Ecology of Butyrate-Producing Bacteria from the Human Large Intestine. FEMS Microbiol Lett 2009, 294, 1–8. [Google Scholar] [CrossRef]
- González-Medina, S.; Bevin, W.; Alzola-Domingo, R.; Chang, Y.M.; Piercy, R.J. Hypoglycin A Absorption in Sheep without Concurrent Clinical or Biochemical Evidence of Disease. J Vet Intern Med 2021, 35, 1170–1176. [Google Scholar] [CrossRef] [PubMed]
- De Meijere, A. Bonding Properties of Cyclopropane and Their Chemical Consequences. Angewandte Chemie 1979, 18, 809–886. [Google Scholar] [CrossRef]
- Nelson, D.L.; Cox, M.M.; Hoskins, A. Principles of Biochemistry, 8th ed.; Freeman, W.H., Ed.; Macmillan International, 2021. [Google Scholar]
- Bressler, R.; Corredor, C.; Brendel, K. HYPOGLYCIN AND HYPOGLYCIN-LIKE COMPOUNDS. Pharmacol Rev. 1969, 21, 105–130. [Google Scholar] [CrossRef]
- Magasanik, B. Catabolite Repression. Cold Spring Harb Symp Quant Biol 1961, 26, 249–256. [Google Scholar] [CrossRef]
- Adams, R.; Jones, V. V. The Structure of Leucenol. J Am Chem Soc 1947, 69, 1803–1805. [Google Scholar] [CrossRef]
- Bickel, A.F. On the Structure of Leucaenine (Leucaenol) from Leucaena Glauca Bentham. J Am Chem Soc 1947, 69, 1801–1803. [Google Scholar] [CrossRef]
- Jones, R.J. Does Ruminal Metabolism of Mimosine Explain the Absence of Leucaena Toxicity in Hawaii? Aust Vet J 1981, 57, 55–56. [Google Scholar] [CrossRef]
- Jones, R.J.; Lowry, J.B. Australian Goats Detoxify the Goitrogen 3-Hydroxy-4(IH) Pyridone (DHP) after Rumen Infusion from an Indone-Sian Goat. Experientia 1984, 40, 1435–1436. [Google Scholar] [CrossRef] [PubMed]
- Jones, R.J.; Megarrity, R.G. Successful Transfer of DHP-Degrading Bacteria from Hawaiian Goats to Australian Ruminants to Overcome the Toxicity of Leucaena. Aust Vet J. 1986, 63, 259–262. [Google Scholar] [CrossRef]
- Allison, M.J.; Mayberry, W.R.; Mcsweeney, C.S.; Stahl, D.A. Synergistes Jonesii, Gen. Nov., Sp.Nov.: A Rumen Bacterium That Degrades Toxic Pyridinediols. Syst Appl Microbiol 1992, 15, 522–529. [Google Scholar] [CrossRef]
- Allison, M.J.; Hammond, A.C.; Jones, R.J. Detection of Ruminal Bacteria That Degrade Toxic Dihydroxypyridine Compounds Produced from Mimosine. Appl Environ Microbiol 1990, 56, 590–594. [Google Scholar] [CrossRef]
- Baraille, M.; Buttet, M.; Grimm, P.; Milojevic, V.; Julliand, S.; Julliand, V. Changes of Faecal Bacterial Communities and Microbial Fibrolytic Activity in Horses Aged from 6 to 30 Years Old. PLoS One 2024, 19. [Google Scholar] [CrossRef]
- Theelen, M.J.P.; Luiken, R.E.C.; Wagenaar, J.A.; van Oldruitenborgh-Oosterbaan, M.M.S.; Rossen, J.W.A.; Zomer, A.L. The Equine Faecal Microbiota of Healthy Horses and Ponies in The Netherlands : Impact of Host and Environmental Factors. Animals 2021, 11, 1–17. [Google Scholar] [CrossRef] [PubMed]
- Hu, D.; Chao, Y.; Li, Y.; Peng, X.; Wang, C.; Wang, Z.; Zhang, D.; Li, K. Effect of Gender Bias on Equine Fecal Microbiota. J Equine Vet Sci 2021, 97. [Google Scholar] [CrossRef]
- Van Galen, G.; Saegerman, C.; Marcillaud Pitel, C.; Patarin, F.; Amory, H.; Baily, J.D.; Cassart, D.; Gerber, V.; Hahn, C.; Harris, P.; et al. European Outbreaks of Atypical Myopathy in Grazing Horses (2006-2009): Determination of Indicators for Risk and Prognostic Factors. Equine Vet J 2012, 44, 621–625. [Google Scholar] [CrossRef]
- Votion, D.M.; François, A.C.; Kruse, C.; Renaud, B.; Farinelle, A.; Bouquieaux, M.C.; Marcillaud-pitel, C.; Gustin, P. Answers to the Frequently Asked Questions Regarding Horse Feeding and Management Practices to Reduce the Risk of Atypical Myopathy. Animals 2020, 10, 1–15. [Google Scholar] [CrossRef]
- Fernandes, K.A.; Rogers, C.W.; Gee, E.K.; Kittelmann, S.; Bolwell, C.F.; Bermingham, E.N.; Biggs, P.J.; Thomas, D.G. Resilience of Faecal Microbiota in Stabled Thoroughbred Horses Following Abrupt Dietary Transition between Freshly Cut Pasture and Three Forage-Based Diets. Animals 2021, 11. [Google Scholar] [CrossRef] [PubMed]
- Fernandes, K.A.; Gee, E.K.; Rogers, C.W.; Kittelmann, S.; Biggs, P.J.; Bermingham, E.N.; Bolwell, C.F.; Thomas, D.G. Seasonal Variation in the Faecal Microbiota of Mature Adult Horses Maintained on Pasture in New Zealand. Animals 2021, 11, 1–21. [Google Scholar] [CrossRef]
- Raspa, F.; Chessa, S.; Bergero, D.; Sacchi, P.; Ferrocino, I.; Cocolin, L.; Corvaglia, M.R.; Moretti, R.; Cavallini, D.; Valle, E. Microbiota Characterization throughout the Digestive Tract of Horses Fed a High-Fiber vs. a High-Starch Diet. Front Vet Sci 2024, 11. [Google Scholar] [CrossRef]
- Salem, S.E.; Maddox, T.W.; Berg, A.; Antczak, P.; Ketley, J.M.; Williams, N.J.; Archer, D.C. Variation in Faecal Microbiota in a Group of Horses Managed at Pasture over a 12-Month Period. Sci Rep 2018, 8, 1–10. [Google Scholar] [CrossRef]
- Chaucheyras-Durand, F.; Sacy, A.; Karges, K.; Apper, E. Gastro-Intestinal Microbiota in Equines and Its Role in Health and Disease: The Black Box Opens. Microorganisms 2022, 10, 1–33. [Google Scholar] [CrossRef]
- Krägeloh, T.; Cavalleri, J.M.V.; Ziegler, J.; Sander, J.; Terhardt, M.; Breves, G.; Cehak, A. Identification of Hypoglycin A Binding Adsorbents as Potential Preventive Measures in Co-Grazers of Atypical Myopathy Affected Horses. Equine Vet J 2018, 50, 220–227. [Google Scholar] [CrossRef] [PubMed]
- Mok, C.H.; Urschel, K.L. Amino Acid Requirements in Horses. Asian-Australas J Anim Sci 2020, 33, 679–695. [Google Scholar] [CrossRef]
- Gibbs, P.G.; Potter, G.D.; Schelling, G.T.; Kreider, J.L.; Boyd, C.L. DIGESTION OF HAY PROTEIN IN DIFFERENT SEGMENTS OF THE EQUINE DIGESTIVE TRACT. J Anim Sci 1988, 66, 400–406. [Google Scholar] [CrossRef] [PubMed]
- Reitnour, C.M.; Salsbury, R.L. Digestion and Utilization of Cecally Infused Protein by the Equine. J. Anim Sci 1972, 35, 1190–1193. [Google Scholar] [CrossRef]
- Glade, M.J. NITROGEN PARTITIONING ALONG THE EQUINE DIGESTIVE TRACT. J Anim Sci 1983, 57, 943–953. [Google Scholar] [CrossRef]
- Woodward, A.D.; Holcombe, S.J.; Steibel, J.P.; Staniar, W.B.; Colvin, C.; Trottier, N.L. Cationic and Neutral Amino Acid Transporter Transcript Abundances Are Differentially Expressed in the Equine Intestinal Tract. J Anim Sci 2010, 88, 1028–1033. [Google Scholar] [CrossRef] [PubMed]
- Slade, L.M.; Bishop, R.; Morris, J.G.; Robinson, D.W. Digestion and Absorption of 15N-Labelled Microbial Protein in the Large Intestine of the Horse. Br Vet J 1971, 127, 11–13. [Google Scholar] [CrossRef] [PubMed]
- Neis, E.P.J.G.; Dejong, C.H.C.; Rensen, S.S. The Role of Microbial Amino Acid Metabolism in Host Metabolism. Nutrients 2015, 7, 2930–2946. [Google Scholar] [CrossRef] [PubMed]
Figure 1.
Representation of bacterial α-diversity deduced from inverse Simpson index, bacterial genus richness deduced from Chao1 index and bacterial genus evenness deduced from Simpson index. Data are scatter dot plots at the genus level for each fermenter in both groups (i.e., control fermenters and HGA-treated fermenters), with the mean and the standard deviation. Black circles represent control fermenters, and purple triangles represent HGA-treated fermenters. Groups were compared with ANOVA followed by post-hoc pairwise tests, using FDR multi-tests correction (q-value threshold: * < 0.05; ** < 0.01).
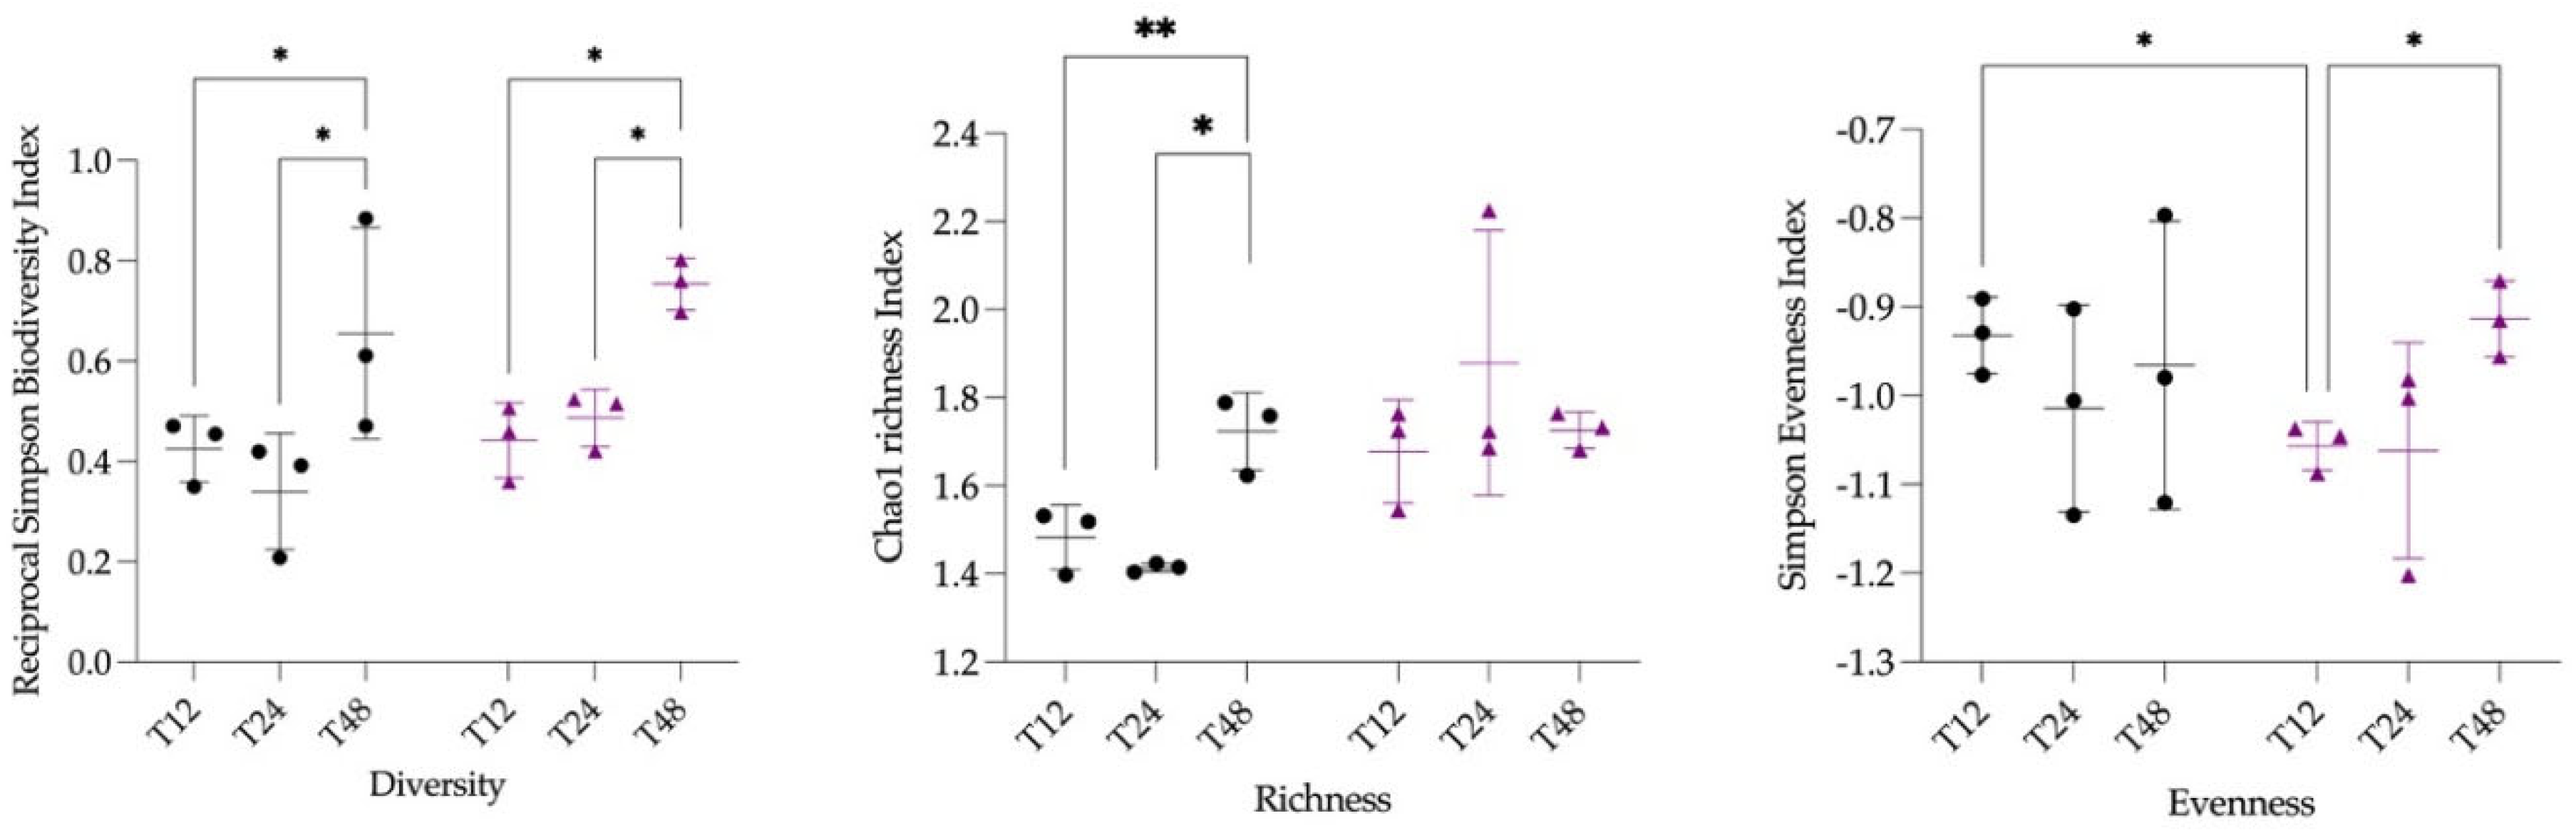
Figure 2.
Representation of bacterial β-diversity with a Principal Coordinates Analysis – Rounds symbols represent control fermenters and triangular symbols represent hypoglycin A-treated fermenters after adding hypoglycin A while square symbols represent the fermenters at T0 before adding HGA.
Figure 2.
Representation of bacterial β-diversity with a Principal Coordinates Analysis – Rounds symbols represent control fermenters and triangular symbols represent hypoglycin A-treated fermenters after adding hypoglycin A while square symbols represent the fermenters at T0 before adding HGA.
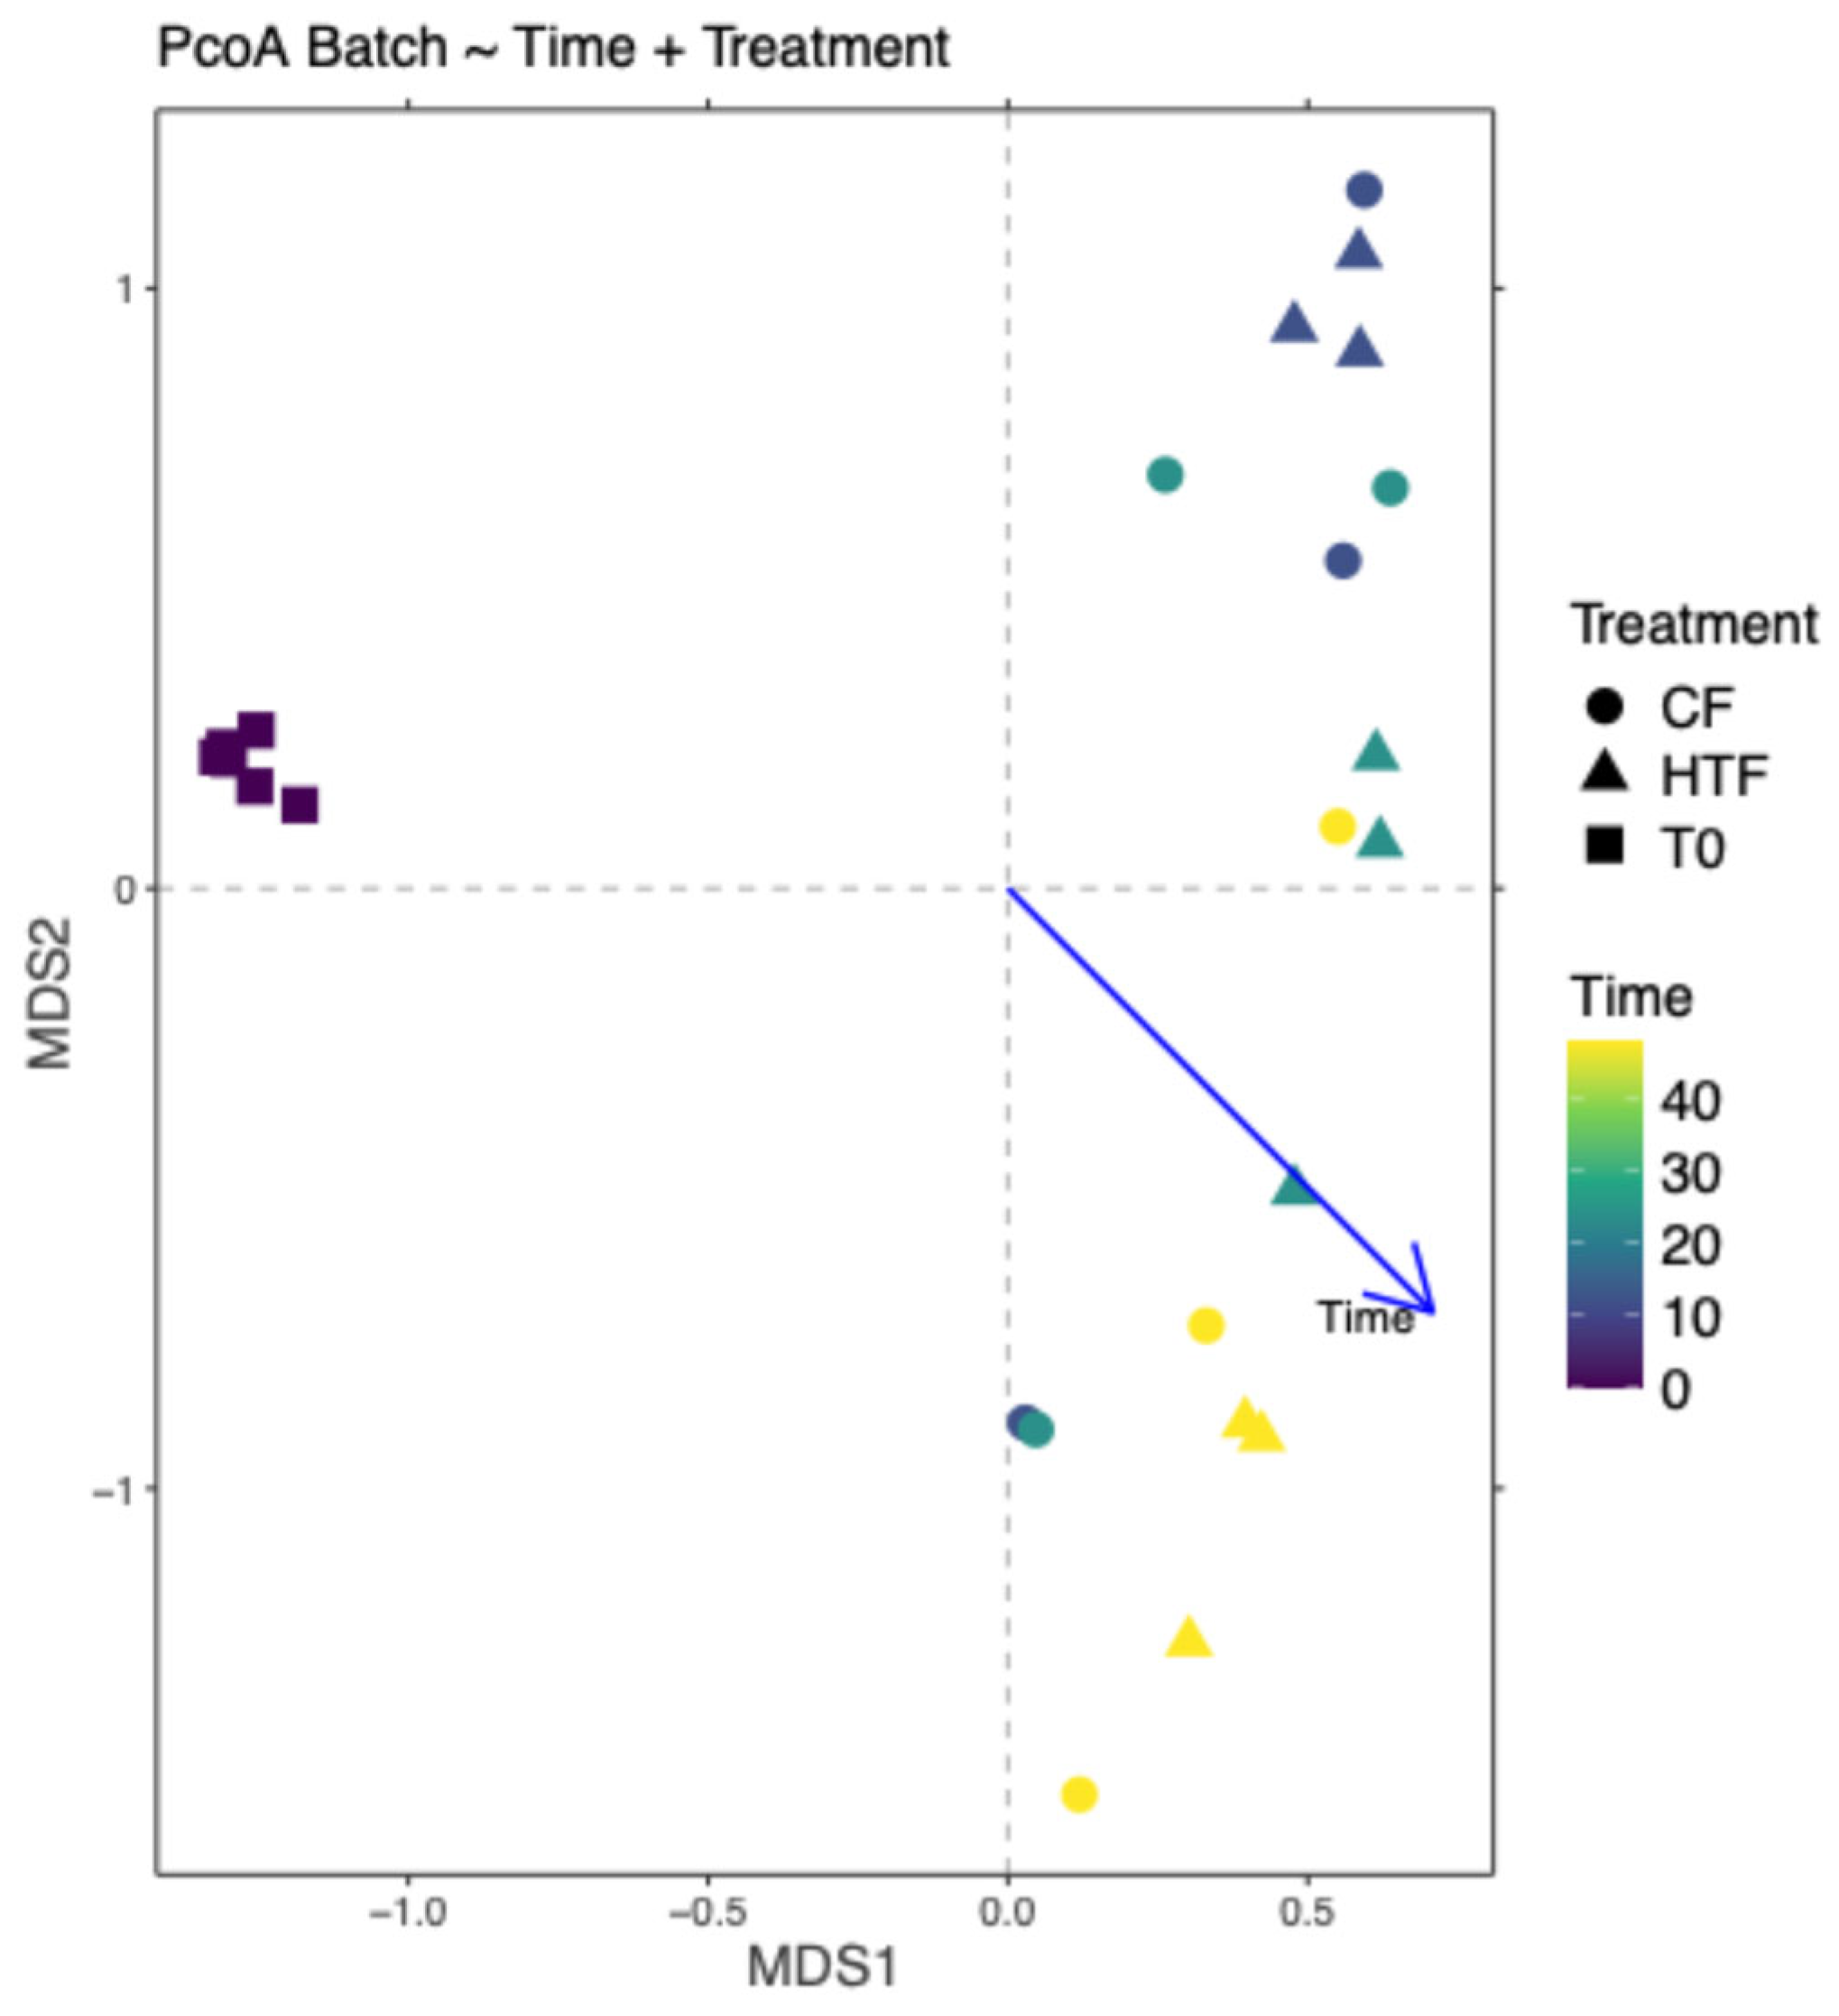
Figure 3.
Representation of bacterial β-diversity with a Principal Coordinates Analysis – Rounds symbols represent control fermenters and triangular symbols represent hypoglycin A-treated fermenters after adding hypoglycin A.
Figure 3.
Representation of bacterial β-diversity with a Principal Coordinates Analysis – Rounds symbols represent control fermenters and triangular symbols represent hypoglycin A-treated fermenters after adding hypoglycin A.
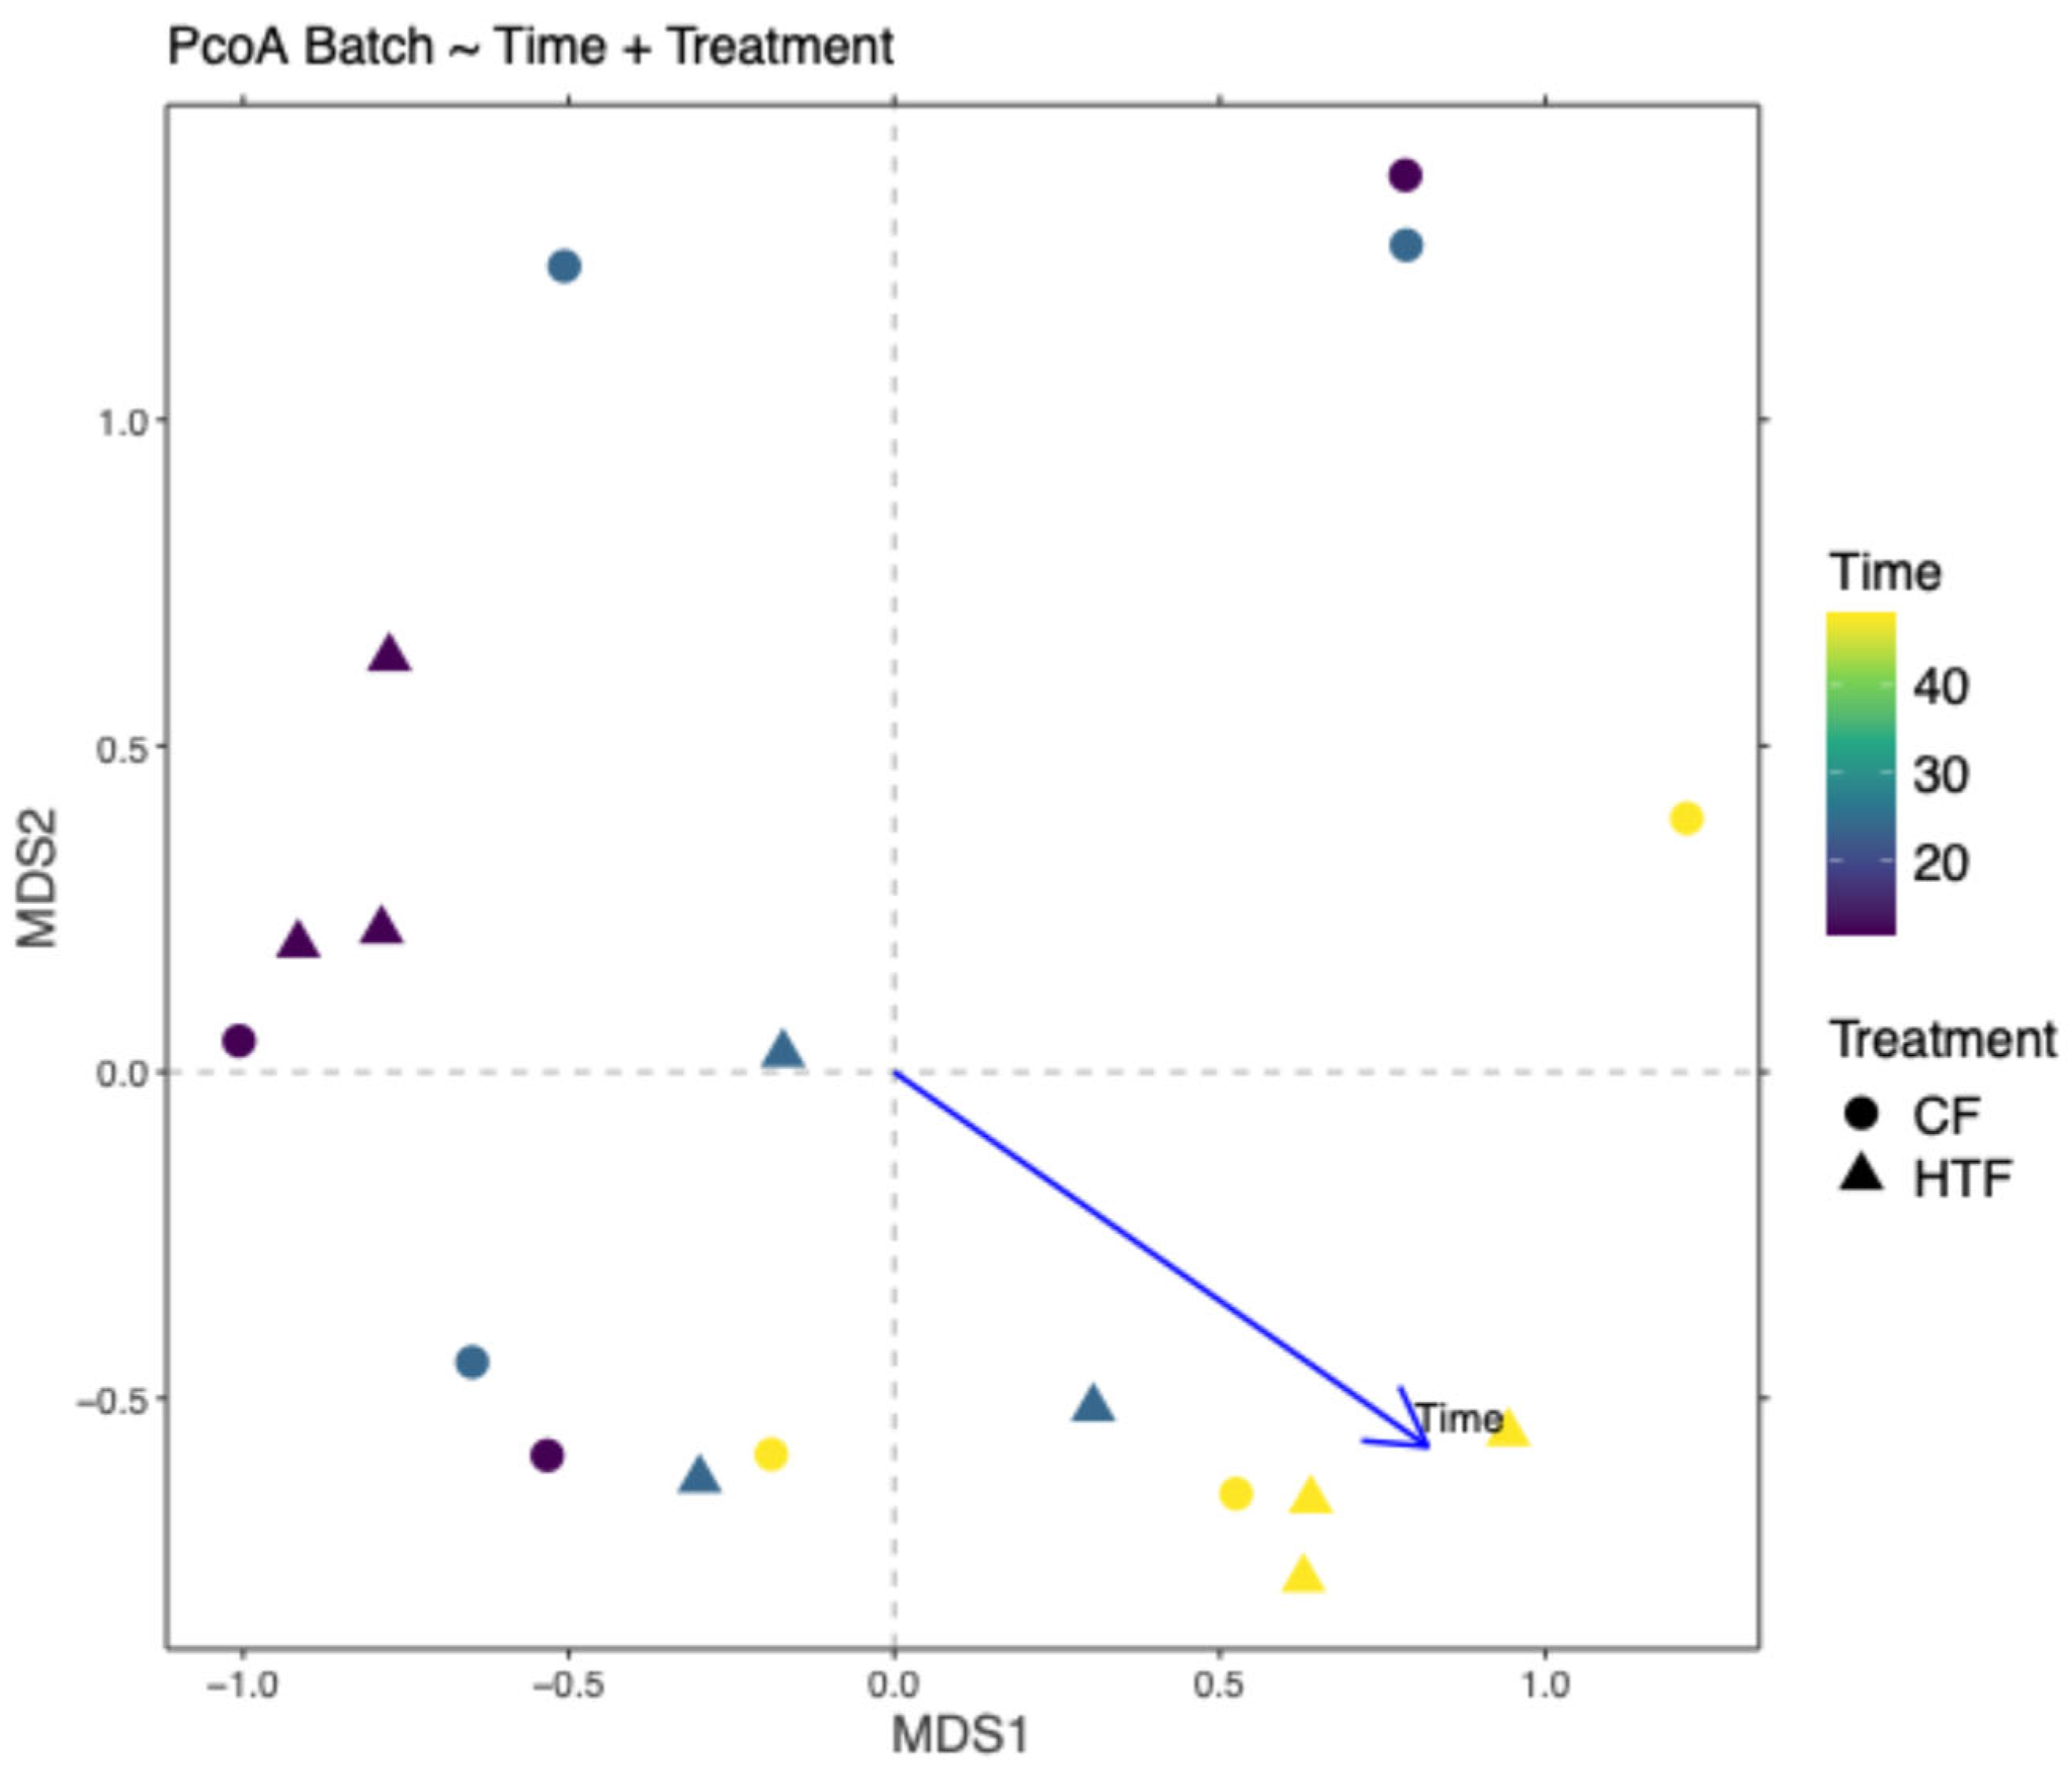
Figure 4.
Bray-Curtis -based Redundancy Analysis model of microbiota samples for T12, T24 and T48. The samples are coloured by Time value (left panel) or by Treatment group (right panel). Variable fitting to the model is represented by a vector for each variable.
Figure 4.
Bray-Curtis -based Redundancy Analysis model of microbiota samples for T12, T24 and T48. The samples are coloured by Time value (left panel) or by Treatment group (right panel). Variable fitting to the model is represented by a vector for each variable.
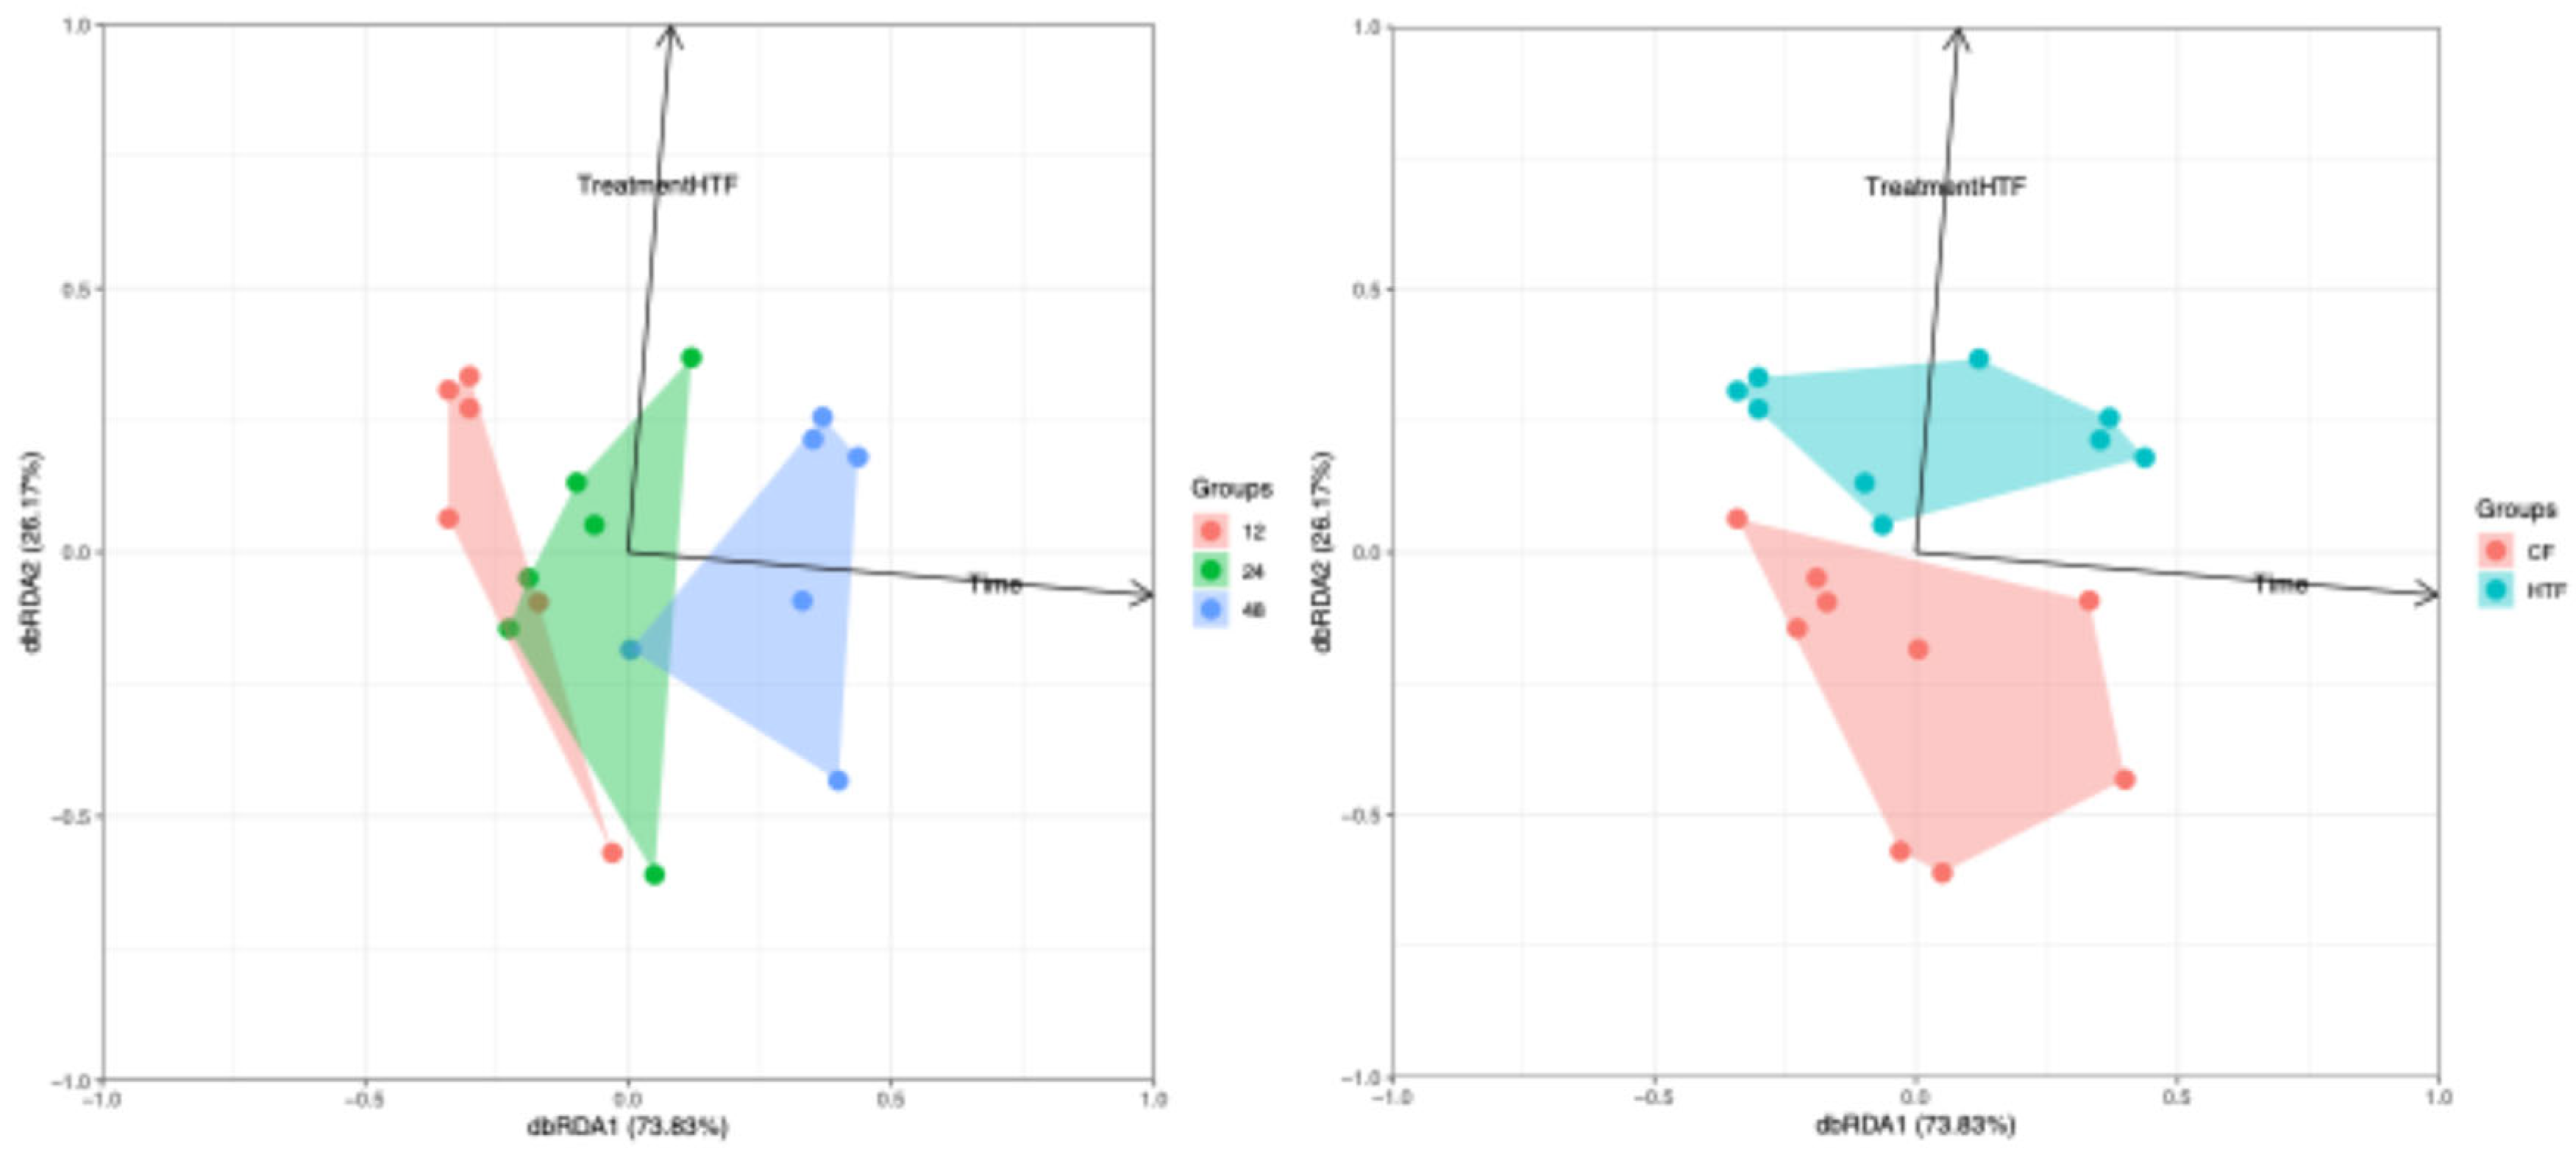
Figure 5.
Volcano plot for Treatment effect with differences in microbial population abundance between control fermenters (CF) and hypoglycin A-treated fermenters (HTF) (a) all Time combined (b) T12, (c) T24, (d) T48. The x-axis represents the log2 fold change, indicating the relative change between the two conditions: CF on the left and HTF on the right. The y-axis represent -log10 p-value. The horizontal dotted line indicates the significant threshold (p = 0.05). Red dots represent populations that are significantly different between CF and HTF.
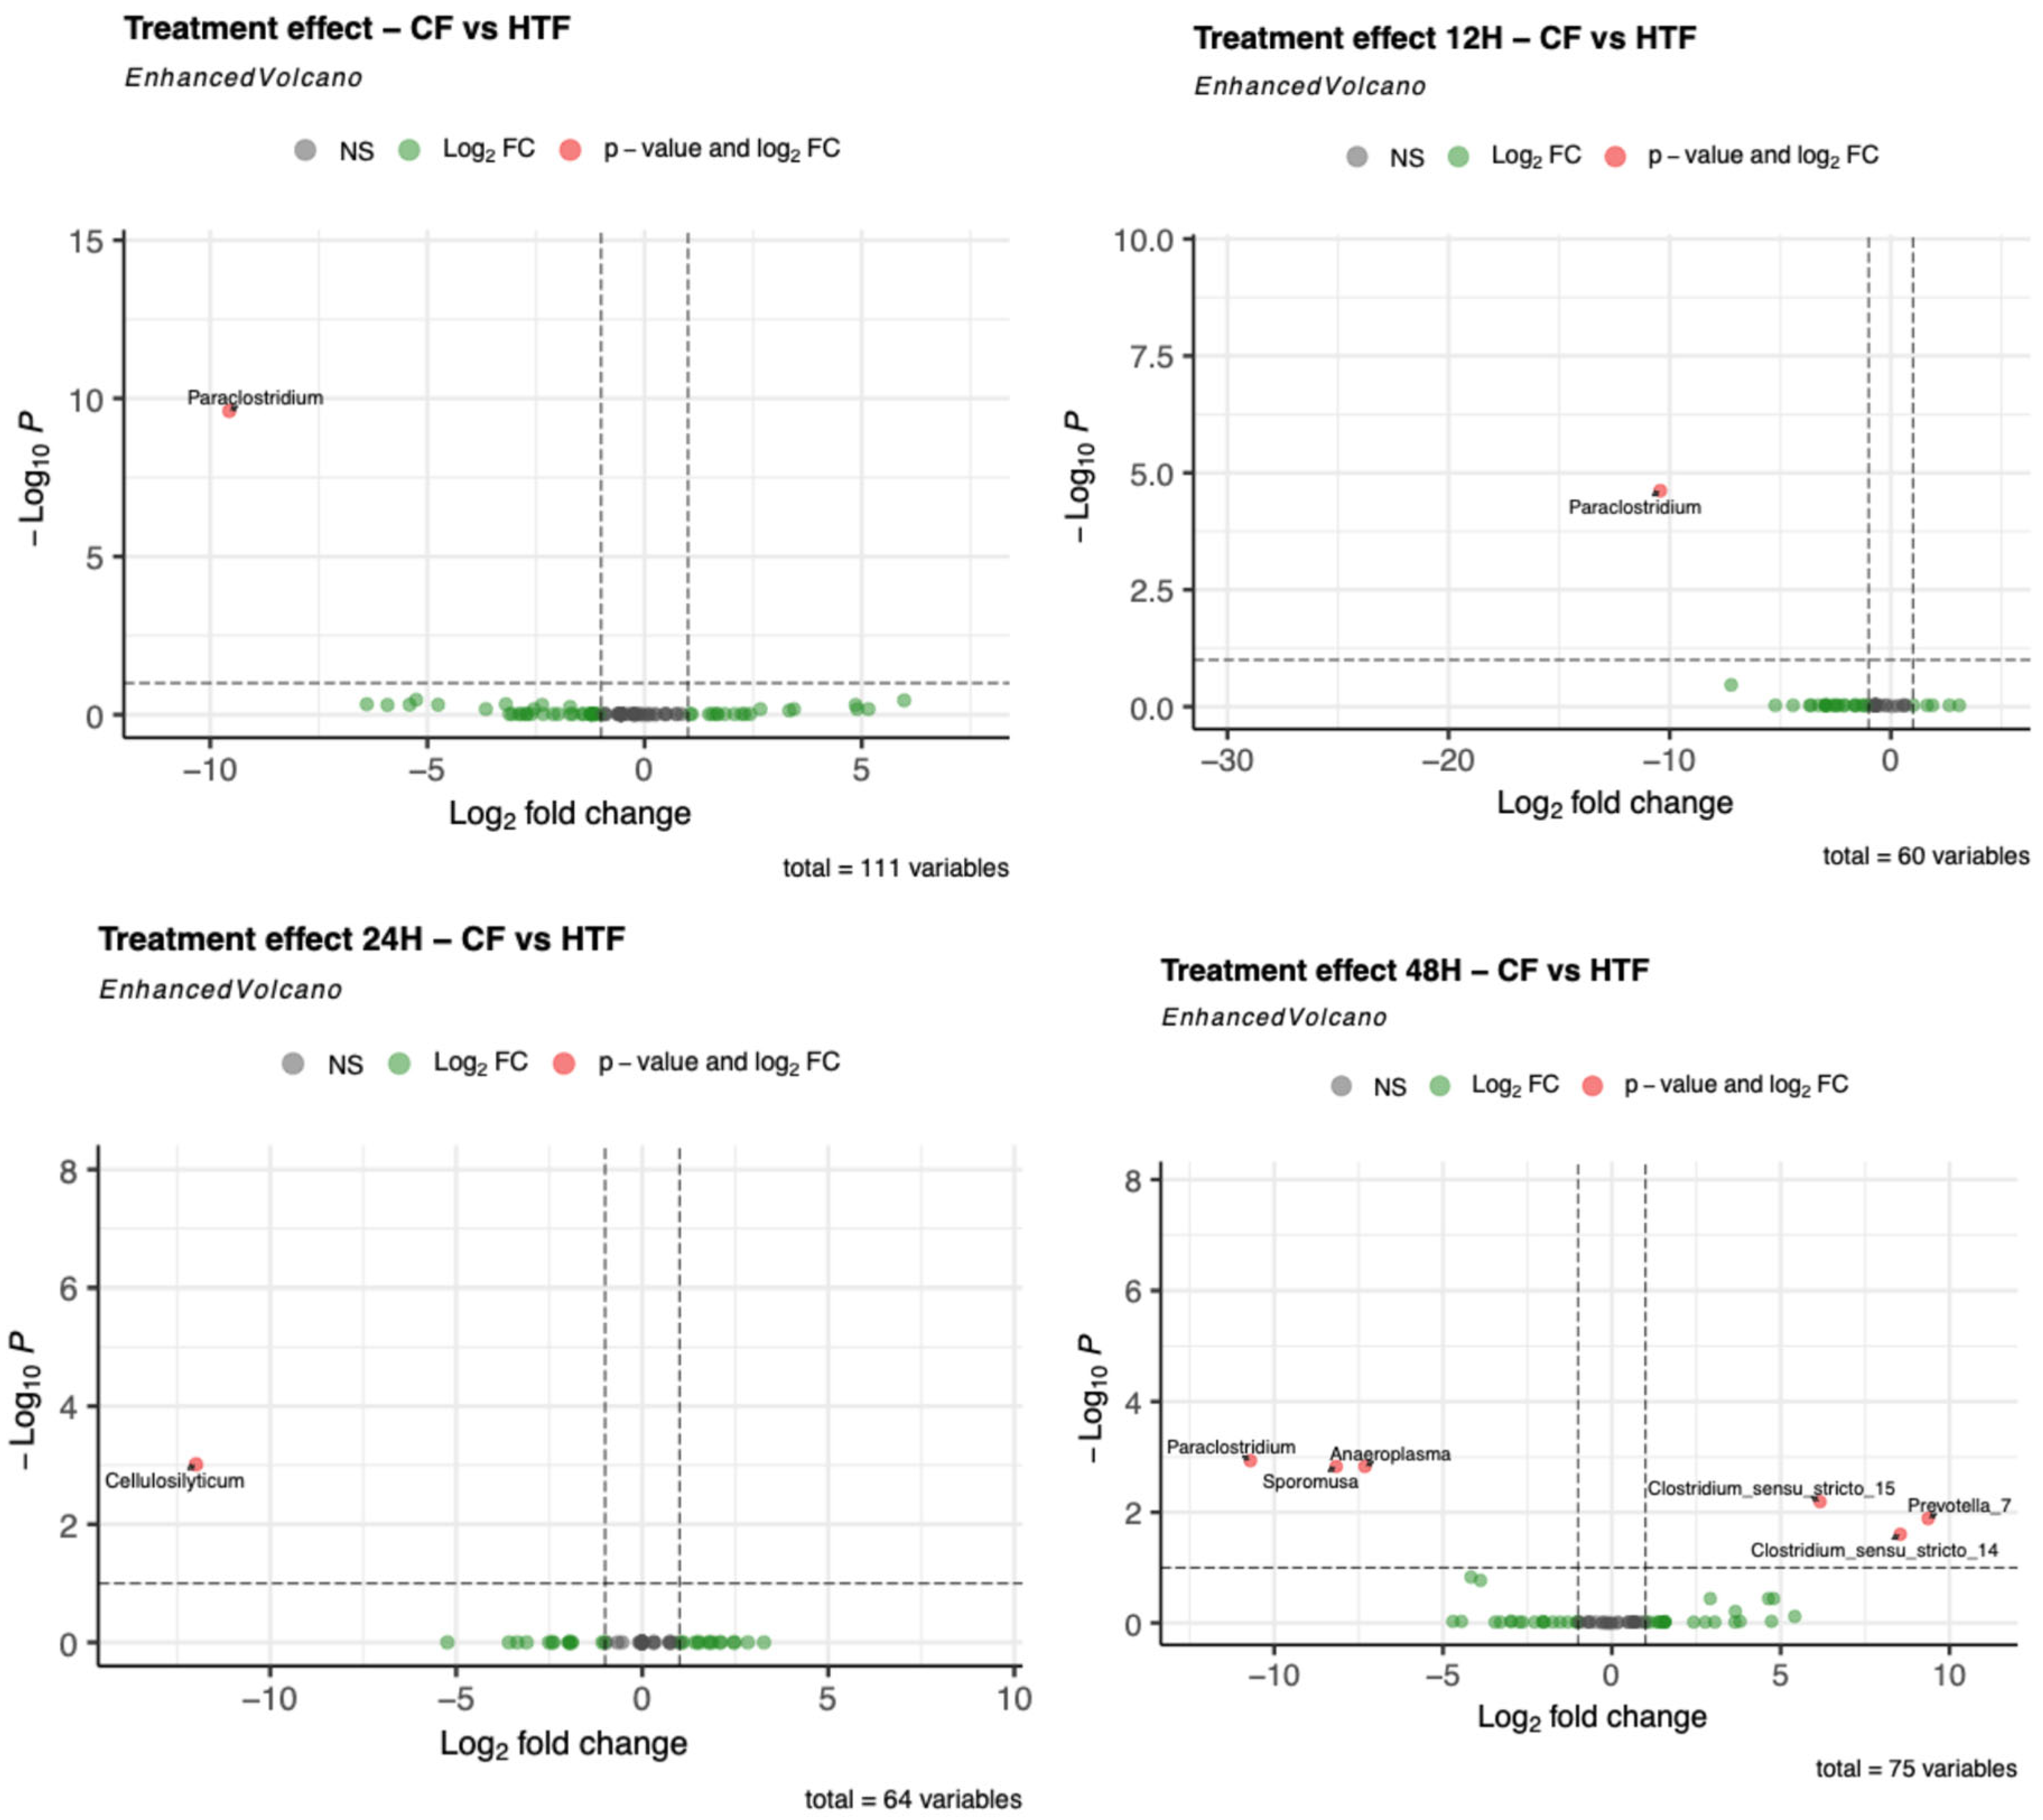
Figure 6.
Graphical representation of acetate concentration (mM) and log-transformed concentration of propionate and butyrate in batch experiment. Symbols represent the mean and the standard deviation. Black dots represent control fermenters and purple diamond represent hypoglycin A-treated fermenters. Significantly different with a p-value of 0.05 or less: * < 0.05; ** < 0.01.
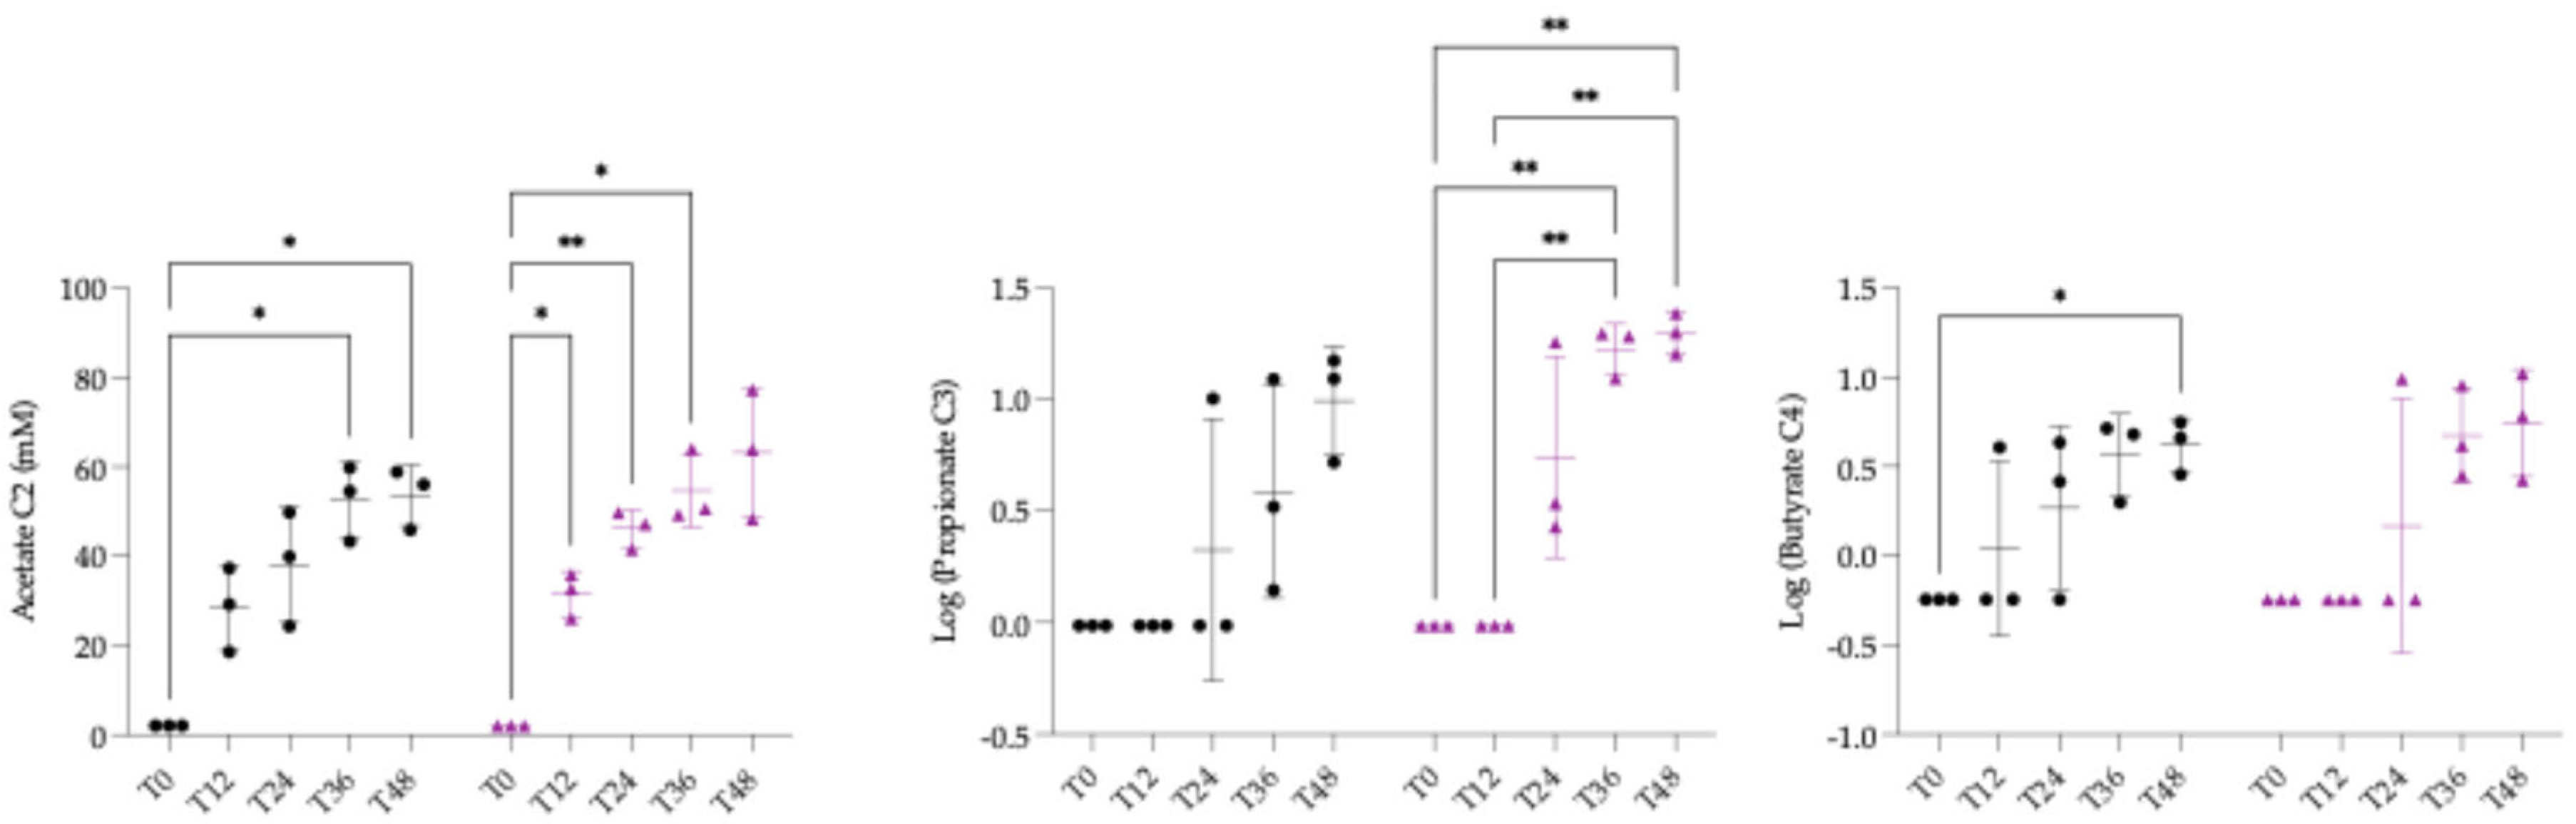
Figure 7.
Graphical representation of log-transformed concentration of hypoglycin A in the control fermenters. Symbols represent the mean and the standard deviation. Significantly different with a p-value of 0.05 or less: * < 0.05; ** < 0.01; *** < 0.001; **** <0.0001.
Figure 7.
Graphical representation of log-transformed concentration of hypoglycin A in the control fermenters. Symbols represent the mean and the standard deviation. Significantly different with a p-value of 0.05 or less: * < 0.05; ** < 0.01; *** < 0.001; **** <0.0001.
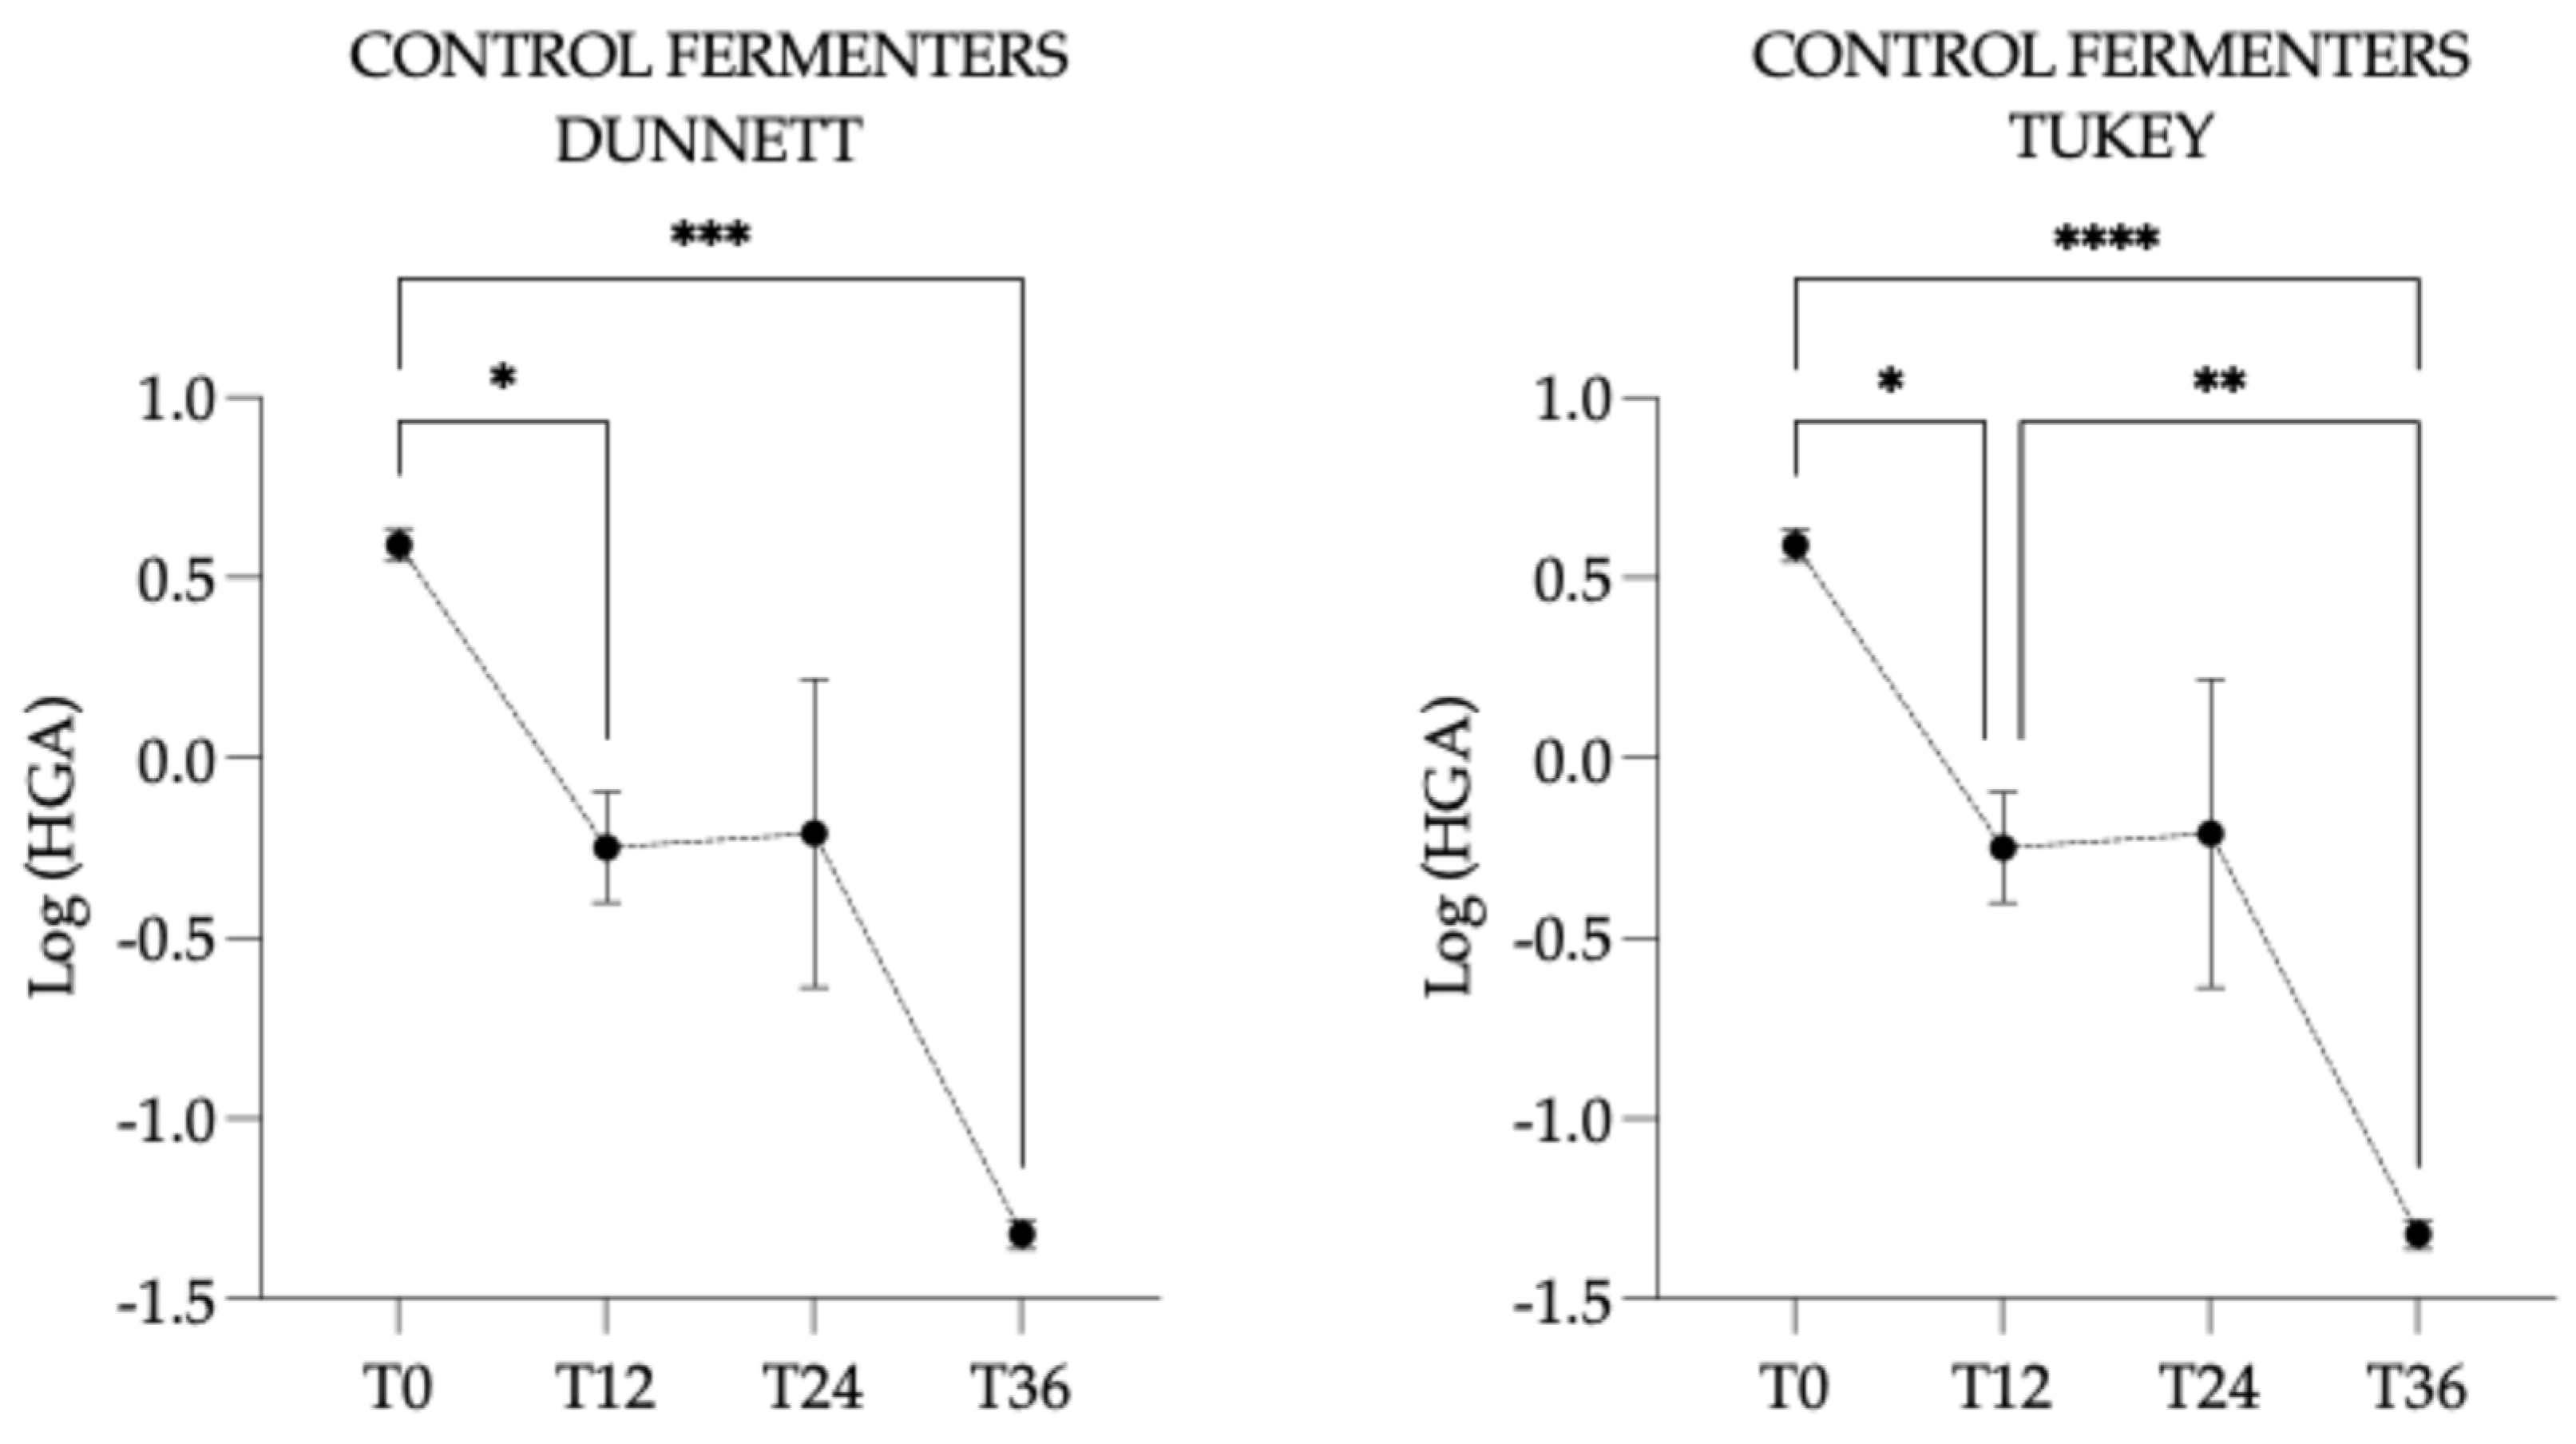
Figure 8.
Graphical representation of log-transformed concentration of hypoglycin A in the hypoglycin A-treated fermenters. Symbols represent the mean and the standard deviation. Significantly different with a p-value of 0.05 or less: * < 0.05; ** < 0.01; *** < 0.001.
Figure 8.
Graphical representation of log-transformed concentration of hypoglycin A in the hypoglycin A-treated fermenters. Symbols represent the mean and the standard deviation. Significantly different with a p-value of 0.05 or less: * < 0.05; ** < 0.01; *** < 0.001.
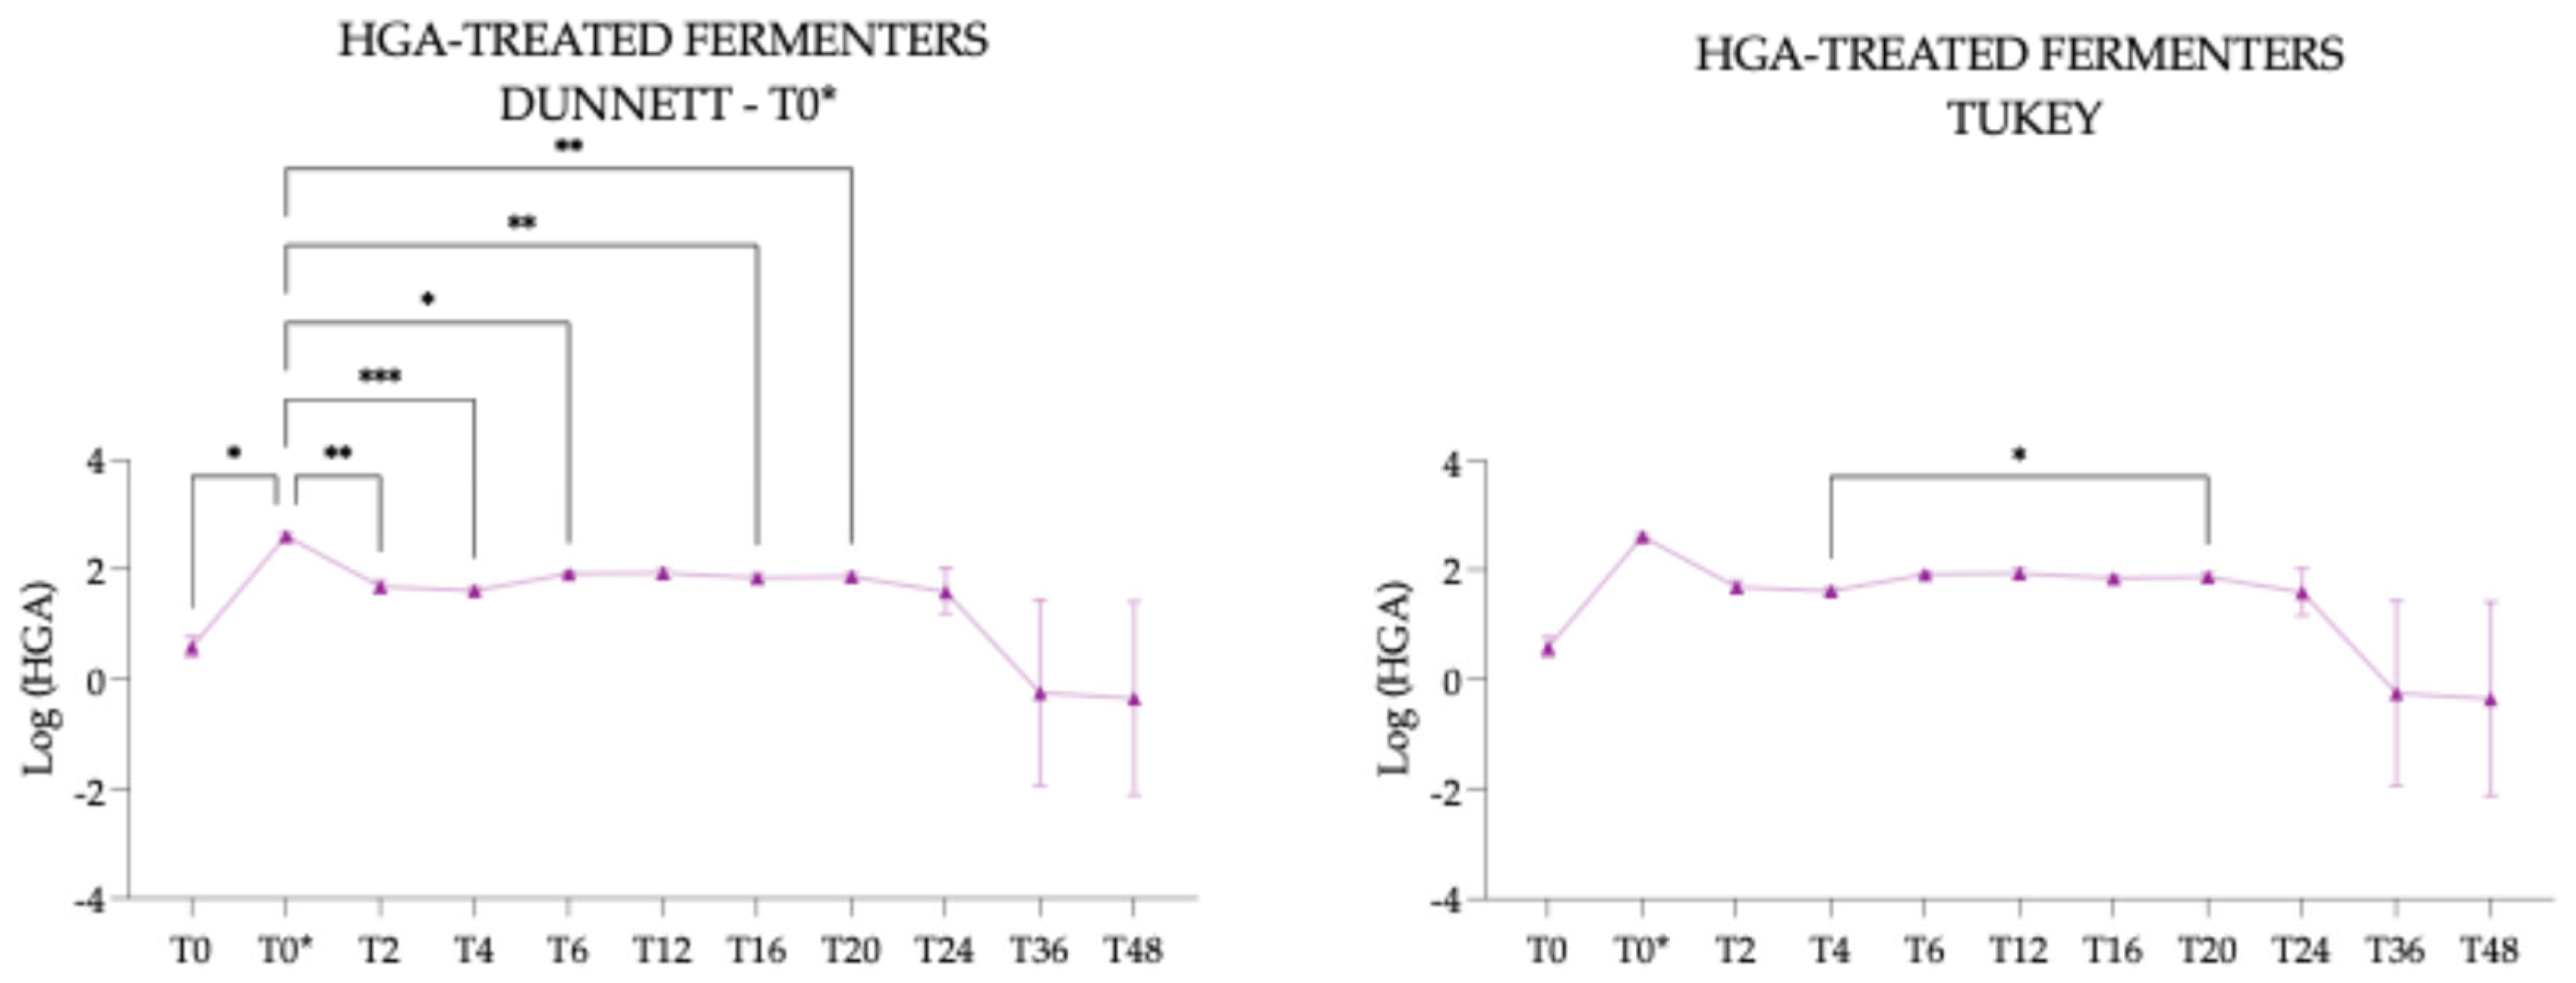
Figure 9.
Graphical representation of log-transformed concentration of Hypoglycin A in the control fermenters and in the Hypoglycin A-treated fermenters. Symbols represent the mean and the standard deviation. Black dots represent control fermenters and purple diamond represent Hypoglycin A-Treated fermenters. Significantly different with a p-value of 0.05 or less: * < 0.05; ** < 0.01; *** < 0.001; ****<0.0001.
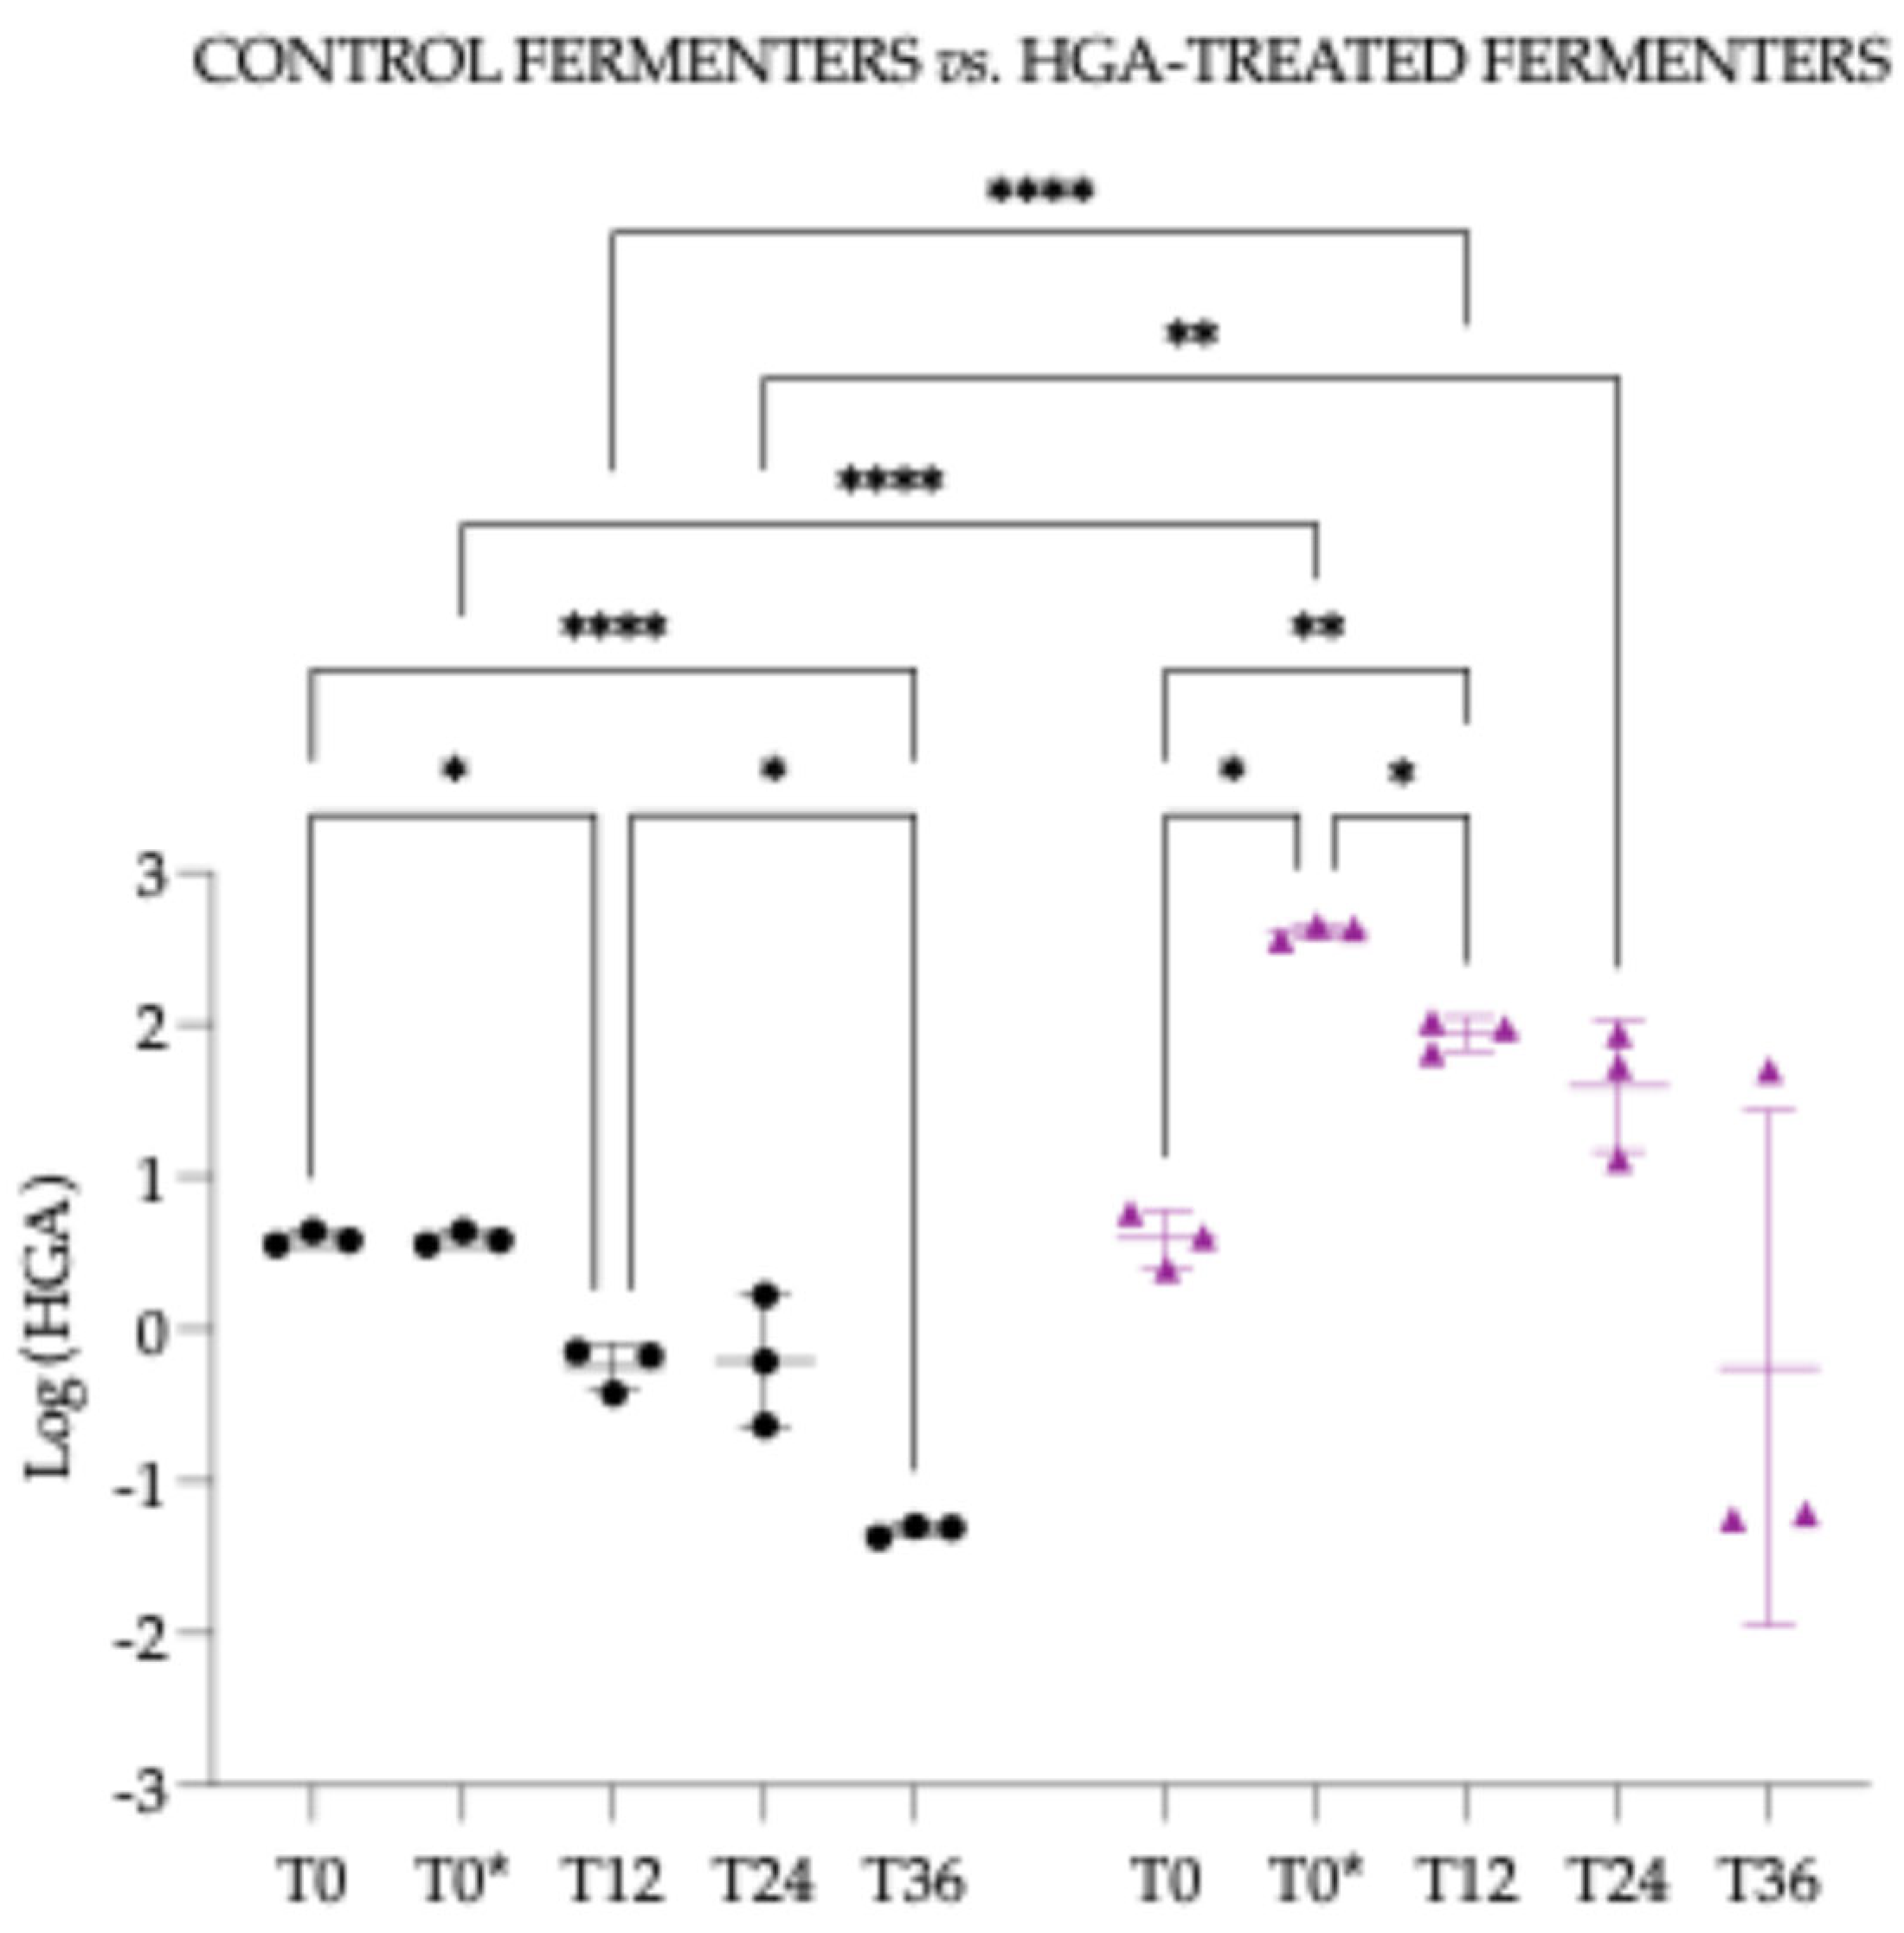
Figure 10.
Graphical representation of normalised hypoglycin A degradation kinetics. Symbols represent the mean and the standard deviation.
Figure 10.
Graphical representation of normalised hypoglycin A degradation kinetics. Symbols represent the mean and the standard deviation.
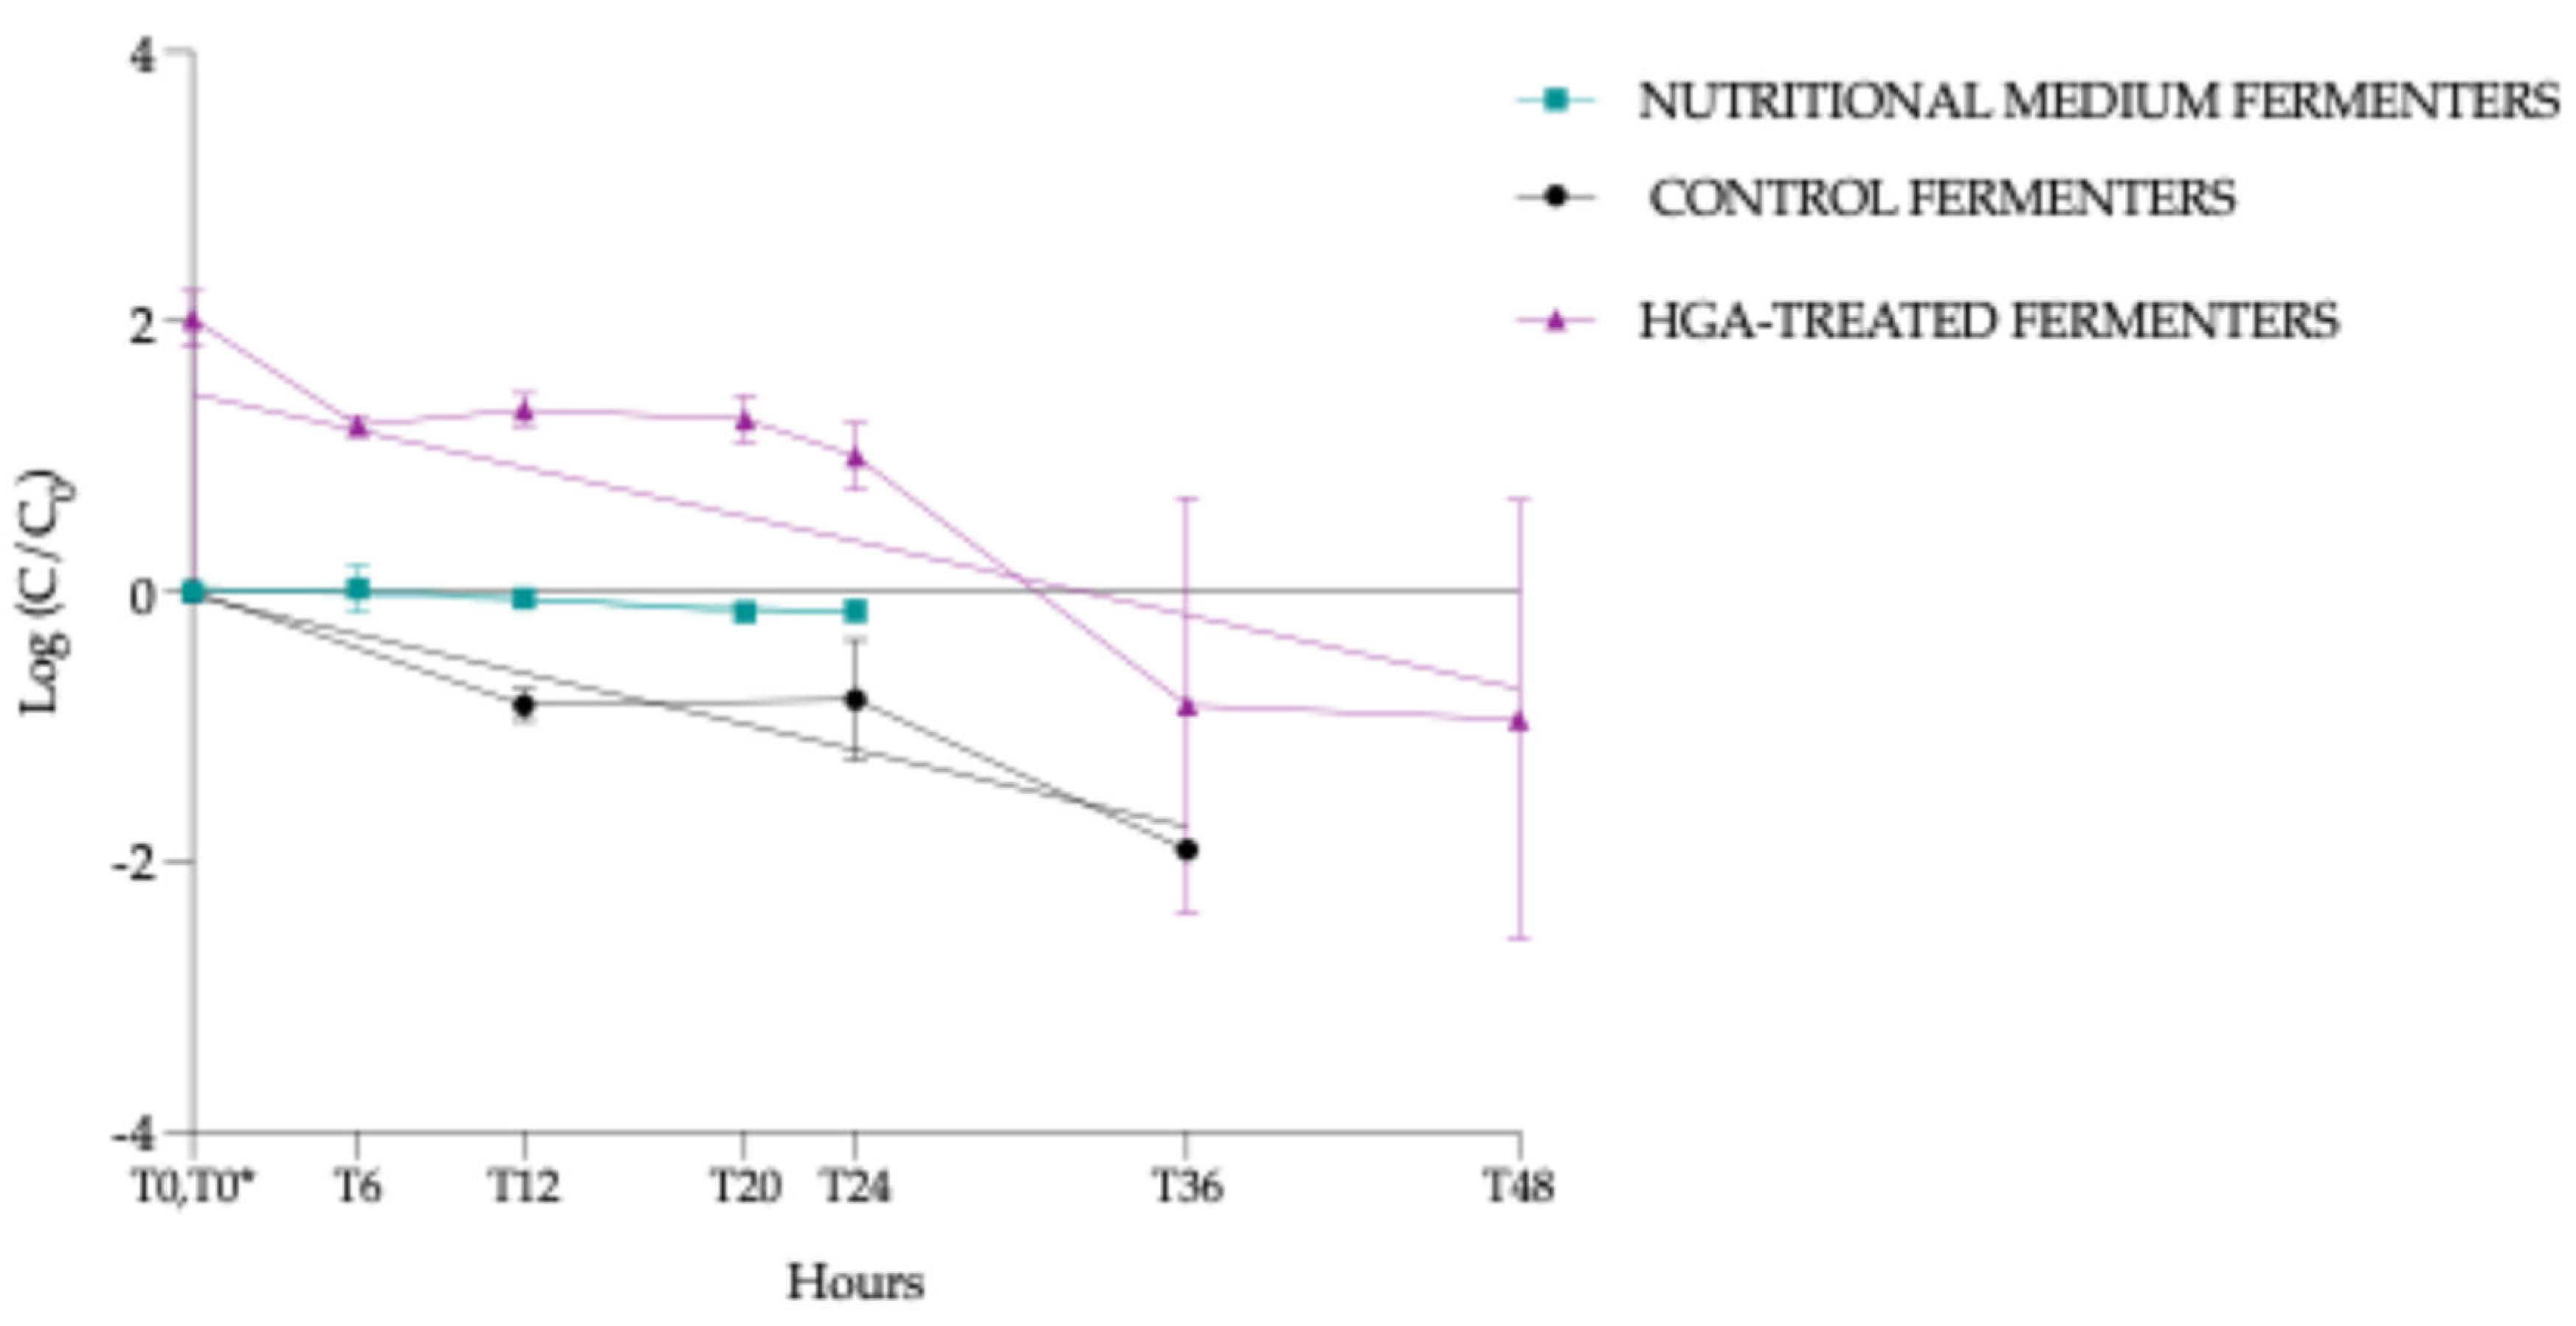

Table 1.
β-diversity pairwise comparisons without T0.
| Pairs | p-value adjusted | |
|---|---|---|
| T12 vs. T24 | 0.5416 | nsig |
| T12 vs. T48 | 0.0189 | * |
| T24 vs. T48 | 0.0265 | * |
Significantly different with a p-value of 0.05 or less: * < 0.05; nsig: Not significant. CF: control fermenters – HTF: hypoglycin A-treated fermenters.
Disclaimer/Publisher’s Note: The statements, opinions and data contained in all publications are solely those of the individual author(s) and contributor(s) and not of MDPI and/or the editor(s). MDPI and/or the editor(s) disclaim responsibility for any injury to people or property resulting from any ideas, methods, instructions or products referred to in the content. |
© 2025 by the authors. Licensee MDPI, Basel, Switzerland. This article is an open access article distributed under the terms and conditions of the Creative Commons Attribution (CC BY) license (http://creativecommons.org/licenses/by/4.0/).
Copyright: This open access article is published under a Creative Commons CC BY 4.0 license, which permit the free download, distribution, and reuse, provided that the author and preprint are cited in any reuse.


