
Submitted:
15 October 2025
Posted:
16 October 2025
You are already at the latest version
Abstract
The hippocampus modulates daily fluctuations in learning and memory, with the muscarinic cholinergic system contributing critically to these cognitive processes. All five muscarinic acetylcholine receptor (mAChR) subtypes (M1–M5) are expressed in this region. This study aimed to characterize the daily variation in hippocampal mAChR expression and affinity in male and female rats. Binding assays were conducted at Zeitgeber times (ZTs) 2, 6, 10, 14, 18, and 22, and M1–M5 subtypes were quantified by immunoprecipitation at ZT2 (light phase) and ZT14 (dark phase). Both sexes exhibited day/night variations in mAChR expression and affinity. In males, peak expression occurred during the light phase (ZTs 2, 6, 10), whereas in females, it was highest during the dark phase (ZTs 14, 18, 22). Receptor affinity was elevated at ZTs 2, 18, and 22 in males, and at ZTs 2, 6, and 10 in females. Subtype analysis revealed that all mAChRs were more abundant during the light phase in males. In females, M2–M5 predominated during the light phase, while M1 was most abundant during the dark phase. These results indicate sex-dependent circadian modulation of hippocampal mAChR expression and affinity, highlighting the temporal regulation of muscarinic cholinergic signaling in learning and memory.
Keywords:
daily rhythms
; muscarinic cholinergic receptors
; hippocampus
; M1-M5 subtypes
; Bmax and KD
; binding assay
; immunoprecipitation
1. Introduction
Every aspect of animal physiology and behavior is influenced by circadian rhythms, which enable organisms to anticipate and adapt to predictable environmental changes. In mammals, the suprachiasmatic nucleus (SCN) functions as the central pacemaker, coordinating the synchronization of peripheral clocks [1,2,3,4]. Several oscillatory structures are also present within the central nervous system (CNS), among which the hippocampus plays a pivotal role in modulating daily variations in learning and memory efficiency [5]. Within this structure, the muscarinic cholinergic system (MChS) is fundamental to the neural circuitry underlying learning and memory processes [6,7,8,9].
The activity of the MChS in mammals exhibits a pronounced circadian rhythm. Acetylcholine (ACh) is predominantly released during wakefulness, which is why it is considered a wakefulness-associated neurotransmitter [10]. Two primary approaches are commonly used to analyze ACh in the CNS: one involves quantifying ACh release through microdialysis assays, and the other measures ACh content in tissue extracts. Studies assessing ACh release in the hippocampus, cortex, and other central structures of rats have consistently demonstrated a positive correlation with periods of behavioral activity [11,12,13,14,15]. In contrast, measurements of ACh in rat hippocampal and cortical tissue extracts have shown an inverse relationship with activity, with the highest levels occurring during the light period [16,17,18].
Regarding muscarinic acetylcholine receptors (mAChRs), several reports indicate that they exhibit circadian rhythmicity, although findings on the timing of peak expression are inconsistent, with peaks reported during both the light and dark periods [10,19,20,21,22]. Despite analyses across different strains, species, and brain regions, most studies suggest a higher number of mAChRs during the animals’ rest periods. It is important to note that these studies are relatively old and methodologically limited, typically analyzing only a few time points per day and often employing a single radioligand concentration in binding assays.
mAChRs are G-protein-coupled receptors classified into five subtypes (M1–M5) based on their structure and the second messenger pathways to which they are coupled. Specifically, M2 and M4 subtypes are generally linked to the inhibition of adenylyl cyclase and a reduction in cAMP, thereby negatively regulating ACh release, whereas M1, M3, and M5 are stimulatory, associated with increased intracellular calcium and inositol triphosphate (IP3) levels [8]. The M1 subtype, through activation of MAP kinase pathways, contributes to long-term changes in gene expression underlying learning and memory processes [23].
All five mAChR subtypes are expressed in the CNS with distinct regional distributions [8,24,25]. In the hippocampus, immunoprecipitation studies indicate a predominance of the M1 subtype (55%), with lower levels of M2 (12%), M3 (11%), M4 (16%), and only mRNA detected for the M5 subtype [24].
Hippocampal mAChRs are closely associated with learning, memory, and synaptic plasticity, with each subtype exerting specific functional roles. Postsynaptic localization has been reported for M1 and M3 receptors on principal hippocampal neurons, whereas M2 and M4 receptors are predominantly presynaptic. M2 receptors, in particular, are considered the primary cholinergic autoreceptors on septohippocampal nerve terminals, inhibiting ACh release and thereby critically modulating cholinergic tone [8,25,26].
Neurodegenerative processes, such as Alzheimer’s disease, are associated with deficits in cholinergic neurotransmission, primarily affecting the hippocampus and cortex. Acetylcholinesterase inhibitors are commonly used to counteract impaired ACh release, as the development of selective agonists for specific mAChR subtypes is challenging due to the high conservation of orthosteric binding sites among mAChRs [23].
Circadian modulation of learning and memory efficiency is an evolutionarily conserved phenomenon, observed across organisms ranging from invertebrates to higher mammals, including humans. The hippocampus exhibits intrinsic oscillatory capabilities, with clock genes such as Per1, Per2, Clock, and Bmal rhythmically expressed in this structure, which has functional implications for synaptic plasticity and behavior [1,5,27,28,29,30].
Given the critical role of mAChRs in learning and memory, and their modulation by the circadian system, the objective of this study was to characterize daily variations in hippocampal mAChR expression. This involved assessing both the total receptor quantity and binding affinity across a 24-hour cycle at 4-hour intervals (Zeitgeber times: ZTs 2, 6, 10, 14, 18, and 22) using a radioligand binding approach. In addition, the expression of the five mAChR subtypes (M1–M5) was examined at two specific time points, ZT2 and ZT14, corresponding to the light and dark periods, respectively.
2. Materials and Methods
Animals
Male and female Wistar rats were supplied and housed in the vivarium room of the Neurobiology Laboratory at the Institute of Biomedical Sciences, University of São Paulo, in polypropylene boxes (4 animals per box). They were kept in rooms with controlled lighting (light/dark cycle of 12h/12h) and temperature (21±3ºC), along with an exhaust system, with water and food provided ad libitum (rodent food - Nuvilab CR1®). Two rooms were utilized: one with an inverted light cycle, where the animals euthanized during the dark phase were placed (Zeitgeber Times: 14, 18, and 22), with lights turned on at 19:00 h; and another room with a normal cycle, housing the animals euthanized during the light phase (Zeitgeber Times: 2, 6, and 10), with lights turned on at 07:00 h. The project received approval from the Animal Use Ethics Committee (CEUA) of the Institute of Biomedical Sciences at the University of São Paulo (ICB-USP) under CEUA no. 9805191021, and the experimental protocol adhered to all standards established by CONCEA.
Experimental Procedure
Male and female rats were housed in the vivarium until they reached 90 days of age, at which point they were euthanized every 4 hours over a 24-hour period, specifically at the Zeitgeber Times (ZTs): 2, 6, 10, 14, 18, and 22. ZTs 2, 6, and 10 corresponded to the light phase, while ZTs 14, 18, and 22 were during the dark phase. ZT stands for “zeitgeber time”, which refers to the light-dark cycle, with ZT=0 marking the start of the light period. The hippocampi were then dissected, isolated, and preserved for the analysis of mAChR expression.
Hippocampal Membrane Preparation
Hippocampal membranes were prepared from 5 animals at each time point (ZTs 2, 6, 10, 14, 18 and 22) across all experiments, following the protocol established by Cardoso et al. [31]. Briefly, the entire hippocampus was isolated, minced, and homogenized in 25 mM Tris-HCl, pH 7.4 (buffer: 5 mM MgCl2, 1 mM EDTA, and 1 mM phenylmethylsulfonyl fluoride-PMSF; with the addition of 0.3 M sucrose) using an Ultra-Turrax homogenizer (T-25, Ika Labortechnik, Staufen, Germany). The homogenate was centrifuged at 1,000 g for 10 min. The supernatant was filtered through two layers of gauze and subsequently centrifuged at 100,000 g for 60 min. The final pellet was resuspended in 1 mL of 25 mM Tris-HCl buffer, pH 7.4, with a Dounce homogenizer, and stored at -80 °C. All procedures were conducted at 4 °C. Protein concentration was measured using a BioRad protein assay, with BSA as the standard (Bio Rad Laboratories, Hercules, CA).
[3H]Quinuclidinyl Benzilate ([3H] QNB) Binding Assay
In saturation binding experiments [31], hippocampal membranes (100 µg protein) were incubated with 0.02 - 2.0 nM [3H]QNB, a subtype-nonselective antagonist with high affinity and very slow dissociation (specific activity 80.0 Ci/mmol; American Radiolabeled Chemicals Inc., St. Louis, MO, USA), both in the absence (total binding) and presence (nonspecific binding) of 1 µM atropine for 1 h at 30 °C. Following incubation, the binding reaction was halted by cooling on ice and rapidly filtered through GF/B glass fiber filters (Whatman International Ltd., Maidstone, UK) under vacuum. The filters were washed three times with ice-cold buffer, partially dried under vacuum, and placed in vials containing OptiPhase HiSafe 3 (Perkin Elmer, Loughborough Leics., UK) scintillation liquid. The amount of radioactivity was measured using a liquid scintillation counter (Perkin Elmer Tri-Carb 5110TR, USA). Specific binding was calculated as the difference between total and nonspecific binding. Nonspecific binding, near the KD value, accounted for approximately 10% of total [3H]QNB binding (data not shown). Saturation binding data were analyzed using the weighted nonlinear least-squares interactive curve-fitting program GraphPad Prism (GraphPad Prism Software Inc., San Diego, CA, USA). A mathematical model for one or two binding sites was employed. The equilibrium dissociation constant (KD) and the binding capacity (Bmax) were determined from a specific saturation hyperbola [32].
Immunoprecipitation Assays for Detection of mAChR Subtypes
Hippocampal membranes (100 µg, in duplicate) from male and female rats at ZT 2 and ZT 14 were radiolabeled with 1.5 nM of [3H]QNB (the maximum binding obtained in saturation binding experiments) in the absence (total binding) and presence of 1 µM atropine (nonspecific binding) for 1 h at 30 °C. The binding reaction was halted by cooling on ice and rapidly filtering through GF/B glass fiber under vacuum. The filters were washed three times with ice-cold buffer, partially dried under vacuum, and placed in scintillation vials containing OptiPhase HiSafe 3. The amount of radioactivity was measured using a scintillation β-counter. Specific binding was calculated as the difference between total and nonspecific binding.
To solubilize the receptors [33,34,35], the membrane preparation (100 µg) (in duplicate) was incubated with 1.5 nM [3H]QNB in the absence (total binding) and presence of 1 µM atropine (nonspecific binding) for 1 h at 30 °C. [3H]QNB-receptors were solubilized with digitonin and sodium deoxycholate in a 25 mM Tris-HCl buffer, pH 7.4 (containing 0.1% sodium deoxycholate), for 1 h at 4 °C. After this, 0.1% digitonin was added. The sample was incubated for 15 min at 4 °C and then centrifuged at 15,000 g for 20 min at 4 °C. The supernatant, which contained the solubilized receptors, was collected and the amount of radioactivity was determined.
The supernatant (100 µl), containing the solubilized receptors, was immunoprecipitated using subtype-specific antibodies. This sample was incubated with 0.5 µg of polyclonal antibodies against goat mAChR subtypes [M1 (C-20, sc 7470), M2 (C-18, sc 7472), M3 (C-20, sc 7474), M4 (C-19, sc 7476), and M5 (C-20, sc 7478), Santa Cruz Biotechnology, CA, USA] (specific) or with IgG (nonspecific) (Sigma Co, MO, USA) in a 25 mM Tris-HCl buffer, pH 7.4, for 4 h at 4 °C. Following this incubation, 20 µl of Pansorbin (Calbiochem, CA, USA) was added and incubated with agitation for 1 h at 4 °C, then centrifuged at 15,000 g for 10 min. The pellet was washed with 200 µl Tris-HCl buffer, pH 7.4, and centrifuged again at 15,000 g for 10 min. The amount of radioactivity was measured in 50 µl of Pansorbin deposit ([3H]QNB-subtype-specific antibodies) (total) or Pansorbin deposit ([3H]QNB-IgG) (nonspecific). The specific immunoprecipitation (the difference between total and nonspecific) was determined, and results were expressed as fmol/mg of protein.
To validate our immunoprecipitation assays, the percentage of specific immunoprecipitation for each mAChR subtype in hippocampal membranes from male rats was calculated by dividing the amount of [3H]QNB counts in the Pansorbin pellet by the total counts in the supernatant and Pansorbin pellet (Shiozaki et al. 1999) [35].
Statistical Analysis
Data were expressed as mean ± standard error of the mean (SEM). Data were subjected to the Shapiro-Wilk normality test. Statistical differences between groups were assessed by one-way ANOVA followed by the Newman-Keuls post-test. Student’s t-test was used to compare two groups. The significance level for rejection of the null hypothesis was set at 5% (p < 0.05).
3. Results
3.1. [3H]QNB Binding in the Rat Hippocampus: Analysis of Daily Rhythmicity of mAChRs in Male and Female Rats
The binding of [3H]QNB to hippocampal membranes from each experimental group (ZT2 to ZT22) in both male and female rats was found to be specific and saturable. The saturation hyperbola analysis of specific binding best conformed to a one-site model (Figure 1 and Figure 2). An analysis of three experiments, each performed in duplicate, revealed the maximum number of binding sites (Bmax) and the dissociation constant (KD), as summarized in Table 1 and Table 2.
In male rats, analysis of Bmax across Zeitgeber times (ZTs) revealed significant variation (one-way ANOVA: p < 0.001) (Figure 3A, Table 1). Post hoc Newman-Keuls tests indicated that Bmax values at ZTs 2, 6, and 10 were significantly elevated relative to ZT22 (p < 0.01), while values at ZTs 14 and 18 were significantly different from ZT6 (p < 0.05). No statistically significant differences were observed among Bmax values during the light phase at ZTs 2, 6, and 10 (20.45 ± 1.86, n = 3; 24.14 ± 2.14, n = 3; and 20.92 ± 2.20 fmol/mg protein, n = 3, respectively; p > 0.05), nor among values during the dark phase at ZTs 14, 18, and 22 (14.81 ± 0.79, n = 3; 13.46 ± 2.88, n = 3; and 7.94 ± 1.11 fmol/mg protein, n = 3, respectively; p > 0.05). Although not all comparisons reached statistical significance, Bmax values exhibited a clear trend toward reduction during the dark phase (ZTs 14, 18, and 22) compared to the light phase (ZTs 2, 6, and 10).
In male rats, KD values also varied significantly across ZTs (one-way ANOVA: p<0.01) (Figure 3B, Table 1), with a temporal profile distinct from that observed for Bmax. Post hoc Newman-Keuls analysis revealed that KD values at ZTs 2, 18, and 22 (0.16 ± 0.05, n = 3; 0.19 ± 0.12 nM, n = 3; 0.12 ± 0.09 nM, n = 2, respectively) were significantly lower than at ZT6 (0.92 ± 0.20 nM, n = 3) (p < 0.05). No significant differences were detected among KD values during the dark phase, at ZTs 14, 18, and 22 (0.51 ± 0.05, n = 2; 0.19 ± 0.12, n = 3, 0.12 ± 0.09 nM, n = 2, respectively; p > 0.05), nor between these and the values observed during the light phase at ZTs 2 and 10 (0.16 ± 0.05, n = 3; 0.58 ± 0.05 nM, n = 3, respectively; p > 0.05). These findings indicate that KD exhibits time-of-day-dependent modulation, although without a consistent light/dark phase pattern.
The data revealed a daily variation of hippocampal muscarinic acetylcholine receptors (mAChRs) in 90-day-old male rats, with changes observed in both receptor density (Bmax) and binding affinity (KD). Receptor density (Figure 3A) differed between light and dark phases, with higher values at ZTs 2, 6, and 10 (light phase) and lower values at ZTs 14, 18, and 22 (dark phase). Receptor affinity (Figure 3B), expressed as the reciprocal of KD, reached maximal levels at ZT2 (light phase) and at ZTs 18 and 22 (dark phase), thereby indicating an enhancement of receptor affinity during the dark-to-light transition. Both maximal density and affinity occurred at ZT2, suggesting a peak in receptor function at this time. At ZT14, receptor density decreased, accompanied by intermediate affinity values, reflecting a reduced receptor activity at the beginning of the dark phase.
In female animals, both Bmax and KD values varied significantly across the different Zeitgeber times (ZTs) (one-way ANOVA: p < 0.001) (Figure 4, Table 2). No significant differences in Bmax were observed among the daytime ZTs 2, 6, and 10 (9.34 ± 1.15, n = 3; 15.24 ± 1.74, n = 3; and 11.92 ± 1.21 fmol/mg protein, n = 3, respectively), nor among the nighttime ZTs 14, 18, and 22 (25.67 ± 3.64, n = 3; 32.39 ± 6.35, n = 3; and 28.41 ± 1.61 fmol/mg protein, n = 3, respectively) (Figure 4A; Table 2). Nevertheless, Bmax values were consistently higher during the night compared with the day. Post hoc analysis (Newman–Keuls test) revealed significant differences between the daytime ZTs (2, 6, and 10) and the nighttime ZT 18, as well as between daytime ZTs 2 and 10 and ZT 22 (p < 0.05).
Specific binding assays yielded KD values of 0.05 ± 0.01 nM (n = 3), 0.12 ± 0.03 nM (n = 3), and 0.15 ± 0.01 nM (n = 3) for ZTs 2, 6, and 10, respectively, with no significant differences among these daytime values (Figure 4B, Table 2). In contrast, KD values measured at nighttime ZTs 14, 18, and 22 were higher than those recorded during the day, although they did not differ significantly from one another (0.49 ± 0.17 nM, n = 3; 0.41 ± 0.12 nM, n = 3; and 0.31 ± 0.04 nM, n = 3, respectively). Significant differences were observed between daytime ZTs 2, 6, and 10 and ZT 14, and between ZT 2 and ZT 18 (Newman–Keuls test: p < 0.05).
The data evidenced that hippocampal mAChRs in 90-day-old female rats undergo daily fluctuations in both receptor density (Bmax) and binding affinity (KD). Receptor density (Figure 4A) displayed a diurnal pattern, with elevated values during the dark phase (ZTs 14, 18, and 22). This contrasts with the pattern observed in male rats, where receptor density peaked during the light phase (ZTs 2, 6, and 10). Conversely, receptor affinity (Figure 4B) in females was highest during the light phase (ZTs 2, 6, and 10). Notably, at ZT22—near the end of the dark phase—a peak in receptor density coincided with an intermediate affinity value, suggesting that hippocampal muscarinic cholinergic activity may reach its maximum at this time in females. In males, peak functionality occurred at ZT2, at the onset of the light phase. The lowest functionality in females appears to occur at ZT14, marked by reduced receptor affinity and moderate receptor density—i.e., at the beginning of the dark phase—a pattern similar to that observed in males.
3.2. Comparison of mAChR Subtypes (M1 to M5) During Light (ZT2) and Dark (ZT14) Phases in Male and Female Rats
A comparative analysis of hippocampal mAChR subtypes (M1–M5) in male rats at ZT2 and ZT14, corresponding to the light and dark phases, respectively, is shown in Figure 5A. Expression of subtypes M1–M4 was significantly higher at ZT2 (light phase: M1 = 7.03 ± 1.20, n = 6; M2 = 4.37 ± 0.57, n = 7; M3 = 2.42 ± 1.13, n = 7; M4 = 3.20 ± 0.22 fmol/mg protein, n = 3) compared with ZT14 (dark phase: M1 = 2.80 ± 1.19, n = 3; M2 = 0.18 ± 0.12, n = 4; M3 = 0.17 ± 0.12, n = 4; M4 = 0.24 ± 0.21, n = 4) (t-test: p < 0.05). No significant difference was observed for M5 (ZT2 = 1.18 ± 0.22, n = 5; ZT14 = 0.70 ± 0.45 fmol/mg protein, n = 4; t-test: p > 0.05).
Figure 5B shows the comparative analysis of the same mAChR subtypes in female rats at ZT2 and ZT14. Expression of subtypes M2–M4 was significantly higher at ZT2 (light phase: M2 = 4.13 ± 0.84, n = 6; M3 = 1.43 ± 0.51, n = 7; M4 = 2.61 ± 1.11 fmol/mg protein, n = 5) than at ZT14 (dark phase: M2 = 0.18 ± 0.12, n = 3; M3 = 0.16 ± 0.12, n = 3; M4 = 0.24 ± 0.20 fmol/mg protein, n = 3) (t-test: p < 0.05). Conversely, M1 expression was significantly lower at ZT2 compared with ZT14 (ZT2 = 1.71 ± 0.86, n = 6; ZT14 = 2.79 ± 1.19 fmol/mg protein, n = 3; t-test: p < 0.05). No significant difference was observed for M5 (ZT2 = 1.30 ± 0.50, n = 7; ZT14 = 0.70 ± 0.45 fmol/mg protein, n = 3; t-test: p > 0.05).
This immunoprecipitation assay for hippocampal samples from 90-day-old male rats demonstrated that the distribution of mAChR subtypes is consistent with previously published findings from immunohistochemistry, receptor binding, and immunoprecipitation studies in the hippocampus of male rats and mice [24,36,37]. M1 mAChRs constitute the largest proportion in the hippocampus (68.1 ± 6.1%, n = 4), whereas the remaining subtypes are present at lower levels. The percentage distributions of M2, M3, M4, and M5 mAChR subtypes are 31.5 ± 6.4% (n = 5), 11.2 ± 4.7% (n = 6), 10.5 ± 5.8% (n = 4), and 0.6 ± 0.4% (n = 3), respectively (data not shown).
4. Discussion
In mammals, circadian rhythms are generated by the suprachiasmatic nucleus (SCN) of the hypothalamus, which functions as the master pacemaker and coordinates peripheral oscillators throughout the central nervous system (CNS) and in peripheral organs. The hippocampus is considered a secondary oscillator, as it displays oscillations in long-term potentiation (LTP), as well as in memory encoding, consolidation, and retrieval. These rhythmic variations are accompanied by time-dependent expression of core clock genes such as Per1, Per2, Clock, and Bmal1, suggesting that local molecular clocks modulate synaptic plasticity and cognitive performance across the day-night cycle [1,5,27,28,29,30].
Muscarinic acetylcholine receptors (mAChRs) are widely distributed throughout the CNS, particularly in the hippocampus, where they play a crucial role in learning and memory processes. A major source of cholinergic projections to the hippocampus arises from the basal forebrain and establishes synaptic contacts with intrinsic glutamatergic and GABAergic neurons within this structure [8].
Extensive evidence documents the rhythmicity of acetylcholine (ACh) release and content in several CNS regions, including the hippocampus and cortex, indicating a correlation between the peak activity of this neurotransmitter system and the behavioral activity patterns of the studied animals. However, data concerning the circadian rhythmicity of mAChRs remain scarce and are mostly derived from studies conducted in the 1980s. Moreover, many of these early investigations relied on a single concentration of the mAChR antagonist [³H]QNB rather than constructing full saturation binding curves [19,22,38]. Using [³H]QNB binding, Por and Bondy [22] reported a peak in hippocampal mAChR expression at midnight, corresponding to the dark period. Similarly, Mash et al. [21] observed circadian rhythmicity in mAChRs within the forebrain and brainstem, noting an increased number of receptors at the onset of the light phase. According to the review by Hut and Van der Zee [10], muscarinic cholinergic transmission in the nervous system is more active during wakefulness due to elevated ACh release, which inversely correlates with receptor density.
The present study demonstrates that daily rhythmicity characterizes the expression of mAChRs in the hippocampus—a region rich in these receptors and fundamentally involved in learning and memory. This rhythmicity affects both receptor density and sensitivity, as reflected by changes in binding affinity. Such variations were observed in both male and female rats; however, the timing of peak expression and affinity differed between sexes.
The analysis of parameters derived from the [³H]QNB binding curves, specifically Bmax and KD, revealed that 90-day-old male rats exhibit a higher density of hippocampal mAChRs during the light period at ZTs 2, 6, and 10, whereas receptor density decreases during the dark period at ZTs 14, 18, and 22. Regarding receptor affinity, an increase was observed at ZT2 during the light phase and again at ZTs 18 and 22 during the dark phase. It is noteworthy that muscarinic cholinergic function in the hippocampus appears to be enhanced when both receptor density and affinity are elevated simultaneously, which occurs at the beginning of the light period (ZT2). At ZTs 18 and 22, although receptor affinity remains high, receptor density is reduced.
Although previous studies have not reported daily variations in mAChR affinity [20]—with the exception of Mash et al. [21]—our findings suggest that, in addition to fluctuations in receptor expression, hippocampal mAChRs also exhibit daily variations in binding affinity throughout the day.
Our data for male rats contradict the limited literature reporting an increase in hippocampal mAChRs during the night (Por and Bondy 1981) [22]. It is important to note that several studies associate enhanced cholinergic function with the wakefulness period of the studied animals [10,39]. This relationship holds true for ACh release; however, it does not apply to the number or affinity of mAChRs in males, in which the highest receptor density is observed during the light period. Indeed, Mizuno et al. [15] demonstrated variations in hippocampal ACh release in female rats, showing a significant increase during the dark phase, coinciding with elevated motor activity. Other studies have also confirmed that ACh release in the rat hippocampus correlates with locomotor activity, showing a marked increase at the onset of the dark period. This rhythm persists under constant darkness, suggesting regulation by a circadian oscillator, most likely the suprachiasmatic nucleus [12,40].
In our study, mAChRs were analyzed under conditions in which a light–dark cycle was maintained and, therefore, under entrained conditions; consequently, we cannot ascertain whether this rhythm persists in the absence of a zeitgeber.
A contrasting pattern of maximal mAChR density was observed between males and females. In males, receptor expression peaked during the light period, whereas in females, the highest expression occurred during the dark period. The relationship between receptor density and affinity indicated greater functional activity of mAChRs at ZT2—corresponding to the beginning of the light phase in males—and at ZT22—near the end of the dark phase in females—showing a relatively small temporal difference between sexes.
In females, it is important to note that the phases of the estrous cycle were not determined, resulting in a random distribution of animals across different stages. Estrogen acts as a potent modulator of circadian rhythmicity, influencing the expression of specific clock genes, clock-controlled genes, and, most notably, locomotor activity [41]. According to Alvord et al. [40], the proestrus and estrus phases in rats are associated with a phase advance and a prolonged duration of locomotor activity.
The regulation of cholinergic neurotransmission by steroid hormones is also well established. Cardoso et al. [31,33] demonstrated that hippocampal mAChRs are upregulated following ovariectomy compared with rats in the proestrus phase, with increases observed across all receptor subtypes (M1–M5). Several other studies have similarly reported that estrogen modulates mAChR expression in various brain regions of female rats, leading to greater variability in mAChR density and affinity in females than in males [42,43,44]. Furthermore, estrogen receptor expression in the hippocampus fluctuates across the estrous cycle, rendering this region particularly sensitive to changes in ovarian hormone levels [45].
In general, the expression of mAChR subtypes was higher during the light period compared with the dark period, although this difference did not reach statistical significance for M5. An exception was observed in females, in which M1 expression was elevated during the dark period. Consistent with these findings, the total number of mAChRs in males was also higher during the light phase. In contrast, females exhibited greater total mAChR expression during the dark phase, while M2–M4 subtypes were predominantly expressed during the light phase. The increased expression of the M1 subtype at night may partly account for the higher overall mAChR levels during this period, given the predominance of M1 in the rat hippocampus.
Our results also revealed that mAChR sensitivity—reflecting both receptor density and affinity—is higher in males at the beginning of the light period, whereas in females it peaks at the end of the dark period. Interestingly, when considering male receptor affinity alone, an increase is observed toward the end of the dark phase, coinciding with a rise in ACh release and thereby enhancing cholinergic function at that time. Notably, mAChR functionality in females appears to be maximal at the end of the dark period, characterized by increased receptor density and affinity accompanied by elevated ACh release.
In conclusion, cholinergic transmission in the hippocampus—crucial for learning and memory processes—exhibits daily rhythmicity in its functional activity. While ACh release is primarily associated with periods of behavioral activity, an opposite pattern is observed for mAChR expression in male rats. This inverse relationship may reflect a negative feedback mechanism between ACh release and mAChR expression, given that receptor internalization constitutes a key regulatory process for mAChRs [46]. A comprehensive investigation simultaneously assessing both mAChR expression and ACh release in the rat hippocampus across the circadian cycle would further elucidate the dynamics of this interaction.
Author Contributions
Conceptualization: S.C.A., J.C.N., and F.M.F.A.; methodology: A.L.B.A. and J.R.M.S.; formal analysis: S.C.A., F.M.F.A.; writing - original draft preparation: S.C.A. and F.M.F.A.; writing - review and editing: J.C.N., A.L.B.A. and J.R.M.S.; resources: S.C.A., F.M.F.A. and J.C.N.; funding acquisition: J.C.N., S.C.A., F.M.F.A. All authors have read and agreed to the published version of the manuscript.
Funding
This work was supported by the São Paulo State Research Support Foundation (FAPESP) under grant numbers 2019/24327-5 and 2022/15519-0; and by the Coordination for the Improvement of Higher Education Personnel (CAPES), under grant number 001.
Institutional Review Board Statement
All animal procedures were approved by the Animal Use Ethics Committee (CEUA) of the Institute of Biomedical Sciences, University of São Paulo (Approval No. 9805191021), on December 1, 2021, and were conducted in accordance with the guidelines of CONCEA (National Council for the Control of Animal Experimentation) for the care and use of laboratory animals.
Acknowledgments
I would like to acknowledge Julieta H. Scialfa, Paulo H. Vieira Lima, and Maria Eduarda N. Marques for their outstanding technical assistance, particularly in the implementation and optimization of the experimental protocols.
Conflicts of Interest
The authors declare no conflict of interest. The funders had no role in the design of the study; in the collection, analyses, or interpretation of data; in the writing of the manuscript, or in the decision to publish the results.
References
- Hartsock, M.J.; Spencer, R.L. Memory and the circadian system: identifying candidate mechanisms by which local clocks in the brain may regulate synaptic plasticity. Neurosci Biobehav Rev 2020, 118, 134–162. [Google Scholar] [CrossRef]
- Mohawk, J.A.; Green, C.B.; Takahashi, J.S. Central and peripheral circadian clocks in mammals. Annu Rev Neurosci 2012, 35, 445–462. [Google Scholar] [CrossRef] [PubMed]
- Patke, A.; Young, M.W.; Axelrod, S. Molecular mechanisms and physiological importance of circadian rhythms. Nat Rev Mol Cell Biol 2020, 21, 67–84. [Google Scholar] [CrossRef] [PubMed]
- Patton, A.P.; Hastings, M.H. The Mammalian Circadian Time-Keeping System. J Huntingtons Dis 2023, 12, 91–104. [Google Scholar] [CrossRef] [PubMed]
- Snider, K.H.; Sullivan, K.A.; Obrietan, K. Circadian regulation of hippocampal-dependent memory: circuits, synapses, and molecular mechanisms. Neural Plasticity 2018. [Google Scholar] [CrossRef]
- Ballinger, E.C.; Ananth, M.; Talmage, D.A.; Role, L.W. Basal forebrain cholinergic circuits and signaling in cognition and cognitive decline. Neuron 2016, 91, 1199–1218. [Google Scholar] [CrossRef]
- Brown, D.A. Muscarinic acetylcholine receptors (mAChRs) in the nervous system: some functions and mechanisms. J Mol Neurosci 2010, 41, 340–346. [Google Scholar] [CrossRef]
- Lebois, E.P.; Thorn, C.; Edgerton, J.R.; Popiolek, M.; Xi, S. Muscarinic receptor subtype distribution in the central nervous system and relevance to aging and Alzheimer’s disease. Neuropharmacology 2018, 1, 362–373. [Google Scholar] [CrossRef]
- Thomsen, M.; Sørensen, G.; Dencker, D. Physiological roles of CNS muscarinic receptors gained from knockout mice. Neuropharmacology 2018, 136, 411–420. [Google Scholar] [CrossRef]
- Hut, R.A.; Van der Zee, E.A. The cholinergic system, circadian rhythmicity, and time memory. Behav Brain Res 2011, 221, 466–480. [Google Scholar] [CrossRef]
- Jimenez-Capdeville, M.E.; Dykes, R.W. Daily changes in the release of acetylcholine from rat primary somatosensory cortex. Brain Res 1993, 625, 152–158. [Google Scholar] [CrossRef]
- Kametani, H.; Kawamura, H. Circadian rhythm of cortical acetylcholine release as measured by in vivo microdialysis in freely moving rats. Neurosci Lett 1991, 132, 263–266. [Google Scholar] [CrossRef]
- Mitsushima, D.; Mizuno, T.; Kimura, F. Age-related changes in diurnal acetylcholine release in the prefrontal cortex of male rats as measured by microdialysis. Neuroscience 1996, 72, 429–434. [Google Scholar] [CrossRef]
- Mizuno, T.; Endo, Y.; Arita, J.; Kimura, F. Acetylcholine release in the rat hippocampus as measured by the microdialysis method correlates with motor activity and exhibits a diurnal variation. Neuroscience 1991, 44, 607–612. [Google Scholar] [CrossRef]
- Mizuno, T.; Endo, Y.; Arita, J.; Kimura, F. Spontaneous acetylcholine release in the hippocampus exhibits a diurnal variation in both young and old rats. Neurosci Lett 1994, 178, 271–274. [Google Scholar] [CrossRef]
- Hanin, I.; Massarelli, R.; Costa, E. Acetylcholine concentrations in rat brain: diurnal oscillation. Science 1970, 170, 341–342. [Google Scholar] [CrossRef] [PubMed]
- Saito, Y. The circadian rhythm of brain acetylcholine levels and motor activity in the rat. Life Sci 1971, 10, 735–744. [Google Scholar] [CrossRef] [PubMed]
- Saito, Y.; Yamashita, I.; Yamazaki, K.; Okada, F.; Satomi, R.; Fujieda, T. Circadian fluctuation of brain acetylcholine in rats. I. On the variations in the total brain and discrete brain areas. Life Sci 1974, 16, 281–288. [Google Scholar] [CrossRef]
- Kafka, M.S.; Wirz-Justice, A.; Naber, D.; Wehr, T.A. Circadian acetylcholine receptor rhythm in rat brain and its modification by imipramine. Neuropharmacology 1981, 20, 421–425. [Google Scholar] [CrossRef]
- Marquez, E.; Pavia, J.; Laukonnen, S.; Martos, F.; Gomez, A.; Rius, F.; Sanchez de la Cuesta, F. Circadian rhythm in muscarinic receptor subtypes in rat forebrain. Chronobiol Int 1990, 7, 277–282. [Google Scholar] [CrossRef] [PubMed]
- Mash, D.C.; Flynn, D.D.; Kalinoski, L.; Potter, L.T. Circadian variations in radioligand binding to muscarine receptors in rat brain dependent upon endogenous agonist occupation. Brain Res 1985, 331, 35–38. [Google Scholar] [CrossRef]
- Por, S.B.; Bondy, S.C. Regional circadian variation of acetylcholine muscarinic receptors in the rat brain. J Neurosci Res 1981, 6, 315–318. [Google Scholar] [CrossRef]
- Fisher, A.; Levey, A.I. CNS muscarinic receptors and muscarinic receptor agonists in Alzheimer disease treatment. Handb Clin Neurol 2025, 211, 161–184. [Google Scholar] [CrossRef]
- Levey, A.I. Immunological localization of M1-M5 muscarinic acetylcholine receptors in peripheral tissues and brain. Life Sci 1993, 52, 441–448. [Google Scholar] [CrossRef]
- Levey, A.I.; Edmunds, S.M.; Koliatsos, V.; Wiley, R.G.; Heilman, C.J. Expression of M1–M4 muscarinic acetylcholine receptor proteins in rat hippocampus and regulation by cholinergic innervation. J Neurosci 1995, 15, 4077–4092. [Google Scholar] [CrossRef]
- Rouse, S.T.; Thomas, T.M.; Levey, A.I. Muscarinic acetylcholine receptor subtype, M2: diverse functional implications of differential synaptic localization. Life Sci 1997, 60, 1031–1038. [Google Scholar] [CrossRef]
- Chaudhury, D.; Wang, L.M.; Colwell, C.S. Circadian regulation of hippocampal long-term potentiation. J Biol Rhythms 2005, 20, 225–236. [Google Scholar] [CrossRef] [PubMed]
- Jilg, A.; Lesny, S.; Peruzki, N.; Schwegler, H.; Selbach, O.; Dehghani, F.; Stehle, J.H. Temporal dynamics of mouse hippocampal clock gene expression support memory processing. Hippocampus 2010, 20, 377–388. [Google Scholar] [CrossRef] [PubMed]
- Rawashdeh, O.; Jilg, A.; Jedlicka, P.; Slawska, J.; Thomas, L.; Saade, A.; Schwarzacher, S.W.; Stehle, J.H. Period1 coordinates hippocampal rhythms and memory processing with daytime. Hippocampus 2014, 24, 712–723. [Google Scholar] [CrossRef] [PubMed]
- Wang, L.M.-C.; Dragich, J.M.; Kudo, T.; Odom, I.H.; Welsh, D.K.; O’DellI, T.J.; Colwell, C.S. Expression of the circadian clock gene Period2 in the hippocampus: possible implications for synaptic plasticity and learned behaviour. ASN NEURO 2009, 1, art:e00012. [Google Scholar] [CrossRef]
- Cardoso, C.C.; Pereira, R.T.; Koyama, C.A.; Porto, C.S.; Abdalla, F.M. Effects of estrogen on muscarinic acetylcholine receptors in the rat hippocampus. Neuroendocrinology 2004, 80, 379–386. [Google Scholar] [CrossRef] [PubMed]
- Munson, P.J.; Rodbard, D. Ligand: a versatile computerized approach for characterization of ligand-binding systems. Anal Biochem 1980, 107, 220–239. [Google Scholar] [CrossRef] [PubMed]
- Cardoso, C.C.; Ricardo, V.P.; Frussa-Filho, R.; Porto, C.S.; Abdalla, F.M. Effects of 17β-estradiol on expression of muscarinic acetylcholine receptor subtypes and estrogen receptor alpha in rat hippocampus. Eur J Pharmacol 2010, 634, 192–200. [Google Scholar] [CrossRef] [PubMed]
- Myslivecek, J.; Klein, M.; Novakova, M.; Ricny, J. The detection of the non-M2 muscarinic receptor subtype in the rat heart atria and ventricles. Naunyn Schmiedebergs Arch Pharmacol 2008, 378, 103–116. [Google Scholar] [CrossRef]
- Shiozaki, K.; Iseki, E.; Uchiyama, H.; Watanabe, Y.; Haga, T.; Kameyama, K.; Ikeda, T.; Yamamoto, T.; Kosaka, K. Alterations of muscarinic acetylcholine receptor subtypes in diffuse Lewy Body Disease: relation to Alzheimer’s disease. J Neurol Neurosurg Psychiatry 1999, 67, 209–213. [Google Scholar] [CrossRef]
- Oki, T.; Takagi, Y.; Inagaki, S.; Taketo, M.M.; Manabe, T.; Matsui, M.; Yamada, Y. Quantitative analysis of binding parameters of [3H]N-methylscopolamine in central nervous system of muscarinic acetylcholine receptor knockout mice. Brain Res Mol Brain Res 2005, 133, 6–11. [Google Scholar] [CrossRef]
- Silva, M.F.P.; Alves, P.L.; Alponti, R.F.; Silveira, P.F.; Abdalla, F.M.F. Effects of obesity induced by high-calorie diet and its treatment with exenatide on muscarinic acetylcholine receptors in rat hippocampus. Biochem Pharmacol 2019, 169. [Google Scholar] [CrossRef]
- Kafka, M.S.; Benedito, M.A.; Blendy, J.A.; Tokola, N.S. Circadian rhythms in neurotransmitter receptors in discrete rat brain regions. Chronobiol Int 1986, 3, 91–100. [Google Scholar] [CrossRef]
- Davis, B.; Sadik, K. Circadian Cholinergic Rhythms: Implications for Cholinesterase Inhibitor Therapy. Dement Geriatr Cogn Disord 2006, 21, 120–129. [Google Scholar] [CrossRef]
- Day, J.; Damsma, G.; Fibiger, H.C. Cholinergic activity in the rat hippocampus, cortex and striatum correlates with locomotor activity: an in vivo microdialysis study. Pharmacol Biochem Behav 1991, 38, 723–729. [Google Scholar] [CrossRef]
- Alvord, V.; Kantra, E.; Pendergast, J.S. Estrogens and the Circadian System. Semin Cell Dev Biol 2022, 126, 56–65. [Google Scholar] [CrossRef]
- Dohanich, G.P.; Witcher, J.A.; Weaver, D.R.; Clemens, L.G. Alteration of muscarinic binding in specific brain areas following estrogen treatment. Brain Res 1982, 241, 347–350. [Google Scholar] [CrossRef]
- El-Bakri, N.K.; Adem, A.; Suliman, I.A.; Mulugeta, E.; Karlsson, E.; Lindgren, J.U.; Winblad, B.; Islam, A. Estrogen and progesterone treatment: Effects on muscarinic M 4 receptor subtype in the rat brain. Brain Res 2002, 948, 131–137. [Google Scholar] [CrossRef] [PubMed]
- Van Huizen, F.; March, D.; Cynader, M.S.; Shaw, C. Muscarinic receptor characteristics and regulation in rat cerebral cortex: Changes during development, aging and the estrous cycle. Eur J Neurosci 1994, 6, 237–243. [Google Scholar] [CrossRef] [PubMed]
- Mendoza-Garcés, L.; Mendoza-Rodríguez, C.A.; Jiménez-Trejo, F.; Picazo, O.; Rodríguez, M.C.; Cerbón, M. Differential Expression of Estrogen Receptors in Two Hippocampal Regions During the Estrous Cycle of the Rat. Anat Rec 2011, 294, 1913–1919. [Google Scholar] [CrossRef] [PubMed]
- Volpicelli, L.A.; Levey, A.I. Muscarinic acetylcholine receptor subtypes in cerebral cortex and hippocampus. Prog Brain Res 2004, 145, 59–66. [Google Scholar] [CrossRef]
Figure 1.
Specific saturation curves of [³H]QNB binding to hippocampal membrane preparations from male rats at ZTs 2, 6, 10, 14, 18, and 22. ZTs 2, 6, and 10 correspond to the light phase, whereas ZTs 14, 18, and 22 correspond to the dark phase. Results are representative of three independent experiments (n = 3), each performed in duplicate.
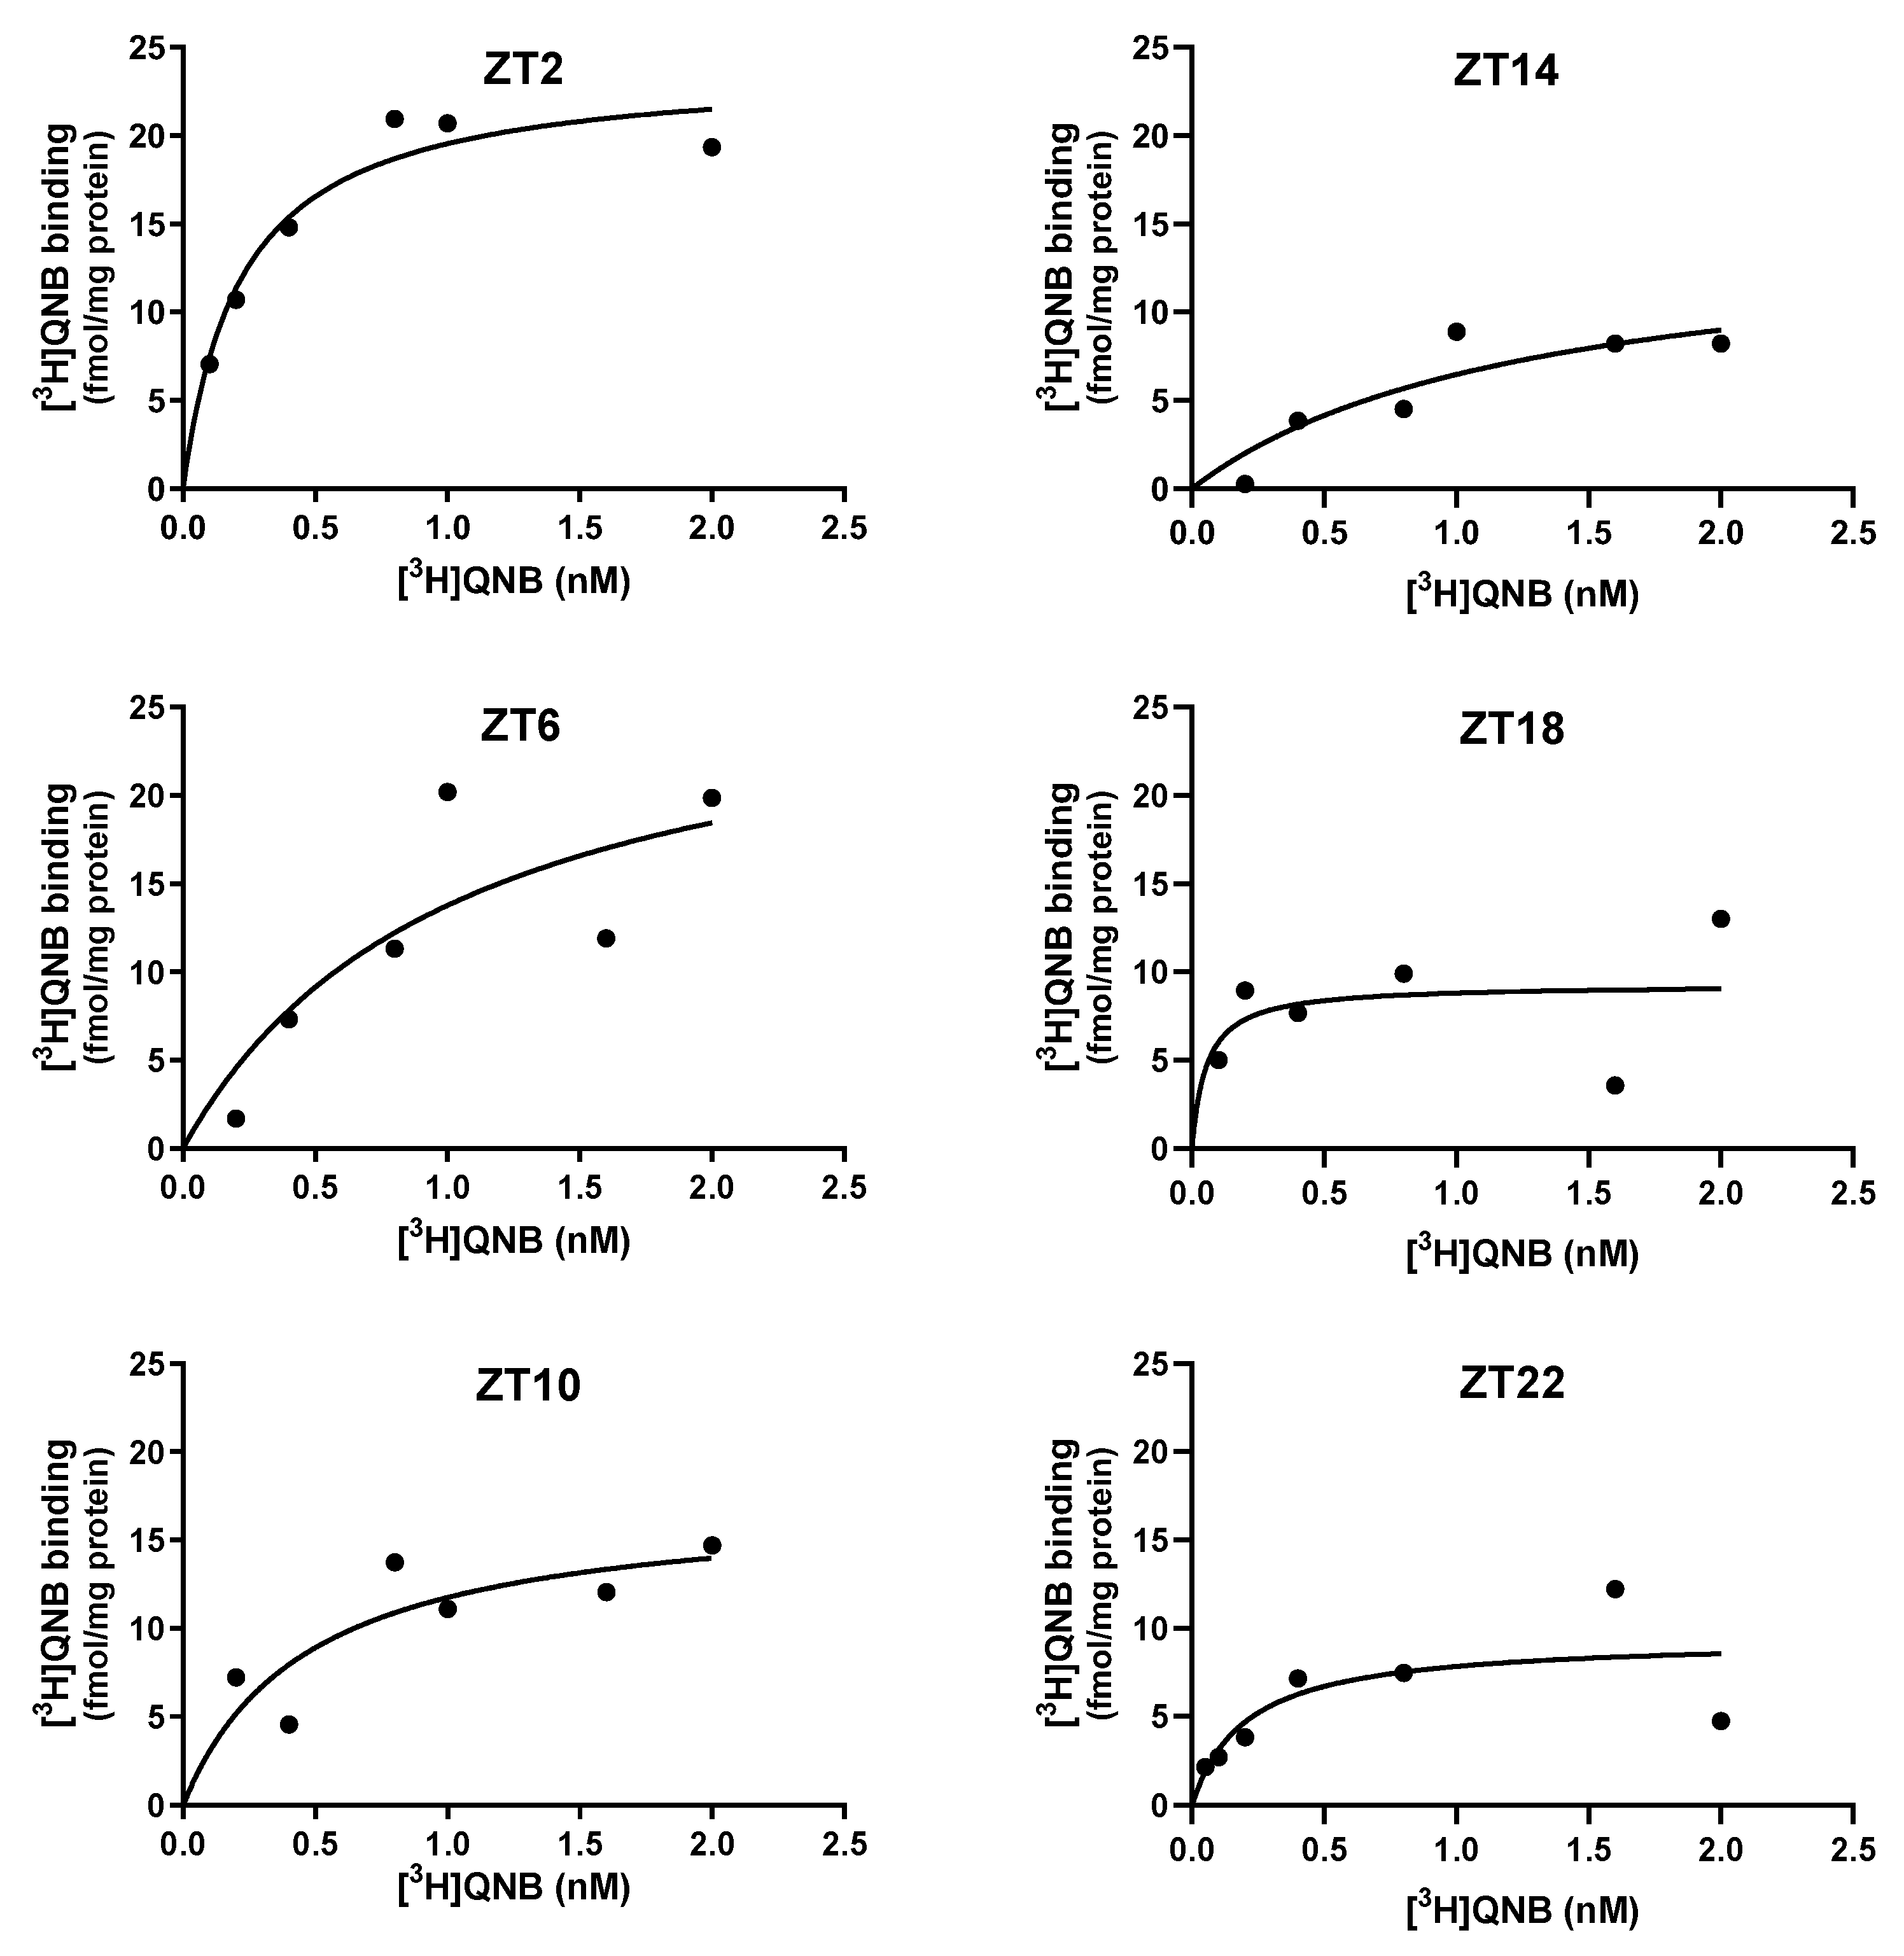
Figure 2.
Specific saturation curves of [³H]QNB binding to hippocampal membrane preparations from female rats at ZTs 2, 6, 10, 14, 18, and 22. ZTs 2, 6, and 10 correspond to the light phase, whereas ZTs 14, 18, and 22 correspond to the dark phase. Results are representative of three independent experiments (n = 3), each performed in duplicate.
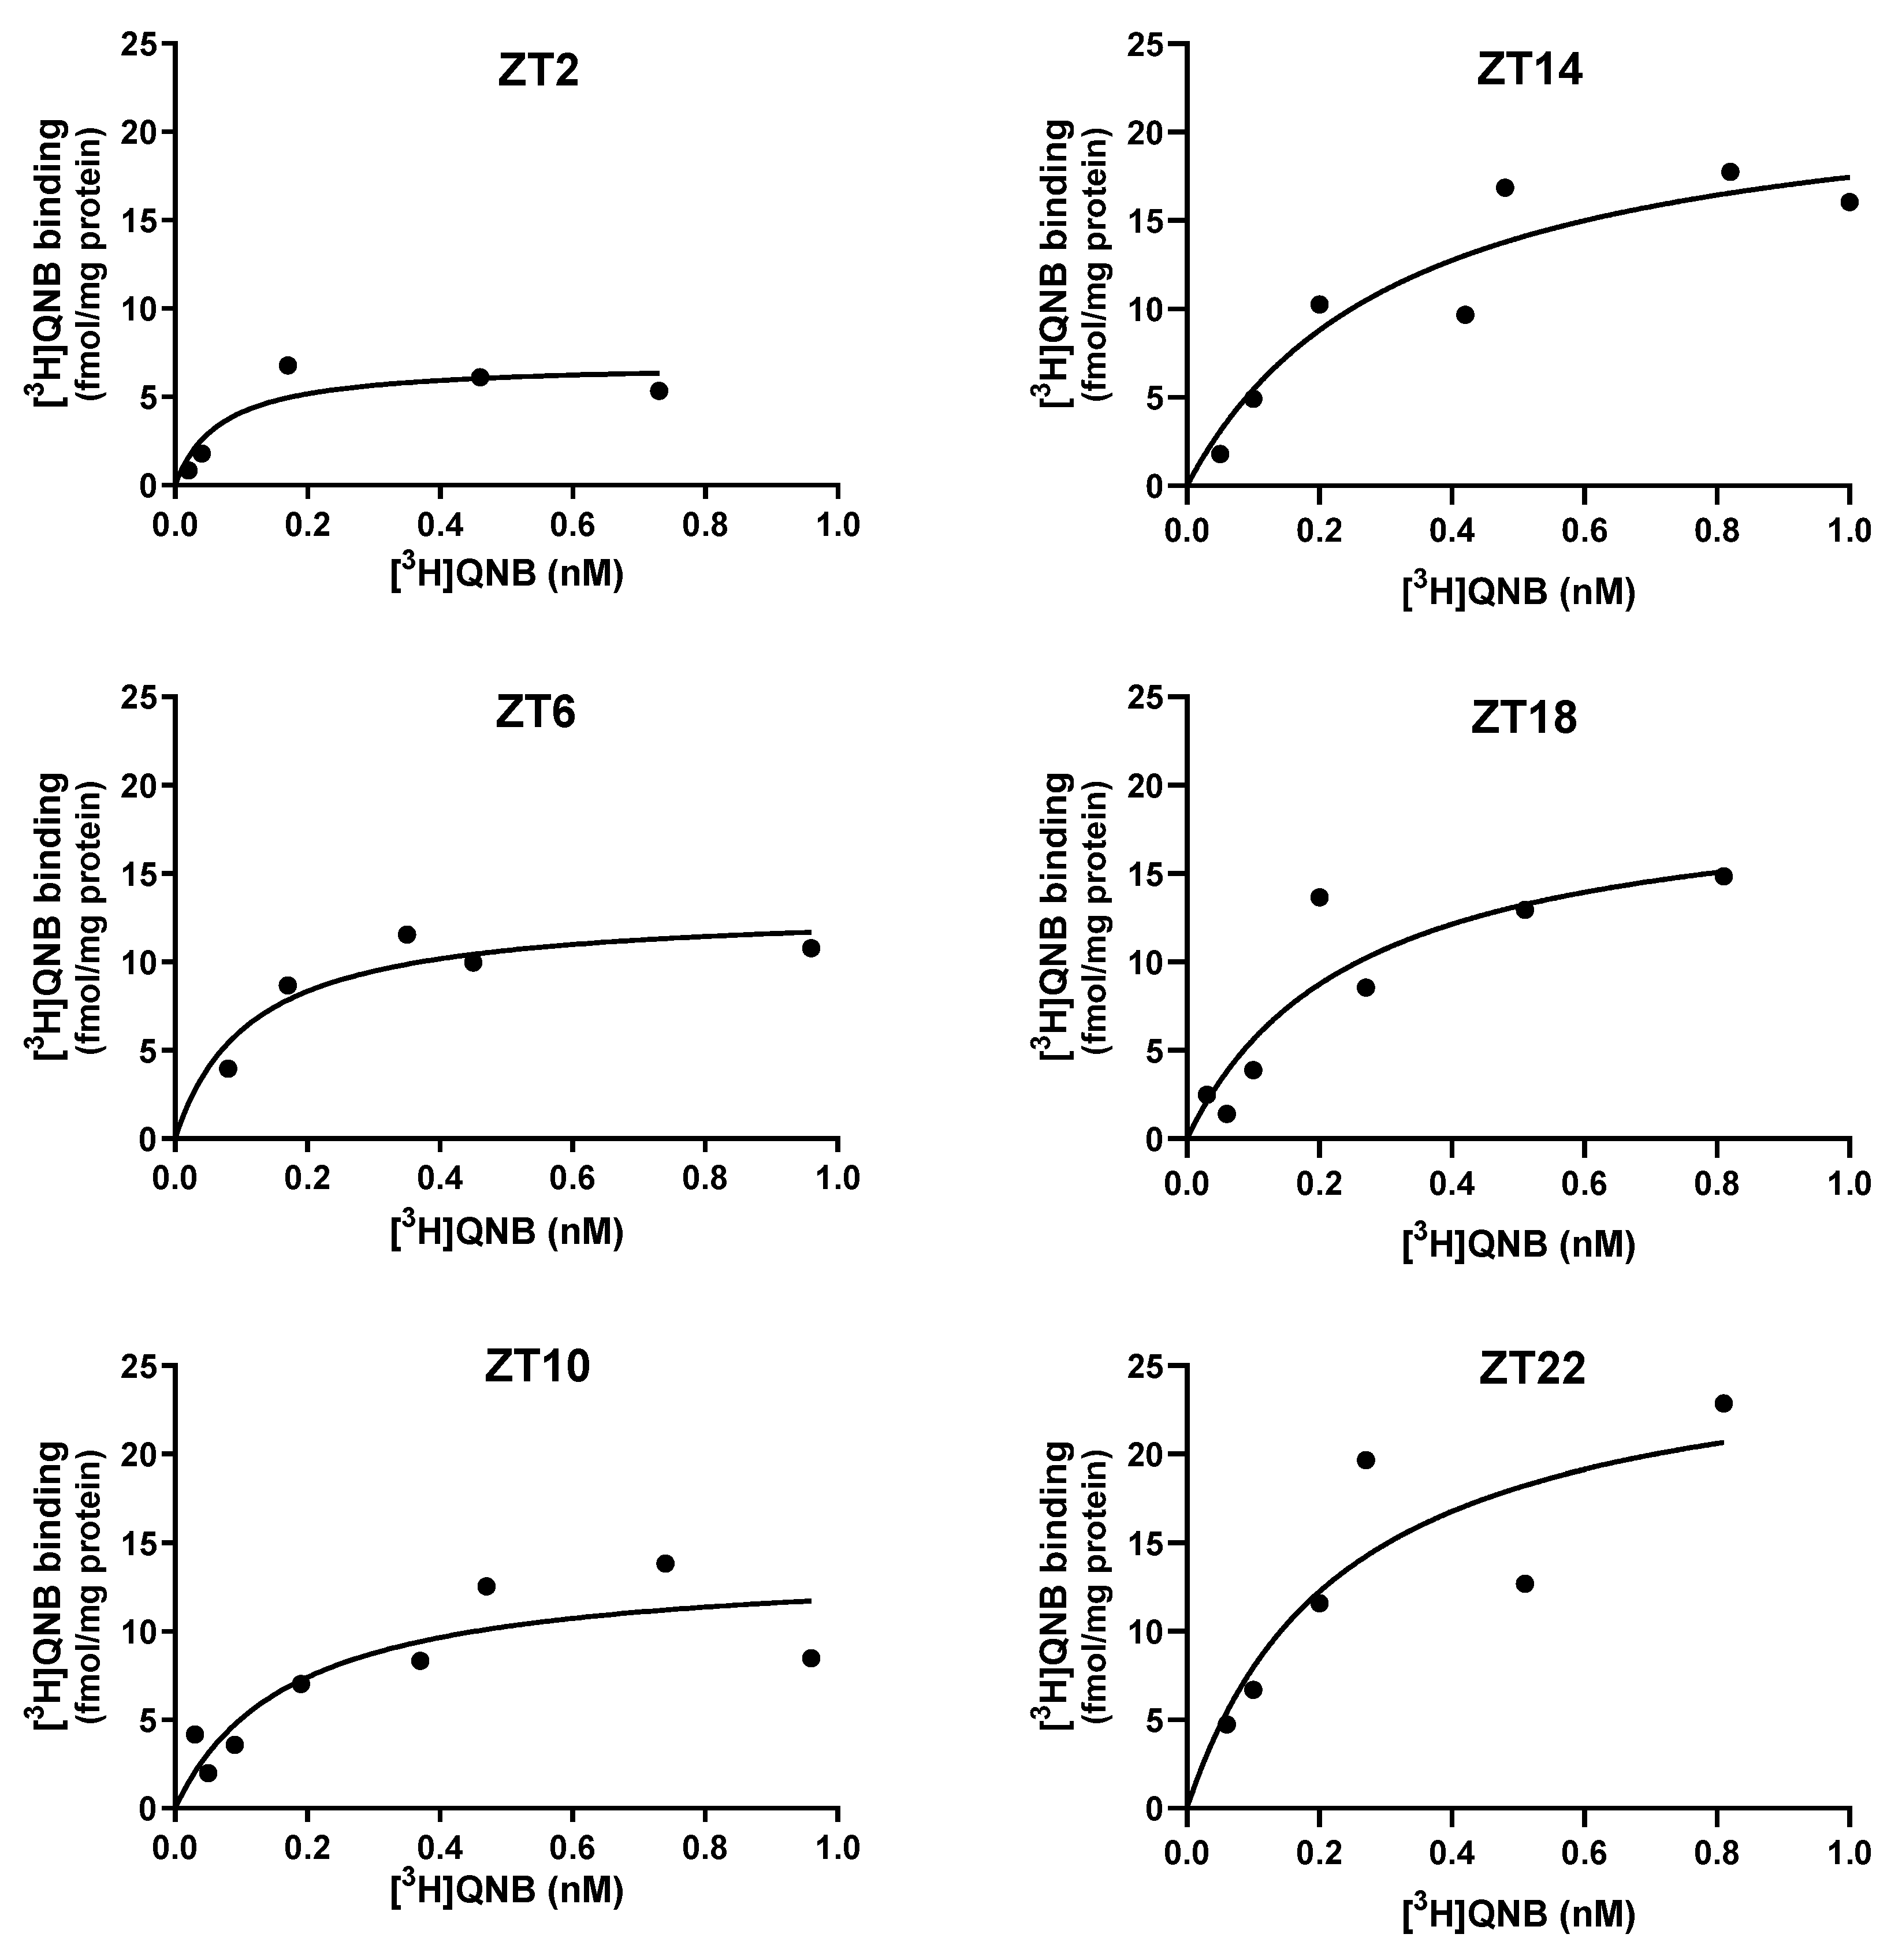
Figure 3.
Daily variations in hippocampal mAChRs in 90-day-old male rats, measured through binding assays at ZTs 2, 6, 10, 14, 18, and 22. ZTs 2, 6, and 10 correspond to the light phase, whereas ZTs 14, 18, and 22 correspond to the dark phase. The analysis shows mAChR densities (Bmax) (A) and affinities (B), expressed as dissociation constants (KD). The 24-hour period is duplicated for better visualization. Data are presented as mean ± S.E.M. of three experiments, each performed in duplicate (one-way ANOVA: p < 0.01; Newman–Keuls test: Bmax: **p < 0.01, ***p < 0.001 vs. ZT22; #p < 0.05 vs. ZT6; KD: *p < 0.05, **p < 0.01 vs. ZT6).
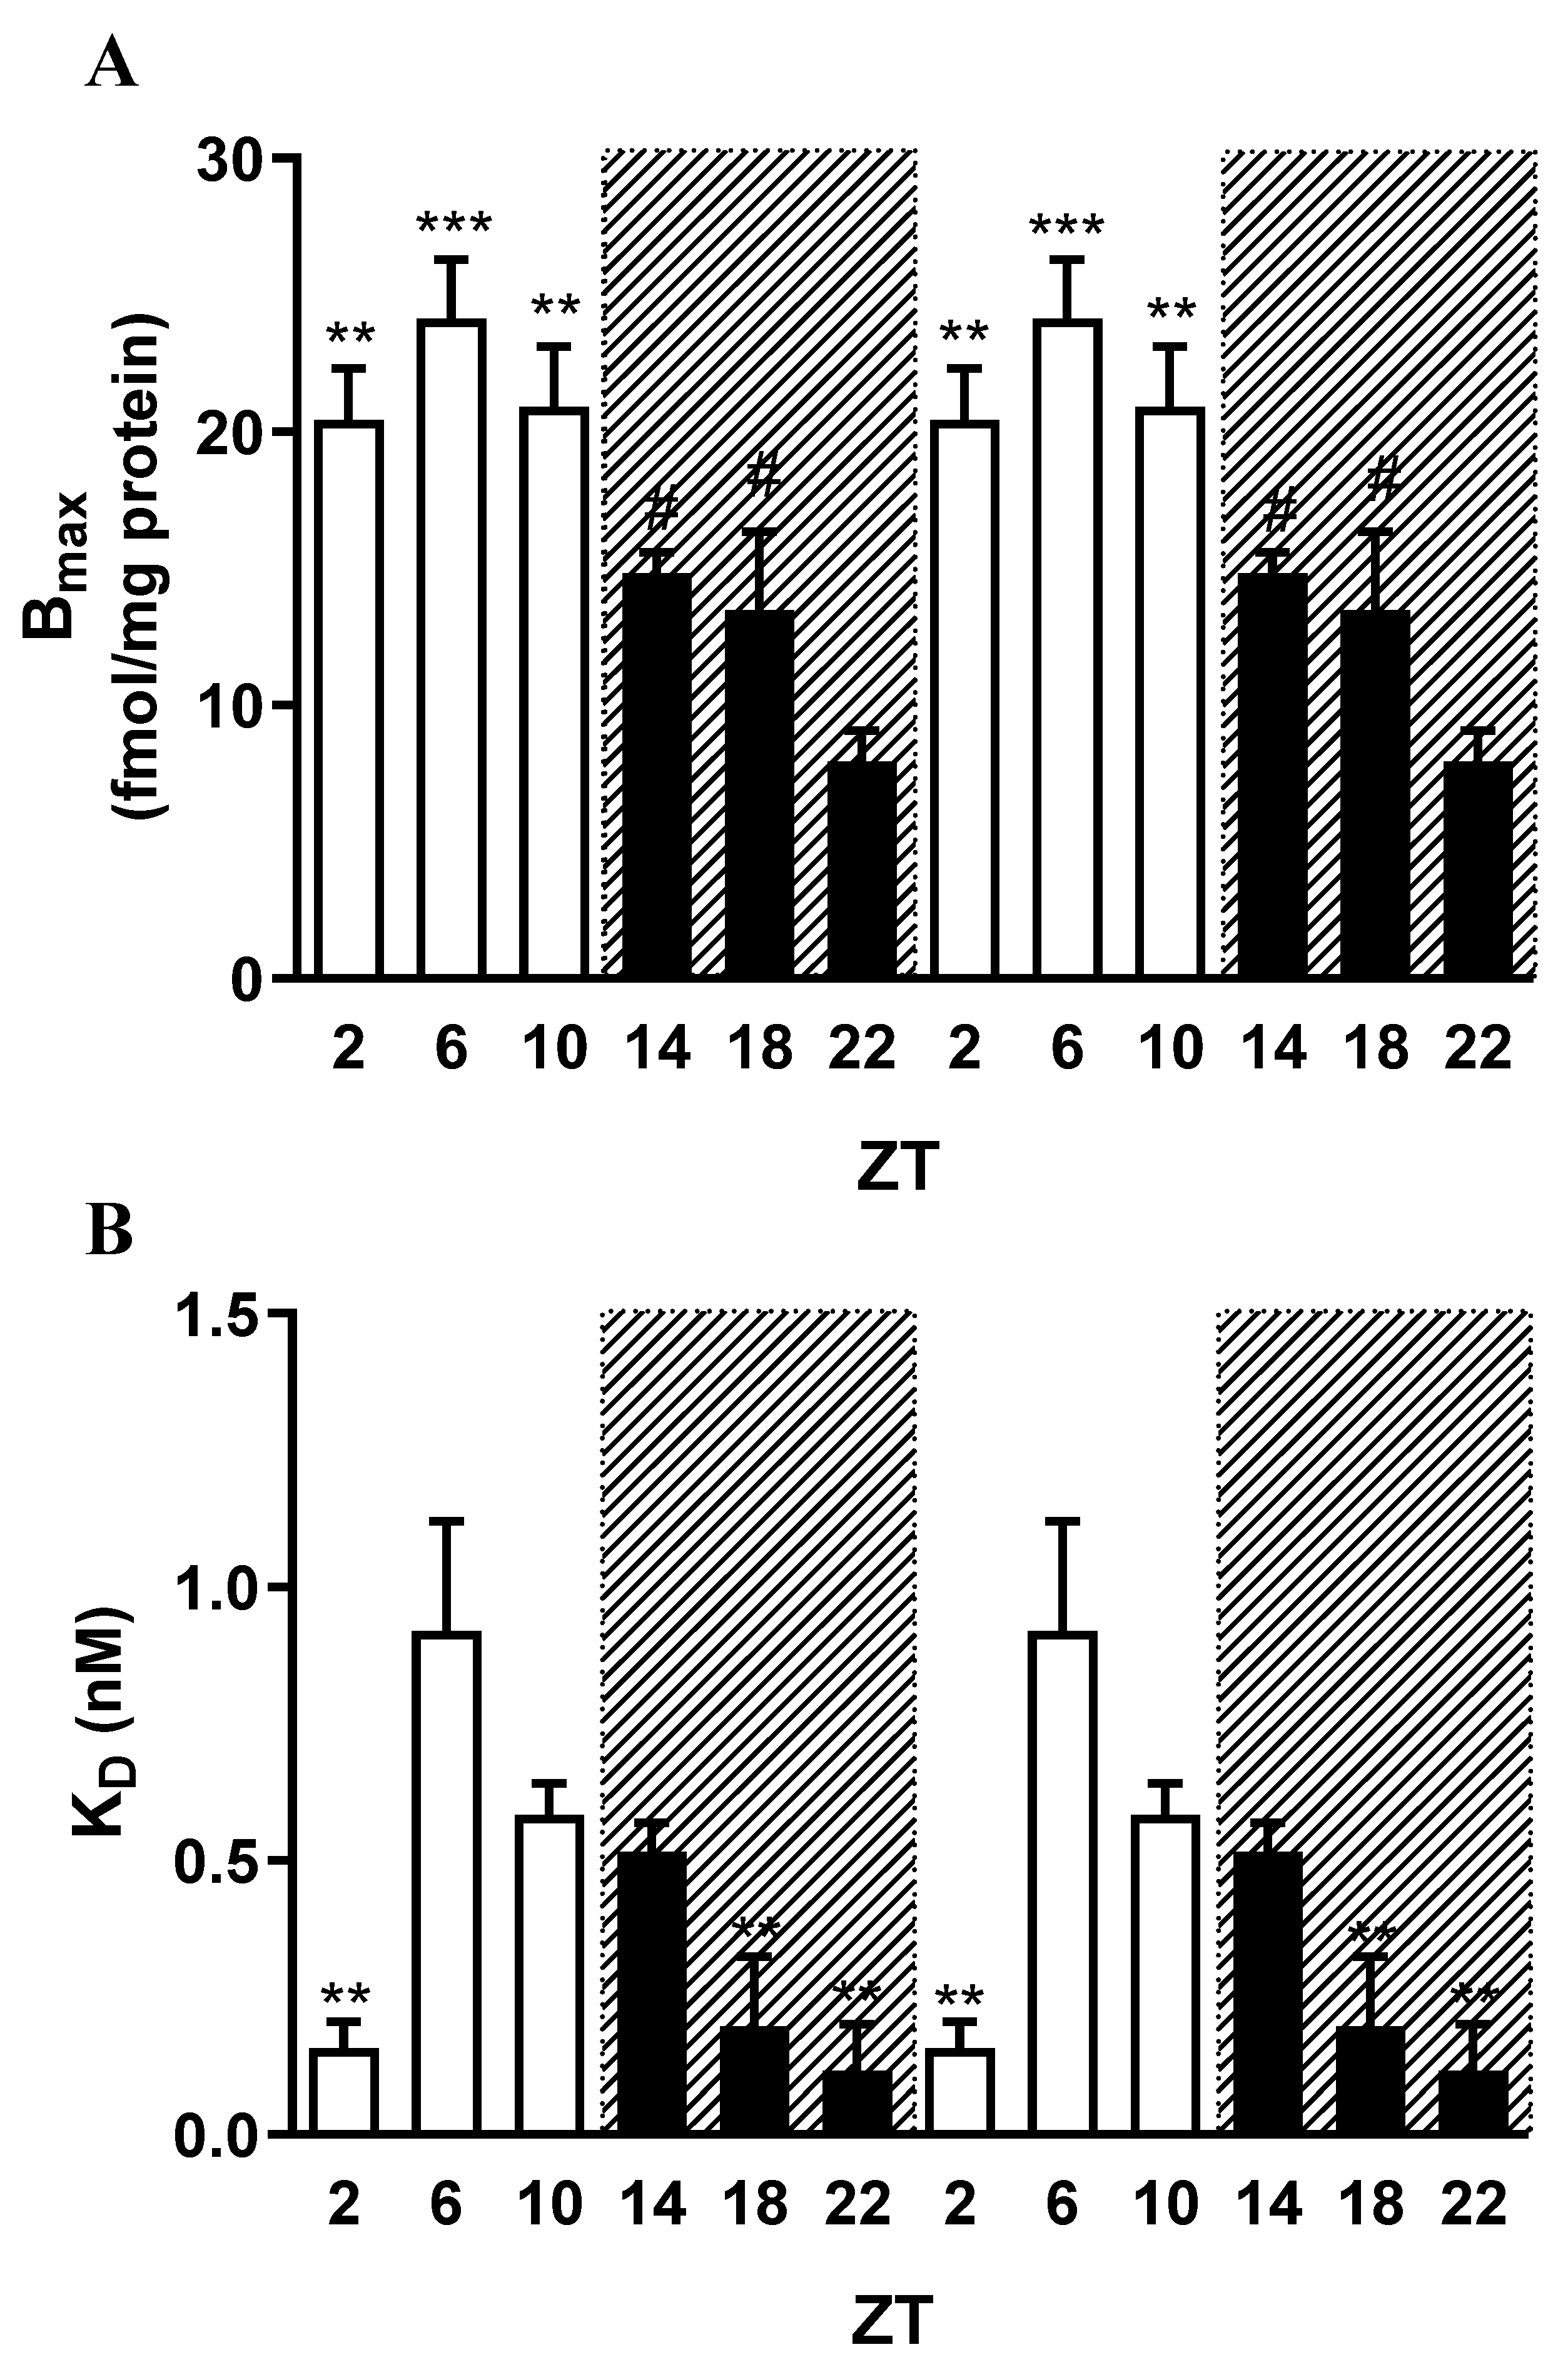
Figure 4.
Daily variations in hippocampal mAChRs in 90-day-old female rats, evaluated through binding assays at ZTs 2, 6, 10, 14, 18, and 22. ZTs 2, 6, and 10 correspond to the light phase, whereas ZTs 14, 18, and 22 correspond to the dark phase. The analysis shows mAChR densities (Bmax) (A) and affinities (B), expressed as dissociation constants (KD). The 24-hour period is duplicated for better visualization. Data are presented as mean ± S.E.M. of three experiments, each performed in duplicate. (One-way ANOVA: p < 0.001; Newman–Keuls: Bmax: *p < 0.05 vs. ZT18; #p < 0.05 vs. ZT22; KD: *p < 0.05 vs. ZT14; #p < 0.05 vs. ZT18.).
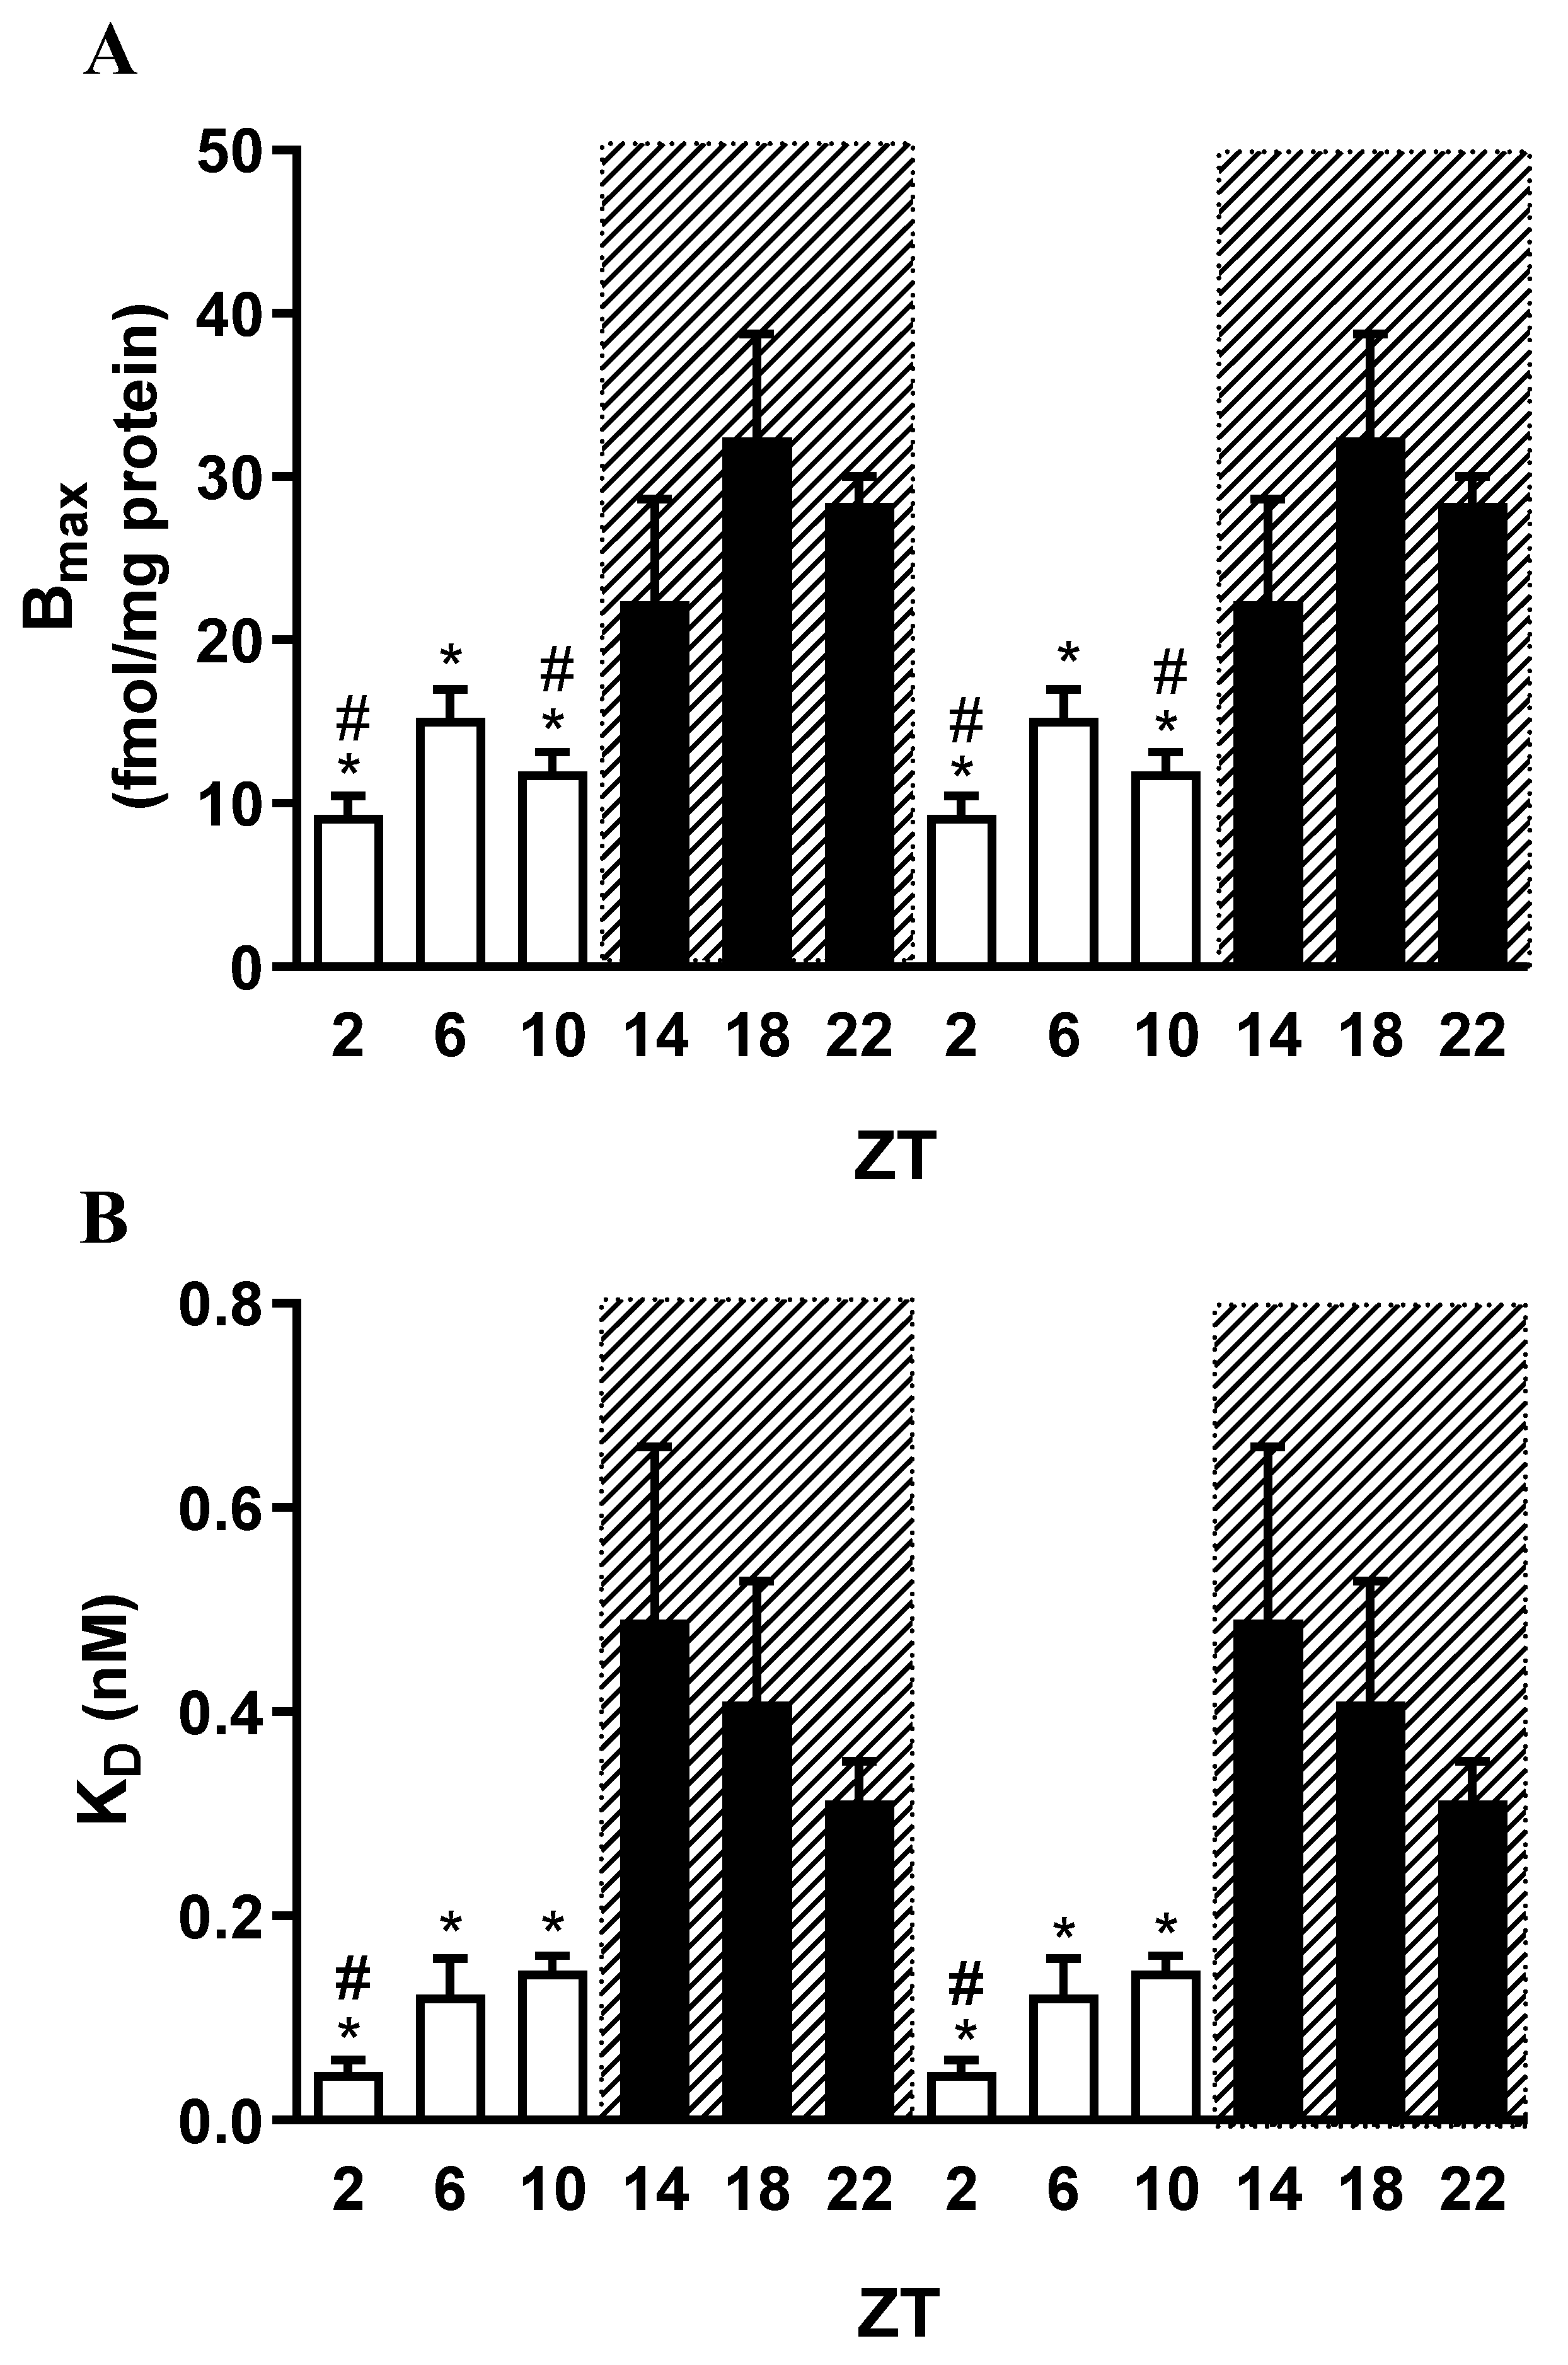
Figure 5.
Expression levels of M1–M5 muscarinic acetylcholine receptor subtypes in the hippocampus of 90-day-old male rats (A) and 90-day-old female rats (B). Samples were analyzed at ZT2 (light phase) and ZT14 (dark phase). Data are presented as mean ± S.E.M., with n = 3–7. *p < 0.05; **p < 0.01; ****p < 0.0001, indicating a statistically significant difference from ZT14 for each mAChR subtype (t-test).
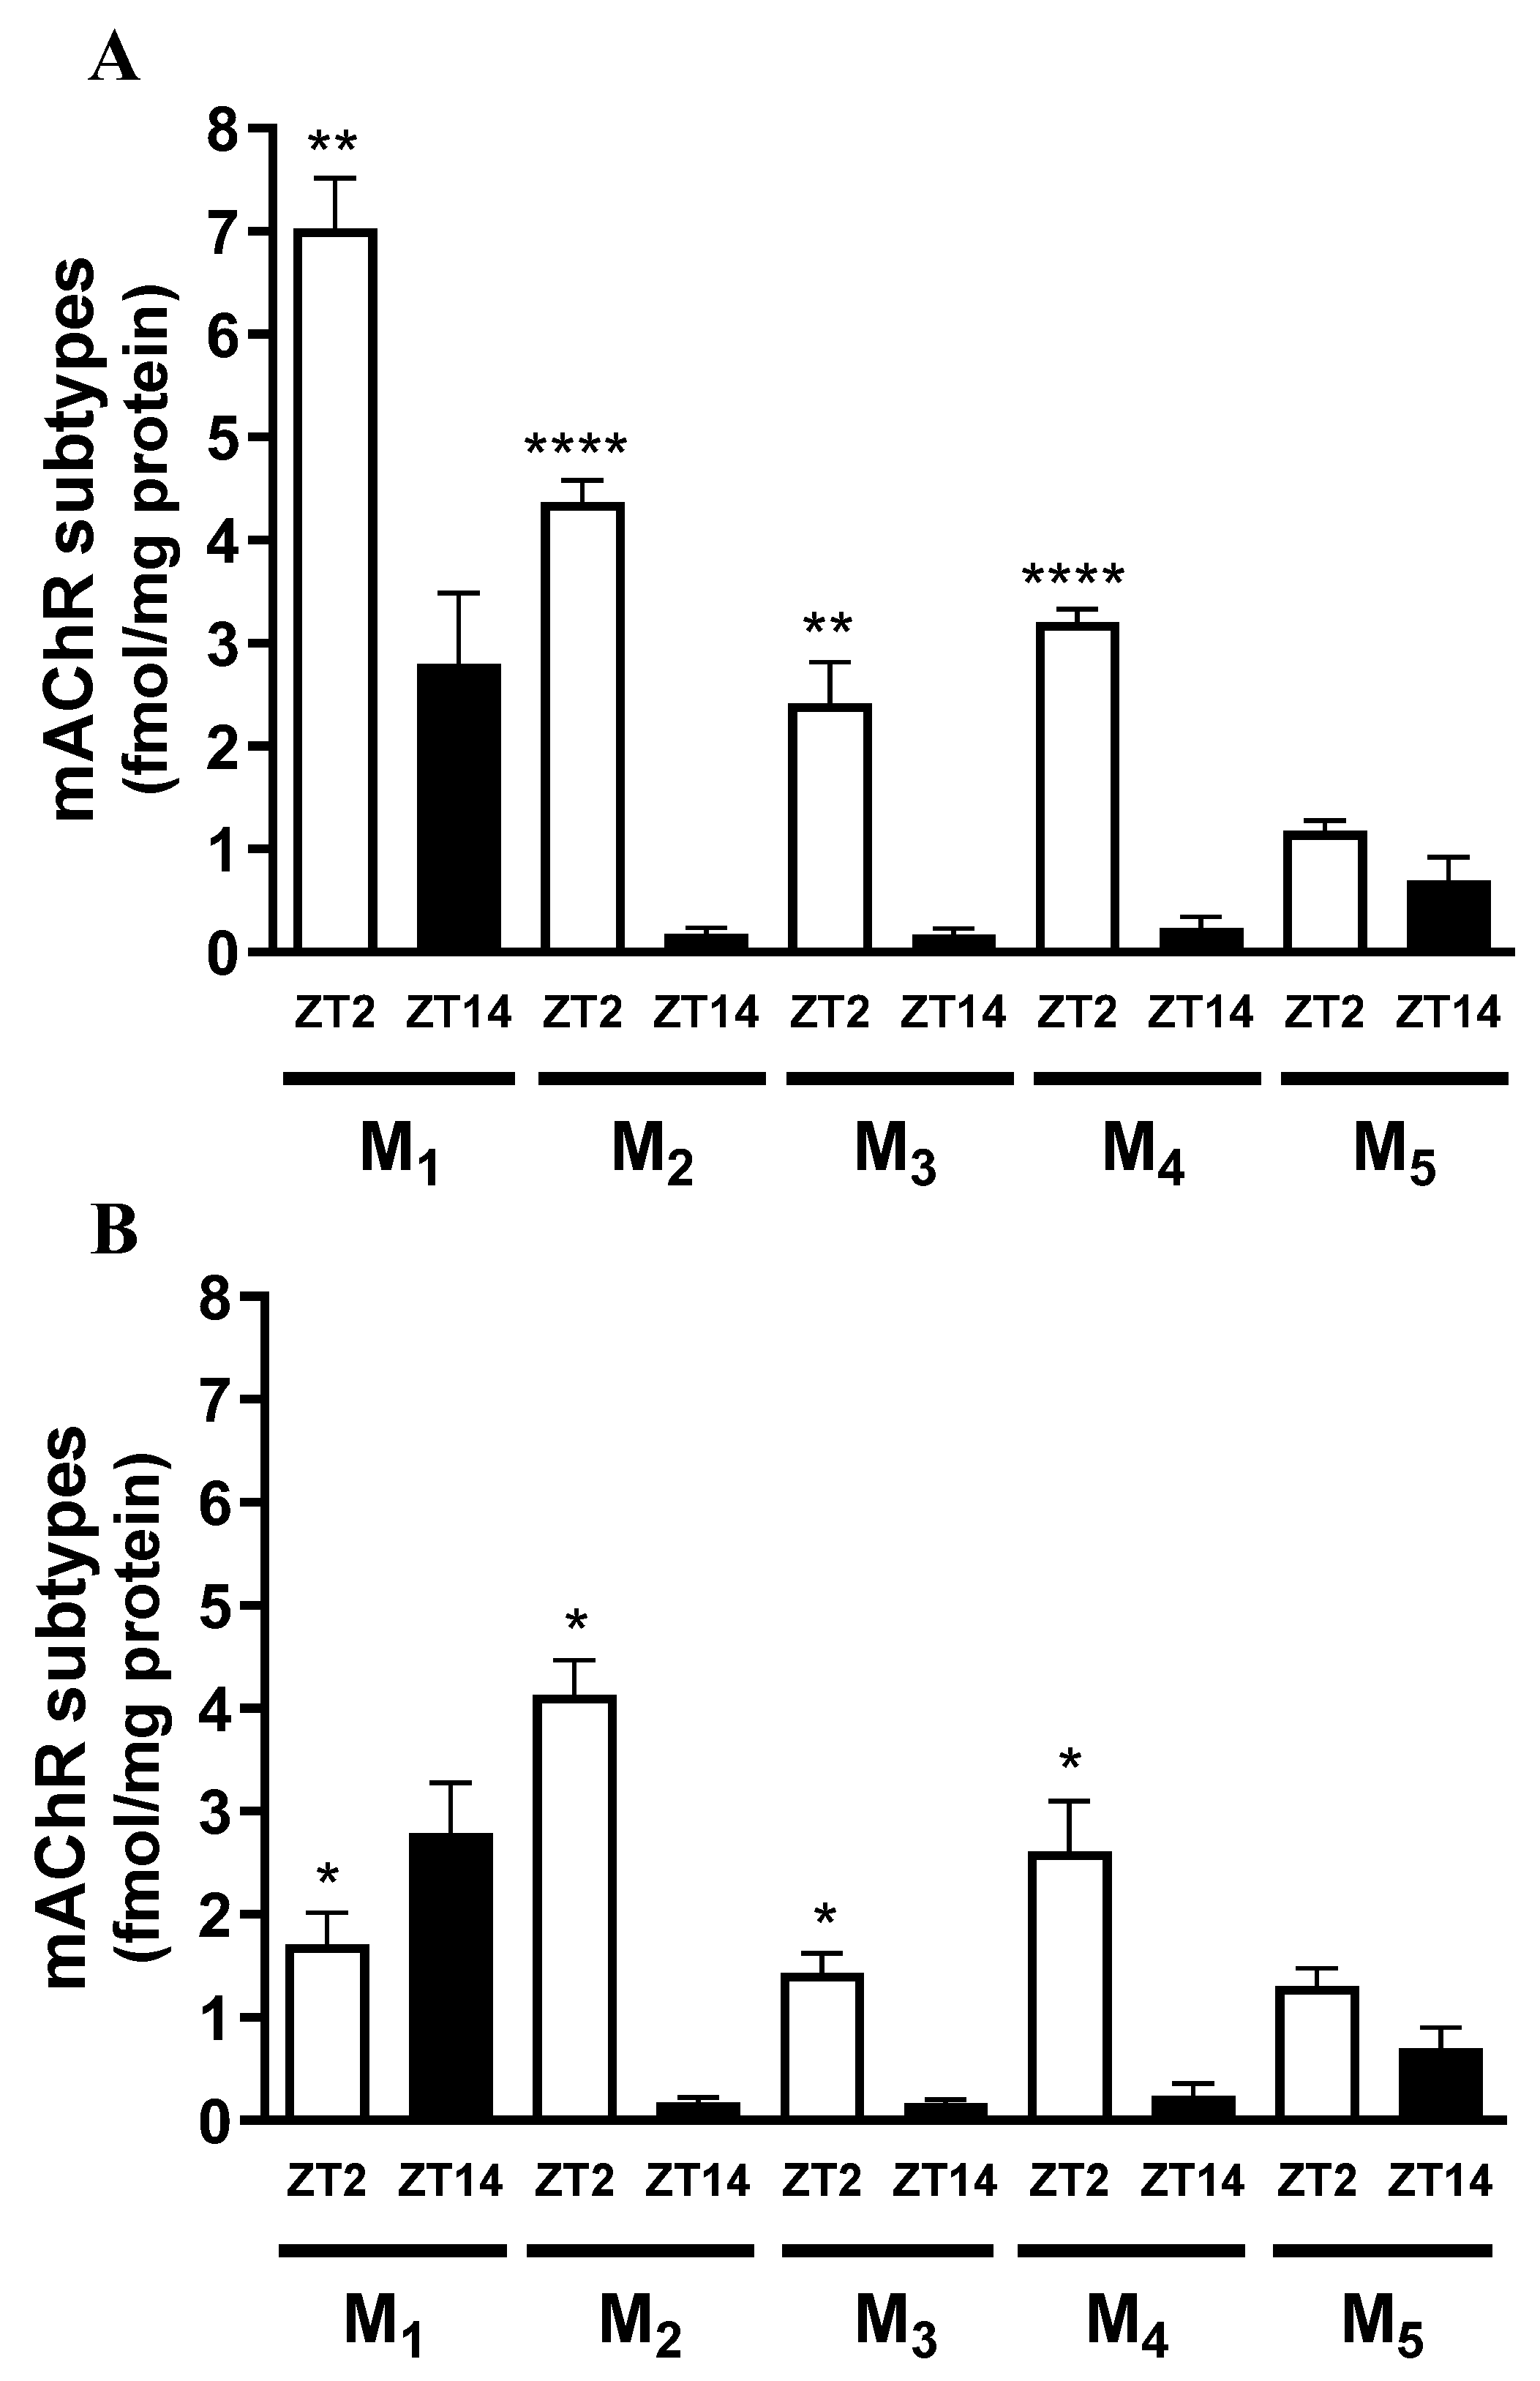

Table 1.
[³H]QNB saturation binding parameters. Receptor densities (Bmax) and dissociation constants (KD) of muscarinic receptors in hippocampal membrane preparations from male rats at Zeitgeber times (ZTs) 2, 6, 10, 14, 18, and 22. ZTs 2, 6, and 10 correspond to the light phase, whereas ZTs 14, 18, and 22 correspond to the dark phase.
| ZT | Bmax (fmol/mg protein) |
KD (nM) |
|---|---|---|
| 2 | 20.45 ± 1.86** | 0.16 ± 0.05** |
| 6 | 24.14 ± 2.14*** | 0.92 ± 0.20 |
| 10 | 20.92 ± 2.20** | 0.58 ± 0.05 |
| 14 | 14.81 ± 0.79# | 0.51 ± 0.05 |
| 18 | 13.46 ± 2.88# | 0.19 ± 0.12** |
| 22 | 7.94 ± 1.11 | 0.12 ± 0.09* |
Data are expressed as mean ± S.E.M. of three experiments, each performed in duplicate (one-way ANOVA: p < 0.01; Newman–Keuls test: Bmax: **p < 0.01, ***p < 0.001 vs. ZT22; #p < 0.05 vs. ZT6; KD: *p < 0.05, **p < 0.01 vs. ZT6).
Table 2.
[³H]QNB saturation binding parameters. Receptor densities (Bmax) and dissociation constants (KD) of muscarinic receptors in hippocampal membrane preparations from female rats at Zeitgeber times (ZTs) 2, 6, 10, 14, 18, and 22. ZTs 2, 6, and 10 correspond to the light phase, whereas ZTs 14, 18, and 22 correspond to the dark phase.
| ZT | Bmax (fmol/mg protein) |
KD (nM) |
|---|---|---|
| 2 | 9.28 ± 1.18*# | 0.05 ± 0.01*# |
| 6 | 15.24 ± 1.74* | 0.12 ± 0.03* |
| 10 | 11.92 ± 1.21*# | 0.15 ± 0.01* |
| 14 | 22.35 ± 6.29 | 0.49 ± 0.17 |
| 18 | 32.39 ± 6.35 | 0.41 ± 0.12 |
| 22 | 28.41 ± 1.61 | 0.31 ± 0.04 |
Data are expressed as mean ± S.E.M. of three experiments, each performed in duplicate (one-way ANOVA: p < 0.001; Newman–Keuls: Bmax: *p < 0.05 vs. ZT18; #p < 0.05 vs. ZT22; KD: *p < 0.05 vs. ZT14; #p < 0.05 vs. ZT18).
Disclaimer/Publisher’s Note: The statements, opinions and data contained in all publications are solely those of the individual author(s) and contributor(s) and not of MDPI and/or the editor(s). MDPI and/or the editor(s) disclaim responsibility for any injury to people or property resulting from any ideas, methods, instructions or products referred to in the content. |
© 2025 by the authors. Licensee MDPI, Basel, Switzerland. This article is an open access article distributed under the terms and conditions of the Creative Commons Attribution (CC BY) license (http://creativecommons.org/licenses/by/4.0/).
Copyright: This open access article is published under a Creative Commons CC BY 4.0 license, which permit the free download, distribution, and reuse, provided that the author and preprint are cited in any reuse.


