
Submitted:
15 October 2025
Posted:
16 October 2025
You are already at the latest version
Abstract
The circadian clock enables organisms to anticipate daily recurring events and syn-chronize their internal rhythms with environmental cues, such as light, aligning with the day/night cycle. Central to the molecular mechanisms of the circadian clock and light sensing are the Period (Per) 1 and 2 genes. While the roles of Per2 in astrocytes and neurons have been characterized, the specific contributions of Per1 remain less understood. Pre-vious research has shown that Per2 in neurons, but not astrocytes, influences phase shifts, whereas the regulation of circadian period involves Per2 in both cell types. In this study, we investigated the role of Per1 in neurons and astrocytes in modulating circadian period and phase shifts. Using an Aschoff Type I protocol (constant darkness) combined with 15-minute light pulses at circadian times (CT) 10, 14, and 22, we found that the absence of Per1 in neurons—but not in astrocytes—significantly affected both the circadian period and phase advance shifts in response to light at CT22.
Keywords:
light
; resetting
; phase shift
; entrainment
; advance
; delay
; Per1 knockout
1. Introduction
The circadian system comprises organ- and tissue-specific clocks that regulate and synchronize physiological functions on a 24-hour time scale, aligning them with the environmental day-night cycle. Disruption of this alignment—such as that caused by shift work or jet lag—impairs the regulation of bodily functions and may ultimately contribute to metabolic syndrome, addictive behaviors, cardiovascular disease, and neurological disorders [1].
At the cellular level, the circadian clock operates through a transcriptional-translational feedback loop with an approximately 24-hour period. In mammals, the core clock genes include Bmal1 and Clock (or its homolog Npas2), which activate the transcription of Per and Cry genes. These, in turn, inhibit their own activation, forming a negative feedback loop. The nuclear receptors REV-ERBα and RORα further regulate the expression of Bmal1, Clock, and Npas2 by repressing or activating their transcription, respectively, thereby completing the core clock mechanism [2]. This mechanism can be modulated by: (1) molecules that bind to nuclear receptors—such as free fatty acids and glucocorticoids acting on PPARα and REV-ERBα—and (2) indirectly via glutamate and its receptors [3].
Circadian behavioral activity is primarily modulated by light. Changes in light intensity trigger adaptive responses, either advancing or delaying the organism’s activity phase depending on the timing of exposure. For instance, a 15-minute light pulse late in the subjective night (e.g., circadian time 22; CT22) advances the clock phase, whereas light exposure early in the subjective night (e.g., CT14) delays it [4,5,6]. At the cellular level, light stimulates the release of neurotransmitters—such as glutamate—at synapses connected to the suprachiasmatic nuclei (SCN), the master pacemaker of the circadian system. This leads to the induction of immediate early genes, such as Fos, and clock genes, such as Per1 and Per2 [7,8,9,10,11].
Notably, mutation of the Per2 gene in all cells of mice shortens the circadian period, diminishes phase delays, and enhances phase advances. In contrast, global deletion of Per1 shortens the period and reduces phase advances only [12,13]. Cell-type-specific deletion of Per2 in astrocytes or neurons also shortens the clock period, but only neuronal deletion affects phase shifts [14]. The distinct role of Per1 in astrocytes and neurons regarding period regulation and phase-shifting remains unclear. Therefore, we investigated the contributions of Per1 in these cell types to circadian period and light-induced phase-shifting responses.
2. Results
2.1. Per1 is Absent in Neuronal or Glial Knock-Out Mice
To investigate the cell type–specific role of Per1 in regulating circadian period and light responsiveness, we generated glia-specific (Per1G; Per1/Gfap-Cre) and neuron-specific (Per1N; Per1/Nes-Cre) Per1 knockout (KO) mice. Mice carrying a floxed Per1 allele [15] (EMMA: 14846) were crossed with transgenic mice expressing Cre-recombinase under the control of either the gfap-promoter (Gfap-Cre, JAX: 004600) or the nestin-promoter (Nes-Cre, EMMA: EM04561).
To confirm cell type–specific deletion of Per1 in neurons and astrocytes, we performed immunohistochemistry on suprachiasmatic nucleus (SCN) tissue harvested at ZT12 using PER1-specific antibodies (Figure 1, green). Neurons were labeled with an anti-NeuN antibody (red) (Figure 1A). In neuronal control mice (NCo; Nes-Cre), PER1 and NeuN co-localized, producing a yellow signal (Figure 1A, upper row, white square at 5 µm). A 3D reconstruction of the neuron at 5 µm confirmed co-expression of PER1, NeuN, and the nuclear stain DAPI (blue), resulting in a yellow composite signal. In Per1NKo mice, PER1 expression was absent in neurons (Figure 1A, lower row), indicating successful deletion of Per1 in this cell type.
Astrocytes were labeled with an anti-GFAP antibody (Figure 1B, magenta). In glial control mice (GCo; Gfap-Cre), PER1 and GFAP co-localized, producing a white signal (Figure 1B, upper row, white square at 5 µm). A 3D reconstruction of the astrocyte at 5 µm showed co-expression of PER1, GFAP, and DAPI (blue), resulting in a white/cyan signal. In Per1GKo mice, PER1 expression was absent in astrocytes (Figure 1B, lower row), confirming successful deletion of Per1 in glial cells.
2.2. Lack of Per1 in Neuronal or Glial Knock-Out Mice Does not Abolish Circadian Rhythmicity but Slightly Reduces Phase Advances in Per1NKo Animals
To assess the impact of light on mice lacking Per1 in neurons or astrocytes, we employed an Aschoff Type I protocol to evaluate light-induced rapid phase shifts under constant darkness [16,17]. The experimental design is illustrated in Figure 2 (see also Materials and Methods). All mouse strains were housed in constant darkness (DD) with access to a running wheel, and locomotor activity was recorded and visualized as double-plotted actograms (Figure 3A).
After approximately 10 days in DD, animals received a 15-minute light pulse (LP) at circadian time (CT) 10, CT14, and CT22 (Figure 3A, yellow stars). Following the LP, mice remained in DD, and activity onsets were marked with lines—blue for pre-LP and red for post-LP. The shift between blue and red lines was used to quantify phase delays or advances in activity onset.
Quantitative analysis revealed no significant effect of the LP at CT10 across all strains (Figure 3B, left panel). The LP at CT14 induced phase delays that were consistent among all groups (Figure 3B, middle panel). However, the LP at CT22 resulted in phase advances in all strains, with the exception of Per1NKo mice, which exhibited significantly reduced phase advances compared to controls and Per1GKo mice (Figure 3B, right panel).
These findings suggest that Per1 expression in neurons—but not in astrocytes—is involved in mediating light-induced phase advances in circadian behavior.
2.3. Period is Shortened In Mice Lacking Per1 in Neurons, And Light at CT22 Shortens Period Across All Strains
Using actograms derived from wheel-running activity recordings, we assessed the circadian period across all mouse strains. Notably, only mice lacking Per1 in neurons (Per1NKo) exhibited a significantly shorter circadian period compared to their neuronal controls (NCo) under baseline conditions without LP (Figure 4, § symbols). This finding aligns with previous reports of reduced phase advances in global Per1 knockout mice [12,13].
We next examined whether light pulses at different circadian times affected the period. An LP at CT10 had no significant impact on period across all genotypes (Figure 4A). Similarly, an LP at CT14 did not alter period in most strains, with the exception of Per1GKo mice, which showed a significant period shortening (Figure 4B, purple and pink columns, * symbol).
Interestingly, an LP at CT22 resulted in a significant shortening of the circadian period in all genotypes examined (Figure 4C, * symbols). This suggests that a light-sensitive signaling pathway is activated at CT22 and remains functional regardless of Per1 deletion in either neurons or astrocytes.
2.4. Amplitude is Unaffected by Light Pulses but Reduced in Per1NKo Mice
We assessed circadian amplitude across all genotypes and found that light pulses (LPs) administered at CT10, CT14, and CT22 did not significantly alter amplitude in any group (Figure 5A–C). However, Per1NKo mice exhibited a markedly reduced amplitude compared to their neuronal controls (Figure 5A–C, middle panels, brown and orange columns), suggesting a potential weakening of the circadian oscillator in the absence of neuronal Per1.
To further investigate oscillator strength, we quantified the relative power of phase across genotypes (Figure 6). Consistent with the observed shorter period and reduced amplitude, Per1NKo mice showed significantly lower relative power of phase compared to controls. No such reduction was observed in other strains. Additionally, light pulses did not affect relative power of phase in any genotype, corroborating findings from Figure 4 and Figure 5.
Importantly, the differences between Per1NKo mice and controls were not attributable to changes in overall activity levels. Total wheel revolutions per day were comparable across all genotypes (Figure 7A–C), indicating that the observed effects were specific to circadian parameters rather than general locomotor activity.
3. Discussion
In this study, we investigated how the absence of the Per1 gene in neurons and astrocytes affects circadian period and phase, using wheel-running activity as a behavioral paradigm. Our experiments revealed that deletion of Per1 in astrocytes had no measurable impact on these parameters. In contrast, the absence of Per1 in neurons led to a shortened circadian period and diminished phase advances in response to a light pulse administered at CT22.
Previous studies have reported that Per1::luc reporter expression is undetectable in glial cells within organotypic SCN slice cultures from rat brain [18]. However, Per1::luc rhythms were observed in cultured astrocytes derived from cortical rat tissue [19]. This discrepancy suggests that Per1 expression in astrocytes may be substantially lower or more diffuse than in neurons, where Per1::luc expression is readily detectable [18]. Our immunohistochemistry data support this interpretation (Figure 1): we observed high levels of PER1 protein in SCN neurons (Figure 1A), while PER1 signal in astrocytes was markedly lower (Figure 1B).
Consistent with these findings, all behavioral circadian parameters assessed in mice lacking Per1 in glial cells (Per1GKo) were indistinguishable from controls. Phase shifting remained unaffected (Figure 3), period was comparable (Figure 4), amplitude was normal (Figure 5), and relative power of phase was unchanged (Figure 6). Total wheel-running activity also matched that of control animals (Figure 7). These results suggest that astrocytic Per1 plays a minimal, if any, role in regulating behavioral circadian clock parameters in vivo.
In contrast, deletion of Per1 in neurons resulted in reduced light-induced phase advances (Figure 3), shortened period (Figure 4), and decreased amplitude (Figure 5), culminating in reduced relative power of phase (Figure 6)—indicative of a weakened circadian oscillator. Notably, these changes were not attributable to differences in total wheel-running activity, which remained consistent across all groups. These findings, in line with previous reports [18], reinforce the notion that Per1 primarily influences behavioral circadian parameters through neuronal mechanisms rather than astrocytic ones.
Several studies have demonstrated that Per1 expression in the SCN can be induced by brief light exposure [7,10,11]. Moreover, global deletion of Per1 in mice has been shown to impair phase advances without affecting phase delays [12], suggesting that light-induced Per1 expression is specifically linked to phase advances. Our findings support and extend this view by showing that Per1 expression in neurons—but not astrocytes—is necessary for light-induced phase advances (Figure 3).
The reduction in phase advances observed in Per1NKo mice cannot be solely attributed to light-induced period shortening at CT22 (Figure 4C). All genotypes exhibited period shortening following a light pulse at CT22, which could be interpreted as an earlier onset of activity the next day, contributing to the phase advances seen in Figure 3. This effect was also present in Per1NKo mice (Figure 4C, orange bar), and the difference in period between NCo and Per1NKo mice increased post-light pulse, with Per1NKo mice showing an even shorter period (Figure 4C, §§ and °°°). If period shortening alone accounted for phase advances, Per1NKo mice would be expected to show greater advances than controls. However, the opposite was observed, indicating that Per1's role in phase advancement in response to light at CT22 involves a molecular pathway distinct from its role in period regulation.
The functions of Per1 and Per2 genes appear to be distinct [12,20,21], and this distinction is evident when comparing their roles in neurons and astrocytes. In this study, we found that Per1 in neurons—but not astrocytes—was critical for regulating period and phase advances. In contrast, Per2 influenced period in both cell types, but only neuronal Per2 was essential for phase delays [14]. This functional segregation aligns with previous reports showing that Per1-reporter expression is predominantly neuronal, while Per2-reporter expression is more restricted to non-neuronal populations [22]. Our findings also corroborate a recent study indicating that astrocytes regulate circadian period but not phase in the SCN [23].
In summary, astrocytic Per1 appears to have limited importance for circadian regulation, whereas astrocytic Per2 contributes to period control but not to light-mediated phase shifts. In neurons, both Per paralogs are essential: Per1 for phase advances and Per2 for phase delays.
4. Materials and Methods
4.1. Housing of Mice and Mouse Strains
Male and female mice aged 2-6 months on a C57Bl/6 background were placed in isolated light cabinets as previously described in Jud et al., 2005 [24]. Entrainment was done in a constant 12:12 h light /dark cycle. Temperature (22 ± 2 °C monitored by temperature sensor, Technoline WS-9410, Berlin, Germany), humidity (40–50% monitored by humidity sensor, Technoline WS-9410, Berlin, Germany), and illumination (1000 Lux monitored by Luxmeter, Testo, GmbH & Co, Titisee-Neustadt, Germany) were kept constant in all cabinets. Each mouse was housed individually in cages (L: 280 mm × W: 105 mm × H: 125 mm) containing a running wheel made of steel (115 mm in diameter, Trixie GmbH, Tarp, Germany). All mice were provided with sufficient woodchip bedding, as to not block the running wheel, and enrichement materials such as: red-square house, piece of carton, neslet (5x5 cm) and an open-sided tube. Food and water were provided ad libitum.
The neuronal-specific Per1NKo (Per1 fl/fl x Nestin-cre) and glia-specific Per1GKo (Per1 fl/fl x Gfap-cre) were obtained, by breeding the Per1 fl/fl mice described in Olejniczak et al., 2021; EMMA: 14846 [15] against the Nestin-cre mice [25](EMMA: EM04561) and Gfap-cre mice [26](JAX: 004600). The latter two mice lines were used as controls, along with the wild-type (WT) littermates. Glial and neuronal Per1 deletion was verified by genotyping, and immunohistochemistry of brain tissues collected at zeitgeiber time (ZT) 12 (Figure 1A-B). All experiments and procedures were performed according to the Schweizer Tierschutzgesetz guidelines and approved by the Canton of Fribourg and the cantonal commission for animal experiments (2021-17-FR, 33789).
4.2. Monitoring of Circadian Locomotor Activity Rhythm
To quantify the circadian locomotor activity rhythm, the running wheel revolutions were recorded by a magnetic circuit, which was fixed vertically on the axis of the running wheel outside the cage. The revolutions (locomotor activity) were captured in 1 minute intervals by ClockLab 3 data acquisition system software (Acquisition Version 3.208, Analysis Version 6.0.36). This is further described in Jud et al., 2005 [24]and Brenna et al., 2025 [27].
4.3. Light Pulses Application (Aschoff Type I Protocol)
The experimental designed (Figure 2) was designed and performed according to the Aschoff Type I protocol [16,17]. Mice were allowed to entrain in a constant 12:12 light:dark cycle for 2 weeks. This was followed by their release into constant darkness (DD) for 2 weeks, switching off the light by using an automatic digital timer. Following the 2 weeks in DD, the light pulse (LP) at circadian time (CT) 10 was calculated for each mouse individually by analysing their wheel running activity in the ClockLab3 software. In essence, the last 10 days of wheel running activity in DD were used to obtain the period length, and prediction of activity at CT12 for the next day. These were used to calculate the light pulse at CT10 for each mouse, as described in Jud et al., 2005 [24]. The LPs were applied the next day in a separate cabinet. Each mouse received a 15 minute LP at their previously calculated time, followed by their transfer into the original cabinet, where they were allowed to run freely for another 2 weeks in DD. The procedure described above, was repeated for administering the LPs at CT14 and CT22 (Figure 2). At the end of the last DD entrainement, the mice were transferred back into a 12:12 light:dark cycle. A recovery time of 2 weeks was allowed, before they were sacrificed for tissue collection.
4.4. Analysis of Circadian Locomotor Activity Rhythm Parameters
Phase shift (i.e., phase resetting) in DD following each LP, as well as other circadian locomotor activity rhythm parameters (e.g., actograms, period length, amplitude, total locomotor activity count, and relative power of phase (FFT)) were evaluated using ClockLab analysis (Actimetrics) software version 6.0.36.
To calculate the phase shift following each light pulse, a line of best fit was set through 10 consecutive activity onsets before the LP was applied. A second line of best fit was set through 10 activity onsets after the LP, excluding the first two days after the LP (transition phase). The difference between the two lines of best fit at the onset of activity, during the day of the LP, is considered the phase shift value.
All other circadian locomotor activity parameters were obtained using the ClockLab3 softaware, by setting the 2 lines of best fit through 10 activty onsets as described above.
4.5. Tissue Collections and Immunohistochemistry
Mice were perfused at ZT12 with 4% paraformaldehyde (PFA). Brains were isolated, with particular care in not damaging the optical nerve area and subsequently the SCN. Brains were held overnight in 4% PFA before being cryoprotected in 30% sucrose for 2 days. SCN cryosections (40 µm) from each brain, were placed in 24-well plates. Sections were washed for 20 min. in 1x PBS buffer, followed by 3 times 10-min washes in 1x PBS/0.2% Triton X-100 buffer. The sections were then treated for 15 min. in 1x PBS/1% Triton X-100m buffer, before being washed again 3 times with 1x PBS/0.2% Triton X-100. Sections were then blocked for 3 h at room temperature in 1x PBS/ 0.2% Triton X-100/ 10% Donkey Serum (Sigma, Catalog Number D9663). Following blocking, primary antibodies for PER1, GFAP, NeuN (Table 1), were diluted in 1x PBS/ 0.2% Triton X-100/ 10% Donkey Serum and sections were incubated at 4o C for 2 nights. Following incubation, the sections were washed 5 times (10 min. each) with 1x PBS/0.2% Triton X-100 buffer, before being incubated for 2 h at room temperature with the secondary antibodies (Table 1), diluted in 1x PBS/ 0.2% Triton X-100/ 10% Donkey Serum. This was then followed by 5 times washes with 1x PBS/ 0.2% Triton X-100, and an overnight wash at 4o C. All sections were stained with DAPI (Roche; 1:5000 in 1x PBS/ 0.2% Triton X-100) for 20 minutes. A final wash with 1x PBS/ 0.2% Triton X-100 was performed before being mounted on glass microscope slides. Fluorescent Z-stacks images were taken using a confocal microscope (Leica TCS SP5) using either the 20x or 63x magnification. All acquired images were processed in ImageJ, version 2.14.0/ 2.54f. The images of the SCN for each mouse genotype, acquired with either the 20x or 63x magnification, were analyzed by compressing the entire Z-stack. On the other hand, for the 3D analysis, no compression of the Z-stack was performed.
4.6. Statistical Analysis
GraphPad Prism software (version 10.3.1) was used for statistical analysis. Parametric unpaired t-test was used to calculate the significant difference between the groups, in the phase shift following each light pulse. A similar test was used to quantify the differences in the period lengths between the cell-specific KOs and their controls. On the other hand, a parametric paired t-test was used to calculate the significant difference in the period lengths before and after LPs for each group. In addition, the significant difference between three groups or more was performed using parametric one-way ANOVA, using the Tukey test to correct for multiple comparisons. Data are presented as mean ± SEM, and are considered significant when the p value < 0.05.
The raw data appear in Appendix A.
Author Contributions
Conceptualization, D.E. and U.A.; methodology, D.E.; validation, D.E, and U.A.; formal analysis, D.E.; investigation, D.E.; resources, U.A.; data curation, D.E.; writing—original draft preparation, U.A.; writing—review and editing, D.E.; visualization, U.A.; supervision, U.A.; project administration, U.A.; funding acquisition, U.A. All authors have read and agreed to the published version of the manuscript.
Funding
This research was funded by the Swiss National Science Foundation, grant number 310030_219880/1 (U.A.) and the State of Fribourg.
Institutional Review Board Statement
All experiments and procedures were performed according to the Schweizer Tierschutzgesetz guidelines and approved by the Canton of Fribourg and the cantonal commission for animal experiments (2021-17-FR, 33789).
Informed Consent Statement
Not applicable
Data Availability Statement
The original contributions presented in this study are included in the article. Further inquiries can be directed to the corresponding author.
Acknowledgments
The authors thank Antoinette Hayoz, Maude Marmy and Dr. Jürgen Ripperger for technical support and Dean Stewart and Spyridoula Mitsikosta for critically reading the manuscript.
Conflicts of Interest
The authors declare no conflicts of interest.
Appendix A
Raw Data
Figure 3B

Phase Shift- LP CT10
| WT | NCo | Per1NKO | GCo | Per1GKo |
| 12 | 7 | -4 | 0 | 0 |
| -2 | -23 | -18 | -26 | 21 |
| -12 | -16 | 19 | -28 | -10 |
| -12 | 23 | 17 | -14 | -9 |
| 28 | 32 | -2 | 7 | 7 |
| 10 | 0 | -30 | -17 | -9 |
| 7 | 10 | 6 | 6 | -18 |
| 15 | -3 | 15 | 10 | -12 |
| 12 | 7 | -18 | -11 | -3 |
| -8 | -14 | -13 | -20 | 3 |
| -10 | 3 | |||
| -5 | -9 |
Phase Shift- LP CT14
| WT | NCo | Per1NKO | GCo | Per1GKo |
| -147 | -108 | -115 | -138 | -127 |
| -138 | -115 | -129 | -120 | -85 |
| -70 | -74 | -120 | -110 | -172 |
| -99 | -60 | -66 | -113 | -90 |
| -108 | -42 | -71 | -144 | -108 |
| -76 | -82 | -117 | -128 | -143 |
| -143 | -62 | -90 | -78 | -174 |
| -104 | -128 | -122 | -99 | -145 |
| -138 | -94 | -111 | -146 | -118 |
| -148 | -82 | -122 | -211 | -88 |
| -131 | -83 | |||
| -126 | -146 |
Phase Shift- LP CT22
| WT | NCo | Per1NKO | GCo | Per1GKo |
| 39 | 7 | 39 | 50 | 25 |
| 30 | 34 | 25 | 65 | 39 |
| 40 | 28 | -18 | 28 | 30 |
| 44 | 30 | -6 | 39 | 55 |
| 58 | 25 | 9 | 30 | 21 |
| 19 | 32 | -39 | 19 | 25 |
| 45 | 18 | 30 | 0 | -24 |
| 39 | 16 | 1 | 51 | 71 |
| 28 | 74 | 21 | 14 | 10 |
| 25 | 20 | 32 | 66 | 16 |
| 87 | 37 | |||
| 41 | 23 | |||
| 69 | -15 | |||
| 66 | 48 | |||
| 73 | 67 | |||
| 58 | 85 | |||
| 25 | ||||
| 45 | ||||
| 30 | ||||
| 63 |
Fig4 A– Period Length- With and Without LP CT10
| WT - | WT + | NCo - | NCo + | P1NKO - | P1NKO + | GCo - | GCo + | P1GKO - | P1GKO + |
| 23.52 | 23.52 | 23.72 | 23.77 | 22.63 | 22.49 | 23.7 | 23.67 | 23.7 | 23.64 |
| 23.52 | 23.47 | 23.32 | 23.25 | 22.71 | 22.91 | 24.01 | 24.02 | 23.33 | 23.51 |
| 23.69 | 23.9 | 23.43 | 23.41 | 23.04 | 23.13 | 23.88 | 23.81 | 23.52 | 23.48 |
| 23.46 | 23.48 | 23.42 | 22.93 | 23.85 | 23.72 | 23.61 | 23.69 | 23.61 | 23.57 |
| 23.54 | 23.65 | 23.47 | 23.4 | 23.54 | 23.55 | 23.73 | 23.83 | 23.55 | 23.59 |
| 23.51 | 23.41 | 23.31 | 23.27 | 23.39 | 23.37 | 23.6 | 23.65 | 23.21 | 23.3 |
| 23.52 | 23.53 | 23.63 | 23.62 | 23.02 | 23.05 | 23.37 | 23.28 | 23.56 | 23.65 |
| 23.89 | 23.81 | 23.48 | 23.53 | 22.91 | 22.32 | 23.5 | 23.69 | 23.33 | 23.34 |
| 23.84 | 23.75 | 23.38 | 23.42 | 22.74 | 22.83 | 23.71 | 23.41 | 23.45 | 23.42 |
| 23.64 | 23.55 | 23.55 | 23.22 | 22.92 | 22.91 | 23.58 | 23.61 | 24.02 | 24.13 |
| 23.57 | 23.62 | 22.98 | 23.17 | ||||||
| 23.51 | 23.43 | 23.77 | 23.71 |
Fig4 B- Period Length- With and Without LP CT14
| WT - | WT + | NCo - | NCo + | P1NKo - | P1NKo + | GCo - | GCo + | P1GKo - | P1GKo + |
| 23.54 | 23.53 | 23.4 | 23.4 | 22.98 | 22.99 | 23.71 | 23.73 | 23.77 | 23.75 |
| 23.64 | 23.58 | 23.36 | 23.35 | 22.84 | 22.76 | 24.05 | 24.02 | 23.57 | 23.38 |
| 23.91 | 23.85 | 23.66 | 23.5 | 23.32 | 23.2 | 23.83 | 23.88 | 23.47 | 23.46 |
| 23.67 | 23.49 | 23.31 | 23.37 | 23.57 | 23.77 | 23.78 | 23.72 | 23.63 | 23.62 |
| 23.62 | 23.56 | 23.5 | 23.5 | 23.33 | 23.51 | 23.61 | 23.58 | 23.54 | 23.48 |
| 23.68 | 23.61 | 23.24 | 23.27 | 23.36 | 23.34 | 23.92 | 23.92 | 23.35 | 23.34 |
| 23.72 | 23.55 | 23.54 | 23.1 | 22.5 | 22.83 | 23.46 | 23.42 | 23.83 | 23.55 |
| 23.97 | 23.98 | 23.47 | 23.51 | 22.88 | 22.91 | 23.54 | 23.56 | 23.7 | 23.74 |
| 23.77 | 23.85 | 23.48 | 23.47 | 23.47 | 23.59 | 23.65 | 23.71 | 23.51 | 23.5 |
| 23.63 | 23.65 | 23.43 | 23.68 | 22.54 | 22.83 | 23.53 | 23.66 | 24.1 | 24.07 |
| 23.34 | 23.38 | 22.82 | 22.86 | ||||||
| 23.35 | 23.47 | 23.77 | 23.77 |
Fig4 C- Period Length- With and Without LP CT22
| WT - | WT + | NCo - | NCo + | P1NKO - | P1NKO + | GCo - | GCo + | P1GKO - | P1GKO + |
| 23.85 | 23.56 | 23.59 | 23.51 | 22.94 | 22.51 | 23.78 | 23.71 | 23.92 | 23.79 |
| 23.81 | 23.79 | 23.54 | 23.56 | 23.56 | 22.94 | 24.08 | 24 | 23.69 | 23.58 |
| 24.01 | 23.84 | 23.67 | 23.67 | 23.13 | 22.75 | 23.94 | 23.82 | 23.53 | 23.37 |
| 23.91 | 23.63 | 23.49 | 23.39 | 23.46 | 23.41 | 23.87 | 23.77 | 23.79 | 23.6 |
| 23.67 | 23.63 | 23.68 | 23.28 | 23.6 | 23.4 | 23.76 | 23.68 | 23.67 | 23.48 |
| 23.68 | 23.72 | 23.81 | 23.67 | 23.97 | 23.48 | 23.99 | 23.76 | 23.63 | 23.23 |
| 23.89 | 23.7 | 23.6 | 23.27 | 23.49 | 23.3 | 23.79 | 23.59 | 23.69 | 23.48 |
| 24.06 | 23.93 | 23.56 | 23.5 | 23.47 | 23.41 | 23.88 | 23.46 | 23.68 | 23.38 |
| 23.93 | 23.77 | 23.39 | 23.27 | 23.22 | 23.02 | 23.94 | 23.55 | 23.88 | 23.49 |
| 23.83 | 23.66 | 23.65 | 23.46 | 22.93 | 22.57 | 23.75 | 23.71 | 24.11 | 23.99 |
| 23.87 | 23.25 | 22.76 | 22.72 | ||||||
| 23.81 | 23.64 | 22.95 | 22.49 | ||||||
| 23.54 | 23.4 | 23.54 | 23.42 | ||||||
| 23.49 | 23.44 | 23.41 | 22.89 | ||||||
| 23.56 | 23.37 | 23.07 | 22.81 | ||||||
| 23.58 | 23.3 | 23.91 | 23.67 | ||||||
| 23.73 | 23.56 | ||||||||
| 23.42 | 23.39 | ||||||||
| 23.64 | 23.34 | ||||||||
| 23.68 | 23.55 |
Fig 5A- Amplitude- With and Without LP CT10
| WT - | WT + | ||
| 1629.2 | 1673.6 | ||
| 596.2 | 484.83 | ||
| 1630.28 | 1651.32 | ||
| 1291.7 | 1170.19 | ||
| 1708.38 | 1881.72 | ||
| 1462.28 | 1744.38 | ||
| 1477 | 1625.51 | ||
| 1394.99 | 1103.68 | ||
| 1476.33 | 1515.13 | ||
| 1412.77 | 1442.94 | ||
| NCo - | NCo + | P1NKO - | P1NKO + |
| 1566.23 | 1630.78 | 1022.9 | 914.22 |
| 1367.67 | 1368.14 | 679.31 | 631.27 |
| 1525.49 | 1519.59 | 1533.5 | 1309.38 |
| 1895.58 | 1911.1 | 1269.11 | 1179.53 |
| 1394.79 | 1565.67 | 1256.69 | 1470.32 |
| 1588 | 1784.54 | 911.89 | 784.27 |
| 1150.29 | 1185.78 | 1092.38 | 1123.25 |
| 879.61 | 1120.03 | 1180.42 | 1047.43 |
| 1737.62 | 1769.17 | 1187.93 | 1174.27 |
| 1405.35 | 1654.24 | 1305.9 | 1262.47 |
| 1066.06 | 1186.45 | 961.34 | 1060.84 |
| 1604.57 | 1771.29 | 1110.39 | 1303.44 |
| GCo - | GCo + | P1GKO - | P1GKO + |
| 1420.29 | 1181 | 968.53 | 1097.58 |
| 1253.68 | 1146.13 | 1232.85 | 920.71 |
| 1043.8 | 887.32 | 1291.7 | 1170.19 |
| 934.56 | 910.72 | 963.98 | 893.04 |
| 1346.69 | 1362.21 | 1464.79 | 1534.84 |
| 1029.59 | 1106.36 | 1274.09 | 1088.74 |
| 1421.2 | 1427.64 | 1051.08 | 970.53 |
| 1320.21 | 1469.69 | 1006.68 | 907.49 |
| 1172.18 | 1173.28 | 1609.85 | 1195.26 |
| 1147.91 | 1064.07 | 639.8 | 1062.97 |
Fig 5B- Amplitude- With and Without LP CT14
| WT - | WT + | ||
| 1700.28 | 1731 | ||
| 1025.83 | 679.8 | ||
| 1793.12 | 1658.44 | ||
| 1561.66 | 1578.08 | ||
| 1716.78 | 1780.54 | ||
| 1443.52 | 1616.54 | ||
| 1046.23 | 1413.56 | ||
| 1347.69 | 1433.07 | ||
| 1385.71 | 1511.1 | ||
| 1288.71 | 1491.23 | ||
| NCo - | NCo + | P1NKO - | P1NKO + |
| 1675.76 | 1615.08 | 1234.96 | 1048.78 |
| 1494.18 | 1429.02 | 831.3 | 664.68 |
| 1676.09 | 1520.32 | 1414.74 | 1535.74 |
| 1322.45 | 1534.78 | 1452.98 | 1378.7 |
| 1438.15 | 1531.97 | 1205.68 | 1464.62 |
| 1769.83 | 1535.75 | 1083.32 | 1289.99 |
| 1408.81 | 1089.65 | 1057.86 | 1185.5 |
| 1281.54 | 1504.97 | 1066.39 | 1207.54 |
| 1320.81 | 1573.63 | 1015.99 | 1270.6 |
| 1580.79 | 1650.43 | 1246.28 | 1575.57 |
| 1794.14 | 1747.38 | 1156.43 | 1331.06 |
| 1154.33 | 1057.54 | 1063.21 | 855.05 |
| GCO - | GCo + | P1GKO - | P1GKO + |
| 1420.29 | 1181 | 968.53 | 1097.58 |
| 1253.68 | 1146.13 | 1232.85 | 920.71 |
| 1043.8 | 887.32 | 1291.7 | 1170.19 |
| 934.56 | 910.72 | 963.98 | 893.04 |
| 1346.69 | 1362.21 | 1464.79 | 1534.84 |
| 1029.59 | 1106.36 | 1274.09 | 1088.74 |
| 1421.2 | 1427.64 | 1051.08 | 970.53 |
| 1320.21 | 1469.69 | 1006.68 | 907.49 |
| 1172.18 | 1173.28 | 1609.85 | 1195.26 |
| 1147.91 | 1064.07 | 639.8 | 1062.97 |
Fig 5C- Amplitude- With and Without LP CT22
| WT - | WT + | ||
| 1073.47 | 1062.06 | ||
| 1670.84 | 1784.74 | ||
| 1476.21 | 1601.83 | ||
| 1588.3 | 1832.59 | ||
| 1135.89 | 1156.47 | ||
| 1479.6 | 1327.47 | ||
| 1116.26 | 961.53 | ||
| 1339.08 | 1521.42 | ||
| 1587.32 | 1640.92 | ||
| 1238.91 | 1340.14 | ||
| NCo - | NCO + | P1NKO - | P1NKO + |
| 1481.56 | 1529.37 | 1227.28 | 1189.36 |
| 1624.38 | 1409.12 | 1023 | 850.79 |
| 1861.74 | 1676.92 | 1244.99 | 1461.47 |
| 1448.02 | 1667.55 | 1381.32 | 1438.58 |
| 1255.35 | 1497.07 | 727.42 | 1241.72 |
| 1375.49 | 1412.21 | 1274.48 | 1178.82 |
| 959.37 | 1068.34 | 691.59 | 936.2 |
| 1819.02 | 1752.56 | 971.88 | 1207.46 |
| 997.71 | 961.52 | 1174.01 | 1162.88 |
| 1150.3 | 1556.34 | 1051.52 | 1034.11 |
| 1033.47 | 1434.64 | 1496.9 | 1440.03 |
| 1427.15 | 1426.25 | 894.46 | 984.58 |
| 1296.44 | 1384.99 | 1364.76 | 1330.06 |
| 961.63 | 1306.92 | 1176.71 | 1194.95 |
| 1586.6 | 2086.73 | 989.71 | 1076.45 |
| 1902.79 | 1823.62 | 1450.16 | 1423.16 |
| 1261.72 | 1206.29 | ||
| 1539.68 | 1891.81 | ||
| 1927.48 | 1987.97 | ||
| 1508.26 | 1490.64 | ||
| GCo - | GCo + | P1GKO - | P1GKO + |
| 1518.92 | 1282.65 | 1070.15 | 785.52 |
| 1405.78 | 1383.96 | 1371.63 | 1299.42 |
| 1252.48 | 1127.76 | 1319.08 | 1325.03 |
| 1522.85 | 1714.34 | 1139.27 | 1006.39 |
| 952.73 | 1042.12 | 1631.8 | 1721.83 |
| 1175.99 | 1458.97 | 966.08 | 1253.66 |
| 1280.26 | 1409.2 | 1021.15 | 818.92 |
| 1136.51 | 1507.97 | 1235.66 | 1200.19 |
| 1133.49 | 794.41 | 1098.63 | 1591.71 |
| 1102.36 | 1276.25 | 1208.2 | 780.88 |
Fig 6A- Relative Power of Phase- With and Without LP CT10
| WT - | WT + | ||
| 0.0115 | 0.0119 | ||
| 0.0032 | 0.0022 | ||
| 0.0104 | 0.0105 | ||
| 0.01 | 0.0089 | ||
| 0.0121 | 0.0139 | ||
| 0.0114 | 0.0114 | ||
| 0.008 | 0.0081 | ||
| 0.0132 | 0.011 | ||
| 0.0087 | 0.0083 | ||
| 0.0106 | 0.0111 | ||
| NCo - | NCo + | P1NKO - | P1NKO + |
| 0.0102 | 0.0098 | 0.0049 | 0.0049 |
| 0.0095 | 0.0093 | 0.0041 | 0.0033 |
| 0.0094 | 0.0075 | 0.0076 | 0.0068 |
| 0.0149 | 0.0155 | 0.0052 | 0.0044 |
| 0.0097 | 0.0092 | 0.0079 | 0.0076 |
| 0.0127 | 0.0129 | 0.0044 | 0.0045 |
| 0.0156 | 0.0144 | 0.0075 | 0.007 |
| 0.007 | 0.008 | 0.0075 | 0.0072 |
| 0.0094 | 0.0112 | 0.0068 | 0.0062 |
| 0.0119 | 0.012 | 0.0068 | 0.0052 |
| 0.0126 | 0.0134 | 0.005 | 0.0046 |
| 0.0177 | 0.0152 | 0.0068 | 0.0065 |
| GCo - | GCo + | P1GKO - | P1GKO + |
| 0.0098 | 0.0093 | 0.0053 | 0.0055 |
| 0.0082 | 0.008 | 0.0077 | 0.0065 |
| 0.007 | 0.0053 | 0.007 | 0.0061 |
| 0.01 | 0.0095 | 0.0058 | 0.0055 |
| 0.0055 | 0.0054 | 0.0088 | 0.0083 |
| 0.0077 | 0.0088 | 0.01 | 0.0092 |
| 0.0145 | 0.0141 | 0.0111 | 0.0102 |
| 0.011 | 0.0107 | 0.0081 | 0.0064 |
| 0.0131 | 0.0139 | 0.0109 | 0.0101 |
| 0.0112 | 0.0105 | 0.006 | 0.0089 |
Fig 6B- Relative Power of Phase- With and Without LP CT14
| WT - | WT + | ||
| 0.0121 | 0.0123 | ||
| 0.005 | 0.0033 | ||
| 0.0116 | 0.0103 | ||
| 0.0104 | 0.0104 | ||
| 0.0118 | 0.0121 | ||
| 0.0124 | 0.0129 | ||
| 0.0062 | 0.0069 | ||
| 0.0157 | 0.0145 | ||
| 0.0101 | 0.0091 | ||
| 0.0107 | 0.011 | ||
| NCo - | NCo + | P1NKO - | P1NKO + |
| 0.0108 | 0.0107 | 0.0053 | 0.0046 |
| 0.0095 | 0.0095 | 0.0051 | 0.0042 |
| 0.0099 | 0.0094 | 0.007 | 0.0075 |
| 0.0107 | 0.0102 | 0.0078 | 0.0094 |
| 0.0138 | 0.0127 | 0.0068 | 0.0056 |
| 0.0105 | 0.0112 | 0.0084 | 0.0078 |
| 0.0118 | 0.0086 | 0.0085 | 0.0073 |
| 0.0099 | 0.0104 | 0.0076 | 0.0069 |
| 0.0119 | 0.0145 | 0.0079 | 0.0075 |
| 0.0118 | 0.0124 | 0.0067 | 0.0075 |
| 0.0146 | 0.0125 | 0.006 | 0.007 |
| 0.0117 | 0.0099 | 0.0066 | 0.0077 |
| GCo - | GCo + | P1GKO - | P1GKO + |
| 0.0093 | 0.0095 | 0.0046 | 0.0055 |
| 0.0094 | 0.0084 | 0.0073 | 0.0072 |
| 0.0086 | 0.0077 | 0.0077 | 0.0073 |
| 0.0122 | 0.011 | 0.0068 | 0.0061 |
| 0.0062 | 0.0059 | 0.0088 | 0.0097 |
| 0.0119 | 0.0135 | 0.0091 | 0.0098 |
| 0.014 | 0.0152 | 0.0089 | 0.011 |
| 0.0089 | 0.0077 | 0.0079 | 0.0083 |
| 0.0122 | 0.0119 | 0.0101 | 0.0089 |
| 0.0079 | 0.014 | 0.0118 | 0.012 |
Fig 6C- Relative Power of Phase- With and Without LP CT22
| WT - | WT + | ||
| 0.0048 | 0.0049 | ||
| 0.0114 | 0.0116 | ||
| 0.0097 | 0.0103 | ||
| 0.011 | 0.0119 | ||
| 0.0069 | 0.0073 | ||
| 0.0121 | 0.0122 | ||
| 0.0133 | 0.0157 | ||
| 0.0116 | 0.0111 | ||
| 0.0062 | 0.0062 | ||
| 0.0106 | 0.0106 | ||
| NCo - | NCo + | P1NKO - | P1NKO + |
| 0.0106 | 0.0113 | 0.0058 | 0.0055 |
| 0.0129 | 0.0106 | 0.0054 | 0.0049 |
| 0.0118 | 0.0101 | 0.0091 | 0.0069 |
| 0.0121 | 0.0123 | 0.0095 | 0.0083 |
| 0.0082 | 0.0115 | 0.0058 | 0.0068 |
| 0.0065 | 0.0061 | 0.0073 | 0.0083 |
| 0.0125 | 0.0166 | 0.004 | 0.0048 |
| 0.0168 | 0.0173 | 0.0115 | 0.0122 |
| 0.0125 | 0.0136 | 0.0075 | 0.0086 |
| 0.0133 | 0.011 | 0.0071 | 0.0079 |
| 0.0059 | 0.0064 | 0.0069 | 0.0068 |
| 0.0143 | 0.0124 | 0.0085 | 0.0076 |
| 0.0105 | 0.0098 | 0.0049 | 0.0053 |
| 0.0132 | 0.0166 | 0.0068 | 0.0072 |
| 0.0108 | 0.0126 | 0.0092 | 0.0076 |
| 0.0143 | 0.0132 | 0.0136 | 0.0166 |
| 0.0144 | 0.0159 | ||
| 0.0127 | 0.0138 | ||
| 0.0137 | 0.0185 | ||
| 0.018 | 0.0169 | ||
| GCo - | GCo + | P1GKO - | P1GKO + |
| 0.0103 | 0.0098 | 0.0071 | 0.0046 |
| 0.01 | 0.0101 | 0.0079 | 0.007 |
| 0.008 | 0.0082 | 0.0085 | 0.0078 |
| 0.0102 | 0.0128 | 0.0071 | 0.0064 |
| 0.0058 | 0.0061 | 0.0108 | 0.0089 |
| 0.0105 | 0.0116 | 0.0087 | 0.0091 |
| 0.0096 | 0.0122 | 0.0103 | 0.0092 |
| 0.0139 | 0.0145 | 0.0096 | 0.0077 |
| 0.0109 | 0.0126 | 0.008 | 0.0106 |
| 0.0125 | 0.0084 | 0.0099 | 0.0072 |
Fig 7A- Wheel Revolutions- With and Without LP CT10
| WT - | WT + | ||
| 244734 | 240866 | ||
| 46792 | 32568 | ||
| 237729 | 236200 | ||
| 217243 | 188537 | ||
| 454149 | 520440 | ||
| 249152 | 250230 | ||
| 146302 | 136451 | ||
| 389652 | 342849 | ||
| 312362 | 262004 | ||
| 341940 | 351375 | ||
| NCo - | NCo + | P1NKO - | P1NKO + |
| 218791 | 205467 | 111072 | 126750 |
| 252929 | 217789 | 119075 | 102913 |
| 342744 | 262696 | 322705 | 276080 |
| 482338 | 572646 | 204308 | 149835 |
| 313478 | 355716 | 193381 | 180136 |
| 330132 | 295652 | 198051 | 206006 |
| 637773 | 610999 | 203996 | 150433 |
| 234887 | 261367 | 454497 | 374048 |
| 384940 | 441118 | 423743 | 378609 |
| 339336 | 353439 | 315264 | 322637 |
| 345426 | 352075 | 210797 | 291156 |
| 249229 | 261962 | 322166 | 319490 |
| GCo - | GCo + | P1GKO - | P1GKO + |
| 296336 | 255942 | 105882 | 107544 |
| 229251 | 214979 | 144644 | 130187 |
| 185580 | 134745 | 179670 | 168521 |
| 195696 | 178052 | 204501 | 169353 |
| 159084 | 144890 | 290940 | 275816 |
| 224838 | 199862 | 416302 | 411713 |
| 448138 | 433318 | 336436 | 337461 |
| 318614 | 339488 | 314908 | 242631 |
| 426093 | 410714 | 322923 | 266675 |
| 331914 | 299191 | 142074 | 283565 |
Fig 7B- Wheel Revolutions- With and Without LP CT14
| WT - | WT + | ||
| 240410 | 254367 | ||
| 82311 | 49743 | ||
| 285137 | 242927 | ||
| 215179 | 227147 | ||
| 376859 | 462758 | ||
| 278298 | 270004 | ||
| 129260 | 134719 | ||
| 417326 | 380632 | ||
| 352962 | 318603 | ||
| 350868 | 350632 | ||
| NCo - | NCo + | P1NKO - | P1NKO + |
| 251290 | 231417 | 156910 | 115182 |
| 280599 | 265181 | 118707 | 115494 |
| 342037 | 339369 | 262451 | 321276 |
| 254022 | 320806 | 289847 | 310230 |
| 533059 | 446784 | 178316 | 207862 |
| 292090 | 300417 | 231630 | 200888 |
| 378389 | 550061 | 386629 | 432737 |
| 233259 | 228652 | 178930 | 173431 |
| 613617 | 604298 | 200160 | 222907 |
| 461801 | 545264 | 398227 | 479472 |
| 290516 | 298258 | 374886 | 409356 |
| 330929 | 339254 | 360278 | 320689 |
| GCo - | GCo + | P1GKO - | P1GKO + |
| 262020 | 285084 | 96965 | 107620 |
| 306433 | 230807 | 157855 | 134910 |
| 175325 | 191835 | 170113 | 174704 |
| 242560 | 195258 | 194854 | 207609 |
| 148531 | 163719 | 241263 | 285885 |
| 362979 | 386668 | 356582 | 406299 |
| 397118 | 448138 | 314382 | 335690 |
| 239686 | 227843 | 246404 | 334522 |
| 348745 | 349613 | 364804 | 390672 |
| 208570 | 438812 | 250504 | 159382 |
Fig 7C- Wheel Revolutions- With and Without LP CT22
| WT - | WT + | ||
| 92557 | 85671 | ||
| 262836 | 277889 | ||
| 200624 | 213688 | ||
| 313694 | 421147 | ||
| 175633 | 214912 | ||
| 268751 | 267469 | ||
| 136337 | 111548 | ||
| 387280 | 413122 | ||
| 344158 | 369719 | ||
| 327321 | 361340 | ||
| NCo - | NCo + | P1NKO - | P1NKO + |
| 239390 | 234918 | 160751 | 140374 |
| 312436 | 260558 | 129961 | 113624 |
| 354334 | 342854 | 219735 | 256441 |
| 317156 | 337413 | 257202 | 282733 |
| 169070 | 244920 | 133229 | 168874 |
| 128860 | 93636 | 146894 | 230736 |
| 416713 | 502006 | 176013 | 181463 |
| 519500 | 593352 | 272844 | 290042 |
| 292209 | 296689 | 165029 | 228320 |
| 371353 | 386950 | 376412 | 397206 |
| 193241 | 229756 | 268641 | 378746 |
| 431143 | 431138 | 358247 | 421444 |
| 361284 | 406581 | 208696 | 206332 |
| 256446 | 338402 | 317752 | 306705 |
| 252999 | 339745 | 343732 | 408438 |
| 338345 | 341841 | 261867 | 268968 |
| 366863 | 317026 | ||
| 219944 | 252265 | ||
| 493689 | 660953 | ||
| 449941 | 495378 | ||
| GCo - | GCo + | P1GKO - | P1GKO + |
| 256610 | 234705 | 145045 | 97931 |
| 308817 | 275293 | 179235 | 160647 |
| 246088 | 182287 | 179498 | 170569 |
| 212203 | 247235 | 190443 | 182077 |
| 194307 | 148037 | 313510 | 268019 |
| 337609 | 387877 | 277649 | 374044 |
| 326693 | 427769 | 318375 | 316719 |
| 343640 | 387117 | 275483 | 270982 |
| 430180 | 268466 | 207919 | 339585 |
| 319850 | 362163 | 335811 | 180523 |
References
- Roenneberg, T.; Merrow, M. The Circadian Clock and Human Health. Curr Biol 2016, 26, R432–443. [Google Scholar] [CrossRef]
- Takahashi, J.S. Transcriptional architecture of the mammalian circadian clock. Nat Rev Genet 2017, 18, 164–179. [Google Scholar] [CrossRef] [PubMed]
- Albrecht, U. Timing to perfection: the biology of central and peripheral circadian clocks. Neuron 2012, 74, 246–260. [Google Scholar] [CrossRef] [PubMed]
- Daan, S.; Pittendrigh, C.S. A function analysis of circadian pacemakers in nocturnal rodents. II. The variability of phase response curves. J. Comp. Physiol. 1976, 106, 253–266. [Google Scholar] [CrossRef]
- Schwartz, W.J.; Zimmerman, P. Circadian timekeeping in BALB/c and C57BL/6 inbred mouse strains. J Neurosci 1990, 10, 3685–3694. [Google Scholar] [CrossRef]
- Foster, R.G.; Hughes, S.; Peirson, S.N. Circadian Photoentrainment in Mice and Humans. Biology (Basel) 2020, 9. [Google Scholar] [CrossRef]
- Albrecht, U.; Sun, Z.S.; Eichele, G.; Lee, C.C. A Differential Response of Two Putative Mammalian Circadian Regulators, mper1and mper2, to Light. Cell 1997, 91, 1055–1064. [Google Scholar] [CrossRef]
- Dziema, H.; Oatis, B.; Butcher, G.Q.; Yates, R.; Hoyt, K.R.; Obrietan, K. The ERK/MAP kinase pathway couples light to immediate-early gene expression in the suprachiasmatic nucleus. Eur J Neurosci 2003, 17, 1617–1627. [Google Scholar] [CrossRef]
- Golombek, D.A.; Rosenstein, R.E. Physiology of circadian entrainment. Physiol Rev 2010, 90, 1063–1102. [Google Scholar] [CrossRef]
- Shigeyoshi, Y.; Taguchi, K.; Yamamoto, S.; Takekida, S.; Yan, L.; Tei, H.; Moriya, T.; Shibata, S.; Loros, J.J.; Dunlap, J.C.; et al. Light-Induced Resetting of a Mammalian Circadian Clock Is Associated with Rapid Induction of the mPer1 Transcript. Cell 1997, 91, 1043–1053. [Google Scholar] [CrossRef] [PubMed]
- Yan, L.; Silver, R. Differential induction and localization of mPer1 and mPer2 during advancing and delaying phase shifts. Eur J Neurosci 2002, 16, 1531–1540. [Google Scholar] [CrossRef]
- Albrecht, U.; Zheng, B.; Larkin, D.; Sun, Z.S.; Lee, C.C. MPer1 and mper2 are essential for normal resetting of the circadian clock. J Biol Rhythms 2001, 16, 100–104. [Google Scholar] [CrossRef]
- Spoelstra, K.; Albrecht, U.; van der Horst, G.T.; Brauer, V.; Daan, S. Phase responses to light pulses in mice lacking functional per or cry genes. J Biol Rhythms 2004, 19, 518–529. [Google Scholar] [CrossRef]
- Hassan, S.A.; Wendrich, K.S.; Albrecht, U. Deletion of Clock Gene Period 2 (Per2) in Astrocytes Shortens Clock Period but Does Not Affect Light-Mediated Phase Shifts in Mice. Clocks Sleep 2025, 7. [Google Scholar] [CrossRef]
- Olejniczak, I.; Ripperger, J.A.; Sandrelli, F.; Schnell, A.; Mansencal-Strittmatter, L.; Wendrich, K.; Hui, K.Y.; Brenna, A.; Ben Fredj, N.; Albrecht, U. Light affects behavioral despair involving the clock gene Period 1. PLoS Genet 2021, 17, e1009625. [Google Scholar] [CrossRef]
- Aschoff, J. Circadian Rhythms in Man. Science 1965, 148, 1427–1432. [Google Scholar] [CrossRef]
- Pittendrigh, C.S. Circadian Systems: Entrainment. In Biological Rhythms, Aschoff, J., Ed.; Springer: Boston, MA, USA, 1981; pp. 95–124. [Google Scholar]
- Yamaguchi, S.; Isejima, H.; Matsuo, T.; Okura, R.; Yagita, K.; Kobayashi, M.; Okamura, H. Synchronization of cellular clocks in the suprachiasmatic nucleus. Science 2003, 302, 1408–1412. [Google Scholar] [CrossRef] [PubMed]
- Prolo, L.M.; Takahashi, J.S.; Herzog, E.D. Circadian rhythm generation and entrainment in astrocytes. J Neurosci 2005, 25, 404–408. [Google Scholar] [CrossRef] [PubMed]
- Abarca, C.; Albrecht, U.; Spanagel, R. Cocaine sensitization and reward are under the influence of circadian genes and rhythm. Proc Natl Acad Sci U S A 2002, 99, 9026–9030. [Google Scholar] [CrossRef] [PubMed]
- Park, J.; Lee, K.; Kim, H.; Shin, H.; Lee, C. Endogenous circadian reporters reveal functional differences of PERIOD paralogs and the significance of PERIOD:CK1 stable interaction. Proc Natl Acad Sci U S A 2023, 120, e2212255120. [Google Scholar] [CrossRef]
- Cheng, H.Y.; Alvarez-Saavedra, M.; Dziema, H.; Choi, Y.S.; Li, A.; Obrietan, K. Segregation of expression of mPeriod gene homologs in neurons and glia: possible divergent roles of mPeriod1 and mPeriod2 in the brain. Hum Mol Genet 2009, 18, 3110–3124. [Google Scholar] [CrossRef] [PubMed]
- Patton, A.P.; Smyllie, N.J.; Chesham, J.E.; Hastings, M.H. Astrocytes Sustain Circadian Oscillation and Bidirectionally Determine Circadian Period, But Do Not Regulate Circadian Phase in the Suprachiasmatic Nucleus. J Neurosci 2022, 42, 5522–5537. [Google Scholar] [CrossRef] [PubMed]
- Jud, C.; Schmutz, I.; Hampp, G.; Oster, H.; Albrecht, U. A guideline for analyzing circadian wheel-running behavior in rodents under different lighting conditions. Biol Proced Online 2005, 7, 101–116. [Google Scholar] [CrossRef] [PubMed]
- Tronche, F.; Kellendonk, C.; Kretz, O.; Gass, P.; Anlag, K.; Orban, P.C.; Bock, R.; Klein, R.; Schütz, G. Disruption of the glucocorticoid receptor gene in the nervous system results in reduced anxiety. Nature Genetics 1999, 23, 99–103. [Google Scholar] [CrossRef]
- Zhuo, L.; Theis, M.; Alvarez-Maya, I.; Brenner, M.; Willecke, K.; Messing, A. hGFAP-cre transgenic mice for manipulation of glial and neuronal function in vivo. Genesis 2001, 31, 85–94. [Google Scholar] [CrossRef]
- Brenna, A.; Ripperger, J.A.; Albrecht, U. Locomotor Activity Monitoring in Mice to Study the Phase Shift of Circadian Rhythms Using ClockLab (Actimetrics). Bio Protoc 2025, 15, e5187. [Google Scholar] [CrossRef]
Figure 1.
Immunohistochemistry of PER1 expression in the suprachiasmatic nuclei (SCN) of neuronal control (NCo), neuronal Per1 knock-out (Per1NKo), glial control (GCo) and glial Per1 knock-out (Per1GKo) mice at Zeitgeber time (ZT) 12. (A) Photomicrographs of SCNs from NCo and Per1NKO mice at low to high magnification (from left to right, white line = 50 µm, 10 µm, 5 µm). White squares indicate the magnified areas. The images at right show 3D reconstructions of cells with DAPI nuclear staining (blue). Green = PER1, red = NeuN specific to neuronal cells. (B) Photomicrographs of SCNs from GCo and Per1GKO mice at low to high magnification (from left to right, white line = 50 µm, 10 µm, 5 µm). White squares indicate the magnified areas. The images at right show 3D reconstructions of cells with DAPI nuclear staining (blue). Green = PER1, pink = glial fibrillary acidic protein (GFAP) specific to glial cells including astrocytes.
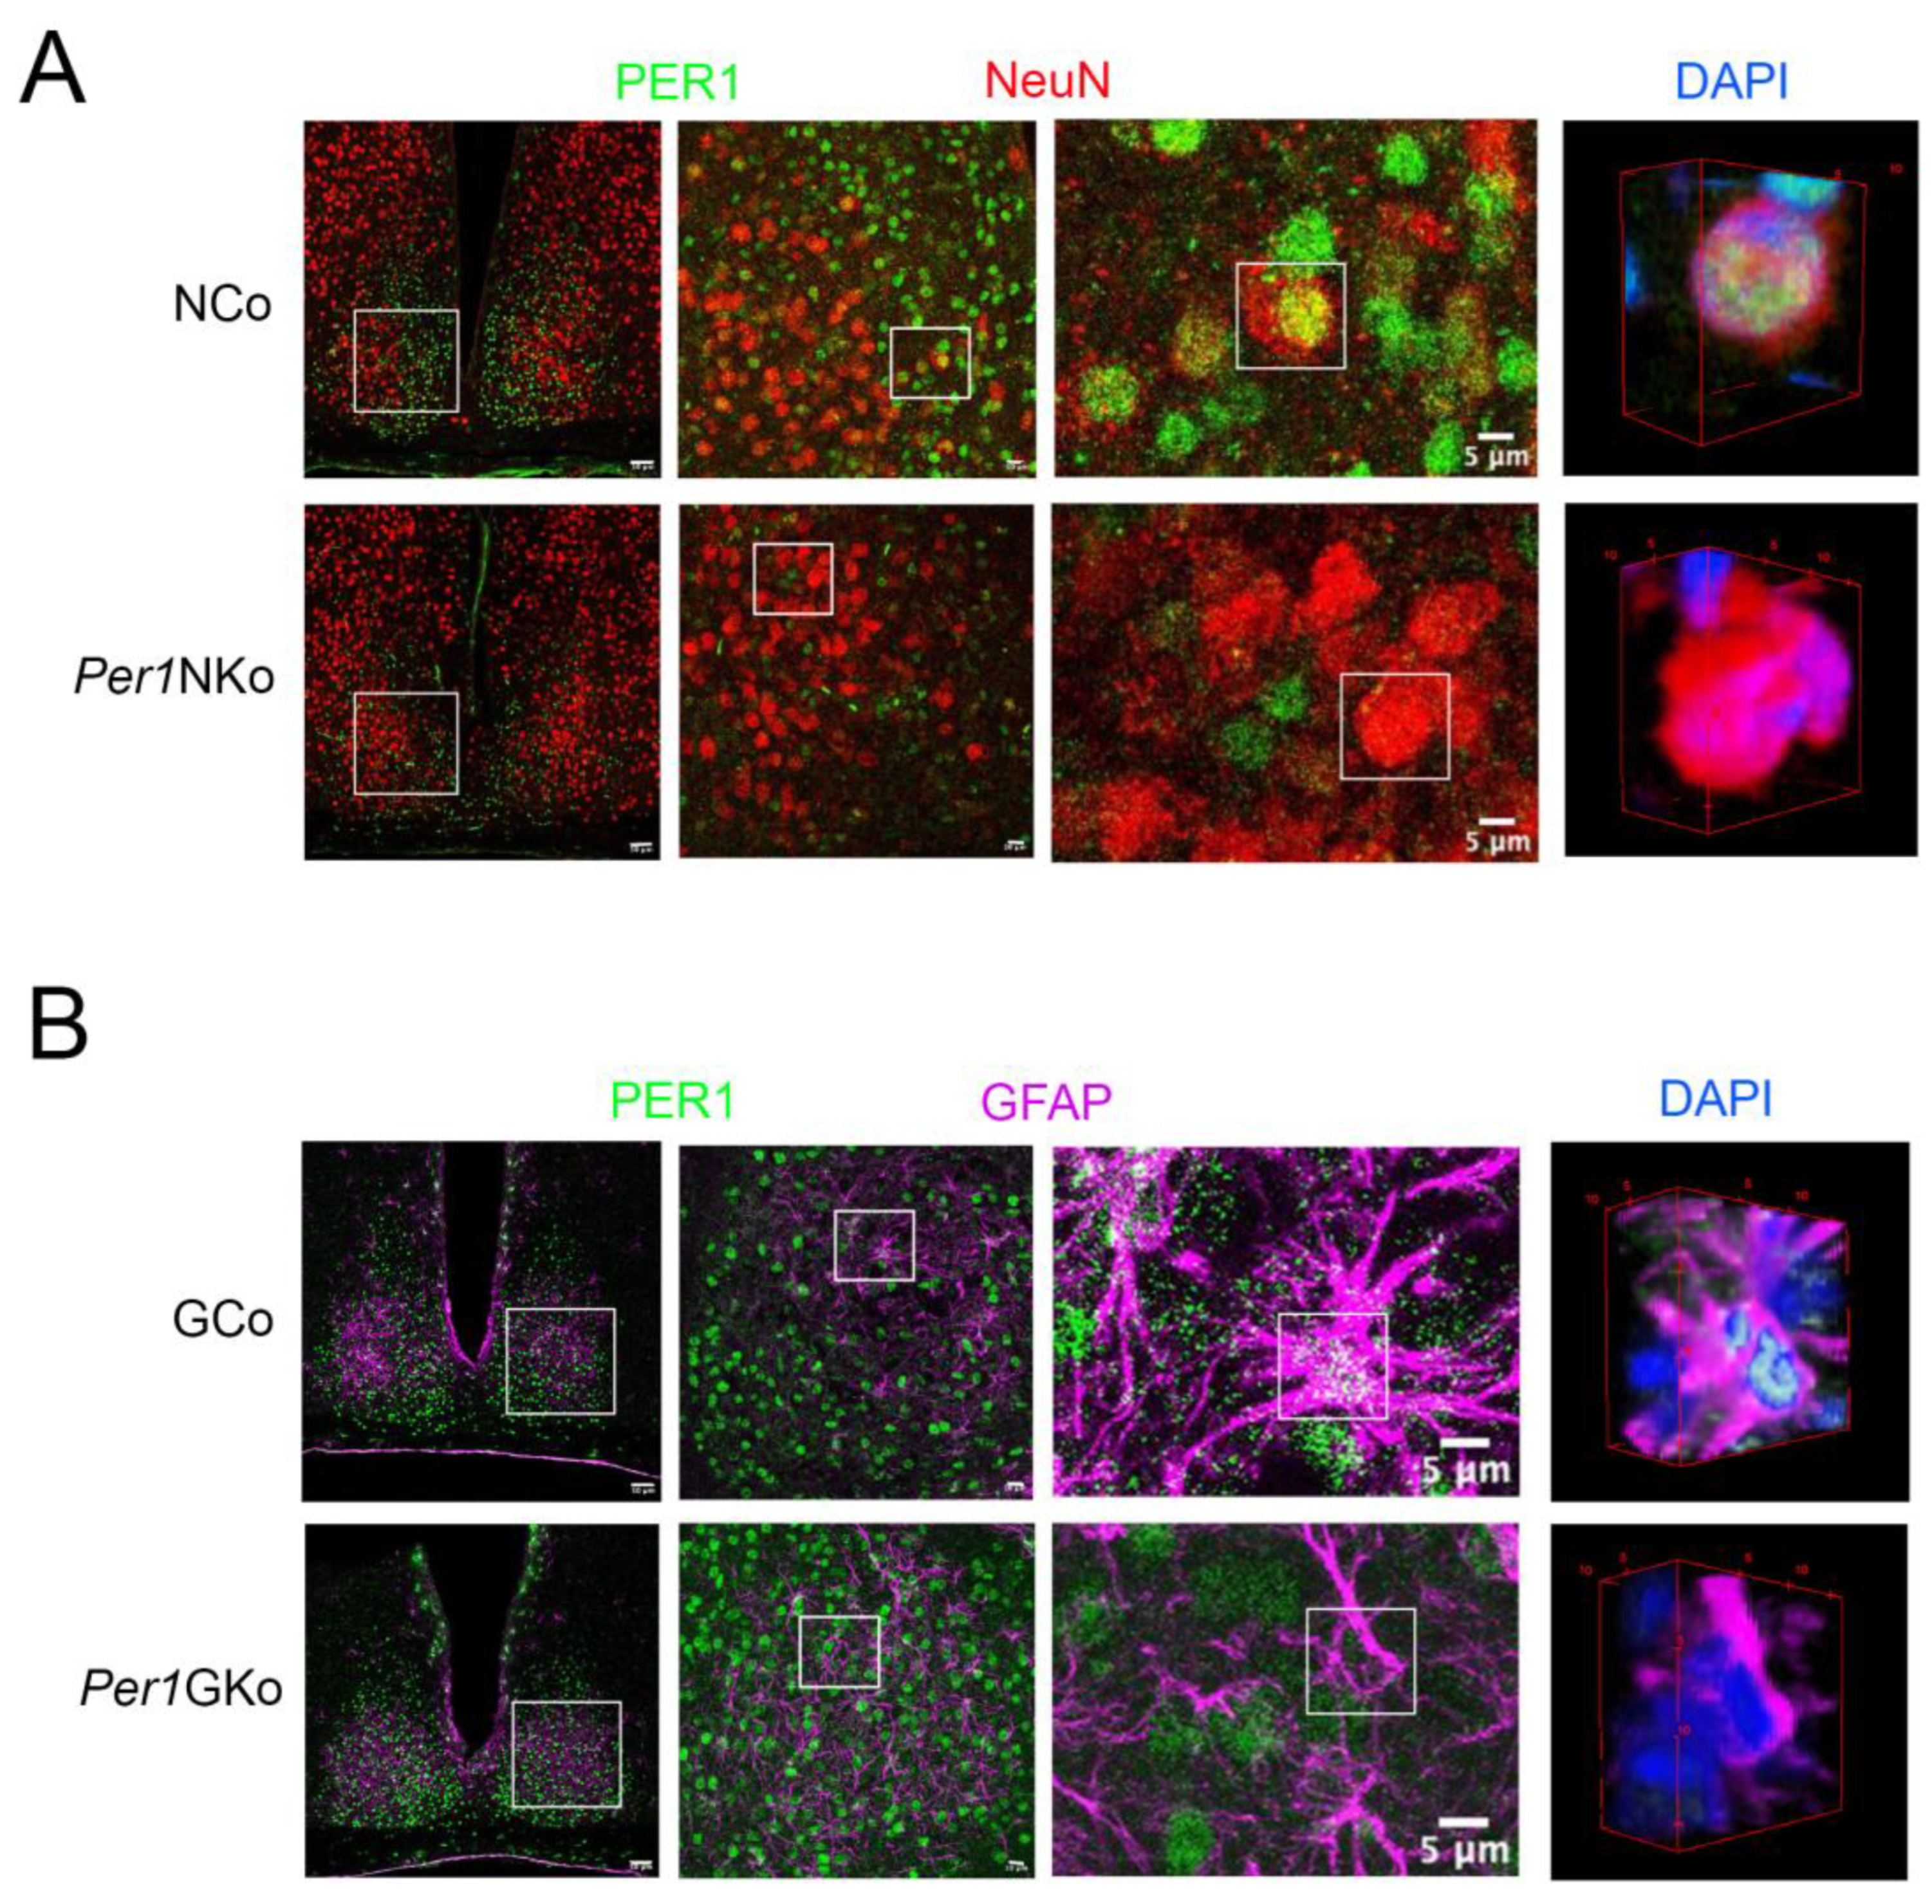
Figure 2.
Experimental design for application of 15-minute light pulses (LPs, red arrows) using the Aschoff type I protocol. Mice were kept in a light / dark cycle (LD) for 2 weeks and then they were released into constant darkness (DD) before receiving a LP at circadian time (CT) 10. Subsequently, the animals were kept for 2 weeks in DD before they received a LP at CT14 (early subjective night). The mice were again kept for 2 weeks in DD and then they received a LP at CT22 (late subjective night). Subsequently, the animals were kept again in DD for 2 weeks. During the whole experiment locomotor activity was recorded. White and black bars represent light or dark, respectively.
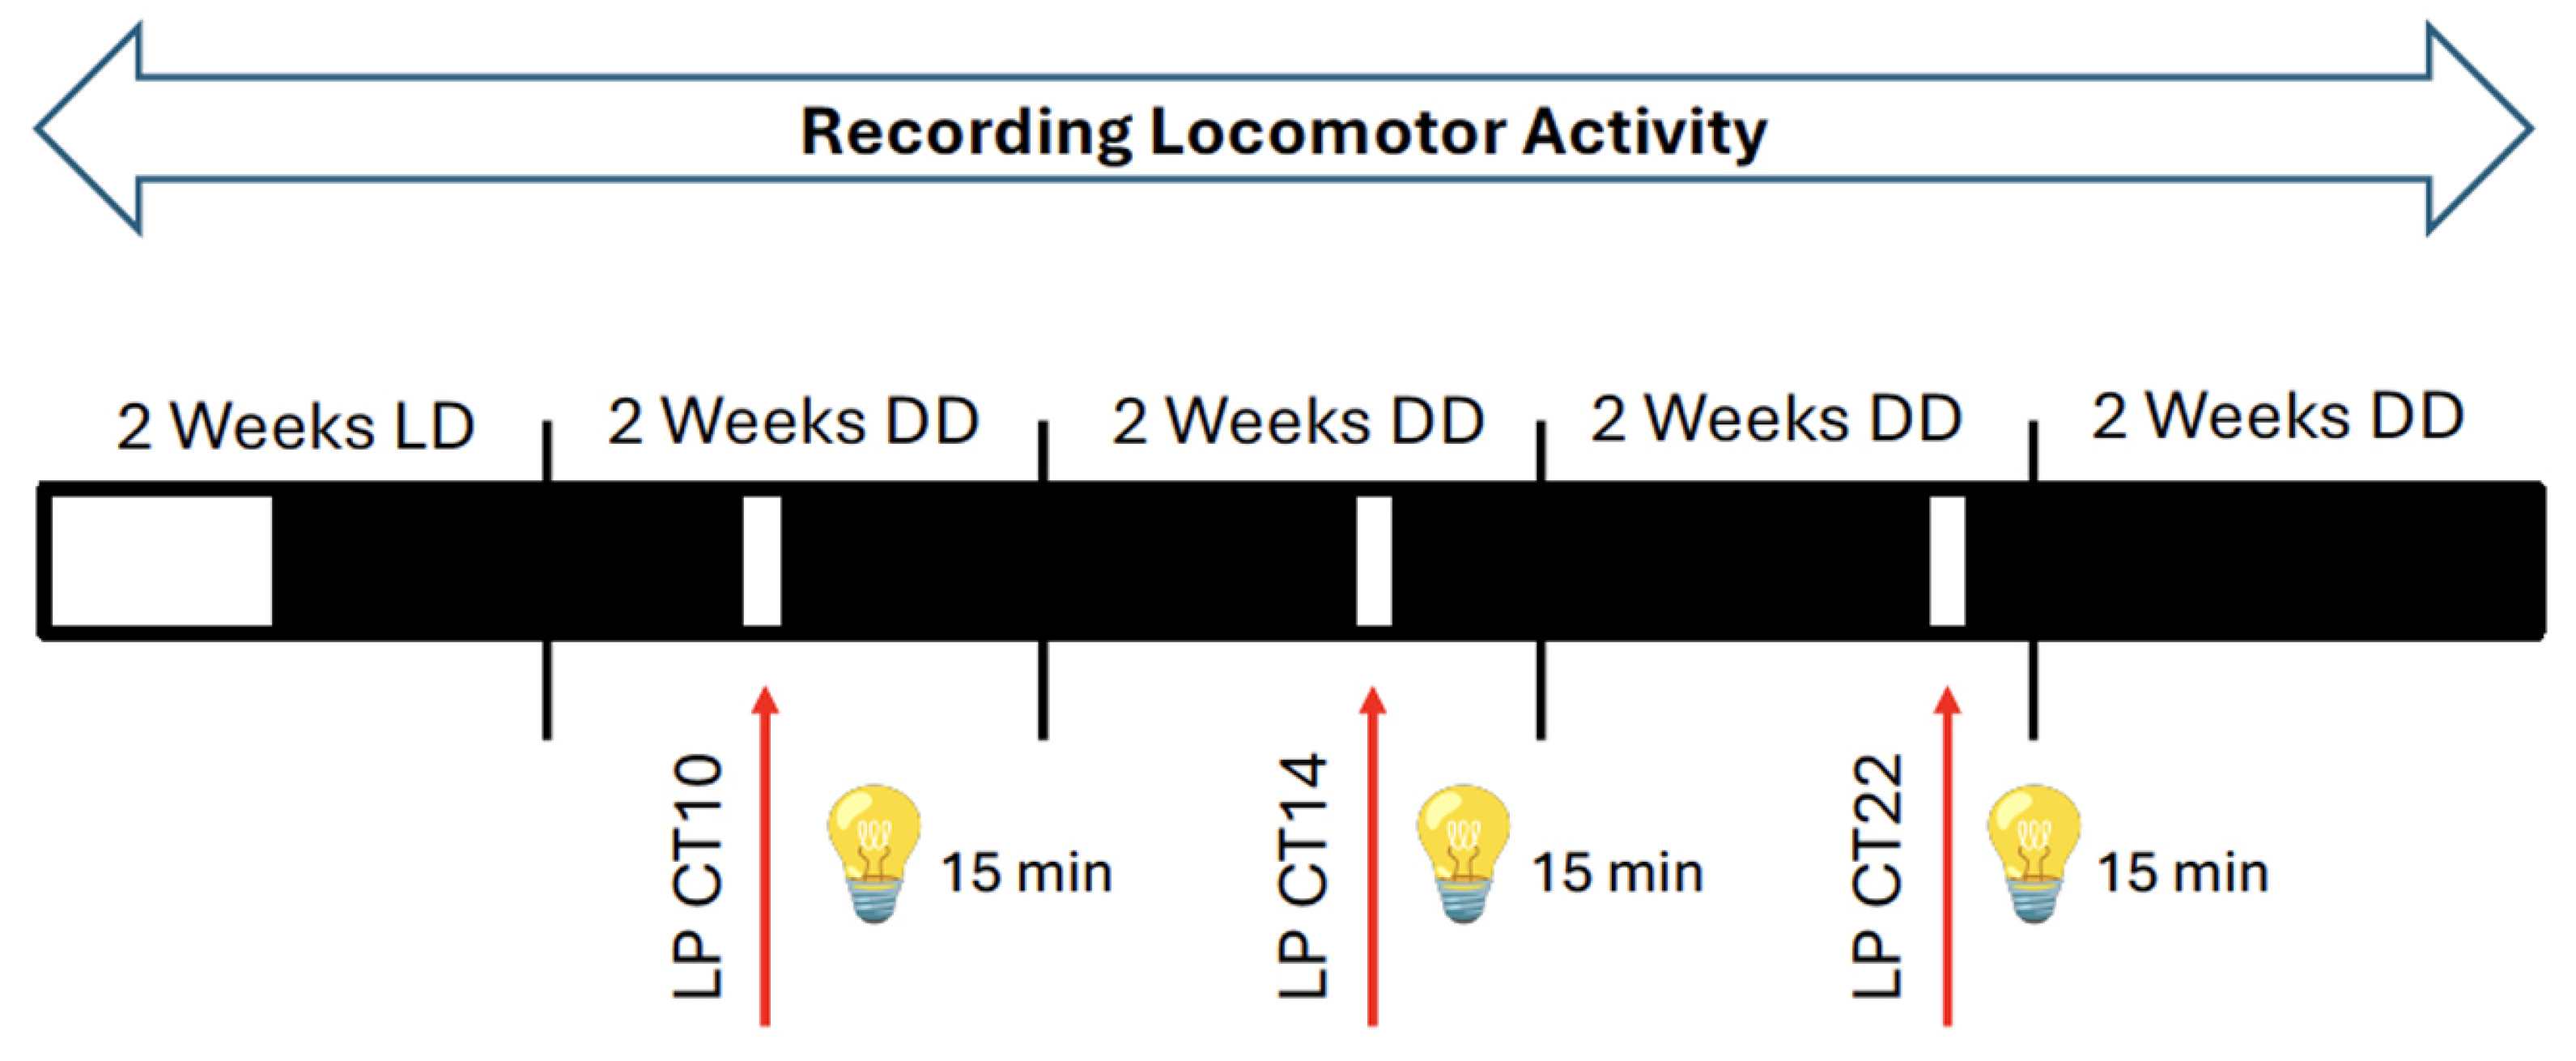
Figure 3.
Wheel-running activity and effect of light pulses on control and cell type specific Per1 knock-out mice under constant darkness (DD) conditions (Aschoff type I protocol). (A) Representative actograms of wheel-running activity of neuronal control (NCo), neuronal Per1 knock-out (Per1NKo), glial control (GCo) and glial Per1 knock-out (Per1GKo) animals. A 15-minute light pulse (LP) was applied at circadian time (CT) 10, 14, and 22 (yellow asterisk). The blue lines indicate onset of wheel-running activity before the LP and the red lines onset of activity after the LP. (B) Quantification of the distances between the blue and red lines in A representing the amount of phase shift in minutes after an LP at CT10 (left panel), CT14 (middle panel) and CT22 (right panel). Data are represented as mean ± SEM with n = 10 for wt (light blue), GCo (red), Per1GKo (pink) and n = 20 for NCo (green) and n = 16 for Per1NKo (orange). A diminished phase advance in Per1 NKo mice was observed in response to an LP at CT22 (*p < 0.05, unpaired t-test).
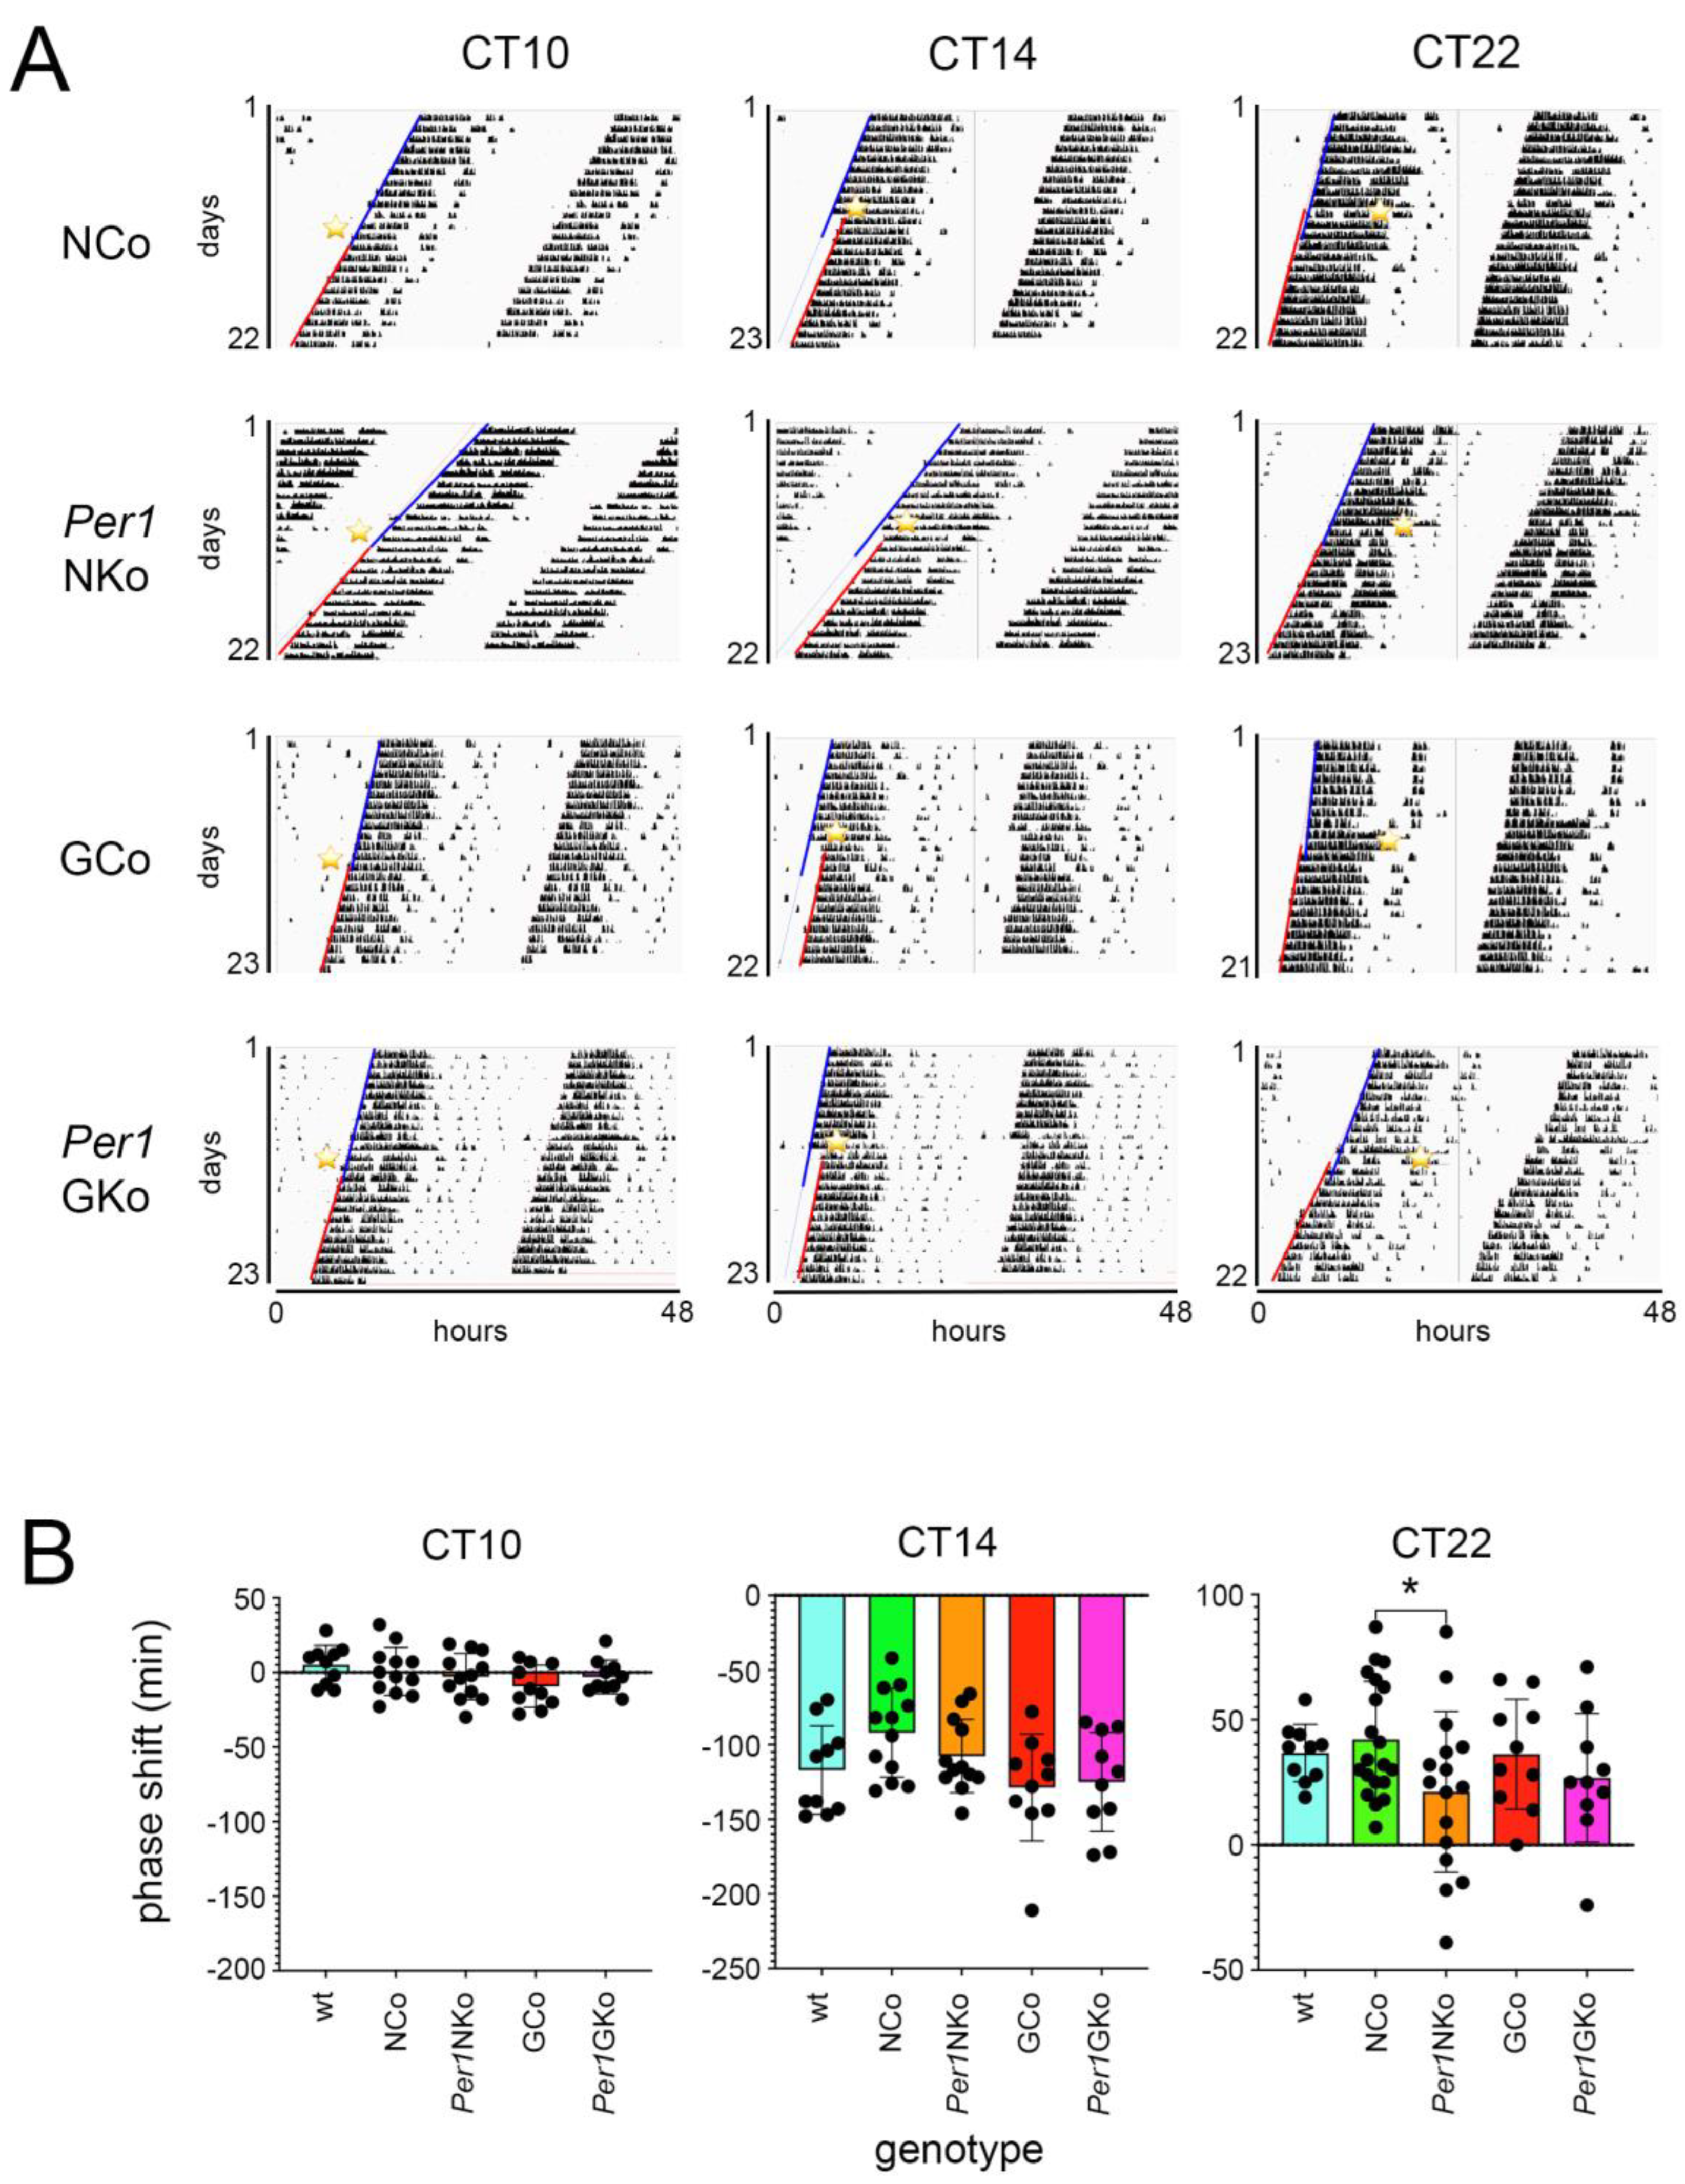
Figure 4.
Period length in control (wt, NCo, GCo) and Per1 knock-out animals (Per1NKo, Per1GKo) and effect of a light pulse (LP) on period. (A) Period before and after an LP at CT10 are similar in all genotypes investigated. Data are represented as mean ± SEM with n = 10-12. Period in Per1NKo mice (brown) before the LP is significantly shorter compared to NCo animals (dark green)(§§p < 0.01, n = 12, unpaired t-test). (B) Period before and after an LP at CT14 are similar in all genotypes investigated, except for Per1GKo mice which show a significantly shortened period after the LP (*p < 0.05, n = 10, Wilcoxon matched-pairs test). Data are represented as mean ± SEM with n = 10-12. Period in Per1NKo mice (brown) before the LP is significantly shorter compared to NCo animals (dark green)(§p < 0.05, n = 12, unpaired t-test). (C) Period before and after an LP at CT22 are significantly different in all genotypes investigated (**p < 0.01, n = 10 for wt, GCo, Per1GKo; ****p < 0.0001, n = 20 for NCo and 16 for Per1NKo, Wilcoxon matched-pairs test). Data are represented as mean ± SEM. Period in Per1NKo mice (brown) before the LP is significantly shorter compared to NCo animals (dark green)(§§p < 0.01, n = 16-20, unpaired t-test). Also after an LP at CT22 period in Per1NKo mice (orange) is significantly shorter compared to NCo animals (green)(°°°p < 0.001, n = 16-20, unpaired t-test).
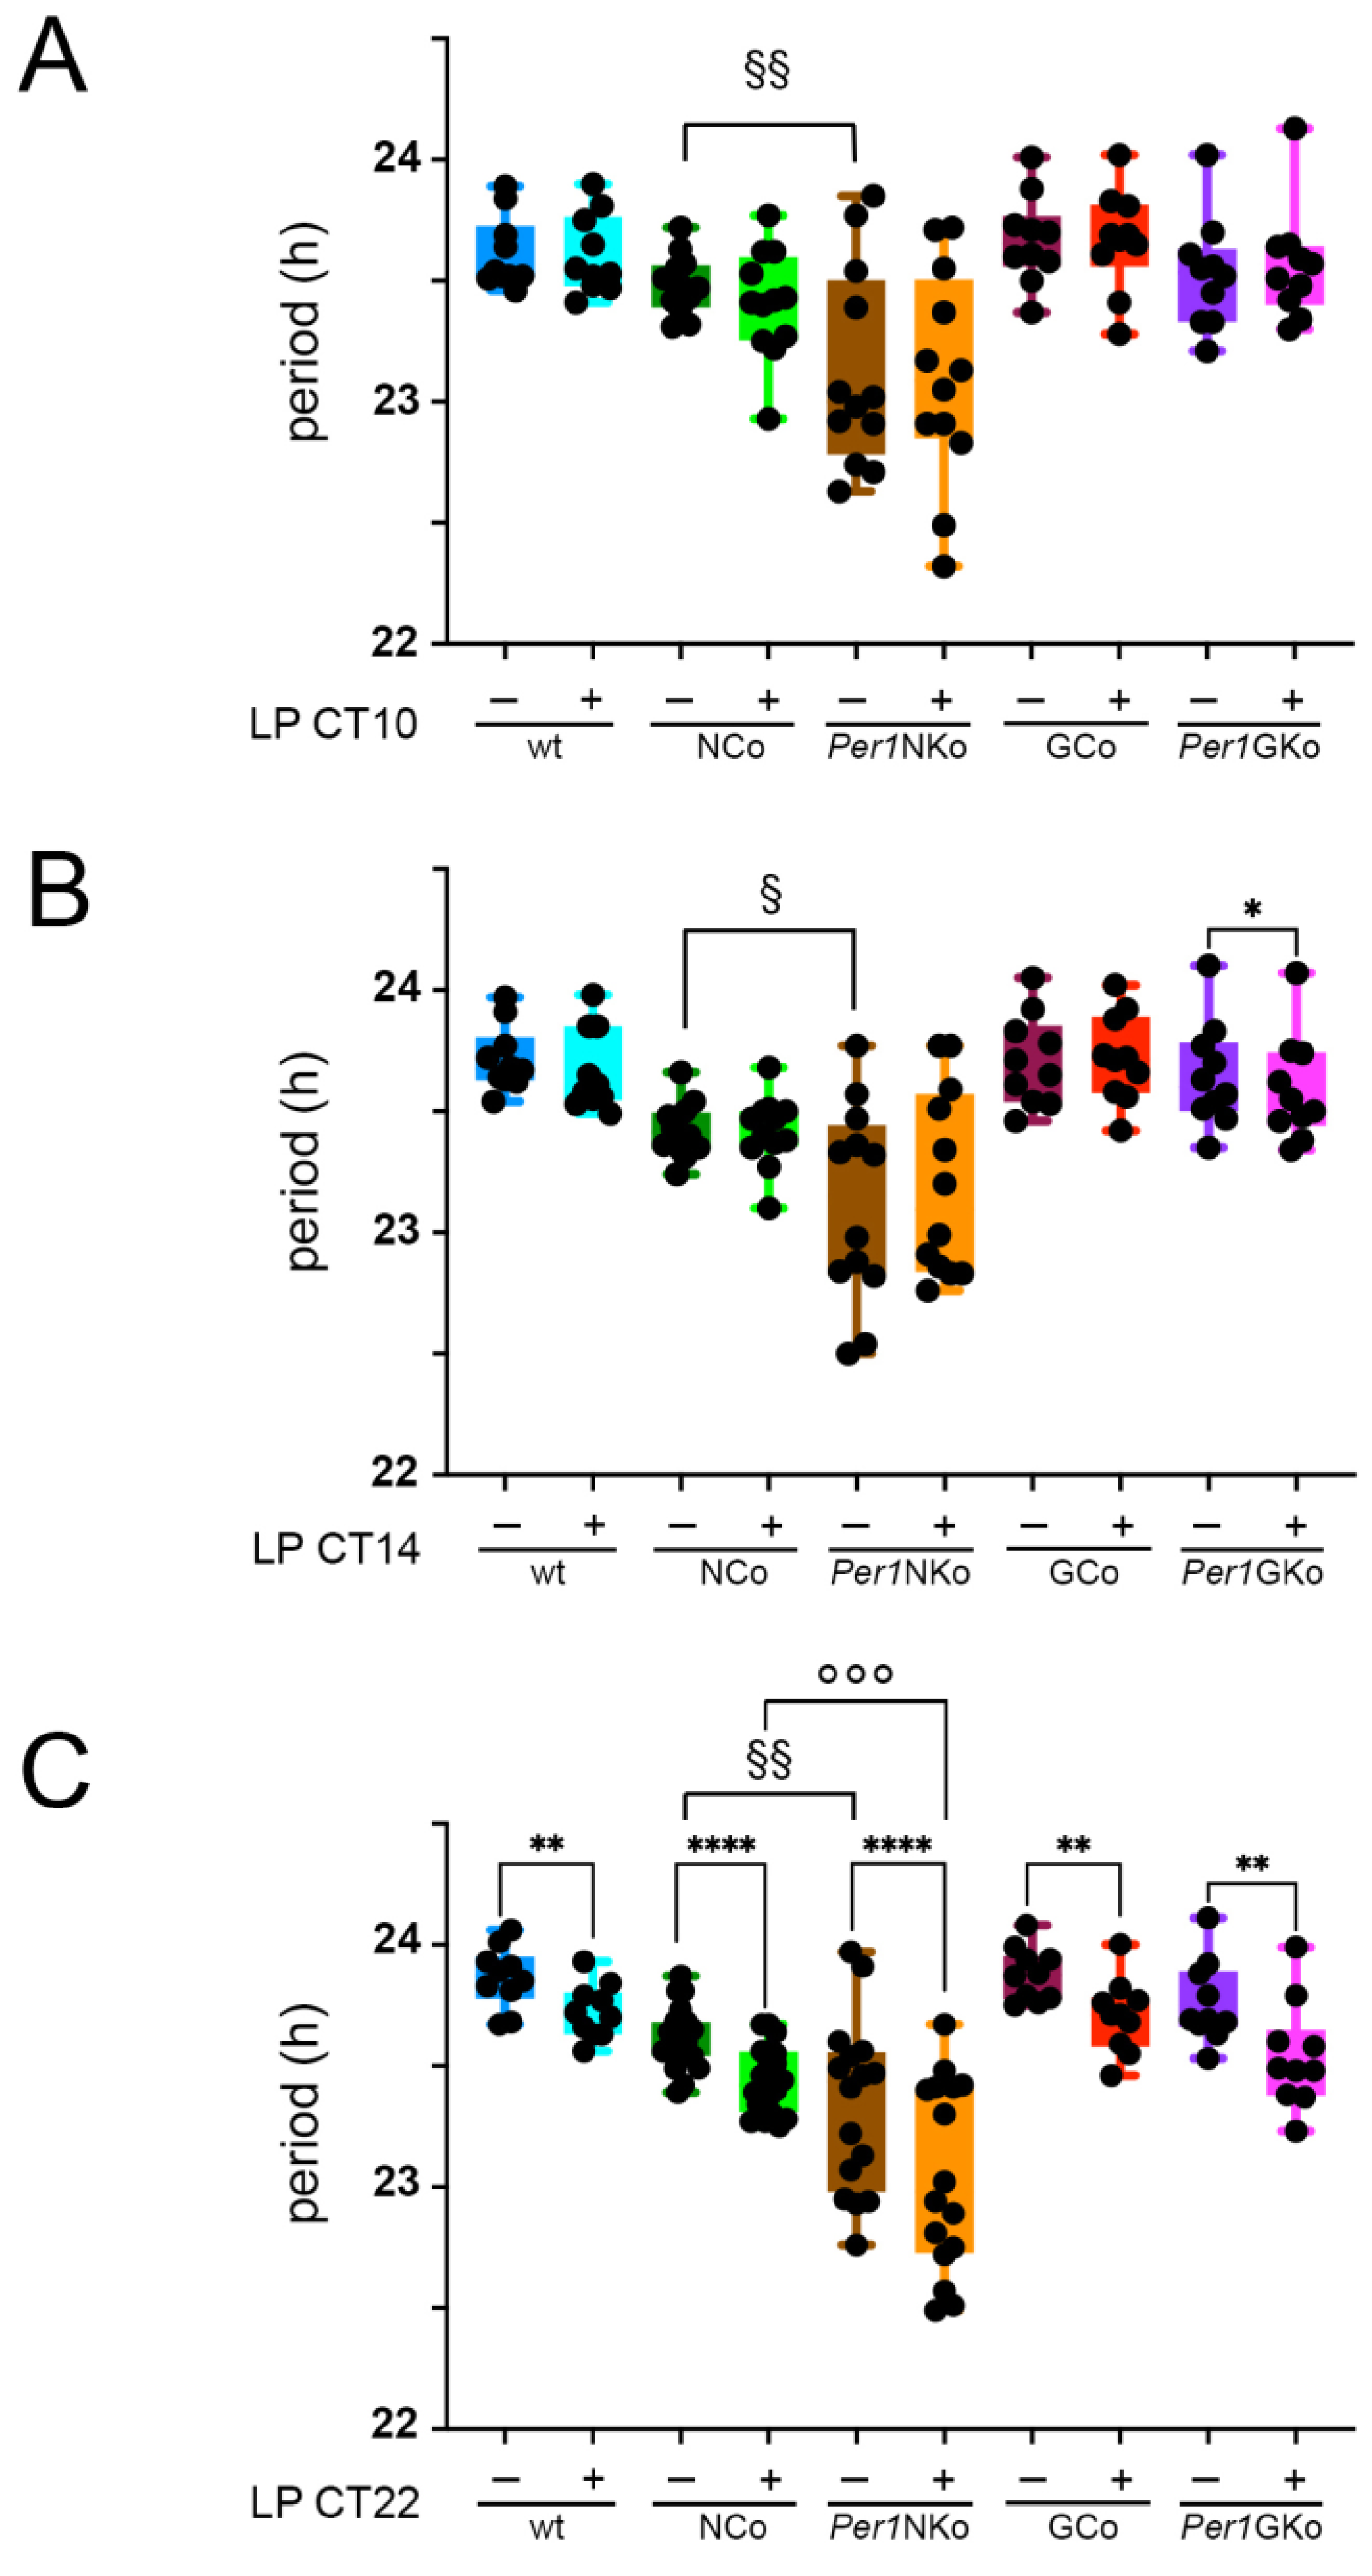
Figure 5.
Amplitude in control (wt, NCo, GCo) and Per1 knock-out animals (Per1NKo, Per1GKo) and effect of a light pulse (LP) on amplitude. (A) Amplitude before and after an LP at CT10 is similar in all genotypes investigated. Data are represented as mean ± SEM with n = 10-12. Amplitude in Per1NKo mice before (brown) and after (orange) the LP is significantly lower compared to NCo animals (green)(*p < 0.05, **p < 0.01, ***p < 0.001, n = 12, one-way ANOVA). (B) Amplitude before and after an LP at CT14 is similar in all genotypes investigated. Data are represented as mean ± SEM with n = 10-12. Amplitude in Per1NKo mice before (brown) and after (orange) the LP is significantly lower compared to NCo animals (green)(*p < 0.05, **p < 0.01, n = 12, one-way ANOVA). (C) Amplitude before and after an LP at CT22 is similar in all genotypes investigated. Data are represented as mean ± SEM with n = 10-12. Amplitude in Per1NKo mice before (brown) and after (orange) the LP is significantly lower compared to NCo animals (green)(**p < 0.01, ***p < 0.001, n = 12, one-way ANOVA).
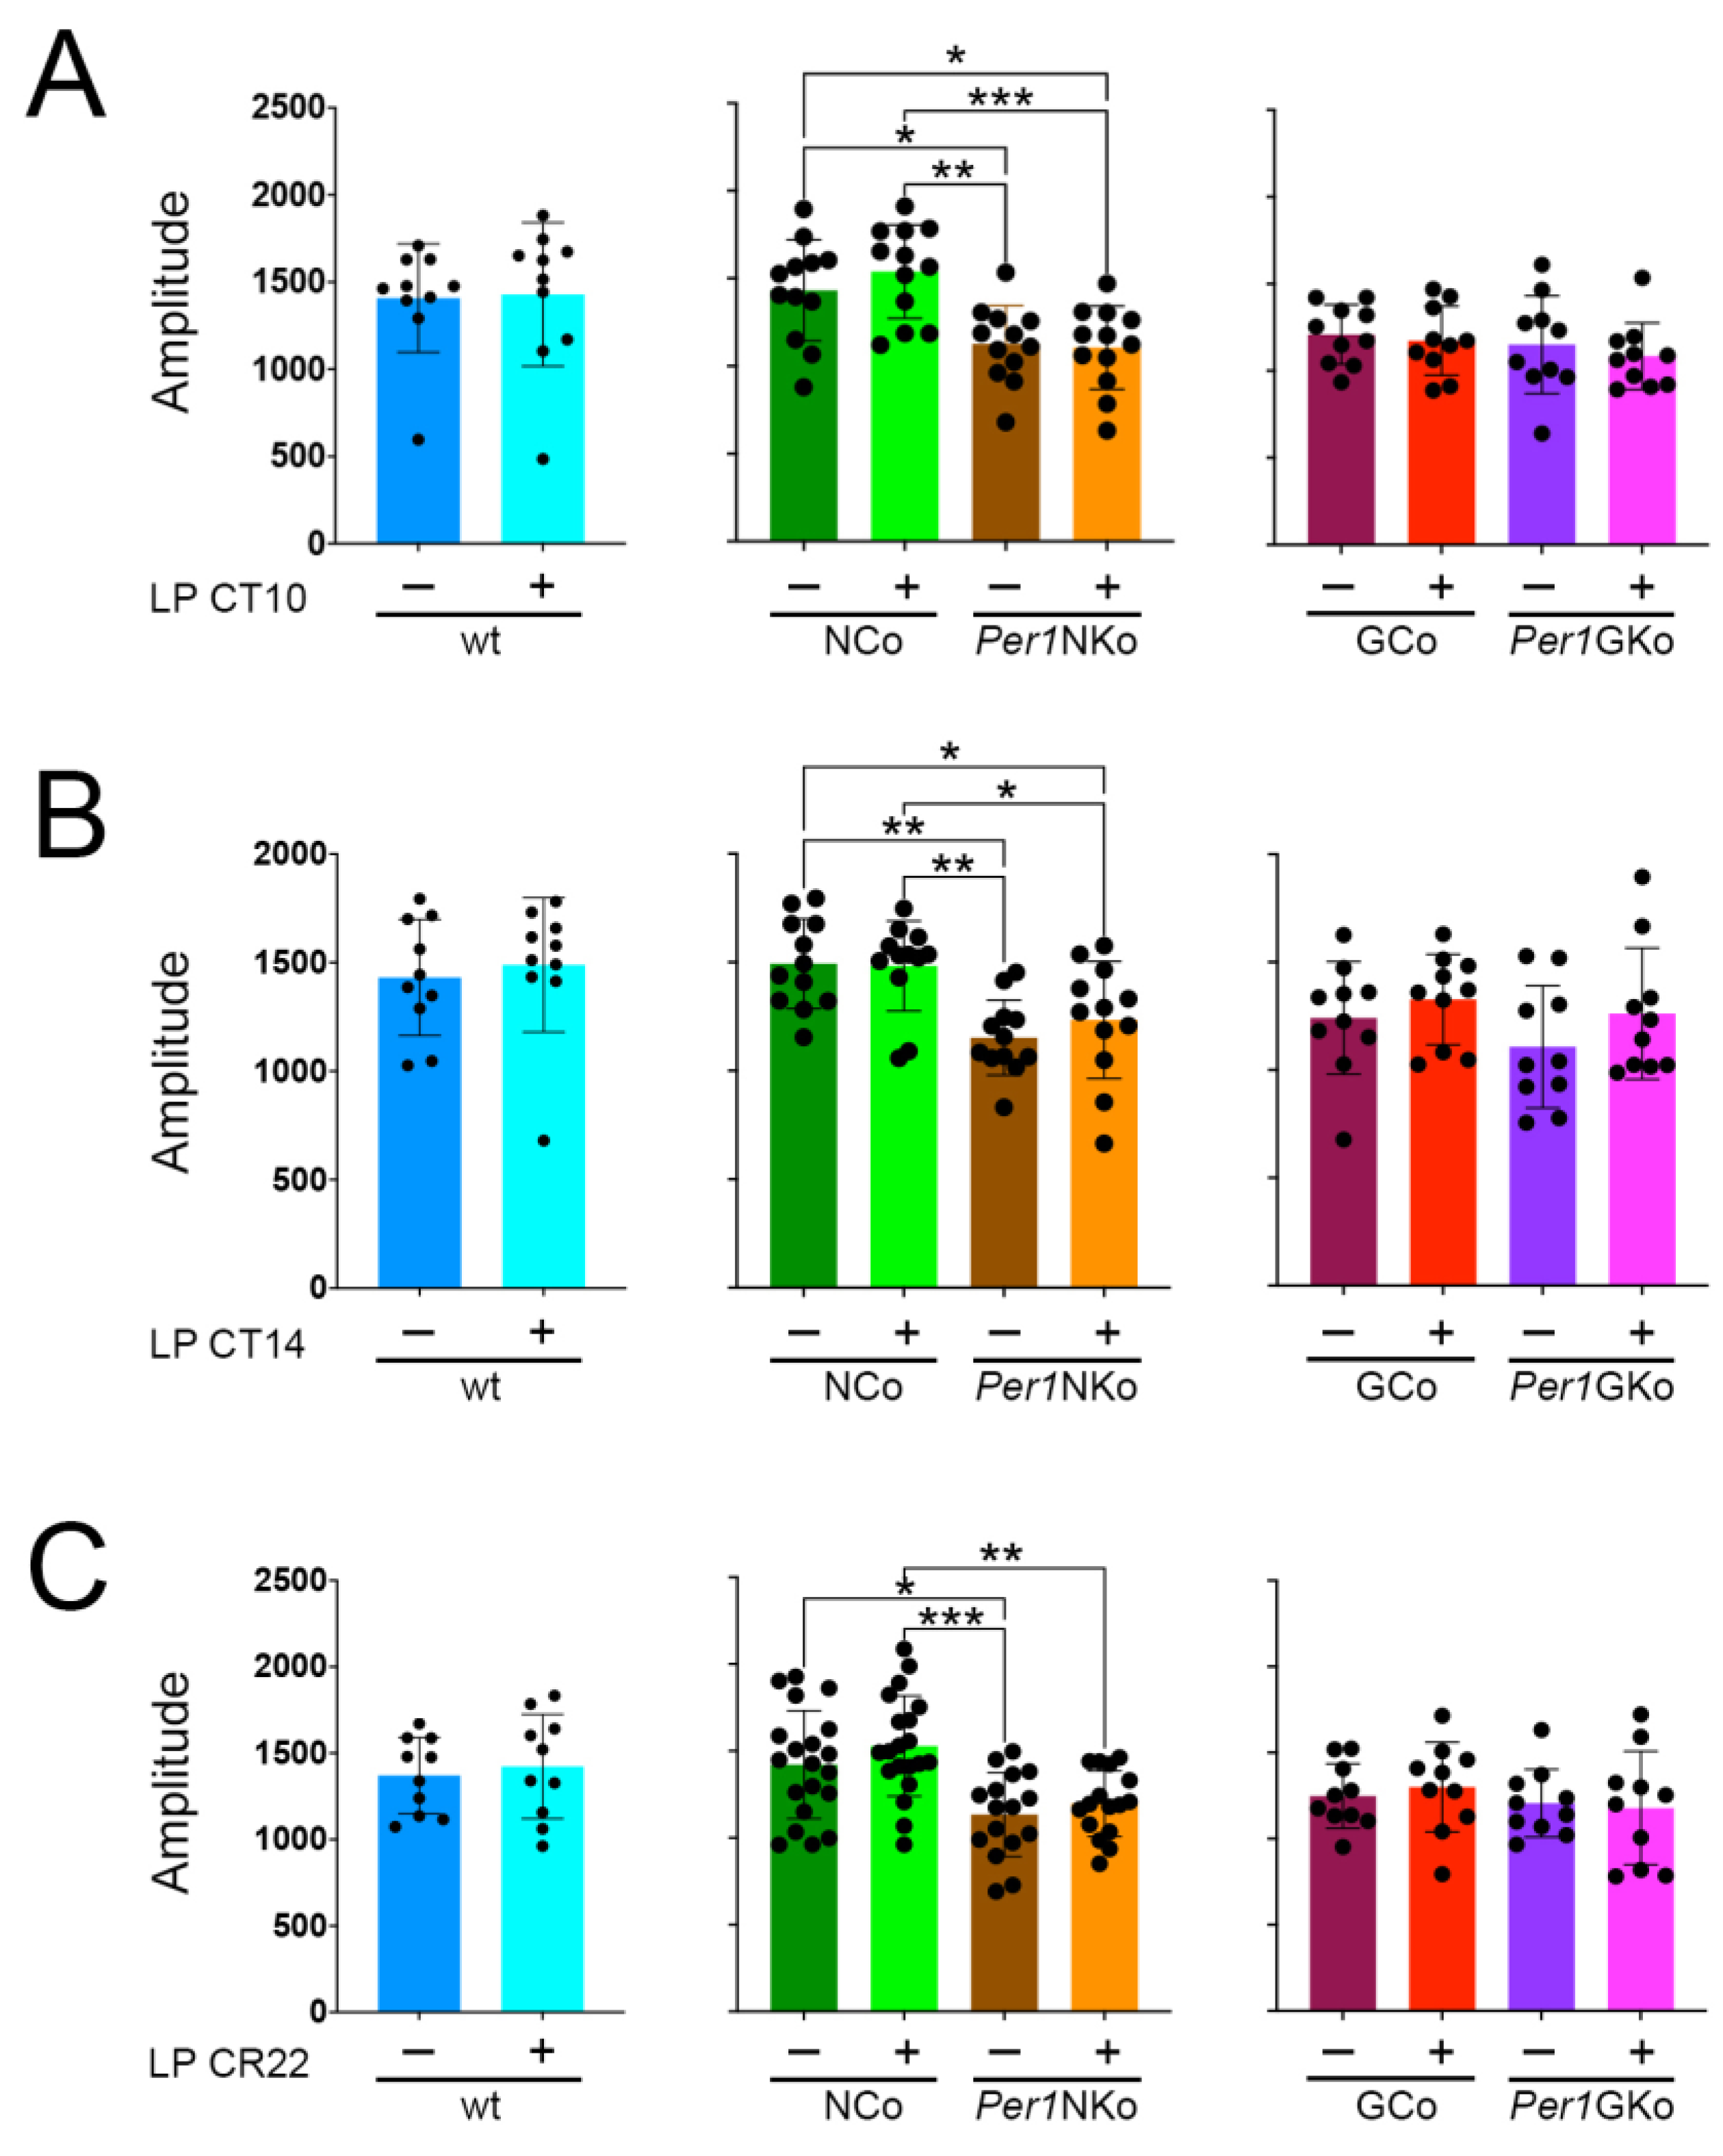
Figure 6.
Relative power of phase in control (wt, NCo, GCo) and Per1 knock-out animals (Per1NKo, Per1GKo) and effect of a light pulse (LP) on relative power of phase. (A) Relative power of phase before and after an LP at CT10 is similar in all genotypes investigated. Data are represented as mean ± SEM with n = 10-12. Relative power of phase in Per1NKo mice before (brown) and after (orange) the LP is significantly lower compared to NCo animals (green)( ****p < 0.0001, n = 12, one-way ANOVA). (B) Relative power of phase before and after an LP at CT14 is similar in all genotypes investigated. Data are represented as mean ± SEM with n = 10-12. Relative power of phase in Per1NKo mice before (brown) and after (orange) the LP is significantly lower compared to NCo animals (green)(****p < 0.0001, n = 12, one-way ANOVA). (C) Relative power of phase before and after an LP at CT22 is similar in all genotypes investigated. Data are represented as mean ± SEM with n = 10-12. Relative power of phase in Per1NKo mice before (brown) and after (orange) the LP is significantly lower compared to NCo animals (green)(***p < 0.001, ****p < 0.0001, n = 12, one-way ANOVA). Relative power of phase in Per1GKo (magenta) is lower compared to GCo animals (red) after an LP at CT22 (*p < 0.05, n = 10, one-way ANOVA).
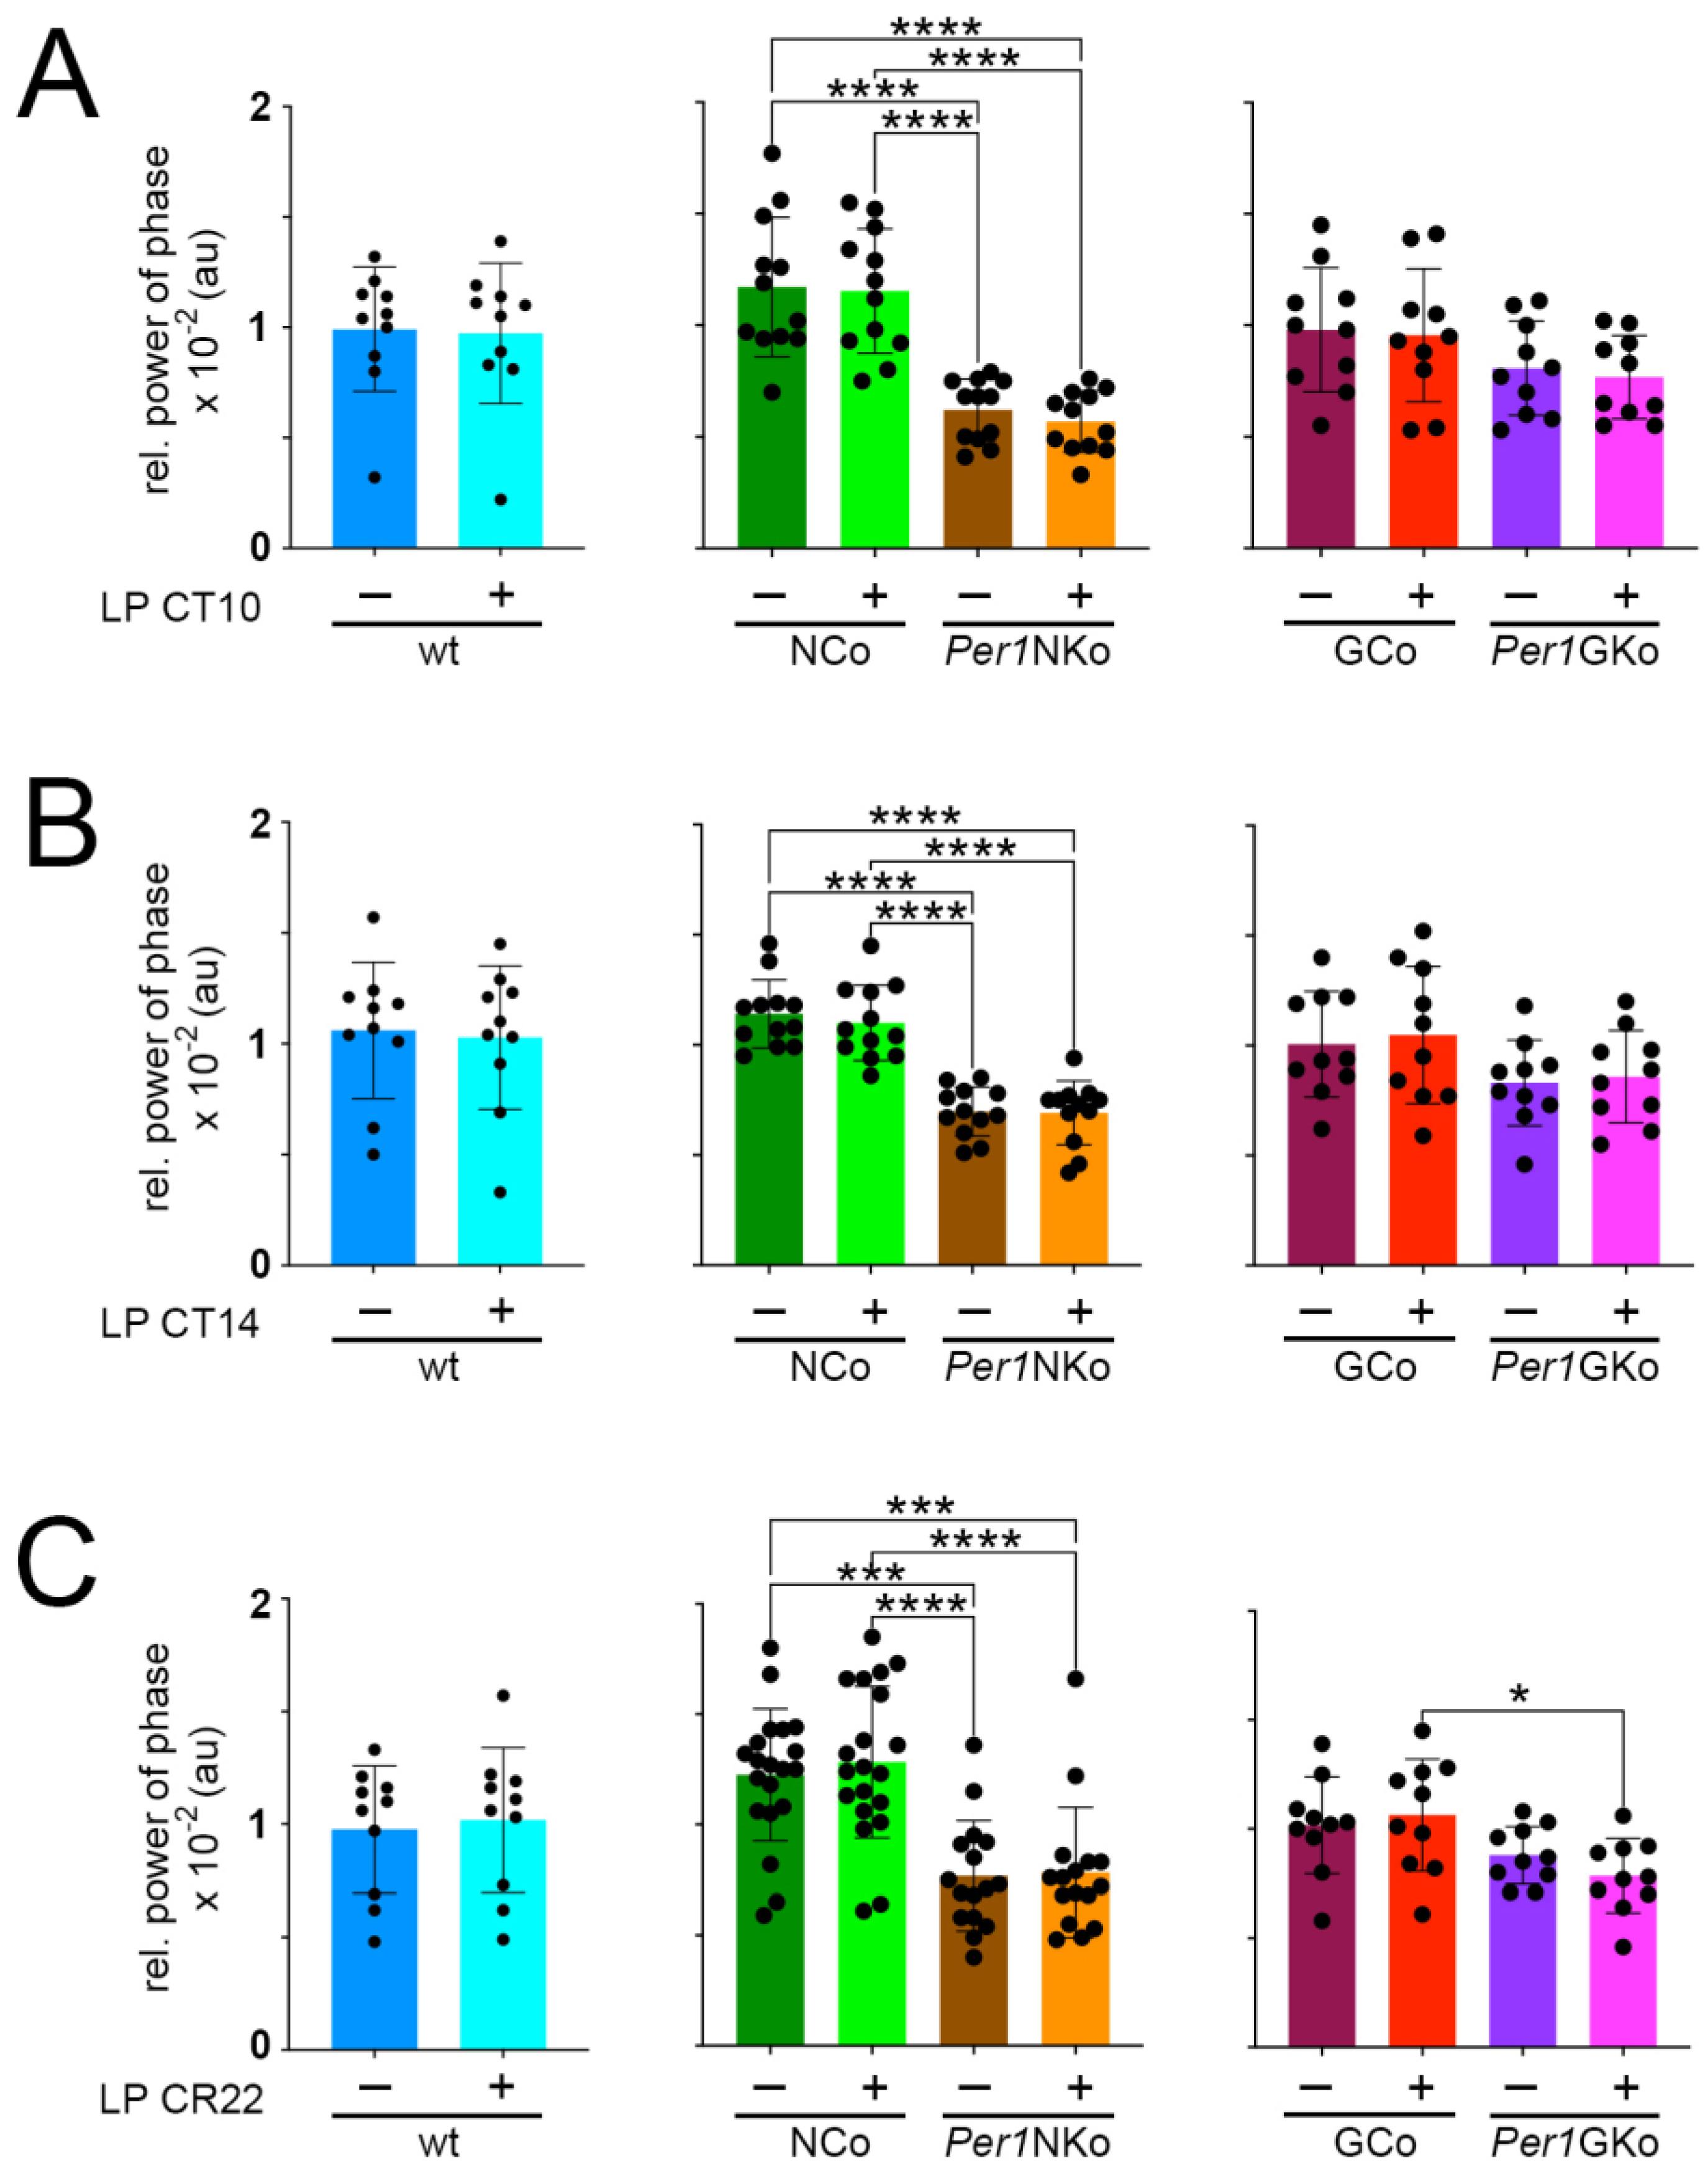
Figure 7.
Total wheel-running activity in control (wt, NCo, GCo) and Per1 knock-out animals (Per1NKo, Per1GKo) and effect of a light pulse (LP) on wheel-running activity. (A) Wheel revolutions per day before and after an LP at CT10 are similar in all genotypes investigated. Data are represented as mean ± SEM with n = 10-12. (B) Wheel revolutions per day before and after an LP at CT14 are similar in all genotypes investigated. Data are represented as mean ± SEM with n = 10-12. (C) Wheel revolutions per day before and after an LP at CT22 are similar in all genotypes investigated. Data are represented as mean ± SEM with n = 10-12.
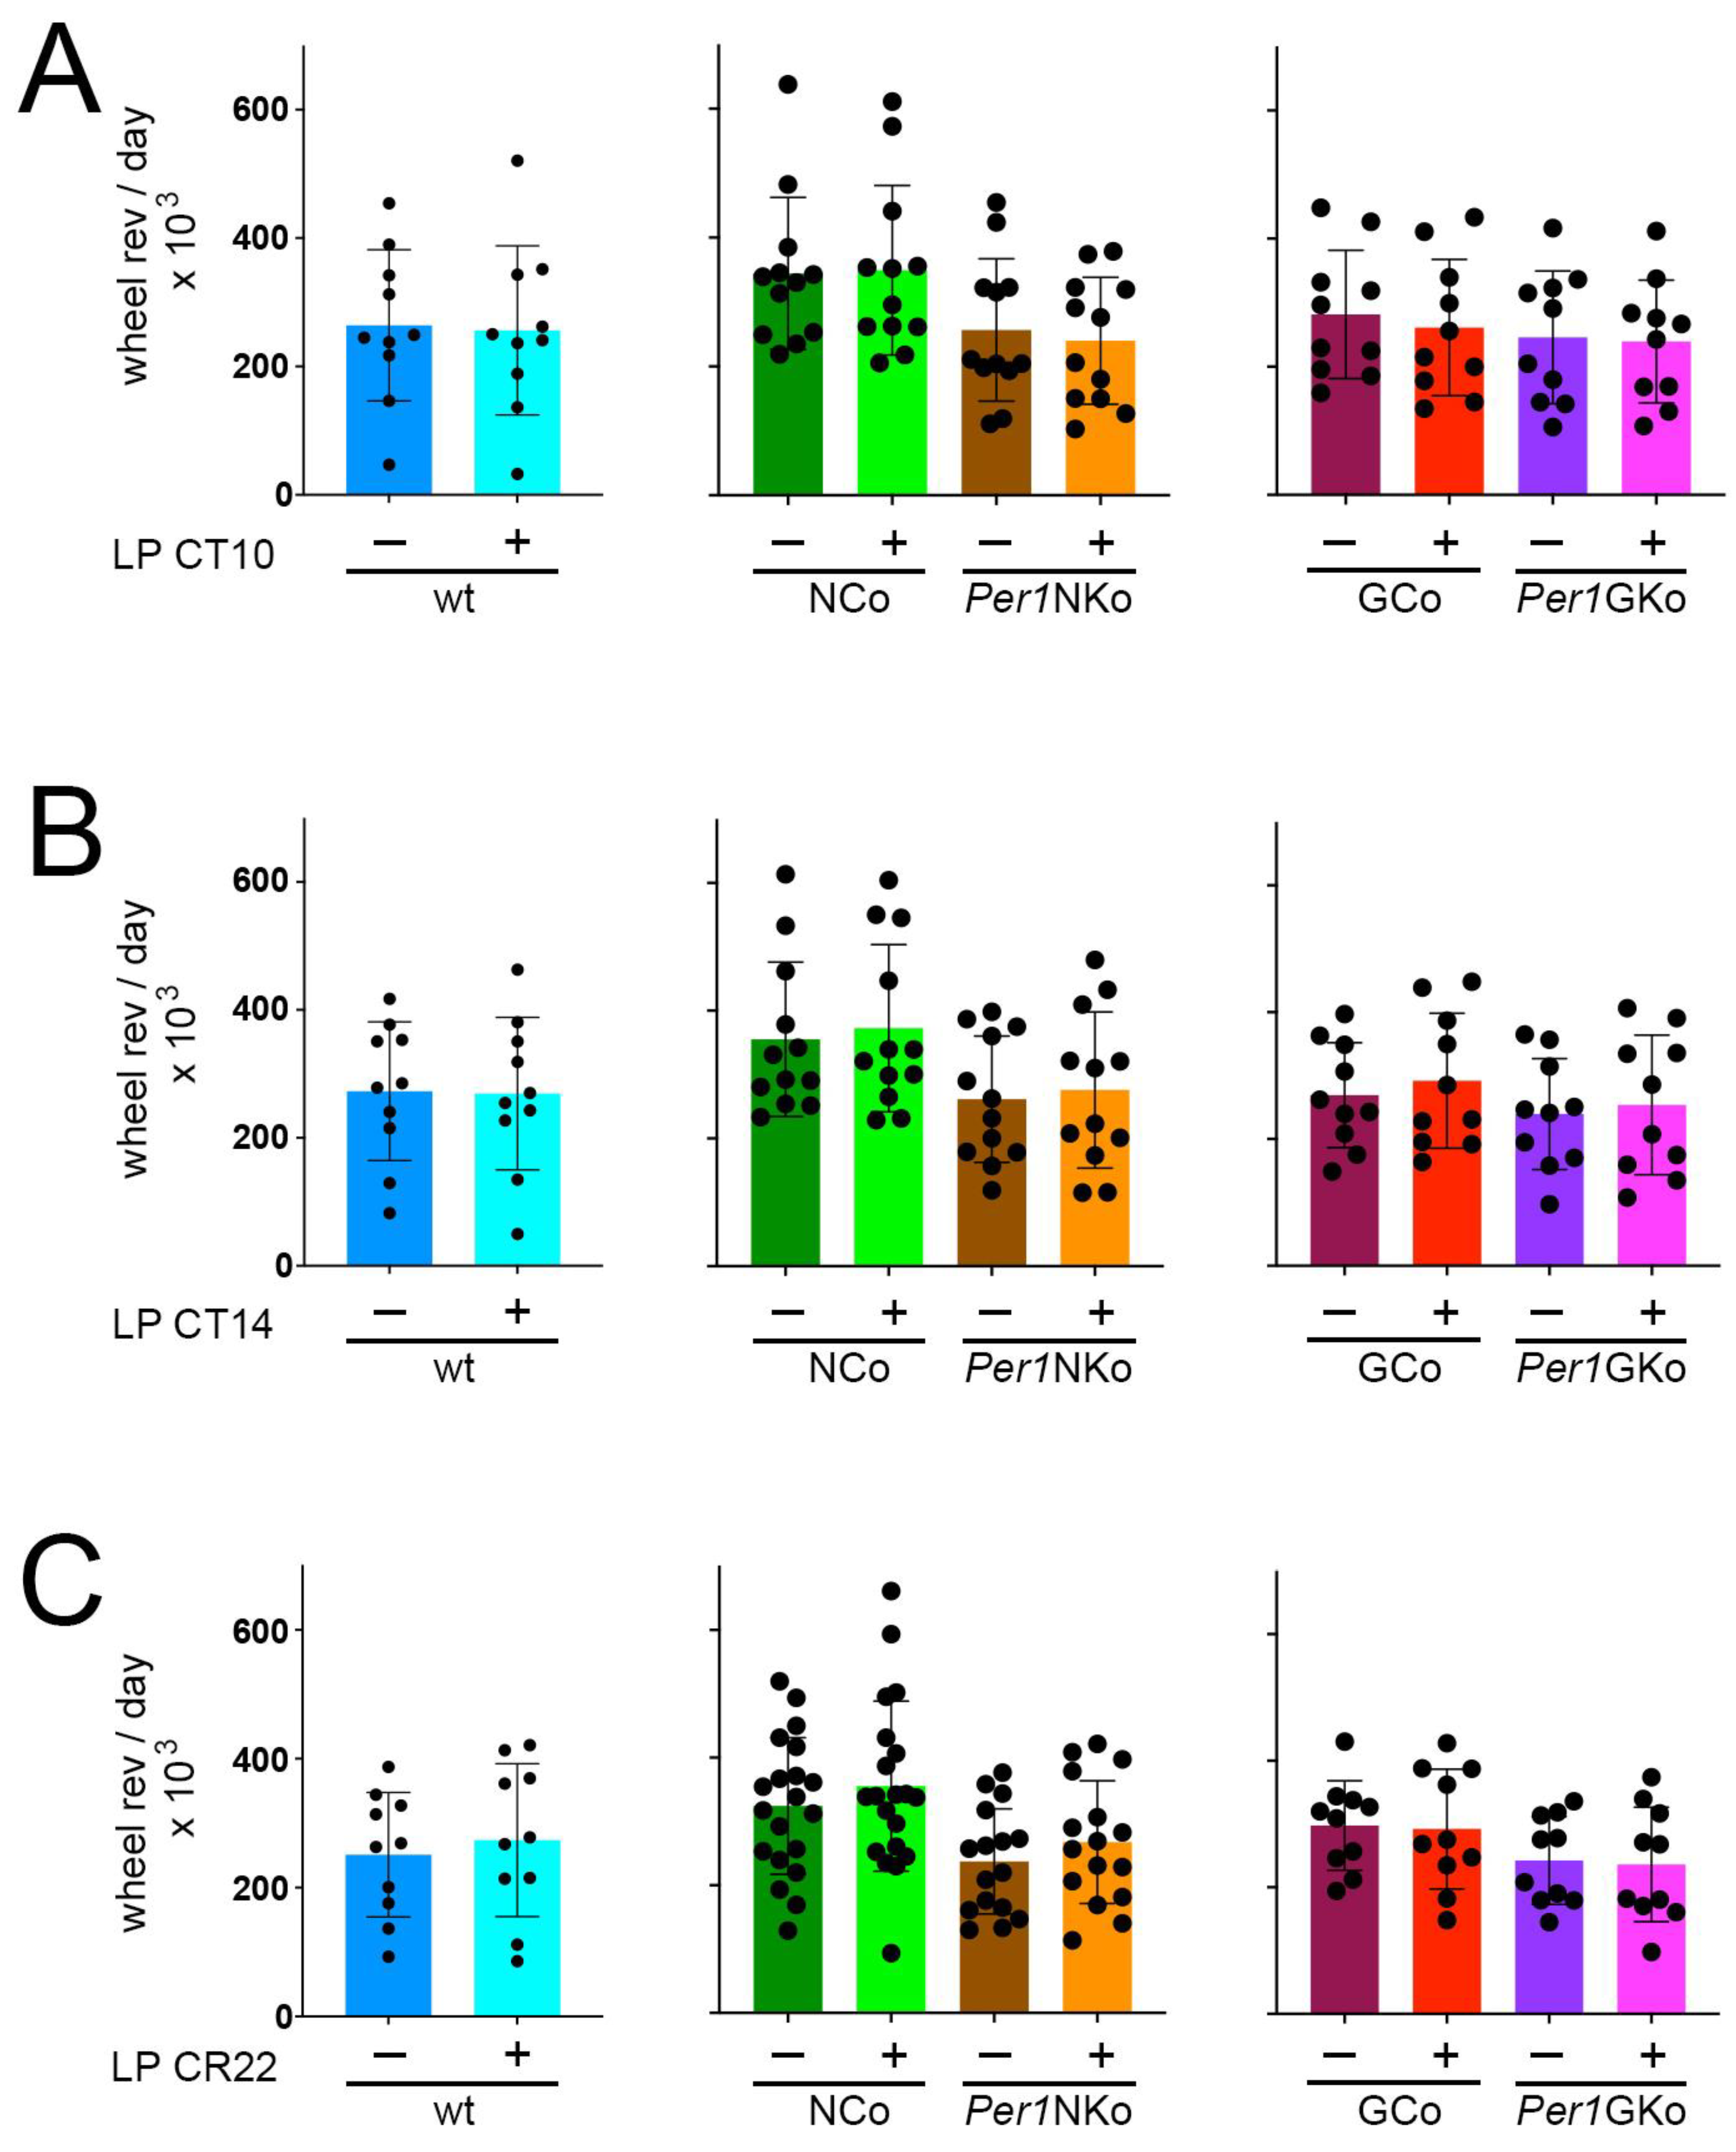
Table 1.
Antibodies used for immunohistochemistry.
| Antibody | Species | Company | Catalog number | Lot Number | Dilution |
|---|---|---|---|---|---|
| Anti-mPER1 (residues 6-21) |
Rabbit | Merck Millipore | AB2201 | 3480987 | 1:8000 |
| Anti-GFAP | Goat | Abcam | AB53554 | 1046529-1 | 1:1000 |
| Anti-NeuN | Chicken | Merck Millipore | ABN91 | 4049831 | 1:2000 |
| Alexa Fluor 647- AffiniPure Donkey Anti-Chicken IgG (H+L) | Donkey | Jackson Immunoresearch | 703-605-155 | 134612 | 1:1000 |
| Alexa Fluor 568 Donkey Anti-Goat IgG (H+L) | Donkey | Abcam | Ab175704 | GR3278446-1 | 1:1000 |
| Alexa Fluor 488-AffiniPure Donkey Anti-Rabbit IgG (H+L) | Donkey | Jackson Immunoresearch | 711-545-152 | 132876 | 1:1000 |
Disclaimer/Publisher’s Note: The statements, opinions and data contained in all publications are solely those of the individual author(s) and contributor(s) and not of MDPI and/or the editor(s). MDPI and/or the editor(s) disclaim responsibility for any injury to people or property resulting from any ideas, methods, instructions or products referred to in the content. |
© 2025 by the authors. Licensee MDPI, Basel, Switzerland. This article is an open access article distributed under the terms and conditions of the Creative Commons Attribution (CC BY) license (http://creativecommons.org/licenses/by/4.0/).
Copyright: This open access article is published under a Creative Commons CC BY 4.0 license, which permit the free download, distribution, and reuse, provided that the author and preprint are cited in any reuse.


