Submitted:
15 October 2025
Posted:
15 October 2025
You are already at the latest version
Abstract
In response to the demand for high-density urban renewal and quality enhancement, the microclimate of street canyon spaces has become a critical factor influencing pedestrian experience and public space vitality. As key nodes connecting above-ground and underground spaces, the entrances and exits of underground commercial streets are particularly sensitive to thermal, humidity, and wind conditions. This study examines a semi-open street canyon adjacent to Entrance No. 11 of the Jianjun Road Underground Commercial Street in Yancheng City as a case study. Through continuous field measurements and numerical simulations using ENVI-met v5.5.1, we conducted a comprehensive analysis. Five monitoring points were established at a height of 1.5 m to simultaneously record the air temperature, relative humidity, wind speed, and thermal radiation images. The results indicate that ventilation acceleration zones form near openings and channel constrictions, whereas leeward sides and corners are prone to stagnant airflow and heat accumulation. During afternoon periods with strong solar radiation and low wind speeds, the predicted mean vote (PMV) values near the entrance increase significantly. The simulation results are in good agreement with the field observations in terms of both the trend and spatial distribution. On the basis of these findings, optimization strategies are proposed, including controlling enclosure ratios and local height-to-width ratios, utilizing ventilation corridors and side openings to guide airflow, and incorporating shading devices and low-emissivity materials to improve pedestrian thermal comfort and accessibility.
Keywords:
street canyon
; microclimate simulation
; thermal comfort assessment
; morphological optimization
; urban morphology
1. Introduction
Urban street valleys are canyon-like spaces enclosed by buildings on both sides of continuous streets. As important objects of research on urban microclimates and air pollutant diffusion, their environmental quality directly affects pedestrians’ thermal comfort experience, health and safety, as well as building energy consumption. Especially in high-density urban built-up areas, the thermal and humid wind environment near the ground layer of street valleys is a key link connecting individual thermal perception with the vitality of public spaces, and they are also important factors in intensifying or alleviating the urban heat island effect [1,2,3]. Empirical and numerical evidence has shown that in a humid and hot climate or hot summer and cold winter climate, the superposition of high radiation and low wind speed in the afternoon significantly increases the probability of heat stress and discomfort for pedestrians, thus affecting their walking behavior and patterns of staying indoors [4,5,6]. Flow and radiation exchanges at the street valley scale are also coupled with the dilution and diffusion of near-surface pollutants, the stability of the road boundary layer, and the intensity of heat islands [7,8,9,10]. Depicting the spatiotemporal evolution and mechanism of action of street valley microclimates from the perspective of pedestrian height has become an important scientific issue in urban renewal and the improvement of street quality. From the perspective of the interactive relationship between climate response and spatial form, the formation mechanism of street valley microclimates involves the coupled effects of multiple factors. Geometric morphological parameters such as the aspect ratio (H/W), orientation, and interface continuity determine the solar radiation reception, shadow distribution, and air flow structure [11,12]. Studies have shown that east‒west street valleys are prone to significant temperature differences due to asymmetric solar radiation, with the west wall surface often becoming a high-temperature heat source on summer afternoons. However, semi-open street valleys, with openings at one or both ends, can introduce natural ventilation and light while maintaining a sense of enclosure. Their microclimate characteristics lie between those of closed street valleys and open spaces, making them more suitable for the demands of contemporary urban functional integration and quality improvement [13,16].
In recent years, with the advancement of sensor technology and numerical simulation methods, research on street valley microclimates has gradually shifted from macroclimate analysis to the exploration of environmental perception and response mechanisms at the pedestrian scale (1.5 meters in height) [17,18,19]. Tools such as ENVI-met and CFD have been widely used to simulate the distributions of temperature, humidity and wind and thermal comfort indicators in street valleys. These studies reveal that in hot summer and cold winter or hot and humid climate zones, the superposition of high solar radiation and low wind speed in the afternoon significantly increases the probability of heat stress for pedestrians, affecting their walking and staying behaviors [20,21]. In addition, ecological intervention measures such as sunshade components, vertical greening, and tree array configuration have also been found to effectively increase the mean radiant temperature (MRT) and wind environment, albeit their benefits are jointly constrained by local geometric, material, and meteorological conditions [22,23,24,25].
Semi-open street valleys usually refer to streets that are enclosed on both sides by buildings or parts of natural terrain, but have one or both ends open [26,27,28]. Although existing research provides a systematic understanding of the microclimate mechanisms of regular street valleys or open spaces, studies on composite functional nodes such as semi-open street valleys and underground commercial street entrances and exits are still relatively weak [29,30]. Owing to the coupled effects of geometric expansion and contraction, material thermal inertia, and underground and above-ground heat and moisture exchange, such spaces are prone to form a complex environment in the afternoon where ventilation acceleration zones, stagnant wind and heat accumulation zones, and local hot spots coexist [31,32,33]. As a transitional node connecting the above-ground and underground areas, the entrances and exits of underground commercial streets not only gather and disperse a large number of people but also their glass canopies, highly reflective materials and other components significantly change the local radiation balance and thermal comfort conditions [34,35,36,37]. At present, there remains a lack of continuous observational data based on pedestrian height, multivariable, and long-term series, as well as verification studies compared with numerical models on an hourly basis, thus limiting the scientific basis for the optimization design of such spatial environments [38].
Yancheng city, as a typical representative of the hot summer and cold winter climate zone in China, has significant changes in temperature and humidity in spring, providing ideal conditions for studying the dynamic response of microclimate [39,40]. This study focuses on the entrance and exit of the No. 11 underground commercial street on Jianjun Road and its adjacent semi-open street valley as the objects. This area integrates underground space with street valleys and exhibits the typical characteristics of multiple couplings, such as geometric expansion and contraction, material thermal inertia and air exchange. In particular, during the afternoon, it is prone to form a complex thermal environment where a “ventilation growth zone—stagnation zone—local hot spot” coexist [41,42]. Most of the existing studies focus on regular street valleys or open spaces and lack continuous observations of pedestrian height in such composite scenarios with multiple variables and long-term sequences, as well as model verification and mechanism analyses based on actual measurements [43,44,45]. Thermal comfort research indicates that PMV indicators are significantly influenced by factors such as temperature, clothing, and metabolic rate and that there are differences in sensitivity among different populations. Thermal discomfort can also trigger behavioral adaptations such as shortened stays and path changes [46,47]. Research combining actual measurements and simulations not only reveals local climate adaptation issues but also provides an empirical basis and design reference for the optimization of the thermal environment in urban renewal in similar climate zones [48,49,50,51].
On the basis of the above content, this paper examines the semi-open street valley adjacent to the entrance and exit of No. 11 of Jianjun Road Underground Commercial Street in Yancheng as the research object. Combined with field continuous monitoring and the simulation of ENVI-met software, the aims of this study are (1) to reveal the spatiotemporal differentiation characteristics and dominant mechanism of the thermal, humid and wind environments in the composite space; (2) to verify the reliability of the model in the simulation of the pedestrian height microclimate; and (3) to propose a thermal comfort optimization strategy based on morphological regulation and ecological intervention that provides a quantitative basis for the underground space and street-valley composite design in high-density urban renewal.
Figure 1.
Schematic diagram of the street valley. If there are multiple panels, they should be listed as: (a) Open street valley. (b) Semi-open street valley.
Figure 1.
Schematic diagram of the street valley. If there are multiple panels, they should be listed as: (a) Open street valley. (b) Semi-open street valley.
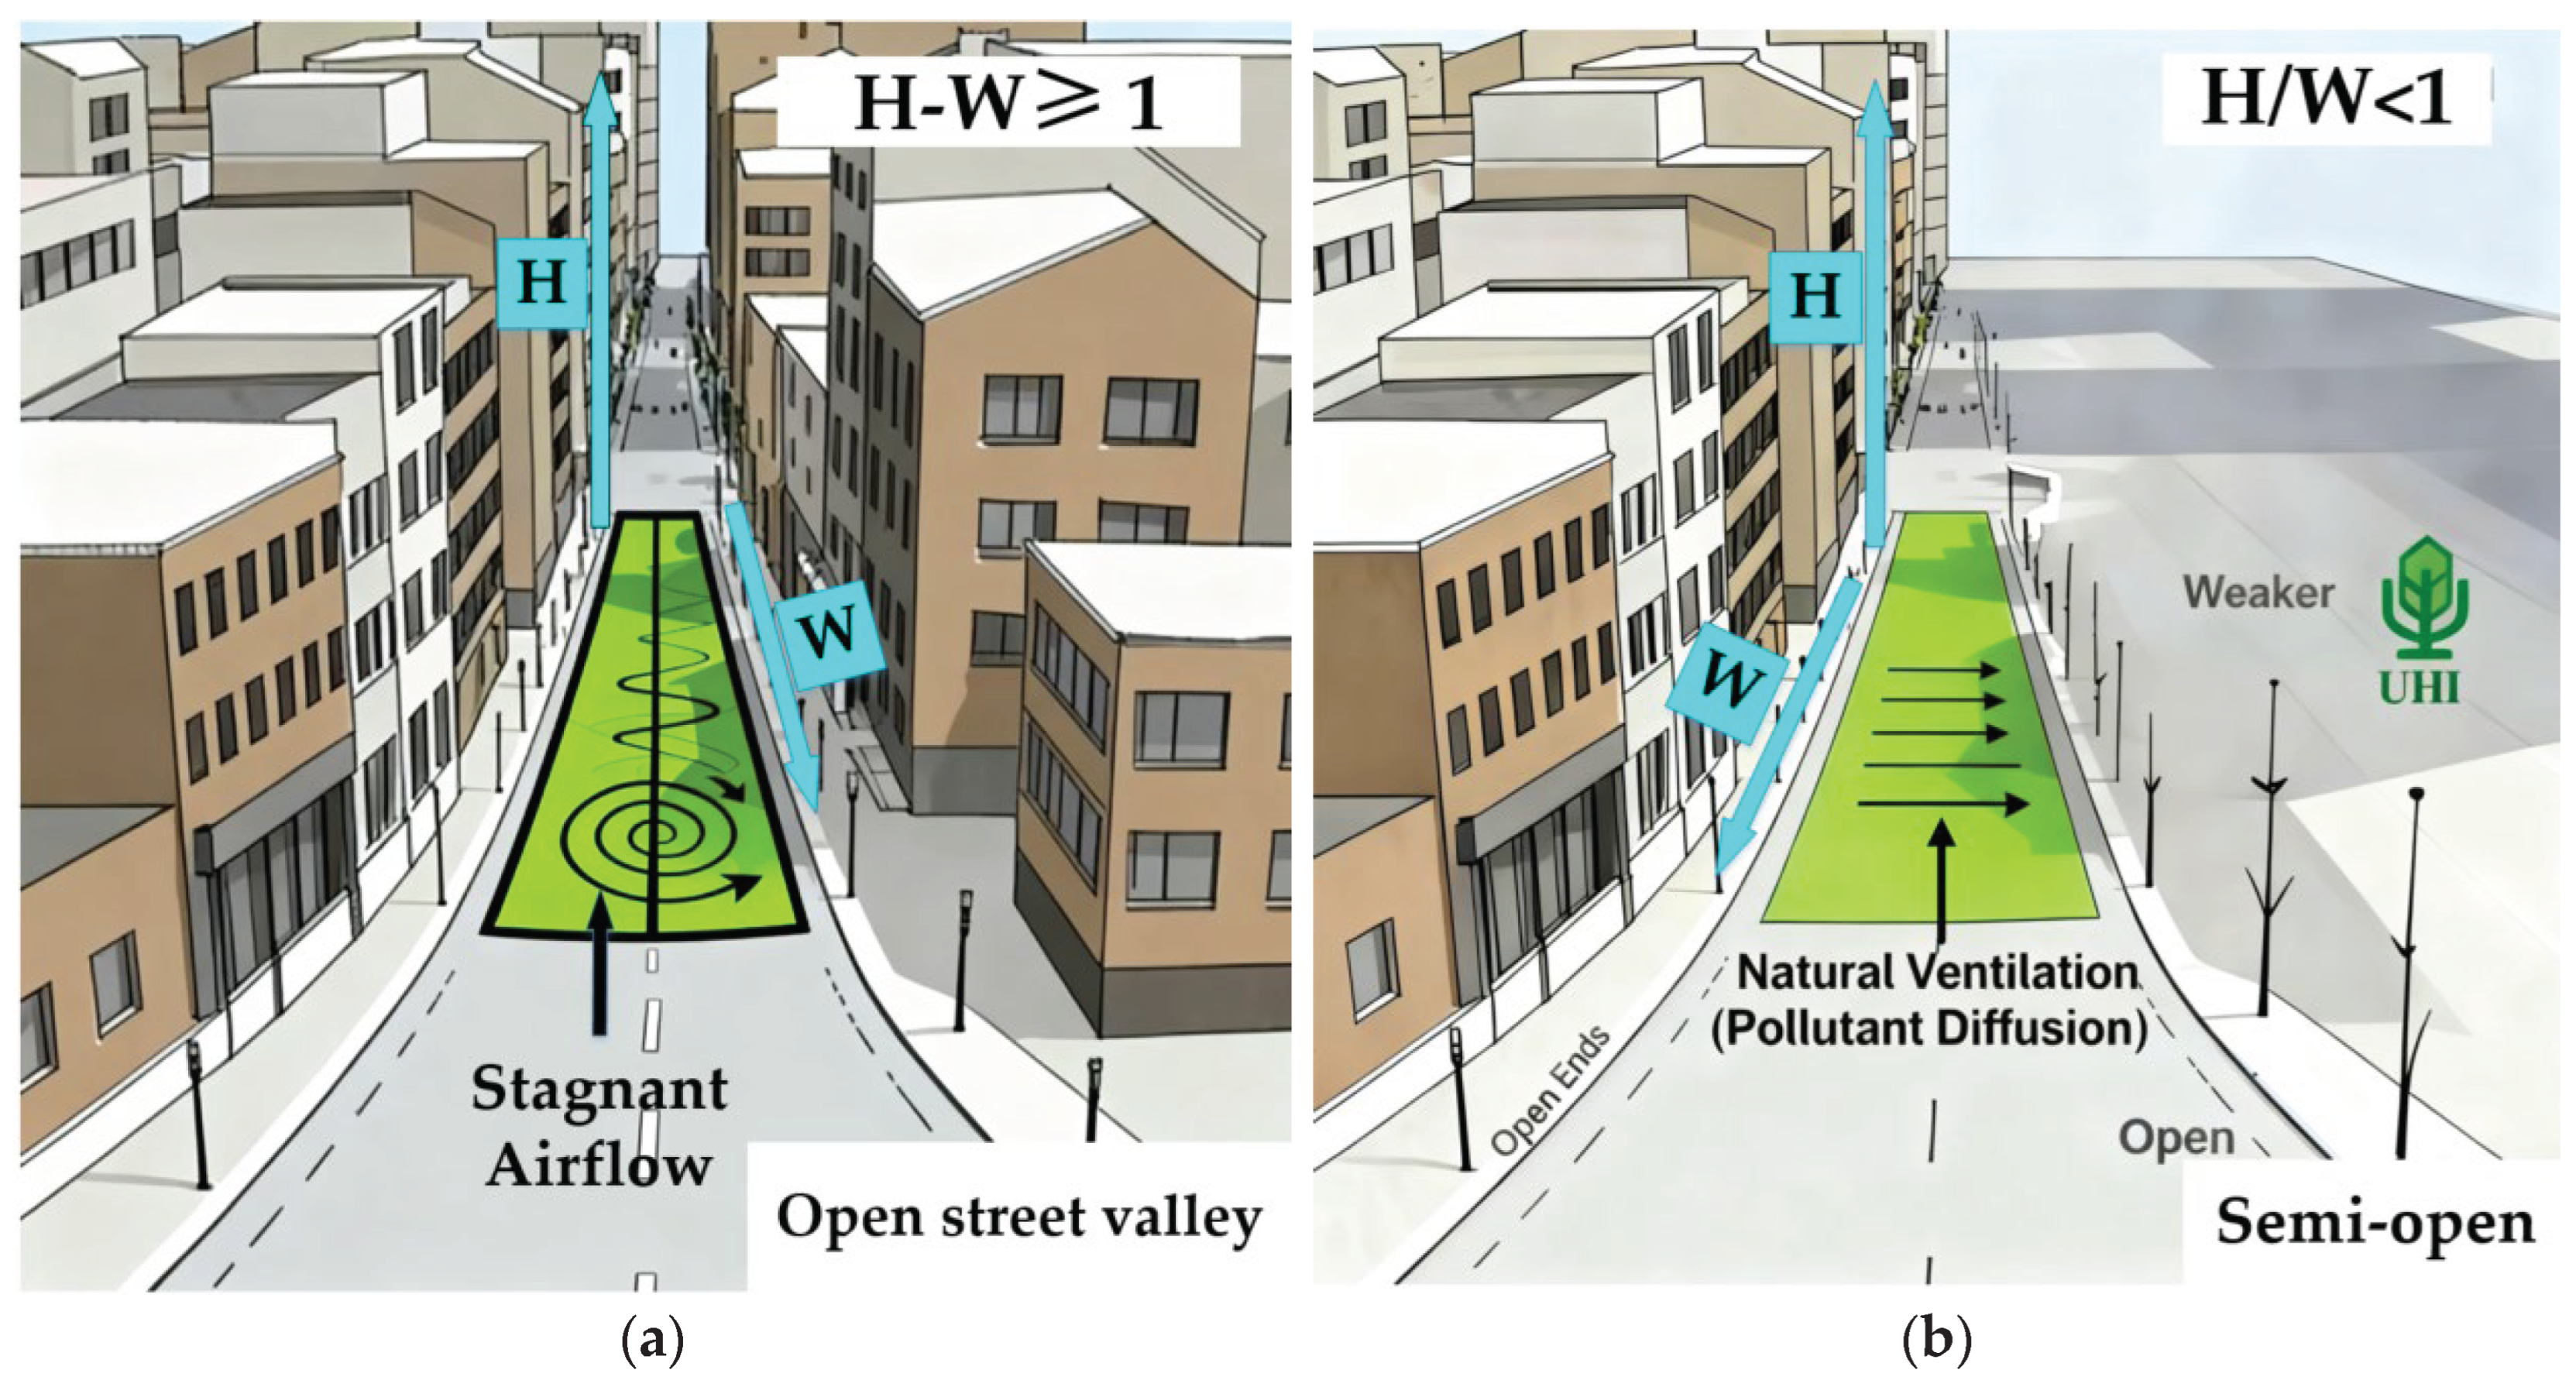

Table 1.
This is a table. Differences between street valleys and semi-open street valleys.
| Features | Street Valleys | Semi-open Street Valleys |
|---|---|---|
| Architectural continuity | Continuous closure | Discontinuous or with notches |
| Aspect ratio (H/W) | Larger (usually≥1) | Smaller (possibly <1) |
| Ventilation capacity | Poor, it is prone to form vortices | Better, pollutants are prone to diffusion |
| Heat island effect | Significant | Weaker |
| Typical area | City center, business district | Residential areas, mixed functional areas |
2. Experimental Design and Methods
2.1. Research Area
Yancheng, which is under the jurisdiction of Jiangsu Province, is located in the central part of the Jiangsu coast, between 32°34′-34°28′ north latitude and 119°27′-120°54′ east longitude, with a total area of 17,700 square kilometers. Yancheng is located in the transitional zone from the northern subtropical climate to the warm temperate climate, a region prone to cold winters and hot summers. Generally, the Su Bei Irrigation Canal serves as the boundary. The area south of the canal has a northern subtropical climate, whereas the area north of the canal has a southern warm temperate climate, featuring transitional characteristics. The climate is strongly influenced by the ocean. Compared with the western part of Jiangsu Province at the same latitude, the temperatures in the study area in spring are lower and increase later. The temperatures also decrease slowly in autumn and are higher than those in spring. The annual precipitation is also significantly greater than that in the western part of this province. The average annual temperature in Yancheng is approximately 14-16 °C. This experiment does not consider the influence of extreme weather on the microclimate. The period from April 3rd to April 12th, which is in spring and has an average temperature of approximately 16 °C, was selected. The investigation time interval is from 7:00 to 19:00.
This study selected the underground commercial street of Jianjun Road in Yancheng as the research location. The underground commercial street on Jianjun Road is 1,682 meters long and is currently the longest urban underground commercial street in northern Jiangsu. Construction of the road began in August 2011, and it officially opened on October 1, 2013. It has 38 entrances and exits connecting the above-ground and underground areas.
Figure 2.
Underground commercial street on Jianjun Road, Yancheng.
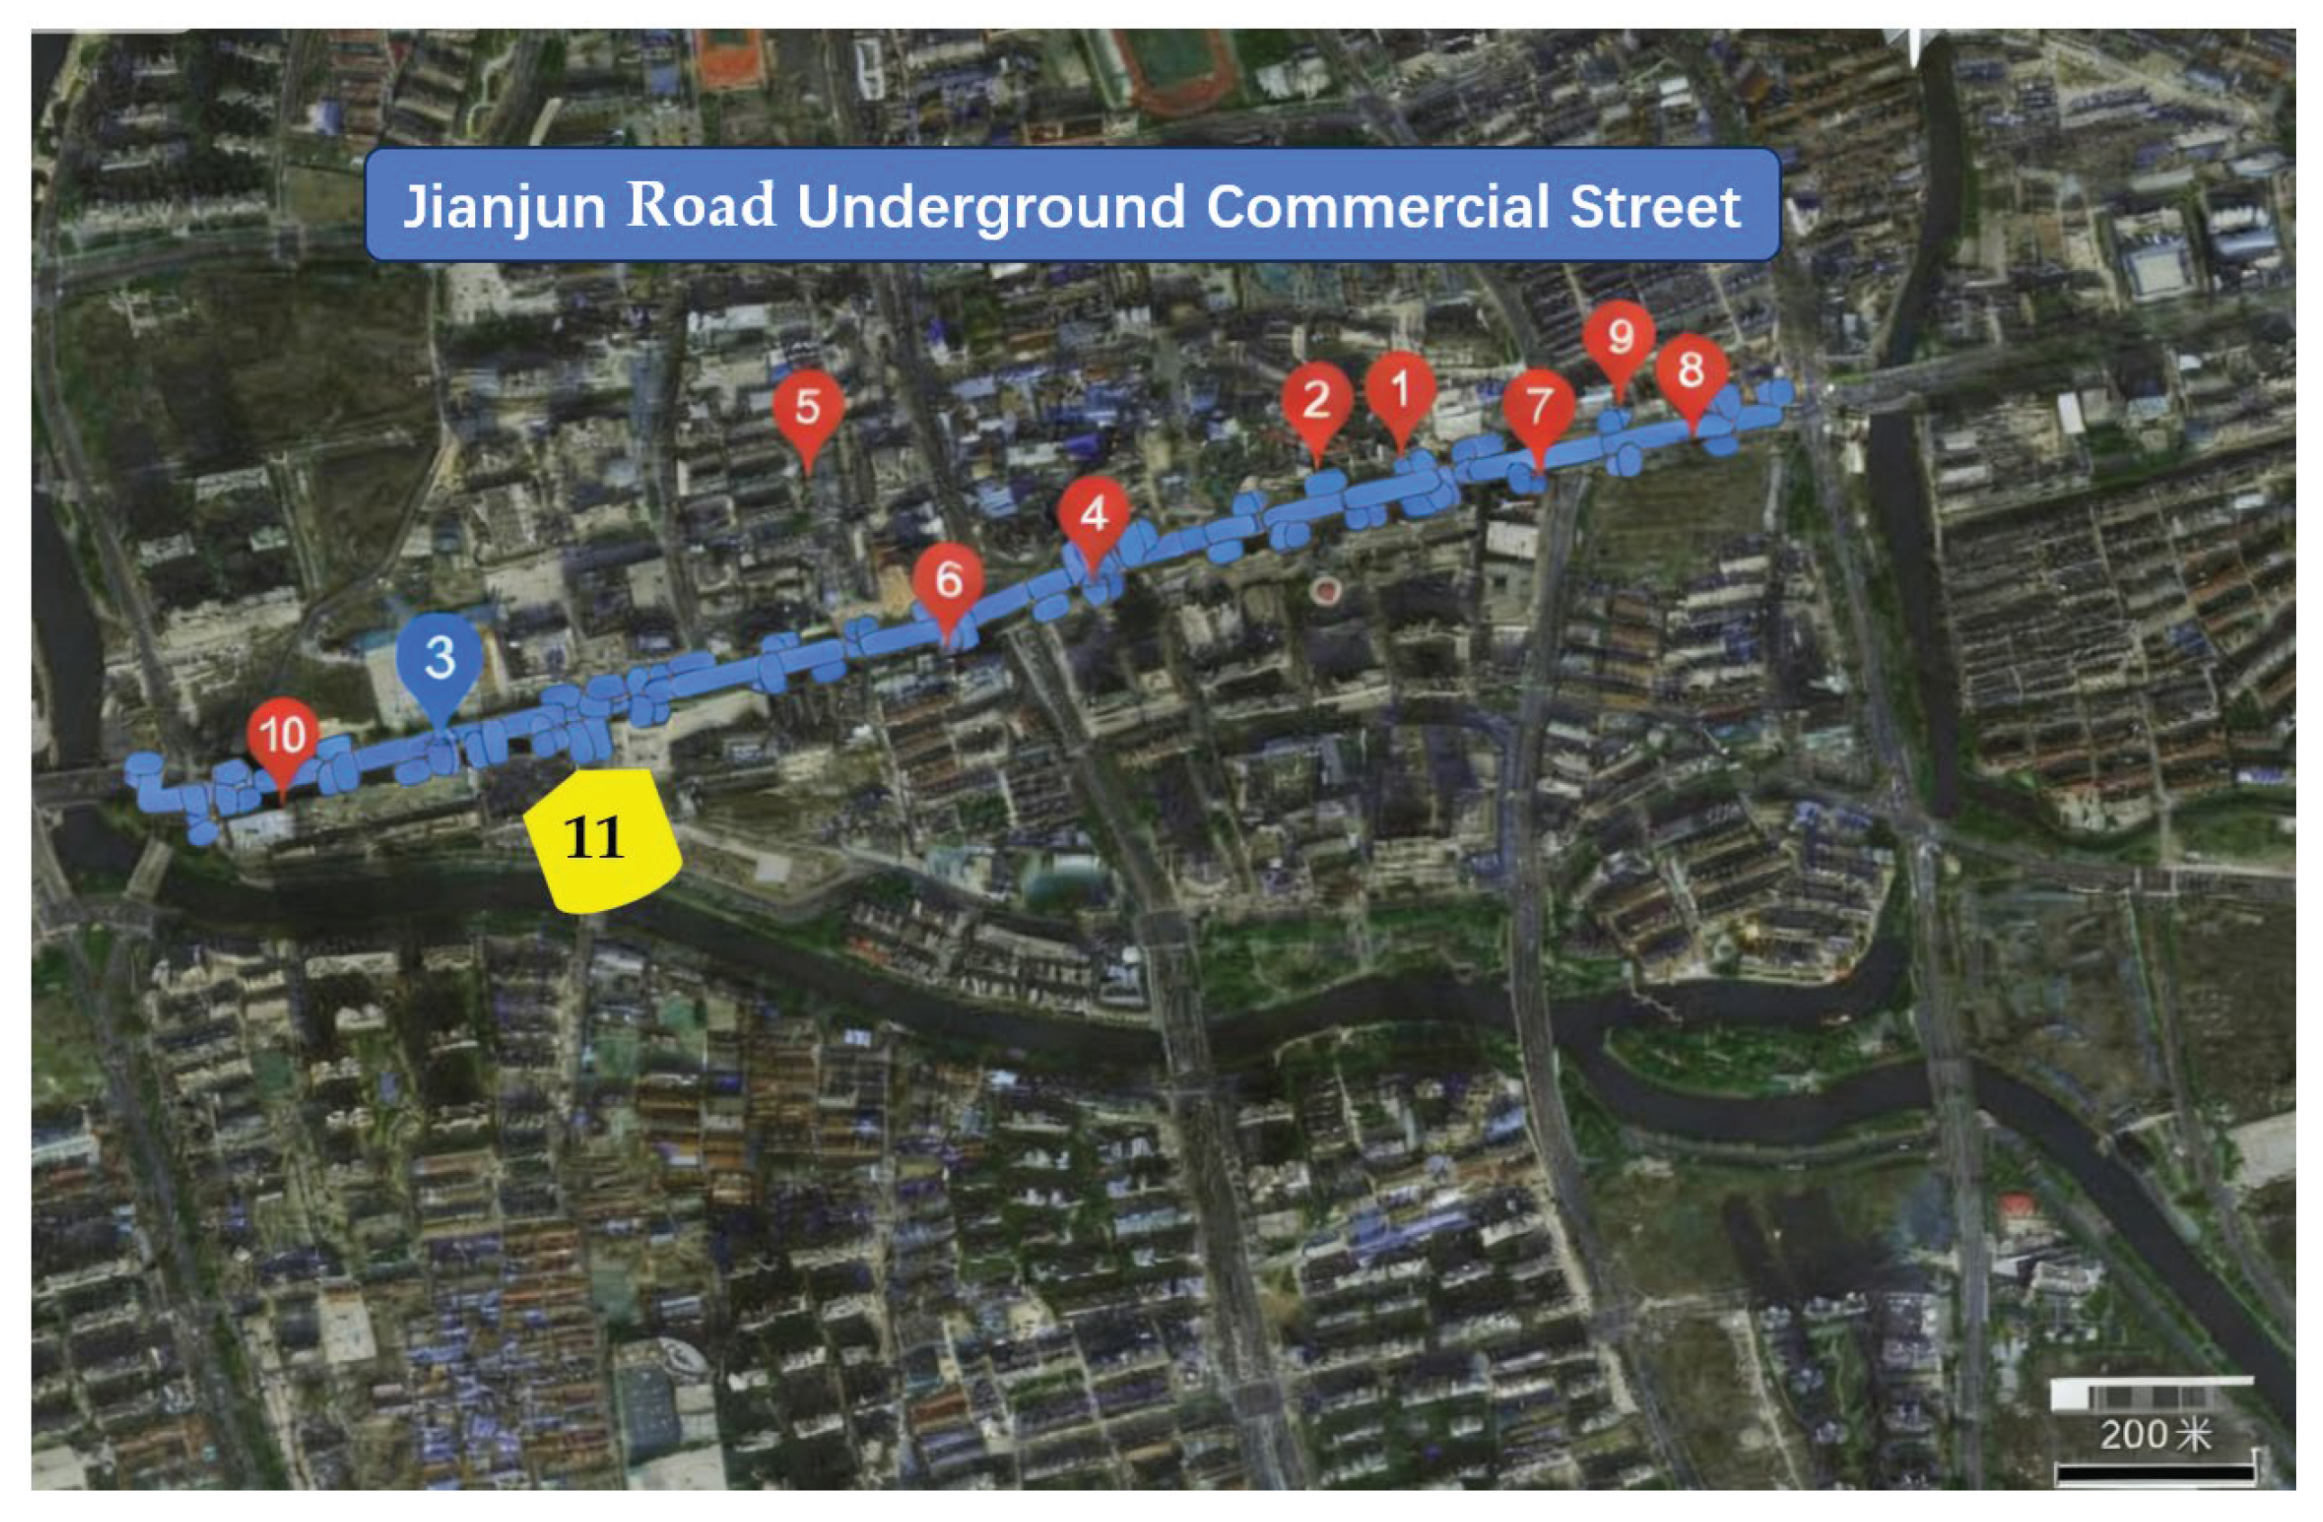
Research has revealed that the No. 11 entrance and exit of the underground commercial street on Jianjun Road in Yancheng is close to a large shopping mall. Accordingly, the foot traffic at all the entrances and exits of the underground commercial street is much greater than that at other entrances and exits. Therefore, for this study, an open street valley approximately 100 meters long near the No. 11 entrance and exit of the underground commercial street on Jianjun Road in Yancheng City was selected as the measured street valley, as shown in Figure 3.
2.2. Experimental Design
This study conducted continuous field observations on the entrance and exit of the No. 11 underground commercial street on Jianjun Road in Yancheng and the adjacent street valley space to characterize the intraday microclimate evolution of the entrance and exit street valley composite space and to provide boundary conditions and verification samples for the ENVI-met numerical simulation. The observation period was from April 3rd to 12th, totaling 10 days. During the time interval from 7:00 to 19:00, the temperature, humidity, CO2 concentration, wind speed, etc., at each measurement point were monitored to obtain the microclimate parameters of the street valley space. At the same time, surface facade thermal imaging was conducted to identify local hot spots and shading effects. The observations cover a complete daily cycle from the morning peak to the afternoon peak and then to the evening decline to ensure the representativeness of typical time periods.
The layout of the measurement points follows the principles of directional and morphological differences, considering both north‒south and east‒west street sections, different height‒width ratios (H/W), and opening forms. Ultimately, as shown in Figure 3, five fixed measurement points were established within the research scope: P1 on the outside of the entrance and exit, P2 on the inside of the entrance and exit, P3 at the upper air outlet of the street valley, P4 at the center of the street valley, and P5 at the lower air outlet of the street valley, as well as random points for evaluating spatial nonuniformity. As shown in Table 2. All test instruments were uniformly installed at a height of 1.5 m in the human breathing zone to reflect the actual experience of pedestrians and reduce the deviations caused by the disturbances of the near-ground boundary layer.
2.3. Field Measurement
At each fixed measurement point, verification is conducted on the hour and on the half hour and continuous records are maintained. At each monitoring moment, the same variable is measured three times consecutively, and the average is taken as the value of that moment. The basic data of the microclimate environment in the street valley measured are air temperature(°C), relative humidity(%), wind speed(m/s), and CO2 concentration (ppm) at the measured pedestrian height (1.5 m) in the street valley. The experimental equipment used includes a handheld three-in-one digital anemometer for temperature, humidity and wind (SW6056), which synchronizes the outputs of three types of measurement values to meet the monitoring requirements of street and valley wind speed fields. The wind speed ranged from 0.3 to 45 m/s, the temperature ranged from -10 °C to 50 °C (14 °F to 122 °F), and the humidity ranged from 20%RH to 85%RH. The measurement range of the CO2 detector was 0 to 6000ppm. Wavelength range of the handheld thermal imager was (NF-521):8 to 14. Zero-point span verification of the three types of equipment were completed before entering the site, and daily rechecks were carried out according to the observation schedule. If reading drift occurred, interchangeability comparisons and recalibrations were performed in accordance with the established process to reduce systematic errors.
To verify the external consistency, supplementary measurements were carried out in an open area near the study area from 09:00 to 15:00 every test day. As shown in Figure 4. Elements such as temperature, relative humidity and wind speed were collected, and the on-site observations were compared with the hourly average data of the meteorological department during the same period to verify the accuracy of the instrument readings and the stability of the sampling process.
3. Microclimate Simulation Analysis
This section may be divided by subheadings. It should provide a concise and precise description of the experimental results, their interpretation, as well as the experimental conclusions that can be drawn.
3.1. Numerical Simulation Parameter Settings
To ensure consistency between the numerical simulations and field observations, this study takes the actual monitoring range of the measured street valley as the modeling object. Based on the layout and survey results described in Section 2.2, April 9, 2025, was selected as the simulation date, and the semi-open street valley near Exit 11 was chosen as the simulation area. Geometric abstraction was carried out in ENVI-met in accordance with the principles of maintaining the geometric framework and simplifying noncritical details, i.e., retain the height and outer contour of the buildings on both sides, the relative scale and positional relationship of the entrances and exits, the openings and passages, and the roads and pedestrian spaces; and moderately simplify the small auxiliary components and fragmented landscape elements to reduce the computational load while maintaining the invariance of the dominant flow and radiation characteristics.
Figure 5.
The simulated measured area and ENVI-met model of underground commercial streets.
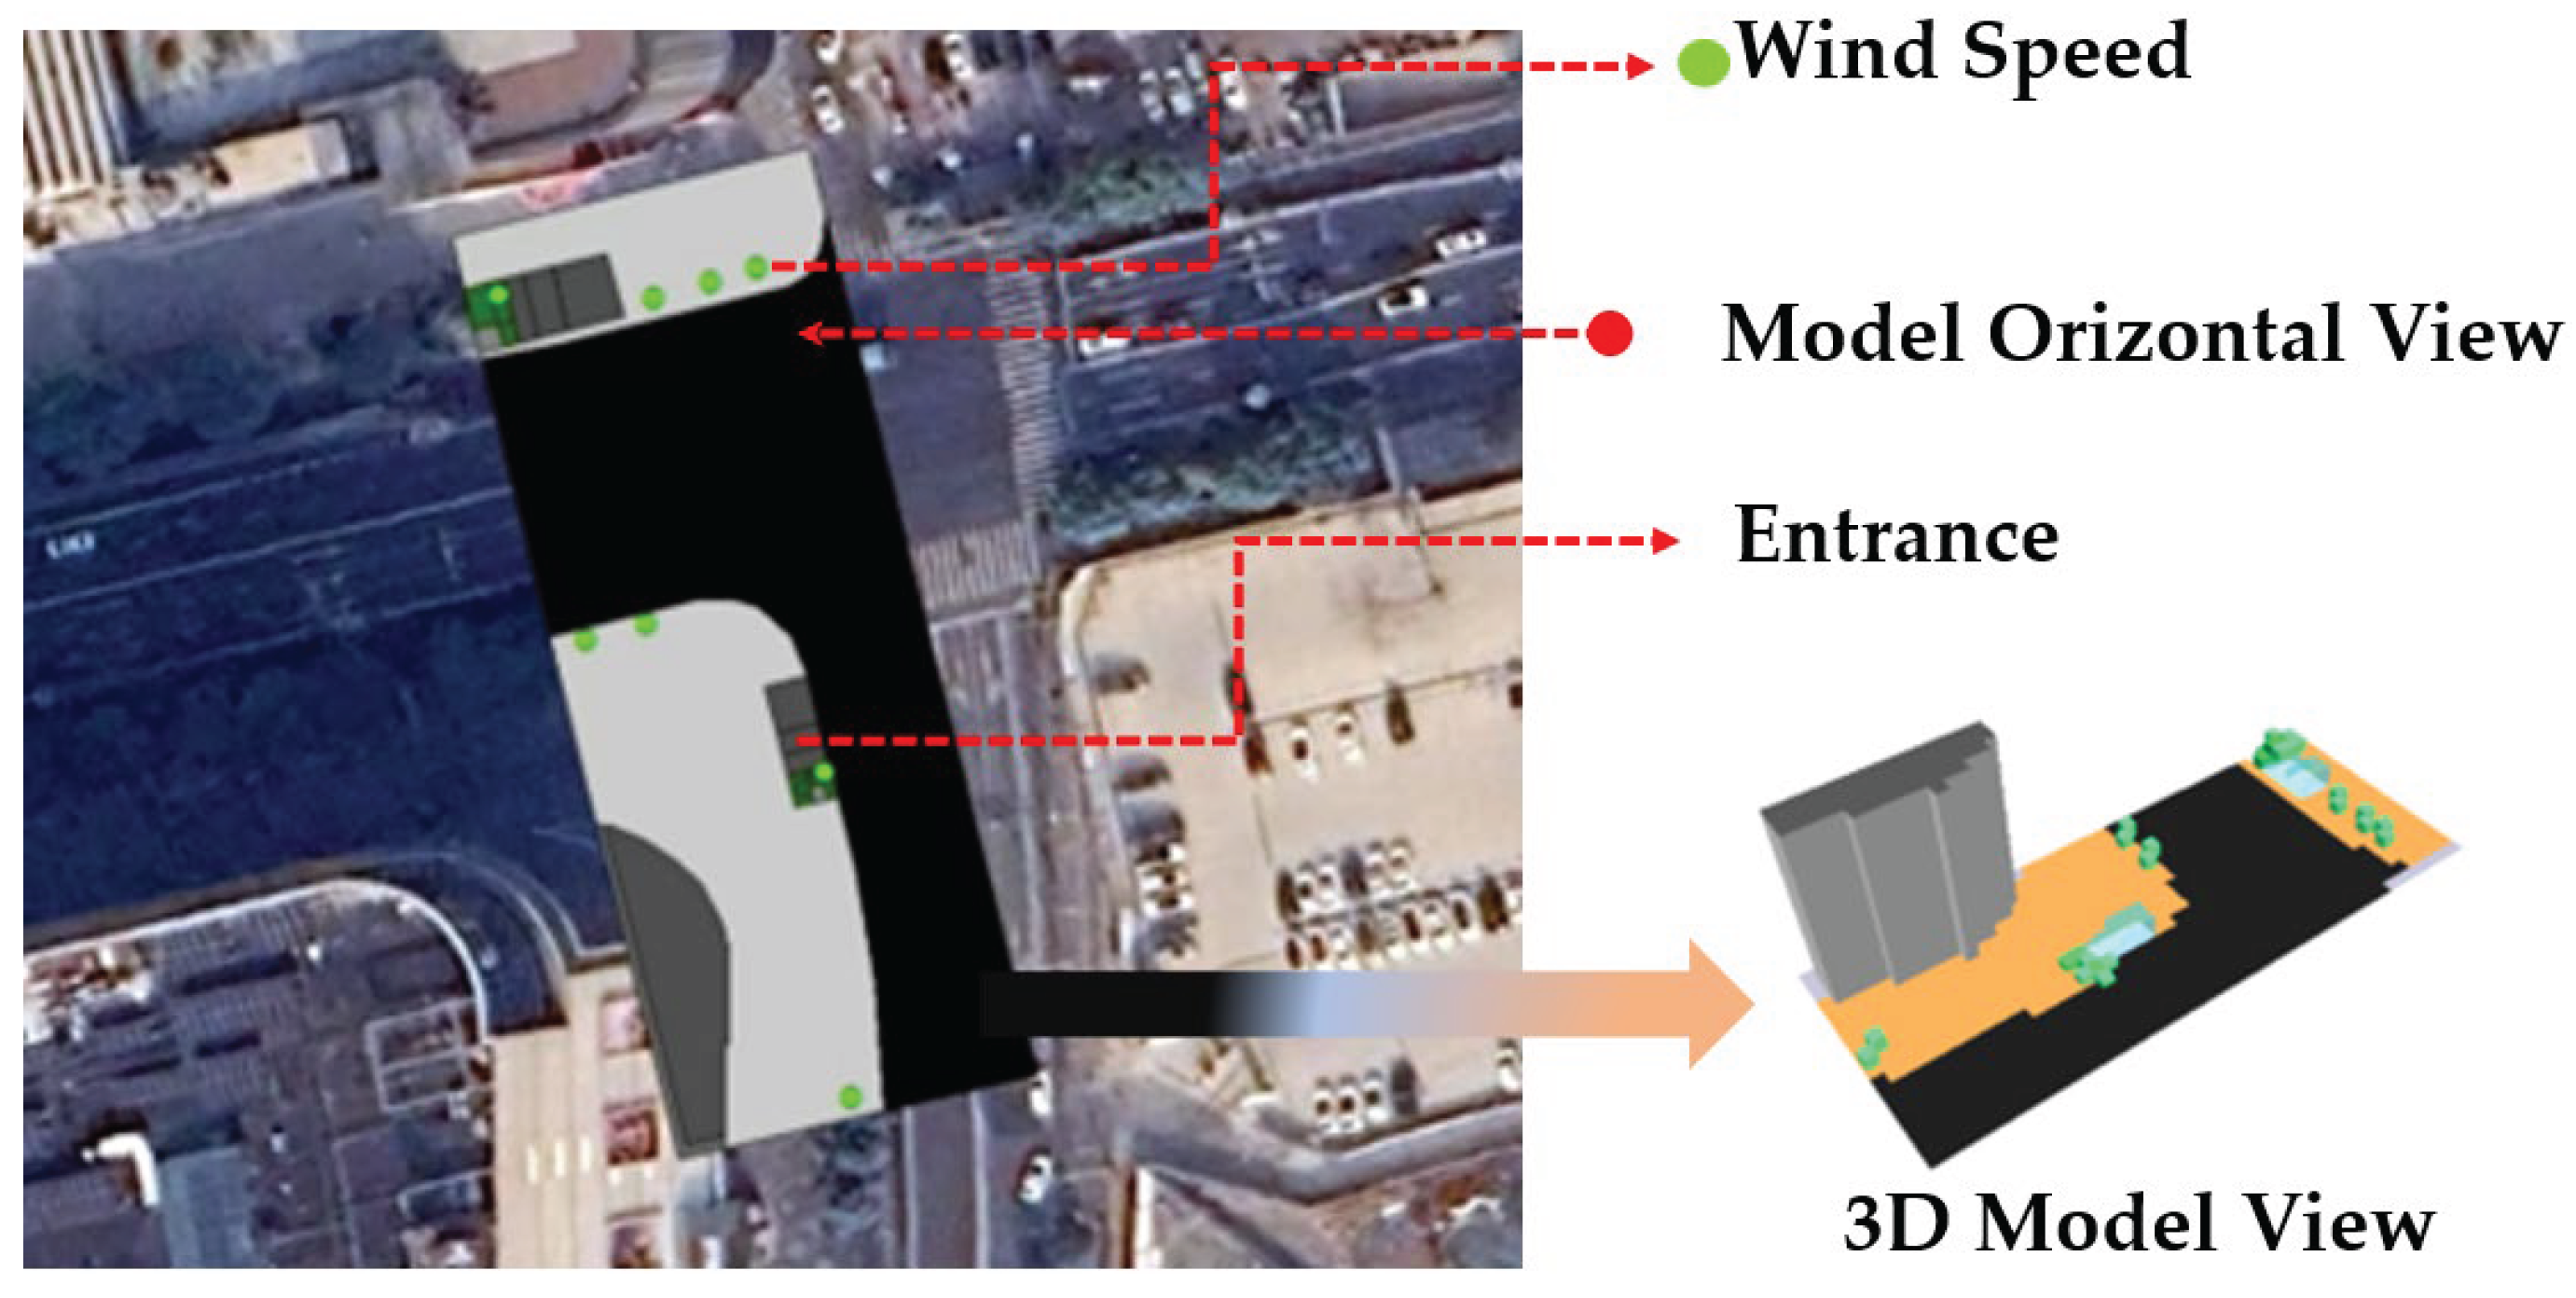
In accordance with the size of the simulation area and to better analyze the response of the thermal and humid wind field at different pedestrian heights, the horizontal area was 100 m*45 m, the entire simulation environment was 2 m*2 m*2 m, and the unit grid size was 5 m*5 m*3 m. Therefore, the number of grids was 50 m*25 m*25 m, and the grid was further divided into 5 equal parts near the ground. This configuration can analyze not only typical ventilation channels and stagnant zones under the condition of coexisting enclosed openings but also complete hourly simulations within an acceptable computational cost. The model adopts a parameter combination consistent with the field observations to solve for air temperature, relative humidity, wind speed and CO2 concentration on an hourly basis and outputs them hourly. To match the observation height, the spatiotemporal distribution of the plane at a height of 1.5 m above the ground was extracted as the focus and used for one-to-one comparison and error evaluation with the measured curve and the isomap of typical moments.
3.2. PMV Comfort Model
The PMV human settlement experience comfort model was selected. The predicted average thermal sensation index (PMV) model was used in this study to quantitatively analyze the thermal comfort in different areas of the street valley where the entrances and exits of the underground commercial street are located. The specific formula is as follows:
M: Energy metabolism rate of the human body, measured in watts per square meter ();
W: Mechanical power generated by the human body, in watts per square meter ();
Pa: Partial pressure of water vapor in the surrounding air, measured in pascals ();
ta: Temperature of the air around the human body, in degrees Celsius (°C);
tr: Average radiant temperature, in degrees Celsius (°C);
fcl: Ratio of the area covered by clothing to the exposed area of the human body;
tcl: Temperature of the outer surface of the garment, in degrees Celsius (°C);
hc: Surface heat transfer coefficient, measured in watts per square meter in Kelvin ()
In the design of the simulation parameters, the energy metabolism rate of the human body was set at 1.2 met (at rest), the thermal resistance of clothing was set as 0.8 clo (typical value), the mechanical power generated by the human body was set as 0 (no additional work is done), and the average radiation temperature was approximately the air temperature. Through such a model that comprehensively considers multiple factors, the PMV values under different environmental parameters can be calculated more accurately. Furthermore, the PMV of different areas in the valley where the entrances and exits of the underground commercial street are located can be quantitatively evaluated. Once areas with poor PMV are identified, more scientific, effective and quantified optimization plans can be proposed in a targeted manner. Hence, it is recommended to provide strong support for improving the thermal comfort of pedestrians in underground commercial streets.
3.3. Simulation Results and Analysis
The measured values of temperature, humidity, wind speed and CO2 concentration in the simulation results of the measured area were compared with the simulated values to analyze the differences between the software simulation results and the measured results to verify the degree of coupling between the simulation software and the measured results.
3.3.1. Air Temperature
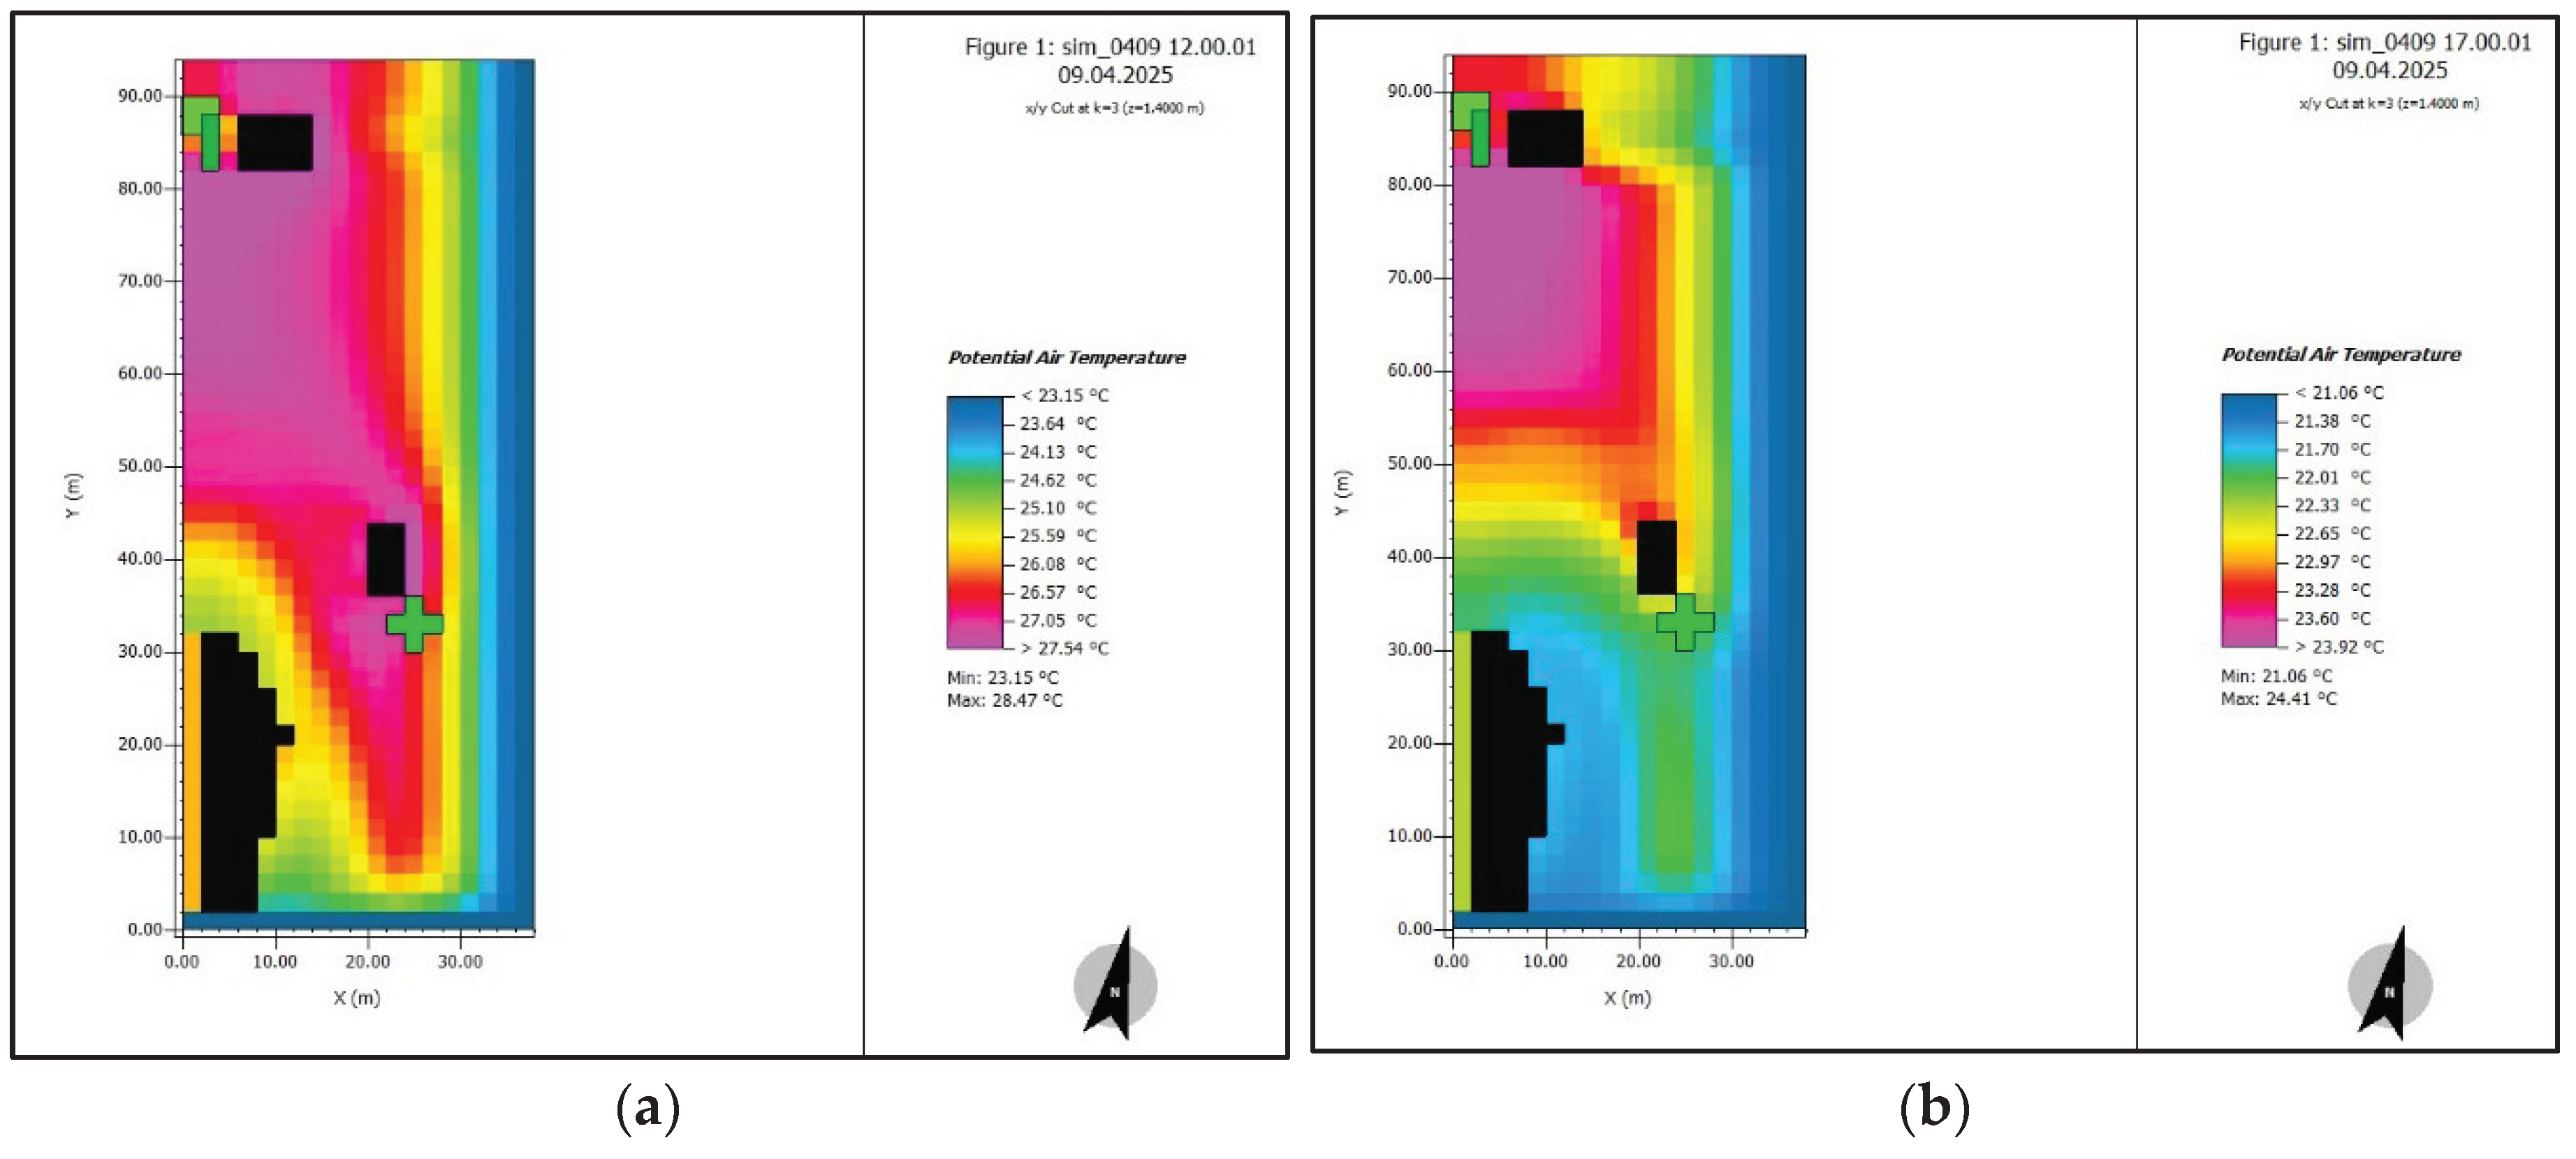
To verify the consistency between the ENVI-met software simulation and the measured values, in this paper, the parameters of the measured area were simulated hourly from 7 a.m. to 6 p.m. The figure shows the air temperature distribution at 12 noon and 5 p.m. at a height of 1.5 m above the ground, as well as the statistics of the measured and simulated temperatures at each measurement point.
A comparative analysis revealed that the simulation of air temperature by ENVI-met was relatively accurate. The average absolute error of all measurement points at two times was 0.36 °C, and the root mean square error (RMSE) was 0.42 °C. Moreover, the deviation between most of the simulated values and the measured values was within ±0.5 °C, meeting the accuracy requirements for microclimate simulation.
From the perspective of spatial distribution, the temperature at point P2 was consistently higher than that at the other points. This is closely related to factors such as the area being blocked by buildings, poor ventilation, and heat exchange between underground space and the outside. In the afternoon, owing to the greater solar altitude angle, the time at which the street valley is exposed to direct sunlight was prolonged. Coupled with the thermal inertia effect of the building materials, the temperature increase at points P4 and P2 was more significant between 12:00 and 17:00. Although the model revealed a slight overestimation at points P3, P4 and P5, it successfully captured the spatial differentiation characteristics of the local heat accumulation zone and ventilation cooling zone formed by the building layout and open diversion as a whole, proving that it can effectively reflect the thermal structure of the semi-open street valley.
Consistent with Oke’s street-valley theory, the simulation results clearly demonstrated the regulatory effect of building shadows on temperature distribution. For example, the east‒west street valley formed a distinct asymmetric temperature distribution in the afternoon. This feature was well reproduced by the model, indicating that ENVI-met exhibited a reliable physical basis for simulating the radiation exchange and thermal equilibrium processes in street valleys.
Figure 6.
Two format schematics. (a) Comparison of measured values and simulated values at each measurement point at 12:00 (°C). (b) Comparison of measured values and simulated values at each measurement point at 17:00 (°C).
Figure 6.
Two format schematics. (a) Comparison of measured values and simulated values at each measurement point at 12:00 (°C). (b) Comparison of measured values and simulated values at each measurement point at 17:00 (°C).
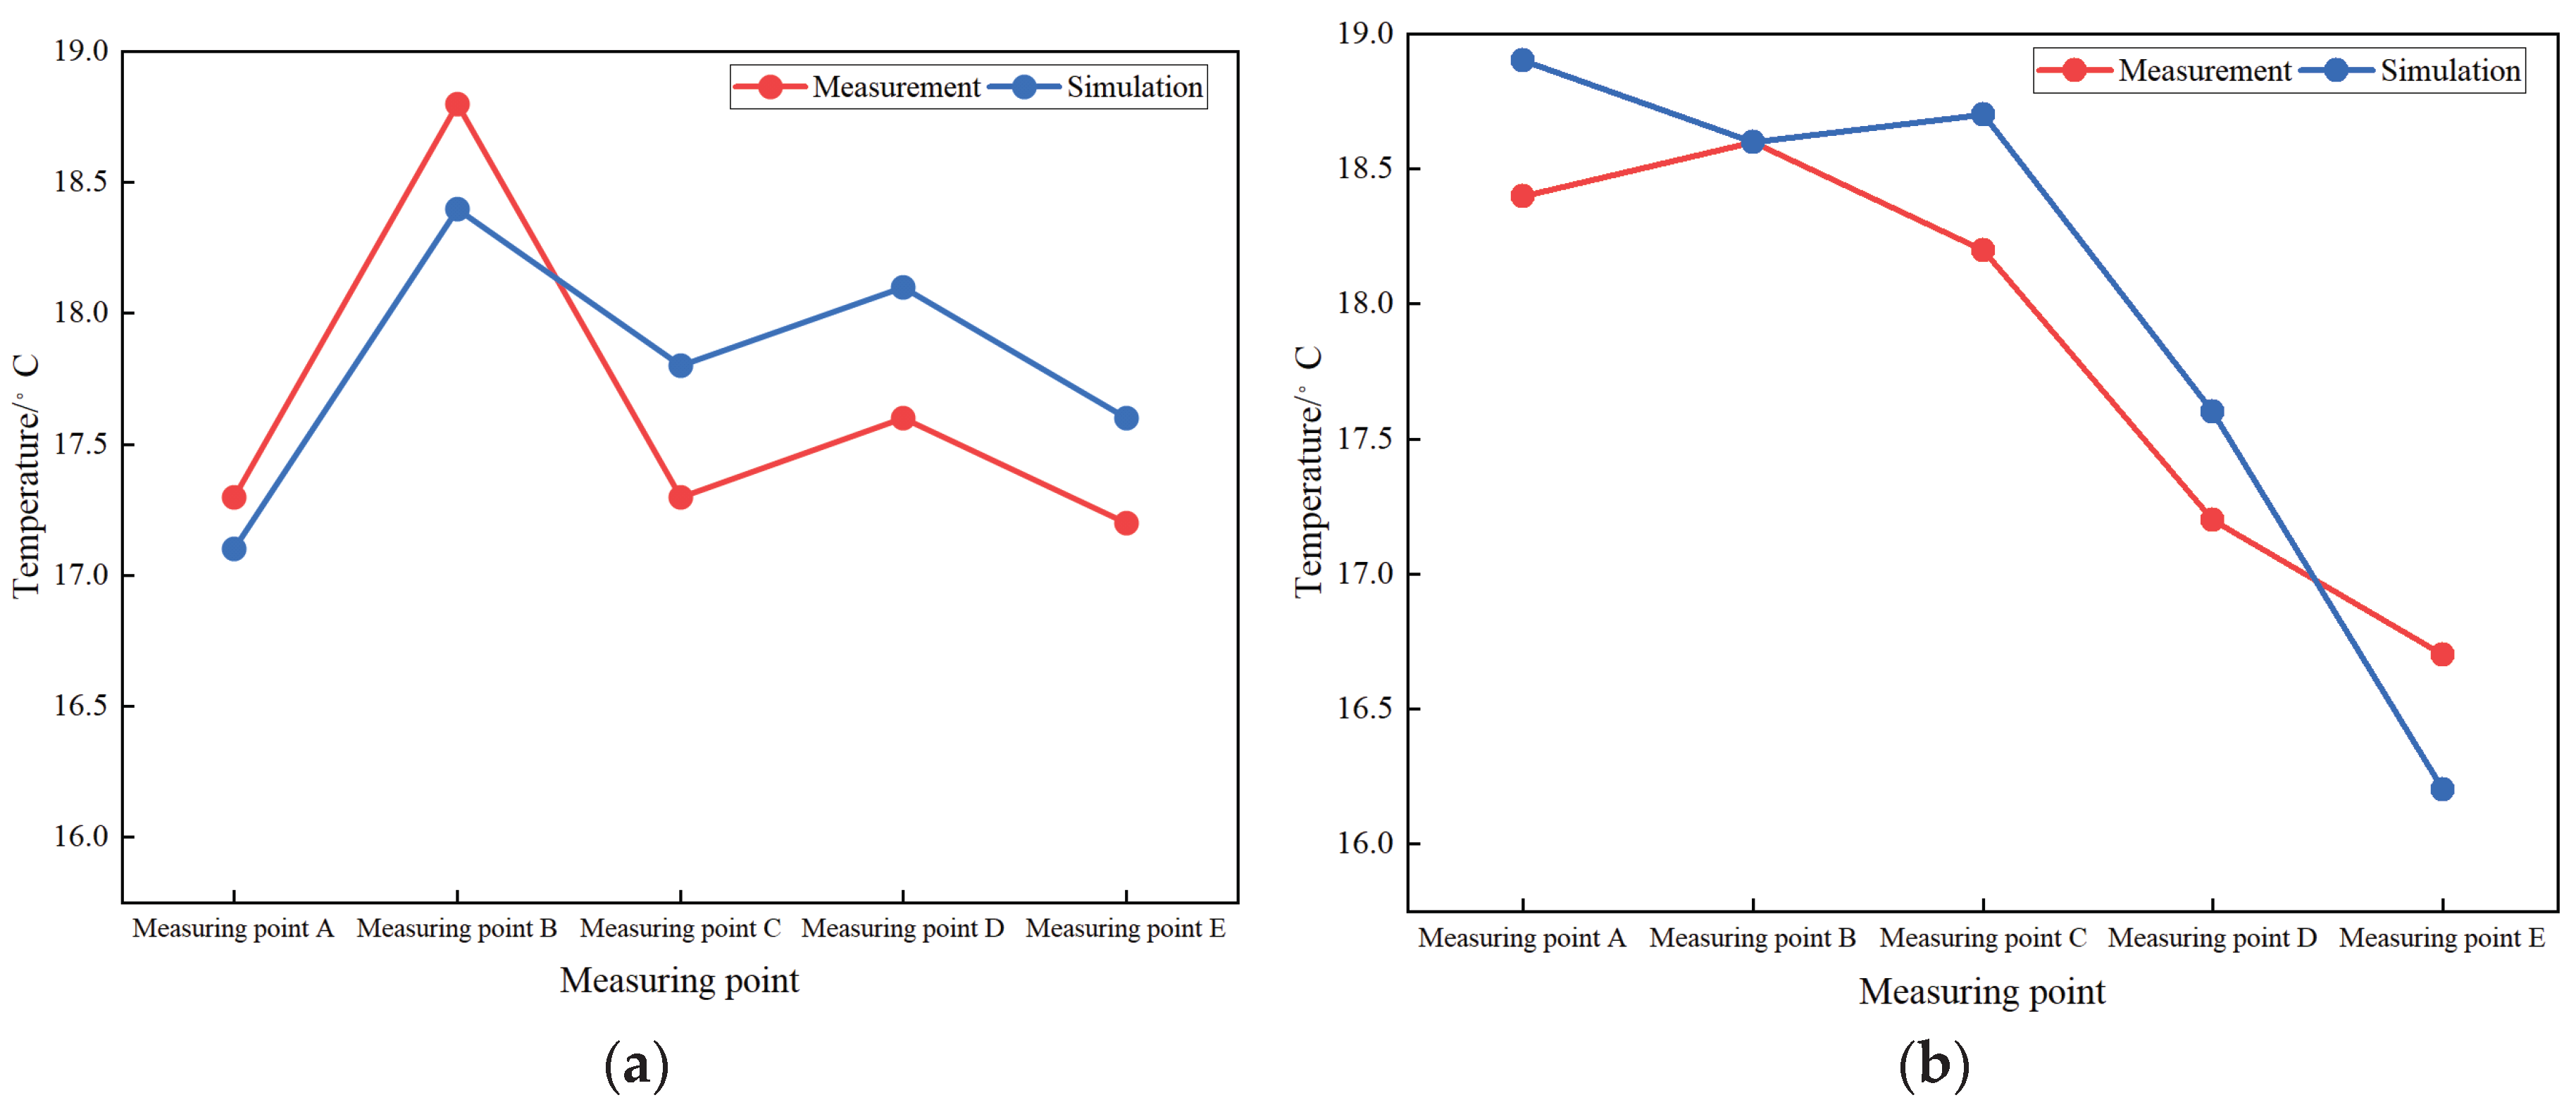
Figure 7.
Air temperature at two times. (a) Air temperature at a height of 1.5 m above the ground (12:00). (b) Air temperature at a height of 1.5 m above the ground (17:00).
Figure 7.
Air temperature at two times. (a) Air temperature at a height of 1.5 m above the ground (12:00). (b) Air temperature at a height of 1.5 m above the ground (17:00).
3.3.2. Air Humidity
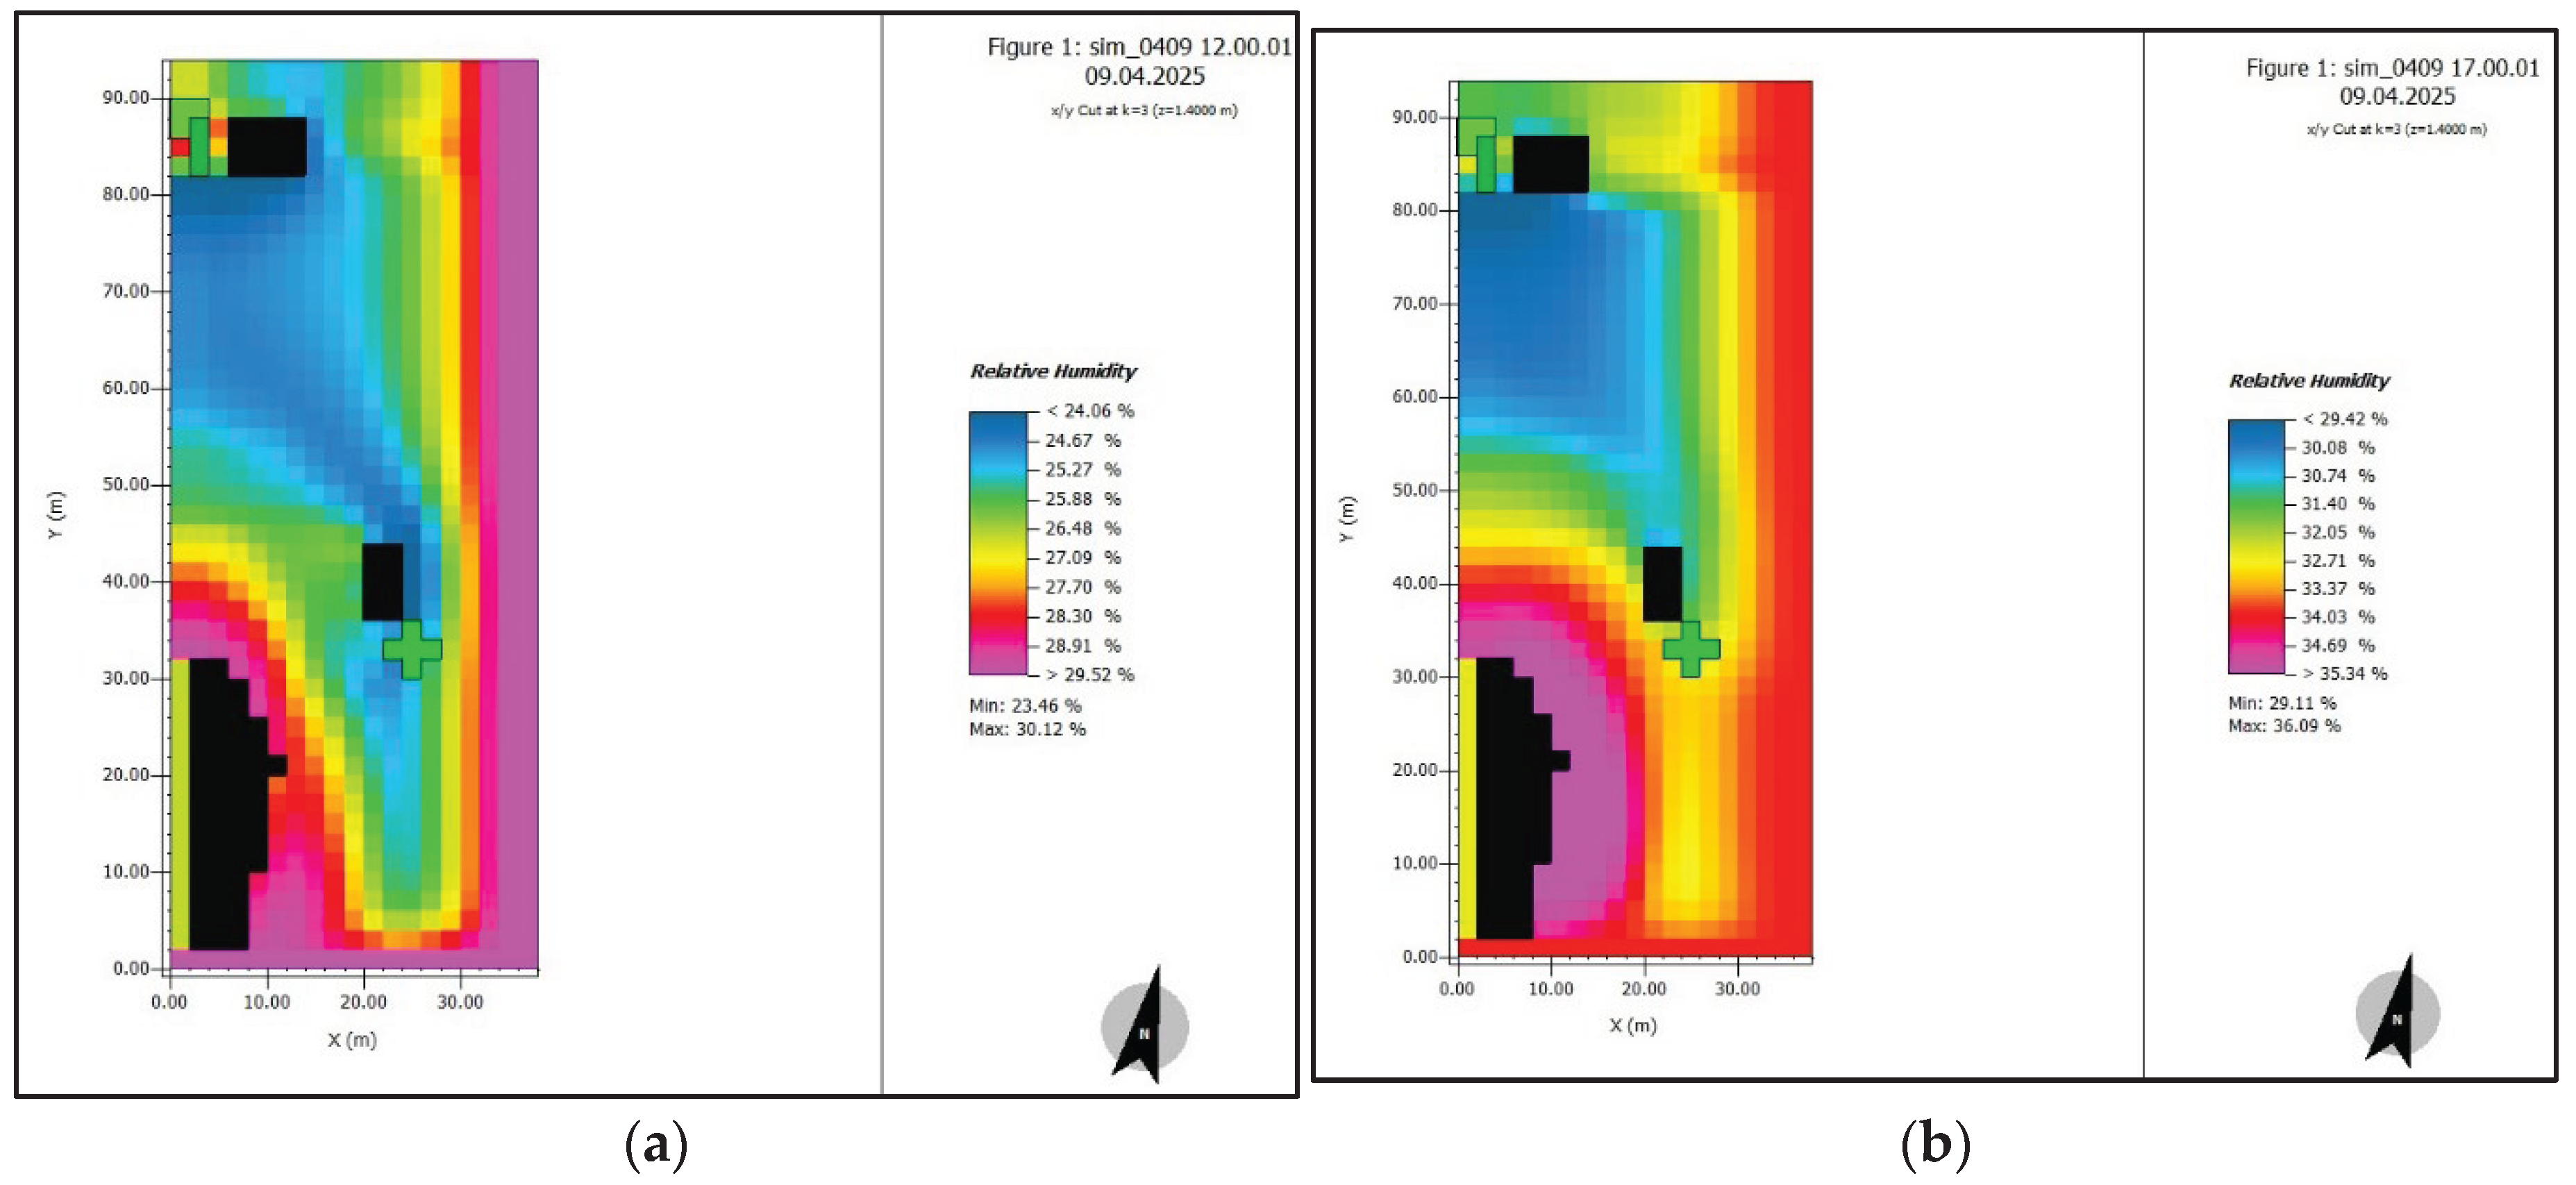
The following figure displays the simulation of air humidity at 12:00 and 15:00 when there was a difference in humidity on both sides of the street valley. A comparison of the measured and simulated values of the street valley humidity revealed that the measured and simulated values of the overall change in the air humidity distribution were approximately consistent.
The overall trend of humidity simulation was consistent with the actual measurement, especially when a high-humidity environment near point P2 was maintained. The simulation accurately reflected the increased humidity effect caused by the exchange of air between the underground space and the outdoors. The simulated value at point P2 was in good agreement with the measured value, with an error within±4%, indicating that the model’s handling of the main humidity source was reasonable.
However, points P3 and P5 showed significant deviations at 17:00. These errors mainly stem from the simplified treatment of surface evapotranspiration, vegetation transpiration and anthropogenic wet sources by the model. The actual surface material of the street valley was complex. Accordingly, the moisture exchange characteristics of concrete pavement, asphalt pavement and green belt varied significantly, and the spatial variation in the local moisture evaporation rate was large. However, the model adopted a relatively uniform parameter scheme, which led to a systematic overestimation of the humidity simulation in relatively dry areas, such as P3, P4 and P5, which were far from the entrance and exit.
Despite these variations, the model demonstrated good ability to capture the controlling effects of different underlying surfaces and ventilation conditions on humidity distribution, with the simulation results revealing that the humidity in the well-ventilated areas of P1 and P3 was relatively low, whereas that in the poorly ventilated areas of P2 and P5 was relatively high. This trend is consistent with the measured results.
Figure 8.
Humidity measurement vs simulation. (a) Comparison of measured values and simulated values at each measurement point at 12:00 (%). (b) Comparison of measured values and simulated values at each measurement point at 17:00 (%).
Figure 8.
Humidity measurement vs simulation. (a) Comparison of measured values and simulated values at each measurement point at 12:00 (%). (b) Comparison of measured values and simulated values at each measurement point at 17:00 (%).

Figure 9.
Air humidity at 1.5m ground at two times. (a) Air humidity at a height of 1.5 m above the ground (12:00). (b) Air humidity at a height of 1.5 m above the ground (17:00).
Figure 9.
Air humidity at 1.5m ground at two times. (a) Air humidity at a height of 1.5 m above the ground (12:00). (b) Air humidity at a height of 1.5 m above the ground (17:00).
3.3.3. Air Velocity
The simulated and measured distributions of wind speed are presented in Figures 11 (a) and (b). Due to the high transient and turbulent characteristics of the near-surface wind field, this paper focuses on comparing the overall consistency of the spatial distribution patterns and magnitudes between the simulation and the measured data.
The simulation results successfully reproduced the basic distribution law of wind speed inside the street valley. That is, owing to the channel effect and the action of incoming wind, the wind speed outside the entrance and exit P1 and at upwind P3 was relatively high. However, in the leeward areas and behind the corners of the buildings at P2 and P5, vortices or stagnant wind zones were prone to form, resulting in a significant reduction in wind speed. This distribution was highly consistent with the theory of street valley ventilation and actual observations.
With respect to the measured values, the time-averaged results of the simulated values were close to the measured average values, but the simulation was relatively smooth and failed to fully reproduce the instantaneous fluctuation characteristics of the measured wind speed. This is mainly because the Reynolds average (RANS) turbulence model adopted by ENVI-met conducts statistical processing on turbulence pulsations and filters out high-frequency fluctuation components. Therefore, it is more suitable for analyzing average wind fields rather than instantaneous wind conditions. In addition, pedestrians and temporary obstacles within the street valley can cause disturbances to the airflow. While these elements were not included in the model, they are also possible reasons for the differences.
Notably, the model performs well in capturing the local acceleration effects caused by the architectural geometry. As shown in Figure 10, at 12:00, a distinct area of increased wind speed appeared at the entrance and exit opening P1, which was consistent with the actual observed Venturi effect, indicating that the model exhibits good ability to handle flow problems under complex geometric boundary conditions.
Table 3.
Relationship between Wind Speed and Human Thermal Comfort.
| Wind speed (m/s) | Outdoor environment (°C) | Human reaction |
|---|---|---|
| 0.05 | 0 | Static air, feel a little uncomfortable |
| 0.2 | 1.1 | Almost do not feel the wind, but more comfortable |
| 0.4 | 1.9 | Can feel the wind but more comfortable |
| 0.8 | 2.8 | Feel a lot of wind in some windy areas When the air is hot, it is acceptable |
| 1.0 | 3.3 | In a well-ventilated environment with a hot and dry climate |
| 2.0 | 3.9 | In a well-ventilated environment with a hot and humid climate |
| 4.5 | 5 | It still feels like a gentle breeze outdoors |
3.3.4. PMV Thermal Comfort Analysis
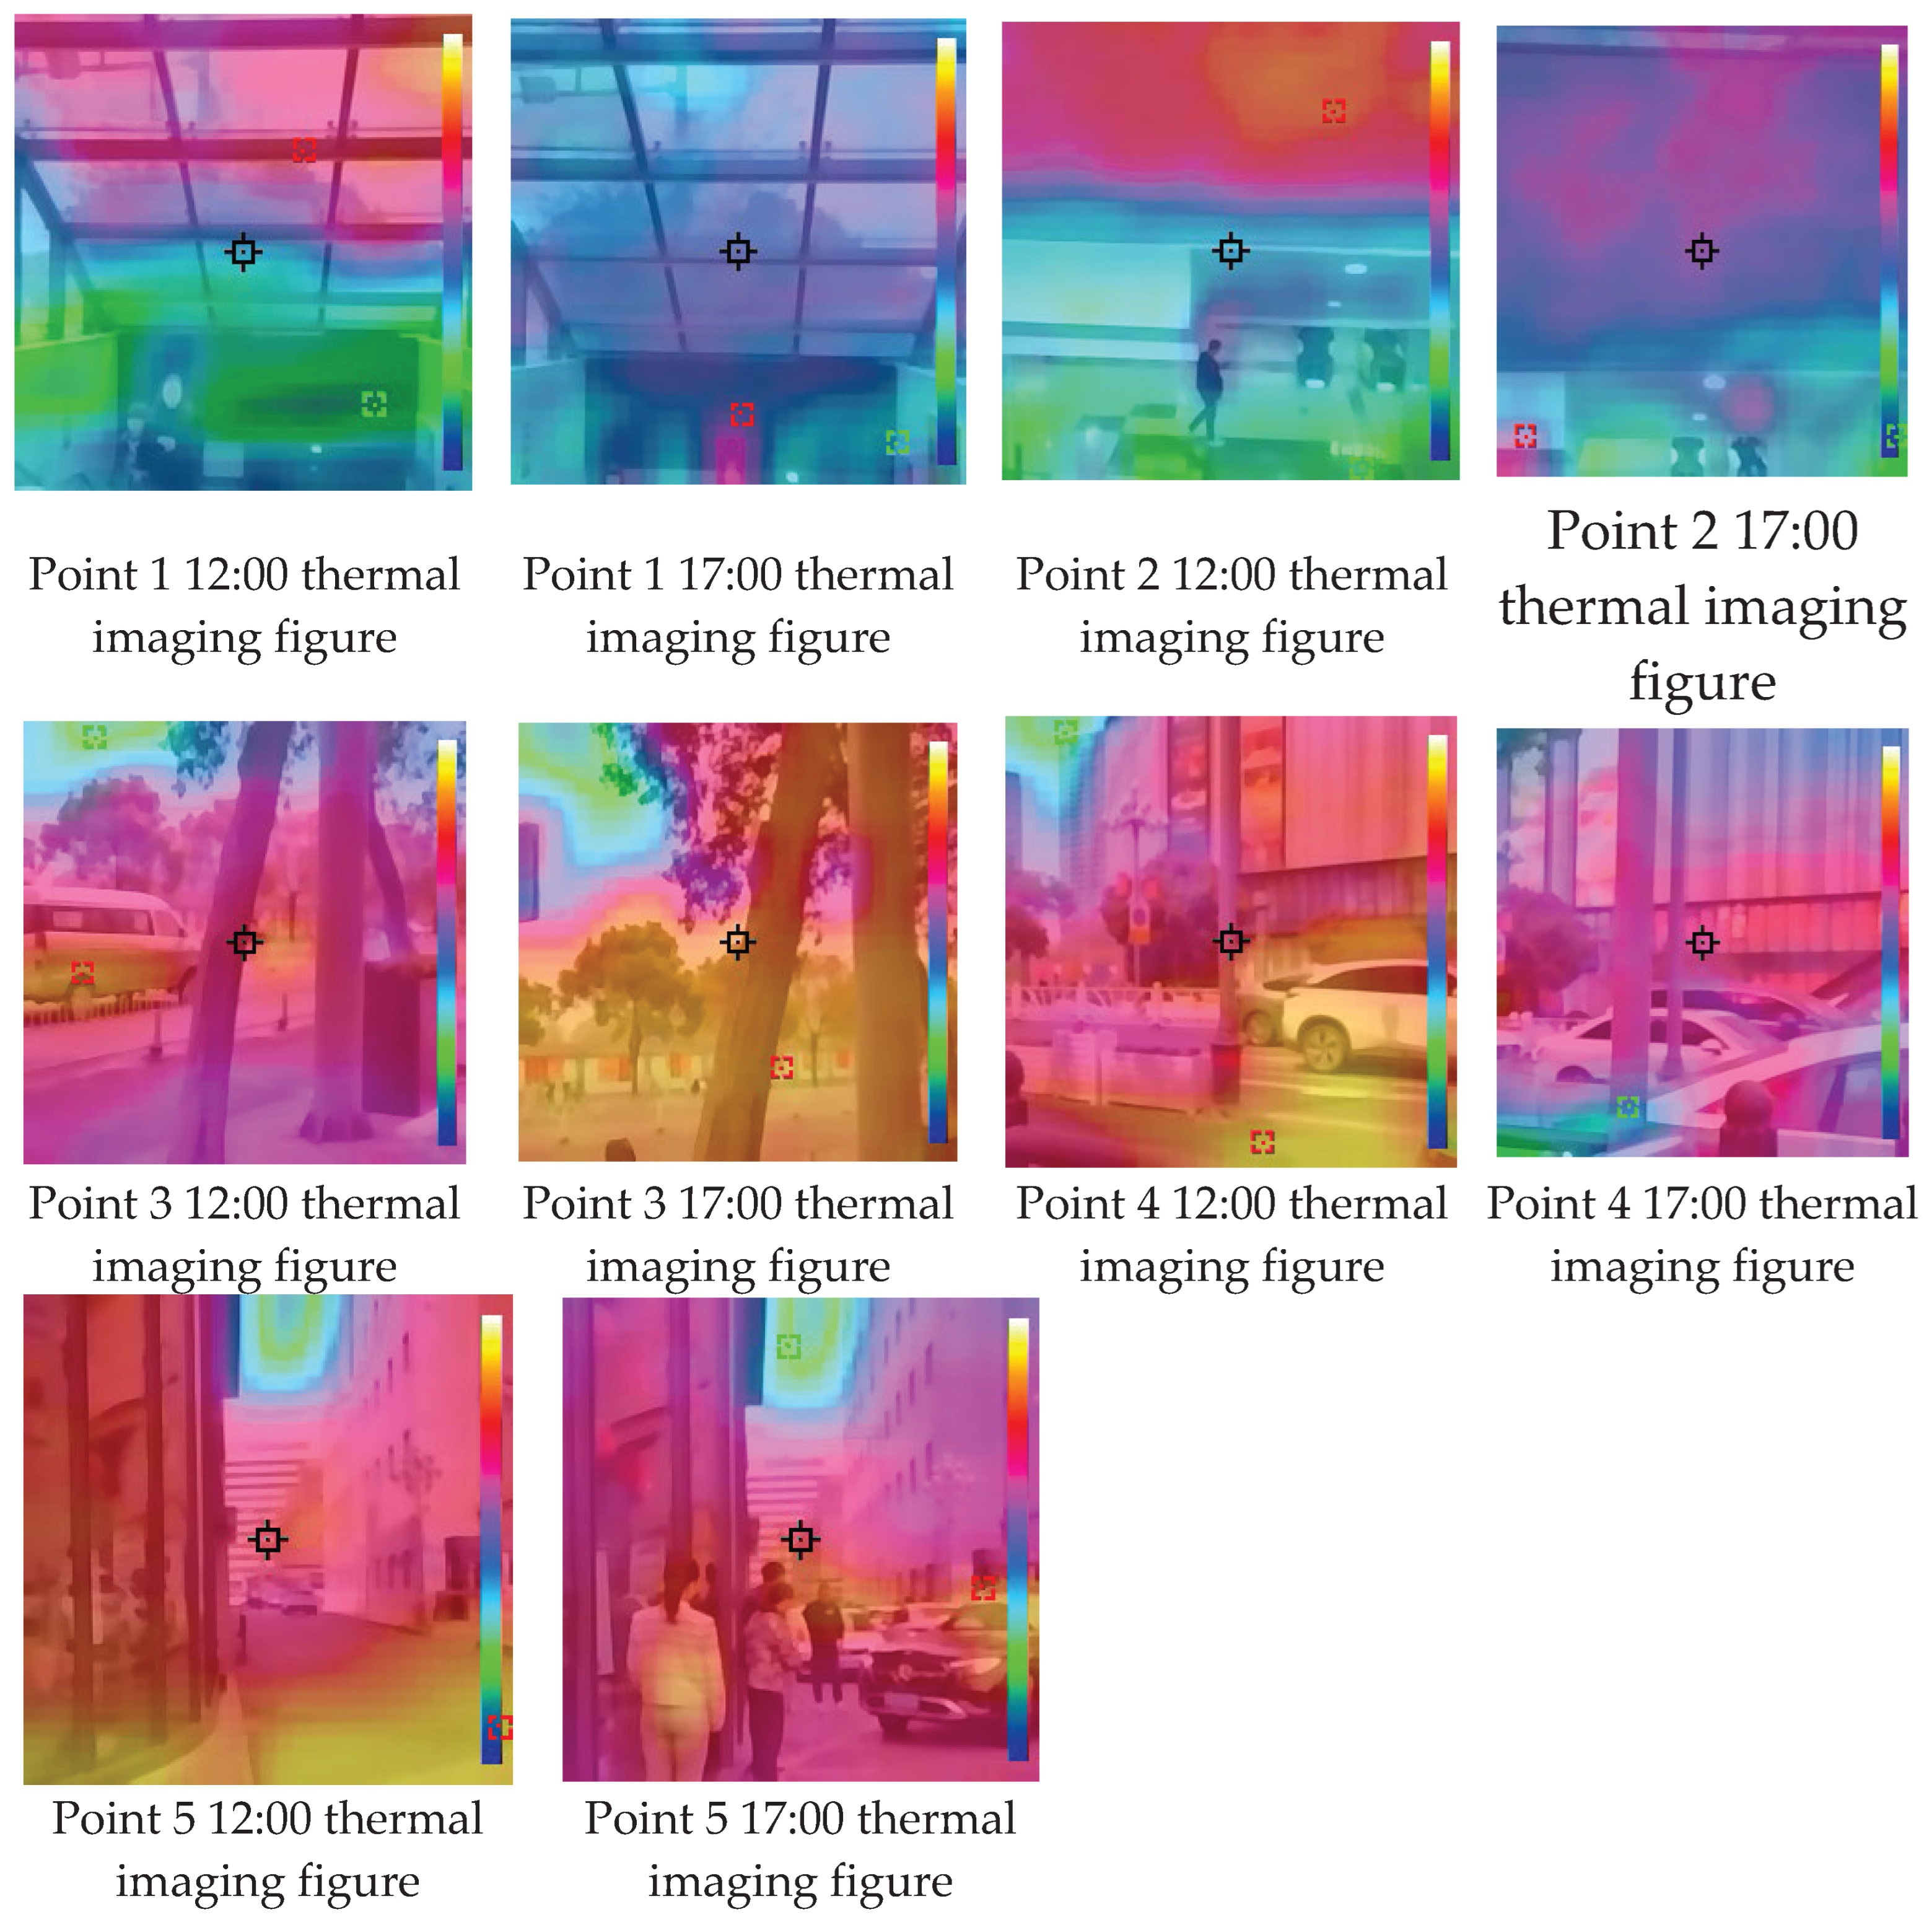
The wavelengths of the handheld thermal imager selected for this experiment ranged from 8 to 14. The thermal imaging data, as a longitudinal supplement to the ENVI-met software analysis, were essentially consistent with the data from the abovementioned ENVI-met images. However, at 12:00, the upper temperatures at measurement points 1 and 2 were higher than the lower temperatures, which might be due to the glass shielding plates at the entrances and exits of the underground commercial street. The following figure presents the thermal imaging images of five measurement points at 12:00.
To further evaluate human thermal perception around entrances and exits, this study combined PMV simulation of ENVI-met and onsite thermal imaging observations for a comprehensive analysis. The main input parameters of the PMV model were set as follows: human metabolic rate of 1.2 met (in a sedentary state), clothing thermal resistance of 0.8 clo (typical spring clothing), and mechanical work of 0. Owing to the lack of comprehensive radiation observation data, the average radiation temperature was approximately replaced by air temperature, which may have introduced a degree of uncertainty.
The PMV simulation results revealed that during the afternoon period from 12:00 to 14:00, the PMV values in the near-domains P1 and P2 of the entrance and exit were significantly higher than those in other areas, reaching 1.8 (slightly warm), thereby indicating that there was strong heat stress and poor thermal comfort in this area. This is closely related to the intense solar radiation, dense crowds and poor ventilation caused by the layout of the buildings during this period. In contrast, the PMV values at street valley center P4 and downwind P5 remained between 1.2 and 1.5 (with a slightly warm sensation), indicating a relatively good thermal environment.
Thermal imaging observations provide strong empirical support for the above simulation results. The image shows that at 12:00, the upper surface temperature of the P1 and P2 measurement points was significantly higher than that of the lower points, with the maximum difference in temperature reaching 3–4 °C. After analysis, this is mainly because the glass sunshades or canopies on the upper part of the entrance and exit absorbed shortwave solar radiation and converted it into longwave radiant heat, creating a “radiant heating” effect on the area below. This geothermal phenomenon was captured, to a certain extent, by the model, but owing to the simplification of the radiation exchange of complex shading components, the simulated PMV value may still underestimate the actual thermal sensation.
Notably, thermal imaging revealed that at 17:00, despite the weakening of solar radiation, the interior of point P2 still maintained a relatively high temperature. This indicates that the heat accumulated inside the underground commercial street in the afternoon was released slowly, resulting in a distinct “thermal lag” effect. This discovery has significant implications for the design of underground space entrances and exits. Accordingly, the use of high-reflectivity materials or enhanced ventilation to accelerate heat loss is recommended.
Figure 11.
PMV thermal comfort at 12:00 and 17:00. Simulation results of PMV thermal comfort. (a) PMV values at each monitoring point at 12:00. (b) PMV values at each monitoring point at 17:00.
Figure 11.
PMV thermal comfort at 12:00 and 17:00. Simulation results of PMV thermal comfort. (a) PMV values at each monitoring point at 12:00. (b) PMV values at each monitoring point at 17:00.
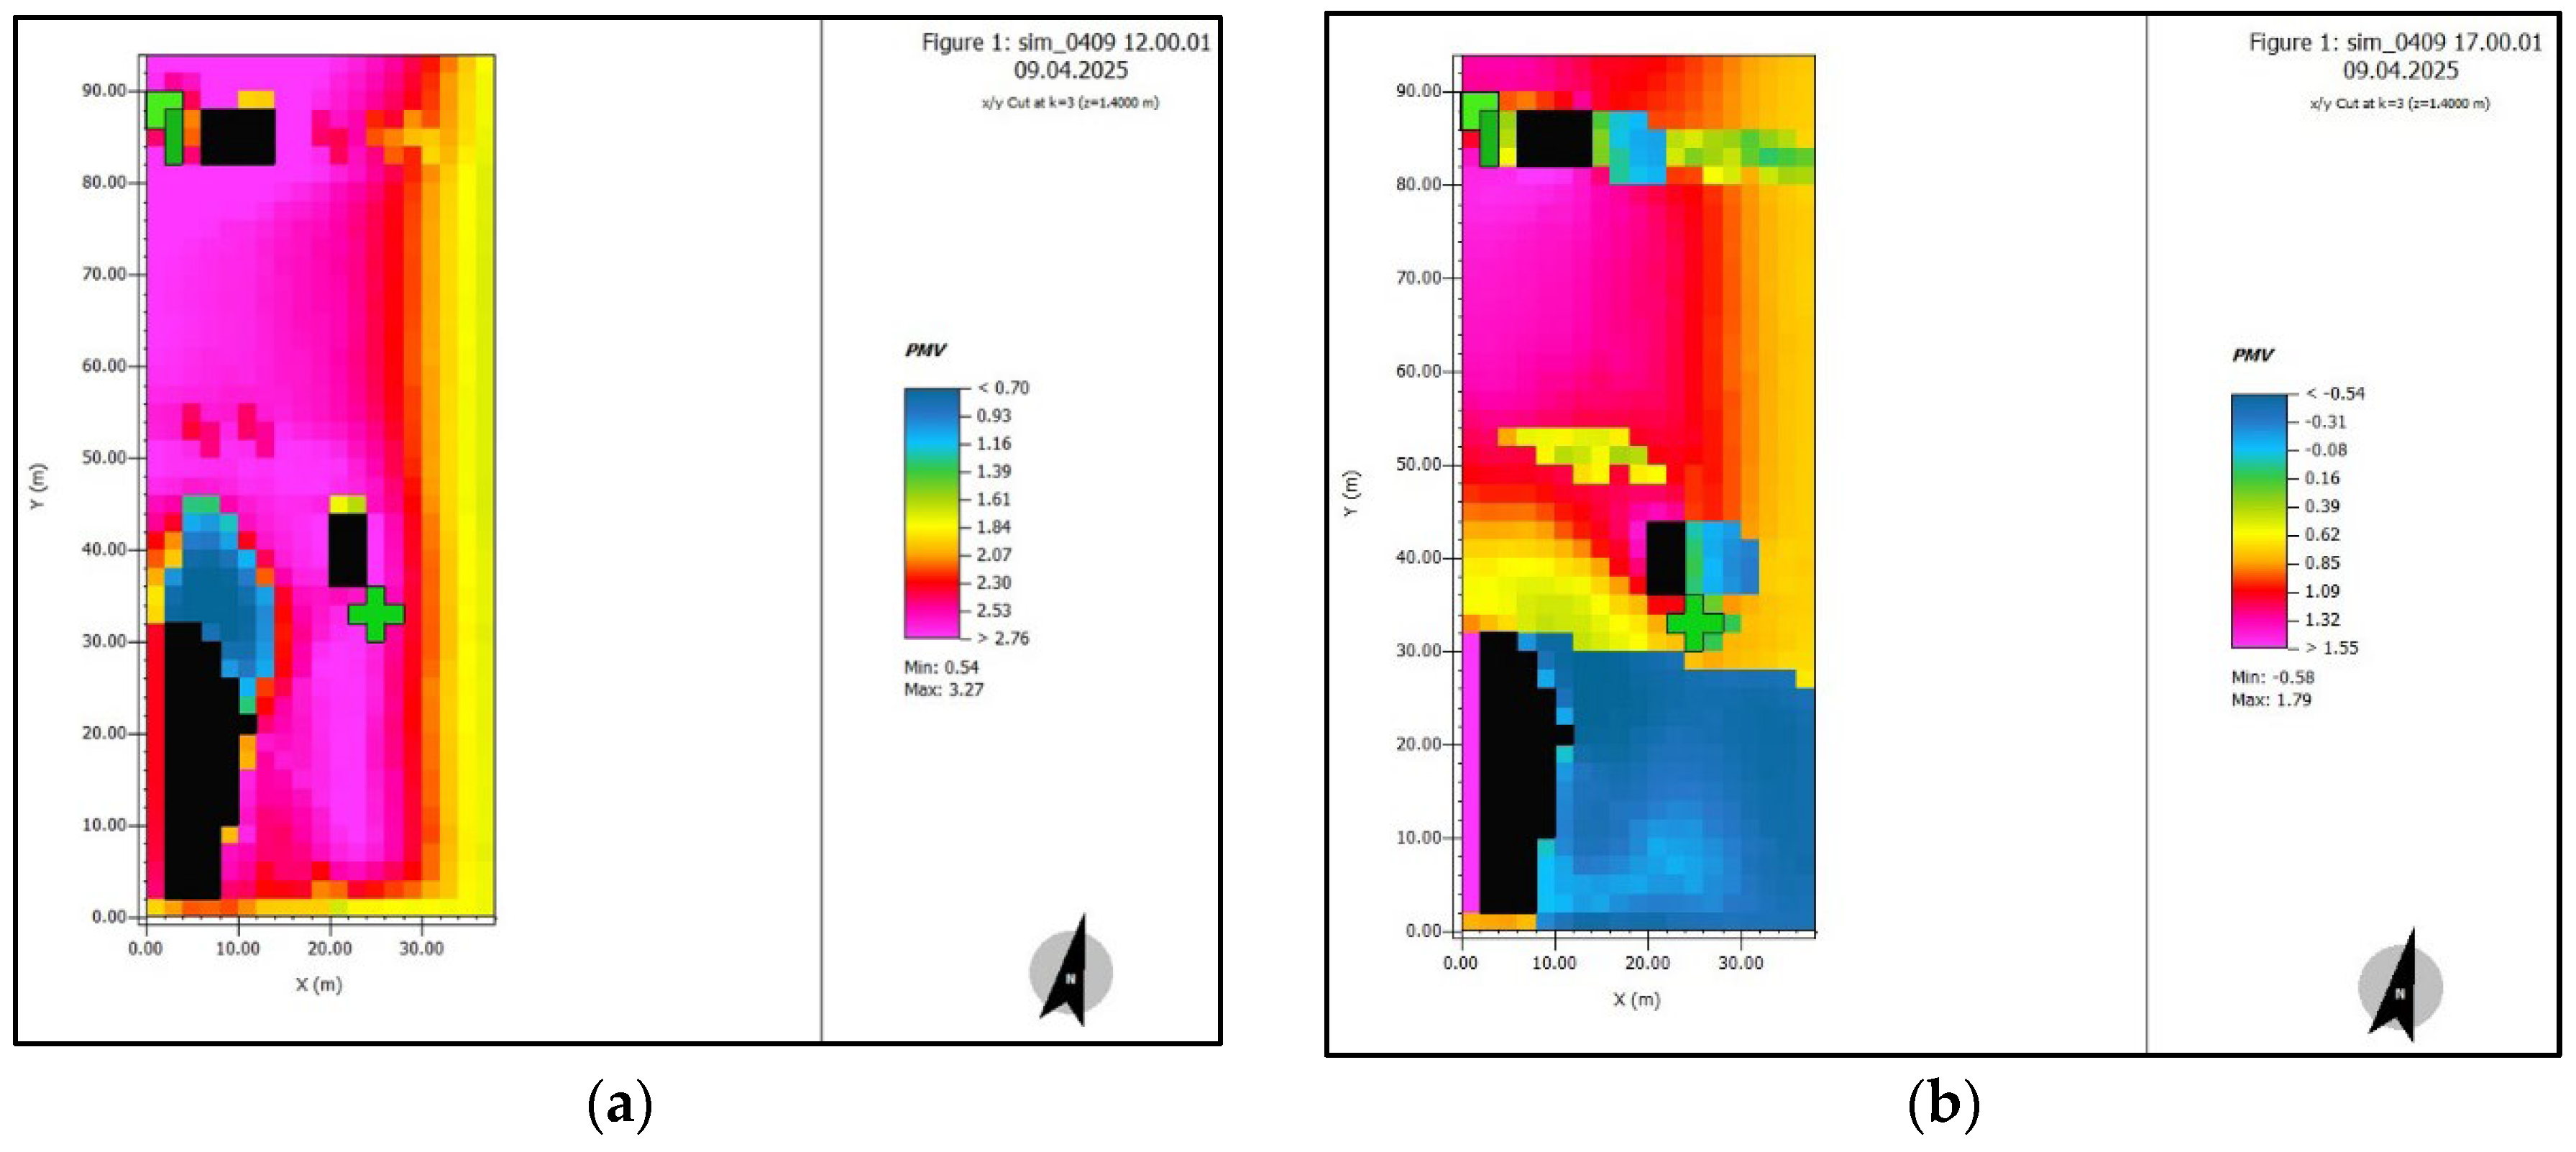
Figure 12.
Thermal images of measurement points at different times. Thermal imaging images of each measurement point at different times.
Figure 12.
Thermal images of measurement points at different times. Thermal imaging images of each measurement point at different times.
4. Comfort Optimization Strategies for the Entrances and Exits of Underground Commercial Streets
On the basis of the above research and analysis of the impact of the street valley space microclimate on the comfort level of underground commercial street entrances and exits in terms of measured data, ENVI-met analysis, and thermal imaging analysis, combined with the characteristics of the street valley microclimate, influencing factors of thermal comfort and numerical simulation results, the following optimization strategies are proposed.
4.1. Optimization of Street Valley Spatial Form
The optimization of the street valley spatial form can be achieved by reducing the height-to-width ratio (H/W) of the street valley to increase the amount of incident solar radiation in the bottom space, thereby increasing thermal comfort in winter, or by increasing the height-to-width ratio to enhance the shading effect and reduce radiative heat gain in summer. On the basis of the semi-open street valley studied in this paper, buildings can be appropriately added in the surrounding areas, so the shadow of the buildings’ façades can be used to block direct sunlight at noon, thereby improving the thermal comfort of pedestrians. However, the height-to-width ratio must be controlled between 0.8 and 1.0 to ensure that the entrances and exits receive sufficient sunlight while avoiding direct inflow of the northwest dominant wind. In the winter, the H/W ratio can be appropriately increased to reduce the penetration of cold air, whereas in the summer, shading can be used to reduce direct radiation. At the same time, continuous closed interfaces should be avoided, and staggered layouts or ventilation corridors should be adopted to increase air flow and reduce stagnant air areas and heat accumulation. The optimization of the street valley shape is presented in Figure 13 below.
The street valley shape can optimize the architectural interface and roof shape. By changing the air flow path through building terraces, inclined facades and arched roofs, the vortex or strong wind areas can be reduced. Additionally, installing overhanging eaves or deflector plates on the tops of buildings on both sides of the street valley to guide the main air flow toward the entrance and exit areas will enhance natural ventilation. Furthermore, a zigzag or recessed facade can be adopted to avoid the “canyon wind” effect caused by a single vertical interface. It is further recommended that the wind speed around the entrances and exits be balance and maintained between 1.5 and 2.5 m/s, which is within the range of human thermal comfort. The optimization of the architectural form is displayed in Figure 14 below.
Greenery and water bodies can also be introduced to regulate the microclimate. Because vegetation lowers the temperature of the air through transpiration, water evaporation absorbs heat. Simultaneously, greening blocks solar radiation and absorbs heat. Additionally, vertical greenery, such as climbing plants, green walls or rooftop gardens, can be established on both sides of the street valley and around the entrances and exits, to shield the west-exposed walls in summer. Shallow water pools, spray devices and small fountains can also be added near the outsides of the entrances and exits. Such measures can reduce the surrounding temperatures by 1-3 °C due to evaporation cooling. Notably, the layout should be combined with the overall landscape design so as to not affect the aesthetics, and attention should also be focused on avoiding excessive increases in humidity. It is also suggested that planting deciduous trees, such as paulownia and ginkgo, on both sides of the street valley can provide shade in summer and allow light to pass through in winter, balancing the heat comfort of the seasons. The street form optimization is presented in Figure 15 below.
4.2. Optimization of the Space Design of Entrances and Exits
For the optimization of the entrance and exit space design, the first considerations are shading and ventilation, which can be combined. For example, shading can be used to reduce radiant heat gain, and air flow can be guided through air-guiding devices to improve ventilation. Considering that the upper part of the entrances and exits of the underground commercial street in Yancheng is made of glass, according to the thermal imaging images, the temperature of the upper part is relatively high during the day. Adjustable sunshades, such as electric blinds and photovoltaic sunshades, should be installed above the entrances and exits as they can block direct sunlight from 9:00 to 16:00 in summer and be opened in winter to introduce sunlight. Furthermore, arc-shaped wind guide walls with heights of 1.8 to 2.5 m are set on both sides of the entrance and exit to guide the southeast wind in summer into the underground space and block the cold wind in winter at the same time. This design uses a composite structure of shading and greening, such as a pergola-style green plant corridor, which combines the effects of shading, cooling and aesthetics.
Moreover, the size and opening method of the entrances and exits can also be optimized by regulating the speed and direction of the airflow through spatial scale and opening the exits and entrances to avoid overdraft or insufficient ventilation. The widths of the entrances and exits should be expanded, and the depth should be shortened to reduce air flow blockage and form a “through-wind” channel. For example, an outward-expanding opening can be used and combined with ground paving diversion lines to guide natural wind into the underground space.
Attention can also be given to the surface materials and surface treatment as the surface temperature can be regulated through the thermal physical properties of building materials. Furthermore, paving the ground in the street valley with high-reflectivity materials will reduce the absorption of solar radiation. These measures will lower the surface temperatures by 5 to 8 °C. The facades of the entrances and exits should use materials with low thermal conductivity, and the ceiling of the underground space entrances should be made of light-colored metal, as in the underground commercial street in Yancheng.
Plates or glass can be used to reduce the heat radiation from the top to the bottom after absorbing heat, as shown in the optimization of the entrance and exit shape in Figure 16 below.
5. Conclusions
This study integrates field measurements with ENVI-met simulations to investigate the microclimate and thermal comfort conditions in a semi-open street canyon adjacent to an underground commercial street entrance in a hot summer/cold winter region. The main findings are summarized as follows:
(1) The aspect ratio (H/W) of the street canyon plays a crucial role in thermal performance. While a ratio between 0.5 and 1.0 effectively balances summer shading and winter solar access and lower values fail to block direct summer radiation, higher ratios complicate wind pressure distributions and reduce ventilation efficiency, thereby impairing thermal comfort.
(2) A length-to-width ratio between 1 and 2 is optimal for north–south oriented streets, facilitating both solar exposure and ventilation. Smaller ratios promote airflow along building edges, aiding heat dissipation in summer and reducing cold wind intrusion in winter. Excessive ratios diminish cross-ventilation effects and hinder thermal environment optimization.
(3) The continuity of building interfaces helps stabilize airflow and provides shade, but excessive continuity or fragmentation can weaken wind channel effects. A combination of strip and point-type buildings can create local pressure differences, enhance air exchange, and improve wind speed and temperature stability. These measures, coupled with greening and water features, significantly improve thermal comfort in street canyons.
(4) In high-density urban blocks, a slight southward orientation of street layouts can facilitate the penetration of summer breezes and mitigate winter northerly winds. The placement of heat sources should avoid the formation of heat islands, thereby enhancing microclimatic comfort under winter wind conditions.
Author Contributions
Conceptualization, Dongqing Zhong, Yancui Gao and Jingnan Xu; methodology, Yancui Gao; software, Jingnan Xu; validation, Yancui Gao, Ziye Liu and Jingnan Xu; formal analysis, Jingnan Xu and Yancui Gao; investigation, Jingnan Xu and Yancui Gao; resources, Dongqing Zhong and Lingxiang Wei and Tian Li; data curation, Jingnan Xu and Lei Yao; writing—original draft preparation, Yancui Gao; writing—review and editing, Lingxiang Wei and Dongqing Zhong; visualization, Jingnan Xu; supervision, Jingnan Xu; project administration, Dongqing Zhong; funding acquisition, Lingxiang Wei and Tian Li . All authors have read and agreed to the published version of the manuscript.
Funding
The authors would like to thank the anonymous referees and the editor of this journal. This work was supported by Shandong Provincial Natural Science Foundation [grant numbers ZR2025QC746 and ZR2025QC774], National Natural Science Foundation of China (NNSFC) [Grant No. 52378083], Natural Science Foundation of Jiangsu Province [Grant No. BK20231488], The Mount Tai Industry Leading Talent Project Special Fund Support [Grant No. tscx202312018], and Jinan City’s Self-Developed Innovative Team Project for Higher Educational Institutions [grant number 20233040].
Data Availability Statement
The raw data supporting the findings of this study are not publicly available due to. However, processed data supporting the conclusions are available from the corresponding author upon reasonable request.
Acknowledgments
During the preparation of this study, the authors used Origin software and DeepSeek software for the purposes of optimizing figures and improving language. The authors have reviewed and edited the output and take full responsibility for the content of this publication. The authors declare no conflicts of interest. The funders had no role in the design of the study; in the collection, analyses, or interpretation of data; in the writing of the manuscript; or in the decision to publish the results.
References
- Zhao Huihui, Xu Genyu, Shi Yurong, etc Dynamic thermal experiences of pedestrians in high-density urban streets and valleys in humid and hot regions [J]. Building Science, 2025, 41 (06): 245-256+263.
- Jiang L, Du S, Liu S, et al. Effects of Morphological Factors on Thermal Environment and Thermal Comfort in Riverside Open Spaces of Shanghai, China[J]. Land, 2025, 14(2): 433. [CrossRef]
- Liu Heng, Zhou Fengyue, Ji Xiang Research on the Impact of Contemporary Urban Submerged Square Space Form on Human Thermal Comfort [J]. Modern Urban Research, 2025, (03): 68-75.
- Wang, M.; Zhang, C.; Wang, S.; Wang, H.; Chen, Q.; Xu, S.; He, B. Sensitivity of Human Thermal Comfort Benchmarks to Background Temperature and Individual Factors: An Empirical Study in Wuhan, China. Buildings 2025, 15, 3037. [CrossRef]
- Zhou Hongxuan, Han Miaomiao, Zhou Tong, etc Research on the Impact of Urban Street Valley Distribution Pattern on the Diffusion of Traffic Pollutants [J]. Environmental Science and Management, 2025, 50 (01): 33-38.
- Park, K.; Jun, C.; Baik, J.; Kim, H.-J. Urban Canyon Design with Aspect Ratio and Street Tree Placement for Enhanced Thermal Comfort: A Comprehensive Thermal Comfort Assessment Accounting for Gender and Age in Seoul, Republic of Korea. Buildings 2024, 14, 2517. [CrossRef]
- Li Suhua, Su Xiaochao, Zhao Xudong, etc Research on Optimization of Soil Cover Depth in Underground Spaces of Residential Areas Based on Outdoor Microclimate Evaluation [J]. Environmental Science and Management, 2023, 48 (12): 40-45.
- Coma J,Pérez G,Gracia D A, et al. Vertical greenery systems for energy savings in buildings: A comparative study between green walls and green facades[J].Building and Environment,2017,111, 228-237. [CrossRef]
- Hao X,Xing Q,Long P, et al. Influence of vertical greenery systems and green roofs on the indoor operative temperature of air-conditioned rooms[J]. Journal of Building Engineering,2020,31101373-101373. [CrossRef]
- Zhong Jiading, Liu Jianlin, Xu Yueli, etc Assessment of the Impact of Plants on Pedestrian Wind Environment in Pocket Park [J]. Building Energy Efficiency (Chinese and English), 2021, 49 (12): 132-138.
- Du Xiaohan, Chen Dong, Wu Jie, etc The influence of geometric shape and greening of street valleys on summer thermal environment [J]. Building Science, 2012, 28 (12): 94-99.
- Zhou, Z.; Wang, P.; Deng, J.; Ouyang, C.; Xu, Y.; Jiang, W.; Ma, K. Numerical Simulation of Street Canyon Morphology and Microclimate in Hot Summer and Cold Winter Zone. Buildings 2023, 13, 2433. [CrossRef]
- Xiong N,Song H,Zhou F, et al. Simulation of Microclimate and PM2.5 Dispersion in Typical Urban Parks in Beijing Based on the ENVI-Met Model[J]. Sustainability,2025,17(16):7247-7247. [CrossRef]
- Yan D,Xu L,Wang Q, et al. Quantifying Landscape Effects on Urban Park Thermal Environments Using ENVI-Met and 3D Grid Profile Analysis[J]. Forests,2025,16(7):1085-1085. [CrossRef]
- Ma X,Zeng T,Zhang M, et al. Street microclimate prediction based on Transformer model and street view image in high-density urban areas[J]. Building and Environment,2025,269112490-112490. [CrossRef]
- Zhao W,Hu Q,Bao A. The Influence of the Spatial Morphology of Township Streets on Summer Microclimate and Thermal Comfort[J]. Buildings,2024,14(11):3616-3616. [CrossRef]
- Lyu Y,Zhang L,Liu X, et al. Microclimate-Adaptive Morphological Parametric Design of Streets and Alleys in Traditional Villages[J]. Buildings,2024,14(1): 152. [CrossRef]
- Tara H,Norhaslina H,Amirhosein G. Evaluation of microclimate mitigation strategies in a heterogenous street canyon in Kuala Lumpur from outdoor thermal comfort perspective using Envi-met[J]. Urban Climate,2023,52:101719. [CrossRef]
- YouJoung K,Seonju J,Bae K K. Impact of urban microclimate on walking volume by street type and heat-vulnerable age groups: Seoul’s IoT sensor big data[J].Urban Climate,2023,51:101658. [CrossRef]
- Liu J,Tang H,Zheng B, et al. A Study on the Summer Microclimate Environment of Public Space and Pedestrian Commercial Streets in Regions with Hot Summers and Cold Winters[J]. Applied Sciences,2023,13(9):5263. [CrossRef]
- Yongling Z,Haiwei L,Ronita B, et al. The time-evolving impact of tree size on nighttime street canyon microclimate: Wind tunnel modeling of aerodynamic effects and heat removal[J]. Urban Climate,2023,49:101528. [CrossRef]
- Peng C,Jinjian J,Jie Z, et al. Effect of street design on UHI and energy consumption based on vegetation and street aspect ratio: Taking Harbin as an example[J]. Sustainable Cities and Society,2023,92:104484. [CrossRef]
- Nikolaos S,Apostolos P,Aristotelis V. Improving the Climate Resilience of Urban Road Networks: A Simulation of Microclimate and Air Quality Interventions in a Typology of Streets in Thessaloniki Historic Centre[J]. Land,2023,12(2):414-414. [CrossRef]
- Xing Z,Liutao C,Jiachuan Y. Simulation framework for early design guidance of urban streets to improve outdoor thermal comfort and building energy efficiency in summer[J]. Building and Environment,2023,228:109815. [CrossRef]
- Rishika S,R.K. P,M.K. G. Urban physics and outdoor thermal comfort for sustainable street canyons using ANN models for composite climate[J]. Alexandria Engineering Journal,2022,61(12):10871-10896. [CrossRef]
- Xiaona Z,Wentao H,Shuang L, et al. Effects of vertical greenery systems on the spatiotemporal thermal environment in street canyons with different aspect ratios: A scaled experiment study.[J]. The Science of the total environment,2022,859(P2):160408-160408. [CrossRef]
- Jian H,Guanwen C. Experimental study of urban microclimate on scaled street canyons with various aspect ratios[J]. Urban Climate,2022,46:101299. [CrossRef]
- Ricard S,Scott E K,Alberto M, et al. How do street trees affect urban temperatures and radiation exchange? Observations and numerical evaluation in a highly compact city[J]. Urban Climate,2022,46:101288. [CrossRef]
- Rick H,Aniss I,Pascal R D, et al. The Environment in the Lead: A Scorecard System to Assess Adaptation Measures and Score Ecosystem Services at the Street Level[J]. Sustainability,2022,14(19):12425-12425. [CrossRef]
- J. G,M. L,J. R, et al. High-fidelity simulation of the effects of street trees, green roofs and green walls on the distribution of thermal exposure in Prague-Dejvice[J]. Building and Environment,2022,223:109484. [CrossRef]
- Hyoungsub K,Woong S K,Yongjun J, et al. Findings from a field study of urban microclimate in Korea using mobile meteorological measurements[J]. Open House International,2022,47(3):473-493. [CrossRef]
- Sung, W.-P.; Huang, C.-S.; Wang, P.-T.; Yang, M.-Y. Integrating AI Generation and CFD Simulation in Coastal Hospital Landscape Design: A Case Study of Penghu, Taiwan. Buildings 2025, 15, 3283. [CrossRef]
- Khan, Z.; Ghiai, M. Enhancing Outdoor Environmental Comfort: A Review of Façade-Surface Strategies and Microclimate Impacts. Buildings 2025, 15, 2829. [CrossRef]
- Krstić, H.; Ranđelović, D.; Jovanović, V.; Mančić, M.; Stoiljković, B. Contribution of Glazed Additions as Passive Elements of the Reduction in Energy Consumption in Detached Houses. Buildings 2025, 15, 2715. [CrossRef]
- Tao, X.; Liang, X.; Liu, W. Climate-Adaptive Architecture: Analysis of the Wei Family Compound’s Thermal–Ventilation Environment in Ganzhou, China. Buildings 2025, 15, 2673. [CrossRef]
- Zhangabay, N.; Zhangabay, A.; Akmalaiuly, K.; Utelbayeva, A.; Duissenbekov, B. Assessment of Aerodynamic Properties of the Ventilated Cavity in Curtain Wall Systems Under Varying Climatic and Design Conditions. Buildings 2025, 15, 2637. [CrossRef]
- Liu, C.; Fang, Y.; Shi, Y.; Wang, M.; Han, M.; Chen, X. Impact of the Mean Radiant Temperature (Tmrt) on Outdoor Thermal Comfort Based on Urban Renewal: A Case Study of the Panjiayuan Antique Market in Beijing, China. Buildings 2025, 15, 2398. [CrossRef]
- Zhang, D.; Liu, G.; Kang, K.; Chen, X.; Sun, S.; Xie, Y.; Lin, B. Quantifying Thermal Demand in Public Space: A Pedestrian-Weighted Model for Outdoor Thermal Comfort Design. Buildings 2025, 15, 2156. [CrossRef]
- Xu, Z.; Wu, H.; Han, C.; Chang, J. Research on the Method of Automatic Generation and Multi-Objective Optimization of Block Spatial Form Based on Thermal Comfort Demand. Buildings 2025, 15, 2098. [CrossRef]
- Chu, Y.; Cui, J.; Sun, J.; Guo, W. Research on Pedestrian Vitality Optimization in Creative Industrial Park Streets Based on Spatial Accessibility: A Case Study of Qingdao Textile Valley. Buildings 2025, 15, 1679. [CrossRef]
- Gomaa, M.M.; Nabil, J.; Berkouk, D.; Ragab, A. A Comparative Study of Vegetation Strategies for Outdoor Thermal Comfort in High- and Low-Density Urban Areas. Urban Sci. 2025, 9, 416. [CrossRef]
- Chen, P.; Nie, L.; Kang, J.; Liu, H. Research on the Influence of Open Underground Space Entrance Forms on the Microclimate: A Case Study in Xuzhou, China. Buildings 2024, 14, 554. [CrossRef]
- Zhao, W.; Hu, Q.; Bao, A. The Influence of the Spatial Morphology of Township Streets on Summer Microclimate and Thermal Comfort. Buildings 2024, 14, 3616. [CrossRef]
- Xiong, N.; Song, H.; Zhou, F.; Yan, Y.; Jia, J.; Li, Q.; Liu, D.; Wang, J. Simulation of Microclimate and PM2.5 Dispersion in Typical Urban Parks in Beijing Based on the ENVI-Met Model. Sustainability 2025, 17, 7247. [CrossRef]
- Liu, J.; Tang, H.; Zheng, B.; Sun, Z. A Study on the Summer Microclimate Environment of Public Space and Pedestrian Commercial Streets in Regions with Hot Summers and Cold Winters. Appl. Sci. 2023, 13, 5263. [CrossRef]
- Silverberg, J.; Gad, D.R.; Luger, T.; et al. Differential impact of atopic eczema by age of onset: findings from the “Scars of Life”. Journal of the American Academy of Dermatology 2025,93 (3S): AB172-AB172. [CrossRef]
- Al-Khawaja, S., & Asfour, O. S. (2024). The impact of COVID-19 on the importance and use of public parks in Saudi Arabia. Ain Shams Engineering Journal, 15, Article 102286. [CrossRef]
- Nascimento, S.D.A.; Silva, D.A.V.L.; Lisboa, N.A.M.; et al. How do visitors perceive the urban greenery microclimate in the city’s only green space? A case study in Brazilian semi-arid. Environmental Development 2025, 56, 101244. [CrossRef]
- Zhou, J.; Guo, C.; Hu, M.; et al. How did plant communities impact microclimate and thermal comfort in city green space: a case study in Zhejiang Province, China. Atmosphere 2025, 16, 390. [CrossRef]
- Li, Q.; Li, Q.; Peng, H.; et al. Study on the effect of vertical structure of urban green spaces on microclimate in Guangzhou through a full-year numerical simulation. Landscape and Urban Planning 2025, 260, 105370. [CrossRef]
- Tian, F.; Huang, T.; Huang, W. Multi-objective optimization of residential block space morphology in Xingtai City under energy-saving orientation. Buildings 2025, 15, 1028. [CrossRef]
Figure 3.
Street Valley Measurement. Displays distribution of measuring points 1–5 for data collection.
Figure 3.
Street Valley Measurement. Displays distribution of measuring points 1–5 for data collection.
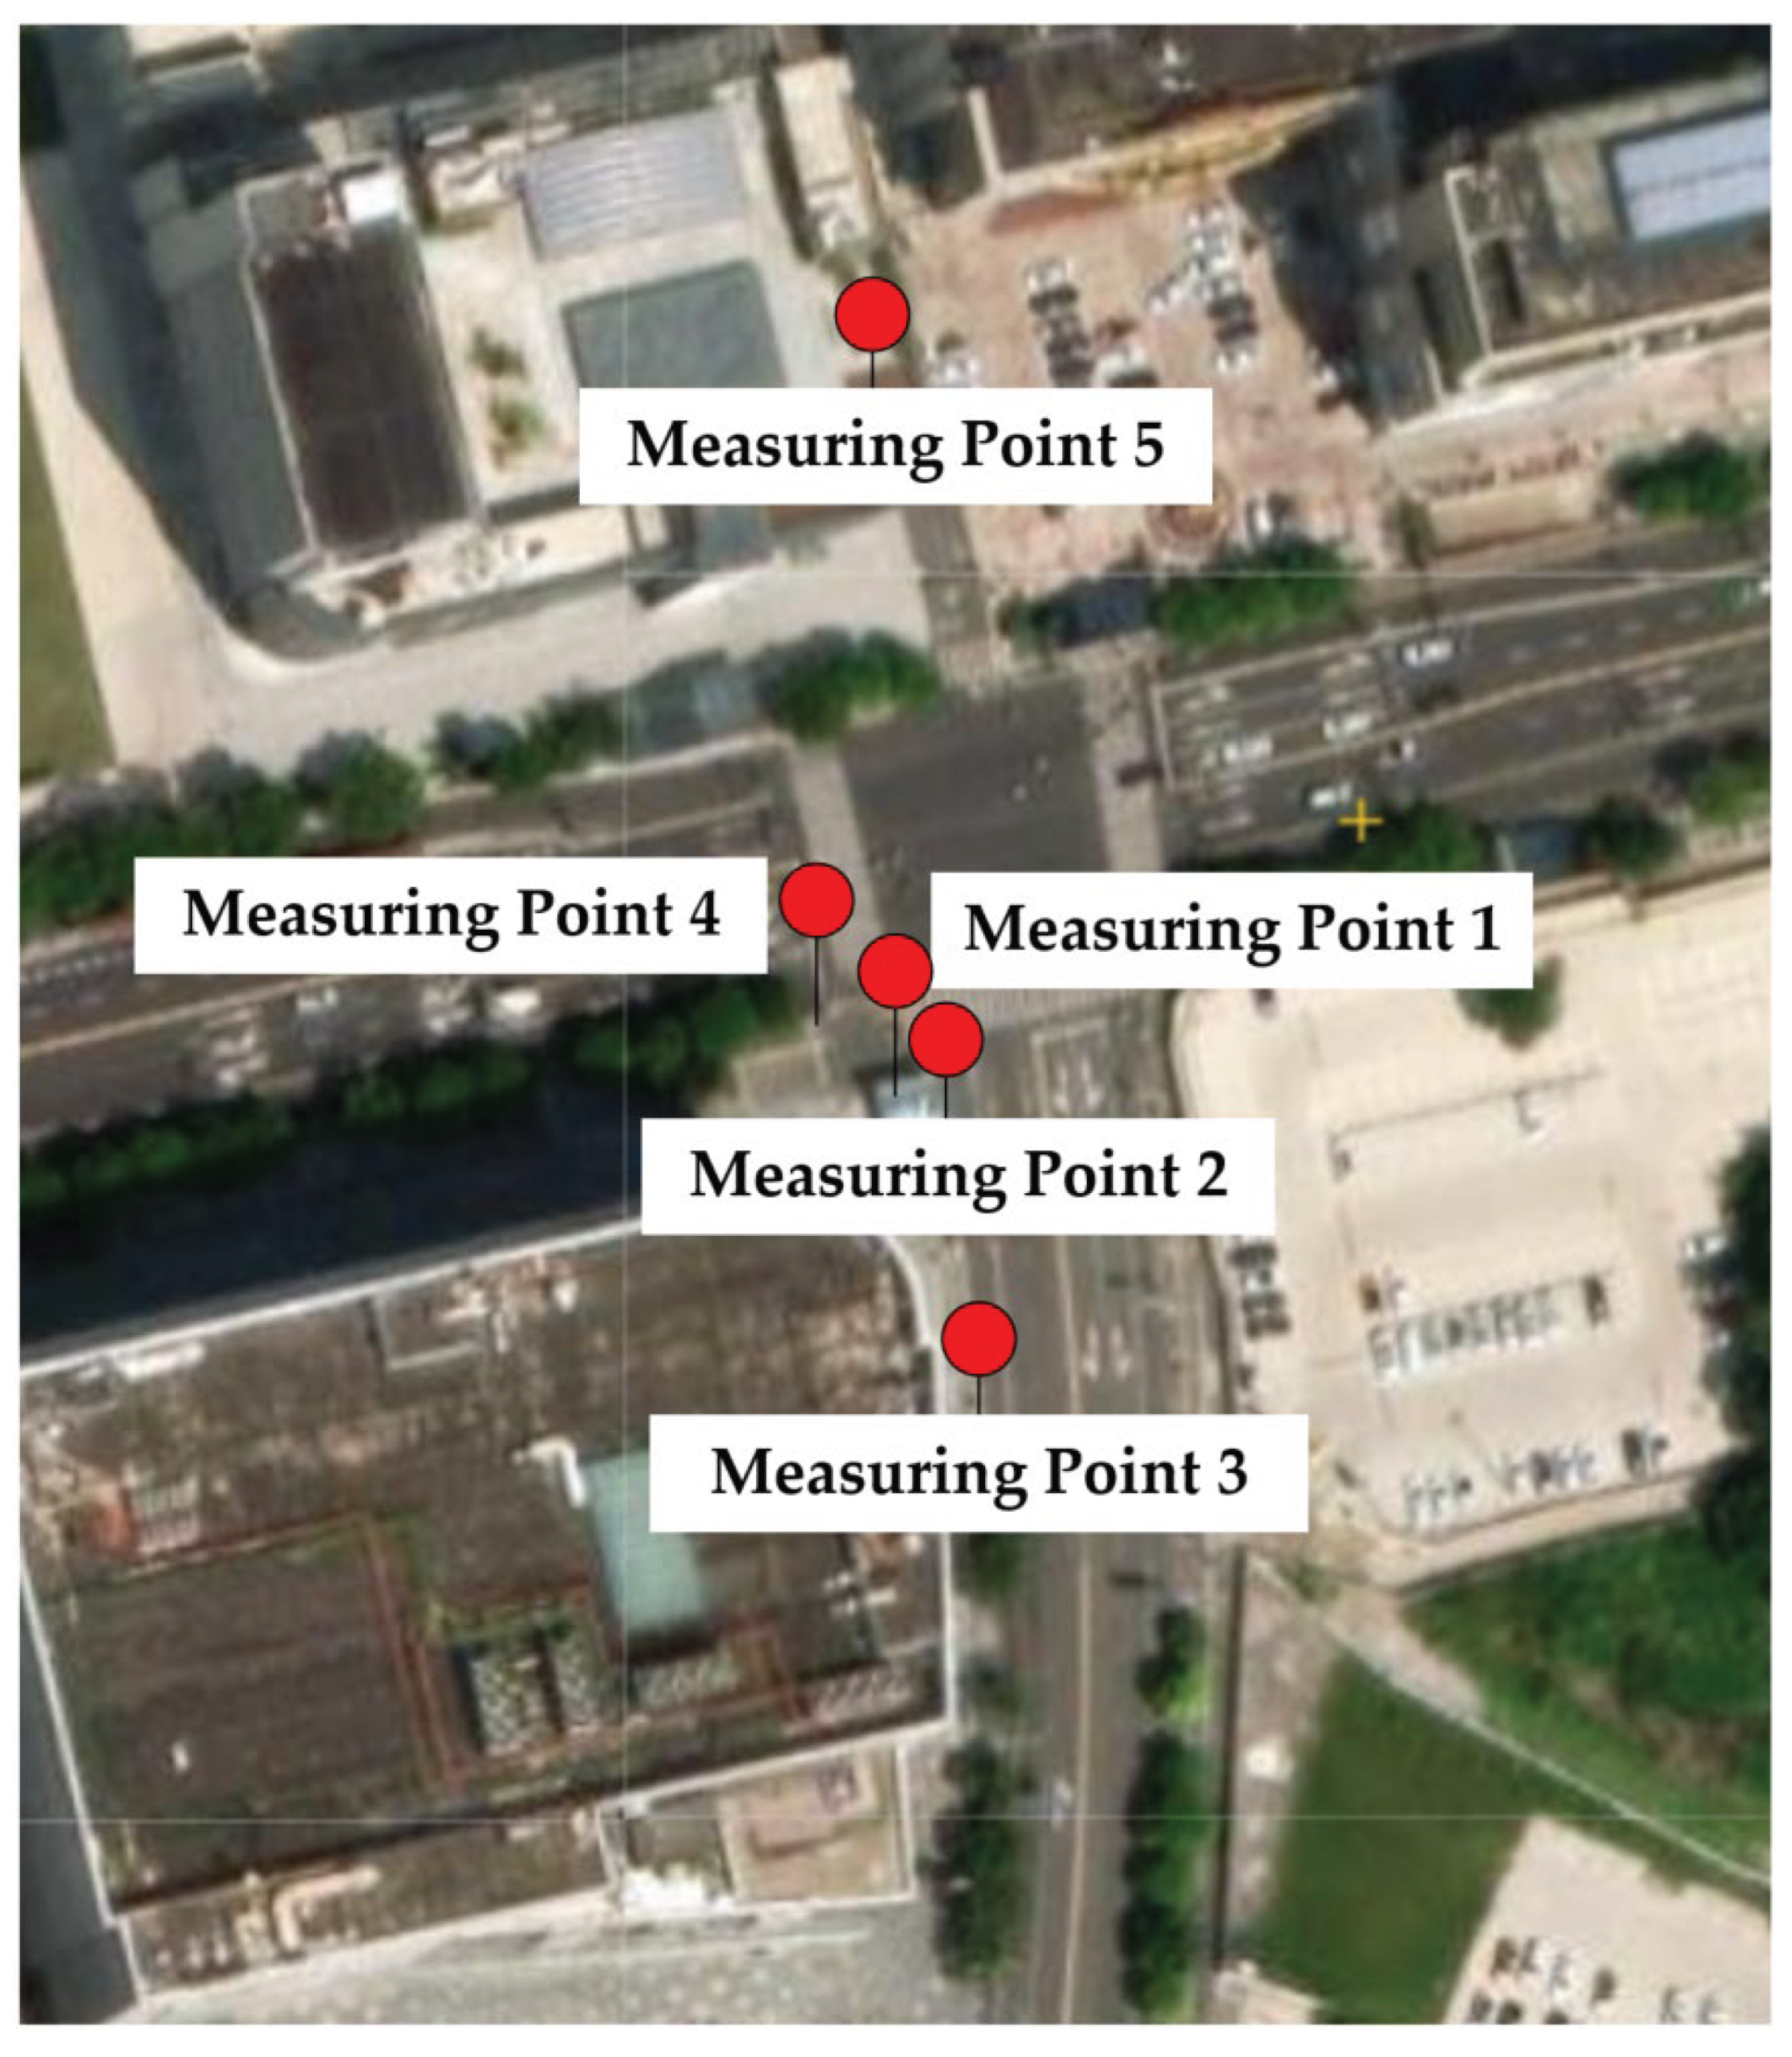
Figure 4.
The measured data on April 9th. (a) Hourly variation of air temperature from 7:00 to 18:00. (b) Hourly variation of relative humidity from 7:00 to 18:00. (c) Hourly variation of wind speed from 7:00 to 18:00. (d) Hourly variation of CO2 concentration from 7:00 to 18:00.
Figure 4.
The measured data on April 9th. (a) Hourly variation of air temperature from 7:00 to 18:00. (b) Hourly variation of relative humidity from 7:00 to 18:00. (c) Hourly variation of wind speed from 7:00 to 18:00. (d) Hourly variation of CO2 concentration from 7:00 to 18:00.
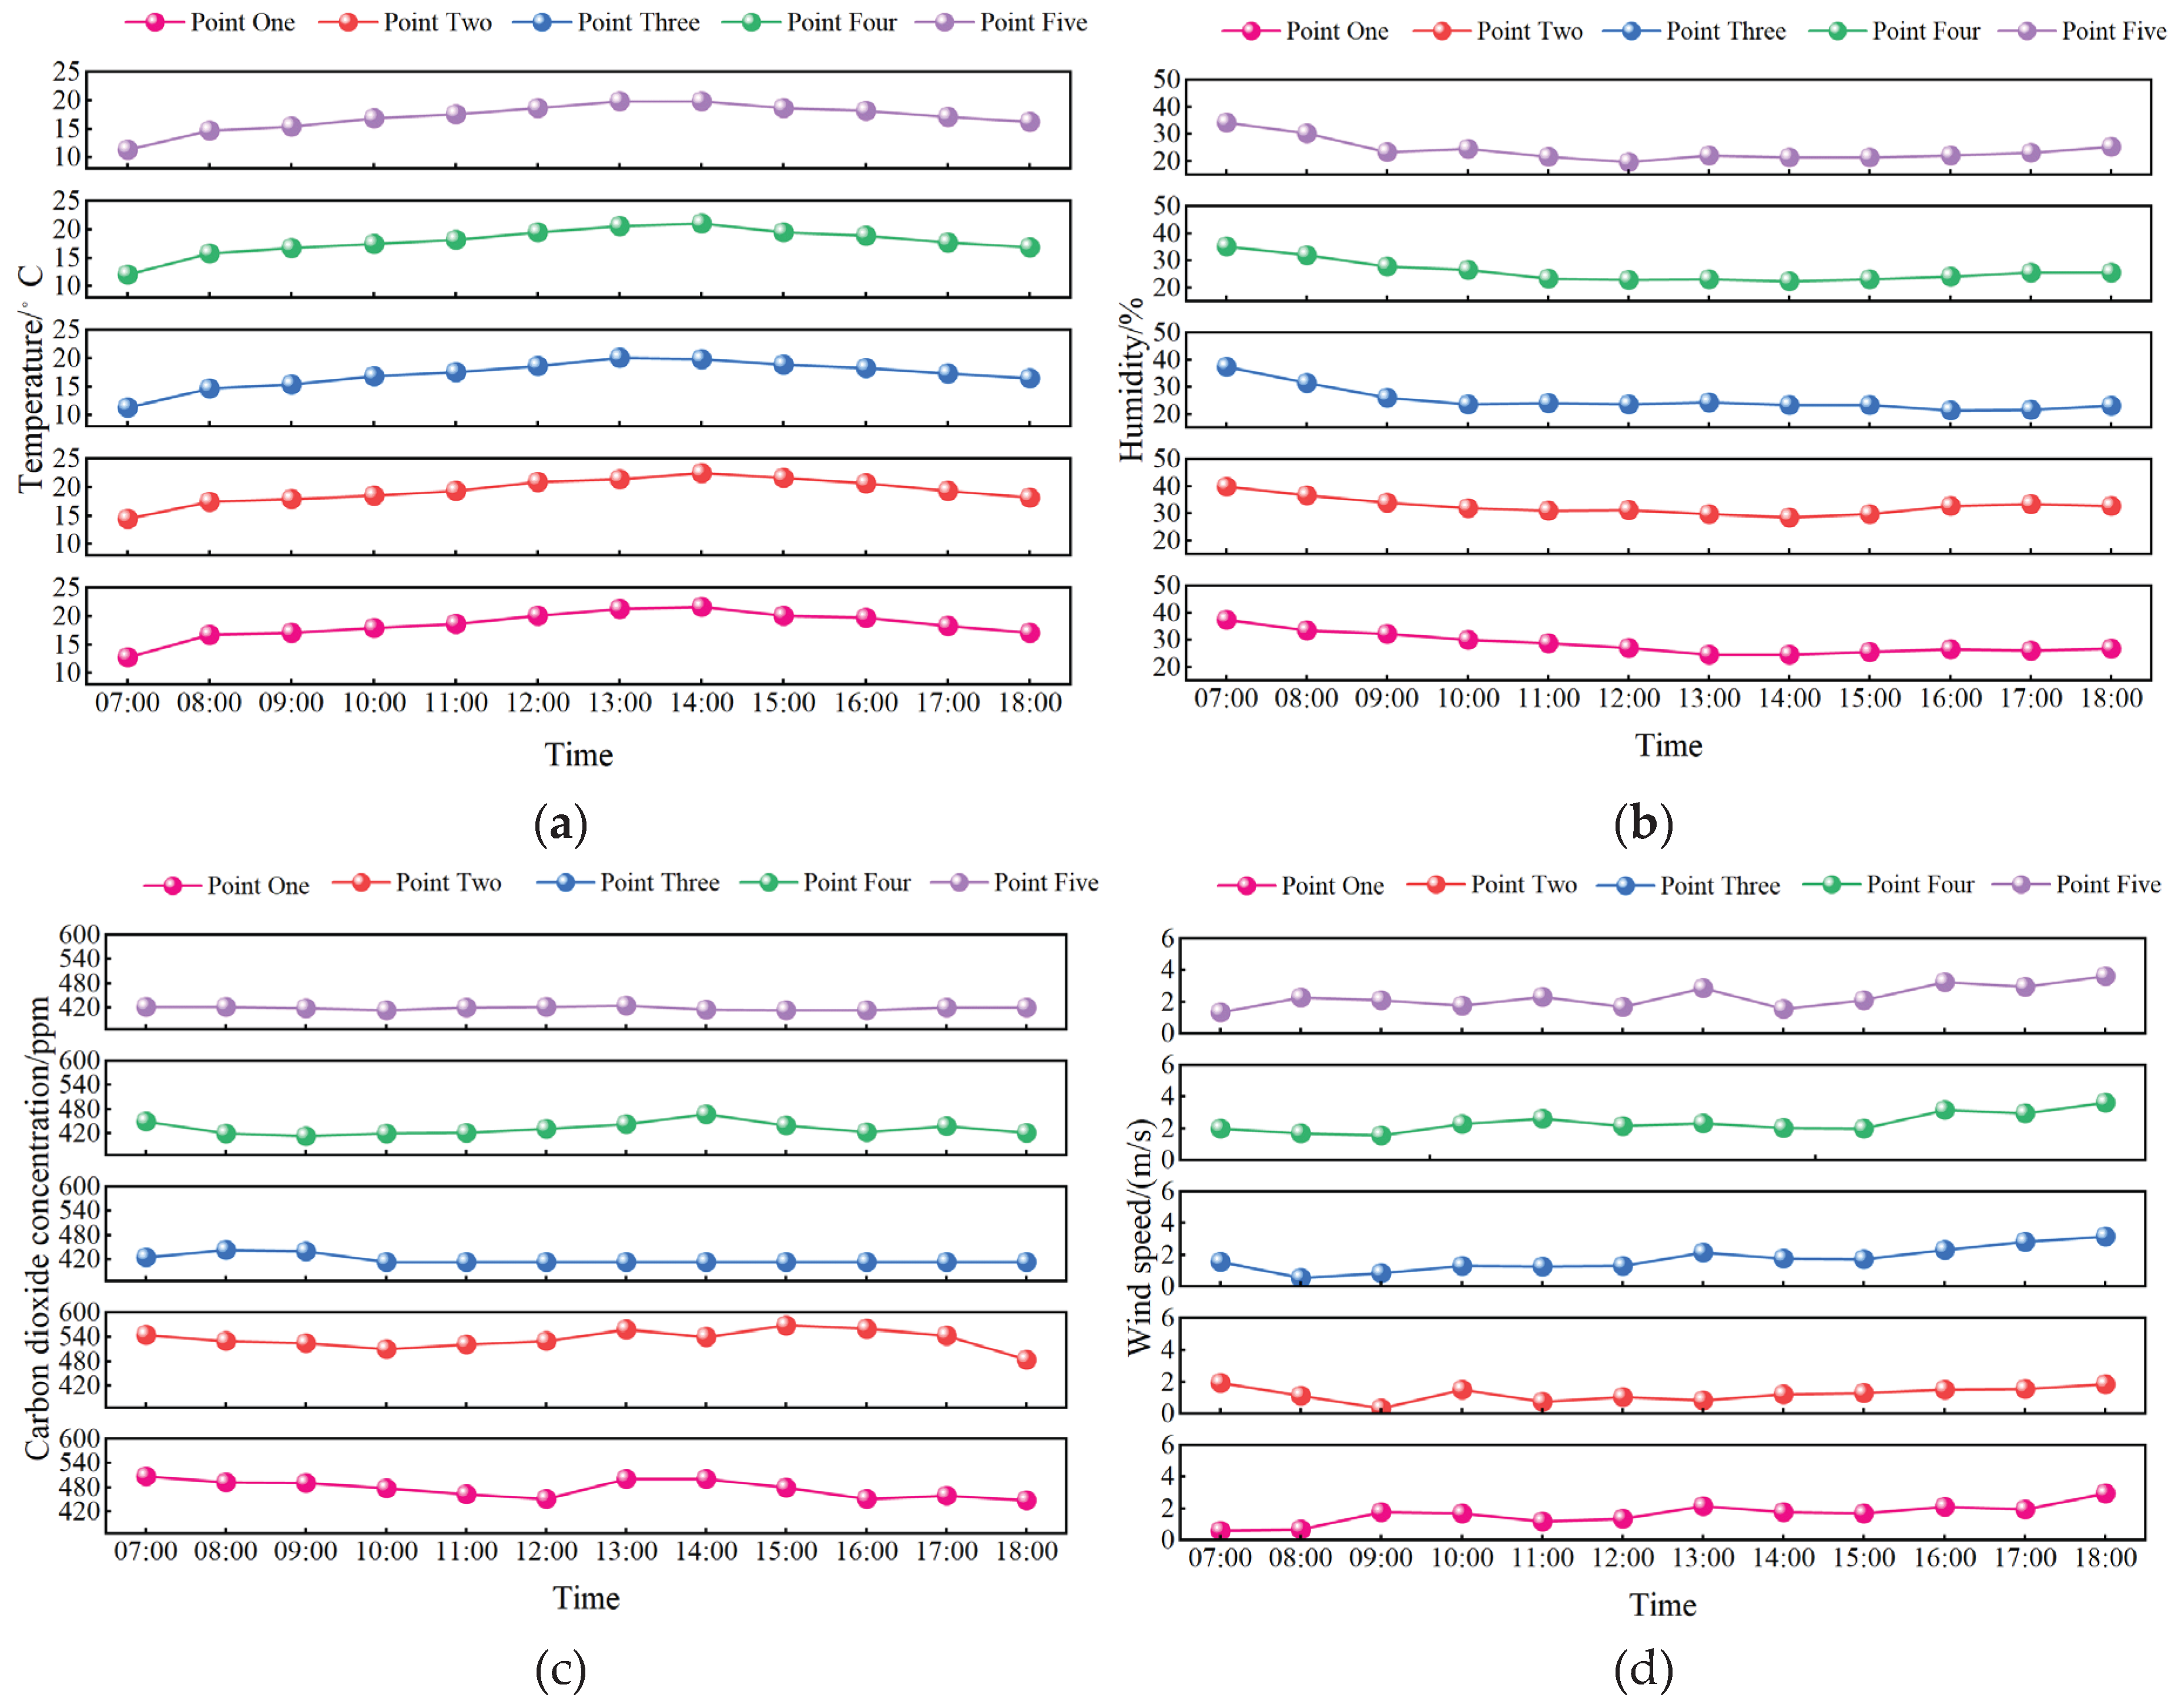
Figure 10.
Wind speed at 1.5m ground, 12:00 vs 17:00. (a) Wind speed at 1.5 m above the ground (12:00). (b) Wind speed at 1.5 m above the ground (17:00).
Figure 10.
Wind speed at 1.5m ground, 12:00 vs 17:00. (a) Wind speed at 1.5 m above the ground (12:00). (b) Wind speed at 1.5 m above the ground (17:00).
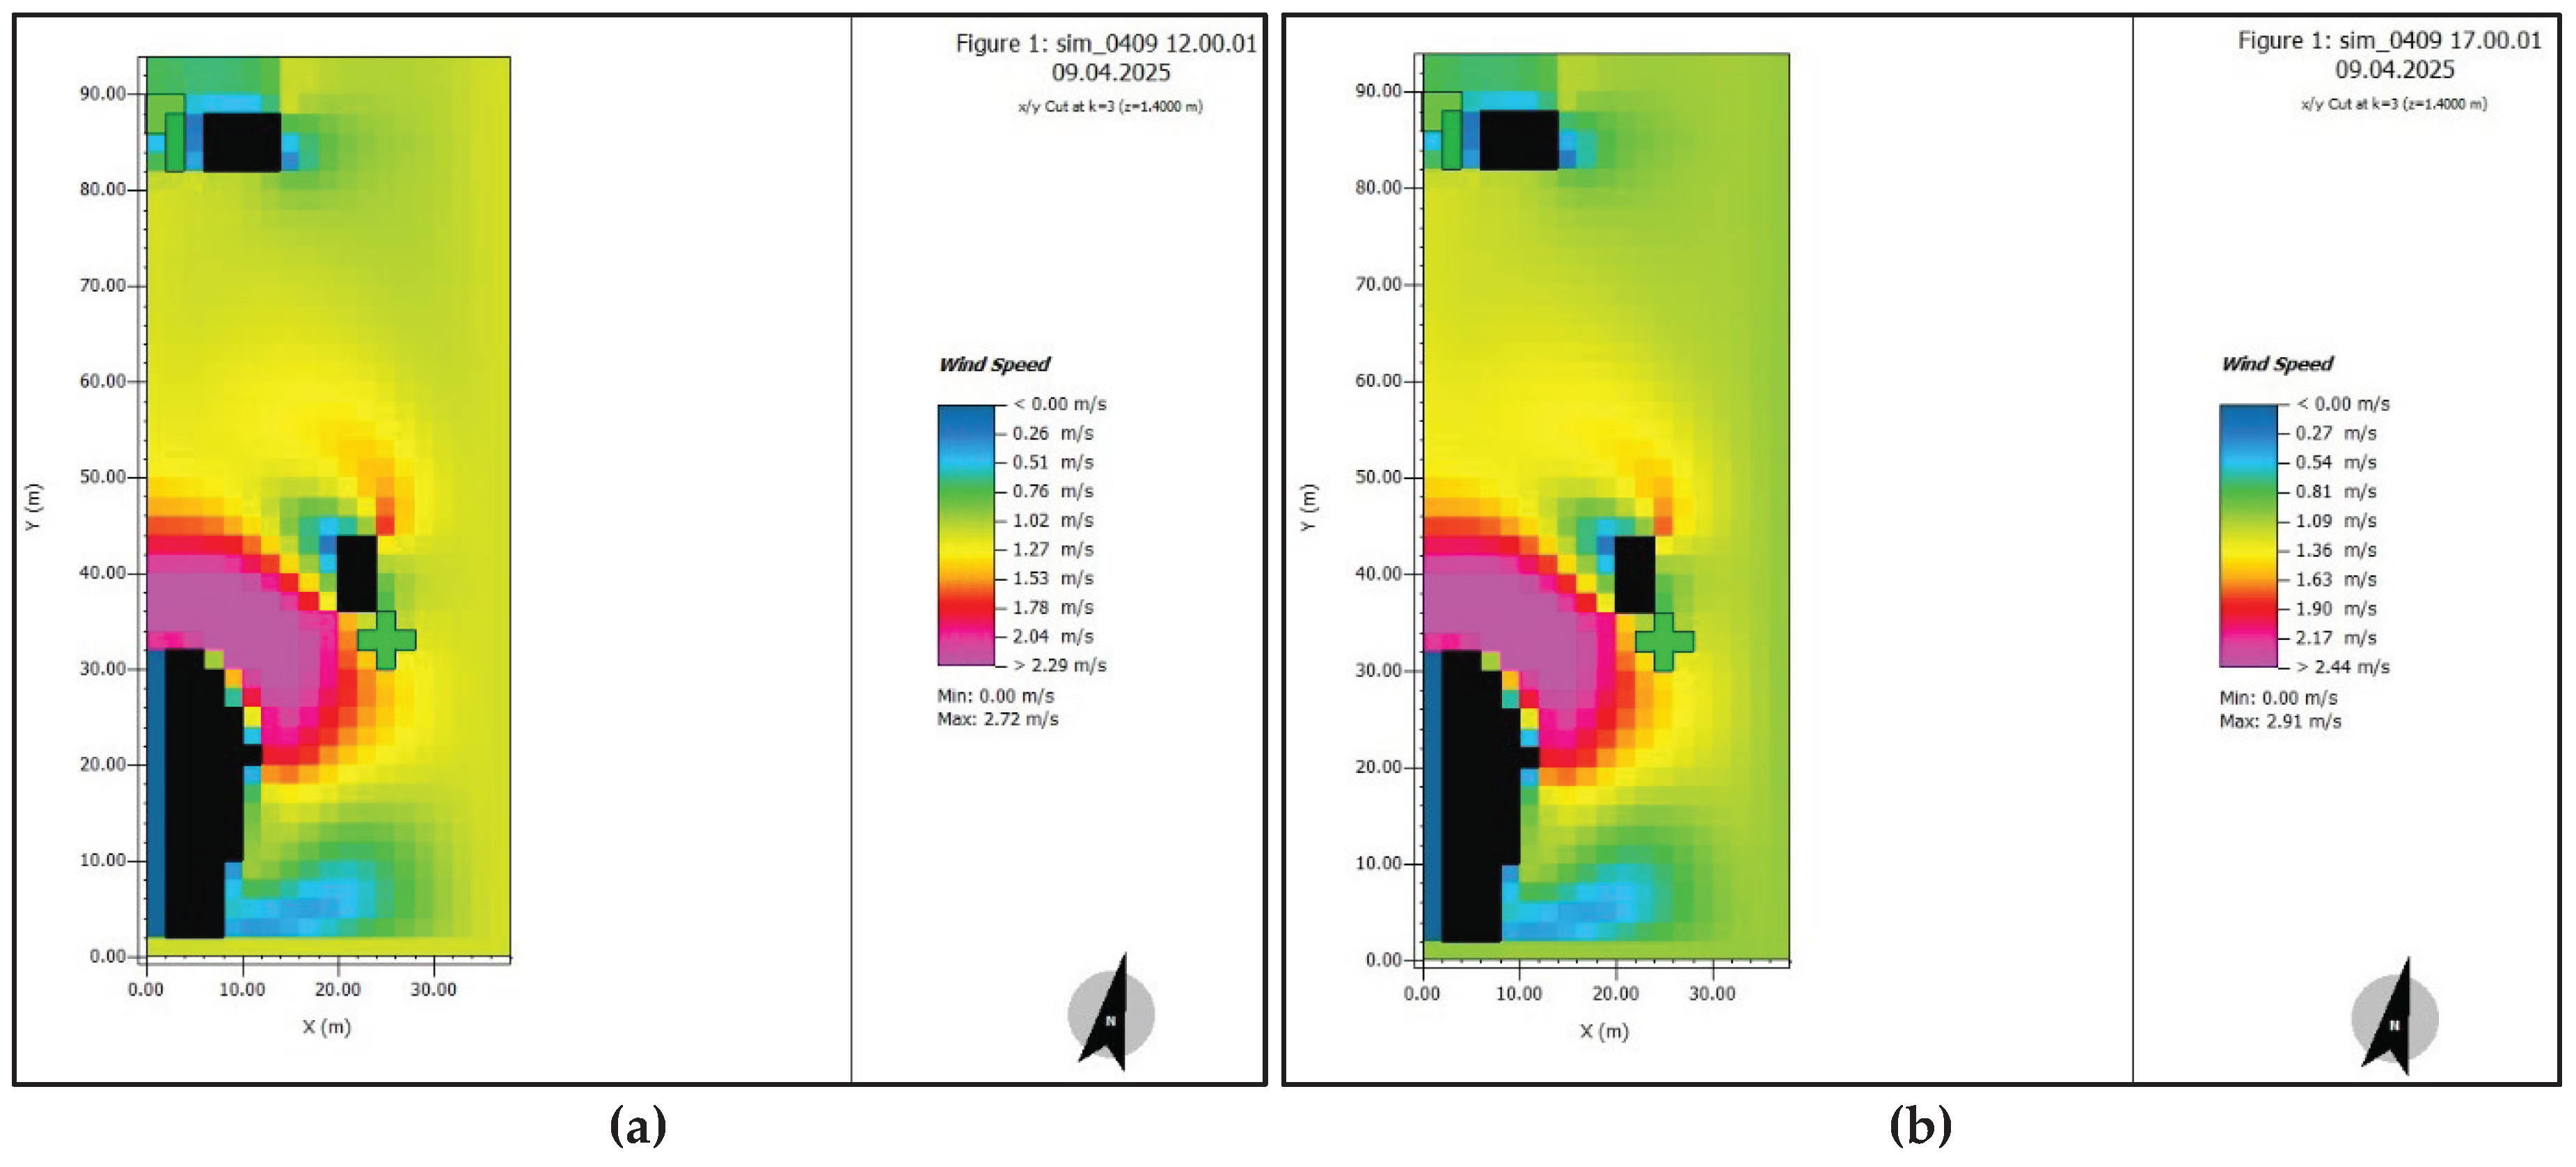
Figure 13.
Optimization of street valley shape to improve air circulation.
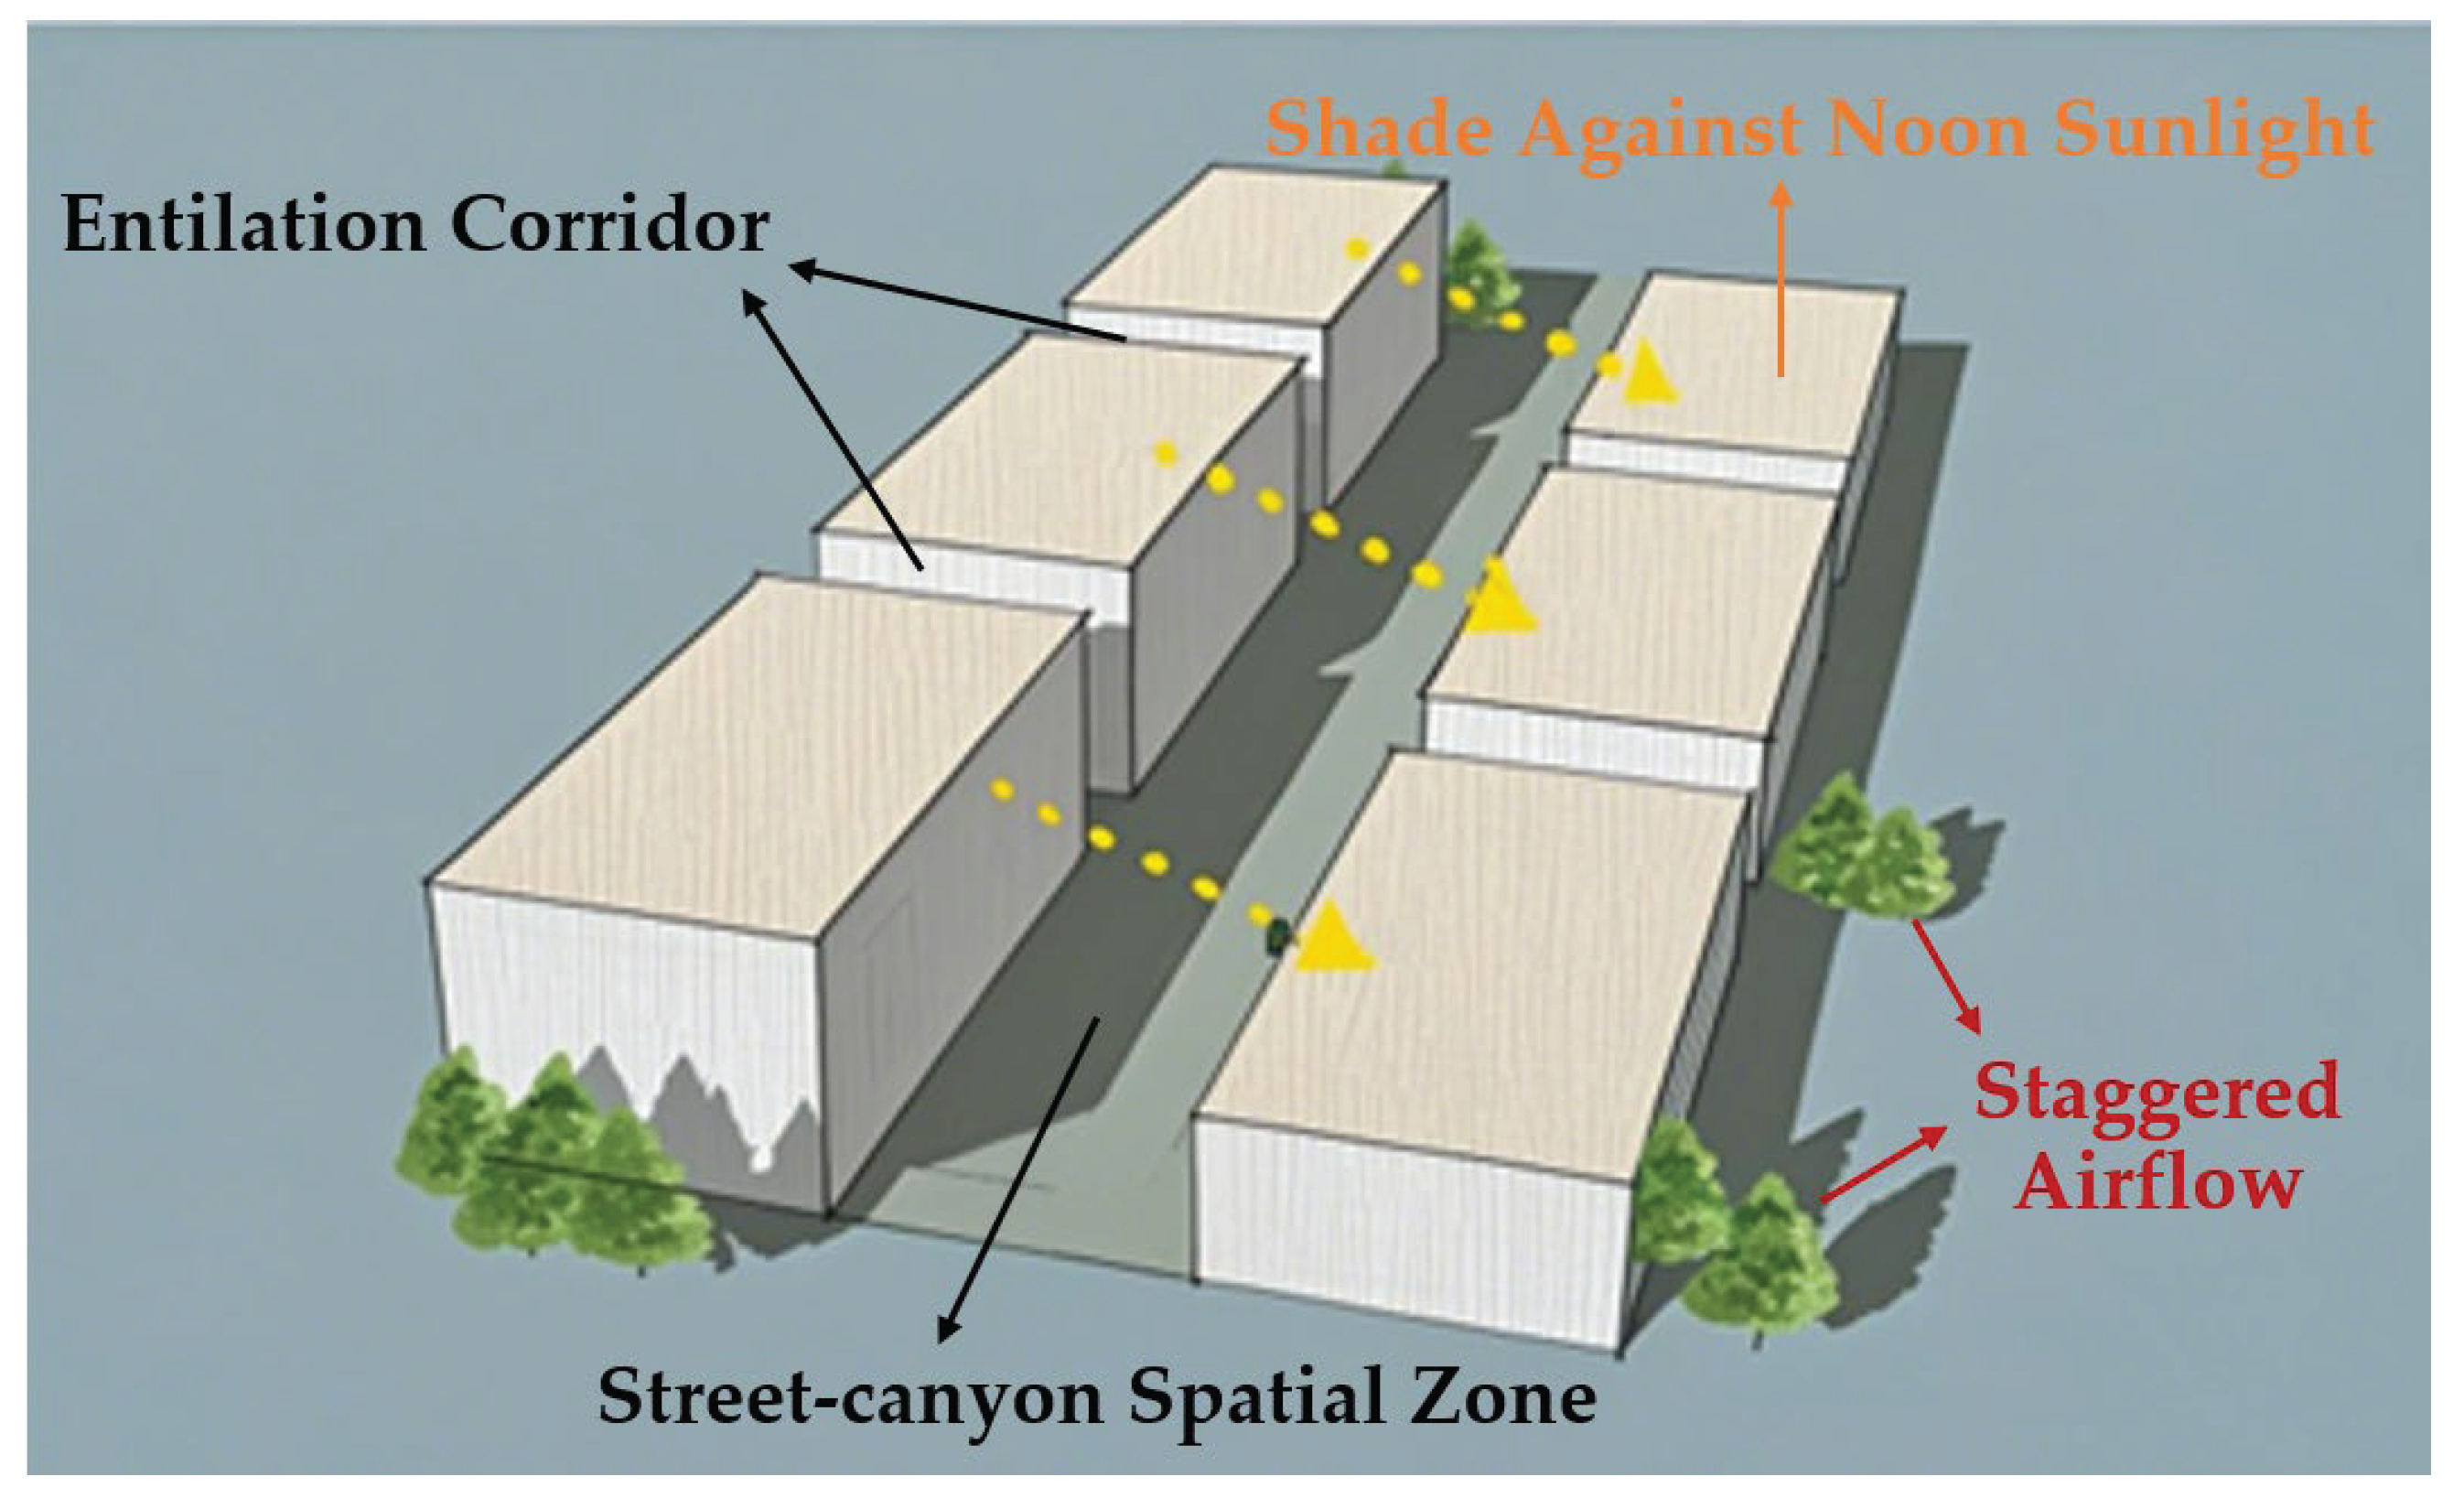
Figure 14.
Optimization of architectural form for better street space.
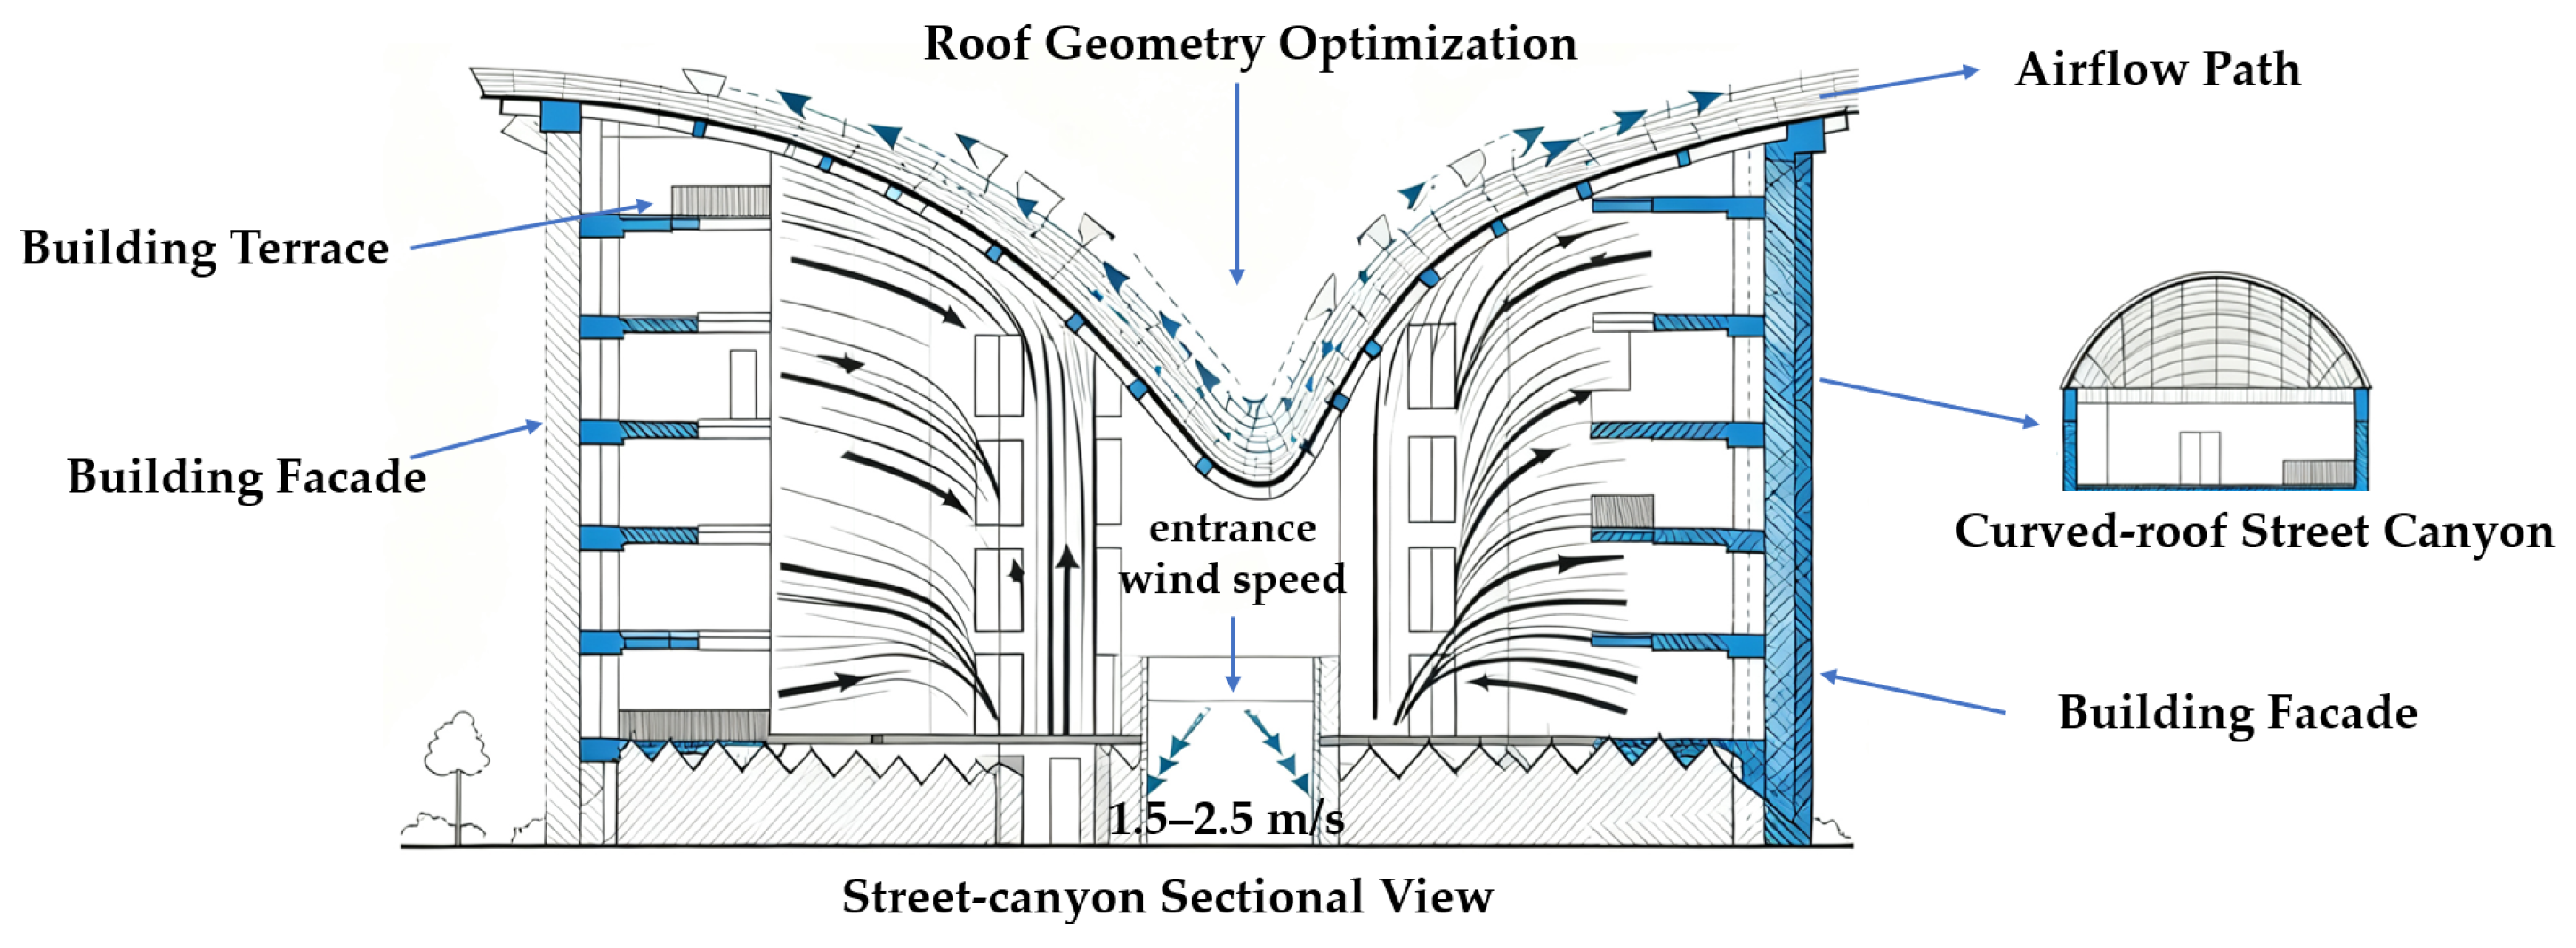
Figure 15.
Street morphology optimization for thermal comfort improvement.
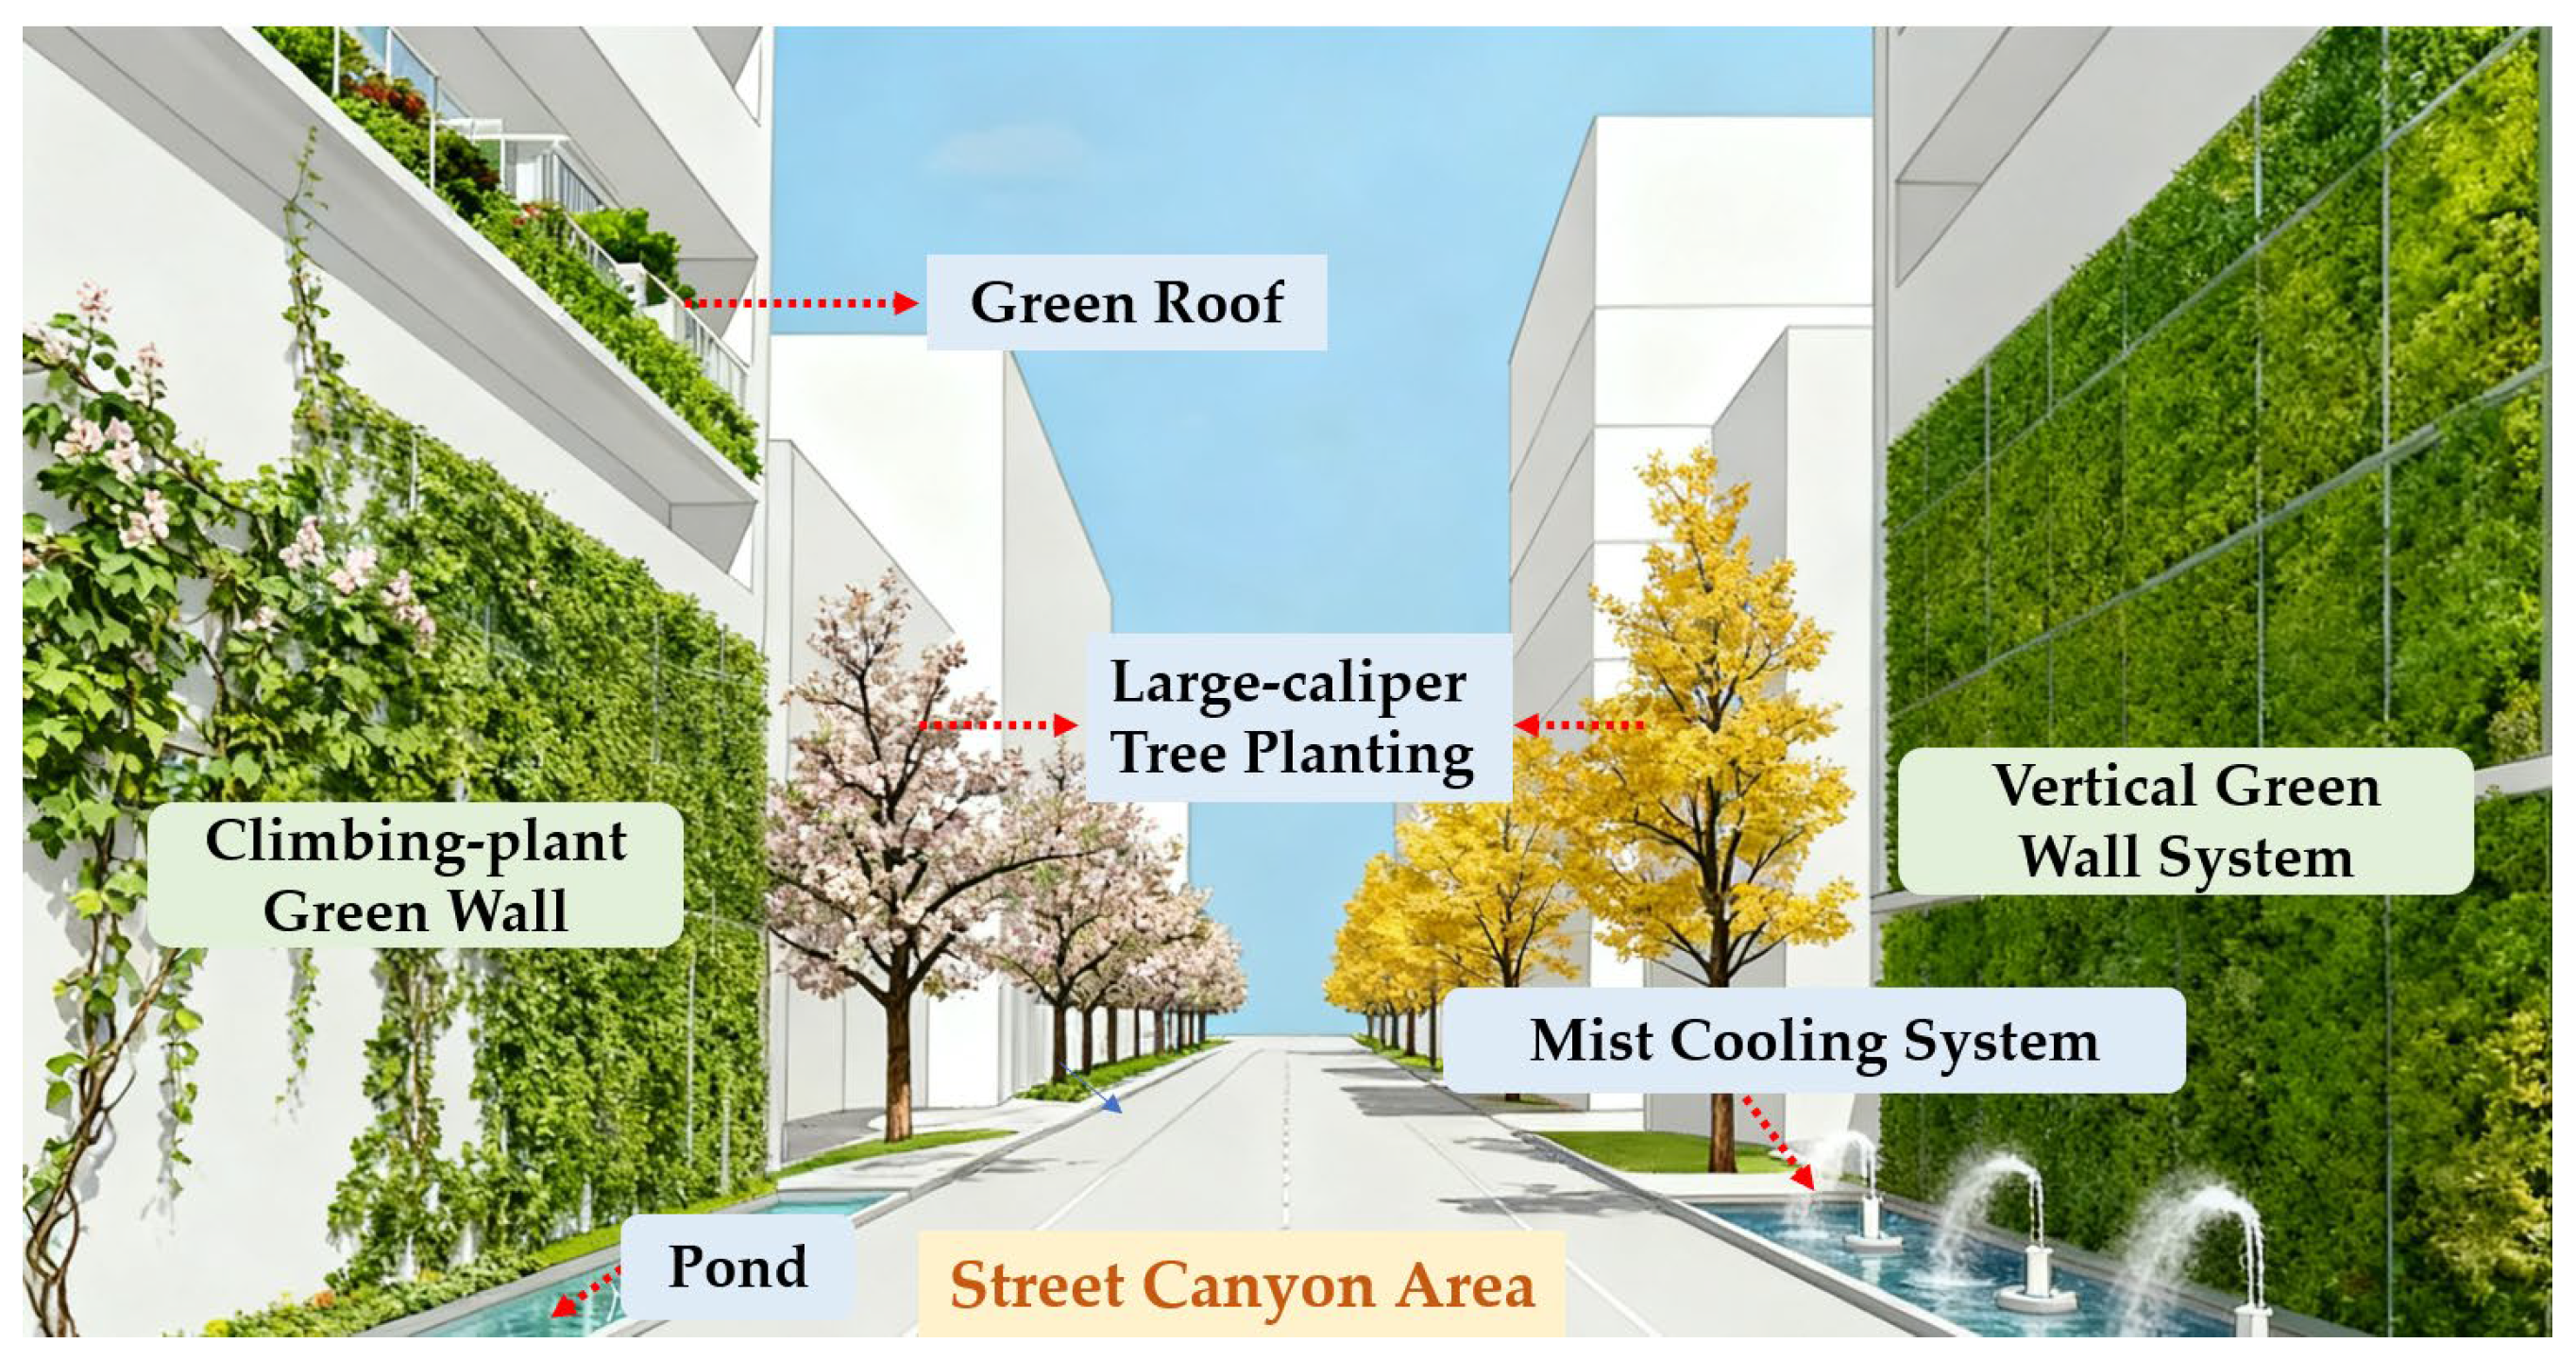
Figure 16.
Optimization of entrance and exit shapes for airflow enhancement. (a) Motorized PV canopy plus curved walls widen shortened entry for airflow.(b) Reflective ground lines channel wind through expanded entrance, boosting ventilation.
Figure 16.
Optimization of entrance and exit shapes for airflow enhancement. (a) Motorized PV canopy plus curved walls widen shortened entry for airflow.(b) Reflective ground lines channel wind through expanded entrance, boosting ventilation.
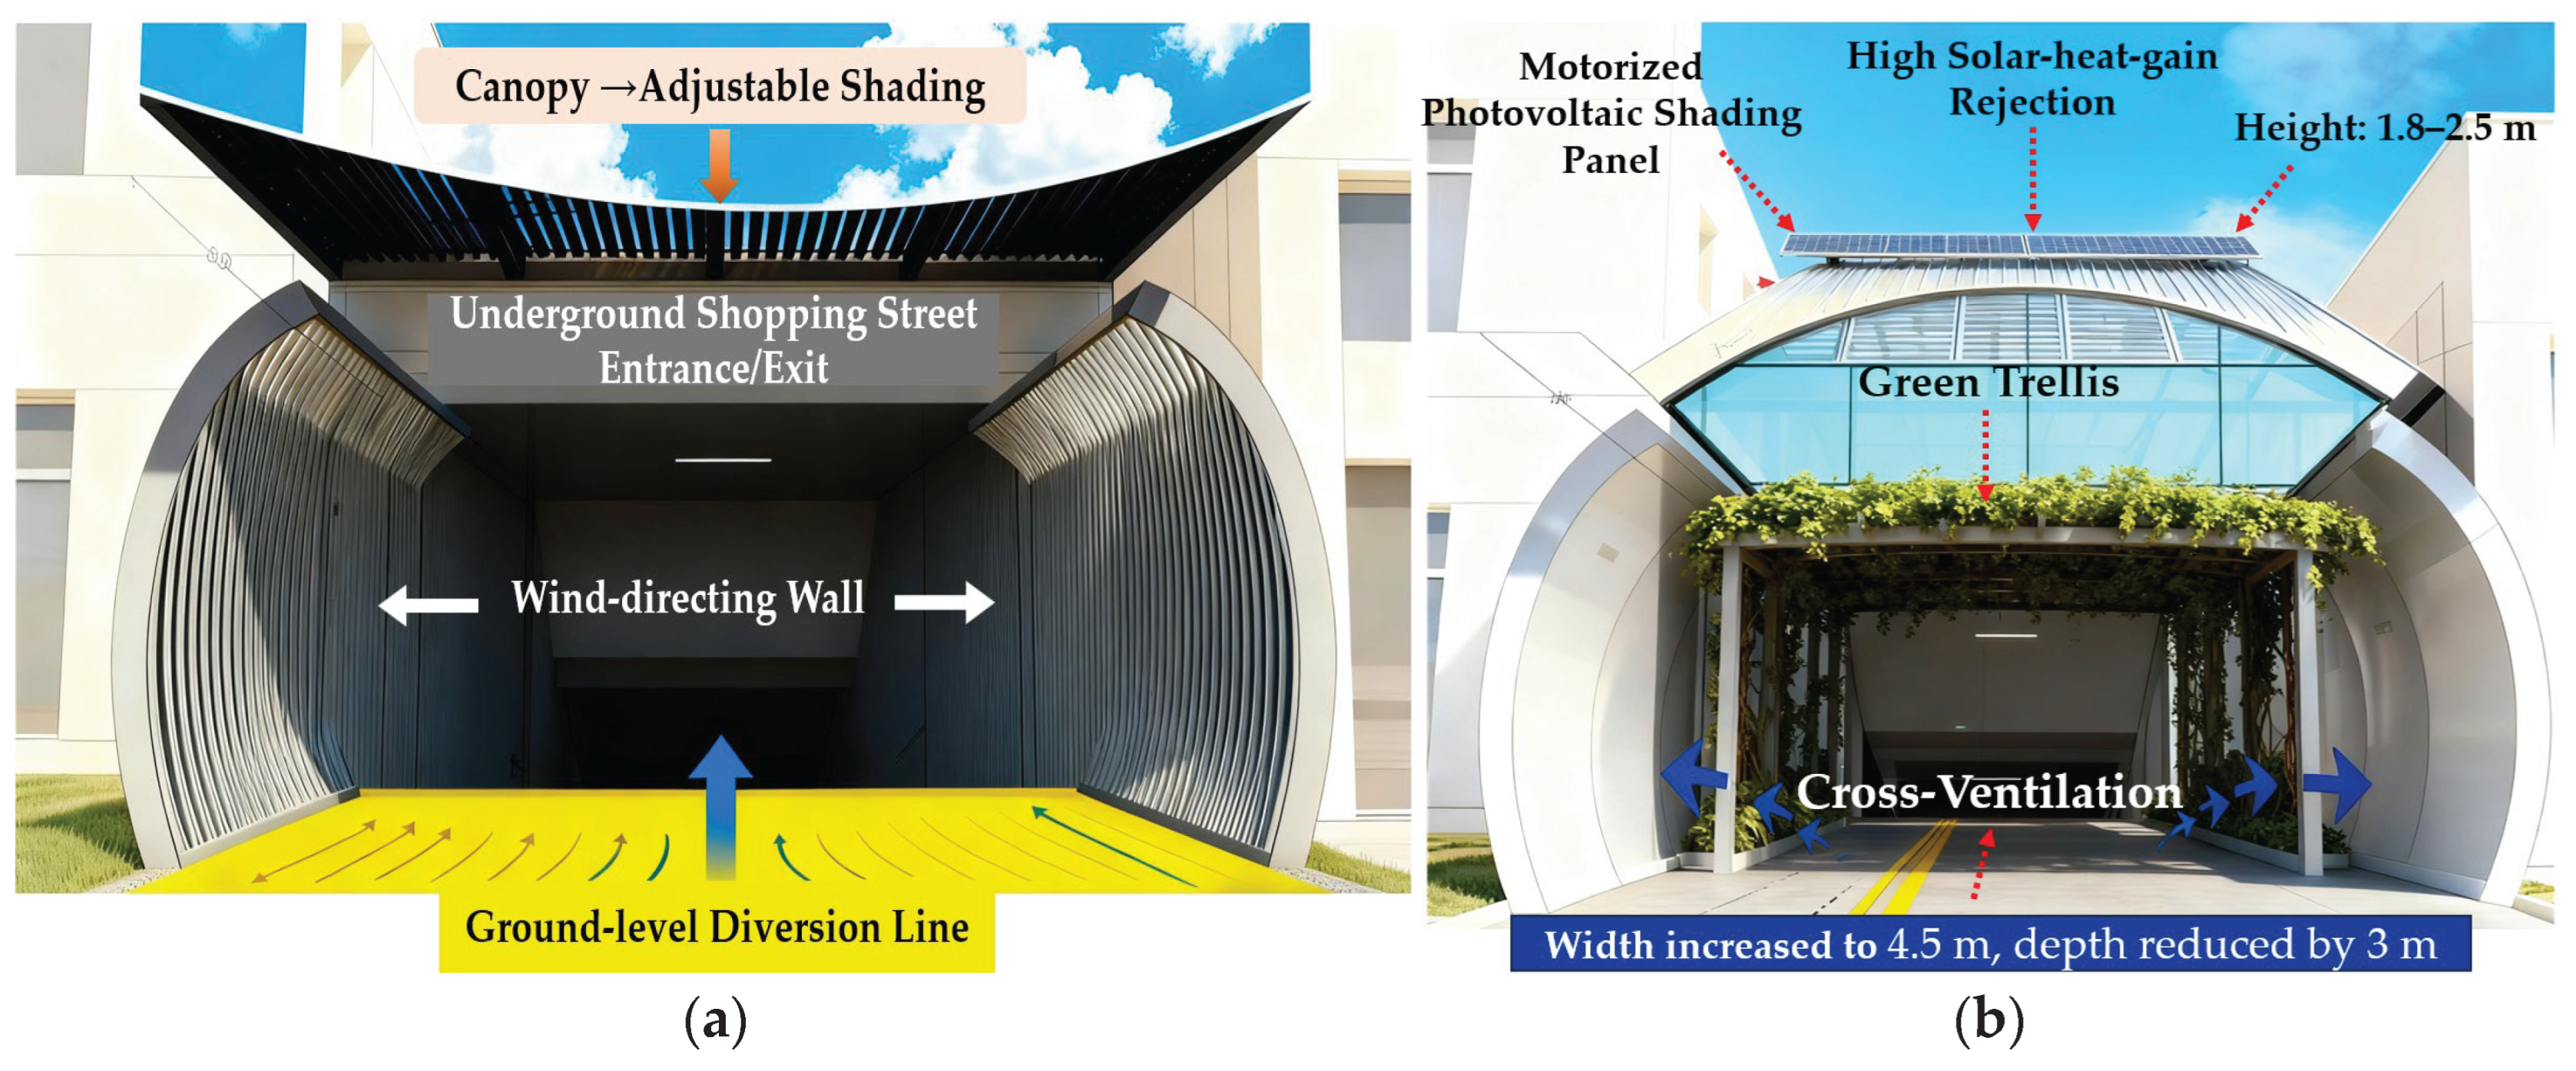
Table 2.
Street valley measurement points.
| Measuring point | Horizontal position | Height (m) | Pictures |
|---|---|---|---|
| 1 | The entrance and exit of the underground commercial street inside the street valley (inside the street valley) | 1.5 |  |
| 2 | The entrance and exit of the underground commercial street in the street valley (inside) | 1.5 | 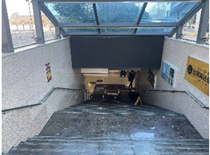 |
| 3 | The street valley is upwind | 1.5 | 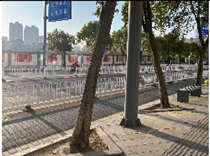 |
| 4 | The central area of street valley | 1.5 | 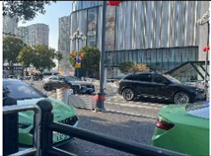 |
| 5 | Downwind of street valley | 1.5 | 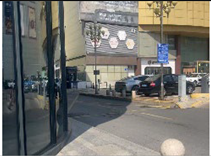 |
Disclaimer/Publisher’s Note: The statements, opinions and data contained in all publications are solely those of the individual author(s) and contributor(s) and not of MDPI and/or the editor(s). MDPI and/or the editor(s) disclaim responsibility for any injury to people or property resulting from any ideas, methods, instructions or products referred to in the content. |
© 2025 by the authors. Licensee MDPI, Basel, Switzerland. This article is an open access article distributed under the terms and conditions of the Creative Commons Attribution (CC BY) license (http://creativecommons.org/licenses/by/4.0/).
Copyright: This open access article is published under a Creative Commons CC BY 4.0 license, which permit the free download, distribution, and reuse, provided that the author and preprint are cited in any reuse.


