Introduction
In recent years, the participation of athletes with an impairment in high-profile international events, such as the Paralympic Games [
1,
2,
3], has significantly increased, alongside the growing professionalism of these sports [
4]. Similarly to Olympic sports, this has led to an increasing attention on the periodic health and fitness evaluation of potential Paralympic candidates (hereinafter referred to as Paralympians) [
5,
6,
7,
8,
9,
10]. Paralympic athletes (PA) often experience a range of distinct impairments and health conditions that contribute to the complexity of the sporting environment [
10]. This calls for more detailed information on each athlete and may require more complex strategies to address, prevent, and mitigate health concerns [
11,
12].
The assessment of body composition has become routine among PA, with applications in general health screenings to evaluate nutritional status and in the monitoring of the impact of dietary and training interventions [
13]. PA represent an athletic population with inherent variability, including individuals with different types and degrees of physical, visual, and intellectual impairments [
14]. While the principles for assessing body composition in athletes with intellectual and vision impairments largely align with those for able-bodied athletes, PA such as reduced muscle power (e.g., those with a spinal cord injury), limb deficiency (e.g., those with amputations), or restricted passive range of movement (e.g., those with arthrogryposis) pose unique challenges in body composition assessment [
15]. In particular, it has been reported that PA with physical impairments exhibit a specific body composition profile that differs from that of their able-bodied counterparts, with distinct patterns of tissue distribution across body regions that can vary based on several factors, including the type of the impairment, the sport practiced, the amount of training, and the duration of injury [
16,
17,
18,
19,
20,
21].
Overall, and of special interest from a health-related perspective, PA, especially those with physical impairments, experience changes in body composition due to their conditions, including increased whole-body adiposity, muscle atrophy, reduced lean mass and bone mineral density, as well as an increase in fat mass [
18,
22,
23,
24]. Accordingly, accurately assessing and monitoring body composition over time in PA is particularly important, as such alterations, including the accumulation of fat mass in specific body regions, are closely associated with other conditions, such as osteoporosis, obesity, cardiovascular disease, hypertension, type II diabetes mellitus, certain forms of cancer, and an increased risk of mortality [
25,
26].
The assessment of body composition is also important from a performance perspective. Body composition characterizes not only PA competing in endurance sports, but also those involved in power, mixed metabolism, and skill sports [
27]. In particular, among endurance PA, evidence indicates that the most successful athletes (i.e., Paralympic medalists) exhibit lower fat mass values than their peers, suggesting that fat mass percentage is associated with performance [
27].
Techniques for assessing body composition vary in complexity and setting, ranging from laboratory-based to field-based methods, each presenting advantages and limitations, along with some degree of measurement error [
15,
28]. Various techniques for assessing body composition include manual anthropometry (such as body circumferences and skinfold thickness), Bioelectrical Impedance Analysis (BIA), Air Displacement Plethysmography (ADP), Hydrostatic Weighing, Dual-Energy X-ray Absorptiometry (DXA), and imaging methods like Computed Tomography and Magnetic Resonance Imaging [
29]. The choice of method typically depends on the intended goal of the measurements and the technology available.
Today, DXA has been recognized as an accurate method to assess body composition in PA [
28,
30,
31]. However, DXA is not always accessible in many sports contexts due to logistical challenges and costs. As a result, clinicians, nutritionists, and physical conditioners often turn to more accessible methods, such as BIA or anthropometric predictive equations, as alternatives for estimating body composition in PA. However, the accuracy of these methodologies relies on predictive equations based on the assumption that body tissues are distributed in a similar manner across all individuals within a given population and are specific to the population being evaluated [
32]. The current body composition methodologies based on predictive equations have been mostly validated for able-bodied individuals, with few predictive models specifically developed in large cohorts of PA.
Despite the importance of precisely assessing body composition in this special athletic population, the accuracy of the currently available methods for estimating body composition in PA relative to DXA has been poorly investigated to date [
19,
31,
33,
34,
35]. These studies assessed the accuracy of anthropometry [
19,
31,
33,
34,
35], BIA [
31,
33], and ADP [
31] in relatively small and often heterogeneous samples of PA. Taken together, these studies indicate a lack of transferability of the currently used methods for assessing body composition in PA when compared to DXA. They also highlight the need for further research that involves larger samples of PA, in order to better account for the impact of different types of impairments.
The present study was designed to address gaps in the literature by assessing body composition using various currently available methods in a large cohort of male and female Paralympians. These athletes were examined as part of the preparticipation medical program implemented at the Institute of Sport Medicine and Science of the Italian Olympic Committee [
9,
36]. The first aim of this study was to evaluate the accuracy of selected skinfold equations, BIA, ADP in estimating body composition, using DXA as the reference method. A second aim of this study was to examine the association between anthropometric measures, BIA and ADP estimates, and relative fat mass as determined by DXA.
2. Materials and Methods
2.1. Participants
The Institute of Sport Medicine and Science conducts medical and performance evaluations of elite Italian athletes before their participation in the Paralympic Games [
9,
36]. This pre-participation medical assessment includes clinical, laboratory and instrumental tests that encompass the assessment of body composition, nutritional status and cardiovascular function. In this context, a total of 86 male (mean age 33.0 ± 10.0 years) and 75 female (mean age 32.8 ± 9.5 years) Paralympians were included in the study.
Recruited PA participated in 17 sport disciplines, that is Para Equestrian (n = 5), Para Shooting (n = 6), Para Archery (n = 14), Para Athletics (e.g., wheelchair racing, high jump, shot put; n = 17), Para Judo (n = 4), Para Swimming (n = 32), Para Powerlifting (n = 3), Para Badminton (n = 1), Sitting Volleyball (n = 14), Wheelchair Fencing (n = 12), Para Taekwondo (n = 1), Wheelchair Tennis (n = 2), Para Table Tennis (n = 7), Para Rowing (n = 9), Para Canoe (n = 6), Cycling (n = 21), and Para Triathlon (n = 7).
The study was conducted in accordance with the Declaration of Helsinki, and the protocol was approved by the Institutional Review Board of the local Institute of Sport Medicine and Science. The study design of the present investigation was evaluated and approved by the Ethical Committee (CET - Comitato Etico Territoriale Lazio Area 1, date of approval 06\03\2024 IRB number 0208/2024). All athletes involved in this study were thoroughly briefed on the purpose and procedures of the evaluation and provided their written informed consent, in compliance with Italian regulations and the policies of the Institute.
2.2. Procedures
All Paralympians underwent a body composition assessment between one and eight months before the Paris 2024 Paralympic Games. Body composition was assessed using a whole-body DXA scan, BIA, ADP, and anthropometric measurements. All measurements were conducted on the same day in the morning, following a 3–4 hour fast. During all assessments, athletes wore minimal clothing (i.e., underwear). They were advised to refrain from vigorous physical activity on the day before the testing session and to avoid any exercise on the morning of the evaluations.
Prior to the body composition assessment, athletes completed a face-to-face questionnaire to collect general information, including age, sport, and health condition.
2.2.1. Anthropometric assessment
The anthropometric evaluation involved the measurement of body mass, stature, skinfold thicknesses, and body circumferences.
Body mass was measured to the nearest 0.1 kg with athletes wearing only underwear, using a certified mechanical scale with stadiometer (SECA 711, GmbH, Hamburg, Germany). Athletes with upper limb amputation(s) were asked to remove their prosthesis before having their body mass measured. For athletes with lower limb amputation(s), body mass was measured with the prosthesis on, and the weight of the prosthesis was then subtracted from the total measurement to obtain the actual body mass. Similarly, for athletes unable to stand, body mass was assessed while seated on their wheelchair, with the wheelchair weight subtracted from the measurement to obtain the athlete's actual body mass.
Standing height was measured to the nearest 0.1 cm using a mechanical scale with a stadiometer (SECA 711, GmbH, Hamburg, Germany) according to conventional criteria and measuring procedures [
37]. Athletes with lower limb amputation(s) were measured while wearing their prosthesis, while for athletes who were wheelchair users and unable to stand, body stature was self-reported. Body mass index for all athletes was calculated as body mass (kg) divided by height squared (m
2).
Body circumferences were measured using a n
on-elastic steel millimeter measuring tape (Anthroflex NA305, 6mm x 2m). Based on the impairment, where the anatomical measurement sites were present, the following body circumferences were measured according to standard procedures [
37]: waist, abdomen, and hips.
Skinfold thicknesses were measured to the nearest 0.2 mm by the same trained investigator with a mechanical skinfold caliper (GIMA, Milan, Italy). Annual calibration checks have been performed. Wherever compatible with the athlete’s impairment, skinfold thicknesses were measured at the biceps, triceps, subscapular, chest, axilla, suprailiac (anterior and medial), abdominal, anterior thigh, and calf according to conventional criteria and measurement procedures [
37]. For athletes with an impairment affecting one side of the body, measurements were taken on the non-impaired side.
Body density or the %FM were calculated using four commonly used skinfold equations developed in able-bodied populations: Durnin and Womersley, 1974 (%FM_DW); Evans et al., 2005 (%FM_EV3 and %FM_EV7); Pollock et al., 1976 (%FM_POL); Thorland et al., 1984 (%FM_THO3 and %FM_THO) [
38,
39,
40,
41] (
Table 1). Body density values were converted to %FM according to Siri [
42].
2.2.2. Bioelectrical Impedance Analysis (BIA) Assessment
Bioelectrical impedance analyses were performed with impedance analyzer (BIA 101 BIVA PRO, AKERN srl, Pisa, Italy) at a single frequency of 50 kHz, with tetrapolar technique. The device was calibrated every morning using the standard control circuit supplied by the manufacturer. The accuracy of the device was 0.1% for resistance and 0.1% for reactance. Athletes were instructed to remove their socks and jewellery, then lie in a supine position on a non-conductive surface (e.g., a crib mattress or examination table) for 10 minutes to ensure procedural standardization. The arms were extended and positioned slightly apart from the body, ensuring that the ankles and thighs remained separated. Adhesive electrodes were placed on the athletes' dorsal wrist and ankle after the skin was cleaned with alcohol. The wrist measurement landmark was located at the distal end of the third metacarpal and between the styloid processes of the radius and ulna. The ankle landmark was positioned at the end of the second metatarsal and between the medial and lateral malleoli. For athletes with unilateral upper (or lower) limb amputation on the right side, the left hand (or foot) was used. Athletes with bilateral lower limb amputation did not undergo this technique.
Relative body fat estimates were determined using the generalized equation included in the AKERN software.
2.2.3. Air Displacement Plethysmography (ADP) Assessment
When possible (36 Female and 27 Male athletes), according to the impairment of the athlete, the relative fat mass (%FM_ADP) was assessed using a commercially available device (COSMED USA Inc., Concord, CA) according to the procedures recommended by the manufacturer [
43]. A two-point calibration was performed with an empty chamber before each athlete’s assessment. Athletes were instructed to wear tight-fitting swimwear and a snug nylon cap to cover their hair, and to remove any prostheses and metal objects, including jewelers. Once in the chamber, athletes were asked to remain still for the duration of the assessment. The ADP procedure involved two measurements of body volume, unless the readings differed by more than 150 ml. If the discrepancy exceeded 150 ml, a third measurement was taken. Body volume was determined on the basis of the air displaced when the athlete was positioned in the chamber. Using predictor equations built into the system software, the %FM_ADP was estimated from body density, derived from the corrected body volume along with body mass and stature. For athletes who were unable to remain seated without support (e.g., those with a spinal cord injury at the cervical or high thoracic level), this technique was not employed.
2.2.4. Dual-Energy X-ray Absorptiometry (DXA) Assessment
DXA-measured body composition was assessed through a whole-body scan on a QDR Explorer fan beam densitometer (Hologic, MA, United States). In the laboratory, daily quality control of the DXA scanner was performed prior to scanning with an encapsulated spine phantom (Hologic Inc., Bedford, MA, United States) to monitor potential baseline drift. Throughout the testing period, the device exhibited negligible baseline drift. Whole-body DXA scans were conducted on participants according to the guidelines outlined in “The Best Practice Protocol for the Assessment of Whole-Body Body Composition by DXA” [
44]. Before the scan, athletes were instructed to empty their bladder and remove any metal objects, jewelers, or reflective materials, including prosthetics. Positioning aids were utilized to support the residual lower limb, and special strapping was applied around the residual ankle to ensure stability during the scans. All measurements were carried out and all DXA scans were analyzed by the same trained investigator to maintain consistency. The analysis of DXA scans was carried out with the Hologic Discovery software (version 12.6.1) for Windows XP, in line with the manufacturer's guidelines. For the purposes of this study, the whole-body relative fat mass (%FM_DXA) was used for analysis.
2.2.5. Statistical analysis
The normality of data was assessed using the Shapiro_Wilk test and descriptive statistics (mean and standard deviation) were computed for all variables.
Mean bias (i.e., the average of the differences between the %FM obtained by each skinfold equation and the %FM_DXA) was computed to get a measure of systematic measurement errors. Non-parametric variables were log-transformed and the %FM obtained by each skinfold equation was compared with the %FM_DXA using the two-tailed paired-sample t-test. The Lin’s concordance correlation coefficient (ρc) was used to quantify the agreement between the %FM_DXA and each skinfold equation [
45]; agreement was considered poor (ρc < 0.90), moderate (ρc between 0.90 and 0.95), substantial (ρc between 0.95 and 0.99), excellent (ρc > 0.99) and perfect (ρc = 1). The Reduced Major Axis (RMA) regression [
46] was used to assess the relationship between the %FM_DXA (i.e., the dependent variable) and the %FM predicted by each skinfold equation. In case of perfect agreement, the intercept and the slope of the RMA line are 0 and 1, respectively. Agreement between each skinfold equation and DXA was tested using Bland-Altman analysis (limits of agreement and range) [
47].
The strength of the relationship between %FM_DXA and each individual anthropometric measurement was estimated using Pearson’s correlation coefficient (rₚ) for normally distributed variables and Spearman’s correlation coefficient (rₛ) for non-normally distributed variables.
Linear regression analyses with the %FM_DXA as dependent variable and each individual anthropometric measurement as independent variable were also carried out. The adjusted coefficient of determination (Adj R2) and the standard error of estimate (SEE) were used to assess the goodness-of-fit of each predictive model.
Statistical analyses were performed using SPSS v. 16.0 (IBM Corp., Armonk, NY, United States). The statistical significance was set at P ≤ 0.05.
3. Results
The majority of athletes were of Caucasian descent (n = 156; 97%), and the sample did not sufficiently represent other races, such as Asian, Hispanic, or Black. Given the impact of race on body composition [
48], two athletes of Asian descent and three athletes of Black descent were excluded from the analysis. Additionally, twenty athletes were excluded due to the presence of DXA artifacts (e.g., spasms during data acquisition, inability to maintain the required position, or the presence of metal implants). Finally, three athletes were excluded for other reasons (e.g., incomplete dataset). Accordingly, a total of 133 Paralympians (66 males and 67 females) were included in the analysis.
In the descriptive analyses reported in
Figure 1,
Figure 2 and
Figure 3, athletes were divided into five distinct health condition groups: the Spinal Cord Injuries and Related Disorders Group (SCI; n = 52; male PA, n = 29 and female PA, n = 23), which included athletes with spinal cord injury (n = 47), or spina bifida (n = 5); the Amputation Group (AMP; n = 31; males, n = 16 and females, n = 15), which included athletes with a total or partial absence of bones or joints in the upper limb (n = 7), lower limb(s) (n = 22), or both (n = 2), resulting from trauma, illness, or congenital limb deficiency; the Brain Injury Group (BI; n = 10; male PA, n = 7 and female PA, n = 3), which included athletes with acquired brain injuries or other neurological conditions related to brain damage, such as cerebral palsy; the Other Health Conditions Group (OTH; n = 28; male PA, n = 11 and female PA, n = 17), which included athletes with health conditions different from those included in the other groups, such as multiple sclerosis, femoral dysplasia, agenesis, and arthrogryposis; the Vision and Intellectual Health Conditions Group (VI; n = 12; male PA, n = 3 and female PA, n = 9), which included athletes with vision impairment and intellectual impairment.
Descriptive statistics (mean ± standard deviation) for age, body mass, stature, and BMI of male and female participants across groups are presented in
Table 2.
Figure 1 illustrates the %FM_DXA of the whole sample of male and female athletes (panels A and B, respectively), as well as by health condition groups.
A summary of the accuracy and agreement in the estimation of %FM by each skinfold equation, BIA, and ADP compared with %FM_DXA is presented in
Table 3. The t-test showed that only %FM_THO7 in the female group was not significantly different from the average %FM_DXA, whereas all the other skinfold equations and field methods (i.e., BIA and ADP) significantly underestimated %FM_DXA, with systematic bias ranging from −1.78% (%FM_DW in the female group) to −10.69% (%FM_POL in the male group).
The ρc indicated poor agreement between %FM obtained with each of the considered skinfold equations and field methods and %FM_DXA (ρc < 0.90 for all,
Table 3). The slope and the intercept of the RMA were, respectively, near to 1 and to 0 for the %FM_DXA and the %FM_EV3 in female PA indicating good concordance between these measurements. All other measurement showed poor agreement (
Table 3).
The agreement between %FM obtained by ADP and field methods (i.e., skinfold equations, BIA) and %FM_DXA in the male and female groups is shown in
Figure 2 and
Figure 3, respectively. Despite at least slightly more than 90% of the data points falling within the 95% limits of agreement in each Bland-Altman plot (
Figure 2 and
Figure 3), the range of the limits of agreement in each plot was large (i.e., higher than 7.47 in male PA and 10.51 in female PA;
Table 3), indicating poor agreement.
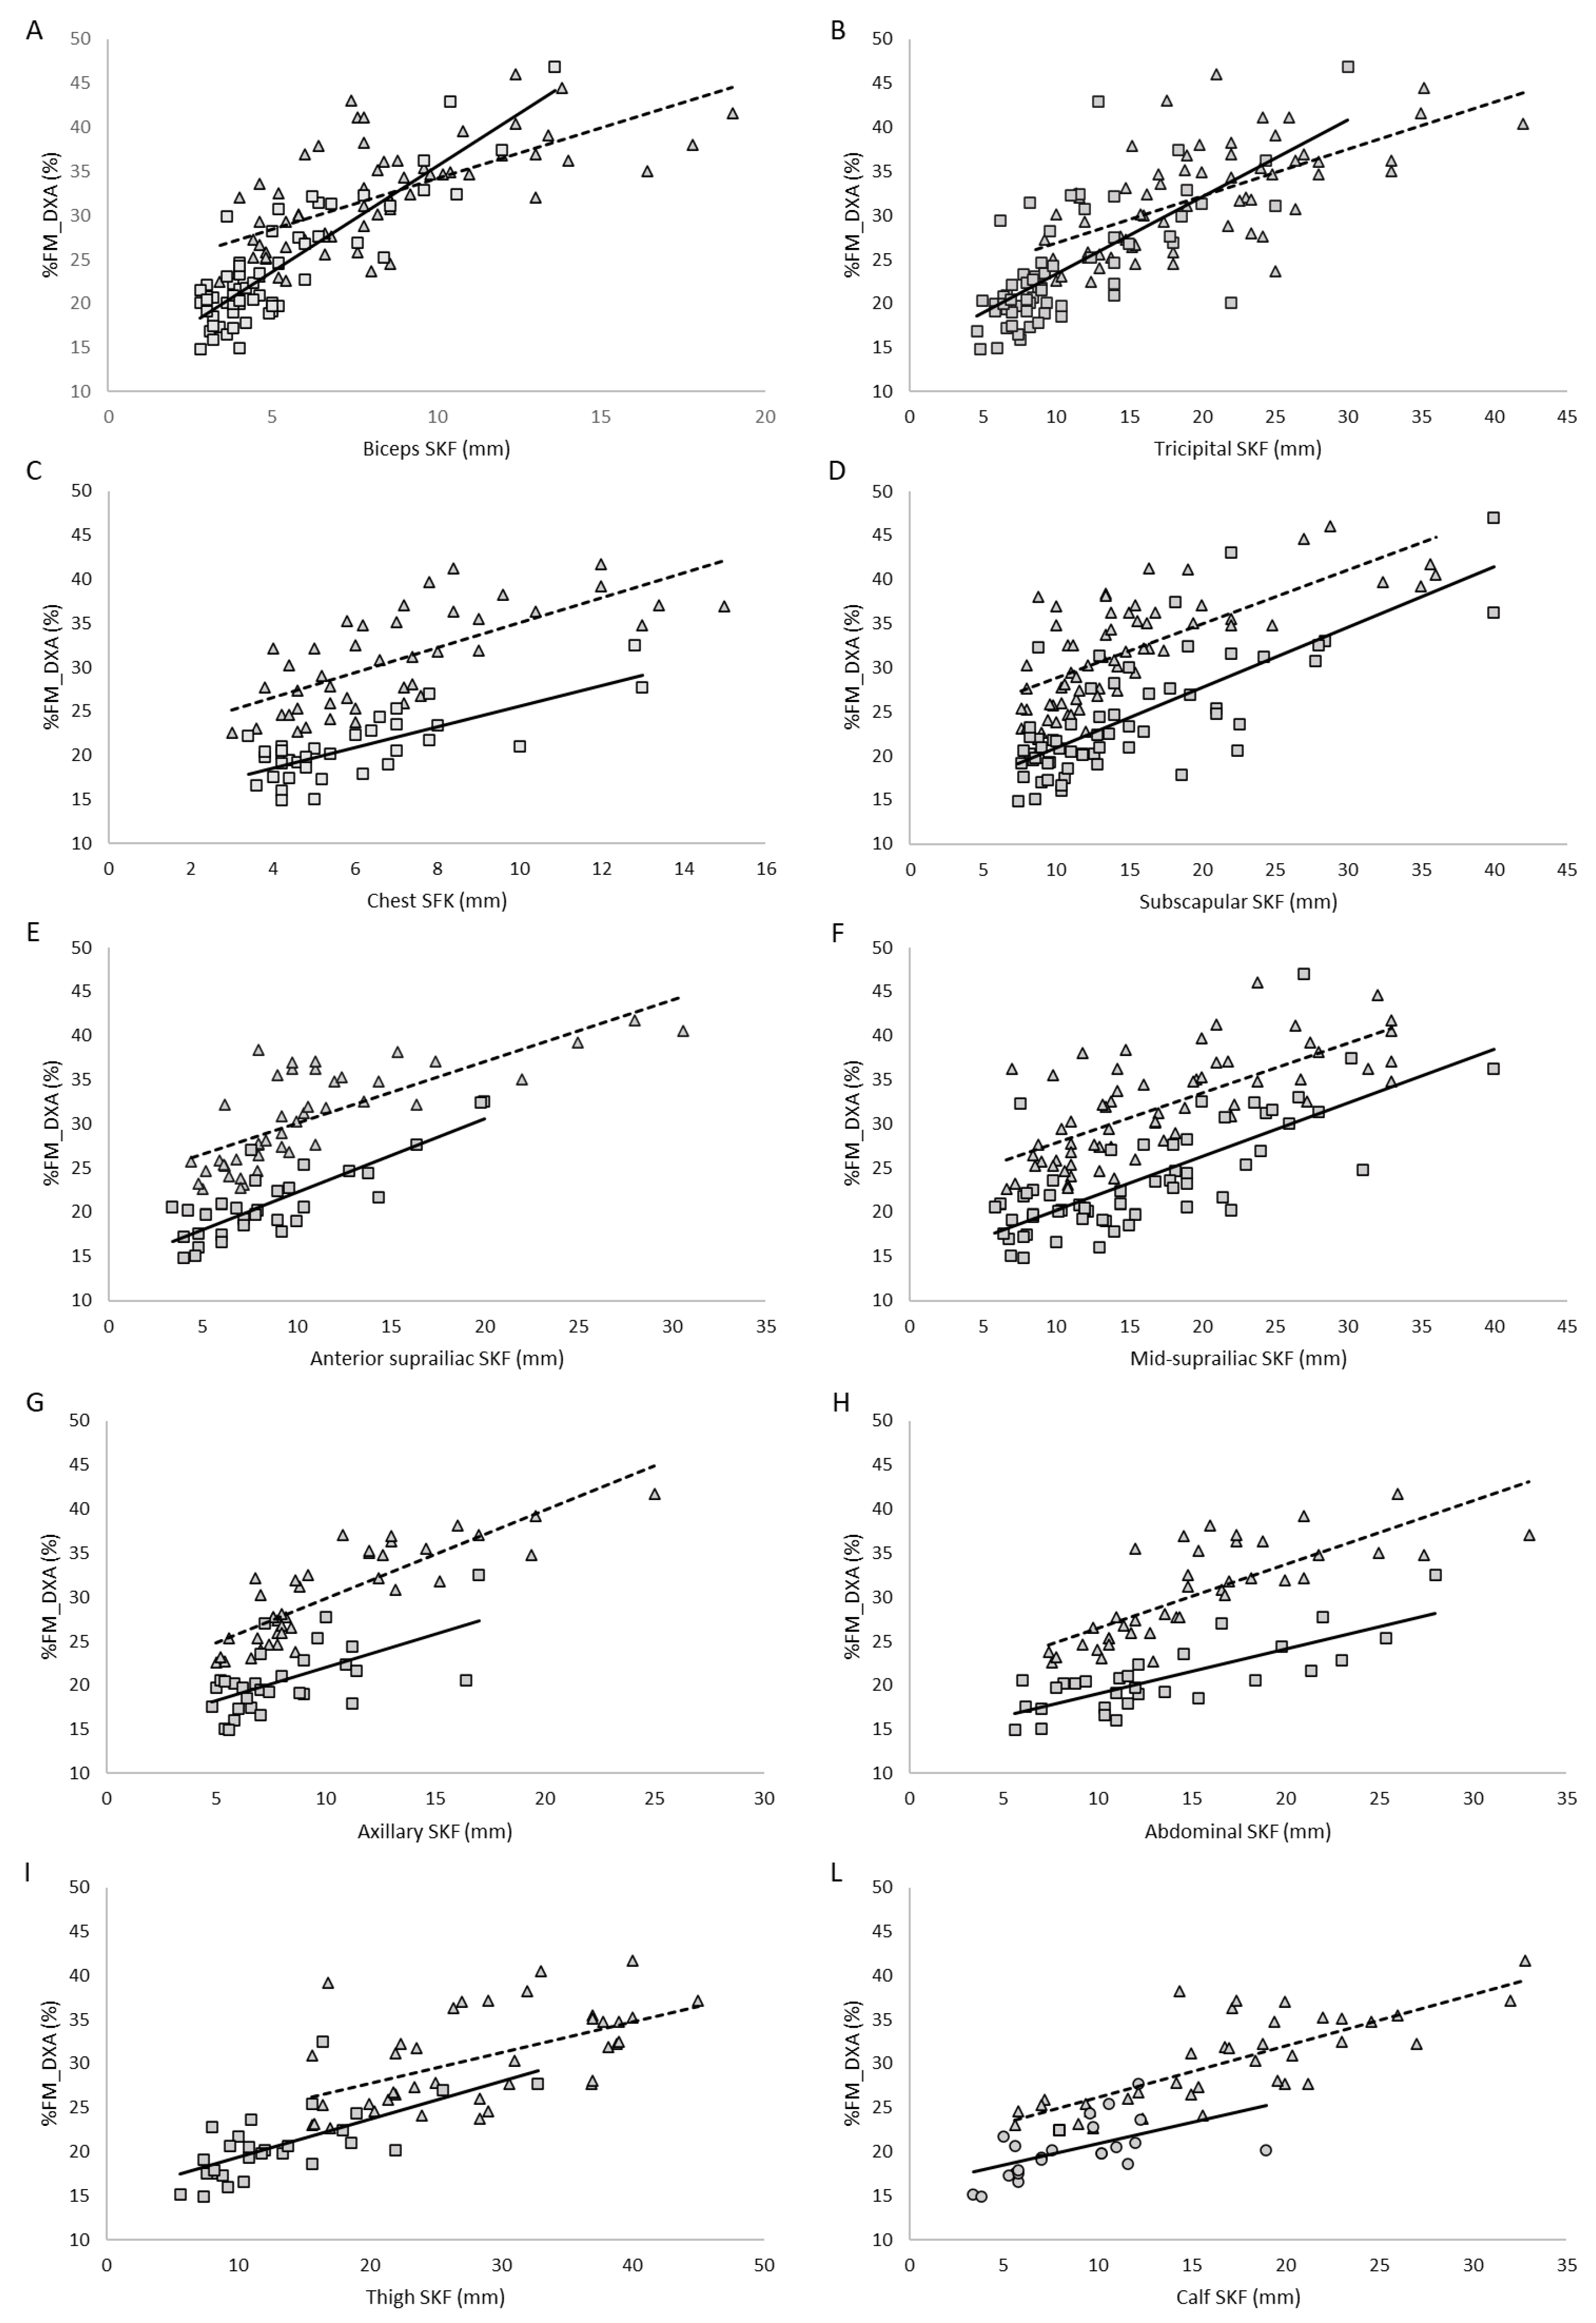
As shown in
Table 4 and
Figure 4, the correlation analysis revealed a positive and statistically significant association between each skinfold thickness and %FM_DXA in both groups. In male PA, the highest correlation between each skinfold thickness and %FM_DXA was observed for the biceps skinfold, and the lowest for the calf skinfold. In female PA, the highest correlation was found for the axillary skinfold, whereas the lowest was for the thigh skinfold. In both sexes, waist circumference showed the strongest correlation with %FM_DXA (
Table 4). Moreover, in both males and females, the sums of four, seven, and nine skinfolds showed positive and statistically significant correlations with %FM_DXA, with correlation coefficients greater than 0.7 (
Table 4). In both groups, the sum of nine skinfolds provided the highest predictive power for %FM_DXA (adjusted R2 = 0.76 in male PA and 0.79 in female PA), along with the lowest standard error of estimate (1.54 in male PA and 2.37 in female PA).
4. Discussion
Accurate assessment of body composition in athletes with impairments is crucial in Paralympic sports, given its relationship with both health and athletic performance. Unfortunately, however limited evidence exists in the literature regarding the ability of field measurements to accurately assess body composition in PA, particularly in female PA [
19].
The primary aim of this study was to evaluate the ability of ADP and field methods (i.e., existing skinfold equations validated in able-bodied populations, and BIA) to estimate %FM in male and female Paralympians, using DXA as the reference standard. The results showed that nearly all skinfold equations developed in able-bodied populations, as well as BIA and ADP, failed to accurately estimate %FM_DXA in both male and female Paralympians. In females, %FM_THO7 was the only skinfold equation that predicted %FM values close to %FM_DXA, with a mean bias of 0.13%; this difference was not statistically significant (
Table 3). However, the Bland–Altman plot (
Figure 3) showed that although nearly all data points fell within the 95% limits of agreement, the limits were very wide, indicating poor prediction accuracy. For all the other skinfold equations, the two-tailed paired-sample t-test revealed a significant systematic bias, with %FM_DXA being underestimated in both male and female Paralympians (
Table 3). In male PA, a large (≥ 4%) systematic bias was observed in all the evaluated skinfold equations, whereas in female PA it was found in 4 out of 6 skinfold equations. These findings are consistent with previous studies [
31,
33,
35] indicating that anthropometry for assessing %FM in PA systematically underestimate %FM_DXA. This suggests that skinfold equations developed in able-bodied populations are not adequate for accurately predicting %FM_DXA in male and female Paralympians. Consequently, our results highlight the need for specific skinfold equations tailored to this athletic population.
Our results showed that BIA consistently underestimated %FM compared with DXA, with large variations in BIA estimates and poor agreement in both male and female PA (
Table 3 and
Figure 2 and
Figure 3). So, in agreement with previous research [
31,
33], our findings suggest that BIA prediction equations do not adequately apply to this athletic population. The variability observed may be attributable to pronounced body asymmetry in athletes with unilateral amputation, as well as muscle atrophy and altered extracellular fluid distribution in the lower limbs of athletes with spinal cord injury, factors that could reduce the accuracy of this technique in this athletic population.
As far as ADP is concerned, the results showed that %FM estimated by ADP was significantly lower than %FM_DXA, with poor agreement between measurements in both male and female PA (
Table 3,
Figure 2 and
Figure 3). These results expand on previous findings in male wheelchair game players [
31] and suggest that ADP is not a valid method for estimating body composition in Paralympians, with its outcomes requiring cautious interpretation.
The interplay of multiple factors influencing body composition in this unique athletic population, such as sex, race, underlying health condition (e.g., spinal cord injury, limb/s amputation/s), level and asymmetry of lesion, practiced sport and level of participation, makes the development of population-specific equations particularly challenging. In this study, we aimed to advance the development of specific equations for PA by analyzing male and female athletes separately and by providing data from a sample homogeneous in race and athletic level (all athletes being Paralympians). The correlation analysis showed that in male PA, the correlation coefficients between %FM_DXA and the biceps, chest, subscapular, anterior suprailiac, and abdominal skinfolds were near or slightly above 0.8 (
Table 4 and
Figure 4). In female PA, the anterior suprailiac, axillary, abdominal, and calf skinfolds significantly correlated with %FM_DXA, with correlation coefficients near or slightly above 0.8 (
Table 4 and
Figure 4). These results may reflect sex-specific patterns of fat distribution. In this context it is also interesting to underlay that in both male and female athletes, the sum of nine skinfolds is able to predict more than 80% of variance in predicting the %FM_DXA. In male PA, the linear regression model which uses the sum of nine skinfolds as independent variable and %FM_DXA as dependent variable showed an adjusted R
2 near 0.80, with a relatively small SEE (~1.5). Theoretically, as already reported by Goosey-Tolfrey et al. [
31], an equation that includes a broader range of sites could better account for inter-individual variation in fat distribution. However, it should be noted that this potential advantage may be constrained by practical limitations when assessing certain lower-body sites in PA. Taken together, these results may be useful in clinical settings, as they can help the guide of nutritionists, sports physicians, and physical trainers in selecting anatomical sites and determining the number of skinfolds to include in the assessments, providing valuable information on the nutritional status of athletes of both genders when DXA is unavailable.
Although the relatively large number of PA enrolled in this study, we were unable to perform statistical analyses by underlying health condition within each male and female group due to the relatively small sample sizes in each subgroup. However, we made an effort to provide informative results stratified by both sex and health condition (
Table 1 and
Figure 1,
Figure 2 and
Figure 3), offering guidance for professionals in assessing body composition in PA, given the lack of other published information. In fact, despite the importance of accurately assessing body composition in this special athletic population, the accuracy of the currently available methods for estimating body composition in PA relative to DXA has been poorly investigated to date [
19,
31,
33,
34,
35]. These studies assessed the accuracy of anthropometry [
19,
31,
33,
34,
35], BIA [
31,
33], and ADP [
31] in relatively small and often heterogeneous samples of PA. For example, one study included 8 male and 8 female highly active athletes with spinal cord injury from a university team [
33]; another involved 19 female wheelchair game players, comprising both athletes who were ambulant with support and those who were non-ambulant during daily living [
19]; a third study examined 14 male elite wheelchair game players, either ambulant with support or non-ambulant during daily living [
35]; finally a further study evaluated 30 male trained wheelchair game players alongside 29 male athletes with unilateral lower limb amputation practicing a variety of adapted sports [
34]. Based on the above, and to the best of our knowledge, the present study represents a first attempt to address gaps in the literature, where previous research often involved small numbers of athletes, and/or evaluated the accuracy of only a single field method for assessing body composition versus DXA (e.g., skinfold equations only).
This study has some limitations that should be acknowledged. First, as noted above, the relatively small number of athletes within each health condition group prevented us from considering the combined effect of gender and health condition on the accuracy of field methods for estimating %FM_DXA. Second, the results obtained do not take into account the type of sport practiced by the athletes, which could influence the pattern of fat mass distribution. We aim in the future to increase the size of the study group in order to take into account all the different conditions, for example the sport practiced, and their influence on body composition.
However, a strength point of this study was that we considered three currently used methods that can be available to assess body composition in this athletic population when DXA cannot be used (i.e., anthropometry, BIA and ADP). A further strength of this study is that we provided data on a relatively large sample of male and female PA, all at the elite level.
In conclusion, the results of this study indicate a lack of transferability of available methods for assessing body composition (skinfold equations, BIA, and ADP) in estimating %FM compared to DXA in both male and female Paralympians, as these methods proved inaccurate. Given the importance of providing clinicians with accessible field-based methods to assess body composition in this special athletic population, future research should focus on developing approaches that integrate different factors, such as gender and type of impairment. The sum of skinfolds may represent a suitable option, particularly when combined with body circumferences. Although existing skinfold equations show limited accuracy compared to DXA, with large differences observed within para-athletes, and results should therefore be interpreted with caution, the sum of skinfolds can still be useful for monitoring individual changes in body composition throughout the season.
Author Contributions
Conceptualization, R.S., M.B., V.C., L.M.; methodology, R.S., M.B., V.C., L.M., A.T., L.T., A.F. and M.S.; validation, R.S., M.B. and M.S.; formal analysis, V.C.; investigation, R.S., M.B., L.M., A.T., L.T., A.F. and M.S.; data curation, R.S., M.B., V.C., L.M., A.T., L.T., L.F. and M.S.; writing—original draft preparation, R.S., M.B. and V.C.; supervision, R.S., M.B. and M.S. All authors have read and agreed to the published version of the manuscript.
Funding
This research received no external funding.
Institutional Review Board Statement
The study was conducted in accordance with the Declaration of Helsinki and approved by the Ethical Committee (CET - Comitato Etico Territoriale Lazio Area 1, date of approval 06\03\2024 IRB number 0208/2024).
Informed Consent Statement
Informed consent was obtained from all subjects involved in the study.
Data Availability Statement
Research data will be made available upon request to the corresponding author.
Acknowledgments
The authors would like to warmly thank all the athletes who participated in the study and their technical and medical staff for kind cooperation.
Conflicts of Interest
The authors declare no conflicts of interest.
Abbreviations
The following abbreviations are used in this manuscript:
| PA |
Paralympic athletes |
| DXA |
Dual-Energy X-ray Absorptiometry |
| BIA |
Bioelectrical Impedance Analysis |
| ADP |
Air Displacement Plethysmography |
| %FM_DXA |
DXA-assessed whole-body relative fat mass |
| SKFs |
skinfolds |
| %FM_BIA |
BIA-assessed whole-body relative fat mass |
| %FM_ADP |
ADP-assessed whole-body relative fat mass |
| %FM_DW |
%FM estimated by the Durnin and Womersley equation |
| %FM_EV3 |
%FM estimated using the three-site equation by Evans and colleagues |
| %FM_EV7 |
%FM estimated using the seven-site equation by Evans and colleagues |
| %FM_POL |
%FM estimated using the equation by Pollock and colleagues |
| %FM_THO3 |
%FM estimated using the three-site equation by Thorland and colleagues |
| %FM_THO7 |
%FM estimated using the seven-site equation by Thorland and colleagues |
| SCI |
Spinal Cord Injuries and Related Disorders Group |
| AMP |
Amputation Group |
| BI |
Brain Injury Group |
| OTH |
Other Health Conditions Group |
| VI |
Vision and Intellectual Health Conditions Group |
| BMI |
Body Mass Index |
| rP
|
Pearson product–moment correlation coefficient |
| rs
|
Spearman rank correlation coefficient |
| P |
p-value |
References
- International Paralympic Committee Annual Report 2019.
- International Paralympic Committee Annual Report 2020.
- International Paralympic Committee Annual Report 2022.
- Bundon, A.; Ashfield, A.; Smith, B.; Goosey-Tolfrey, V.L. Struggling to Stay and Struggling to Leave: The Experiences of Elite Para-Athletes at the End of Their Sport Careers. Psychol Sport Exerc 2018, 37, 296–305. [Google Scholar] [CrossRef]
- Nabhan, D.; Lewis, M.; Taylor, D.; Bahr, R. Expanding the Screening Toolbox to Promote Athlete Health: How the US Olympic & Paralympic Committee Screened for Health Problems in 940 Elite Athletes. Br J Sports Med 2021, 55, 226–230. [Google Scholar] [CrossRef]
- Steffen, K.; Bahr, R.; Clarsen, B.; Fossan, B.; Fredriksen, H.; Gjelsvik, H.; Haugvad, L.; Hoksrud, A.F.; Iversen, E.; Koivisto-Mørk, A.; et al. Comprehensive Periodic Health Evaluations of 454 Norwegian Paralympic and Olympic Athletes over 8 Years: What Did We Learn? Br J Sports Med 2024, 58, 826–835. [Google Scholar] [CrossRef]
- Steffen, K.; Clarsen, B.; Gjelsvik, H.; Haugvad, L.; Koivisto-Mørk, A.; Bahr, R.; Berge, H. Illness and Injury among Norwegian Para Athletes over Five Consecutive Paralympic Summer and Winter Games Cycles: Prevailing High Illness Burden on the Road from 2012 to 2020. Br J Sports Med 2021, 56, bjsports–2021. [Google Scholar] [CrossRef]
- Pelliccia, A.; Quattrini, F.M.; Squeo, M.R.; Caselli, S.; Culasso, F.; Link, M.S.; Spataro, A.; Bernardi, M. Cardiovascular Diseases in Paralympic Athletes. Br J Sports Med 2016, 50, 1075–1080. [Google Scholar] [CrossRef]
- Bernardi, M. 1; Romano, S. 2; Squeo, M.R. 3; Guerra, E. 4; Adami, P.E. 5; Alviti, F. 6; Mattei, A. 7; Corsi, L. 8; Lanzano, R. 8; Curatulo, P.G. 8; et al. Aerobic Fitness Is a Potential Crucial Factor in Protecting Paralympic Athletes with Locomotor Impairments from Atherosclerotic Cardiovascular Risk. Sport Sci Health 2021, 363–374. [Google Scholar] [CrossRef]
- Pinheiro, L.; Verhagen, E.; Ocarino, J.; Fagher, K.; Ahmed, O.H.; Dalton, K.; Mann, D.L.; Weiler, R.; Akinyi Okoth, C.; Blauwet, C.A.; et al. Periodic Health Evaluation in Para Athletes: A Position Statement Based on Expert Consensus. BMJ Open Sport Exerc Med 2024, 10, e001946. [Google Scholar] [CrossRef]
- Hawkeswood, J.P.; O’Connor, R.; Anton, H.; Finlayson, H. The Preparticipation Evaluation for Athletes with Disability. Int J Sports Phys Ther 2014, 9, 103–115. [Google Scholar]
- Van de Vliet, P. Paralympic Athlete’s Health. Br J Sports Med 2012, 46, 458–459. [Google Scholar] [CrossRef]
- Slater, G.; Goosey-Tolfrey, V. Assessing Body Composition of Athletes. In Sports Nutrition for Paralympic Athletes, Second Edition; CRC Press, 2019 ISBN 978-0-429-49195-5.
- International Paralympic Committee IPC Classification - Paralympic Categories & How to Qualify 2025.
- Goosey-Tolfrey, V.L.; Sutton, L. Body Composition in Chronic Disease and Disability. In Body Composition in Sport, Exercise and Health; Routledge, 2012 ISBN 978-0-203-13304-0.
- Flueck, J.L. Body Composition in Swiss Elite Wheelchair Athletes. Front Nutr 2020, 7, 1. [Google Scholar] [CrossRef]
- Cavedon, V.; Peluso, I.; Toti, E.; Sandri, M.; Pedrinolla, A.; Zancanaro, C.; Milanese, C. DXA-Measured Total and Regional Body Composition in Female Athletes with a Physical Impairment. J funct morphol kinesiol 2025, 10, 49. [Google Scholar] [CrossRef]
- Cavedon, V.; Sandri, M.; Peluso, I.; Zancanaro, C.; Milanese, C. Body Composition and Bone Mineral Density in Athletes with a Physical Impairment. PeerJ 2021, 9, e11296. [Google Scholar] [CrossRef]
- Sutton, L.; Wallace, J.; Goosey-Tolfrey, V.; Scott, M.; Reilly, T. Body Composition of Female Wheelchair Athletes. Int J Sports Med 2009, 30, 259–265. [Google Scholar] [CrossRef]
- Cavedon, V.; Zancanaro, C.; Milanese, C. Body Composition Assessment in Athletes with Physical Impairment Who Have Been Practicing a Wheelchair Sport Regularly and for a Prolonged Period. Disabil Health J 2020, 13, 100933. [Google Scholar] [CrossRef] [PubMed]
- Miyahara, K.; Wang, D.-H.; Mori, K.; Takahashi, K.; Miyatake, N.; Wang, B.-L.; Takigawa, T.; Takaki, J.; Ogino, K. Effect of Sports Activity on Bone Mineral Density in Wheelchair Athletes. J Bone Miner Metab 2008, 26, 101–106. [Google Scholar] [CrossRef] [PubMed]
- Sherk, V.D.; Bemben, M.G.; Bemben, D.A. Interlimb Muscle and Fat Comparisons in Persons with Lower-Limb Amputation. Arch Phys Med Rehabil 2010, 91, 1077–1081. [Google Scholar] [CrossRef]
- Gorgey, A.S.; Dudley, G.A. Skeletal Muscle Atrophy and Increased Intramuscular Fat after Incomplete Spinal Cord Injury. Spinal Cord 2007, 45, 304–309. [Google Scholar] [CrossRef]
- Gorgey, A.S.; Shepherd, C. Skeletal Muscle Hypertrophy and Decreased Intramuscular Fat after Unilateral Resistance Training in Spinal Cord Injury: Case Report. J Spinal Cord Med 2010, 33, 90–95. [Google Scholar] [CrossRef]
- Stillman, M.D.; Williams, S. Guideline for the Identification and Management of Cardiometabolic Risk after Spinal Cord Injury: A Case of Unsubstantiated Recommendations. Spinal Cord Ser Cases 2019, 5, 97. [Google Scholar] [CrossRef]
- Farkas, G.J.; Gater, D.R. Neurogenic Obesity and Systemic Inflammation Following Spinal Cord Injury: A Review. J Spinal Cord Med 2018, 41, 378–387. [Google Scholar] [CrossRef]
- Bernardi, M.; Carucci, S.; Faiola, F.; Egidi, F.; Marini, C.; Castellano, V.; Faina, M. Physical Fitness Evaluation of Paralympic Winter Sports Sitting Athletes. Clin J Sport Med 2012, 22, 26–30. [Google Scholar] [CrossRef] [PubMed]
- van der Scheer, J.W.; Totosy de Zepetnek, J.O.; Blauwet, C.; Brooke-Wavell, K.; Graham-Paulson, T.; Leonard, A.N.; Webborn, N.; Goosey-Tolfrey, V.L. Assessment of Body Composition in Spinal Cord Injury: A Scoping Review. PLoS One 2021, 16, e0251142. [Google Scholar] [CrossRef] [PubMed]
- Stewart, A.D.; Sutton, L. Body Composition in Sport, Exercise and Health; Routledge, 2012; ISBN 978-0-415-61497-9.
- Keil, M.; Totosy de Zepetnek, J.O.; Brooke-Wavell, K.; Goosey-Tolfrey, V.L. Measurement Precision of Body Composition Variables in Elite Wheelchair Athletes, Using Dual-Energy X-Ray Absorptiometry. Eur J Sport Sci 2016, 16, 65–71. [Google Scholar] [CrossRef] [PubMed]
- Goosey-Tolfrey, V.; Keil, M.; Brooke-Wavell, K.; de Groot, S. A Comparison of Methods for the Estimation of Body Composition in Highly Trained Wheelchair Games Players. Int J Sports Med 2016, 37, 799–806. [Google Scholar] [CrossRef]
- Heyward, V.H.; Wagner, D.R. Applied Body Composition Assessment; Human Kinetics, 2004; ISBN 978-0-7360-4630-5.
- Mojtahedi, M.C.; Valentine, R.J.; Evans, E.M. Body Composition Assessment in Athletes with Spinal Cord Injury: Comparison of Field Methods with Dual-Energy X-Ray Absorptiometry. Spinal Cord 2009, 47, 698–704. [Google Scholar] [CrossRef]
- Cavedon, V.; Zancanaro, C.; Milanese, C. Anthropometric Prediction of DXA-Measured Body Composition in Female Team Handball Players. PeerJ 2018, 6, e5913. [Google Scholar] [CrossRef]
- Willems, A.; Paulson, T.A.W.; Keil, M.; Brooke-Wavell, K.; Goosey-Tolfrey, V.L. Dual-Energy X-Ray Absorptiometry, Skinfold Thickness, and Waist Circumference for Assessing Body Composition in Ambulant and Non-Ambulant Wheelchair Games Players. Front Physiol 2015, 6, 356. [Google Scholar] [CrossRef]
- Pelliccia, A.; Quattrini, F.M.; Cavarretta, E.; Squeo, M.R.; Adami, P.E.; Di Paolo, F.M.; Spataro, A.; Bernardi, M. Physiologic and Clinical Features of the Paralympic Athlete’s Heart. JAMA Cardiology 2021, 6, 30–39. [Google Scholar] [CrossRef]
- Lohman, T.G.; Roche, A.F.; Martorell, R. Anthropometric Standardization Reference Manual; Books on Demand, 1988; ISBN 978-0-608-06440-6.
- Evans, E.M.; Rowe, D.A.; Misic, M.M.; Prior, B.M.; Arngrímsson, S.A. Skinfold Prediction Equation for Athletes Developed Using a Four-Component Model. Med Sci Sports Exerc 2005, 37, 2006–2011. [Google Scholar] [CrossRef]
- Durnin, J.V.G.A.; Womersley, J. Body Fat Assessed from Total Body Density and Its Estimation from Skinfold Thickness: Measurements on 481 Men and Women Aged from 16 to 72 Years. Br J Nutr 1974, 32, 77–97. [Google Scholar] [CrossRef]
- Pollock, M.L.; Hickman, T.; Kendrick, Z.; Jackson, A.; Linnerud, A.C.; Dawson, G. Prediction of Body Density in Young and Middle-Aged Men. J Appl Physiol 1976, 40, 300–304. [Google Scholar] [CrossRef]
- Thorland, W.G.; Johnson, G.O.; Tharp, G.D.; Housh, T.J.; Cisar, C.J. Estimation of Body Density in Adolescent Athletes. Hum Biol 1984, 56, 439–448. [Google Scholar]
- Siri, W. Body Volume Measurement by Gas Dilution.; 1961.
- COSMED BOD POD Gold Standard Body Composition Tracking System Operator’s Manual-P/N 210-2400 Rev. M-DCO 1765 2015.
- Nana, A.; Slater, G.J.; Stewart, A.D.; Burke, L.M. Methodology Review: Using Dual-Energy X-Ray Absorptiometry (DXA) for the Assessment of Body Composition in Athletes and Active People. Int J Sport Nutr Exerc Metab 2015, 25, 198–215. [Google Scholar] [CrossRef]
- Lin, L.I. A Concordance Correlation Coefficient to Evaluate Reproducibility. Biometrics 1989, 45, 255–268. [Google Scholar] [CrossRef]
- Harper, W.V. Reduced Major Axis Regression. In Wiley StatsRef: Statistics Reference Online; John Wiley & Sons, Ltd, 2016; pp. 1–6 ISBN 978-1-118-44511-2.
- Bland, J.M.; Altman, D.G. Agreed Statistics: Measurement Method Comparison. Anesthesiology 2012, 116, 182–185. [Google Scholar] [CrossRef]
- Heymsfield, S.B.; Peterson, C.M.; Thomas, D.M.; Heo, M.; Schuna, J.M. Why Are There Race/Ethnic Differences in Adult Body Mass Index–Adiposity Relationships? A Quantitative Critical Review. Obes Rev 2016, 17, 262–275. [Google Scholar] [CrossRef]
Figure 1.
Box plot of relative fat mass estimated by DXA in male (Panel A) and female (Panel B) athletes in the total sample stratified by health condition. Legend: %FM_DXA, whole-body relative fat mass; WS, whole sample; SCI, Spinal Cord Injuries and Related Disorders Group; AMP, Amputation Group; BI, Brain Injury Group; OTH, Other Health Conditions Group; VI, Vision and Intellectual Health Conditions Group.
Figure 2.
Bland–Altman plots showing the agreement by health condition between the relative fat mass assessed though skinfold equations (Panels A-F), BIA (Panel G), and ADP (Panel H) and the relative fat mass assessed though DXA in males. Legend: SCI, Spinal Cord Injuries and Related Disorders Group; AMP, Amputation Group; BI, Brain Injury Group; OTH, Other Health Conditions Group; VI, Vision and Intellectual Health Conditions Group. The solid lines indicate bias ± 2 standard deviations.
Figure 3.
Bland–Altman plots showing the agreement by health condition between the relative fat mass assessed though skinfold equations (Panels A-F), BIA (Panel G), and ADP (Panel H) and the relative fat mass assessed though DXA in females. Legend: SCI, Spinal Cord Injuries and Related Disorders Group; AMP, Amputation Group; BI, Brain Injury Group; OTH, Other Health Conditions Group; VI, Vision and Intellectual Health Conditions Group. The solid lines indicate bias ± 2 standard deviations.
Figure 4.
Correlation between skinfold thicknesses and relative fat mass assessed by DXA in male PA (squares) and female PA (triangles). Legend: %FM_DXA, relative fat mass assessed though DXA; SKF, skinfold; the solid line represents the regression line in the male group; the dashed line represents the regression line in the female group.
Table 1.
Skinfold equations used in this study to predict body density or relative fat mass in Paralympians.
Table 1.
Skinfold equations used in this study to predict body density or relative fat mass in Paralympians.
| References |
Abbreviation |
Sex |
Skinfold Equation |
| Durnin and Womersley, 1974 |
%FM_DW |
M |
BD = 1.1765 – [0.0744 · log10 (BI + TR + SS + SI)] |
| F |
BD = 1.1567 – [0.0717 · log10 (BI + TR + SS + SI)] |
| Evans et al, 2005 |
%FM_EV3 |
M/F |
%FM = 8.997 + [0.24658 · (TR + AB + TH)] – (6.343 · Sex) – (1.998 · Race) |
| Evans et al, 2005 |
%FM_EV7 |
M/F |
%FM = 10.566 + [0.12077 · (TR + SI + TH + SS + AX + CH + AB)] – (8.057 · Sex) – (2.545 · Race) |
| Pollock et al, 1976 |
%FM_POL |
M |
BD = 1.09716 – (0.00065 · CH) – (0.00055 · SS) – (0.0008 ·TH) |
| F |
BD = 1.0852 – (0.0008 · SI) – (0.00011 · TH) |
| Thorland et al, 1984 |
%FM_THO3 |
M |
BD = 1.1136 – [0.00154 · (TR + SS + AX)] + [0.00000516 · (TR + SS + AX)2] |
| F |
BD = 1.0987 – [0.00122 · (TR + SS + SI)] + [0.00000263 · (TR + SS + SI)2] |
| Thorland et al, 1984 |
%FM_THO7 |
M |
BD = 1.1091 – [0.00052 · (TR + SS + AX + SI + AB + TH + CA)] + [0.00000032 · (TR + SS + AX + SI + AB + TH + CA)2] |
| F |
BD = 1.1046 – [0.00059 · (TR + SS + AX + SI + AB + TH + CA)] + [0.00000060 · (TR + SS + AX + SI + AB + TH + CA)2] |
Table 2.
General characteristics of athletes stratified by gender and health conditions. Data are presented as Mean and standard deviation (SD).
Table 2.
General characteristics of athletes stratified by gender and health conditions. Data are presented as Mean and standard deviation (SD).
| |
|
Males |
|
Females |
|
| Variable |
Group |
Mean |
SD |
Mean |
SD |
| Age (years) |
SCI |
35.3 |
10.7 |
35.0 |
10.1 |
| |
AMP |
29.1 |
6.4 |
29.5 |
8.0 |
| |
BI |
32.3 |
9.3 |
27.3 |
2.1 |
| |
OTH |
32.6 |
9.3 |
35.5 |
10.2 |
| |
VI |
24.0 |
4.4 |
31.1 |
10.5 |
| Body Mass (kg) |
SCI |
69.1 |
11.5 |
58.2 |
8.0 |
| |
AMP |
68.1 |
14.6 |
56.5 |
7.7 |
| |
BI |
65.9 |
8.5 |
67.4 |
17.7 |
| |
OTH |
68.4 |
16.1 |
67.4 |
10.7 |
| |
VI |
83.3 |
11.8 |
74.1 |
26.8 |
| Stature (cm) |
SCI |
175.0 |
12.9 |
166.3 |
9.9 |
| |
AMP |
173.1 |
17.5 |
166.3 |
4.9 |
| |
BI |
176.4 |
8.4 |
166.3 |
8.4 |
| |
OTH |
176.6 |
7.0 |
168.1 |
7.8 |
| |
VI |
178.8 |
1.9 |
171.2 |
8.3 |
| BMI (kg/m2) |
SCI |
22.8 |
5.0 |
21.1 |
3.1 |
| |
AMP |
22.8 |
3.8 |
20.4 |
2.2 |
| |
BI |
21.1 |
1.8 |
24.1 |
3.7 |
| |
OTH |
21.8 |
4.3 |
23.9 |
4.0 |
| |
VI |
26.1 |
4.2 |
24.8 |
6.7 |
Table 3.
Agreement between fat mass percentage obtained using skinfold equations, BIA, and ADP, and that measured by DXA (reference method) in Paralympians. .
Table 3.
Agreement between fat mass percentage obtained using skinfold equations, BIA, and ADP, and that measured by DXA (reference method) in Paralympians. .
| |
Descriptive statistics |
Paired
t-test |
CCC |
RMA
regression |
Bland-Altman
Analysis |
| Method |
Mean |
SD |
Bias |
t |
P |
ρc |
Slope |
Int |
U LoA |
L LoA |
Range |
| Males |
|
|
|
|
|
|
|
|
|
|
|
| %FM_DW (n = 59) |
19.17 |
5.80 |
-4.55 |
9.59 |
<0.001 |
0.64 |
0.92 |
-2.71 |
2.43 |
-11.53 |
13.96 |
| %FM_EV3 (n = 28) |
11.49 |
3.26 |
-9.23 |
22.93 |
<0.001 |
0.20 |
0.81 |
-5.36 |
-5.25 |
-13.21 |
7.95 |
| %FM_EV7 (n = 28) |
11.04 |
2.99 |
-9.68 |
26.47 |
<0.001 |
0.17 |
0.74 |
-4.38 |
-5.94 |
-13.42 |
7.47 |
| %FM_POL (n = 28) |
9.91 |
3.42 |
-10.69 |
21.90 |
<0.001 |
0.16 |
0.85 |
-7.64 |
-6.46 |
-14.91 |
8.45 |
| %FM_THO3 (n = 28) |
14.53 |
6.32 |
-5.66 |
6.70 |
<0.001 |
0.38 |
1.92 |
-24.25 |
2.90 |
-14.22 |
17.12 |
| %FM_THO 7 (n = 25) |
12.64 |
5.83 |
-8.02 |
9.18 |
<0.001 |
0.35 |
1.48 |
-17.91 |
-2.40 |
-13.64 |
11.25 |
| %FM_BIA (n = 58) |
13.97 |
10.18 |
-9.16 |
10.38 |
<0.001 |
0.42 |
1.69 |
-25.21 |
4.01 |
-22.33 |
26.34 |
| %FM_ADP (n = 27) |
15.10 |
6.63 |
-5.33 |
5.72 |
<0.001 |
0.50 |
1.71 |
-19.74 |
2.31 |
-12.97 |
15.27 |
| Females |
|
|
|
|
|
|
|
|
|
|
|
| %FM_DW (n = 61) |
29.99 |
5.09 |
-1.78 |
4.03 |
<0.001 |
0.76 |
0.86 |
2.54 |
4.99 |
-8.56 |
13.55 |
| %FM_EV3 (n = 38) |
24.50 |
4.20 |
-5.92 |
10.96 |
<0.001 |
0.42 |
0.80 |
0.27 |
0.60 |
-12.44 |
13.04 |
| %FM_EV7 (n = 38) |
23.26 |
3.82 |
-7.15 |
16.45 |
<0.001 |
0.37 |
0.72 |
1.24 |
-1.90 |
-12.41 |
10.51 |
| %FM_POL (n = 39) |
23.71 |
5.52 |
-6.96 |
10.91 |
<0.001 |
0.40 |
1.01 |
-7.33 |
0.85 |
-14.77 |
15.62 |
| %FM_THO3 (n = 59) |
22.43 |
7.49 |
-9.00 |
10.84 |
<0.001 |
0.28 |
1.31 |
-18.65 |
3.50 |
-21.51 |
25.01 |
| %FM_THO 7 (n = 36) |
30.34 |
10.34 |
0.13 |
-0.12 |
0.909 |
0.67 |
2.02 |
-30.67 |
13.08 |
-12.82 |
25.90 |
| %FM_BIA (n = 63) |
22.90 |
8.44 |
-9.56 |
11.66 |
<0.001 |
0.35 |
1.27 |
-18.23 |
3.20 |
-22.31 |
25.51 |
| %FM_ADP (n = 36) |
29.43 |
8.03 |
-2.33 |
4.38 |
<0.001 |
0.85 |
1.39 |
-14.57 |
4.00 |
-8.48 |
12.48 |
Table 4.
Correlations of skinfold thicknesses and body circumferences with relative fat mass measured by DXA.
Table 4.
Correlations of skinfold thicknesses and body circumferences with relative fat mass measured by DXA.
| |
Males |
Females |
| Variable |
n |
rP/rs
|
Adj R2
|
SEE |
P |
n |
rP/rs
|
Adj R2
|
SEE |
P |
| Biceps SFK |
62 |
0.862 |
0.739 |
3.39 |
<0.001 |
64 |
0.682 |
0.429 |
4.54 |
<0.001 |
| Triceps SKF |
63 |
0.715 |
0.504 |
4.66 |
<0.001 |
63 |
0.647 |
0.400 |
4.63 |
<0.001 |
| Chest SKF |
34 |
0.751 |
0.551 |
2.47 |
<0.001 |
43 |
0.733 |
0.495 |
3.99 |
<0.001 |
| Subscapular SKF |
62 |
0.754 |
0.561 |
4.39 |
<0.001 |
62 |
0.725 |
0.505 |
4.18 |
<0.001 |
| Anterior suprailiac SKF |
31 |
0.830 |
0.678 |
2.50 |
<0.001 |
44 |
0.806 |
0.549 |
3.71 |
<0.001 |
| Mid-suprailiac SKF |
60 |
0.735 |
0.533 |
4.27 |
<0.001 |
62 |
0.722 |
0.506 |
4.17 |
<0.001 |
| Axillary SKF |
30 |
0.593 |
0.329 |
3.19 |
0.001 |
39 |
0.842 |
0.710 |
2.89 |
<0.001 |
| Abdominal SKF |
30 |
0.791 |
0.612 |
2.41 |
<0.001 |
40 |
0.835 |
0.587 |
3.45 |
<0.001 |
| Thigh SKF |
28 |
0.668 |
0.424 |
3.04 |
<0.001 |
39 |
0.590 |
0.277 |
4.63 |
<0.001 |
| Calf SKF |
24 |
0.554 |
0.276 |
2.67 |
0.005 |
37 |
0.773 |
0.586 |
3.31 |
<0.001 |
| Sum of four SKFs |
60 |
0.792 |
0.729 |
3.25 |
<0.001 |
61 |
0.818 |
0.620 |
3.64 |
<0.001 |
| Sum of seven SKFs |
29 |
0.741 |
0.692 |
2.20 |
<0.001 |
39 |
0.892 |
0.772 |
2.56 |
<0.001 |
| Sum of nine SKFs |
24 |
0.878 |
0.760 |
1.54 |
<0.001 |
37 |
0.899 |
0.787 |
2.37 |
<0.001 |
| Waist circumference |
30 |
0.475 |
0.198 |
3.47 |
0.008 |
41 |
0.753 |
0.485 |
3.95 |
<0.001 |
| Abdominal circumference |
30 |
0.455 |
0.179 |
3.50 |
0.011 |
40 |
0.716 |
0.211 |
4.93 |
0.002 |
| Hip circumference |
21 |
0.241 |
0.009 |
3.18 |
0.292 |
33 |
0.720 |
0.503 |
3.76 |
<0.001 |
|
Disclaimer/Publisher’s Note: The statements, opinions and data contained in all publications are solely those of the individual author(s) and contributor(s) and not of MDPI and/or the editor(s). MDPI and/or the editor(s) disclaim responsibility for any injury to people or property resulting from any ideas, methods, instructions or products referred to in the content. |
© 2025 by the authors. Licensee MDPI, Basel, Switzerland. This article is an open access article distributed under the terms and conditions of the Creative Commons Attribution (CC BY) license (http://creativecommons.org/licenses/by/4.0/).