
Submitted:
01 August 2025
Posted:
04 August 2025
You are already at the latest version
Abstract
Phase angle (PhA) is a widely used bioimpedance index associated with cell mass, membrane integrity, skeletal muscle mass and quality, and body fluid distribution. However, its relationship with body fat is unclear, with inconsistent findings in the literature.
This study aims to investigate the relationship between PhA and body fat. The analysis involved 1533 adults of both sexes from the National Health and Nutrition Examination Survey. Anthropometry, bioimpedance analysis, and dual-energy X-ray absorptiometry were used to estimate body mass index (BMI), PhA, and body fat, respectively. Non-linear cubic spline regression models were applied to examine the associations between PhA and fat mass (FM), BMI, fat mass index (FMI), and FM%.
The relationship between PhA and body fat was always non-linear. An initial positive slope was observed with FM, FMI and BMI, followed by a decline, whereas FM% exhibited a flatter initial pattern before decreasing. Men showed more pronounced inflection points at lower fat levels than women. Although significant, the explained variance of the relationships was lower than 10%.
In conclusion, this study demonstrates a non-linear relationship between PhA and body fat. The observed decline in PhA at higher fat levels suggests the onset of clinical complications in people with obesity.
Keywords:
body composition
; bioelectrical impedance analysis
; obesity
1. Introduction
The phase angle (PhA, °) is a bioimpedance index that is widely used in biomedical research into body composition [1]. It is unaffected by errors arising from assumptions about body geometry or tissue properties, because it is calculated directly from the ratio of reactance (Xc, ohms) to resistance (R, ohms), typically measured at a frequency of 50 kHz. From an electrophysiological perspective, PhA reflects the phase shift induced by cell membranes, which act as capacitors by storing electrical charge and thus delaying the current relative to the voltage. As such, PhA is considered an indicator of both cell membrane integrity and body cell mass [2].
Research has consistently shown that phase angle is associated with health status. Low PhA values have been observed in various clinical conditions, in the presence of inflammation, and are linked to longer hospital stays and higher mortality rates [3]. Furthermore, PhA tends to be higher in men than in women and in physically active individuals, and it declines with age regardless of the population [4,5,6].
Most of these associations can be explained by the relationship between PhA and body composition. Specifically, PhA values are positively associated with fat-free mass (FFM), muscle mass and quality, and the relative amount of extracellular water [7,8,9].
The relationship between phase angle and body fat is less clear. Recent reviews have reported inconsistent findings across studies [10,11,12], with null, negative, and positive associations observed in different samples. Some authors have also observed a non-linear association between PhA and BMI, precisely a positive correlation among individuals with low or normal weight, and a negative association in those with severe obesity [13,14,15,16].
However, research into the relationship between PhA and fat mass has primarily relied on indirect, second-level methods of body fat assessment, such as anthropometry and bioelectrical impedance analysis (BIA), and has employed statistical tools with limited capacity to detect non-linear associations.
This study aims to analyse the relationship between phase angle and fat mass (FM), as measured by dual-energy X-ray absorptiometry (DXA), as well as related indices (BMI, FMI, FM%) in a large sample of U.S. young adults. Statistical methods appropriate for curvilinear relationships will be applied.
2. Materials and Methods
2.1. The Sample
The dataset comprises 1533 adults (810 men and 723 women) aged between 21 and 49 years (men: 34.2 ± 8.6 years; women: 35.3 ± 8.4 years). Participants were selected from the 2003–2004 cycle of the National Health and Nutrition Examination Survey (NHANES) [17], the most recent cycle to provide data from both bioelectrical impedance analysis (BIA) and dual-energy X-ray absorptiometry (DXA). The sample corresponds to that analysed by Buffa et al. [18], although 57 individuals were excluded due to cases lacking complete data for the variables of interest.
2.2. Measurements
The protocols adopted in the 2003–2004 NHANES cycle, including procedures, guidelines, and quality standards, are documented in manuals available on the CDC website (www.cdc.gov). All measurements were performed by trained technicians using regularly calibrated equipment. Body weight was measured with a Toledo electronic scale and height with a Seca electronic stadiometer. Bioelectrical parameters were obtained using the HYDRA ECF/ICF Bio-Impedance Spectrum Analyzer 4200 (Xitron Technologies, Inc., San Diego, CA, USA) and whole-body DXA scans were performed with a Hologic QDR-4500A fan-beam densitometer (Hologic, Inc., Bedford, MA, USA).
The selected variables included demographic data such as age and sex, as well as anthropometric measurements (weight, height, and BMI), bioelectrical variables (resistance, R, and reactance, Xc), measured at 50 kHz, and DXA measurements (fat mass, FM). Phase angle (PhA) was calculated as arctan (Xc/R) × 180/π. Fat mass percentage (FM%) was defined as FM divided by weight × 100, and fat mass index (FMI) as FM divided by height squared [19].
2.3. Statistical Analysis
Descriptive statistics for anthropometric and bioelectrical variables were calculated separately for each sex.
The association between phase angle and fat mass indicators was analysed using multiple non-linear regression. Due to the curvilinear relationship between the variables, the regression analysis was performed using cubic splines, a type of mathematical curve that can be used to interpolate complex relationships in data, with a normally distributed response variable [20]. Cubic splines were estimated as follows:
where Y is the response (PhA) and S represents the cubic spline term, which is a non-linear function composed of spline coefficients of the corresponding quantitative variable: BMI, FM, FMI, or FM%, each entering in S(x) separately. Although splines cannot be conveniently written in analytical form, they can be interpreted by examining the overall estimated functions showing the direction and strength of the association between the non-linear predictor and the response variable, alongside 95% confidence intervals (shaded areas in the graphs). In this study, the uncertainty surrounding the splines and regression coefficients was based on the assumption of normality of the residuals, which was confirmed by evaluating quantile-quantile plots of the theoretical normal quantiles against the empirical quantiles of the residuals. The significance of the relationship was assessed using the usual F-test. Following the consensus approach based on Bayesian statistics [21], we used p-values lower than 0.005 as the significance level. Statistical analyses were performed using the free software R with the MASS library (http://www.R-project.org).
Y = a + S (x)
3. Results
The sample comprised men and women of a similar age (34.2 ± 8.6 and 35.3 ± 8.4 years, respectively) who exhibited the typical pattern of sexual dimorphism: men were characterised by greater height, weight, and phase angle, as well as lower fat mass (FM), fat mass percentage (FM%), and fat mass index (FMI) than women (p ~ 0.000) (Table 1). Both sexes exhibited similar high BMI values, indicative of mean overweight (Table 1).
Regression splines indicated non-linear relationships between PhA and fat mass indices, which were mostly significant, particularly for BMI (Figure 1, Table 2). However, the amount of variance explained was always small (less than 10%, Table 2).
All the curves were concave. At low or medium fat levels, the association was positive for BMI, FM and FMI, or null for FM%, and at high values it was negative for all indices. Notably, the relationships between PhA and FM or FMI were very similar in shape. The relationship with BMI was also similar, albeit more pronounced, particularly in men. The relationship between PhA and FM% was somewhat different, showing an almost flat trend indicating the absence of association within the range of low and medium FM% values, and a decreasing slope at higher values.
The slopes were sexually dimorphic, with the inflection points being more pronounced and occurring at lower fat values in men than in women. The inflection points were: 23 kg in men and 34 kg (with a further increase at 46 kg) in women, for FM; 9 kg/m² in men and 16 kg/m² in women, for FMI; 32 kg/m² in men and 37 kg/m² in women, for BMI; 25.5% in men and 42.5% in women, for FM%.
4. Discussion
This study showed that the relationship between phase angle and fat mass, as derived by DXA, is not linear, with an increasing slope (in the case of FM and FMI, and especially BMI) or a flat trend (FM%), followed by a decreasing slope (all indices). The slopes are sexually dimorphic, with men showing more pronounced inflection points, occurring at lower fat values than women.
The observed relationships help to explain the inconsistent results reported in the literature. These results are likely to have arisen from the use of different fat indices and varying nutritional statuses in the studies, as well as the use of linear statistical models to analyse curvilinear relationships.
In low/normal/overweight people, the increasing slope is likely related to the effect of the absolute amount of fat-free mass, whose association with phase angle has been consistently observed in the literature [e.g., 7, 8, 12]. In our study, this interpretation is supported by the stronger associations between PhA and BMI, FM, and FMI in men than in women, and by the lack of association with FM%. Indeed, BMI includes the amount of FFM, and FM is related to FFM [22,23], whereas FM% is less dependent from the absolute quantity of FFM. The results on FMI, which are similar to those on FM, suggest that height does not adjust for body size as efficiently as weight does. Similar findings emerged in the comparison of height- and weight-adjusted indices of sarcopenic obesity (submitted).
As fat mass increases, obesity and severe obesity develop alongside their associated clinical complications. This is likely reflected in the onset of phase angle decline. The inversion of this trend alongside increasing BMI has also been observed in other studies [13,14,15,16], with inflection points ranging from 30 to 50 kg/m². Luo and Jin [16] studied the relationship with FM% and identified flexion points at 33.5% in men and 38.9% in women (beginning to appear at 16.1% and 18.5, respectively). Interestingly, in all studies that considered the sexes separately, the inflection points occurred at lower values of fat mass in men than in women, and the values coincide with the cut offs for overweight in men and obesity in women (25% and 42% respectively [24]).
The relationship between obesity and low PhA has already been observed in the literature [18,25], and can be interpreted in various ways. Obesity is often characterised by inflammation, as adipose tissue stimulates the release of inflammatory mediators such as tumor necrosis factor-α and interleukin-6 [26]. In turn, inflammation, along with the associated oxidative stress and decreased membrane quality, has been linked to low PhA values [14,27]. Other potential causal factors include the relatively high amount of extracellular water which is common among people with obesity [28] and high levels of visceral obesity [29].
Despite being consistent with previous results and exhibiting statistical significance and a solid physiological rationale, the observed curvilinear relationships exhibited low explained variance (less than 10%). Bosy-Westphal et al. [13] reported even lower values, finding that the association between PhA and BMI explained only 1% of the variance. This suggests that variability in phase angle is largely influenced by factors other than fat or fat-related variables.
To analyse fat mass variability, vector analysis, particularly specific bioelectrical impedance vector analysis (BIVA), could provide more information, as it gives details of both phase angle and vector length, with the latter having been shown to accurately estimate FM% [8,18].
Taken together, the findings of this research are bolstered by the following key characteristics of the study: a sizeable sample; DXA-based fat mass assessment; analysis of various fat-related indices; and statistical methods appropriate for non-linear relationships. However, the study is limited by the absence of gold standard techniques to test the association of phase angle with inflammation, extracellular water, or visceral fat within the sample.
5. Conclusions
The present study revealed a weak, non-linear association between phase angle and body fat. This suggests that other variables predominantly influence this relationship, specifically fat-free mass in individuals with low, normal or overweight status, and clinical complications in people with obesity. Phase angle is useful for monitoring variability in these characteristics. However, a comprehensive body composition analysis, including body fat evaluation, should incorporate additional methods, such as bioelectrical impedance vector analysis.
Author Contributions
Conceptualization (EM,FF,EPJ); Methodology (SC); Formal analysis and investigation (SC); Data curation (SC,FF,EPJ); Writing (all the authors); Visualization (SC,FF,EPJ); Supervision (EM); Review & editing (all the authors); Resources (FF).
Funding
The authors acknowledge support from the University of Cagliari under Open Access funding call for the publication of this work.
Institutional Review Board Statement
Ethical review and approval were waived for this study, due to the analysis of already published NHANES data.
Informed Consent Statement
Informed consent was obtained from all subjects involved in the study.
Data Availability Statement
Data derived from public domain resources. Details available on request from the authors.
Conflicts of Interest
The authors declare no conflict of interest.
References
- Bellido D, García-García C, Talluri A, Lukaski HC, García-Almeida JM. Future lines of research on phase angle: Strengths and limitations. Rev Endocr Metab Disord. 2023 Jun;24(3):563–83. [CrossRef]
- Ward LC, Brantlov S. Bioimpedance basics and phase angle fundamentals. Rev Endocr Metab Disord. 2023 Jun;24(3):381–91. [CrossRef]
- Lukaski HC, Garcia-Almeida JM. Phase angle in applications of bioimpedance in health and disease. Rev Endocr Metab Disord. 2023 Jun;24(3):367–70. [CrossRef]
- Barbosa-Silva MCG, Barros AJD, Wang J, Heymsfield SB, Pierson RN. Bioelectrical impedance analysis: population reference values for phase angle by age and sex. Am J Clin Nutr. 2005 Jul;82(1):49–52. [CrossRef]
- Marini E, Buffa R, Gobbo LA, Salinas-Escudero G, Stagi S, García-Peña C, et al. Interpopulation Similarity of Sex and Age-Related Body Composition Variations Among Older Adults. Int J Environ Res Public Health. 2020 Aug 20;17(17):6047. [CrossRef]
- Mundstock E, Amaral MA, Baptista RR, Sarria EE, Dos Santos RRG, Filho AD, et al. Association between phase angle from bioelectrical impedance analysis and level of physical activity: Systematic review and meta-analysis. Clin Nutr. 2019 Aug;38(4):1504–10. [CrossRef]
- Gonzalez MC, Barbosa-Silva TG, Bielemann RM, Gallagher D, Heymsfield SB. Phase angle and its determinants in healthy subjects: influence of body composition. Am J Clin Nutr. 2016 Mar;103(3):712–6. [CrossRef]
- Marini E, Campa F, Buffa R, Stagi S, Matias CN, Toselli S, et al. Phase angle and bioelectrical impedance vector analysis in the evaluation of body composition in athletes. Clinical Nutrition. 2020 Feb;39(2):447–54. [CrossRef]
- Hirano Y, Yamada Y, Matsui Y, Ota S, Arai H. Lower limb muscle quality and phase angle contribute to the reduced walking speed among older adults. Geriatrics & Gerontology International. 2022;22(8):603–9. [CrossRef]
- Di Vincenzo O, Marra M, Sacco AM, Pasanisi F, Scalfi L. Bioelectrical impedance (BIA)-derived phase angle in adults with obesity: A systematic review. Clin Nutr. 2021 Sep;40(9):5238–48. [CrossRef]
- Cancello R, Brunani A, Brenna E, Soranna D, Bertoli S, Zambon A, et al. Phase angle (PhA) in overweight and obesity: evidence of applicability from diagnosis to weight changes in obesity treatment. Rev Endocr Metab Disord. 2023 Jun 1;24(3):451–64. [CrossRef]
- Martins PC, Alves Junior CAS, Silva AM, Silva DAS. Phase angle and body composition: A scoping review. Clin Nutr ESPEN. 2023 Aug;56:237–50. [CrossRef]
- Bosy-Westphal A, Danielzik S, Dörhöfer RP, Later W, Wiese S, Müller MJ. Phase angle from bioelectrical impedance analysis: population reference values by age, sex, and body mass index. JPEN J Parenter Enteral Nutr. 2006;30(4):309–16. [CrossRef]
- Barrea L, Muscogiuri G, Laudisio D, Di Somma C, Salzano C, Pugliese G, et al. Phase Angle: A Possible Biomarker to Quantify Inflammation in Subjects with Obesity and 25(OH)D Deficiency. Nutrients. 2019 Aug;11(8):1747. [CrossRef]
- Brunani A, Perna S, Soranna D, Rondanelli M, Zambon A, Bertoli S, et al. Body composition assessment using bioelectrical impedance analysis (BIA) in a wide cohort of patients affected with mild to severe obesity. Clinical Nutrition. 2021 Jun 1;40(6):3973–81. [CrossRef]
- Luo X, Jin W. Age-related changes in bioelectrical impedance analysis-derived phase angle (PhA) and the association between PhA and sarcopenic obesity in Chinese adults. Medicine (Baltimore). 2025 Jan 10;104(2):e41122. [CrossRef]
- Centers for Disease Control and Prevention (CDC) (2012) National Center for Health Statistics (NCHS). National Health and Nutrition Examination Survey Data. Hyattsville, MD: U.S. Department of Health and Human Services, Centers for Disease Control and Prevention 2012: Available: http://www.cdc.gov/nchs/nhanes/nhanes2003-2004/nhanes03_04.htm. Accessed 2012 Feb 9.
- Buffa R, Saragat B, Cabras S, Rinaldi AC, Marini E. Accuracy of Specific BIVA for the Assessment of Body Composition in the United States Population. PLOS ONE. 2013 Mar 6;8(3):e58533. [CrossRef]
- VanItallie T, Yang M, Heymsfield S, Funk R, Boileau R. Height-normalized indices of the body’s fat-free mass and fat mass: potentially useful indicators of nutritional status. The American Journal of Clinical Nutrition. 1990 Dec 1;52(6):953–9. [CrossRef]
- Hastie T, Tibshirani R, Friedman J. The Elements of Statistical Learning [Internet]. New York, NY: Springer; 2009 [cited 2025 May 31]. (Springer Series in Statistics). Available from: http://link.springer.com/10.1007/978-0-387-84858-7.
- Benjamin DJ, Berger JO, Johannesson M, Nosek BA, Wagenmakers EJ, Berk R, et al. Redefine statistical significance. Nat Hum Behav. 2018 Jan;2(1):6–10. [CrossRef]
- Wells JCK, Fewtrell MS, Williams JE, Haroun D, Lawson MS, Cole TJ. Body composition in normal weight, overweight and obese children: matched case–control analyses of total and regional tissue masses, and body composition trends in relation to relative weight. Int J Obes. 2006 Oct;30(10):1506–13. [CrossRef]
- Marini E, Stagi S, Cabras S, Comandini O, Ssensamba JT, Fewtrell M, et al. Associations of bioelectrical impedance and anthropometric variables among populations and within the full spectrum of malnutrition. Nutrition. 2024 Nov;127:112550. [CrossRef]
- Potter AW, Chin GC, Looney DP, Friedl KE. Defining Overweight and Obesity by Percent Body Fat Instead of Body Mass Index. J Clin Endocrinol Metab. 2025 Mar 17;110(4):e1103–7. [CrossRef]
- Streb AR, Hansen F, Gabiatti MP, Tozetto WR, Del Duca GF. Phase angle associated with different indicators of health-related physical fitness in adults with obesity. Physiology & Behavior. 2020 Oct 15;225:113104. [CrossRef]
- Ellulu MS, Patimah I, Khaza’ai H, Rahmat A, Abed Y. Obesity and inflammation: the linking mechanism and the complications. aoms. 2017;4:851–63.
- Tomeleri CM, Cavaglieri CR, de Souza MF, Cavalcante EF, Antunes M, Nabbuco HCG, et al. Phase angle is related with inflammatory and oxidative stress biomarkers in older women. Exp Gerontol. 2018 Feb 1;102:12–8. [CrossRef]
- Waki M, Kral JG, Mazariegos M, Wang J, Pierson RN, Heymsfield SB. Relative expansion of extracellular fluid in obese vs. nonobese women. Am J Physiol. 1991 Aug;261(2 Pt 1):E199-203. [CrossRef]
- Ferraz VD, da Costa Pereira JP, Pinho Ramiro CPS, Floro Arcoverde GMP, Rodrigues IG, Chagas CL, et al. Is phase angle associated with visceral adiposity and cardiometabolic risk in cardiology outpatients? Eur J Clin Nutr. 2024 Jun;78(6):527–33. [CrossRef]
Figure 1.
Results of cubic splines regression results between PhA values and body fat. Filled areas show the 95% C.I. about the regression mean estimated with the corresponding spline. PhA phase angle; BMI: body mass index; FM: fat mass; FMI: fat mass index; FM%: percentage of fat mass.
Figure 1.
Results of cubic splines regression results between PhA values and body fat. Filled areas show the 95% C.I. about the regression mean estimated with the corresponding spline. PhA phase angle; BMI: body mass index; FM: fat mass; FMI: fat mass index; FM%: percentage of fat mass.
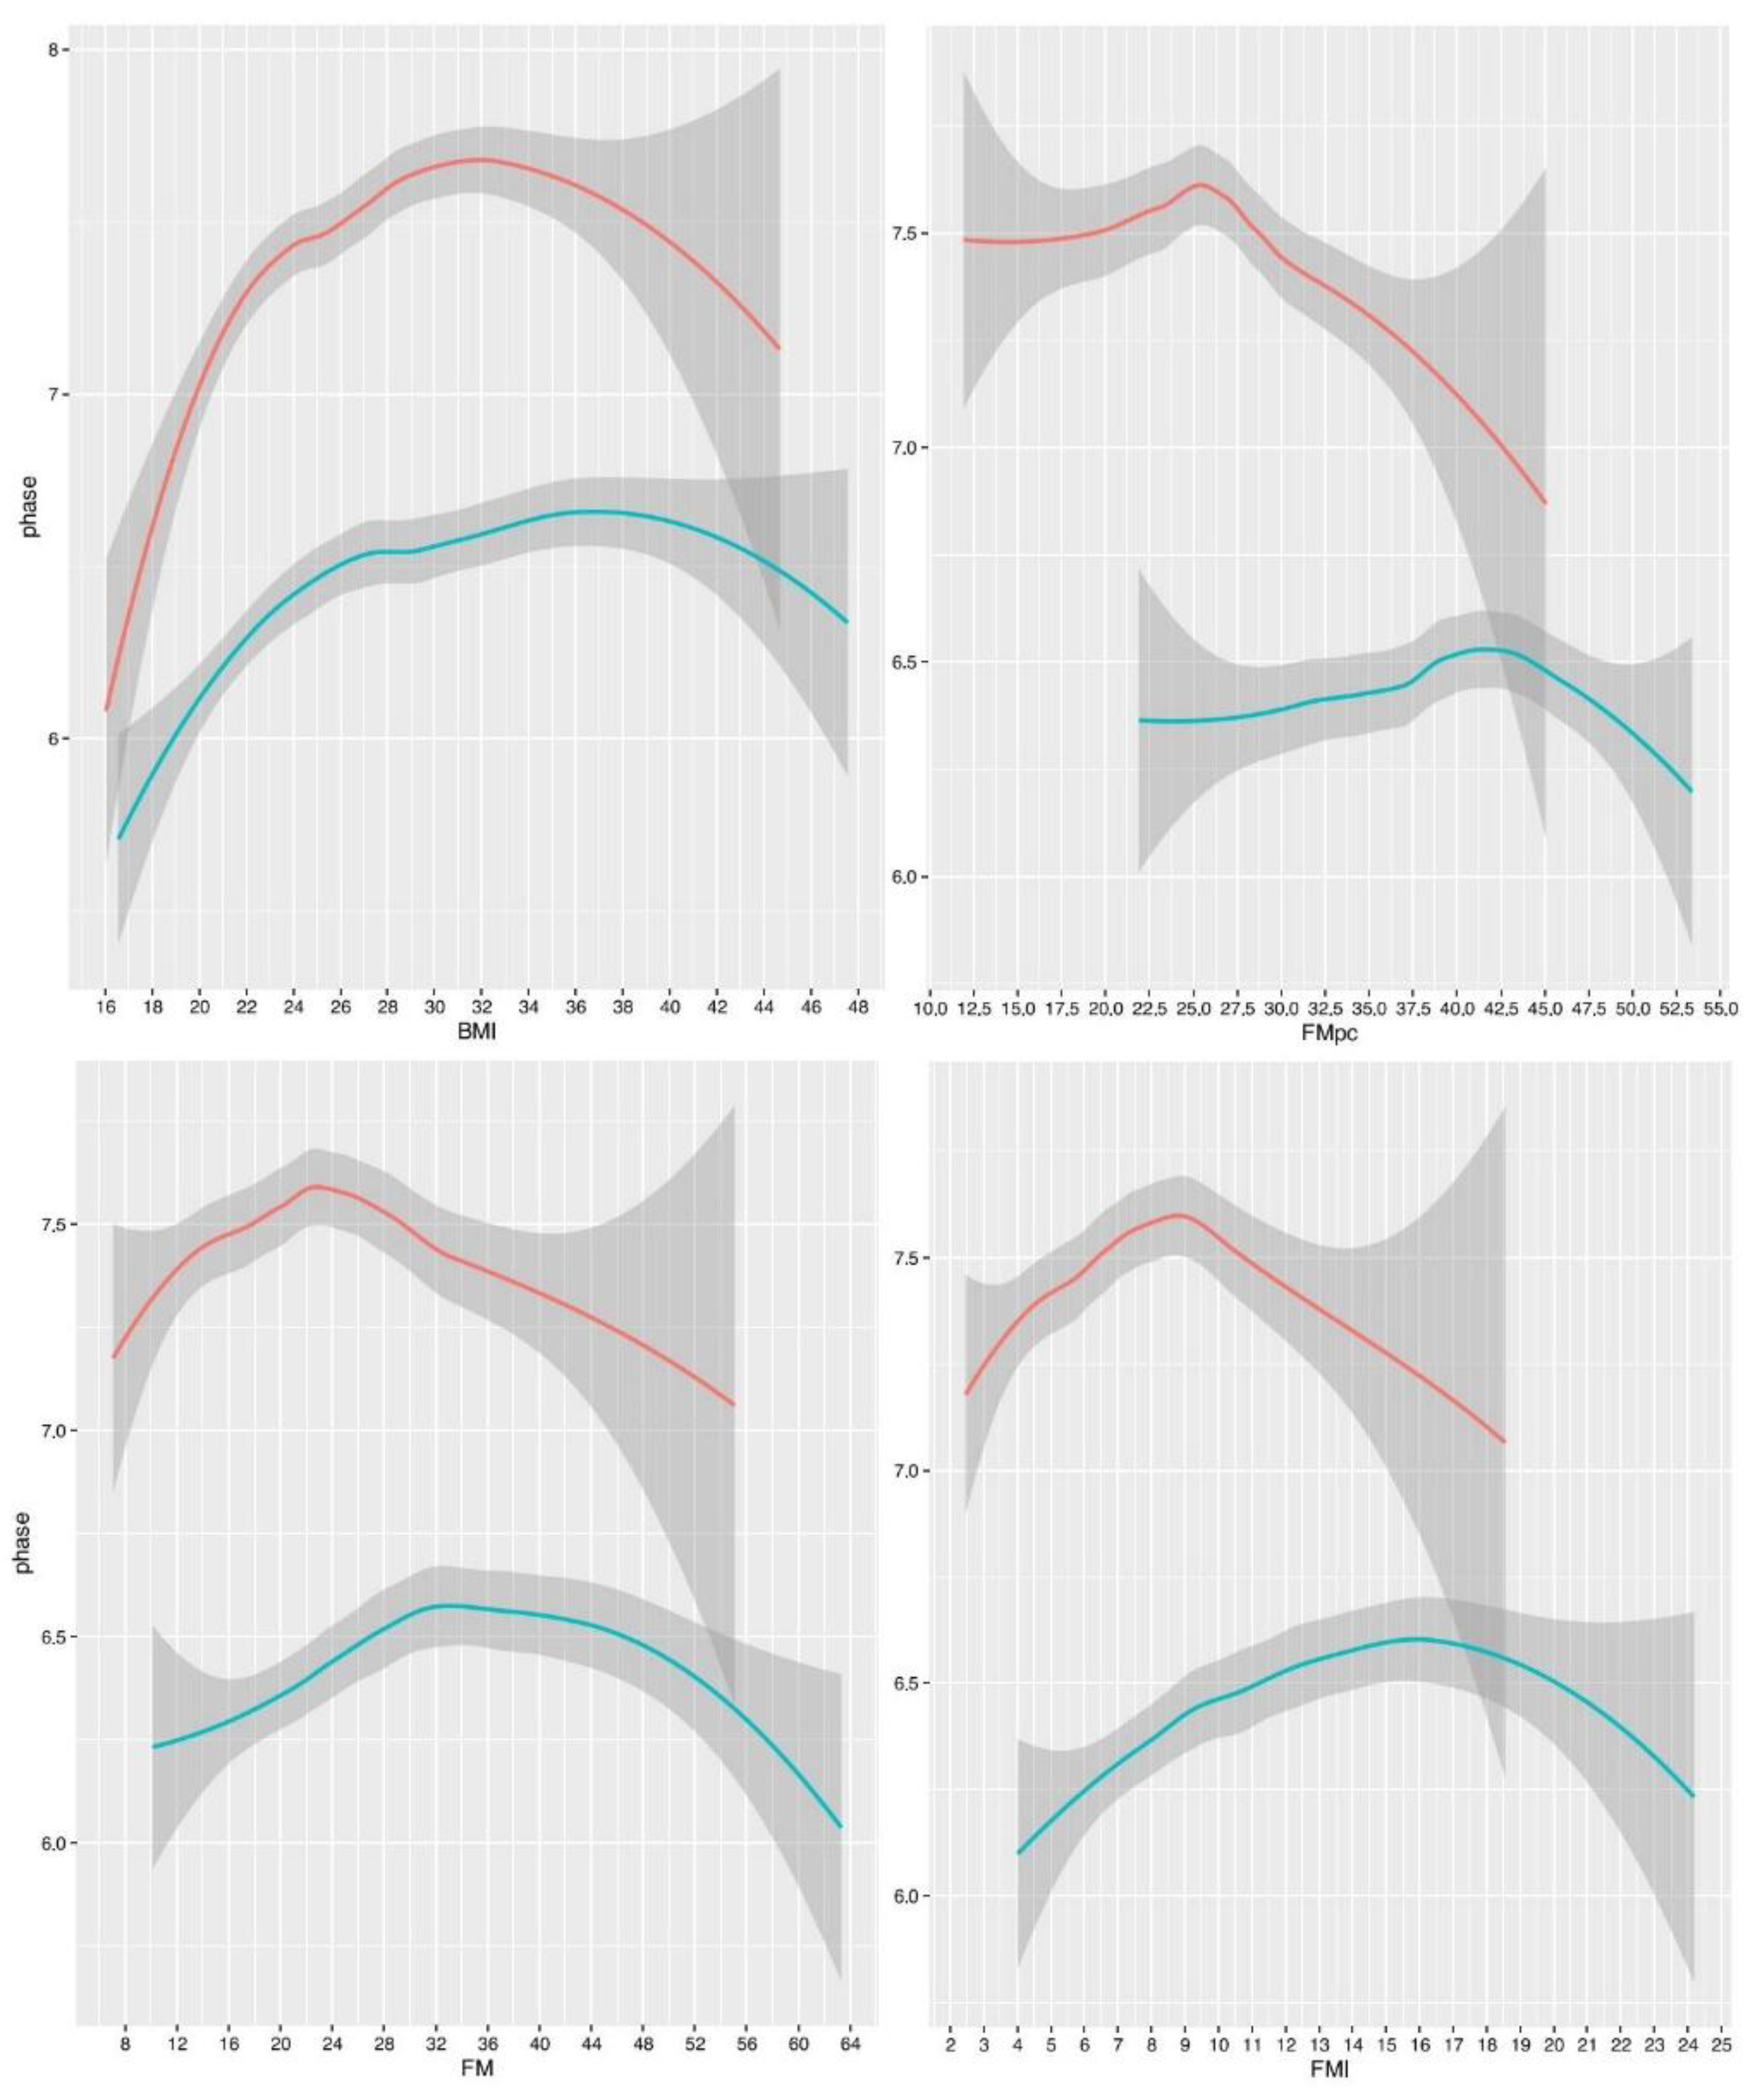

Table 1.
Sample characteristics by sex. R resistance; Xc reactance; PhA phase angle; FM: fat mass, FM%: percentage of fat mass; FMI: fat mass index; BMI: body mass index.
Table 1.
Sample characteristics by sex. R resistance; Xc reactance; PhA phase angle; FM: fat mass, FM%: percentage of fat mass; FMI: fat mass index; BMI: body mass index.
| Men (n = 810) (Mean ± SD) |
Women (n = 723) (Mean ± SD) |
Men vs women t-test |
p-value | |
|---|---|---|---|---|
| Age | 34.2 ± 8.6 | 35.3 ± 8.4 | -2.53 | 0.012 |
| Height (cm) | 175.6 ± 7.6 | 162.6 ± 6.6 | 35.56 | ~0.000 |
| Weight (kg) | 83.9 ± 15.7 | 73.6 ± 17.4 | 12.18 | ~0.000 |
| R (ohm) | 464.0 ± 60.5 | 562.7 ± 76.9 | -28.07 | ~0.000 |
| Xc (ohm) | 60.3 ± 8.2 | 62.9 ± 8.5 | -6.09 | ~0.000 |
| PhA (°) | 7.5 ± 0.8 | 6.5 ± 0.7 | 25.91 | ~0.000 |
| FM (kg) | 23.0 ± 8.2 | 29.7 ± 11.2 | -13.46 | ~0.000 |
| FM% | 26.6 ± 5.7 | 38.8 ± 6.5 | -39.15 | ~0.000 |
| FMI (kg/m2) | 7.5 ± 2.6 | 11.2 ± 4.2 | -20.97 | ~0.000 |
| BMI (kg/m2) | 27.2 ± 4.6 | 27.9 ± 6.4 | -2.48 | 0.013 |
Table 2.
Cubic splines regression results between PhA and FM-related indices. BMI: body mass index; FM: fat mass; FMI: fat mass index; FM%: percentage of fat mass.
Table 2.
Cubic splines regression results between PhA and FM-related indices. BMI: body mass index; FM: fat mass; FMI: fat mass index; FM%: percentage of fat mass.
| F | p | Exp. variance (%) | |
|---|---|---|---|
| BMI (kg/m2) | |||
| Men | 12.57 | ~0.000 | 8.25 |
| Women | 13.72 | ~0.000 | 7.96 |
| FM (kg) | |||
| Men | 2.35 | 0.0680 | 1.16 |
| Women | 5.04 | 0.0017 | 2.50 |
| FMI (kg/m2) | |||
| Men | 3.35 | 0.0182 | 1.54 |
| Women | 7.50 | 0.0001 | 3.17 |
| FM % | |||
| Men | 3.72 | 0.0146 | 1.46 |
| Women | 1.36 | 0.3580 | 0.58 |
Disclaimer/Publisher’s Note: The statements, opinions and data contained in all publications are solely those of the individual author(s) and contributor(s) and not of MDPI and/or the editor(s). MDPI and/or the editor(s) disclaim responsibility for any injury to people or property resulting from any ideas, methods, instructions or products referred to in the content. |
© 2025 by the authors. Licensee MDPI, Basel, Switzerland. This article is an open access article distributed under the terms and conditions of the Creative Commons Attribution (CC BY) license (http://creativecommons.org/licenses/by/4.0/).
Copyright: This open access article is published under a Creative Commons CC BY 4.0 license, which permit the free download, distribution, and reuse, provided that the author and preprint are cited in any reuse.


