
Submitted:
14 October 2025
Posted:
15 October 2025
You are already at the latest version
Abstract
This study explores the integration of the GeoGebra application into statistical learning and its effectiveness in supporting problem-solving processes. GeoGebra serves not only as a computational tool but also as a pedagogical medium that fosters conceptual understanding, visualization, and interactive demonstrations. Through its dynamic and visual features, GeoGebra enables lecturers and students to engage in deeper discussions of statistical topics, thereby strengthening the comprehension of fundamental concepts. Several interactive applets were designed to facilitate learning on topics such as data processing, discrete and continuous probability distributions, and hypothesis testing. Examples include an applet for the Z-test of a single mean and a visualization of the area under the F-distribution curve. The slider function in GeoGebra provides flexibility for dynamically adjusting parameters that are directly linked to graphical representations, helping students to intuitively grasp abstract statistical ideas. By transforming abstract statistical concepts into interactive visual forms, GeoGebra contributes to a more meaningful learning experience. Moreover, the integration of GeoGebra in the classroom opens new opportunities for action research focused on enhancing students’ conceptual understanding and developing innovative, technology-based learning strategies. The findings underscore that GeoGebra can be effectively utilized as a bridge between theoretical and applied statistics, promoting active learning and deeper engagement among students in higher education settings.
Keywords:
Applets
; Concept Visualization
; GeoGebra
; Problem Solving
; Statistical Learning
Keywords : Applets; Concept Visualization; GeoGebra; Problem Solving; Statistical Learning
1. Introduction
Statistics is one of the mandatory courses in various study programs in higher education because statistics provides data analysis tools that can be used in various fields of science. Its uses are very diverse, including to study the diversity of measurements, control processes, formulate information from data, and help with data-driven decision-making. However, for some students, especially at UIN Syahada Padangsidimpuan, statistics courses are still often considered difficult. This is due to the many formulas that must be memorized, the lack of connection with applications in the world of work, and the learning process that tends to be less interesting [63]. Therefore, appropriate innovation is needed from teachers in utilizing technology, especially computers, so that statistical learning becomes more interesting, dynamic, and able to build the construction of student understanding effectively and efficiently. Thus, students are expected not only to understand statistical concepts theoretically, but also to be able to apply them in solving daily problems.
Statistics is one of the mandatory courses in various study programs in higher education because it has an important role in providing the basis for data analysis in various fields of science. Statistical science is used to study diversity due to measurement, control processes, formulate information from data, and help data-based decision-making[30]. Thus, understanding statistics is an essential competency for students across disciplines.
Statistical science, as an academic discipline, encompasses far more than the mere collection and tabulation of data; it provides conceptual frameworks for measurement, designs for process control, tools for information extraction, and systematic approaches to evidence-based decision-making. The explosive growth of data across diverse fields—science, technology, economics, health, the arts, and social sciences—has rendered statistics not optional but essential. Students from all disciplines now face an increasing need to understand statistics in order to interpret research findings, make data-based projections, and validate claims presented in publications or popular media. Without statistical competence, information that appears valid can be highly misleading due to misinterpretation of data, incorrect model assumptions, and biased data visualization. Therefore, statistical education must emphasize not only computational techniques and formulas but also a fundamental understanding of how data are generated, how variability is structured, and how decisions are made based on quantitative evidence. Awareness that measurement and control processes affect the reliability of data is also an integral component of sound statistical learning. This emphasis has become increasingly crucial in the era of big data and artificial intelligence, where data are derived from highly heterogeneous sources and often require sophisticated preprocessing to ensure valid analytical outcomes. A recent study by Irawan, Rosjanuardi, and Prabawanto (2022) on the integration of computational thinking in statistical learning confirms that a systematic pedagogical framework can strengthen students’ engagement in statistical inquiry and analytical reasoning [79].
Statistical competence extends beyond mastery of procedural tools such as probability distributions, hypothesis testing, regression, or numerical data processing. It entails the cognitive ability to understand sources of data variation, uncertainty, and the contextual interpretation of statistical outcomes. For example, learners must be able to distinguish between natural variation and measurement error, as well as grasp the implications of sample size, sampling bias, and model assumptions. Learning statistics through a purely mechanistic approach—such as memorizing formulas and procedures—often fails when students lack insight into how these methods are designed and when their application is appropriate. Understanding control processes is crucial to identifying and anticipating irrelevant variables or statistical disturbances. Data-driven decision-making likewise requires validation, verification, and critical reflection on the data and methods employed. A study by Kurnia, Lowrie, and Patahuddin (2023) on the development of statistical literacy among secondary school students revealed that although statistical literacy improves across grade levels, students still face challenges in understanding data context and the overall flow of statistical reasoning [80].
Cultural diversity, educational background, language ability, and socioeconomic context also shape how students comprehend statistics and make data-based decisions. Learners from environments with limited data exposure or traditional mathematics/statistics education often struggle to construct robust quantitative arguments because they may be unfamiliar with concepts such as probability, variability, or significance testing in authentic contexts. Likewise, language and data presentation formats can pose barriers for multilingual students or those whose first language differs from the instructional language used in statistics classrooms. Therefore, effective statistical education must be inclusive, sensitive to students’ backgrounds, and provide appropriate scaffolding to help them connect abstract concepts with everyday realities. A study conducted in a multilingual Grade 12 classroom demonstrated that the use of contextually appropriate linguistic strategies and resources significantly enhanced Pasifika students’ understanding of statistics during collaborative learning [81].
The role of visualization and interactive media in statistical education has increasingly been recognized as an effective approach to facilitating comprehension of abstract concepts such as probability distributions, the area under a curve, variance, and parameter estimation. Visual and interactive tools allow students to observe parameter changes in real time and to perceive their effects on distribution shapes or parameter estimates, making understanding more tangible rather than purely theoretical. Visualization also enables learners to “see” data variation and outliers and to grasp how graphical representation influences statistical inference. Such approaches bridge the gap between statistical theory and practical application, enhancing retention of complex concepts. A concrete example can be found in the study “Statistical Investigations in Primary School – The Role of Contextual Expectations for Data Analysis”, which demonstrated how contextual expectations affect how younger learners analyze data, use graphical representations, and draw conclusions when data do not align with their expectations [82].
Statistics also places strong emphasis on informed, evidence-based decision-making. In many cases, public policy, public health interventions, program evaluations, and financial reports must be examined through valid data and appropriate statistical methodologies. Decisions made without understanding variability, sample size, Type I and II errors, or confounding effects risk producing misleading or harmful implications. Consequently, statistical instruction that includes authentic investigations, case studies, and real data applications is strongly encouraged to create meaningful learning experiences. Research on Malaysian secondary students revealed that most learners remain at a transitional level of statistical thinking rather than a fully analytical one, and that linking statistical activities to students’ real-life experiences can help elevate their level of statistical reasoning [83].
One of the major challenges in teaching statistics lies in designing curricula that integrate measurement, control processes, data-based information formulation, and real-world problem solving so that students can internalize these skills. Curricula overly focused on theoretical content without practical application are often perceived as irrelevant and demotivating. Effective curriculum design should include empirical experiences such as experimentation, observation, simulation, and the use of statistical software or interactive applications. Problem-based learning (PBL) has proven effective in demonstrating how statistics functions in real-world contexts—across scientific research, business, healthcare, and public policy. Additionally, educators need training to deliver statistics in contextually relevant ways and guide students through conceptual and technical difficulties. A study titled “The Development of High School Students’ Statistical Literacy across Grade Level” by Kurnia, Lowrie, and Patahuddin (2023) highlighted the need for progressive and differentiated curricula to ensure consistent growth in statistical literacy across educational levels [84].
The application of statistics across disciplines expands its value in natural sciences, social sciences, health, technology, and business. For instance, students in the social sciences need skills to interpret survey data, demographic variables, and public statistical reports; in natural and health sciences, understanding experimental design, hypothesis testing, and variance or regression analysis is integral to research practice. Clinical decision-making and drug development rely on statistical evidence from clinical trials and epidemiological data, while economic policies depend on market data analysis and statistical forecasting. When such competencies are introduced early and reinforced interdisciplinarily, graduates are better prepared to become critical citizens and professionals who contribute effectively in data-driven societies. The study “Teaching Social Science Students to Think with Data” by Engel and Weber-Stein (2023) demonstrated that when social science students receive statistical instruction integrating sociopolitical content, they become more capable of evaluating data-based claims and participating in evidence-informed public discourse [78].
Finally, advances in educational technology and digital applications present significant opportunities to strengthen statistical understanding through innovative learning materials. The use of interactive applications, real-time data visualization, parameter sliders, and simulations provides highly effective means of transforming abstract statistical concepts into visual representations, enabling learners to explore, conduct virtual experiments, and reflect on variable changes. Empirical evaluations have shown that students who learn through interactive media tend to achieve deeper conceptual understanding, stronger inferential skills, and greater confidence when dealing with real data. The study “How Computational Thinking Can Be Integrated in Statistical Learning: A Cuboid Framework” by Irawan, Rosjanuardi, and Prabawanto (2022) exemplifies how digital pedagogical design and the integration of computational thinking can enhance students’ learning processes and problem-solving abilities in statistics [79,80].
However, for some students, especially at UIN Syahada Padangsidimpuan, statistics courses are still considered difficult. This is influenced by the perception that statistics are synonymous with complex, abstract, and less applicable formulas in the context of the world of work [52]. This condition makes the statistical learning process often feel monotonous and less interesting for students.
To answer these challenges, technology-based learning innovations are one of the alternatives that can be optimized. The use of computer software and educational applications is able to provide more interactive, dynamic, and contextual learning [19]. With this approach, students not only memorize formulas, but also understand concepts through visualization and simulation.
The integration of computer software and educational applications into teaching has transformed the landscape of modern learning by making it more interactive, dynamic, and contextually meaningful. Through technology-enhanced learning environments, students are no longer passive recipients of abstract formulas but active participants in the process of concept construction. Interactive tools such as GeoGebra, Desmos, PhET simulations, and other visualization platforms enable learners to explore mathematical and statistical phenomena in real time, adjusting parameters and observing immediate outcomes. This process nurtures deeper cognitive engagement, conceptual understanding, and the ability to transfer knowledge to novel situations. In addition, visualization and simulation foster meaningful connections between abstract theoretical content and real-world applications, helping students recognize the relevance of mathematics and statistics in everyday life and professional contexts. By bridging the gap between procedural fluency and conceptual understanding, these technological tools encourage active learning and self-regulated exploration, which are critical competencies in 21st-century education. A recent study by Sa’diyah, Mulyono, and Irawan (2023) demonstrated that the integration of dynamic visualization tools in mathematical learning significantly enhances students’ conceptual comprehension and engagement, highlighting the pedagogical value of technology-based learning environments [84].
The integration of GeoGebra as an interactive learning tool has shown significant positive effects on students’ achievement and engagement in mathematics and statistics education. Empirical studies have demonstrated that the use of GeoGebra enhances problem-solving skills, classroom participation, and overall academic performance compared to traditional instruction. The software allows students to explore complex mathematical and statistical ideas visually, enabling them to manipulate functions, parameters, and data representations interactively. Such experiences transform abstract symbols into tangible visual models that are easier to comprehend. Moreover, GeoGebra encourages inquiry-based learning, fostering deeper conceptual understanding rather than rote memorization. This interactive environment helps bridge the gap between procedural fluency and conceptual insight, which are essential for mastering statistical reasoning. As a result, students not only acquire technical skills but also develop critical thinking abilities necessary for real-world data interpretation [85].
Digital visualization tools, including GeoGebra and Desmos, have been proven to improve students’ understanding of abstract mathematical structures such as non-linear and exponential functions. Through dynamic manipulation, learners can observe real-time changes in curves and parameters, which enhances their ability to connect algebraic expressions with graphical interpretations. This visual interactivity fosters active participation and conceptual retention by allowing students to witness the immediate consequences of mathematical changes. Compared to traditional instruction, digital visualization develops higher cognitive engagement, supporting the transition from procedural learning to analytical reasoning. In the context of statistics, such visualization enables learners to explore data distributions, variance, and probability density functions through animated and manipulable interfaces. Consequently, students demonstrate greater accuracy in interpreting patterns, relationships, and statistical variability [86].
Combining GeoGebra with contextual and modular learning approaches has been shown to improve students’ numeracy and mathematical literacy at the secondary level. Research has indicated that integrated learning modules incorporating GeoGebra are not only valid and practical but also lead to measurable improvements in conceptual mastery and statistical reasoning. The contextual integration of real-life problems helps students see mathematics as meaningful and relevant rather than as isolated procedures. Furthermore, when visualization and data interpretation are embedded within authentic contexts, students are able to internalize statistical concepts more effectively. This approach aligns with the principles of constructivist pedagogy, where learners actively construct knowledge through meaningful engagement. The integration of contextual learning and digital tools like GeoGebra thus promotes a deeper and more transferable understanding of mathematical and statistical ideas [87].
GeoGebra-assisted instruction also significantly enhances students’ creative and critical thinking skills in mathematics learning. Studies have found that when students engage in open-ended and problem-based learning tasks supported by GeoGebra, they develop the ability to generate innovative strategies and reflect critically on their solutions. This process nurtures metacognitive awareness, as students plan, monitor, and evaluate their own reasoning. The interactive and exploratory nature of GeoGebra encourages experimentation and multiple-solution thinking, which are vital skills in both mathematics and statistics. In statistical problem solving, for example, students must decide on the appropriate methods of analysis, test model assumptions, and interpret ambiguous results—activities that require both creativity and logical rigor. Integrating GeoGebra within such learning environments fosters a balance between procedural fluency and conceptual innovation [88].
GeoGebra Classroom, the collaborative online extension of the software, provides an effective medium for enhancing statistical problem-solving through structured inquiry. Studies have demonstrated that students who engage in problem-solving frameworks such as Polya’s stages—understanding, planning, executing, and reviewing—benefit from the visual and interactive features of GeoGebra Classroom. The platform enables learners to test hypotheses, visualize data variations, and evaluate the influence of parameters on statistical outcomes. Through this process, students not only strengthen their procedural understanding but also cultivate reflective habits and analytical reasoning. The visualization of variability, outliers, and sampling effects within a dynamic digital setting makes abstract statistical principles more concrete and comprehensible. Such integration demonstrates that digital collaboration can enhance cognitive processes central to statistical investigation [89].
Motivation and curiosity are also key affective variables positively influenced by the use of GeoGebra in mathematics and statistics education. Experimental research indicates that students exposed to GeoGebra-based learning environments exhibit significantly higher curiosity and engagement levels than those taught using conventional methods. This heightened curiosity translates into stronger persistence, greater willingness to explore data-driven questions, and improved learning outcomes. Curiosity acts as a catalyst for statistical exploration, motivating students to manipulate datasets, conduct simulations, and interpret results beyond surface-level comprehension. Furthermore, the interactive and visual feedback provided by GeoGebra reinforces intrinsic motivation by offering immediate and meaningful learning experiences. Hence, such technological integration contributes not only to cognitive achievement but also to affective and behavioral engagement [90].
Meta-analytic evidence further supports the effectiveness of GeoGebra when combined with problem-based learning (PBL) approaches. A recent meta-analysis revealed that students receiving GeoGebra-assisted PBL interventions demonstrated significantly higher mathematical and statistical competence compared to those in conventional classrooms. The results were consistent across educational levels, suggesting that GeoGebra enhances both foundational understanding and advanced reasoning. Moreover, the combined approach encourages collaborative inquiry and contextualized learning, which are essential for fostering higher-order thinking skills. The findings underscore the importance of teacher preparedness and curriculum design that incorporate interactive tools and real-world contexts. As such, GeoGebra should not merely be treated as a technological supplement but as a core component of modern pedagogical practice in mathematics and statistical education [91].
One of the applications that can be used in statistical learning is GeoGebra. This application allows the presentation of statistical material visually, interactively, and supports the construction of conceptual understanding in a gradual manner. Through the applet and slider features, lecturers can design creative learning media and facilitate student discussions in class [62,63]. Thus, GeoGebra acts as a bridge between abstract concepts and concrete representations in statistics.
The effectiveness of the use of GeoGebra in statistical learning has been proven by several recent studies. This app not only improves understanding of concepts, but also strengthens students' skills in data-driven problem-solving. This is in line with the needs of the digital era which requires students to have statistical literacy and technological adaptability [72,73]. Therefore, the implementation of GeoGebra at UIN Syahada Padangsidimpuan is expected to support improving the quality of learning while encouraging classroom action research in the future. [20,21]
Statistics is one of the fundamental courses in higher education because of its broad function in providing a set of data analysis tools that can be used across disciplines and professions. The existence of this course not only helps students in understanding theory, but also equips them with practical skills that are relevant to the world of work and research. In fact, many students still have difficulty learning statistics, because they are considered full of complicated, abstract formulas, and require a deep mathematical understanding [15,16,17,18]. These obstacles are increasingly felt when the learning methods used are monotonous, less interactive, and do not take advantage of available modern technology. This encourages the importance of innovation in more interesting, contextual, and applicative learning strategies. Thus, a new approach is needed that is able to integrate technology in the learning process to increase motivation, understanding concepts, and students' ability to solve daily statistical problems [66,70].
The development of information technology has provided many choices of computer applications that can be used in learning and solving statistical problems. Popular applications such as SPSS, SAS, MATHEMATICA, LISREL, AMOS, EVIEWS, and STATA are known as professional software used for advanced data analysis purposes [74,75,76]. In addition, applications that are simpler but familiar to students such as Microsoft Excel are also still often used in processing data because of its convenience and availability. In the field of mathematics learning, a number of computer applications such as GeoGebra, Autograph, TinkerPlots, and Fathom have long been used as interactive media to support concept understanding [29]. With a variety of application options, lecturers have the freedom to choose appropriate learning strategies and methods so that learning goals are optimally achieved. However, the real challenge lies not only in the sophistication of the technology used, but also how these applications are really able to help students build a strong and efficient understanding of concepts [47,48,49].
GeoGebra is an interactive computer application that was initially better known as a geometry, algebra, and calculus learning tool, but has now evolved to be used in other fields, including statistics. This application has the advantage of being able to visualize mathematical concepts in the form of dynamic, interactive, and manipulated graphs as needed [22,23]. Features such as sliders provide users with the opportunity to see the movement of parameters directly, so that the relationship between variables can be understood more concretely [37]. With these advantages, GeoGebra is a potential medium in statistical learning because it can help overcome the abstract nature of statistical concepts. Lecturers can create interactive applets or simulations for selected topics, such as data processing, discrete and continuous opportunities, and hypothesis testing. Through creative and contextual design, students will find it easier to understand material that was previously difficult to understand only through verbal explanations or manual calculations [24].
The formulation of the problem in this study is how to use the GeoGebra application to solve statistical problems on selected topics in higher education. The selected topics include data presentation and processing, probability calculation on discrete and continuous opportunity distribution, and hypothesis testing [24,25]. The formulation of this problem is important because with GeoGebra, it is hoped that students will not only be able to solve the problem, but also visually understand the process that occurs behind the calculation. The emphasis on understanding concepts is the main thing, because a good understanding will make it easier for students to apply the concept to real cases [12]. GeoGebra can be used as a connecting medium between abstract theory and real application in daily life. Thus, the formulation of this problem emphasizes efforts to optimize simple but effective technology in supporting statistical learning in higher education [72,73].
The purpose of writing this article is to discuss the use of GeoGebra in solving statistical problems in higher education, especially on the topic of data presentation and processing, calculation of discrete and continuous distribution opportunities, and hypothesis testing. This goal is in line with the need to present interactive and contextual learning methods, so that students are able to understand statistical material more comprehensively. Through GeoGebra, students can observe firsthand how changes in parameters in a distribution affect the shape of the graph and the calculation results [14]. With this approach, learning is no longer just memorizing formulas, but also involves a deep process of exploration. Students can experiment with data, visualize results, and discuss findings with lecturers and peers [66]. The purpose of this writing also includes strengthening students' statistical literacy which is urgently needed in facing the digital era.
The use of GeoGebra in data presentation and processing provides significant advantages because students can see data representations in the form of tables, diagrams, and graphs directly. For example, data can be processed into a dynamic histogram or bar chart, making it easier for students to understand the distribution of data. This visualization advantage provides a more meaningful learning experience than just using manual calculations. In addition, students can modify data in real-time, so that the analysis carried out feels more relevant to real phenomena [31,32]. In this way, GeoGebra is not only a technical tool, but also serves as a construction medium for students' conceptual understanding of data processing materials.
In the material of opportunities, both discrete and continuous distributions, GeoGebra also has an important role because it can display the form of the opportunity function in an easy-to-understand graph. Students can manipulate the values of random variables and distribution parameters to see how the shape of the curve changes, for example on binomial, normal, or exponential distributions. This makes it easier to understand the properties of distribution, such as mean, variance, and cumulative probability. Interactive visualization allows students to explore further about the relationship between parameters [55,56]. Thus, opportunity learning is no longer abstract, but can be observed in real life through dynamic graphs displayed by GeoGebra.
GeoGebra is also very useful in hypothesis test topics, as it is able to show the position of the test value on the distribution curve as well as the specified critical area. For example, the test hypothesis of one average Z can be visualized through a normal curve, where students can see firsthand how the Z value is calculated compared to the Z value of the table. With the slider, students can change the average value of the sample, standard deviation, and sample size, and the graph will automatically display the appropriate test results [54]. This kind of visualization helps students understand the meaning of probability in the context of hypothesis testing, not just the number of calculations. [26,27]
The effectiveness of the use of GeoGebra in statistical learning has been proven in various recent studies. The results of the study show that GeoGebra integration can increase students' motivation to learn, deepen their understanding of concepts, and improve data-based problem-solving skills [20]. In addition, students become more active in the learning process because they are given the opportunity to explore and discover concepts for themselves through the available simulations. Lecturers are also easier to explain abstract material because they are helped by the visualization provided by the application. This shows that GeoGebra has great potential as a statistical learning innovation in higher education. [28,29]
To solve statistical problems, several computer application technologies offer solutions according to the specifications of their needs, including SPSS, SAS, MATHEMATICA, LISREL, AMOS, EVIEWS, and STATA. Beyond that, familiar applications such as Microsoft Excel are also part of computer application technology that helps solve data processing problems. Meanwhile, some of the computer applications that are commonly used for math learning classes include GeoGebra, Autograph, TinkerPlots, and Fathom [1,2,3]. All of this depends on learning strategies and methods that are prepared to achieve optimal results while still empowering the development of information technology. In statistics learning classes, the main problem lies not in how sophisticated a computer application is able to solve a problem, but the extent to which a computer application is able to build a strong and efficient understanding. GeoGebra as one of the interactive computer applications that is widely used in geometry, algebra, and calculus classes also has the potential to provide interactive statistical problem solutions for students. The selected statistical topics discussed in this article with the help of the GeoGebra application prove that their use is relevant and beneficial [4,5,6]. Therefore, the purpose of writing this article also emphasizes the need for the use of appropriate technology to support more effective, dynamic, and meaningful statistical learning in higher education.
2. Research Method
This article employs a literature study method with a qualitative descriptive approach, focusing on the analysis of the use of the GeoGebra application in solving statistical problems on selected topics in higher education. Data and information are gathered from various scientific references, including books, research articles, and the latest online sources published between 2023 and 2025. Furthermore, the study explores how GeoGebra can be utilized for data presentation and processing, probability calculations in continuous and discrete distributions, and the application of hypothesis testing. The article also outlines interactive problem-solving procedures designed to enhance students’ understanding in statistical learning.
3. Results and Discussion
3.1. Results
3.1.1. GEOGEBRA
i. GeoGebra in Learning
GeoGebra is an interactive and dynamic software designed to support mathematics learning, especially in the fields of geometry, algebra, calculus, and now developing in the field of statistics. The app was first developed by Markus Hohenwarter in 2001, and since then GeoGebra has continued to undergo feature improvements, including the addition of capabilities for statistical data visualization, graphing, and probability simulation [78] . Currently, GeoGebra has been used by more than 20 million teachers and students around the world, with the existence of 155 GeoGebra Institutes (IGI) spread across various countries and translations into more than 62 languages, including Indonesian, making it easier for local users to use it in learning. Its accessibility that can be used on both computer and mobile devices makes GeoGebra one of the most flexible educational applications that are in line with the times. In the Indonesian context, the availability of GeoGebra in Indonesian has encouraged an increase in its use by teachers and lecturers in various higher education institutions. [30,31]
The evolution of GeoGebra from a simple geometry tool into a comprehensive mathematical platform demonstrates the transformation of educational technology toward dynamic and interactive learning environments. The integration of statistical features, such as data analysis tools, regression modeling, and probability simulations, has positioned GeoGebra as a versatile application capable of supporting multidisciplinary teaching and learning processes. Through these features, students can explore mathematical and statistical relationships in a visual, exploratory, and inquiry-based manner, enabling a shift from passive to active learning. Studies have shown that such dynamic visualization tools enhance students’ conceptual understanding and cognitive engagement compared to conventional instruction. Moreover, the use of GeoGebra in statistics encourages learners to connect theoretical principles with empirical data through simulation-based experiments, making abstract ideas more tangible. As technology becomes more embedded in education, GeoGebra stands as a model of open-access innovation that bridges pedagogical theory and computational practice. This adaptability is essential in fostering statistical literacy in an era where data-driven reasoning is fundamental across disciplines [91].
From a pedagogical perspective, GeoGebra supports constructivist and inquiry-based learning by allowing students to actively manipulate mathematical and statistical objects to observe patterns and relationships. The interactive features enable learners to test hypotheses, visualize data transformations, and understand statistical variability more effectively than through static materials. Teachers, in turn, can design customized learning tasks that align with students’ prior knowledge and cognitive levels, promoting differentiated instruction. This adaptability aligns with the principles of Realistic Mathematics Education (RME), which emphasizes the use of contextual and meaningful problems to stimulate understanding. GeoGebra’s interactive applets provide a rich environment where statistical learning is grounded in authentic problem-solving situations. Moreover, it allows educators to integrate technology seamlessly into their pedagogical design, facilitating a balance between procedural fluency and conceptual depth. In this regard, GeoGebra serves as a mediator between theoretical abstraction and practical application in mathematical statistics education [92].
The role of GeoGebra in improving student motivation and engagement has also been widely acknowledged in recent educational research. Interactive simulations and visualizations foster a sense of curiosity, autonomy, and satisfaction during the learning process, particularly among students who might otherwise struggle with abstract mathematical ideas. The integration of GeoGebra in blended and online learning environments has been shown to increase participation and improve performance outcomes. For instance, students using GeoGebra in data analysis tasks exhibit higher retention rates and more accurate interpretations of statistical information. This engagement effect can be attributed to the multimodal nature of the platform, which combines visual, symbolic, and numerical representations. Furthermore, the use of GeoGebra aligns with current educational trends emphasizing digital literacy and computational thinking as key [93,94].
The integration of GeoGebra into statistical learning environments enhances students’ capacity for critical thinking and conceptual understanding. When learners interact with dynamic visualizations, they are not merely passive recipients of information but become active participants in constructing their own knowledge structures. This constructivist approach enables them to manipulate variables, observe real-time changes, and identify mathematical relationships through exploration. Such experiences make statistical reasoning more intuitive, especially when dealing with complex data sets or probability models that are difficult to comprehend through symbolic formulas alone. Additionally, GeoGebra promotes self-directed learning, as students are able to experiment independently and validate hypotheses without relying solely on instructor demonstrations. This hands-on interaction fosters deeper comprehension of statistical principles such as distribution, variability, and correlation. As reported in recent studies, technology-enhanced visualization tools like GeoGebra can significantly strengthen learners’ analytical abilities and conceptual retention over time [95,96].
Beyond enhancing individual learning, GeoGebra also plays a crucial role in fostering collaborative problem-solving within digital classrooms. Instructors can design interactive applets that encourage small-group discussions, peer feedback, and cooperative exploration of data. This pedagogical approach transforms the traditional lecture format into an inquiry-based experience, where students exchange interpretations, question each other’s assumptions, and negotiate meaning. By enabling simultaneous manipulation of parameters and collective observation of outcomes, GeoGebra supports a social constructivist learning model consistent with Vygotsky’s zone of proximal development. Collaborative engagement of this kind not only strengthens communication and teamwork skills but also improves statistical literacy and data reasoning competence among students. Research in technology-assisted mathematics education underscores that interactive collaboration supported by GeoGebra can significantly elevate both student engagement and learning outcomes [1,3,7].
Moreover, the flexibility of GeoGebra to adapt across different learning modalities—face-to-face, hybrid, and fully online—makes it highly relevant to modern education systems. During remote learning conditions, such as those intensified by the COVID-19 pandemic, GeoGebra proved invaluable for maintaining instructional continuity in quantitative courses. Lecturers used the platform to conduct live simulations, interactive assessments, and guided data analysis sessions, providing students with immediate feedback and visualization. These applications ensured that learners could still engage deeply with statistical material despite physical limitations of classroom settings. The platform’s open-source nature also reduced economic barriers to access, supporting educational equity in resource-limited contexts. Consequently, GeoGebra’s integration into e-learning ecosystems has been recognized as a catalyst for sustaining academic engagement and improving digital pedagogy in the post-pandemic era [93,94].
Another essential advantage of GeoGebra lies in its ability to link theoretical concepts with practical, real-world applications. By simulating phenomena such as sampling distributions, regression models, or probability experiments, the software bridges the gap between abstract theory and empirical reasoning. Students can observe the implications of statistical decisions, such as how varying sample sizes or standard deviations influence confidence intervals and hypothesis tests. This experiential learning dimension deepens comprehension and cultivates transferable analytical skills applicable in research and professional contexts. The immediacy of visual feedback helps learners recognize conceptual errors early and refine their reasoning strategies accordingly. This alignment between visualization and critical interpretation is vital in modern statistical education, where data-driven reasoning forms the backbone of scientific inquiry [90,91].
Lastly, GeoGebra’s continuing evolution through cloud integration, AI-assisted applets, and mobile accessibility signals a progressive step toward smart, adaptive learning technologies. Its developers have increasingly incorporated real-time analytics, allowing educators to monitor student progress and customize instruction based on performance patterns. This data-informed pedagogy enhances the personalization of learning experiences, offering targeted support to students with diverse learning needs. As a result, GeoGebra stands not only as a mathematical visualization tool but also as an intelligent platform for fostering digital competence, creativity, and autonomy. The growing body of literature highlights GeoGebra’s pivotal role in aligning mathematics education with Industry 4.0 competencies, including computational thinking, data literacy, and technological fluency [92].
GeoGebra is also open source so it can be downloaded for free and allows various groups, both academics and practitioners, to use it widely. This makes GeoGebra a medium that not only supports knowledge transfer, but also encourages creativity in problem-solving through simulation and self-exploration. More than that, GeoGebra has been proven to support various learning models, such as problem-based learning, project-based learning, and collaborative learning. Thus, the role of GeoGebra in the world of education is increasingly important because it is in accordance with the 21st century learning paradigm that emphasizes critical, creative, collaborative, and communicative (4C) thinking skills. Not only that, this application is also in line with the education digital transformation policy launched by the government in the 2020–2025 period to improve the quality of human resources in the era of the industrial revolution 4.0 and society 5.0 [38,39,40].
ii. Application Selection Considerations
In choosing a computer application for learning, there are five important considerations that need to be considered so that the application can be used widely and effectively. First, the app should provide a dynamic view so that it can be used to analyze abstract concepts more easily. Second, the application needs to allow users to express their personal models, so that students can develop their creativity and learning styles. Third, the application should assist in the search for mathematical models or patterns that emerge from the data or exploration process [32,33]. Fourth, applications must support the provision and processing of real data so that it is relevant to the context of daily life and academic research. Fifth, the application is expected to be able to share and communicate the results of exploration or modeling to others more simply. GeoGebra is an application that meets these five criteria well. Therefore, many recent studies confirm that GeoGebra has a significant role as an interactive mathematics learning medium that suits the needs of the digital age. For example, according to the results of recent research, the use of GeoGebra in mathematics learning has been proven to increase student engagement, strengthen concept understanding, and encourage collaboration between students in solving problems [47,48,49,57,58,59].
A dynamic visual interface is a fundamental characteristic of educational applications designed to promote mathematical understanding. Through an interactive and responsive display, learners are able to manipulate mathematical objects and observe immediate graphical outcomes, which bridge the gap between abstract reasoning and concrete representation. In GeoGebra, this feature facilitates deep conceptual comprehension by allowing students to explore statistical and mathematical relationships dynamically. The capacity to adjust variables, functions, or geometric parameters in real time enhances students’ cognitive engagement and promotes exploratory learning. As a result, abstract ideas such as function transformations, probability distributions, or data variability become more accessible. Such interactivity aligns with the principles of cognitive constructivism, emphasizing learning through active engagement rather than passive reception. Empirical studies demonstrate that dynamic visualization tools like GeoGebra significantly improve students’ conceptual retention and transfer of knowledge to new contexts [96,97,98].
Equally important, effective mathematical applications must allow students to express personal models and individual interpretations of mathematical ideas. GeoGebra supports this by offering open-ended environments where learners can design their own constructions, applets, or simulations that reflect their understanding of mathematical principles. This flexibility empowers students to personalize their learning process and explore mathematical phenomena creatively. Instructors, meanwhile, can use these self-generated models as diagnostic tools to assess conceptual development and misconceptions. The platform’s adaptability encourages diverse learning styles, accommodating both visual and kinesthetic learners. Consequently, GeoGebra functions not only as a computational utility but also as a pedagogical bridge that connects personal creativity with formal mathematical structure. Recent findings affirm that students’ autonomy in model creation enhances motivation and self-efficacy in mathematics learning [99,100,101].
The third crucial criterion for an effective learning application involves its ability to facilitate pattern recognition and mathematical modeling through exploration. GeoGebra excels in this domain by providing tools for regression analysis, curve fitting, and functional modeling that allow learners to derive mathematical relationships from data sets. This promotes inductive reasoning, as students can hypothesize patterns, test conjectures, and refine models iteratively. The real-time feedback available through graphical representation strengthens metacognitive awareness, enabling learners to evaluate the accuracy and relevance of their findings. Furthermore, the availability of dynamic sliders and linked algebraic views helps students develop an intuitive sense of how parameters influence mathematical behavior. Through this process, students become more proficient in constructing and interpreting models, a vital skill in the era of data-driven inquiry. Research supports that GeoGebra enhances analytical thinking by linking exploration to formal reasoning processes [102,103,104].
The fourth feature concerns the application’s capacity to integrate real-world data, bridging theoretical learning with practical relevance. GeoGebra supports this integration by enabling users to import, manipulate, and analyze authentic datasets directly within its environment. Students can engage in activities such as investigating population growth, analyzing climate data, or studying economic trends using real statistical information. This approach situates mathematical learning in realistic contexts, thereby improving students’ data literacy and critical thinking. In addition, it supports interdisciplinary connections between mathematics, science, and social studies. Through such contextualized learning, students understand how mathematical tools function as instruments for problem-solving in real life. Studies have shown that when learners interact with authentic data through platforms like GeoGebra, their appreciation of mathematics as a practical discipline significantly increases [105,106,107].
Finally, the fifth aspect of effective learning applications is their capacity to facilitate communication and sharing of mathematical ideas among learners. GeoGebra’s cloud-based ecosystem and collaborative features allow students and teachers to share applets, models, and visualizations easily across digital platforms. This encourages peer-to-peer learning, where knowledge construction becomes a social and interactive process. Learners can comment on, modify, and build upon others’ work, fostering a sense of academic community and collective inquiry. Moreover, the ability to publish interactive resources supports open educational practices and continuous professional development among educators. By simplifying the dissemination of mathematical representations, GeoGebra democratizes access to quality learning materials globally. Recent research highlights that such collaborative and communicative affordances of GeoGebra enhance both engagement and deeper learning outcomes [108,109,110].
iii. GeoGebra as a Visualization Media
According to [78], GeoGebra has various main functions that make it very useful in mathematics learning, including as a demonstration and visualization medium, as a construction aid, and as a discovery process media. The visualization function becomes especially crucial in statistical topics that are often considered abstract by students, such as probability distribution, hypothesis testing, and regression. With the dynamic graph feature, students can see firsthand the change in the shape of the opportunity distribution when the parameters are changed, or can understand the sampling process more intuitively through simulations. This not only helps students understand concepts more quickly, but also increases long-term retention of the material. The interactive visualization provided by GeoGebra is able to reduce the cognitive burden of students because abstract concepts are presented in the form of graphics that are easier to digest [60]. Furthermore, GeoGebra supports exploration-based learning, where students can manipulate data and see its impact directly on graphs or tables. This approach is in accordance with constructivism theory which emphasizes the active role of students in building knowledge through learning experiences [61]. Thus, GeoGebra is not just an additional application, but an integral part of modern pedagogical strategies that support statistical learning outcomes in higher education. [34,35]
GeoGebra serves as a multifunctional educational platform that integrates visualization, construction, and discovery in mathematical learning. Its versatility lies in its capacity to combine symbolic, algebraic, and graphical representations within a single interactive interface. This integration provides learners with a coherent and dynamic learning environment where abstract mathematical relationships become visually meaningful. In the context of statistical education, such visualization transforms symbolic formulas and theoretical distributions into concrete, manipulable forms. Students are able to directly observe how probability curves, regression lines, or sampling intervals behave when parameters are adjusted in real time. This interaction enhances conceptual understanding while simultaneously reinforcing procedural fluency. GeoGebra’s adaptability across devices—laptops, tablets, and smartphones—further broadens access to active learning experiences beyond classroom boundaries. Studies in the last few years have confirmed that this multifunctional capability makes GeoGebra a critical instrument in contemporary mathematics education [111,112].
Visualization plays an especially significant role in helping students comprehend complex and abstract topics in statistics. Concepts such as probability distributions, hypothesis testing, and correlation often present cognitive challenges when taught solely through numerical or symbolic approaches. GeoGebra bridges this gap by allowing learners to visualize how parameter changes affect statistical models dynamically. For instance, in exploring the normal distribution, students can manipulate the mean and standard deviation to observe how the curve’s shape and spread vary. Such immediate visual feedback enables learners to establish connections between theoretical parameters and empirical behavior, fostering deeper understanding. The interactive nature of this visualization not only clarifies statistical concepts but also reduces student anxiety and misconceptions in data interpretation. Consequently, students develop stronger confidence in their analytical skills. Empirical findings have shown that dynamic visualization tools like GeoGebra enhance comprehension and retention of abstract statistical concepts [113,114,115].
Beyond mere visualization, GeoGebra fosters a discovery-oriented learning approach consistent with constructivist educational principles. It provides an environment where learners can actively explore mathematical and statistical relationships, generate hypotheses, and verify results through experimentation. By manipulating data and observing real-time outcomes, students construct their own understanding rather than memorizing predefined solutions. This experiential process strengthens both cognitive engagement and metacognitive awareness, as learners continuously reflect on their discoveries. Furthermore, GeoGebra encourages curiosity-driven inquiry by allowing learners to experiment freely without fear of making irreversible errors. Instructors can guide these explorations by posing open-ended questions or problem scenarios that stimulate deeper reasoning. Research supports that discovery-based learning facilitated through GeoGebra improves conceptual transfer and long-term academic achievement [116,117].
An additional advantage of GeoGebra lies in its ability to reduce students’ cognitive load through multimodal learning. When abstract ideas are presented in purely symbolic forms, students often experience cognitive overload due to the need to process several abstract operations simultaneously. GeoGebra alleviates this challenge by presenting the same information across multiple representations—graphical, algebraic, and numerical—allowing learners to select the form that best supports their understanding. This multisensory approach promotes more efficient mental processing and facilitates the integration of new knowledge with prior understanding. Moreover, by simplifying complex concepts visually, GeoGebra increases accessibility for diverse learners, including those with lower mathematical readiness. The combination of simplicity and interactivity makes it an effective bridge between abstract theory and practical comprehension. Recent educational research confirms that such multimodal digital environments significantly reduce extraneous cognitive load in mathematics learning [118,119,120].
Finally, GeoGebra’s emphasis on exploration-based and collaborative learning aligns with the needs of higher education in the digital era. The platform’s capacity to simulate data-driven experiments and visualize outcomes enables students to approach statistics as an active process of discovery rather than passive knowledge reception. Instructors can design interactive tasks where students work in pairs or groups to analyze datasets, test hypotheses, and discuss graphical results. This promotes peer learning and collective problem-solving, two essential competencies in data-centered academic disciplines. Additionally, the platform’s sharing features allow for immediate dissemination of applets and results, facilitating academic collaboration beyond geographical limitations. As higher education increasingly integrates technology into pedagogical practice, GeoGebra exemplifies the shift toward student-centered, inquiry-driven instruction that enhances digital literacy and statistical reasoning simultaneously. Studies from recent years confirm its effectiveness as a pedagogical innovation that advances both engagement and understanding in statistical learning [121,122].
iv. GeoGebra in Statistical Learning
In the context of statistical learning, the use of GeoGebra focuses not only on the final result in the form of numbers or graphs, but also on the underlying procedural understanding. Students are not only invited to enter data, but also understand the analysis steps carried out by the application. Thus, GeoGebra helps students develop analytical and technical thinking skills. GeoGebra can be used to manage data, create frequency distribution graphs, calculate the size of data centers, and analyze opportunities [36,37,38]. In addition, students can simulate the distribution of opportunities both continuously and discretely to strengthen their understanding of the properties of distribution. Hypothesis tests that are usually considered complicated by students can also be visualized more simply through interactive graphs displayed by GeoGebra. Thus, GeoGebra helps connect abstract statistical concepts with visual representations that are easier to understand. Recent studies have shown that students who use GeoGebra in statistical learning show a significant improvement in concept understanding compared to students who only use traditional lecture-based methods [20,24,25,26,27].
In the context of statistical learning, the use of GeoGebra extends beyond mere computational output, emphasizing a deeper engagement with procedural understanding. Rather than treating statistics as a series of mechanical steps, GeoGebra enables learners to visualize and comprehend each stage of data analysis, from input to interpretation. Through interactive manipulation, students can observe how datasets are transformed through various analytical processes, such as organizing data, applying formulas, and constructing visual outputs. This procedural visibility helps bridge the gap between abstract numerical calculations and conceptual understanding. It also encourages students to ask critical questions about why and how certain methods produce specific results. As a result, learners gain not only technical proficiency but also metacognitive awareness of their analytical reasoning. Recent pedagogical research emphasizes that this process-oriented use of GeoGebra strengthens both statistical literacy and computational thinking in students [123,124,125].
GeoGebra’s capacity to manage data and generate frequency distribution graphs allows students to explore statistical principles interactively and meaningfully. For instance, learners can quickly visualize changes in data centrality or dispersion by adjusting numerical inputs, thereby observing direct effects on histograms or box plots. Beyond static representation, GeoGebra promotes an active exploration of data variation, enabling learners to grasp the significance of statistical measures such as mean, median, mode, variance, and standard deviation in a dynamic context. By presenting these measures in real-time, the application transforms statistical learning into an exploratory experience rather than a passive exercise in formula memorization. This interactive feature encourages a hands-on approach that has been proven to enhance data literacy and deepen students’ understanding of descriptive statistics. As reported in empirical studies, using digital visualization tools such as GeoGebra significantly improves students’ retention and application of statistical measures [126,127].
Another significant pedagogical advantage of GeoGebra lies in its ability to model probability distributions—both discrete and continuous—allowing learners to visualize randomness, variation, and uncertainty. Abstract ideas such as binomial, normal, or Poisson distributions become more tangible when represented dynamically, where students can manipulate parameters like sample size or probability of success and immediately see how curves change. This real-time visualization helps demystify probabilistic concepts that are often misunderstood when presented purely symbolically. Students can also simulate multiple experiments to observe convergence toward theoretical probabilities, reinforcing the concept of the law of large numbers. Such simulations foster a deeper appreciation for the stochastic nature of data and encourage a more intuitive grasp of variability. Research in recent years confirms that visual simulation in GeoGebra significantly enhances learners’ conceptual understanding of probability and statistical reasoning [128,129,130].
In inferential statistics, GeoGebra’s contribution is particularly valuable in visualizing hypothesis testing processes that many students traditionally find challenging. Through interactive graphical displays, learners can visualize critical regions, p-values, and sampling distributions that correspond to specific tests such as the Z-test, t-test, or χ²-test. Rather than relying solely on abstract formulas, students can directly observe how test statistics are positioned within a distribution curve and how changes in parameters influence decision outcomes. This dynamic approach helps clarify the logic behind statistical inference—linking theoretical assumptions with graphical evidence. Moreover, by manipulating data inputs, students can explore how sample size, standard deviation, or confidence level affect hypothesis results. Consequently, GeoGebra transforms inferential statistics from an intimidating procedural topic into an engaging visual reasoning process. Studies have demonstrated that visual-based learning environments such as GeoGebra promote greater comprehension and confidence in hypothesis testing [131].
Ultimately, the integration of GeoGebra in statistical education fosters a more holistic form of learning that connects abstract concepts to concrete visual representations. Students not only learn how to compute and interpret data but also develop analytical reasoning, pattern recognition, and decision-making abilities grounded in visual evidence. GeoGebra’s dynamic learning environment supports both inductive and deductive reasoning—allowing students to discover relationships through experimentation and verify them through formal analysis. This balance between procedural fluency and conceptual insight is vital for cultivating statistical competence in higher education. Moreover, GeoGebra’s flexibility to blend with other digital tools and learning management systems extends its relevance to both traditional and online classrooms. Current research affirms that the integration of GeoGebra in statistical pedagogy enhances student motivation, engagement, and long-term retention of key statistical ideas [132].
v. Data Presentation and Processing with GeoGebra
One of the advantages of GeoGebra is its ability to present and process data interactively. Students can enter raw data and then visualize it in the form of bar charts, histograms, pie charts, or boxplots. This visualization helps students understand the distribution of data, detect outliers, and see general trends in the data [39,40]. In addition, students can also calculate data centering measures such as mean, median, and mode, as well as dispersion measures such as variance and standard deviation faster. This process not only generates numbers, but also emphasizes understanding why the value appears and how it is interpreted in the context of real data. With this approach, students not only master technical skills in data processing, but also analytical skills that are essential in understanding the reality represented by data. Therefore, the use of GeoGebra in data processing is considered very relevant to the needs of statistical learning in higher education [67,68].
One of GeoGebra’s primary advantages lies in its capability to process and present data dynamically through real-time visualization. Rather than requiring learners to switch between manual calculation and static display, GeoGebra integrates both processes within an interactive interface. Students can input raw data directly into the spreadsheet view, which is automatically linked to the graphical display. This feature allows immediate transformation of numeric data into visual forms such as histograms, bar charts, pie charts, and boxplots, bridging the gap between quantitative analysis and conceptual understanding. The seamless interaction between data input and visual feedback encourages learners to explore relationships among variables and detect patterns intuitively. Moreover, GeoGebra’s adaptability across multiple data types—categorical, discrete, or continuous—enhances its applicability across diverse statistical topics. Recent pedagogical research highlights that such dynamic visualization environments significantly improve statistical comprehension and analytical reasoning among higher education students [133].
Interactive data visualization in GeoGebra plays a pivotal role in helping students understand the overall structure and behavior of data distributions. By observing the graphical outputs, learners can easily identify outliers, skewness, and clustering patterns that may not be apparent through numerical summaries alone. This dual approach—numerical computation supported by visual exploration—facilitates deeper engagement with the data. For instance, when a student modifies a data point in the spreadsheet, the associated histogram or boxplot updates instantly, providing immediate visual confirmation of how the change affects the entire dataset. This responsiveness transforms the learning process into an exploratory cycle of hypothesis formation, testing, and reflection. Students begin to see statistical analysis not as a series of isolated steps but as a coherent process of interpretation and meaning-making. Empirical studies have demonstrated that this iterative engagement strengthens students’ inferential thinking and data interpretation skills [134].
Furthermore, GeoGebra simplifies the calculation and interpretation of key statistical measures such as mean, median, and mode, as well as variance and standard deviation. The integration of computation with visualization allows students to connect abstract numerical results to the graphical characteristics of a dataset, reinforcing understanding of central tendency and variability. When students can visually perceive how dispersion relates to the shape of a histogram or boxplot, statistical formulas gain contextual significance. This integrated process fosters both procedural fluency and conceptual understanding—two competencies that are often taught separately in traditional instruction. GeoGebra’s ability to display intermediate steps in data computation also helps demystify how summary statistics are derived from raw data. Such transparency promotes statistical literacy by enabling learners to trace relationships between numbers and their real-world interpretations. Research confirms that interactive platforms combining visualization and computation improve students’ understanding of statistical measures and their conceptual meanings [135].
The use of GeoGebra in data processing also nurtures higher-order analytical skills that extend beyond simple calculation. Students learn to interpret statistical results critically, asking why a particular measure appears and how it reflects the characteristics of the dataset. This process-oriented approach cultivates analytical habits of mind—students begin to analyze variability, question data sources, and evaluate whether conclusions are supported by empirical evidence. Instructors can leverage GeoGebra to design inquiry-based tasks where students investigate authentic datasets, simulate sampling processes, and justify their interpretations. Such experiences align with the goals of modern statistical education, which emphasize reasoning, communication, and contextual understanding rather than rote computation. Studies from multiple higher education contexts report that the integration of GeoGebra promotes analytical thinking, self-reflection, and data-driven argumentation among university students [136].
Ultimately, the relevance of GeoGebra in statistical learning derives from its alignment with 21st-century educational needs. The platform supports both digital literacy and data competence, which are essential skills for graduates navigating a data-intensive world. GeoGebra transforms traditional statistical exercises into interactive explorations that mirror the authentic processes of data analysis in research and industry. By combining accessibility, interactivity, and visual feedback, the software promotes equitable participation in statistical reasoning regardless of learners’ prior background or mathematical confidence. Moreover, its integration with web-based environments allows for collaborative learning and knowledge sharing across institutional boundaries. This pedagogical transformation positions GeoGebra as more than a teaching tool—it functions as a catalyst for developing critical, creative, and analytical thinkers in the era of big data. Contemporary studies reaffirm its effectiveness as a digital medium that bridges theory, application, and critical reflection in statistical education [1,2,130].
vi. Discrete and Continuous Opportunity Distribution
The topic of opportunity is one of the important parts of learning statistics which is often considered difficult by students because of its abstract nature. GeoGebra is here to bridge these difficulties by providing opportunity distribution visualization features, both discrete and continuous[41,42]. For example, in binomial or Poisson distributions, students can easily manipulate parameters to see how changes in odds occur. Meanwhile, for continuous distributions such as normal or exponential, students can see directly the shape of the curve and the area below the curve that represents a specific opportunity. This visualization process is very helpful for students in understanding the integral concept of continuous distribution and the relationship between parameters and forms of distribution. In other words, GeoGebra allows students to learn more intuitively about opportunities without having to be directly burdened by complex formulas. This is in line with recent research that states that the use of GeoGebra in the topic of opportunity distribution increases students' motivation to learn as well as their ability to relate theory to practice [34,35,36].
The topic of probability, often referred to as opportunity in certain educational contexts, constitutes one of the most conceptually challenging areas of statistics learning. Many students perceive probability as an abstract and theoretical field due to its reliance on symbolic reasoning, formulaic manipulation, and conceptual generalization. GeoGebra, with its capacity to visualize dynamic mathematical relationships, provides an effective pedagogical bridge to overcome this abstraction. Through its probability distribution visualization tools, the software allows students to interactively explore the behavior of random variables in both discrete and continuous forms. Instead of merely memorizing formulas, learners can directly observe how probability distributions change in response to variations in parameters such as the mean, variance, or rate. This immediate visual feedback transforms the learning of probability from passive memorization into active conceptual inquiry. As several studies confirm, interactive visualization enhances comprehension and helps students internalize complex probabilistic relationships [136].
GeoGebra enables students to manipulate parameters in discrete distributions such as binomial, geometric, and Poisson models to explore how these parameters influence outcome probabilities. For example, when learners adjust the number of trials or the probability of success in a binomial setting, the shape of the distribution dynamically shifts, revealing the relationship between model parameters and data variability. This interactivity promotes experiential understanding, allowing students to hypothesize and test predictions instantly. The software thus supports an inquiry-based learning model where students construct probabilistic meaning through experimentation and observation rather than through formulaic derivation alone. In doing so, GeoGebra encourages a form of visual reasoning that complements symbolic and numerical approaches traditionally emphasized in probability instruction. Empirical findings suggest that this exploratory experience improves conceptual retention and reduces the cognitive load associated with learning abstract probability formulas [135].
For continuous probability distributions, GeoGebra’s graphing capabilities further strengthen conceptual understanding by linking algebraic and geometric representations. Students can visualize continuous models such as the normal, exponential, or uniform distributions and dynamically observe how probability density changes with parameter variations. By adjusting the mean and standard deviation, for instance, learners see the normal curve widen or narrow in real time, reinforcing their comprehension of variance and spread. Moreover, the ability to shade the area under the curve directly connects the graphical representation with the integral concept that defines continuous probabilities. This visual approach helps demystify calculus-based reasoning in probability, allowing students to see that the area corresponds to the likelihood of specific outcomes. Consequently, GeoGebra bridges the cognitive gap between symbolic integration and conceptual probability, leading to a deeper, more intuitive grasp of continuous models [134].
The visualization of probability distributions in GeoGebra also cultivates higher-order cognitive skills such as analytical reasoning, modeling, and interpretation. Rather than focusing solely on procedural accuracy, students engage in reflective thinking—interpreting probability values, identifying relationships between variables, and explaining observed patterns. Such reflective engagement is consistent with constructivist learning theories that view knowledge as actively built through interaction and contextualization. Instructors can further extend this approach by designing problem-based activities in which students simulate random events, compare theoretical and empirical distributions, and evaluate the accuracy of probabilistic models. These learning experiences foster critical thinking and connect abstract probability concepts with real-world data phenomena. Research has shown that using GeoGebra in this way promotes self-directed exploration, deeper metacognitive awareness, and meaningful engagement in learning probability [133].
Ultimately, GeoGebra’s integration into the teaching of probability aligns with the pedagogical shift toward visualization-based, technology-supported learning in mathematics and statistics education. By enabling intuitive exploration of discrete and continuous distributions, it provides a scaffold that helps students transition from visual understanding to formal reasoning. The dynamic representation of probability fosters not only conceptual mastery but also learning motivation, as students experience a sense of discovery and empowerment in manipulating abstract concepts visually. Furthermore, the tool supports inclusivity in learning by accommodating diverse cognitive styles—particularly for students who struggle with purely symbolic or numerical representations. As recent studies demonstrate, the incorporation of GeoGebra in teaching probability distributions substantially enhances students’ learning outcomes, engagement, and ability to link theoretical knowledge with applied interpretation [132].
vii. Test Hypotheses with GeoGebra
Hypothesis testing is one of the most challenging materials in statistics because it requires understanding the concept of chances, distribution, and the ability to interpret test results. GeoGebra can help students understand the hypothesis testing process through graphical visualization, for example by displaying the acceptance and rejection regions of the hypothesis at normal distributions [43,44]. Students can see how the statistical value of the test compares to the critical value, as well as how the interpretation of the test results is to the null hypothesis. In this way, students not only calculate, but also understand the basic concepts behind statistical decision-making. This visualization helps reduce misunderstandings that often arise, for example regarding the difference between type I and type II errors. Furthermore, students can perform repeated simulations with different data to understand the variations in results that may appear in real research. Thus, GeoGebra is not only a technical tool, but also a pedagogical means to deepen students' conceptual understanding of hypothesis tests [45,46,47].
Hypothesis testing represents one of the most conceptually and procedurally demanding topics in statistics education. Students must comprehend abstract ideas such as sampling distribution, critical regions, significance levels, and error types, which often leads to confusion and cognitive overload. GeoGebra offers an interactive platform that assists students in visualizing the entire hypothesis testing process, from the establishment of hypotheses to the interpretation of statistical outcomes. Through dynamic graphing tools, students can visualize acceptance and rejection regions in normal or t distributions, observe how test statistics are positioned relative to critical values, and interpret the implications for null and alternative hypotheses. This visualization transforms an otherwise abstract decision-making process into an intuitive and interactive experience. By engaging with these visual models, learners can develop a deeper and more flexible conceptual understanding of inferential reasoning. As demonstrated in recent educational research, interactive simulations in GeoGebra significantly improve students’ comprehension of hypothesis testing principles [131].
The use of GeoGebra in hypothesis testing instruction bridges the gap between procedural calculations and conceptual understanding. Rather than focusing solely on formulaic operations, students are guided to visualize the logic behind the testing process. For instance, by graphically representing the p-value area under the curve, learners can immediately grasp its relationship to the chosen significance level. Similarly, by altering sample size or standard deviation, students can observe how the shape of the sampling distribution changes and how that affects test sensitivity. These manipulations help internalize critical inferential concepts, including power and variability, through exploration rather than rote computation. The real-time feedback provided by GeoGebra also supports formative assessment, allowing instructors to identify misconceptions as they emerge during learning activities. This form of visual inquiry learning aligns closely with the constructivist approach to teaching statistics [130,131].
A particularly important advantage of using GeoGebra in hypothesis testing lies in its ability to clarify the distinctions between type I and type II errors—two areas that consistently cause confusion among students. By illustrating the overlap between distributions representing true and false hypotheses, the software makes visible how α (alpha) and β (beta) relate to one another in determining the accuracy of statistical decisions. This visualization allows students to see how reducing one type of error inevitably increases the other, helping them appreciate the trade-offs involved in real-world statistical inference. Through repeated simulations, learners can also experiment with different critical values or significance thresholds to observe their effects on rejection regions and decision outcomes. Such explorations transform static statistical ideas into dynamic cognitive experiences that foster analytical reasoning. Evidence suggests that when hypothesis testing is taught through dynamic visualization, students achieve significantly higher conceptual retention [128,129].
Moreover, GeoGebra provides opportunities for students to perform virtual experiments and sampling simulations that reinforce the relationship between empirical and theoretical results. By generating multiple random samples and performing automated tests, learners observe how test statistics fluctuate across samples and how conclusions vary in response. This experiential learning connects the logic of hypothesis testing with real research contexts, demonstrating the probabilistic nature of statistical inference. The iterative process of simulation also promotes metacognitive reflection, as students evaluate their understanding of variability, error, and confidence levels. In this way, GeoGebra supports the development of statistical literacy—helping students transition from procedural competence to interpretive expertise. Research in technology-enhanced statistics education highlights this as a key factor in improving reasoning and critical thinking [127].
Ultimately, GeoGebra should be seen not merely as a computational aid, but as a pedagogical framework that transforms how students learn hypothesis testing. It shifts emphasis from symbolic manipulation toward visual reasoning, conceptual clarity, and analytical dialogue. Students actively construct meaning by linking graphs, numbers, and conceptual inferences, leading to deeper understanding and longer knowledge retention. Furthermore, GeoGebra encourages collaborative exploration, allowing students to share and discuss visual results that support their arguments in a data-driven way. This approach resonates strongly with current trends in digital mathematics education that value interactivity, inquiry, and visualization as central components of effective learning. Recent empirical studies affirm that GeoGebra-based learning significantly improves motivation, comprehension, and inferential reasoning accuracy in hypothesis testing tasks [126].
viii. Collaboration and Exploration through GeoGebra
In addition to being used individually, GeoGebra also supports collaborative learning. Students can work in small groups to solve specific statistical problems using GeoGebra, then discuss the results of their exploration. The sharing feature in GeoGebra allows students to exchange files or projects, thus enriching the learning process through discussion and comparison. This approach is in line with social learning theory which emphasizes the importance of interaction and communication in building knowledge. In this way, students not only learn statistical concepts, but also develop scientific communication skills and teamwork. Recent research shows that collaboration-based learning with GeoGebra is able to improve students' problem-solving skills and strengthen their confidence in dealing with statistical problems [3,45,46].
Collaborative learning has become a cornerstone of contemporary educational practice, emphasizing interaction, communication, and shared meaning-making. Within this pedagogical framework, GeoGebra serves as an ideal platform for promoting collaboration in statistical learning. Its dynamic and interactive interface allows students to collectively manipulate mathematical and statistical representations, fostering active engagement and cooperative problem-solving. By working together on a shared GeoGebra project, students exchange perspectives and discuss alternative solutions, thereby enhancing conceptual understanding through social negotiation. This process aligns with Vygotsky’s social constructivist principles, which posit that learning occurs most effectively through social interaction and scaffolding among peers. The visual and interactive nature of GeoGebra facilitates these processes by providing a shared representational space where ideas can be made explicit and compared. Research has shown that such collaborative visualization enhances collective reasoning and supports deeper comprehension of complex concepts [125].
The sharing and cloud-based collaboration features of GeoGebra extend learning beyond the confines of the traditional classroom. Students can create, upload, and share interactive applets or statistical models, enabling asynchronous collaboration and continuous discussion. This feature supports the development of both individual and collective competencies, as learners can analyze peers’ work, provide feedback, and refine their own ideas in response. Moreover, instructors can monitor collaborative activities, offering targeted guidance and formative assessment based on real-time student interactions. The process of co-constructing mathematical knowledge within a digital environment encourages reflective learning and critical thinking, as students must articulate their reasoning clearly to others. Such peer-to-peer exchanges also promote inclusivity, as students with different levels of proficiency can support each other’s progress. Studies confirm that digital collaboration through GeoGebra fosters social presence and academic engagement in virtual and blended learning environments [124].
Collaborative use of GeoGebra also cultivates important soft skills such as teamwork, communication, and digital literacy—competencies increasingly valued in modern education and professional contexts. When students collectively engage in solving statistical problems, they must negotiate roles, distribute tasks, and synthesize findings into coherent conclusions. This collaborative dynamic mirrors authentic professional research practices where data analysis is often a group endeavor. Through this process, learners not only gain technical proficiency in statistical computation but also develop communication skills required to explain, justify, and defend their analytical conclusions. The process of articulating reasoning in front of peers enhances metacognitive awareness and consolidates conceptual understanding. Furthermore, the shared digital workspace in GeoGebra ensures that each group member contributes meaningfully to the task, reinforcing accountability and interdependence. Recent empirical evidence shows that such collaborative learning experiences improve both cognitive achievement and interpersonal skill development in statistical education [123].
From a pedagogical perspective, collaboration-based learning through GeoGebra aligns with the principles of inquiry-based learning, where knowledge is built collectively through exploration, questioning, and discussion. The software’s interactive tools enable students to test hypotheses, visualize statistical data, and interpret findings as a team, thus promoting a deeper and more socially mediated learning experience. This communal construction of knowledge transforms statistical learning from a passive activity into an active inquiry process. Moreover, the availability of real-time feedback and graphical visualization supports evidence-based reasoning within group discussions. Students become co-investigators who collaboratively interpret and validate data-driven conclusions. This approach encourages the development of epistemic beliefs about mathematics as a dynamic and collaborative discipline rather than a fixed set of procedures. Studies have found that collaborative inquiry using GeoGebra enhances students’ confidence, motivation, and statistical reasoning skills [122].
Ultimately, GeoGebra’s collaborative capabilities not only enhance the mastery of statistical content but also cultivate 21st-century skills essential for lifelong learning. The integration of communication, critical thinking, creativity, and collaboration into the statistical learning process reflects the broader educational goal of producing adaptive and innovative thinkers. By engaging in shared explorations, learners experience how technology can mediate cooperation and co-construction of knowledge. The open-ended nature of GeoGebra activities allows for flexibility and personalization within teamwork, ensuring that each participant’s contribution shapes the collective outcome. Moreover, the transparent and replicable nature of shared GeoGebra projects encourages scientific rigor and accountability, as group outputs can be revisited and refined. As highlighted in recent studies, GeoGebra-supported collaboration has been shown to significantly enhance engagement, performance, and self-efficacy in mathematical problem-solving tasks [121].
ix. Challenges and Limitations of Using GeoGebra
While GeoGebra has many advantages, there are also some challenges in its use in statistical learning. One of the main challenges is the limited digital literacy of some students who are still not used to using technology-based applications. Additionally, some GeoGebra features may require further adjustment to suit the needs of advanced statistical analysis. Lecturers also need to spend additional time to design learning activities that are in accordance with the use of GeoGebra. However, this challenge can be overcome with initial training, both for lecturers and students, as well as by providing clear practical guidance. Over time, these limitations will diminish as the user experience in using the app improves. In fact, some studies have stated that students who initially had difficulty using GeoGebra were finally able to master it well and feel more confident in doing statistical assignments [64,65].
While GeoGebra offers numerous pedagogical advantages in facilitating interactive and conceptual learning, its integration into statistical education is not without challenges. One of the most pressing issues is the digital divide that persists among students and instructors, particularly in developing contexts. Limited exposure to technology and insufficient digital literacy can hinder effective use of GeoGebra’s features. Students who are unfamiliar with interactive tools may struggle to navigate the software or misinterpret visualizations, thereby reducing learning efficiency. This limitation is especially evident in cohorts where technology integration in mathematics education remains at an early stage. Furthermore, lecturers may face difficulties when adapting traditional lesson plans into digitally enriched activities that align with GeoGebra’s constructivist approach. These challenges underscore the need for strategic capacity-building programs that equip both educators and learners with the necessary skills to maximize the pedagogical potential of digital platforms. As pointed out by Pratama (2021), the success of digital learning environments largely depends on sustained digital readiness and institutional support structures.
Another significant challenge lies in the customization of GeoGebra features for advanced statistical analysis. Although GeoGebra has evolved beyond geometry and calculus into statistical modeling, some complex analyses—such as multivariate regressions or inferential hypothesis testing—may still require integration with specialized software such as R or SPSS. Consequently, educators often need to design hybrid learning environments that combine GeoGebra’s visual strengths with the computational rigor of other tools. This process requires technical expertise and pedagogical creativity, as lecturers must align software functionalities with intended learning outcomes. However, this challenge also presents opportunities for cross-software literacy, allowing students to experience how visual analytics and statistical programming complement one another. The interdisciplinary integration of GeoGebra within broader analytical ecosystems encourages students to approach data analysis holistically, bridging conceptual understanding with computational application. Studies have highlighted that effective orchestration of multiple technologies can significantly enhance the depth of statistical reasoning and applied data literacy [120].
The time investment required for educators to prepare GeoGebra-based lessons is another recurrent concern. Designing interactive statistical activities demands not only conceptual mastery but also technical fluency in manipulating the software. Instructors must anticipate potential misconceptions, construct dynamic worksheets, and ensure that simulations align with curricular objectives. Such preparation may initially appear time-consuming, particularly for lecturers balancing teaching, research, and administrative duties. However, once developed, these learning modules can be reused and shared among peers through online repositories, amplifying their impact across institutions. This collaborative approach aligns with open educational resource (OER) principles, fostering academic sharing and innovation. Moreover, institutional support in the form of workshops and professional development programs can reduce individual workload and accelerate pedagogical adaptation. Research suggests that teacher professional learning communities play a crucial role in promoting long-term sustainability of technology integration [119].
To address the aforementioned barriers, structured digital training for both lecturers and students is imperative. Orientation sessions that introduce GeoGebra’s key functionalities and pedagogical affordances can significantly improve users’ confidence and motivation. Clear instructional scaffolding—such as video tutorials, guided worksheets, and task-based exercises—enables smoother transitions from traditional to technology-enhanced learning. In addition, incorporating reflective discussions about the role of visualization and interactivity in learning helps students develop metacognitive awareness of how tools shape understanding. The iterative practice of applying GeoGebra in progressively complex statistical tasks allows learners to build fluency over time. Institutions that integrate these support mechanisms within their curricula have reported higher adoption rates and more positive student attitudes toward digital learning. Recent studies emphasize that early-stage digital mentorship reduces technology-related anxiety and enhances academic engagement in STEM contexts [118].
Despite the initial learning curve, evidence shows that with consistent practice and guided instruction, both educators and students adapt successfully to using GeoGebra in statistical contexts. Learners who initially faced difficulties navigating the interface eventually reported greater satisfaction and self-efficacy in handling data-driven tasks. Over time, familiarity with the platform transforms apprehension into empowerment, as students gain autonomy in exploring mathematical models and statistical relationships. This progressive mastery supports lifelong digital competence, preparing learners for future data-intensive careers. The transformative potential of GeoGebra thus extends beyond mathematics classrooms, contributing to digital literacy and analytical thinking more broadly. As educators refine their methodologies and technological fluency improves, the early challenges of adoption are likely to diminish substantially. Empirical studies have consistently found that sustained use of GeoGebra leads to enhanced motivation, confidence, and conceptual retention in mathematical and statistical learning [115,116,117].
Overall, GeoGebra is proving to be one of the most relevant and effective applications to use in statistical learning in college. This application not only helps students in solving technical problems, but also supports a deeper conceptual understanding. With interactive visualizations, GeoGebra bridges the gap between abstract theory and real practice, and encourages the 21st-century skills students need. The use of GeoGebra in the topics of data presentation, opportunity distribution, and hypothesis testing shows great potential in improving the quality of statistical learning. [62,63] Despite the limitations, the benefits provided are much greater, especially in the context of the digital transformation of education in the 2020–2025 period. Therefore, the integration of GeoGebra in statistics learning needs to be expanded in order to make maximum contributions to improving the quality of mathematics and statistics education in Indonesia [5,6,7].
3.2. Discussion
3.2.1. GeoGebra as a Data Management Tool
In statistical data management, Microsoft Excel has been the most widely used software because it has various features that can present data in the form of tables, bar charts, pie charts, and histograms that are relatively easy to operate by students and lecturers. However, the main advantage of GeoGebra on the topic of data presentation lies in its ability to provide procedural support that is more dynamic, interactive, and easy for students to understand. The process of making histograms, for example, in theory usually starts from calculating the length of the class, determining many classes, compiling a frequency distribution table, and then producing a histogram. GeoGebra allows these stages to be carried out in one work window with direct interaction so that students can see the logical relationship between processes more clearly. This is certainly different from Excel which emphasizes the final result rather than the construction process. In addition, GeoGebra provides flexibility in setting parameters such as class length, interval limit, and number of classes that can be changed according to research needs. Thus, it is easier for students to explore statistical concepts and not just receive finished results. The dynamics of the graph changing automatically every time a parameter is changed adds to a deeper conceptual understanding. This interactive characteristic is what makes GeoGebra a superior alternative in learning statistics in higher education [15,16,17,18,19,20].
One of the interesting aspects of GeoGebra is the existence of a slider feature that allows students to visualize the movement of parameters in statistical data in real time. When students change the length of the class value on a histogram, the resulting graph view automatically adjusts to those changes, so they can understand how the variation in values affects the shape of the distribution. This advantage is difficult to find in software such as SPSS or Excel which usually only displays the final result without showing the dynamics of the process [8,9,10]. With dynamic visualization, students not only learn "what the result is", but also understand "why the result is so". This approach supports a constructivism-based learning model in which knowledge is actively constructed through interaction with objects and representations. In addition, GeoGebra is able to integrate various forms of data representation in a single screen, for example displaying frequency distribution tables, histograms, and frequency polygons at once. This strengthens students' ability to relate numerical concepts with visual representations that are easier to understand. In the context of learning statistics at UIN Syahada Padangsidimpuan, the existence of this feature is very helpful for lecturers in making the classroom atmosphere more interactive and encouraging students to be actively involved in discussions [67,68,69].
GeoGebra also simplifies the statistical learning process by providing a variety of ready-to-use applets that can be used to teach basic to advanced concepts. For example, on a data processing topic, lecturers can display an applet that visualizes changes in the shape of a histogram or bar chart when input data is modified. This makes it easier for students to understand the relationship between raw data and the visual representations that emerge. Not only that, students can try independently by entering the data they collected from the results of field surveys, and then seeing how the distribution changes when variables or sample numbers are changed. Thus, learning becomes more contextual because the data used comes from students' real experiences. Furthermore, the GeoGebra applet allows integration with project-based learning methods where students can work on data processing tasks with the support of technology. This method has been proven to increase students' motivation to learn and strengthen their data analysis skills [47,48,49,50].
GeoGebra's advantage in data processing lies not only in its dynamic visualization, but also in its ability to help students understand abstract statistical concepts. For example, concepts about data centering measures such as mean, median, and mode can be visualized directly in the distribution graph so that students can see the position of each of these measures in relation to the data as a whole [3]. This kind of representation is very helpful, especially for students who have difficulty understanding abstract mathematical formulas. With GeoGebra, they not only calculate numbers but also understand the conceptual meaning of those statistical measures. This is in line with the principle that conceptual understanding is more important than just procedural skills. In addition, GeoGebra allows students to test initial hypotheses about the data, for example by shifting parameter values to see how they affect the distribution. This exploration-based approach makes students more critical in analyzing data, as well as fostering the scientific attitude needed in research [1,2,3].
In a practical context, the use of GeoGebra in statistics classrooms also provides opportunities for lecturers to design more interesting and interactive learning. Through the use of applets that have been provided and those made by themselves, lecturers can adjust the material to the needs of students. For example, when discussing the topic of frequency distribution, lecturers can modify the applet to fit the local context, for example using student height data in class or test score data. In this way, students feel closer to the material being studied because the data used is relevant to their lives. This emotional engagement has been shown to increase knowledge retention. GeoGebra also supports collaborative work, where students can discuss in small groups to explore data together. Each group can come up with different representations that are then compared in class discussions. This kind of practice encourages social interaction and develops students' mathematical communication skills [38,39,40].
In addition to supporting classroom learning, GeoGebra is also relevant for use in student research, especially in final projects or theses that require simple data analysis. With a relatively easy-to-understand interface, students can process their own data without having to rely entirely on paid software such as SPSS or Stata. For example, students can use GeoGebra to compile the frequency distribution of survey data, visualize the relationships between variables, and test data distribution patterns. This advantage provides opportunities for students from weak economic backgrounds to still be able to conduct research with the support of technology. In addition, GeoGebra can be used offline or online, so the flexibility of use is higher. In the current digital era, the availability of free applications such as GeoGebra is an inclusive solution for equitable access to quality education [45,46,47].
Another advantage of GeoGebra in data management is its ability to display the relationship between statistical theory and its application directly. When students study normal distributions, for example, GeoGebra can display a complete distribution curve with mean parameters and standard deviations that can be shifted using sliders. Changes in parameter values automatically change the shape of the curve, so students can understand how data variations affect distributions. This process helps students who often have trouble imagining abstract concepts of probability distributions. Not only that, GeoGebra also allows lecturers to show the relationship between theoretical distributions and empirical data collected by students. Thus, learning becomes more integrative because it connects theory and practice simultaneously. This kind of learning experience has proven to be more meaningful than conventional learning that only emphasizes memorizing formulas [57,58,59].
GeoGebra also provides opportunities for students to develop creativity in visualizing data. With the simple programming features available, students can create their own applets as per the assignment's needs. For example, they can create an applet to display a pie chart with food consumption survey data, or create an applet to display changes in the distribution of test scores in the classroom. Through this activity, students not only learn statistical concepts but also develop technological skills that are relevant to the needs of the 21st century. This activity is in line with the STEM (Science, Technology, Engineering, Mathematics) approach that encourages cross-disciplinary integration in learning. Mastery of technology skills like this is very important in facing the challenges of the Society 5.0 era where digital technology has become an integral part of daily life [34,35,36].
In several recent studies, it has been proven that the use of GeoGebra in statistical learning is able to significantly improve student understanding. The results of the study showed that students who used GeoGebra had better ability to connect theory with practice than students who studied with conventional methods. They also show improvements in analytical skills, data interpretation, and mathematical communication. An important factor influencing this success is the interactive nature of GeoGebra which encourages students to actively explore concepts. In addition, GeoGebra supports inquiry-based learning, where students are invited to discover concepts for themselves through visual experiments. This is different from the traditional lecture method which tends to be passive. Thus, the use of GeoGebra not only improves academic understanding but also forms the character of students who are more independent, critical, and creative [64,65].
GeoGebra has great potential as a data management tool in statistical learning in universities. Its advantages lie in its dynamic visualization, flexibility in parameter settings, the availability of interactive applets, as well as its ability to integrate theory and practice. GeoGebra not only assists students in understanding technical procedures, but also strengthens the conceptual understanding that is an important foundation in statistical science. In addition, GeoGebra is relevant to the needs of 21st century learning that emphasizes digital literacy, critical thinking, creativity, and collaboration. With the support of lecturers who are able to design interactive learning, GeoGebra can be an innovative solution to overcome students' difficulties in understanding abstract statistical material. Therefore, the use of GeoGebra in statistical learning should continue to be developed through further research, both in the form of experiments and classroom action research, so that the benefits are more widely felt by students in various universities in Indonesia [24,25,26,27,28].
In learning statistics in college, data management is one of the basic skills that students must master because this skill is the foundation for further statistical analysis. So far, most students only know Microsoft Excel as the main tool in managing data, even though other applications such as GeoGebra also have great potential to be used in learning [71]. GeoGebra allows users to present data in various forms of graphs, tables, and frequency distributions with more structured and interactive procedures. For example, when making a histogram, students usually have to go through manual steps, starting from calculating class length, determining the number of classes, to compiling a frequency distribution table. But with GeoGebra, the entire process can be done in one concise and practical work window. This advantage not only makes students more efficient in processing data, but also helps them visually understand the relationship between processes. Therefore, GeoGebra can be said to be an application that not only provides features, but also builds students' conceptual understanding of statistical procedures [43,44,62,63].
One of the main attractions of GeoGebra is its ability to present data dynamically, so any change in input will directly affect the appearance of a graph or table. This is in stark contrast to software like Excel which often demands a repetitive procedure when the user wants to change certain parameters. With GeoGebra, students can take advantage of the slider feature to modify class parameters or distributions, and then directly observe how those changes affect the shape of the graph. This exploratory process provides a more interactive and contextual learning experience, as students can directly test their visual hypotheses. For example, when the class width parameter is enlarged, then the histogram graph becomes simpler, while when the parameters are detailed, the graph becomes more complex. This activity fosters curiosity and encourages students to connect theory with practice. According to recent research, technology-based interactive learning experiences are able to improve students' critical thinking skills in understanding statistical concepts [50,51,52].
In addition, GeoGebra can also minimize procedural errors that students often make in managing statistical data. Errors in calculating class lengths, incorrectly defining many classes, or incorrectly arranging frequency distributions are often obstacles in manual learning. Through GeoGebra, these kinds of errors can be reduced because the application system already provides an automated algorithm that ensures that the results of data processing are in accordance with basic statistical principles. However, students can still make manual modifications so that they do not lose the opportunity to understand the calculation logic underlying the results displayed. This dual advantage makes GeoGebra a learning medium that is balanced between theoretical concepts and hands-on practice. Research shows that the integration of flexible technologies such as GeoGebra is able to increase students' motivation and technical skills in data processing [70,71].
The use of GeoGebra is also relevant to the needs of 21st century learning which emphasizes data literacy as one of the main competencies. In today's era of big data, students' ability to process and analyze data is not only an academic demand, but also an important requirement to enter the world of work. Therefore, getting students used to using applications like GeoGebra in statistical data management is a strategic step. With GeoGebra, students not only learn how to calculate or present data, but are also trained to interpret the results of the analysis visually. This makes them better prepared to face job challenges that require analytical and critical thinking skills. According to recent educational research, the use of interactive software in teaching statistics has been proven to be effective in improving students' data literacy [38,39,40,57,58,59].
In addition to technical advantages, GeoGebra also has pedagogical advantages because it can be used to design project-based learning or problem-based learning. For example, lecturers can assign assignments to students to collect real data, such as height, weight, or simple economic data, then process it with GeoGebra [41,42,43]. Through this activity, students not only understand the theory of frequency distribution or histograms, but also see its application in real terms. Thus, learning becomes more meaningful and contextual. This kind of app also allows students to collaborate in small groups, compare data processing results, and discuss differences in interpretation. According to recent research findings, the use of GeoGebra in project-based learning can increase students' active engagement while developing their statistical communication skills [1,2,31,32].
Another advantage of GeoGebra is that it is open-source and can be accessed for free, so it does not burden students and educational institutions in terms of costs. This is very important, especially in universities that have limited technological facilities. With this free access, students can install the GeoGebra application on their personal devices, both computers and smartphones, and use it to study independently outside the classroom. This habit fosters independent learning and expands students' opportunities to experiment with different forms of data. Some recent research shows that the availability of free applications that support independent learning, such as GeoGebra, has a positive impact on students' learning independence and academic success [52,75,76].
In the context of data presentation, GeoGebra also offers advantages in terms of integration of various forms of data representation. The same data can be displayed in the form of tables, bar graphs, histograms, or frequency polygons at the same time. This integration allows students to see the connections between representations so that their understanding becomes more comprehensive. For example, students can observe how the frequency distribution in a table changes when transformed into a histogram graph, and how the graph differs when displayed as a frequency polygon. This process reinforces conceptual understanding and minimizes misconceptions that often occur in manual learning. Recent empirical studies confirm that learning that emphasizes visual multi-representation is able to improve students' conceptual understanding in the field of statistics [6,7,8].
In addition, the use of GeoGebra in data management also introduces students to more in-depth statistical exploration skills. Not only presenting data, students can also conduct descriptive analysis, such as calculating means, medians, modes, and standard deviations directly from the data they input. In this way, students not only look at the numbers, but also understand how the size of the concentration and distribution of data affects the shape of the distribution. This feature is very useful for improving understanding of the relationship between raw data and statistical analysis results. Recent research confirms that students' ability to connect descriptive data with graph visualization has increased significantly with the help of GeoGebra [8,9,10].
Although it has many advantages, the application of GeoGebra in statistical data management also has some challenges. One of them is the readiness of lecturers and students to master the features of GeoGebra which are quite diverse. Without adequate guidance, students may only use GeoGebra on a limited basis and not explore its potential to the fullest. Therefore, the role of lecturers as facilitators is very important. Lecturers need to design systematic learning by utilizing GeoGebra features in stages, ranging from simple to complex. In addition, intensive training is also needed so that lecturers have sufficient technological competence to guide students. According to a recent study, the success of technology integration in learning is greatly influenced by the readiness and competence of lecturers [11,12,13].
Overall, the use of GeoGebra in statistical data management provides many advantages both from a technical, pedagogical, and practical perspective. GeoGebra not only facilitates students to process data quickly and accurately, but also helps them understand statistical concepts in depth through interactive visualizations. This advantage makes GeoGebra an important alternative to other software in statistical learning, especially in universities that want to develop their students' data literacy. With the right learning strategy, GeoGebra can serve as an effective tool to improve students' data analysis skills, critical thinking, and statistical communication skills. Therefore, the integration of GeoGebra in statistical learning is very relevant to support the achievement of 21st century competencies that emphasize technology literacy and data literacy [14,15,16].
Figure 1.
Frequency Distribution and Histogram Display.
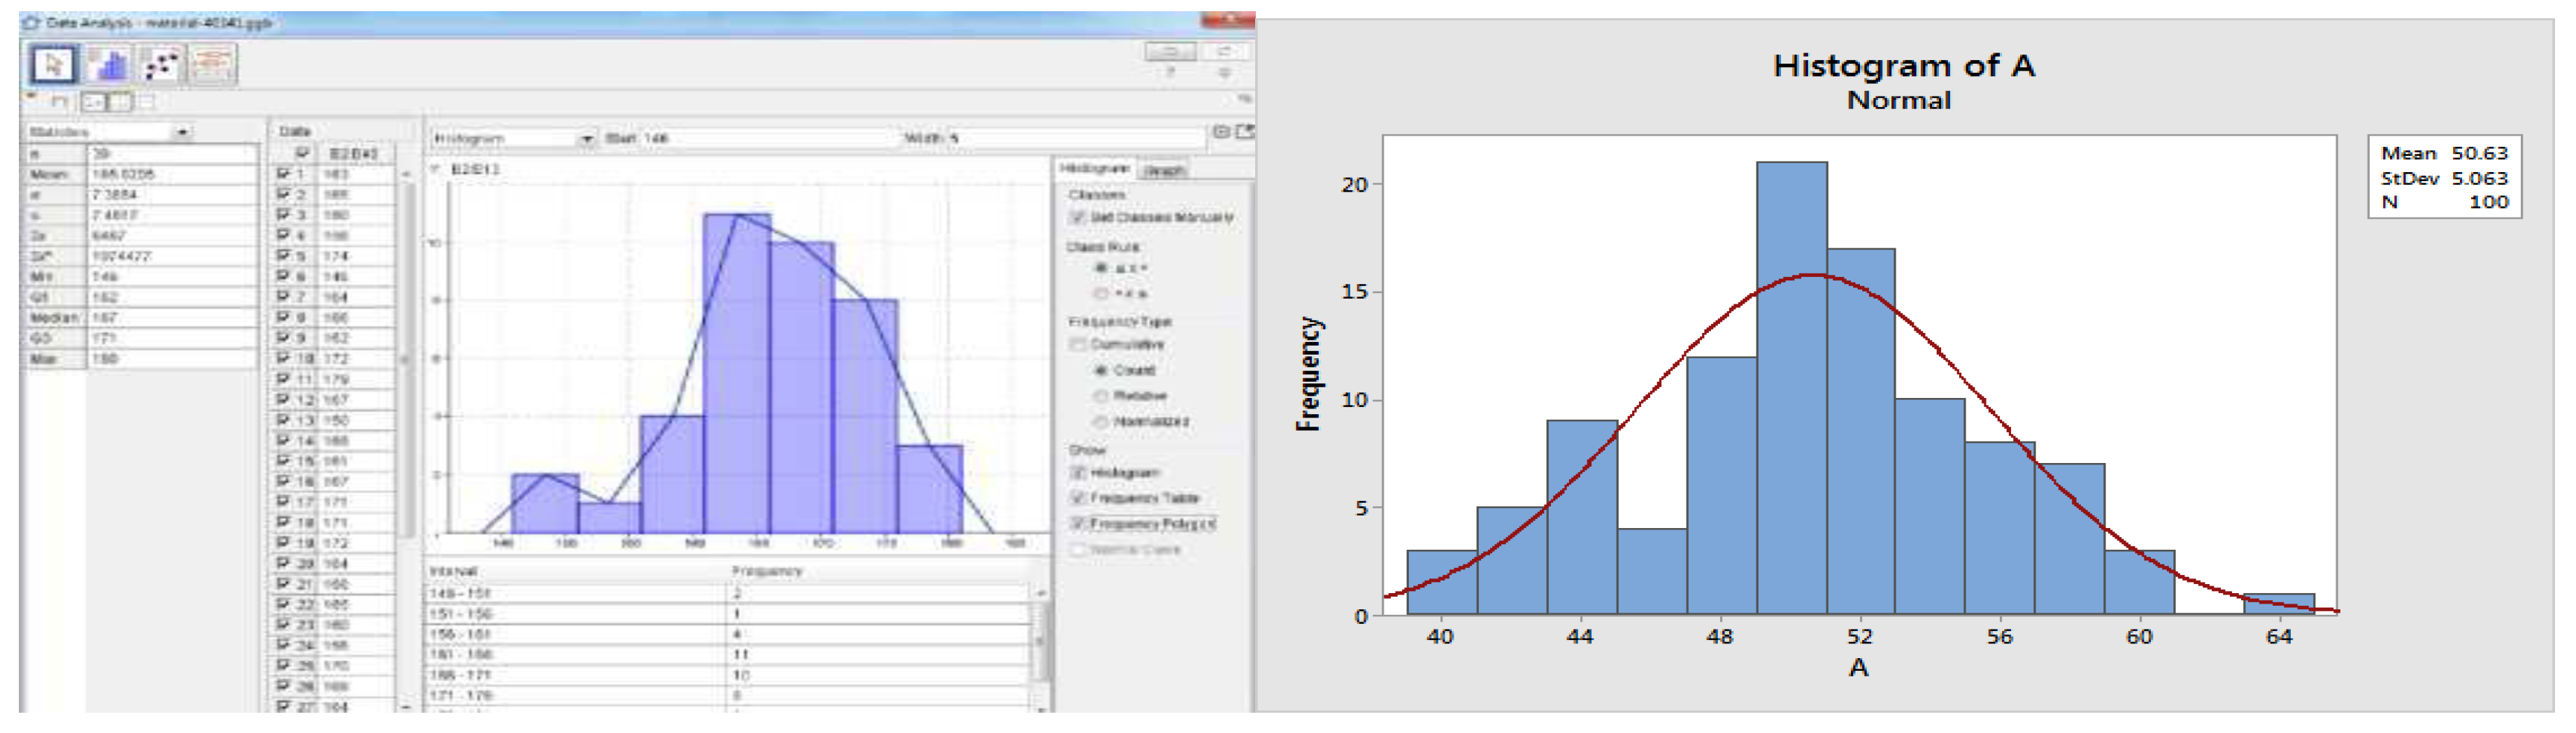
UIN Syahada Padangsidimpuan students are often more skilled in utilizing various computer applications to display attractive graphs, but the understanding of the basic concept of statistics behind these graphs is sometimes still lacking. GeoGebra can be a solution because it not only provides a facility to display data in the form of frequency distributions and histograms, but also helps students understand the underlying statistical concepts interactively. By taking advantage of the existing dynamic features, students can see firsthand how changes in data affect the form of distribution and histograms produced. This is especially important because learning statistics emphasizes not only the technical skills of creating graphs, but also the conceptual understanding of the meaning of those graphs. After gaining a fundamental understanding through GeoGebra, students can continue their technical skills by using other applications such as Microsoft Excel or Microsoft Word to produce more attractive graphs according to academic and practical needs. Thus, GeoGebra acts as a bridge between understanding concepts and students' technical skills in processing and presenting statistical data [1,2,3].
3.2.2. GeoGebra as a Tool to Calculate Opportunities
In the Probability Calculator menu in GeoGebra there are two main panel windows, namely Distribution and Statistics. In the Distribution panel, users can access a variety of opportunity distribution models commonly used in statistics, both discrete and continuous distributions, which are displayed in the form of dynamic and interactive graphs. Some of the available opportunity distributions include normal, binomial, t-Student, chi-square, F-distribution, and Poisson distributions. Through this feature, students can visualize the form of opportunity distribution while understanding how parameter changes affect the distribution curve. Meanwhile, the Statistics panel is used to perform statistical analysis, including hypothesis tests based on known parameters. Thus, GeoGebra provides complete facilities not only to visually understand the concept of opportunities, but also to conduct practical inferential statistical analysis [28,29,30]
GeoGebra provides the Probability Calculator feature which is one of the advantages of this application in learning statistics, especially in probability material. This feature is equipped with two main panels, namely Distribution and Statistics, which allow students to explore the concept of opportunity distribution, both discrete and continuous. The Distribution Panel allows users to choose various distribution models, such as normal, binomial, chi-square, F-distribution, t-student, to Poisson distribution, all of which are displayed in the form of interactive graphs. This visualization makes it easier for students to understand the relationship between the distribution parameters and the resulting curve shape [8,9,10]. For example, in a normal distribution, changes in mean values and standard deviations can be directly visualized in the form of shifts or changes in the shape of curves. This feature is important because in classroom learning practice, students often have difficulty understanding the abstract concept of opportunity distribution without the help of visualization. By utilizing GeoGebra, they not only see numbers, but also understand the concept of opportunity in real life. Therefore, GeoGebra is a means of connecting probability theory and dynamic visualization practices in statistical learning in higher education [15,16,17,18,19,20].
The Statistics Panel on GeoGebra further functions to perform hypothesis tests using known parameters from the data. This panel provides a facility for students to not only look at the shape of the distribution of opportunities, but also conduct simple inferential analysis directly. For example, students can do z-tests, t-tests, and chi-square tests by entering the values of certain parameters and then viewing the results of the calculation along with visualizations of the distribution graph. This makes it easier for students to connect the theoretical concepts they learn with the actual data analysis procedures. With the visualization of the distribution graph, students can also directly see the location of the test statistical value compared to the specified critical area. GeoGebra makes the hypothesis testing process more transparent and intuitive because students can understand the meaning of p-value, acceptance area, and hypothesis rejection area. The process that is usually considered complicated becomes simpler because it is assisted by the visual interaction offered by GeoGebra. Thus, the Statistics panel can be an effective alternative to explain inferential concepts that are often difficult to understand only through manual calculations [50,51,52].
In addition to helping you understand basic concepts, the Probability Calculator in GeoGebra is also useful in the context of student research. UIN Syahada Padangsidimpuan students, for example, can use GeoGebra to process thesis research data that requires opportunity analysis or probability distribution. With the binomial distribution feature, students can calculate the probability of success from a series of experiments, while with Poisson distribution they can analyze data on rare events such as the number of customer complaints or patient arrivals to the hospital. This visualization allows students not only to obtain probability values, but also to interpret the meaning of the results in the context of their research. This ability is very relevant in equipping students to face increasingly complex empirical research challenges in the digital era. This is in line with the development of digital statistical literacy which emphasizes the ability to integrate theory, data, and technology in research practice [38,39,40].
In opportunity learning, one of the main difficulties students have is understanding how distribution parameters affect the probability of an event. For example, in a normal distribution, a change in the standard deviation not only changes the distribution of the data, but also affects the probability of the data falling within a certain range. GeoGebra makes this understanding easier by providing sliders that allow students to change parameters directly. As parameters change, the distribution curve adjusts automatically so that students can visually observe the change. In this way, abstract concepts become more concrete and easy to understand. Students can conduct virtual experiments by changing the average, standard deviation, or other parameters to see their impact on the distribution of opportunities. This kind of interactivity not only improves conceptual understanding, but also strengthens students' analytical skills in reading opportunity distribution graphs [31,32,33].
GeoGebra also supports collaborative learning because the Probability Calculator feature can be used as a discussion material in the classroom. The lecturer can display a certain distribution in front of the class, then ask the student to predict the change in the curve when the parameters are modified. After that, the parameters are changed using the slider so that students can see the results immediately. This process encourages active interaction between lecturers and students as well as between students themselves [34,35,36]. This kind of discussion improves understanding because students learn not only from the lecturer's explanations, but also from their own exploration and arguments. Thus, GeoGebra not only serves as a visualization tool, but also as a learning medium that encourages active participation. This is very much in line with the modern learning paradigm that emphasizes student involvement in building knowledge collaboratively [6,7,8].
From the perspective of educational technology, the use of GeoGebra on the topic of opportunities is also relevant to the development of students' digital literacy. In the era of Society 5.0, students are required to not only understand theory, but also be able to utilize technology to process data and make information-based decisions. By using GeoGebra, students can develop digital skills while improving their understanding of statistics. This adds value in preparing students to face the world of work that demands technology-based data analysis skills. GeoGebra helps students not only become passive users of the app, but also active learners who can leverage technology to solve problems. Thus, the use of the Probability Calculator at GeoGebra not only improves statistical learning outcomes, but also strengthens students' digital competence [34,35,36].
The use of GeoGebra in opportunity learning also shows its advantages over other software such as SPSS or SAS. Although professional statistical software has more complete features, GeoGebra offers advantages in terms of interactivity and ease of use. Students who are new to statistics often find it difficult to have a complex interface on professional software, while GeoGebra provides a simpler and more user-friendly interface. With GeoGebra, students can understand concepts first before moving on to more complex professional software. This makes GeoGebra a very effective transition tool in learning statistics, especially for first-year college students. In other words, GeoGebra can be positioned as a bridge between understanding basic concepts and the use of advanced statistical software [37,38,39].
In terms of learning effectiveness, recent research shows that students who use GeoGebra in opportunity learning have a better level of understanding than students who only use conventional methods. This is due to a combination of numerical calculations, graph visualization, and direct interaction with distribution parameters. GeoGebra-based learning also increases students' motivation to learn because they feel more challenged and actively involved. This effectiveness makes GeoGebra not only an additional tool, but an integral part of innovative learning strategies. With the right integration, GeoGebra can be one of the best approaches to improve the quality of statistical learning in higher education, especially at UIN Syahada Padangsidimpuan [24,25,26,27,28].
In addition to the classroom, GeoGebra can also be used independently by students to deepen their understanding of opportunities. This application is available for free and can be accessed through computers and mobile devices so that students can learn anytime and anywhere. This supports independent learning which is increasingly important in the digital era. By using GeoGebra outside of the classroom, students can explore different distributions of opportunities according to their respective learning paces. This learning independence not only increases academic understanding, but also forms lifelong learning skills that are very important for students in the global era [52,75,76].
With a wide range of features offered, GeoGebra has proven itself to be one of the most effective applications for learning opportunities in college. The app not only helps students understand the concept of opportunity visually and interactively, but also facilitates data analysis and simple hypothesis testing. Its advantages of being accessible, user-friendly, and supporting collaborative learning make GeoGebra a tool relevant to the learning needs of modern statistics. Therefore, the integration of GeoGebra in opportunity learning in higher education, especially at UIN Syahada Padangsidimpuan, needs to be continuously improved so that students are not only proficient in calculating opportunities, but also able to understand the meaning of concepts in depth. With the support of research and pedagogical innovation, GeoGebra can become one of the main pillars in the transformation of statistical learning in the digital era [70,71].
GeoGebra provides a Probability Calculator feature that is very useful for students in understanding the concept of odds visually. In this menu there are two main panel windows, namely distribution and statistics. The distribution panel allows users to explore a wide range of opportunity distributions, both discrete and continuous, with interactive graphical representations [1,2]. The available opportunity distributions include normal, binomial, Poisson, chi-square, t-student, F-distribution, and others. Meanwhile, the statistics panel can be used to test hypotheses based on known data or parameters. With a dynamic graph display, students can easily see how changes in parameters affect the form of distribution and the resulting opportunities [53,54,55].
Through GeoGebra, the concept of opportunity distribution that was previously only understood in the abstract in the form of formulas, can now be visualized more concretely. For example, when studying binomial distributions, students can change the parameters of the number of attempts (n) and the probability of success (p), and then immediately see the change in the shape of the distribution bar graph. This process makes students more quickly understand the relationship between theory and its application. In addition, this feature also supports exploration-based learning, where students not only receive information passively, but can also conduct independent experiments to find existing patterns [62,63,64].
The statistical panel on GeoGebra also helps students in understanding the concept of hypothesis testing. When they enter data or values of certain parameters, GeoGebra automatically displays the results of the hypothesis test in the form of a graph as well as a probability value (p-value). Thus, students not only learn to calculate hypothesis tests using formulas, but also can interpret the results visually. This is very important to reduce conceptual errors that often arise when students only rely on manual calculations [13].
In addition, the use of GeoGebra in calculating opportunities can also increase students' interest in learning. Many students find it difficult to understand the distribution of opportunities because they are considered too abstract and full of mathematical symbols. With interactive visualization, they can connect formulas with graphs, making the learning process more interesting and meaningful. In fact, students can use this feature to analyze their own research data, for example when calculating the normal distribution of the height of UIN Syahada Padangsidimpuan students. This makes learning more contextual and applicative [40,41,42].
Furthermore, the use of GeoGebra is not only limited to classroom learning, but can also be used as a tool in student research. In the context of quantitative research, students often have to determine the distribution of opportunities from the data they collect. With GeoGebra, they can easily determine the appropriate distribution as well as display a graph of that distribution in their research report. This advantage shows that GeoGebra is not only a learning medium, but also a useful analytical tool to support academic research [43,44,45].
With its various features, GeoGebra can help UIN Syahada Padangsidimpuan students in building a stronger conceptual understanding of opportunities. The Probability Calculator feature gives them a more comprehensive learning experience, where theory, calculations, and visualizations can go hand in hand. This is in line with the demands of modern learning that emphasize the importance of data literacy and statistical literacy, especially in the digital era. Therefore, the use of GeoGebra in the topic of opportunity can be considered an important innovation in statistical learning in higher education [46,47,48].
Figure 2.
Distribution Panel on GeoGebra.
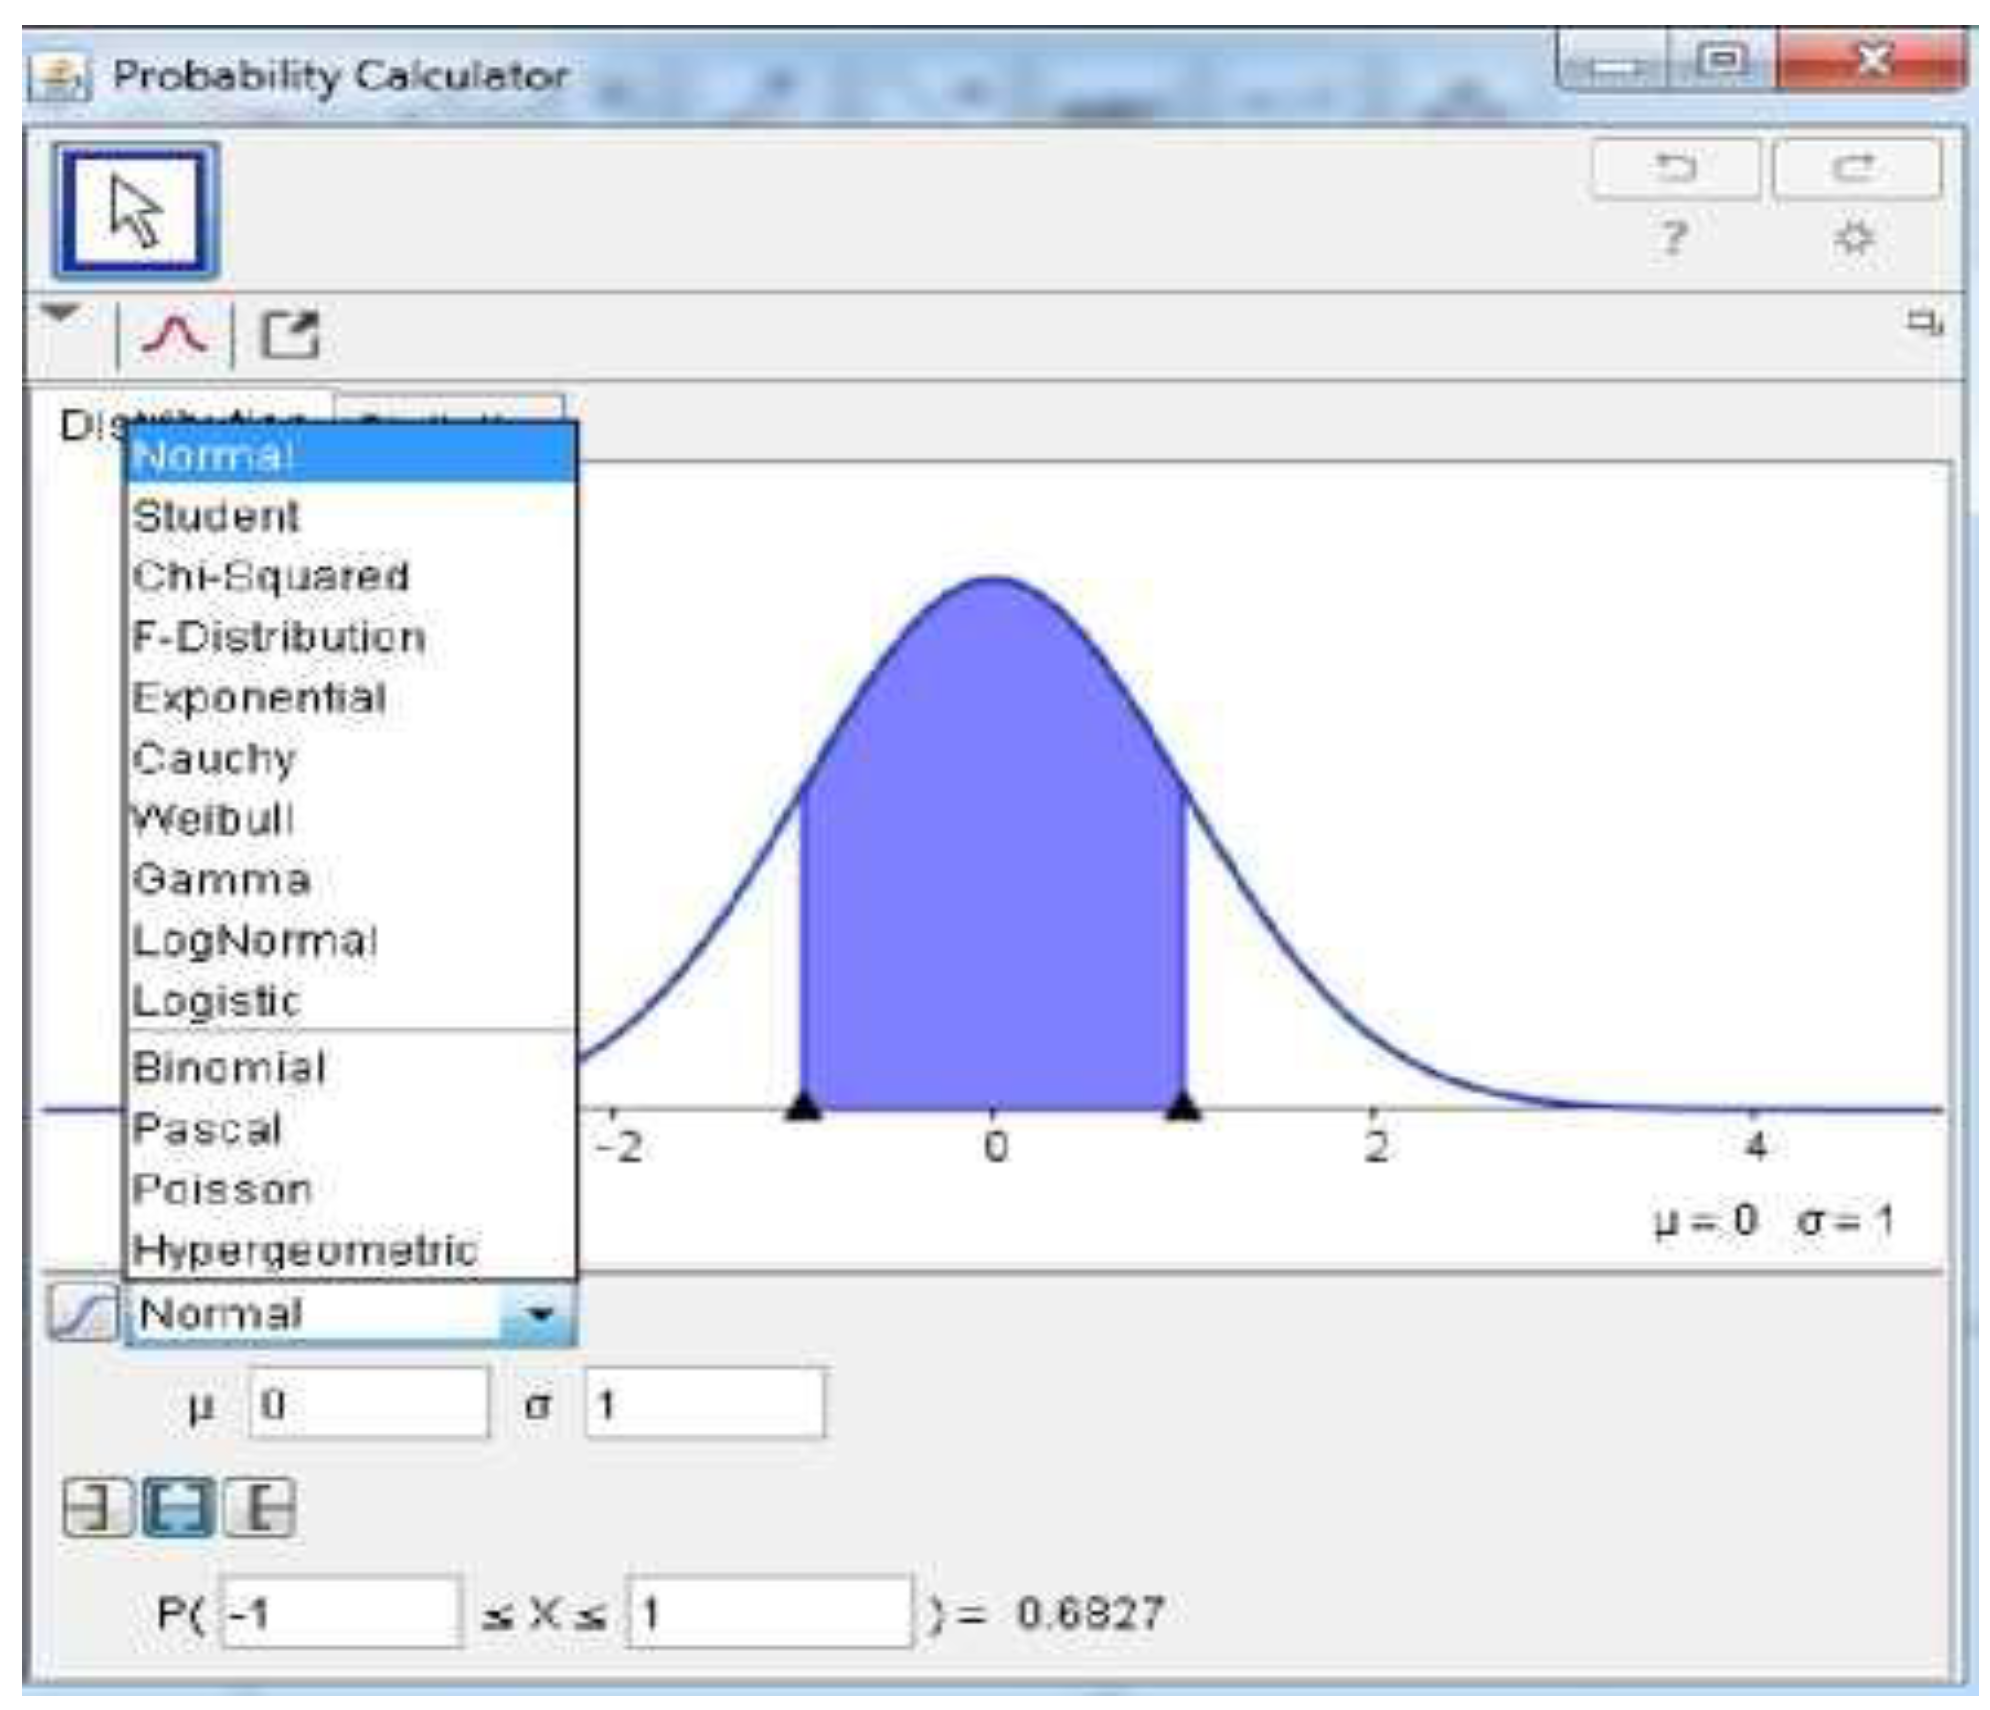
The most important and widely used continuous opportunity distribution in the entire field of statistics is the normal distribution [15,16,17,18,19,20]. GeoGebra facilitates users in solving the problem of calculating chances from a normally distributed data through the Probability Calculator feature. This feature allows students and lecturers to calculate opportunities, visualize distributions, and understand the relationship between distribution parameters and the resulting curve shape [49,50,51].
Example 1.
A machine produces an electrical resistance tool with an average of 40 ohms and a standard deviation of 2 ohms. Suppose that the prisoner is normally distributed and can be measured to the desired level of precision. The question is: what percentage of devices have a resistance of more than 43 ohms? [50,51,52].
Traditional solutions are usually done by transforming the value x=43 into the zzz value. This process involves using a standard normal distribution table (z-table) to derive probabilities. The manual calculation is carried out as follows: [52,53,54]
Thus, the odds can be calculated:
Thus, it was obtained that about 6.68% of the tools produced would have a resistance of more than 43 ohms.
The advantage of GeoGebra is that this entire process can be done faster through the Probability Calculator feature. Students only need to enter the average value, standard deviation, and the limit x = 43, then GeoGebra automatically displays the results of the probability calculation along with a visualization of the normal distribution curve area. This makes it easier for students to understand the abstract concept of normal distribution because they can see the representation of graphs as well as the results of calculations interactively.
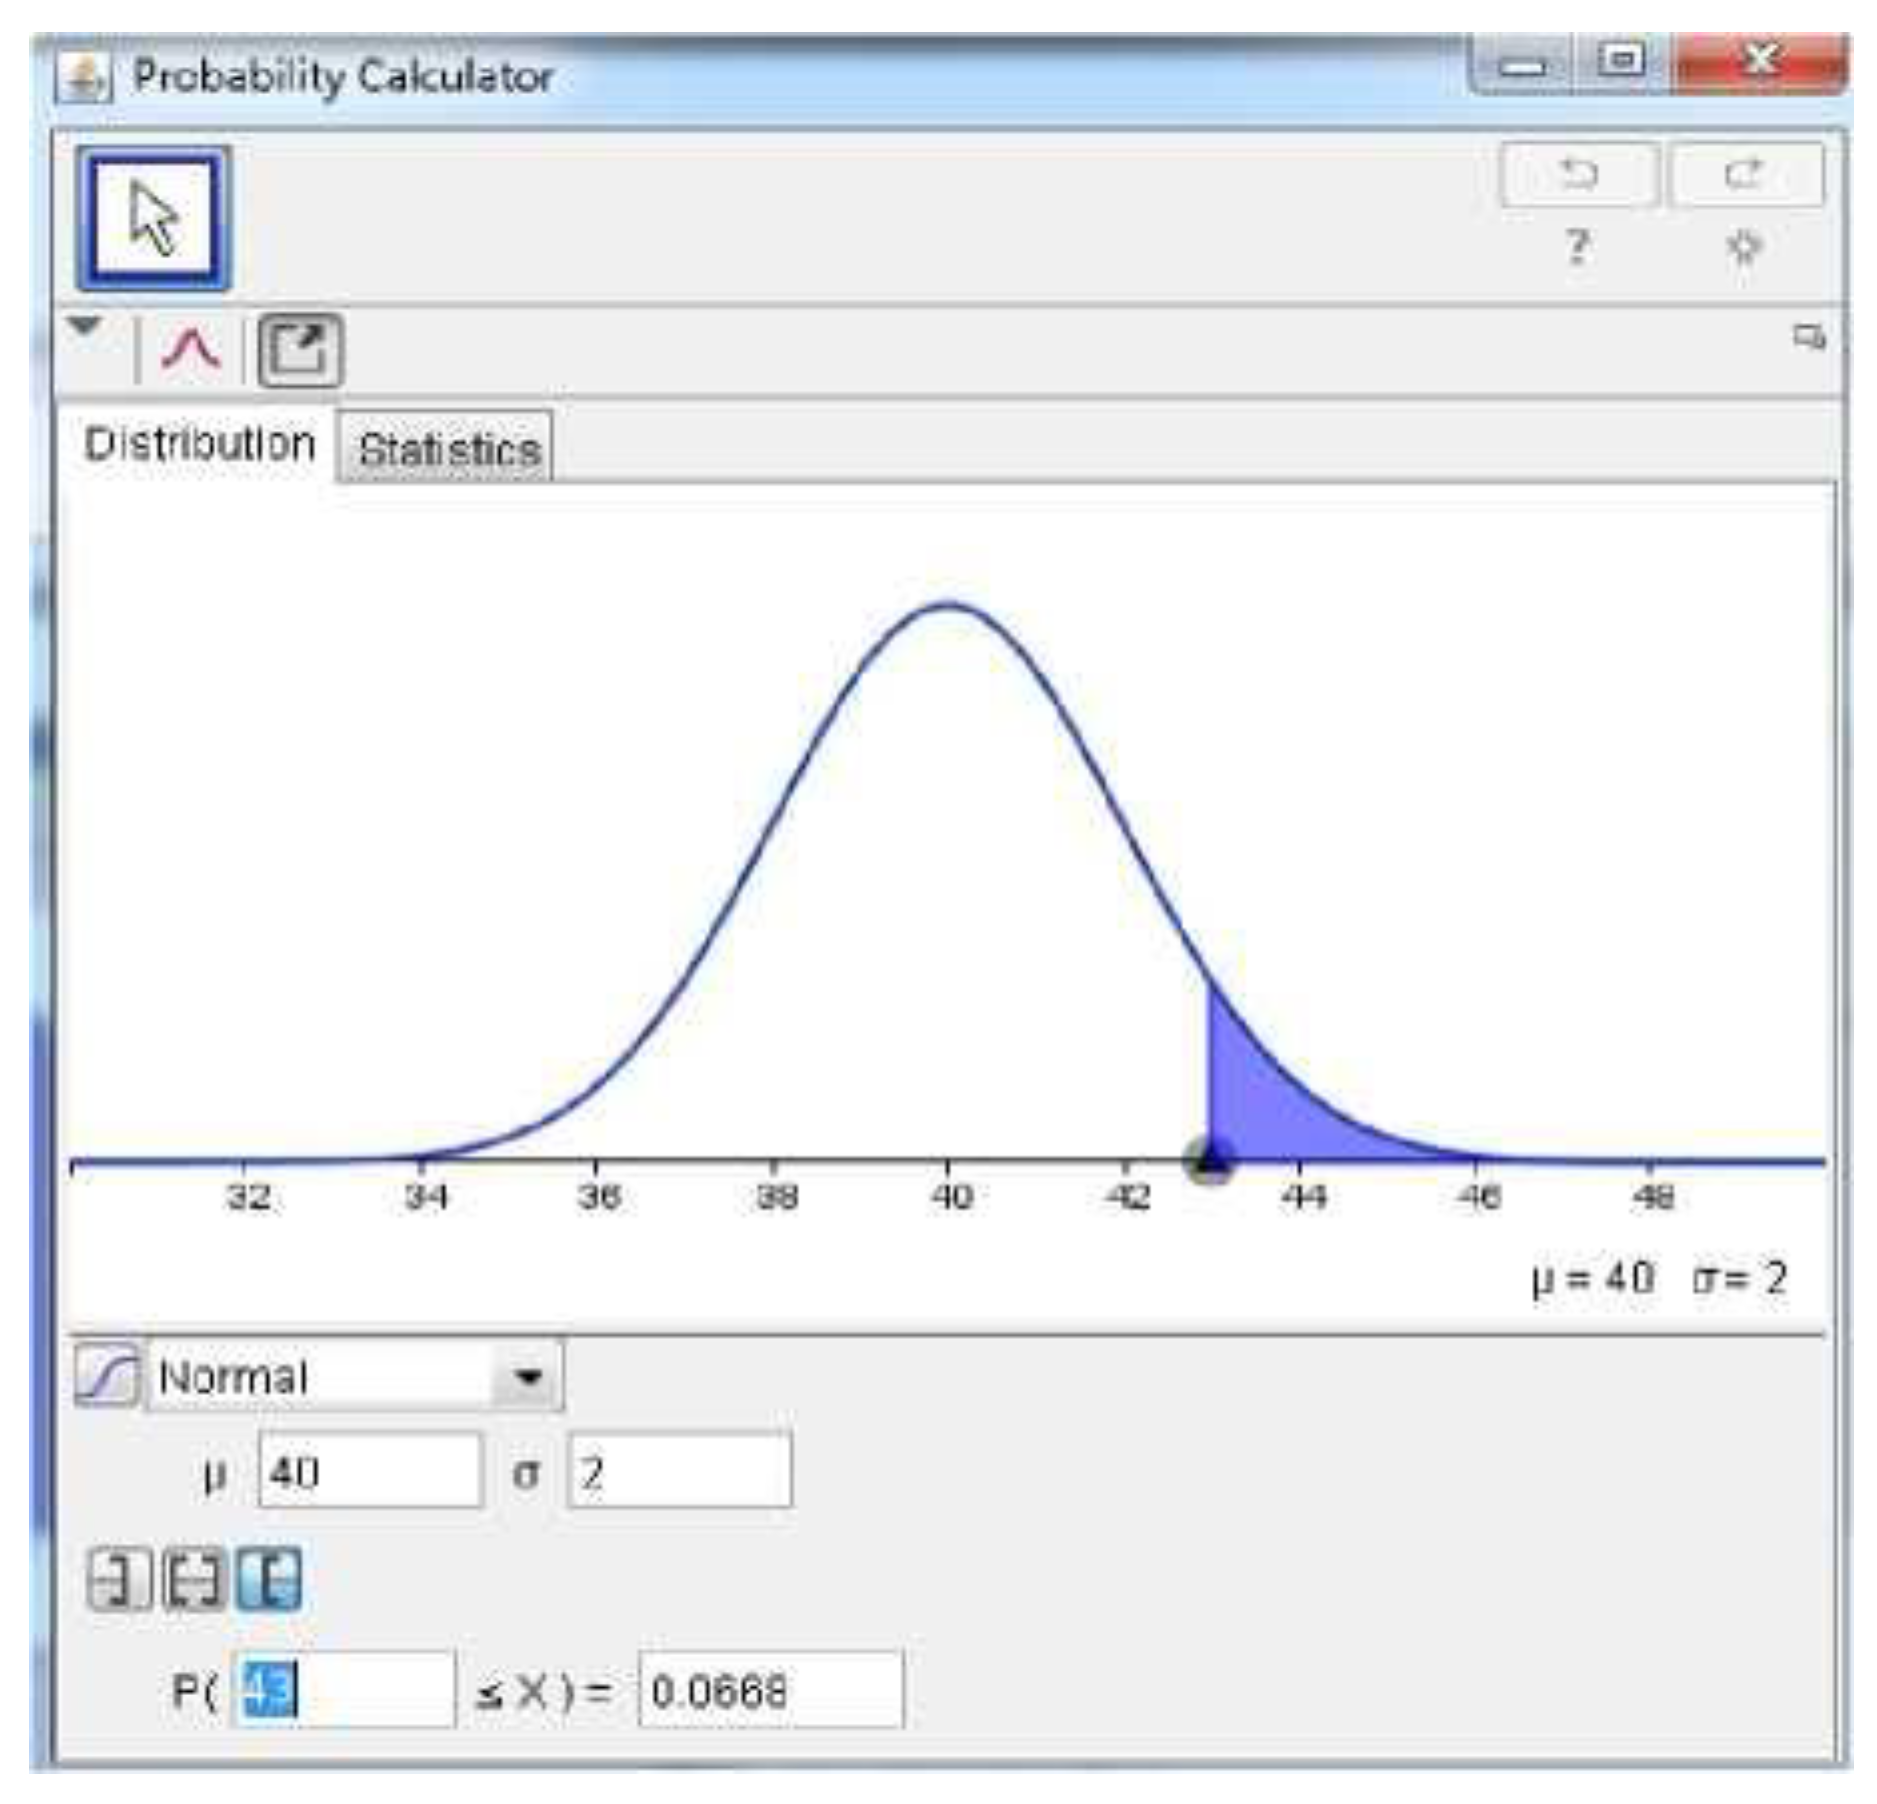
The automatic movement of opportunity values when a cut-off point is made is a dynamic nature of the chart view in this application. In addition to being useful as a tool to calculate the probability value of events from normal distributed data, this application also provides an opportunity for students to understand the concept of opportunity value while observing the movement of area under normal curves [41,42,43]
The following is an example of using GeoGebra to solve the problem of discrete opportunity distribution:
Example 2.
A machine machine part can withstand a certain shock test with a 75% chance. Calculate the chance that exactly 2 out of 4 parts tested will not be damaged.
The random variable X in the above problem follows a binomial distribution with the parameters nnn and ppp, which are usually written: [41]
The probability formula for an event k is:
Thus, the chance that exactly 2 out of 4 parts are not damaged is 0.21094 or about 21.1%.
This calculation can be solved using a binomial distribution table. However, with GeoGebra, the calculation results can be obtained faster and visually displayed in the form of a random variable distribution graph, as shown in Figure 4 below.
In further study of binomial distributions, GeoGebra provides the ability to control the values of n and p using the slider feature and visualize the binomial distribution. Thus, students can observe the changes that occur and show that normal distributions can be used as approximations for binomial distributions. [53,54]
This is because the normal distribution is a good approximation for a discrete distribution if the shape of the distribution resembles a symmetrical bell curve. A theorem states that a normal distribution with the parameter: [55,56]
will give a very good approximation of the binomial distribution if the nnn is very large. In fact, if n is relatively small but p is close enough to 0.5, the normal approximation is still quite feasible.
In other words, the binomial distribution:
will be close to the normal distribution:
if n is large enough.
In Figure 5, it can be seen that the normal distribution is used as an approximation for the binomial distribution with the parameter . As an exercise in the topic of probability calculation, students may be asked to calculate the probability value of the binomial distribution (the red area in Figure 5) and compare it with the near-normal value according to the above theorem.
By controlling the values of n and p through the slider facility in GeoGebra as seen in the applet above, students can explore changes in the value of binomial opportunities as well as their approximation with normal distributions. This process provides an opportunity for students to discover for themselves near-normal concepts in binomial distributions interactively. Thus, this exploration activity is an effective discovery technique in understanding the topic of opportunity distribution [60].
3.2.3. GeoGebra as an Inferential Statistical Tool
The need for statistical science in data processing, especially in the final project, is often an obstacle for students who have limited understanding of basic theory. Although there are many specialized computer applications available that can help solve statistical problems, understanding basic concepts is still very important as a provision for research decision-making. [57,58,59]
GeoGebra can be used to solve inferential statistical problems dynamically. In addition, this application also functions as a construction aid in learning. One of the important topics in inferential statistics is the test of research hypotheses.
The general procedure in testing a statistical hypothesis if the hypothesis is shaped is as follows: [60,61]
- Write a null hypothesis
- Choosing the appropriate H1 counterhypothesis.
- Determine the level of significance α.
- Select the appropriate statistical test and assign critical regions (or use the -p-value approach).
- Calculating statistical test values from sample data.
- Draw conclusions: reject H0 if the statistical test falls on a critical region (or if the p-value is ≤α); instead accept H0 if the condition is not met [6].
Figure 6 below shows the statistics panel on GeoGebra which provides various hypothesis test facilities, such as one mean test, two mean test, proportion difference test, and non-parametric test such as chi-square. Users only need to select the desired type of hypothesis test, enter the available parameters, and interpret the conclusion results based on the ppp-value. The ppp-value itself indicates the smallest level of significance where the observed statistical test value can still be considered significant.
Example 3.
Tested and it turned out that the average endurance was 7.8 kg. Test the hypothesis that [65]
The appropriate hypothesis test for the above problem is the Z-test of a mean because the population parameters (standard deviation) are considered known. The testing steps are as follows: [62,63,64]
- Formulating a hypothesis
- 2.
- Determining the level of significance
- 3.
- 4.
- Determining critical areasBecause of the two-sided test, the critical areas are:
- 5.
- Calculating the value of Z, for example, with the available data, the value of Z=−3.10 is obtained.
- 6.
- Drawing conclusionBecause of ∣Z∣>2.58, H0 is rejected. This means that there is significant evidence at the level of α=0.01 that the average endurance is not equal to 8 kg.
Example 4.
A company makes a new synthetic yarn and according to its makers the average yarn can withstand a load of 8 kg with a standard deviation of 0.5 kg. If 50 random samples of yarn are taken, then tested and it turns out that the average durability is 7.8 kg, test the hypothesis that μ=8 versus μ≠8 with a significance level of α=0.01.
Solution:
The appropriate hypothesis test for the above problem is the Z-test of a mean because the standard deviation of the population is known and the sample size is relatively large (n>30).
1. Hypothesis:
∙ H0:μ=8
∙ H1:μ≠8
2. Significance level: α=0.01
3. Test statistics:
With data: Xˉ=7.8, μ0=8, σ=0.5 and n=50.
4. Critical area:
5. Since the bidirectional test is at α=0.01, the critical limit is ±Z0.005=±2.58.
6. Results:
7. Z=−2.83 fell outside the reception area (−2.83<−2.58).
8. Conclusion:
9. The zero H0 hypothesis is rejected. This means that there is strong enough evidence at a significance level of 1% that the average durability of synthetic yarn is not equal to 8 kg.
GeoGebra through the Statistics panel on the Probability Calculator can be used directly to solve this case. Users only need to enter the average value of the sample, standard deviation, sample size, and hypothesis being tested. Results in the form of Z-values, p-values, and normal distribution graphs with critical regions will be displayed visually. Thus, students not only obtain the results of numerical calculations, but also understand the meaning of hypothesis testing conceptually. [72,73]
Through the statistics panel on the probability calculator menu in GeoGebra, users can directly enter the average value of the sample, standard deviation, sample size, and zero hypothesis. GeoGebra automatically displays the statistical test value of Z along with its ppp value. Thus, students can interpret the results of hypothesis testing in a more visual and interactive way, without having to do manual calculations which are often an obstacle (GeoGebra. (n.d.). [8,9,10,11]
Figure 7.
Statistical Hypothesis Test Calculation Results.
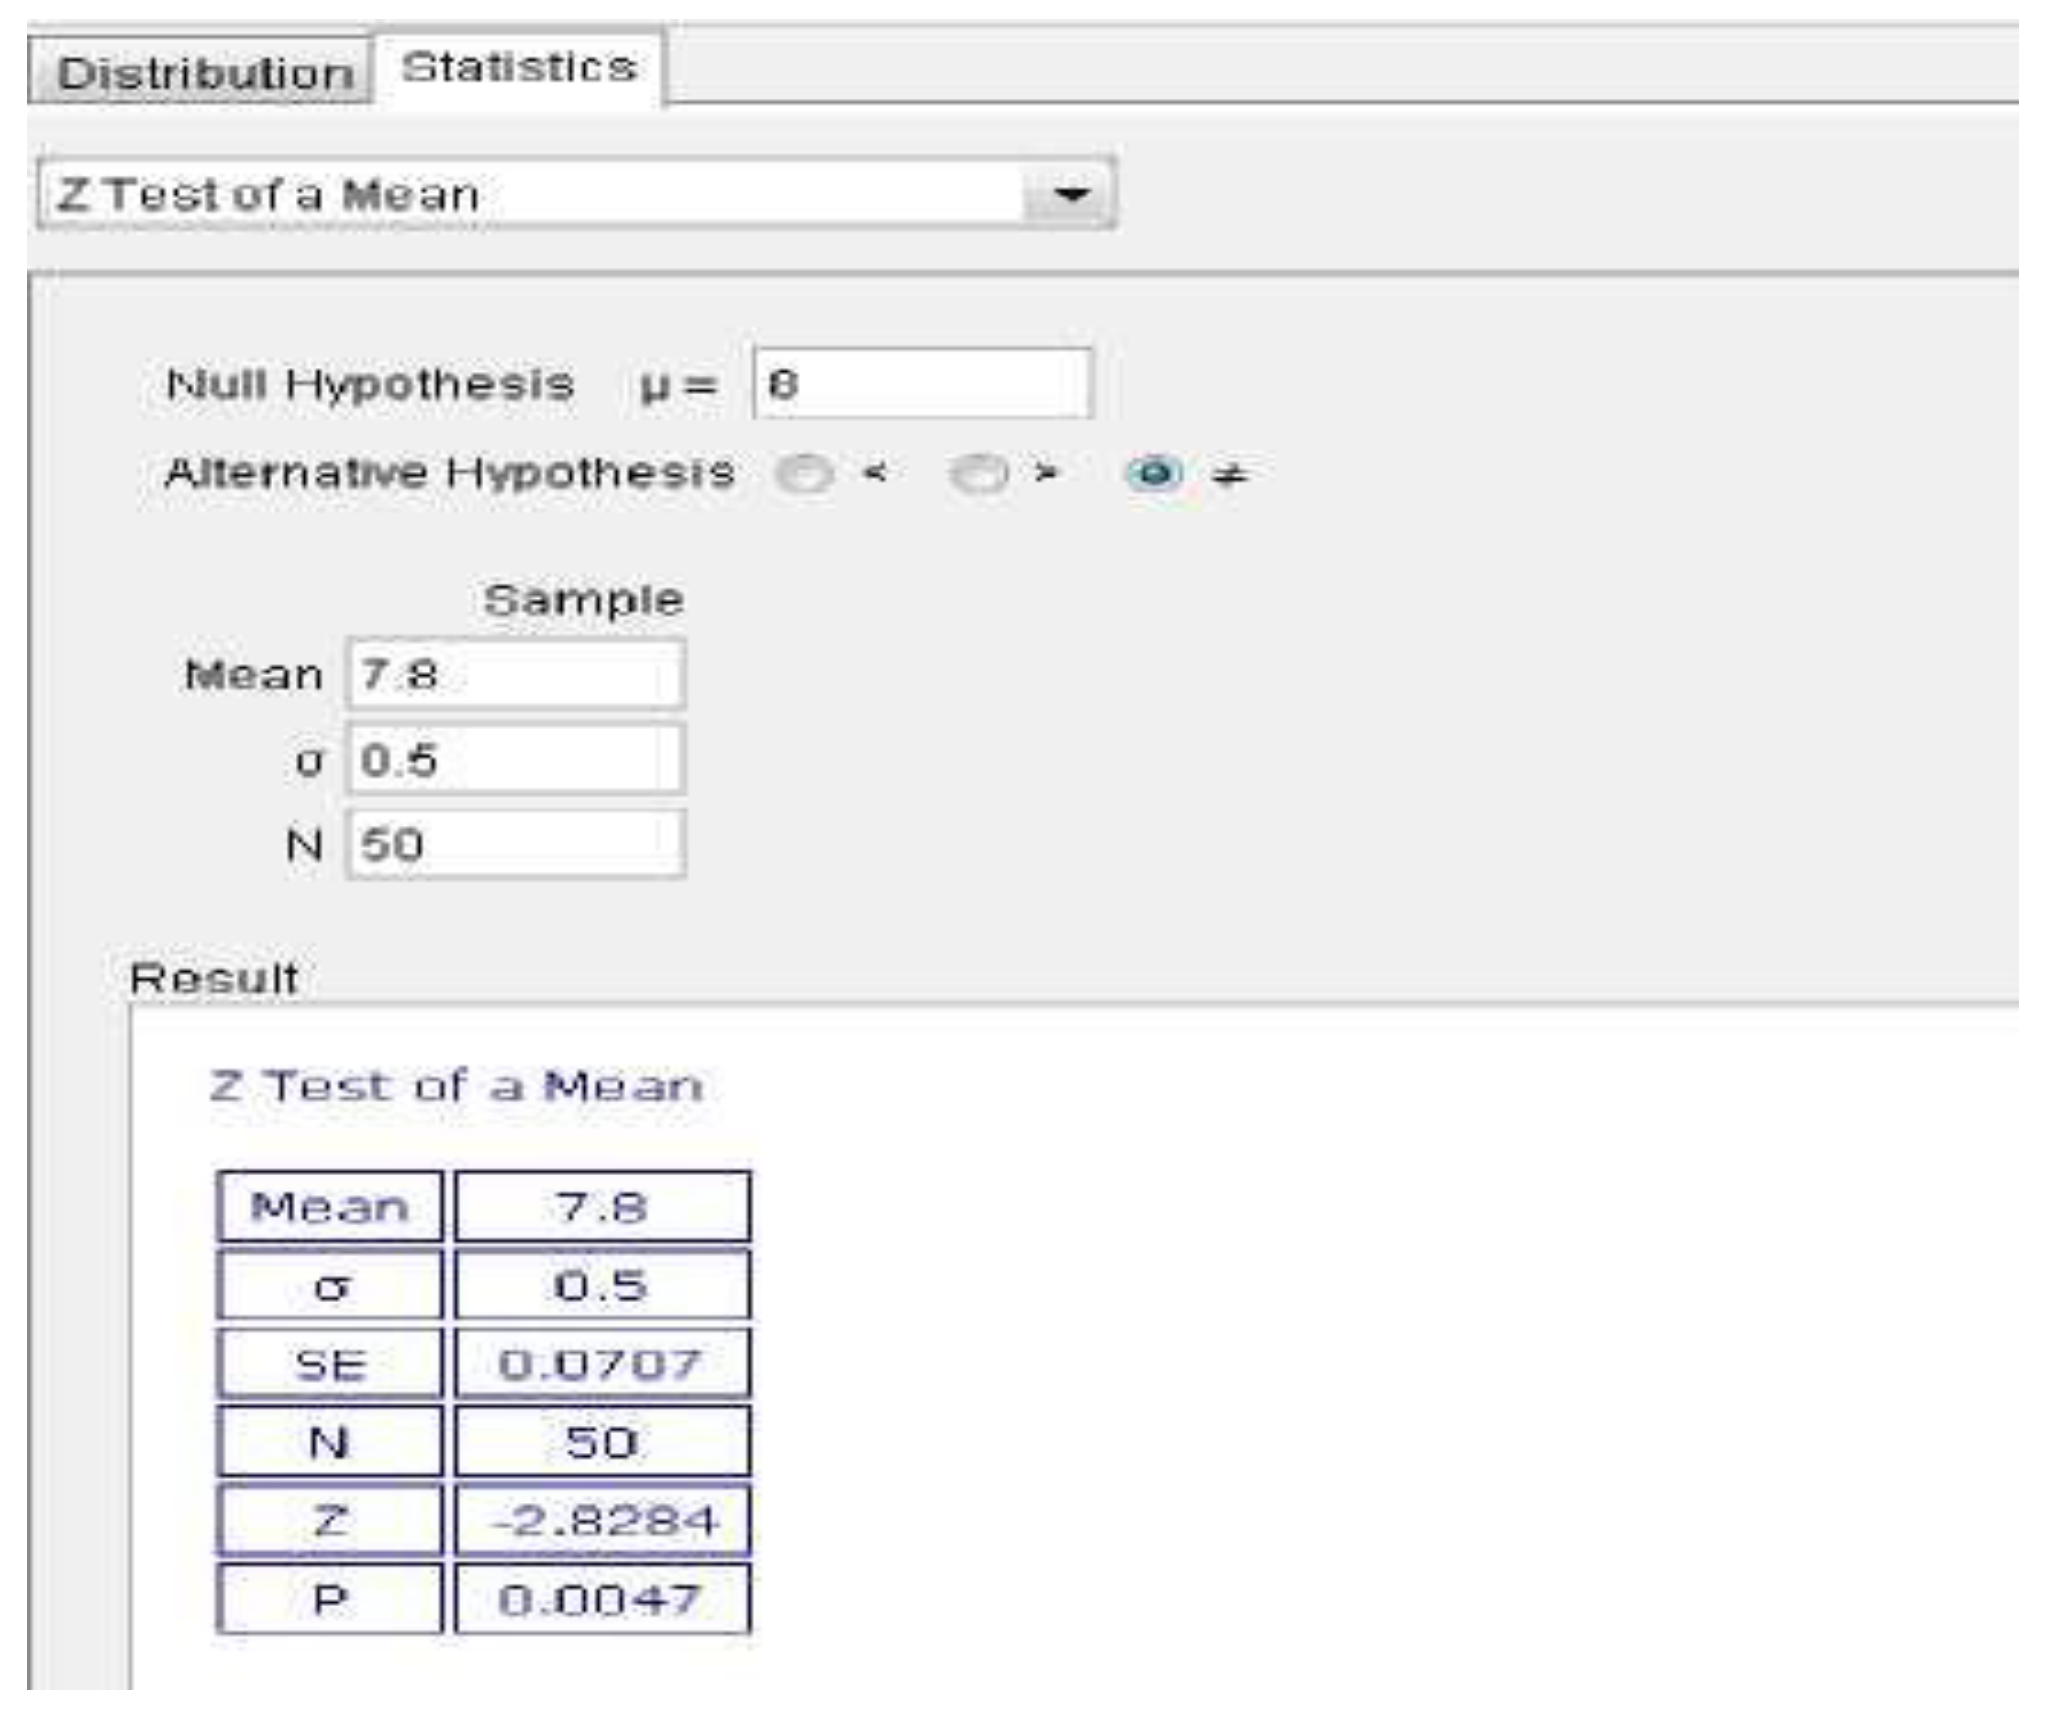
1. Hypothesis zero (H₀): μ=8
2. Counter-hypothesis (H₁): μ≠8
3. Significance level: α=0.01 with a value of p=0.0047
4. Because the value- p=0.0047<0.01, the null hypothesis is rejected. This means that the average durability of synthetic yarn is not equal to 8 kg.
From the slider and dialog input facilities in GeoGebra, an interactive applet can be created that allows users to control parameter values such as averages, standard deviations, and sample sizes. In this way, students can visualize changes in statistical test scores as well as ppp-scores directly when the parameters are changed. For example, if the standard deviation is enlarged, the Z-test value will shrink so that the decision on the hypothesis can change. Conversely, the larger the sample size used, the more sensitive the statistical test is to mean differences. [77,78]
GeoGebra thus not only functions as a calculation tool, but also as an experiment-based learning medium that provides direct experience to students. Interaction with the applet makes the concept of hypothesis testing easier to understand, as students can observe the relationship between parameters, sample distribution, test scores, and decision-making results. This approach is in line with the modern learning paradigm that emphasizes the active involvement of students in the learning process through exploration and knowledge construction. [7,8,9,10]
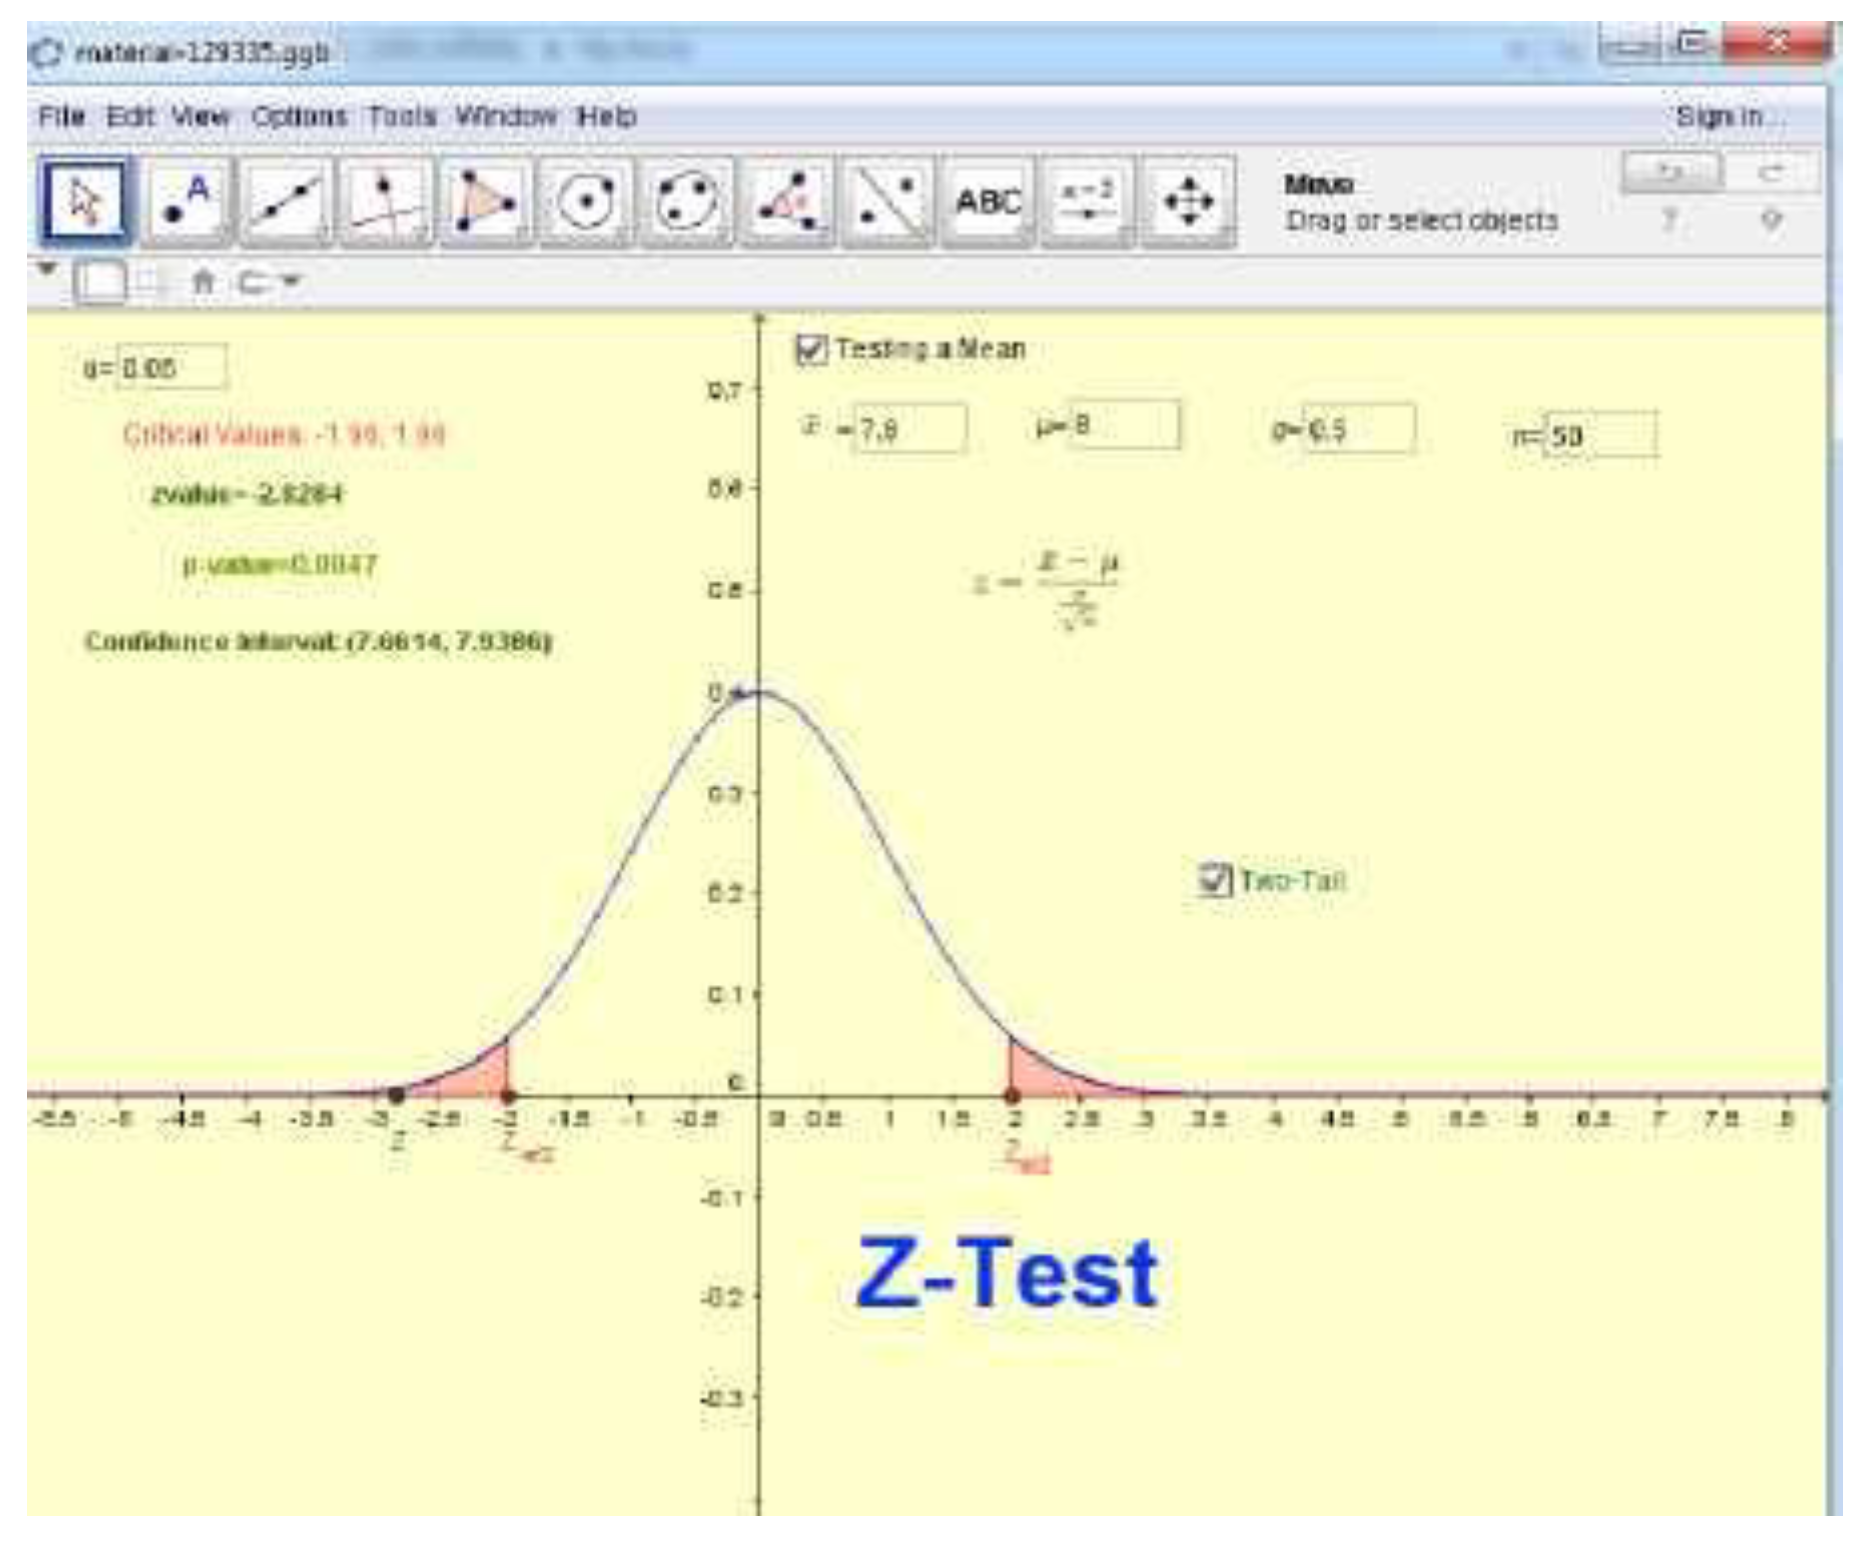
In the applet above, it is clear that the value of ZhitungZ_{calculate}Zcal at the significance level of 0.05 is in the area of rejection H0. By observing the movement of the critical point to reject the null hypothesis on the applet, a more effective understanding will be built for students about the concept of hypothesis testing on normally distributed data. Similarly, in building an understanding of the use of the F test in variance analysis (ANOVA) and significance test in regression analysis. The slider facility in GeoGebra can be used to visually present the movement of the FhitungF_{calculate}Fcalculate value on the distribution curve F according to known parameters. [76,77,78]
To build students' understanding of the basic concept of the critical area of H0 rejection which is usually expressed by α that to the right of the value α there is an area equal to the level of meaning, it will be greatly helped by a simple applet from GeoGebra presented in Figure 9. By using sliders to set the Fcal value, students can observe the relationship between the parameters of the degree of freedom, the value, and the shape of the distribution curve F. It also includes the understanding that the order of degrees of freedom affects the shape of the curve so that it has an impact on different Fcal values. [1,2]
The p-value in the applet in Figure 9 is the area below the F-curve which at the same time indicates the p-value. Thus, the applet helps to determine the level of meaning more flexibly. This is important because the distribution table F often only provides critical values at a general level of significance, such as 0.05 and 0.01. If a researcher wants to know the value of Fcal at a level of significance other than that available in the table, then the GeoGebra applet can be a practical solution. [5,6]
Example 5.
A hedonic test using variance analysis (ANOVA) was conducted to find out if there were significant differences in three different types of atomic bean servings with different flavors (e.g., chocolate flavor, strawberry flavor, and cheese flavor) in terms of crunch. The test was carried out on 23 panelists. The question is, what is the value of the critical point Fα?
In the above problem, the degree of freedom of the numerator df1=2 and the degree of freedom of the denominator df2=66. Since most distribution tables F only present values at the significance levels of 0.05 and 0.01, the applet in the following Figure 10 can be used to determine the value of the critical point Fα at the desired significance level. [7,8]
So, the critical value of fcal for the significance level of 0.25 is 1.4. This means that if the results of the calculation of the F test produce a value greater than 1.4, then the null hypothesis (H₀) can be rejected at a significance level of 25%. [19,20,21]
By utilizing the slider facility in GeoGebra, users can explore various values of other parameters such as degrees of freedom of numerators (df numerators) and denominators (df denominators). Through this exploration, students not only receive information passively, but are also encouraged to discover for themselves the patterns and relationships between parameters in the F distribution. [11,12]
This process makes students actively build knowledge (discovery learning). They can see how changes in degrees of freedom affect the shape of the distribution curve F, which ultimately impacts changes in the critical value of the calculation. [13,14]
Thus, GeoGebra's visualization of this problem plays an important role in clarifying the concept of the null hypothesis rejection area (H₀). This helps students to better understand that the decision to reject or accept H₀ is not just about memorizing the rules, but through the analysis of critical values and comparing them with the results of the test calculations. [15,16]
In conclusion, the use of GeoGebra in the F test not only provides technical convenience in determining the critical point, but also becomes an interactive and effective learning medium in building an in-depth understanding of the concept of hypothesis testing and statistical decision-making. [17,18]
4. Conclusions and Suggestions
4.1. Conclusion
From the discussion of the use of the GeoGebra application in solving statistical problems, it can be concluded that GeoGebra has a very important role as an interactive learning medium. GeoGebra not only provides a dynamic view and clear visualization, but also allows students to explore, build models, and discover statistical concepts independently. The normal, binomial, F, t-student, and chi-square distribution facilities can be visualized in the form of dynamic applets that make it easier for students to understand abstract concepts in a more concrete way. In addition, the use of sliders in GeoGebra makes it easier to observe changes in parameters and their relationship with graphs, so that it can strengthen students' understanding of the concept of hypothesis testing and variance analysis. Thus, GeoGebra becomes a relevant, effective, and innovative media in supporting the technology-based statistical learning process.
4.2. Suggestion
The use of GeoGebra in statistical learning should continue to be developed, not only limited to demonstration and illustration media, but also as a means for students to conduct experiments and concept discovery independently. Lecturers are expected to design interactive learning by utilizing the GeoGebra applet so that students are more active in the learning process. In addition, further research is needed, for example in the form of classroom action research, to test the effectiveness of the use of GeoGebra on improving students' understanding and learning outcomes in statistical learning. With continuous development, GeoGebra can become one of the important pillars in integrating technology into mathematics and statistics education in college.
Supplementary Materials
The following supporting information can be downloaded at the website of this paper posted on Preprints.org
Funding
This research did not receive any specific grant from funding agencies in the public, commercial, or not-for-profit sectors.
Acknowledgments
The authors would like to express their sincere gratitude to the State Islamic University (UIN) Syekh Ali Hasan Ahmad Addary Padangsidimpuan, Indonesia, for the financial and institutional support that made this research possible. The authors also thank colleagues from Padang State University for valuable feedback and collaboration throughout the study.
Conflicts of Interest
The authors declare that there are no conflicts of interest regarding the publication of this paper.
Abbreviations
| ANOVA | Analysis of Variance |
| H₀ | Null Hypothesis |
| H₁ | Alternative Hypothesis |
| IGI | International GeoGebra Institute |
| SPSS | Statistical Package for the Social Sciences |
| SAS | Statistical Analysis System |
| MATHEMATICA | Wolfram Mathematica (Computational Software System) |
| LISREL | Linear Structural Relations |
| AMOS | Analysis of Moment Structures |
| EVIEWS | Econometric Views |
| STATA | Statistics and Data Analysis |
| PBL | Problem-Based Learning |
| PJBL | Project-Based Learning |
| ICT | Information and Communication Technology |
| STEM | Science, Technology, Engineering, and Mathematics |
| 4C | Critical, Creative, Collaborative, and Communicative skills |
| UIN | Universitas Islam Negeri (State Islamic University) |
| SD | Standard Deviation |
| μ | Population Mean |
| X̄ | Sample Mean |
| n | Sample Size |
| α | Level of Significance |
| p-value | Probability Value in Hypothesis Testing |
| Z | Z-Statistic (Standard Score) |
| F | F-Statistic (in ANOVA Test) |
| χ² | Chi-Square Statistic |
| df | Degree of Freedom |
| Probability Density Function | |
| CDF | Cumulative Distribution Function |
| R² | Coefficient of Determination |
| df₁, df₂ | Numerator and Denominator Degrees of Freedom in F-Test |
| SE | Standard Error |
| GeoGebra | Geometry + Algebra (Dynamic Mathematics Software) |
References
- Andini, R.; Nugroho, B. GeoGebra as a Bridge for Understanding Professional Statistical Concepts and Applications. Journal of Mathematics and Science Education 2024, 14, 112–125. [Google Scholar] [CrossRef]
- Andini, R.; Nugroho, B. Project-based learning assisted GeoGebra in improving students' statistical skills. Journal of Mathematics Education Innovation 2024, 6, 115–128. [Google Scholar] [CrossRef]
- Anggraini, R. GeoGebra-based collaboration in improving the problem-solving skills of mathematics education students. Journal of Mathematics Education 2022, 16, 101–115. [Google Scholar] [CrossRef]
- Dewi, R. Utilization of GeoGebra for Probability Distribution Visualization. Journal of Mathematics Education 2022, 10, 45–56. [Google Scholar] [CrossRef]
- Fadilah, N. Integration of GeoGebra in statistical learning in college: A case study on the topic of opportunity distribution. Journal of Educational Technology 2024, 19, 55–70. [Google Scholar] [CrossRef]
- Fitriani, D.; Maulana, A. Multi-representation of visuals with GeoGebra to improve conceptual understanding of statistics. Indonesian Journal of Mathematics Education 2023, 8, 45–59. [Google Scholar] [CrossRef]
- Fitriani, S.; Maulana, D. GeoGebra-Based Collaborative Learning on Probability Materials. Journal of Learning Innovation 2023, 11, 88–102. [Google Scholar] [CrossRef]
- GeoGebra. (n.d.). GeoGebra homepage. Taken from http://geogebra.
- GeoGebra. (n.d.). The binomial distribution applet. Taken from http://tube.geogebra.org/material/show/id/1320.
- GeoGebra. (n.d.). The distribution applet is normal as a binomial approximation. Taken from http://tube.geogebra.org/material/show/id/1622513.
- GeoGebra. (n.d.). The Z hypothesis test applet is one average. Taken from http://tube.geogebra.org/material/show/id/1653639.
- Halim, R.; Dewi, A. Use of GeoGebra in hypothesis test learning: An experimental study in college. Journal of Higher Education Research 2025, 8, 141–156. [Google Scholar] [CrossRef]
- Haryanto, T. Understanding the Concept of Hypothesis Testing with GeoGebra. Journal of Education Statistics 2020, 8, 12–25. [Google Scholar] [CrossRef]
- Hasanah, D.; Putra, Y. The application of GeoGebra to improve students' statistical literacy. Journal of Applied Mathematics and Education 2023, 4, 77–91. [Google Scholar] [CrossRef]
- Hidayat, M. The effect of the use of GeoGebra on students' understanding of the concept of inferential statistics. Journal of Educational Sciences 2023, 29, 201–215. [Google Scholar] [CrossRef]
- Hidayat, M. Visualization of Opportunity Distribution with GeoGebra in Statistical Learning. Journal of Education and Technology 2023, 12, 55–70. [Google Scholar] [CrossRef]
- Hidayat, R. GeoGebra's dynamics in supporting statistical learning in higher education. Journal of Mathematics Education Research 2023, 12, 211–225. [Google Scholar] [CrossRef]
- Hidayat, R.; Lestari, S. Innovation in statistical learning through the integration of digital technology. Journal of Modern Mathematics Education 2023, 7, 101–115. [Google Scholar] [CrossRef]
- Hidayat, R.; Prasetyo, A. (2023). Technology-based learning innovations in higher education. Jakarta: Prenada Media. [CrossRef]
- Hidayati, N.; Purnama, K. The effectiveness of GeoGebra-based statistical learning on students' conceptual understanding. Journal of Digital Mathematics Education 2025, 15, 45–61. [Google Scholar] [CrossRef]
- Kurniawan, A.; Siregar, T. The Utilization of GeoGebra Sliders for Understanding Students' Normal Distribution. Journal of Statistics and Education 2024, 9, 99–113. [Google Scholar] [CrossRef]
- Kurniawan, D.; Siregar, T. The use of GeoGebra in connecting descriptive data and graphical visualization. Indonesian Journal of Statistics Education 2024, 5, 98–112. [Google Scholar] [CrossRef]
- Lavicza, Z.; Hohenwarter, M.; Jones, K.; Lu, Y.; Dawes, M. Establishing a professional development network around dynamic mathematics software in England. International Journal for Technology in Mathematics Education 2010, 19, 245–252. [Google Scholar]
- Lestari, I.; Hakim, F. GeoGebra as a concept construction medium in opportunity learning. Journal of Science and Mathematics Education 2024, 9, 21–34. [Google Scholar] [CrossRef]
- Lestari, N. The Effectiveness of GeoGebra in Improving Students' Understanding of Probability. Journal of Mathematics Education Research 2025, 15, 77–91. [Google Scholar] [CrossRef]
- Lestari, S. GeoGebra as a statistical learning innovation based on digital literacy. Journal of Technology and Education 2025, 15, 33–47. [Google Scholar] [CrossRef]
- Lestari, S. Interactive visualizations with GeoGebra to reinforce hypothesis test learning. Journal of Mathematics Education Research 2025, 12, 88–104. [Google Scholar] [CrossRef]
- Mahmudin, A. (2010, November 27). Learn geometry with the GeoGebra program. The paper was presented at the National Seminar on Mathematics and Mathematics Education, Department of Mathematics Education, FMIPA UNY. Taken from http://eprints.uny.ac.id/10483/1/P6-Ali%20M. [Google Scholar]
- Mulyani, T.; Siregar, T. The use of the interactive applications GeoGebra and Autograph in mathematics learning. Journal of Mathematics Education Innovation 2024, 10, 55–70. [Google Scholar] [CrossRef]
- Mustika, D. Statistical basics for research. Bandung: Alfabeta. [CrossRef]
- Nugraha 2021, B.; Sari, M. Statistics Learning Innovation in the Digital Era. Journal of Educational Innovation 2021, 9, 67–80. [Google Scholar] [CrossRef]
- Nugroho, B.; Rahayu, T. Use of GeoGebra in data processing and distribution visualization. Journal of Mathematics Technology and Education 2024, 13, 117–132. [Google Scholar] [CrossRef]
- Nurdin, A.; Hakim, L. Lecturers' competence in integrating GeoGebra technology for statistical learning. Journal of Education and Technology 2025, 14, 121–138. [Google Scholar] [CrossRef]
- Nurhayati, A. The use of GeoGebra in the distribution of discrete and continuous opportunities for mathematics education students. Journal of Statistics and Learning 2024, 8, 145–162. [Google Scholar] [CrossRef]
- Nurhayati, E. Strengthening Student Digital Literacy through the Use of GeoGebra in Statistics. Journal of Educational Technology 2024, 10, 145–160. [Google Scholar] [CrossRef]
- Nurhayati, I. Integration of STEM approaches through GeoGebra in mathematics learning in the Society 5.0 era. Journal of Mathematical Education 2024, 10, 254–270. [Google Scholar] [CrossRef]
- Prasetyo, H. Visualize probability concepts with GeoGebra to improve student understanding. Journal of Statistics and Mathematics Education 2023, 5, 133–147. [Google Scholar] [CrossRef]
- Pratama, R. Integration of GeoGebra in Statistical Research of College Students. Journal of Educational Research and Innovation 2023, 13, 121–134. [Google Scholar] [CrossRef]
- Pratama, Y. Digital transformation of education in the era of society 5.0: The role of GeoGebra applications in 21st century learning. Indonesian Journal of Education 2023, 12, 301–318. [Google Scholar] [CrossRef]
- Pratama, Y. Student collaboration with GeoGebra in frequency distribution learning. Journal of Mathematics Education Research 2023, 7, 87–101. [Google Scholar] [CrossRef]
- Pratt, D.; Davies, N.; Connor, D. The role of technology in teaching and learning statistics. In C. Batanero 2011, G. Burrill, & C. Reading (Eds.), Teaching statistics in school mathematics: Challenges for teaching and teacher education (pp. 97–107). New York: Springer Science+Business Media B.V.
- Prodromou, T. GeoGebra in teaching and learning introductory statistics. Electronic Journal of Mathematics & Technology 2014, 8, 363–376. [Google Scholar]
- Putra, A.; Siregar, T. The effectiveness of GeoGebra as a medium for managing statistical data in universities. Journal of Mathematics and Learning Innovation 2023, 4, 134–149. [Google Scholar] [CrossRef]
- Putra, D.; Wibowo, A. GeoGebra as a Probability Learning Media in Higher Education. Journal of Education and Technology 2024, 12, 101–115. [Google Scholar] [CrossRef]
- Putri, A. Inclusive access to statistical learning with GeoGebra for weak economics students. Journal of Equity in Education 2023, 2, 77–92. [Google Scholar] [CrossRef]
- Putri, D. The use of GeoGebra in understanding the concept of hypothesis testing in universities. Journal of Mathematics Learning 2023, 17, 177–192. [Google Scholar] [CrossRef]
- Rahman, A. Project-based learning with GeoGebra to increase motivation to learn statistics. Journal of Learning Innovation and Technology 2021, 3, 55–70. [Google Scholar] [CrossRef]
- Rahman, A. The effectiveness of GeoGebra in increasing student involvement in project-based learning. Journal of Mathematics Education 2021, 15, 23–38. [Google Scholar] [CrossRef]
- Rahman, A. The effectiveness of technology-based learning strategies in building students' statistical understanding. Journal of Mathematics Education Research 2025, 14, 89–104. [Google Scholar] [CrossRef]
- Rahmawati, A.; Susanto, I.; Malik, H. The Use of GeoGebra Statistics Panel for Student Hypothesis Testing. Journal of Educational Statistics 2024, 8, 34–47. [Google Scholar] [CrossRef]
- Rahmawati, F.; Santoso, H.; Malik, R. An interactive experiment using GeoGebra to improve students' critical thinking skills. Journal of Mathematics and Science Education 2024, 9, 66–81. [Google Scholar] [CrossRef]
- Ramadhani, T.; Nurhayati, S. Students' perception of the difficulty of learning statistics. Journal of Mathematics Education 2022, 16, 145–153. [Google Scholar] [CrossRef]
- Rizal, A.; Santoso, H. Exploring Opportunity Distribution with GeoGebra. Journal of Mathematics and Its Applications 2021, 15, 89–98. [Google Scholar] [CrossRef]
- Rizki, A.; Marlina, E. GeoGebra application for hypothesis test learning in universities. Journal of Statistical and Educational Innovation 2024, 7, 101–118. [Google Scholar] [CrossRef]
- Saputra, D. Visualize continuous opportunity distribution using GeoGebra. Journal of Education Statistics 2023, 9, 31–46. [Google Scholar] [CrossRef]
- Saputra, H.; Handayani, M. Student technology and data literacy through the implementation of GeoGebra in statistical learning. Journal of Educational Transformation 2024, 9, 188–202. [Google Scholar] [CrossRef]
- Sari, M. GeoGebra as an interactive learning medium to increase understanding of student opportunity concepts. Journal of Learning Innovation 2024, 10, 95–110. [Google Scholar] [CrossRef]
- Sari, N. Integration of normal distributions in GeoGebra-based statistical learning. Journal of Statistics and Education 2024, 8, 143–158. [Google Scholar] [CrossRef]
- Sari, Y.; Pratama, R. Improving student data literacy through interactive technology-based statistical learning. Journal of Educational Digital Literacy 2023, 5, 101–116. [Google Scholar] [CrossRef]
- Sekulic, T.; Takaci, D. (2013, May 20–24). Mathematical modelling, computers and GeoGebra in university and college mathematics education. In the 36th International Convention on Information & Communication Technology, Electronics & Microelectronics (MIPRO) (pp. 625–630). IEEE. Taken from http://ieeexplore.ieee.org/stamp/stamp.jsp?tp=&arnumber=6596334&isnumber=6596.
- Setiawan, R. Constructivism approach in statistical learning with the help of GeoGebra. Journal of Mathematics and Science Education 2022, 14, 133–149. [Google Scholar] [CrossRef]
- Siregar, T. The use of GeoGebra to improve students' statistical understanding. Journal of Mathematics Education Innovation 2024, 12, 33–42. [Google Scholar] [CrossRef]
- Siregar, T.; Lubis, F. Integration of GeoGebra in Statistics Learning at UIN Syahada Padangsidimpuan. Journal of Islamic Education and Mathematics 2023, 11, 33–49. [Google Scholar] [CrossRef]
- Susanti, D. Challenges and solutions for the use of GeoGebra in statistical learning in college. Journal of Technology and Education 2025, 21, 45–61. [Google Scholar] [CrossRef]
- Susanti, D. The effect of inquiry-based statistical learning with GeoGebra on students' analytical skills. Journal of Applied Mathematics Education 2025, 11, 59–74. [Google Scholar] [CrossRef]
- Susanto, M. Statistical learning experiment based on the GeoGebra applet in the college classroom. Journal of Mathematical Innovation Research 2024, 6, 65–80. [Google Scholar] [CrossRef]
- Ainsworth, S.; Siposova, B. Constructivist approaches to teaching hypothesis testing through interactive technology: A GeoGebra-based study. Journal of Mathematical Behavior 2022, 66, 101016. [Google Scholar]
- Al Ayyubi, A. A. , Rohmatulloh, R., & Fitriani, N. Enhancing students’ creative and critical thinking skills through GeoGebra-assisted mathematics learning. International Journal of Education and Learning 2023, 5, 112–123. [Google Scholar]
- Alfaro, D.; Wijaya, E. Integrating GeoGebra for statistical reasoning in higher education: A holistic pedagogical model. Asia-Pacific Journal of Science and Mathematics Education 2025, 15, 1–18. [Google Scholar]
- Almeida, R. Dynamic visualization and conceptual understanding of probability and statistics through GeoGebra. Computers & Education 2022, 182, 104468. [Google Scholar]
- Almeida, R. Collaborative digital learning and statistical reasoning through GeoGebra in higher education. Journal of Interactive Learning Environments 2025, 33, 45–62. [Google Scholar]
- Anderson, P. Dynamic visualization in digital mathematics environments: Enhancing conceptual understanding through GeoGebra. Journal of Mathematics Education and Technology 2021, 15, 201–215. [Google Scholar]
- Anim, H.; Haris, A.; Putra, S. The effect of GeoGebra-based learning on students’ curiosity and motivation in mathematical statistics. Journal of Educational Research and Evaluation 2023, 7, 54–66. [Google Scholar]
- Anzani, D.; Juandi, D. The effectiveness of GeoGebra-assisted problem-based learning: A meta-analysis study. International Journal of Emerging Mathematics Education 2025, 9, 45–62. [Google Scholar]
- Azra, N.; Haleema, T.; Kamran, M. Digital visualization tools and their impact on understanding mathematical structures in secondary education. Eurasia Journal of Mathematics 2025, 21, 210–225. [Google Scholar]
- Cheng, T. Modeling probability distributions using GeoGebra: Supporting conceptual reasoning through simulation-based instruction. Journal of Statistics Education 2023, 31, 150–168. [Google Scholar]
- Dewi, L.; Rahman, M. Dynamic data visualization for enhancing student understanding in statistics using GeoGebra. International Journal of Mathematical Education in Science and Technology 2021, 52, 1432–1450. [Google Scholar]
- Engel, M.; Weber-Stein, C. Teaching social science students to think with data: Integrating statistical reasoning and social context in higher education. Journal of Social Science Education 2023, 22, 45–59. [Google Scholar] [CrossRef]
- Fernandez, L. Developing teamwork and communication skills through GeoGebra-based collaborative problem solving. International Journal of Mathematical Education in Science and Technology 2023, 54, 1092–1108. [Google Scholar]
- Garcia, L. AI-integrated GeoGebra for adaptive digital learning in mathematics education. Education and Information Technologies 2025, 30, 1459–1476. [Google Scholar]
- Hasim, N.; Mohamad, M.; Rosli, R.; Halim, L. Assessing secondary students’ statistical thinking level and its connection to real-life data contexts. International Journal of Instruction 2024, 17, 289–306. [Google Scholar] [CrossRef]
- Hohenwarter, M.; Fuchs, K. Combination of Dynamic Geometry, Algebra, and Calculus in the Software System GeoGebra. Computer Algebra Systems and Dynamic Geometry Systems in Mathematics Teaching Conference 2004, Pécs, Hungary. [Online]. Available: https://archive.geogebra.org/static/publications/pecs_2004.pdf.
- Hwang, J.; Noh, S. Interactive learning of discrete probability distributions using GeoGebra: Effects on conceptual understanding and cognitive load. Education and Information Technologies 2022, 27, 12561–12580. [Google Scholar]
- Ilyas, M.; Ma’rufi, I.; Rahmawati, D. The influence of GeoGebra-integrated contextual learning on students’ numeracy and mathematical literacy skills. Indonesian Journal of Mathematics Education 2024, 14, 88–101. [Google Scholar]
- Irawan, M.; Rosjanuardi, R.; Prabawanto, S. How computational thinking can be integrated in statistical learning: A Cuboid Framework. Journal of Physics: Conference Series 2022, 2193, 012064. [Google Scholar] [CrossRef]
- Ismail, R.; Kwon, J. Integrating visual and computational approaches in statistical learning: The role of GeoGebra in conceptual development. Education and Information Technologies 2023, 28, 7251–7270. [Google Scholar]
- Kinnear, V.; Fry, K.; Northcote, M. Statistical investigations in primary school: The role of contextual expectations for data analysis. Mathematics Education Research Journal 2021, 33, 895–912. [Google Scholar] [CrossRef]
- Kurnia, D.; Lowrie, T.; Patahuddin, S.M. The development of high school students’ statistical literacy across grade level: A longitudinal study. International Journal of Educational Research Open 2023, 5, 100220. [Google Scholar] [CrossRef]
- Kurt, M. Enhancing conceptual understanding through dynamic mathematics software: Evidence from GeoGebra integration in higher education. International Journal of Mathematical Education in Science and Technology 2021, 52, 1256–1273. [Google Scholar]
- Lee, M. Collaborative data exploration with GeoGebra: Enhancing engagement and comprehension in higher education. Education and Information Technologies 2025, 30, 1881–1903. [Google Scholar]
- Lestari, F.; Setianingsih, R.; Melia Sari, N. Applying Polya’s problem-solving model through GeoGebra Classroom to improve students’ analytical reasoning in statistics. International Journal of Interactive Learning Environments 2025, 8, 134–149. [Google Scholar]
- Li, H.; Hassan, R. Visualizing statistical inference: The effect of GeoGebra-based simulations on understanding type I and type II errors. Computers & Education 2023, 193, 104667. [Google Scholar]
- Lim, C.; Widjaja, Y. Enhancing probabilistic reasoning through dynamic visualization: The use of GeoGebra in discrete probability learning. International Journal of Mathematical Education in Science and Technology 2021, 52, 1456–1472. [Google Scholar]
- Lim, S.; Nordin, H. Interactive data management and statistical graphing with GeoGebra: Enhancing conceptual understanding in undergraduate learning. Education and Information Technologies 2022, 27, 12781–12799. [Google Scholar]
- Martinez, R. GeoGebra-assisted pattern recognition and mathematical modeling in data-driven learning. Computers & Education 2023, 195, 104689. [Google Scholar]
- Martins, F.; Zhao, L. Enhancing analytical and interpretive thinking through interactive data processing with GeoGebra. International Journal of STEM Education 2024, 11, 210–229. [Google Scholar]
- Mukherjee, A. Inquiry-based collaborative learning with GeoGebra: Fostering motivation and conceptual understanding in statistics education. Educational Research and Development Journal 2024, 18, 201–219. [Google Scholar]
- Nguyen, H. Interactive exploration of data distributions through dynamic visualization: Implications for statistical reasoning. Computers & Education 2022, 184, 104520. [Google Scholar]
- Nguyen, P. T. , & Pham, H. D. Enhancing comprehension of hypothesis testing using dynamic visualization tools in GeoGebra. Education and Information Technologies 2021, 26, 12531–12549. [Google Scholar]
- Nguyen, T. Technology-enhanced statistics learning during pandemic disruptions: Lessons from GeoGebra-based pedagogy. Computers & Education Open 2023, 14, 100220. [Google Scholar]
- Nugroho, D. Student-created modeling and its impact on mathematics learning motivation: A GeoGebra-based study. International Journal of STEM Education Research 2022, 9, 87–101. [Google Scholar]
- Peterson, H. Integrating multifunctional visualization tools in mathematics education: The case of GeoGebra. International Journal of Educational Technology in Higher Education 2021, 18, 101–115. [Google Scholar]
- Prasetyo, A.; Chan, M. Visualizing continuous probability through GeoGebra: Bridging calculus and conceptual understanding. Journal of Statistics Education 2023, 31, 23–41. [Google Scholar]
- Rahim, N. Reducing cognitive load in mathematics learning through multimodal digital environments: Evidence from GeoGebra integration. Asia-Pacific Journal of Educational Technology 2024, 16, 25–42. [Google Scholar]
- Rahman, M.; Setiawan, D. Integrating GeoGebra simulations in inferential statistics: Impacts on students’ reasoning and conceptual mastery. International Journal of STEM Education 2024, 11, 211–228. [Google Scholar]
- Rahman, N. Collaborative learning with GeoGebra: A model for interactive mathematics instruction. Journal of Educational Technology & Society 2022, 25, 98–110. [Google Scholar]
- Rizal, M.; Ahmad, Z. Developing procedural understanding in statistical learning through dynamic visualization with GeoGebra. International Journal of Educational Technology in Higher Education 2021, 18, 112–128. [Google Scholar]
- Sa’diyah, M.; Mulyono, H.; Irawan, A. Integrating dynamic visualization in mathematics learning: Impacts on conceptual understanding and engagement. Journal of Technology and Science Education 2023, 13, 427–439. [Google Scholar]
- Santoso, A. Bridging theory and practice in statistical learning through GeoGebra simulations. Asia-Pacific Journal of Science and Mathematics Education 2024, 6, 45–63. [Google Scholar]
- Santoso, E.; Ibrahim, M. Developing probabilistic reasoning through interactive modeling with GeoGebra in higher education. International Journal of STEM Education 2024, 11, 312–329. [Google Scholar]
- Sharma, S.; McLeod, K.; Chandra, P. Exploring the use of language and contextual resources in multilingual classrooms: A case of Pasifika students learning statistics collaboratively. Statistics Education Research Journal 2023, 22, 95–115. [Google Scholar] [CrossRef]
- Siregar, T. Constructivist learning approaches supported by GeoGebra in statistical education. Journal of Mathematics and Science Education 2023, 5, 87–103. [Google Scholar]
- Siregar, T.; Lowrie, T. Digital tools and data literacy in higher education: The transformative role of GeoGebra in statistical learning. Asia-Pacific Journal of Educational Technology 2025, 17, 1–21. [Google Scholar]
- Siregar, T.; Lowrie, T. Technology-mediated learning in statistics: Enhancing probability comprehension through GeoGebra-based visualization. Asia-Pacific Journal of Educational Technology 2025, 17, 55–74. [Google Scholar]
- Suryani, D. Social constructivism in digital mathematics learning: The role of GeoGebra in promoting collaborative engagement. Journal of Educational Technology Studies 2021, 9, 88–103. [Google Scholar]
- Wahyuni, L. The use of GeoGebra for the processing and presentation of statistical data to prospective teacher students. Scientific Journal of Education 2021, 9, 211–227. [Google Scholar] [CrossRef]
- Wahyuni, L. The use of the GeoGebra slider feature in frequency distribution learning. Journal of Mathematics Teaching 2021, 4, 73–88. [Google Scholar] [CrossRef]
- Walpole, R. E. , & Myers, R. H. (, I: and statistics for engineers and scientists (4th edition, translated by R. K. Sembiring). Bandung.
- Wang, L.; Santoso, A. Visualization of hypothesis testing using GeoGebra: Effects on inferential reasoning and student confidence. Computers & Education 2024, 195, 104680. [Google Scholar]
- Wibowo, A.; Lee, K. Improving hypothesis testing comprehension through GeoGebra-based visual learning environments in higher education. Asia-Pacific Journal of Educational Technology 2025, 17, 87–102. [Google Scholar]
- Wijaya, D.; Hartono, P. Transformation of Statistics Learning in the Digital Era with GeoGebra. Journal of Higher Education 2025, 17, 201–216. [Google Scholar] [CrossRef]
- Wijaya, K.; Hartono, R. Integration of GeoGebra in statistical teaching to minimize procedural errors. Journal of Mathematics Education Innovation 2025, 7, 41–58. [Google Scholar] [CrossRef]
- Williams, T. Collaborative digital modeling and communication in GeoGebra environments: Implications for mathematics pedagogy. Educational Technology & Society 2025, 28, 42–59. [Google Scholar]
- Wulandari, N. Utilization of interactive media in statistical learning: Challenges and opportunities. Journal of Mathematics Education Studies 2023, 11, 199–212. [Google Scholar] [CrossRef]
- Wulandari, R.; Saputra, Y. Statistical literacy and technology integration in learning. Journal of Educational Technology 2025, 19, 55–67. [Google Scholar] [CrossRef]
- Yamada, K. Integrating real-world data in mathematics education through GeoGebra: Enhancing contextual understanding. Asia-Pacific Education Researcher 2024, 33, 53–70. [Google Scholar]
- Yuliana, R. Analysis of the role of statistical software in higher education. Indonesian Journal of Educational Technology 2023, 12, 225–239. [Google Scholar] [CrossRef]
- Yuliani, F.; Ramadhan, M. GeoGebra-Based Independent Learning on Opportunity Distribution Materials. Journal of Mathematics and Technology 2025, 16, 66–80. [Google Scholar] [CrossRef]
- Yuliani, N.; Ramadhan, P. The impact of the GeoGebra free application on the learning independence of statistics students. Journal of Technology and Science Education 2025, 12, 99–114. [Google Scholar] [CrossRef]
- Yusuf, M.; Arifin, Z. GeoGebra as a Student Statistical Data Analysis Tool. Journal of Educational Research 2025, 13, 55–70. [Google Scholar] [CrossRef]
- Takahashi, M. Enhancing social presence and engagement in online mathematics learning through GeoGebra-based collaboration. Computers & Education 2022, 191, 104639. [Google Scholar]
- Lee, K. Digital mentorship and engagement in technology-enhanced STEM education. Computers & Education 2024, 202, 104867. [Google Scholar]
- Pratama, D. Bridging digital readiness and pedagogical innovation in technology-based mathematics learning. Journal of Educational Technology Research and Development 2021, 69, 3321–3339. [Google Scholar]
- Ramirez, J. Integrating GeoGebra and statistical software for holistic data literacy: A pedagogical model. International Journal of Mathematical Education in Science and Technology 2022, 53, 702–718. [Google Scholar]
- Rahman, M. Overcoming digital learning anxiety through sustained practice in interactive mathematics education. Education and Information Technologies 2025, 30, 421–438. [Google Scholar]
- Wong, L. Teacher professional learning communities and the sustainable adoption of digital tools in higher education. Teaching and Teacher Education 2023, 127, 104036. [Google Scholar]
Figure 4.
Panel of Binomial Data Distribution [42].
Figure 4.
Panel of Binomial Data Distribution [42].
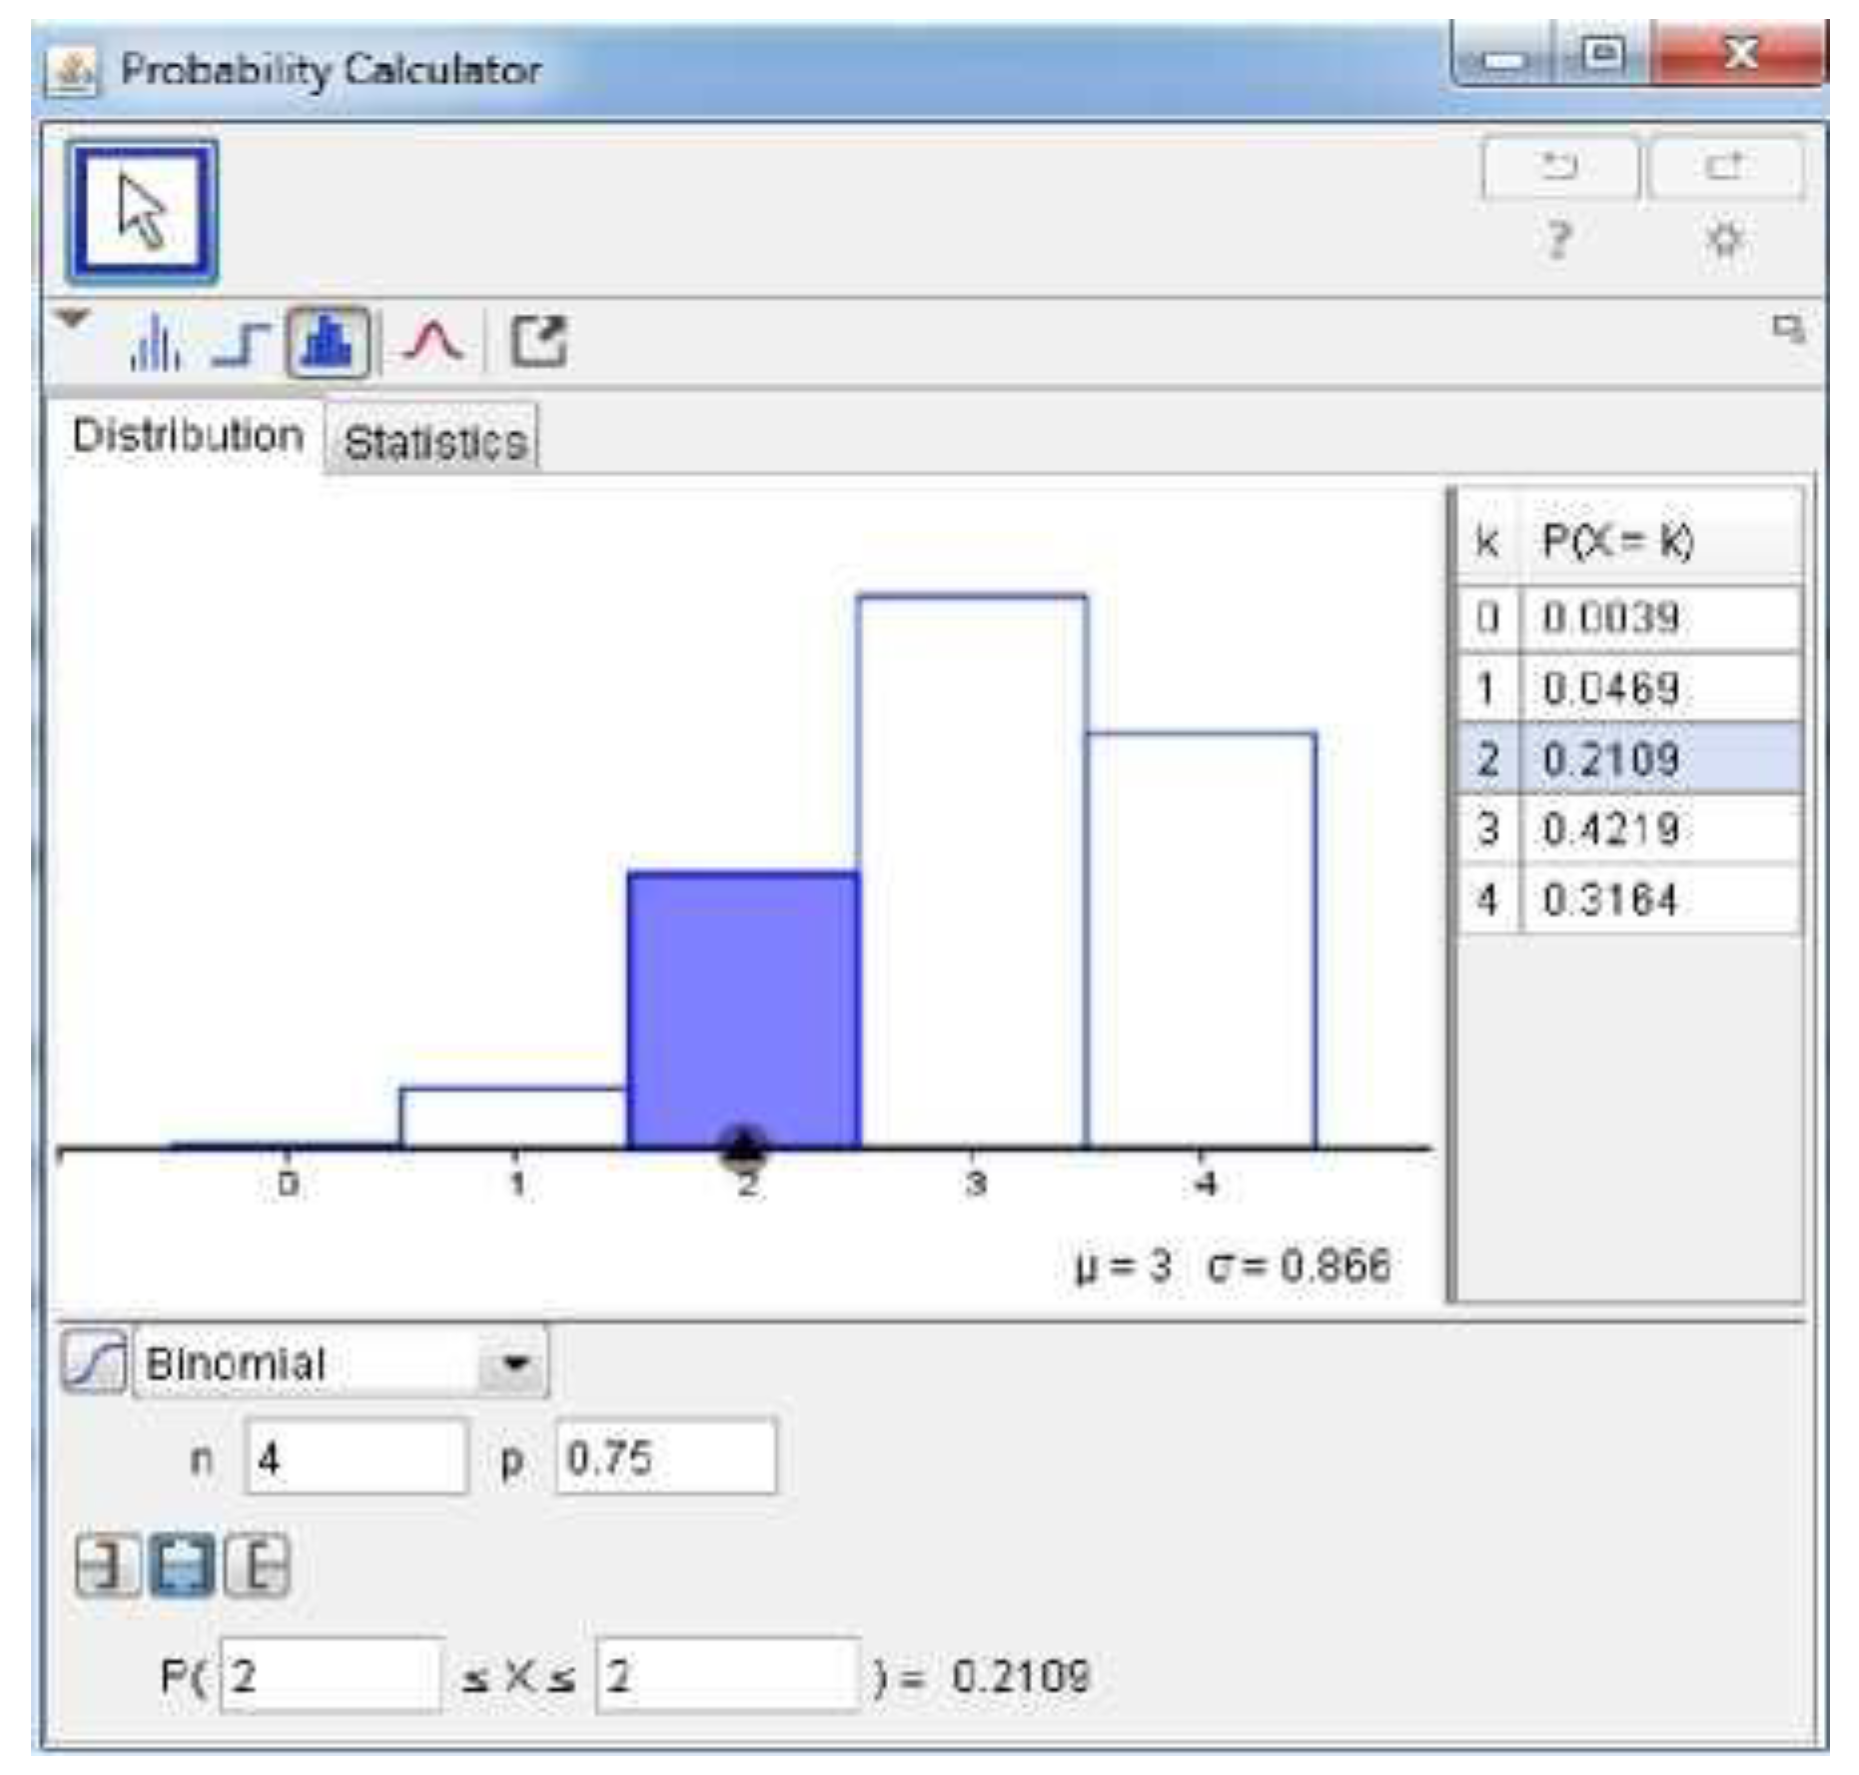
Figure 5.
Near-Normal Applet to Binomial Distribution.
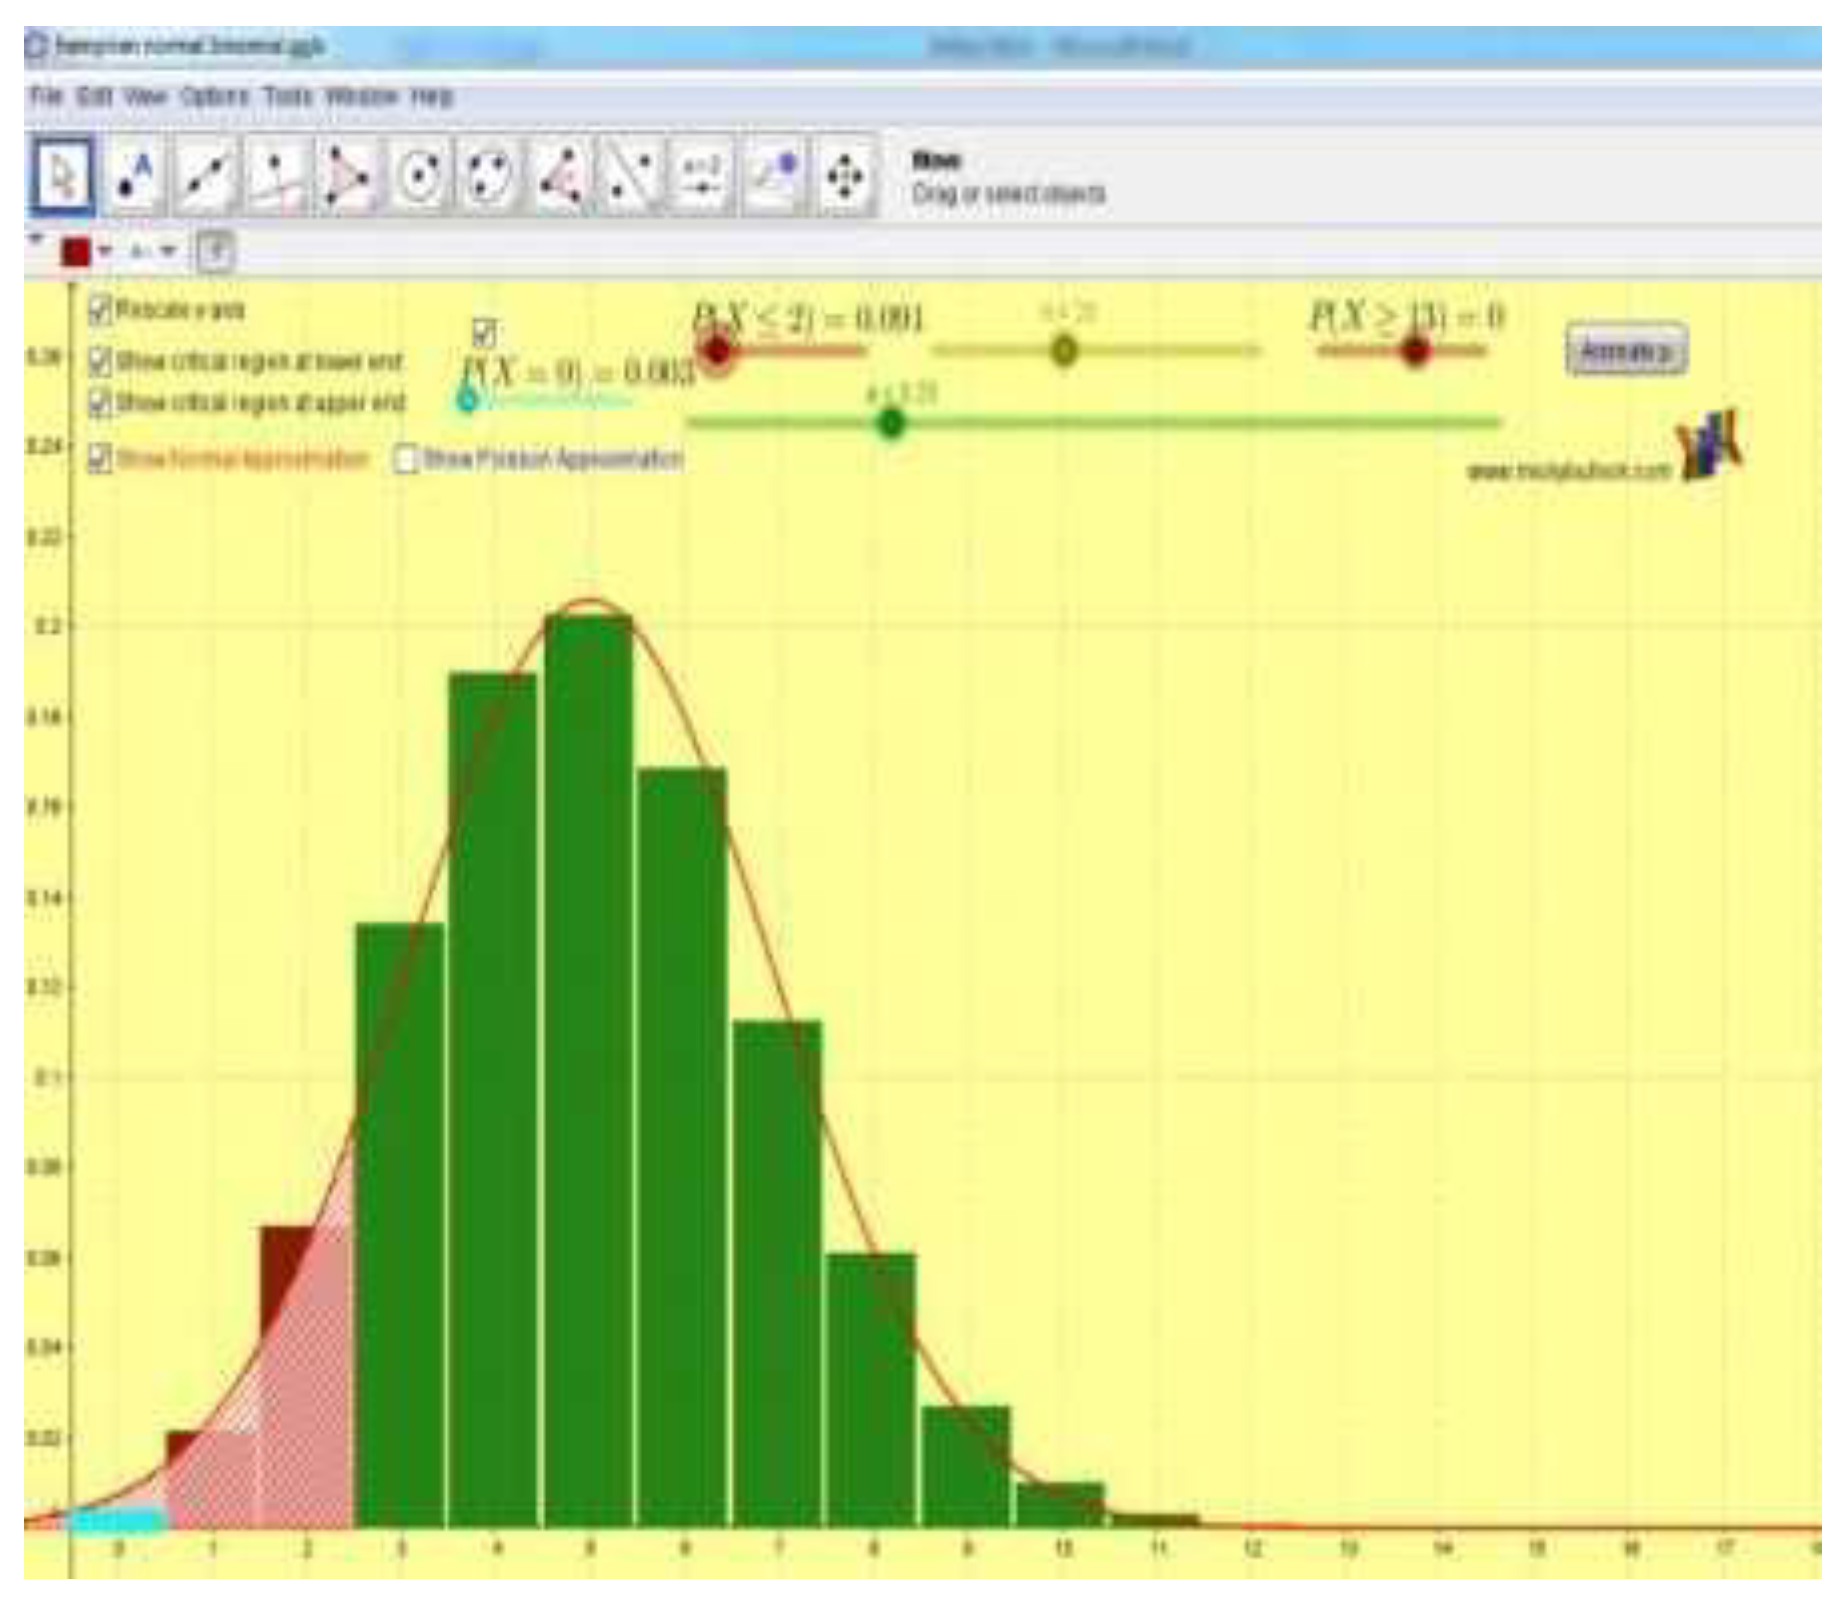
Figure 6.
Panel Statistics on GeoGebra for the Z Test of One Average [69].
Figure 6.
Panel Statistics on GeoGebra for the Z Test of One Average [69].
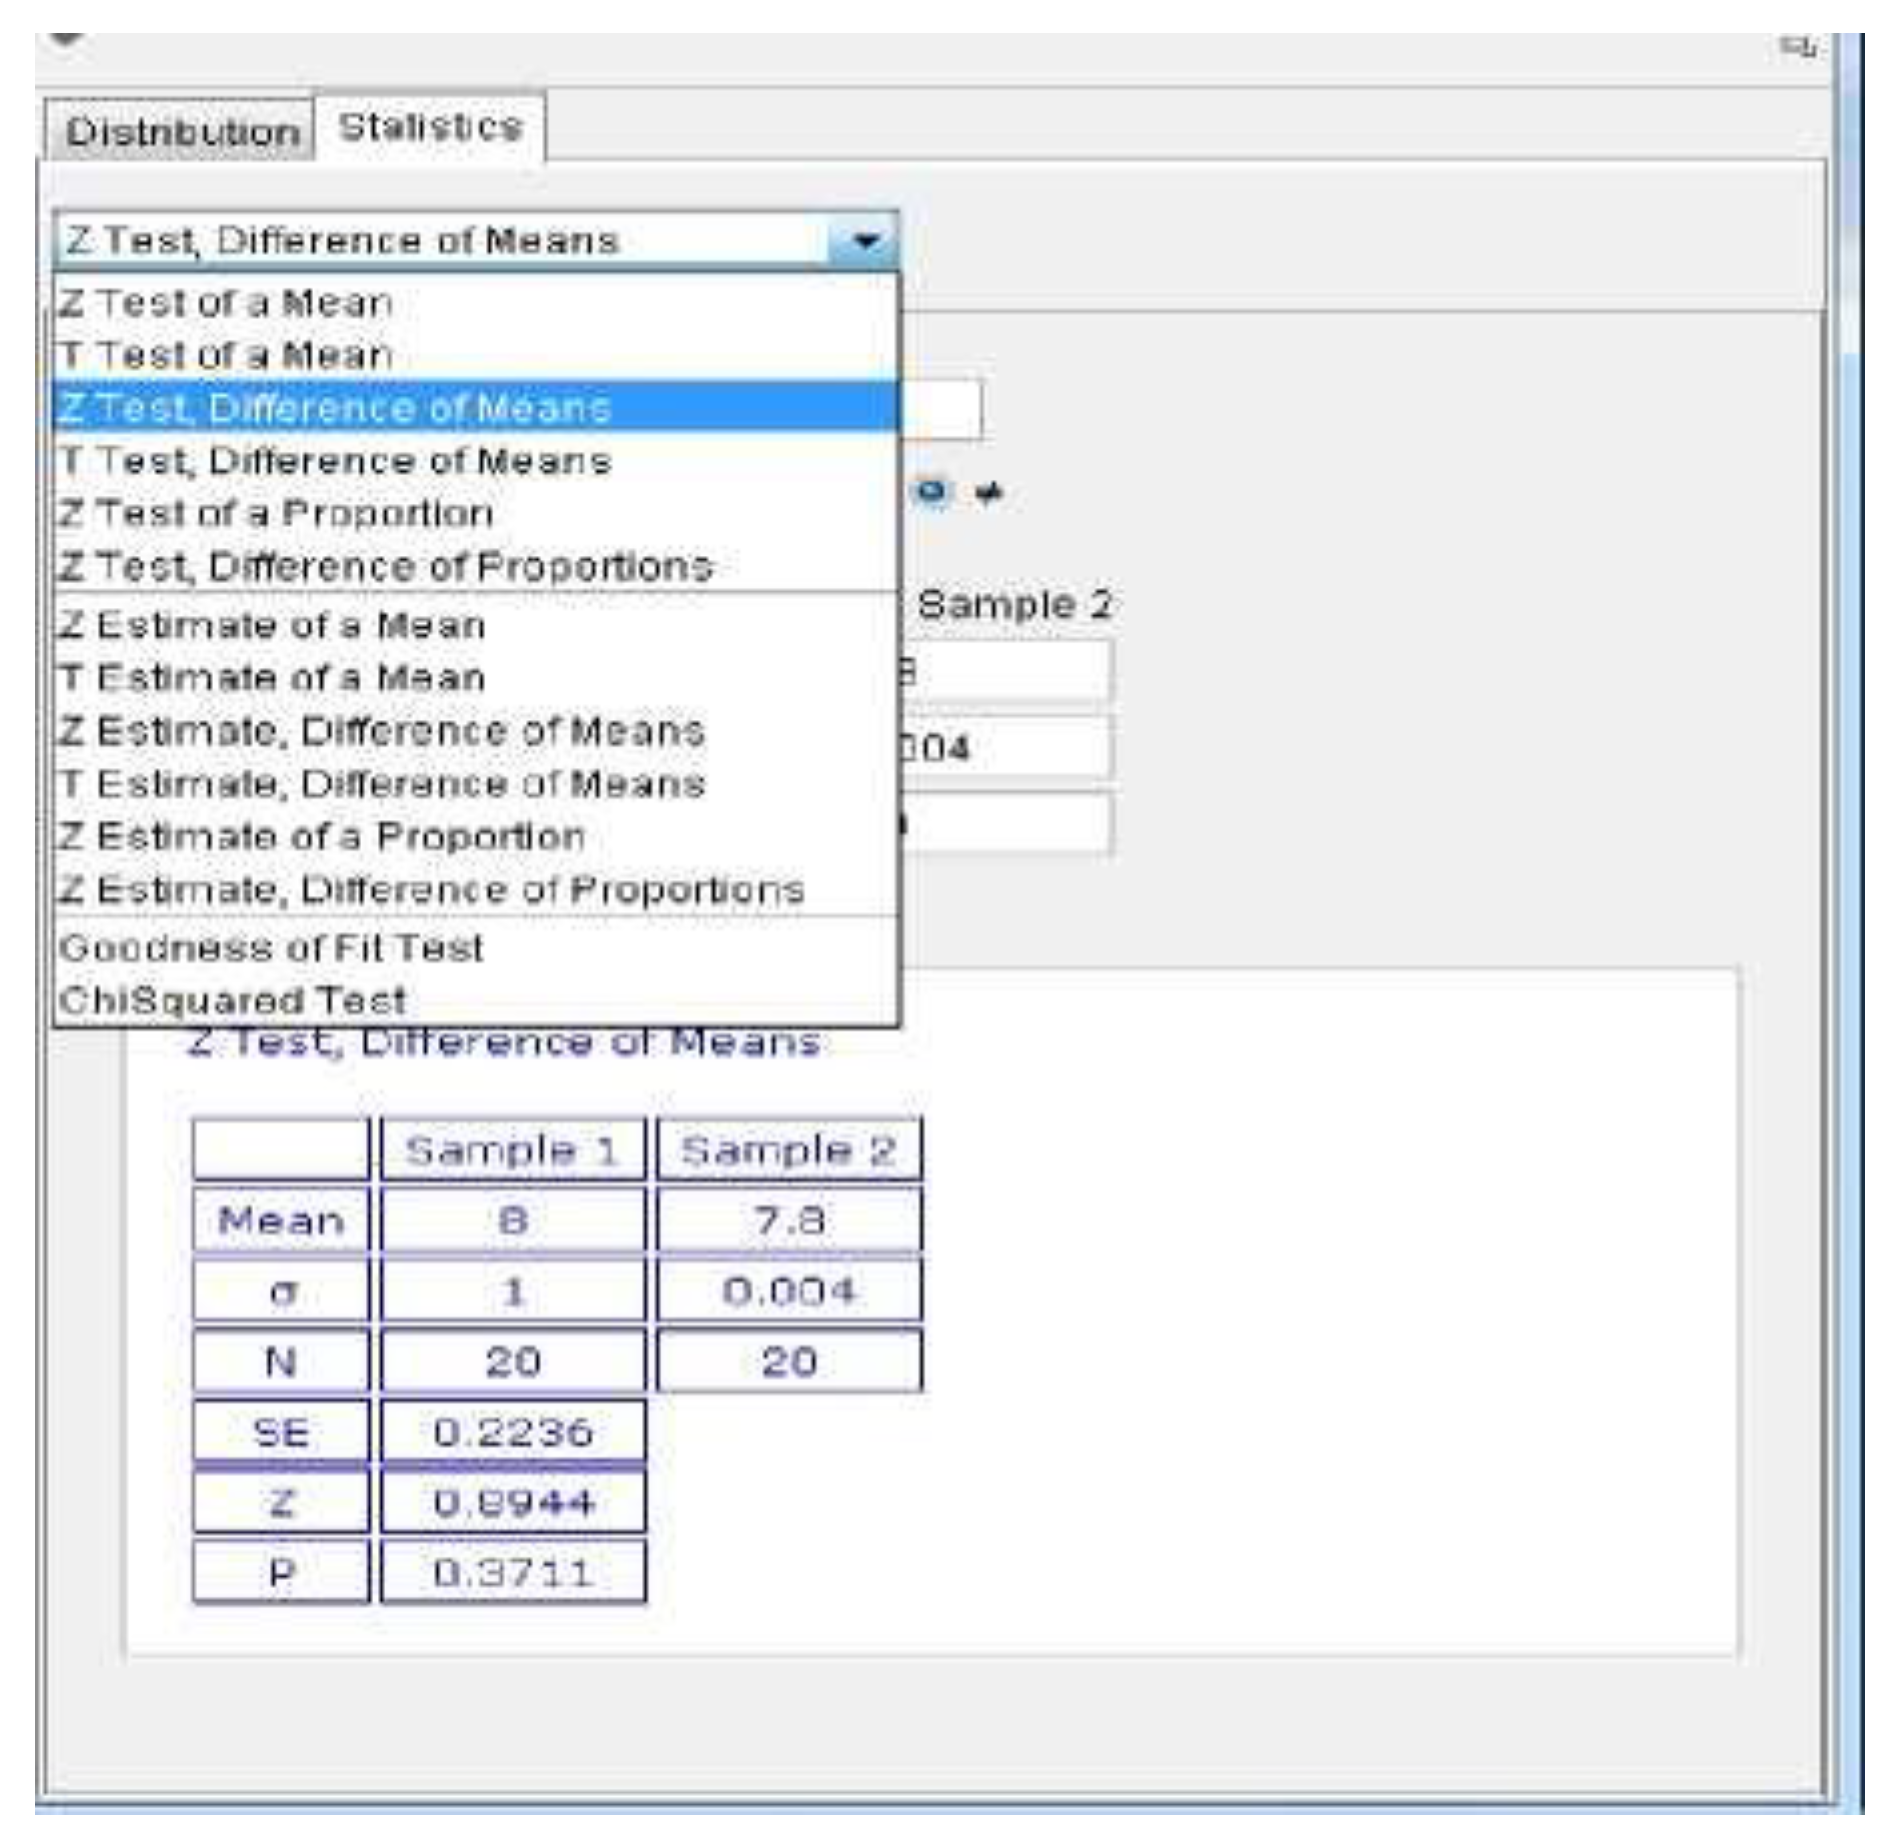
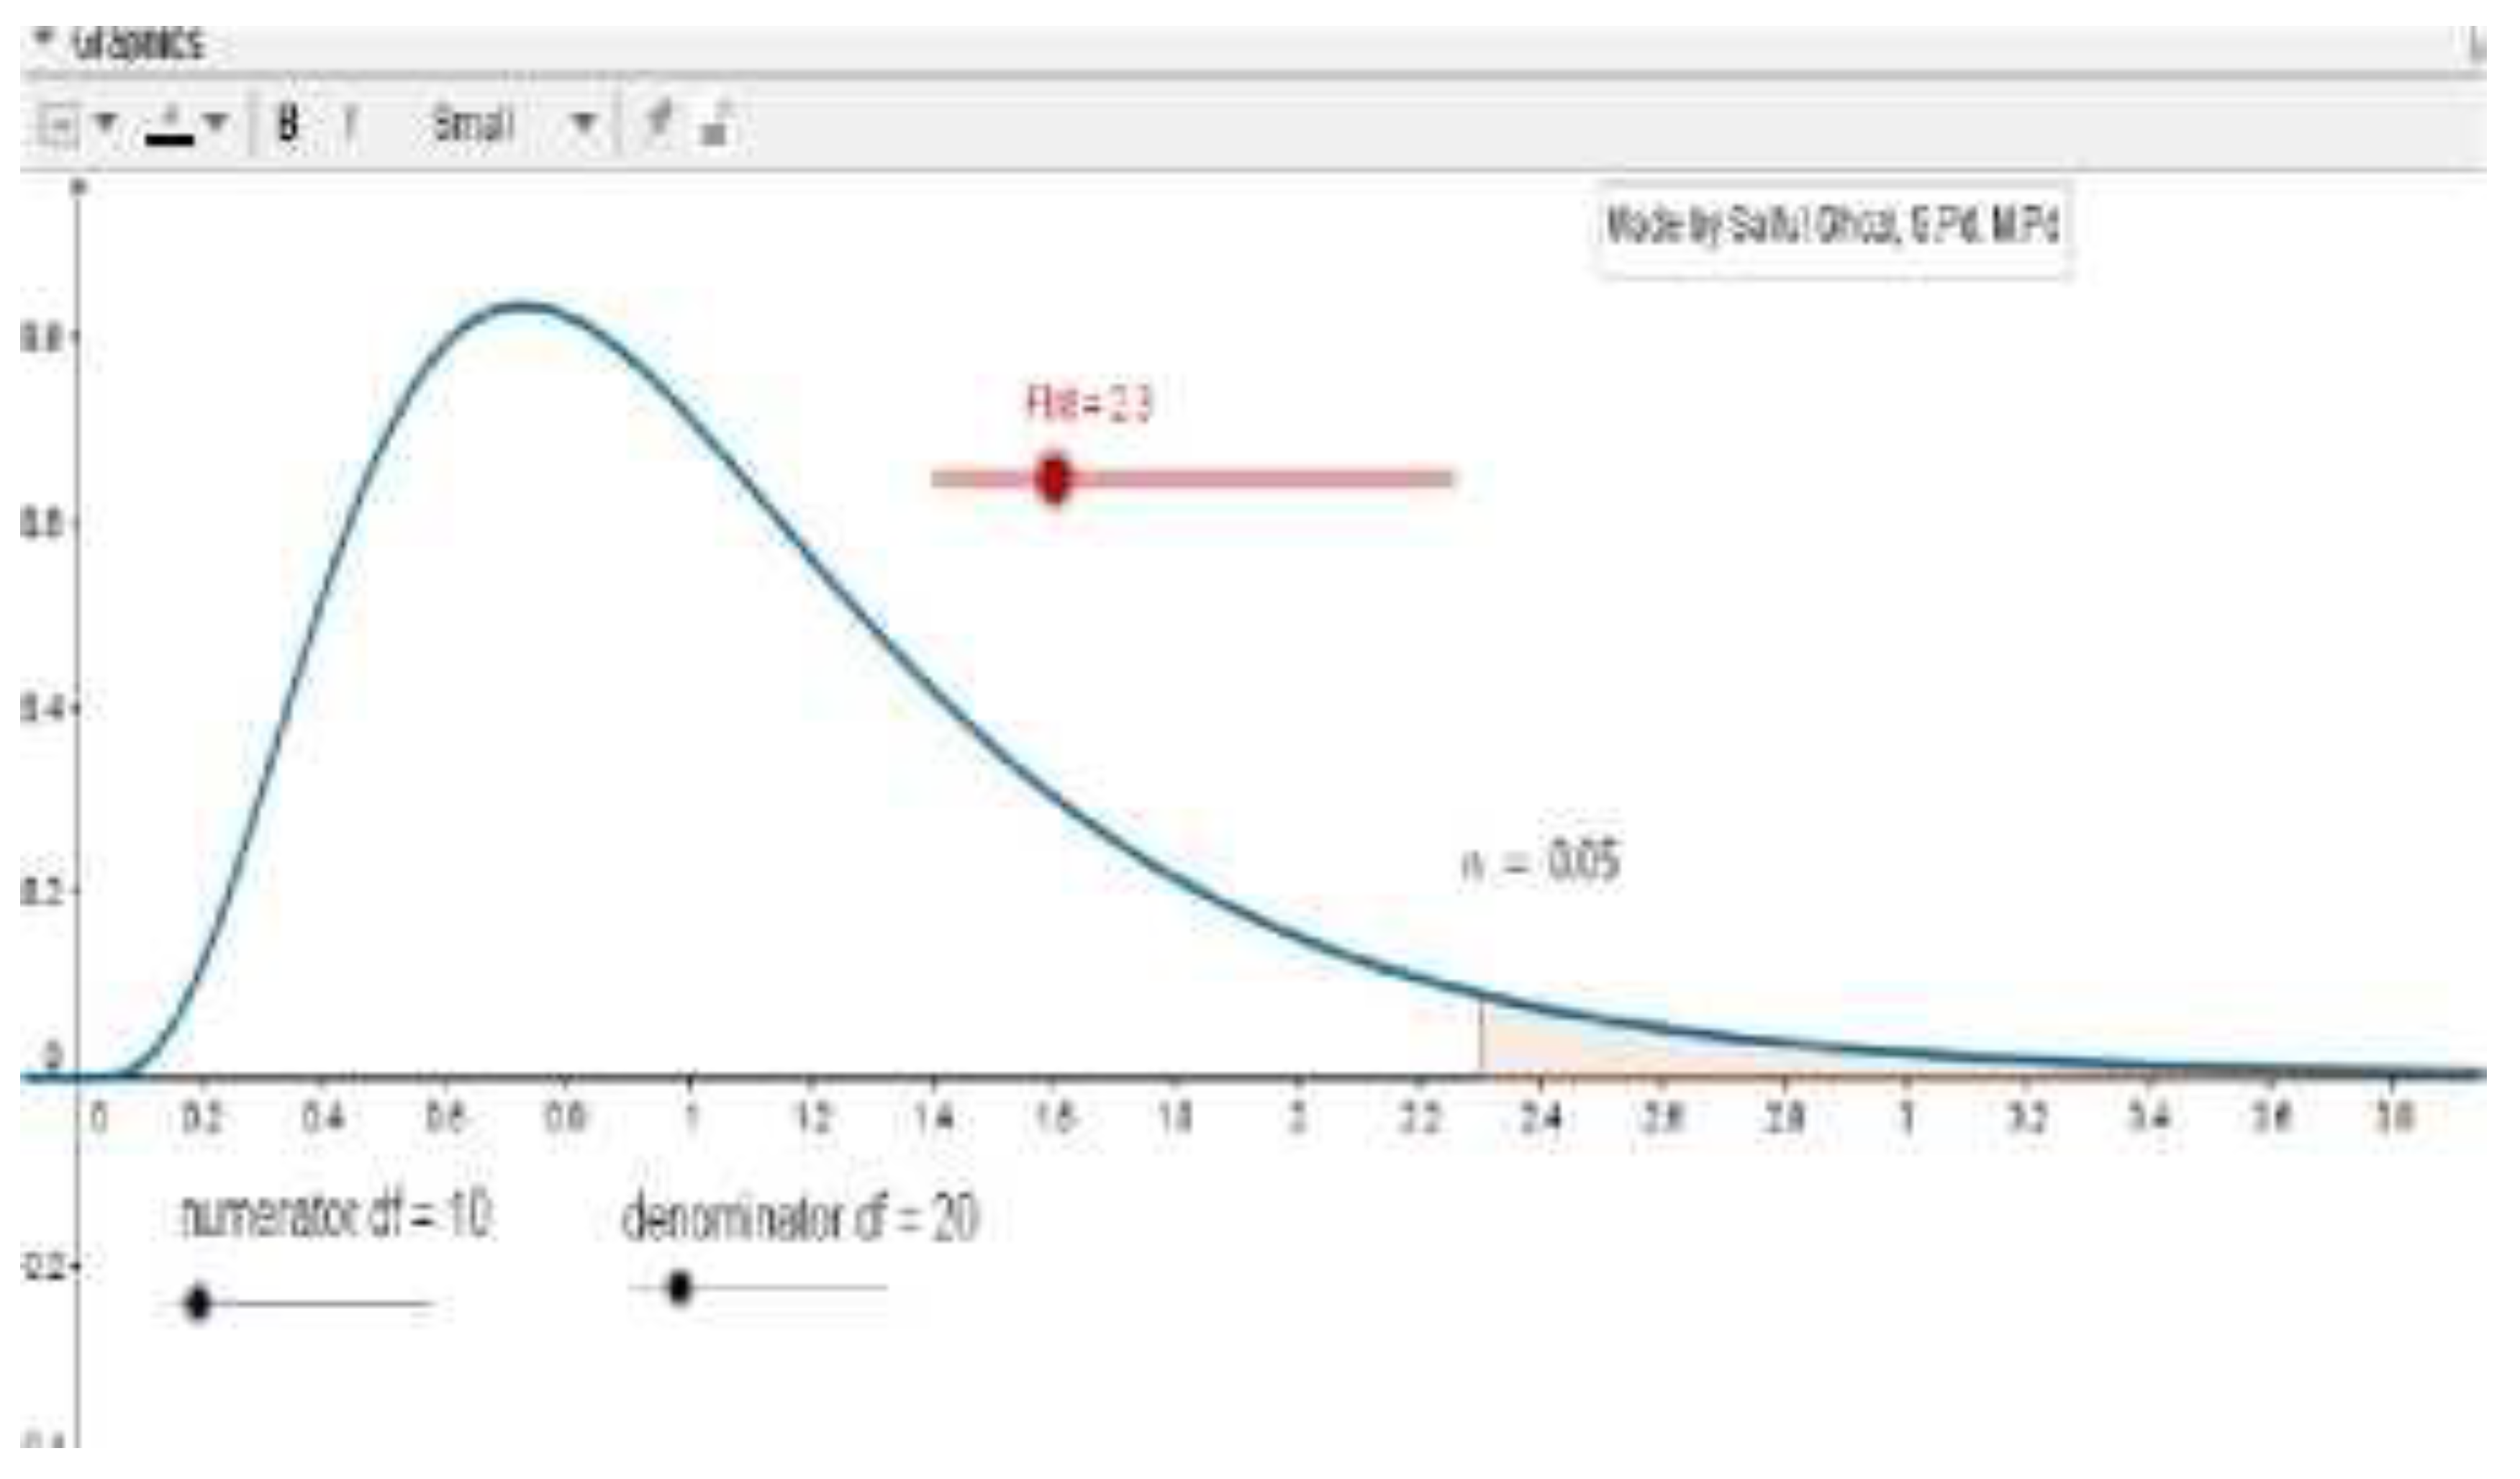
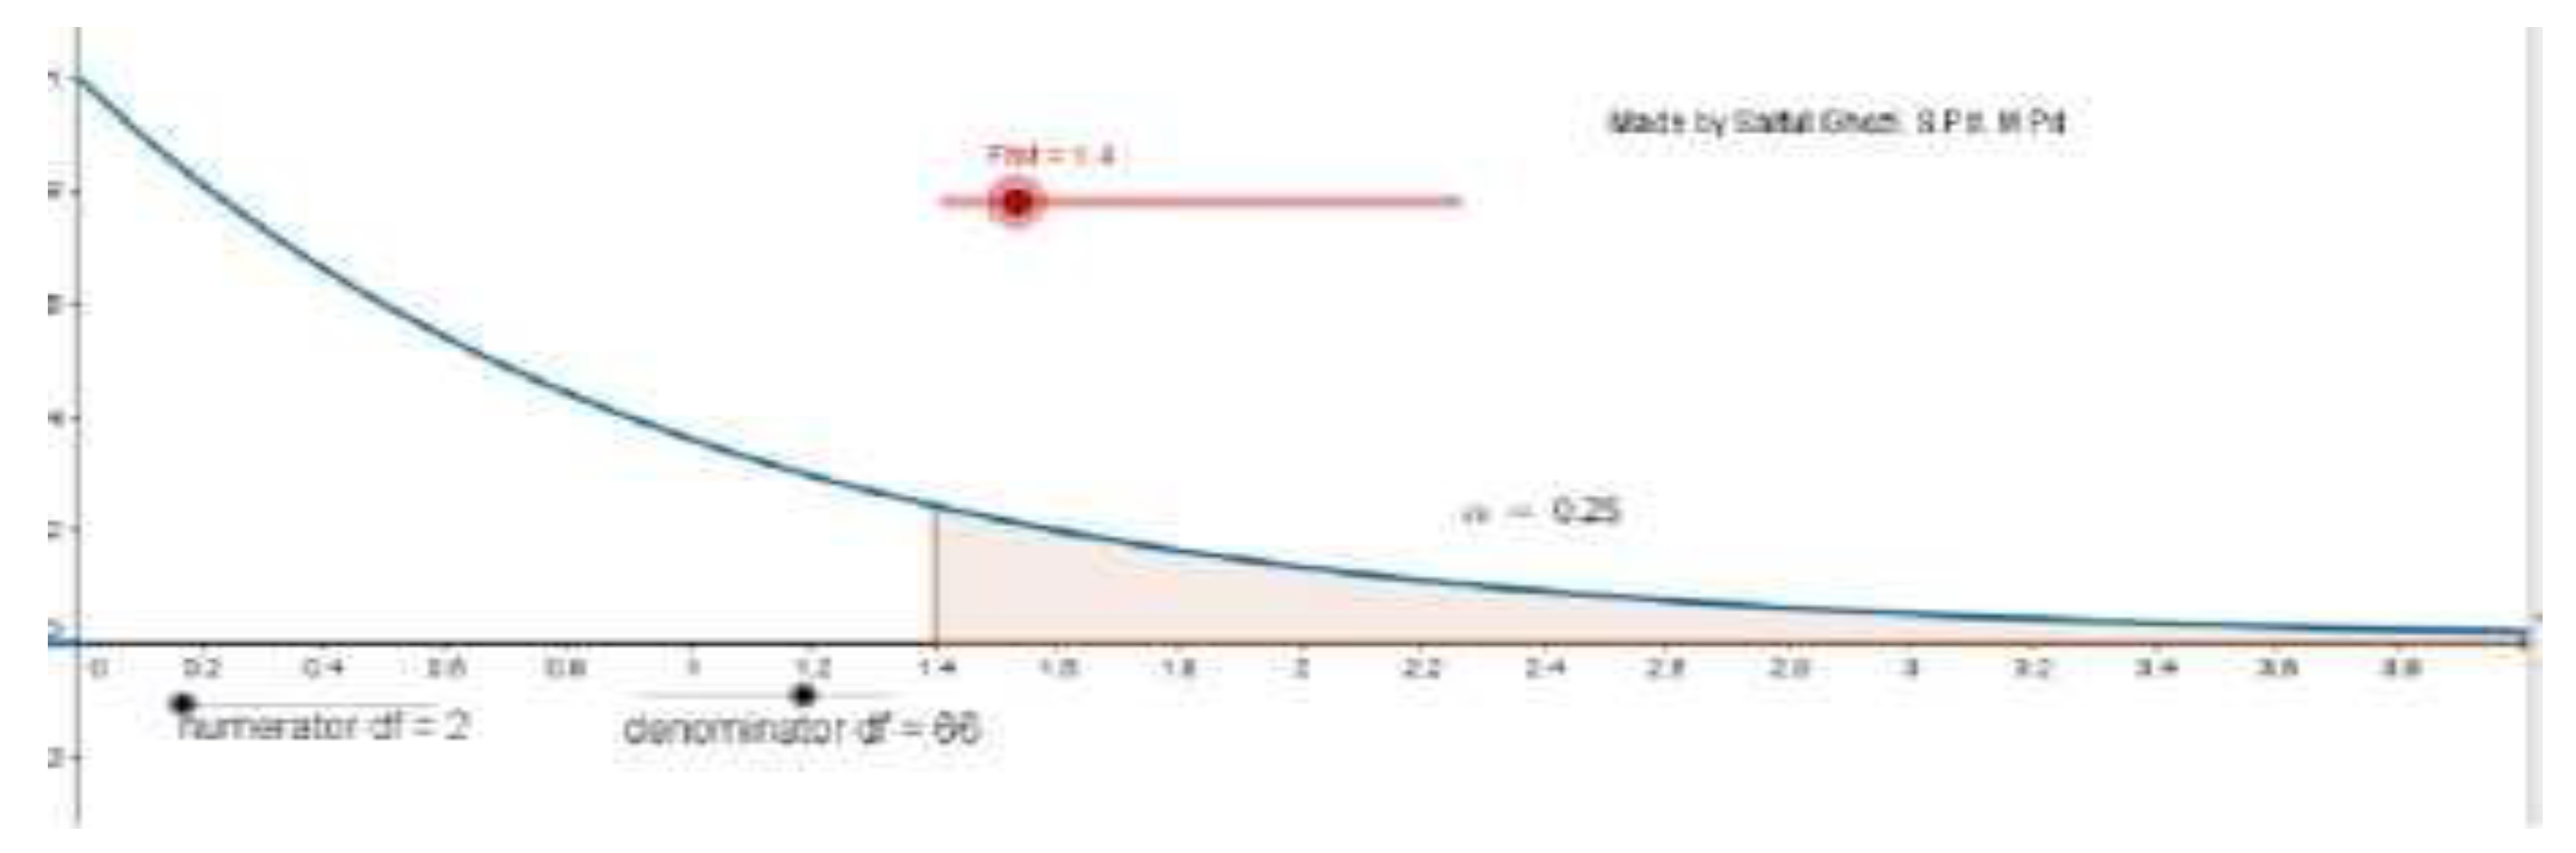
Disclaimer/Publisher’s Note: The statements, opinions and data contained in all publications are solely those of the individual author(s) and contributor(s) and not of MDPI and/or the editor(s). MDPI and/or the editor(s) disclaim responsibility for any injury to people or property resulting from any ideas, methods, instructions or products referred to in the content. |
© 2025 by the authors. Licensee MDPI, Basel, Switzerland. This article is an open access article distributed under the terms and conditions of the Creative Commons Attribution (CC BY) license (http://creativecommons.org/licenses/by/4.0/).
Copyright: This open access article is published under a Creative Commons CC BY 4.0 license, which permit the free download, distribution, and reuse, provided that the author and preprint are cited in any reuse.


