
Submitted:
14 October 2025
Posted:
14 October 2025
You are already at the latest version
Abstract
In the mines of the Karaganda Basin, in addition to methane, there are instances of intense hydrogen sulfide and sulfur dioxide emissions during coal seam extraction. Methane content in the extraction areas ranges from 25 to 38 m³/t. Consequently, degassing is applied in all extraction areas. Before degassing operations, methane is extracted from the unreleased coal seam. In seams exhibiting methane-hydrogen sulfide zones, the methane zone is prioritized for extraction, followed by the hydrogen sulfide zone.
The aim of the article is to determine the specific content of hydrogen sulfide and sulfur dioxide in seams D6 and D10 during the extraction of hydrogen sulfide zones in the Karaganda Basin mines, identify the causes of gas abundance in the seams, and determine the factors influencing the intensity of sulfur-containing gas emissions.
The article presents the results of research on the gas content of seams K10 and D6, based on a comparison of laboratory results obtained through coal sample analysis. It includes data on the natural gas content of seam K10, results from sampling and processing coal samples using DMT methodology, and actual gas emissions from seam K10 during its extraction at the Abai mine of ArcelorMittal Temirtau's coal department. For the first time in the Karaganda Basin, comprehensive studies of coal seam gas content and the impact of degassing on its magnitude have been conducted. Accurate knowledge of gas content is essential for designing seam extraction operations, including daily loads, ventilation parameters, degassing, and other factors dependent on methane content and its potential release during mining.
Keywords:
coal seams
; gas content
; gas richness
; degassing
; methane zone
; hydrogen sulfide zone
1. Introduction
The distribution of methane in coal seams follows the principles of gas statics, reflecting variations in the gas content of the rock mass due to factors such as porosity, gas pressure, temperature, natural moisture, gas permeability, stage of metamorphism, and other factors.
In an undisturbed rock mass, gas migration occurs, but gas dynamic processes are comparable to geological timescales, thus they are not considered in calculations. The mass contains gases of atmospheric origin (carbon dioxide, nitrogen, inert gases, etc.) that penetrate into the subsurface from the Earth’s surface, as well as gases from coal and rock metamorphism (methane, hydrogen, hydrogen sulfide, methane homologues, etc.) moving from the formation towards the Earth’s surface. As a result of diffusive movement of gases in different directions within the mass, nitrogen-carbon dioxide, nitrogen, nitrogen-methane, and methane zones are formed. The first three zones constitute a gas weathering area, which borders with the methane zone where methane content exceeds 80% and its pressure is above 0.1-0.15 MPa.
2. Analysis of Recent Research and Publications
The primary factors determining the gas content of coal-bearing strata include adsorption capacity, gas pressure, and gas permeability [4,5]. According to [6], the adsorption capacity of coal-bearing strata is defined by the primary gas content:
where: хaa, хfg—correspond to the amount of adsorbed and free gas, respectively; a, b—sorption constants; Р, Р1- gas pressure in the seam and at the Earth’s surface, respectively; mп- porosity; k—gas compressibility factor.
The main properties of the “coal-gas-liquid” system are its structure and sorption surface. These properties are determined by the particle sizes of coal and rocks, which range from 10-1 to 10-7 cm. The sorption surface of coal is influenced by molecular and colloidal systems with particle sizes of 10-5 to 10-6 cm. Adjacent to these are coarse-dispersed systems with particle sizes of 10-1 to 10-4 cm, and atomic systems with particle sizes less than 10-6 cm. Higher porosity in coal and rocks correlates with increased gas content. The sorption gas capacity of the mass largely depends on its moisture content, which reduces porosity and gas release. Additionally, the sorption gas capacity of the mass is influenced by gas pressure, which increases with depth. Different zones with varying gas pressure levels and characteristics are identified with increasing depth within the seam [6] (Figure 1).
In the first zone, gas pressure approaches hydrostatic pressure. In the second zone, located in the upper part of the methane zone, gas pressure exceeds hydrostatic pressure but remains below the static pressure of the rock formations. The third zone is situated in the deepest part of the methane zone, where gas pressure approaches the static pressure of the rock formations. The variation in gas pressure with depth follows the law calculated by G. D. Lidin [6].
where Н1- Depth of pressure measurement; Нo—Depth of the upper boundary of the methane zone В, v- Empirical coefficients
P=B(H1-Н0)v+Рo
Calculations show that gas pressure at achieved depths in coal basins of the CIS countries ranges from 3 to 5 MPa, and in some cases reaches 12 MPa or more. Indeed, experimental measurements of gas pressure in the D6 seam of the Karaganda Basin at depths of 450 to 500 m showed that it varies between 2 to 3.5 MPa.
The gas content of coal seams is determined by natural gas permeability, which depends on the conditions of seam deposition, the degree of seam exposure, and the duration of erosion cycles. There exists a quantitative relationship between formation pressure and gas permeability, expressed by equation [6]:
where k0—initial gas permeability; b—coefficient; е—the natural logarithm base
In natural conditions, the gas permeability of fossil coals depends on the macrostructure of the coal seam, the degree and nature of filling of the filtering volume of pores with natural moisture, the methane pressure gradient, and the characteristics of the manifestation of rock pressure.
In undisturbed coal formations, the filtering skeleton of coal exhibits high resistance and comparatively low permeability, hence the gas permeability of a coal seam largely depends on the integrity of the formation.
Regarding gas permeability, coal seams are classified into: highly permeable—λ > 2–3·10−3 mD; of medium permeability—λ = 1—2·10ˉ3 mD; low gas permeability—λ <1 · 10ˉ3 mD [2].
The gas permeability of coals in the main basins of CIS countries is 3 to 5 times higher than that of rocks. The gas permeability of the K18 seam in the Karaganda coal basin at depths of 400 to 500 m varies within 0.6- 0,9 ∙10-2 mD [7].
In Table 1, average values of gas permeability for the developed coal seams of the Karaganda Basin are presented [8].
In Table 2, calculated values of gas permeability changes with depth for the developed coal seams of the Karaganda Basin are provided by Akimbekov A.K. and Makhov A.A. from Karaganda Technical University (KarTU). The anisotropy coefficient for the seams in the Karaganda Basin ranges from 5 to 6. Comparative analysis of the data from Table 1 and Table 2 indicates a high reliability and consistency of the results.
The decrease in gas permeability with depth is described by equation (2). The highest values of gas permeability based on stratigraphy are found in the K12 seam and the valley suites D1, D5, and D6.
In the Kuzbass region, the depth of the gas-bearing zone ranges from 50 to 180 m, in the Donbas region from 50 to 500 m, in the Kizelovsk and Chelyabinsk basins from 300 to 600 m, and in the Pechora, Karaganda, and Tungus basins, as well as in the Sugan, Sakhalin Island, and Caucasus deposits, it ranges from 50 to 230 m. At these depths, the gas content of coal seams reaches 25 to 30 m3/ton, while the gas content of rocks is 4 to 6 m3/t [7].
Studies in recent years have established that the change in gas content of coal, rock, and gas permeability with depth is not unlimited. For instance, in the Donbas region, coal seam gas content peaks at a depth of 300 m, after which it decreases. In the Karaganda Basin, maximum gas content is observed at a depth of 500 m. The decrease in gas content with depth is attributed to the reduction in sorption capacity of the strata with increasing rock temperature; however, at these depths, gas content still amounts to tens of cubic meters per ton of coal.
The data above demonstrate that several factors influence the distribution of gas in coal seams, with gas pressure and permeability being primary among them. To calculate gas emission from a coal seam, it is essential to know the initial gas pressure and how it changes under the influence of mining activities. Studies have shown that when entering zones with increased static stress, the gas pressure curve flattens and changes from convex to concave. An empirical function describing gas pressure in a coal seam over time from its exposure until stabilization of stress-strain conditions can be determined using the formula [6]:
where Рх, Р0—the corresponding gas pressure at any distance from the exposed surface of the seam and the initial pressure in the seam, MPa; Р1—gas pressure at the exposed surface of the seam, MPa; x—depth to the surface of the seam, m; l(t)- depth of the seam unloading zone, m
Studies have shown that calculated values of gas pressure in a coal seam within the influence zone of mining operations, determined by formula (3), exhibit minor discrepancies compared to data obtained experimentally (see Figure 2).
The effectiveness of conducted degassing measures in coal seams is typically determined by the gas state of the coal mass (pressure, gas temperature, and gas content), its properties (permeability, porosity, gas yield capacity, gas storage capacity, etc.), coal structure, mining technology, and economic feasibility.
When seams with gas content of 15-20 m3/t are developed using high-productivity mining faces with daily loads exceeding 2000 t/day, significant delays between preparatory and mining works are observed. As a result, the time for preliminary seam degassing is reduced, potentially leading to gas-related downtime. Additionally, with increasing depth of mining operations, the natural gas release rate into degassing wells may not meet the required gas extraction levels. This is primarily due to low natural filtration and diffusion permeability, high gas storage capacity, and low porosity of coal compared to gas reservoirs.
Common patterns of methane content variation, as one of the primary characteristics of the gas state in a coal seam, include increasing gas content with the stratigraphic depth of the seam and with increasing degree of coal metamorphism. The relationship between gas content and the degree of metamorphism is complex. Coal seams with the highest gas content (up to 40 m3/t) are typically found in low metamorphic anthracites and semi-anthracites. Coals with volatile matter content ranging from 4.5% to 24% generally exhibit gas contents exceeding 20 m3/t. Gas contents ranging from 10 to 20 m3/t are observed in coals with volatile matter content between 4.5% to 14.5% and between 23% to 43% [5,6].
3. Research Methods
The depth of the coal seam significantly influences its gas content [7]. The methane content of coal seams in the Sherubainurinsky area increases with depth following a hyperbolic law (see Figure 3) and generally conforms to the Langmuir equation [4].
This graph likely illustrates how methane content varies with increasing depth in the K10 coal seam at the Sherubainurinsky site, showing both scenarios with and without accounting for sampling losses.
where Хг—natural methane content of dry ash-free coal mass, m3/t d.a.f.; W—Natural moisture content of coal, %; Аз—Ash content of coal, %.
Natural methane content of dry ash-free coal (Xg, m3/t d.a.f.) is determined by the expression [5]:
where Н—Depth of mining, m; H0—Depth of gas weathering zone, m; с and b—The coefficients of the Langmuir equation.
The meanings of the parameters in equations (4) and (5) are determined according to the “Classifier of Methane Content in Coal Seams of the Karaganda Basin,” taking into account refined parameters based on actual methane emission in the development workings, and for new fields, based on geological report data. The residual methane content of coal remaining in the mined space in unextracted blocks of the seam is determined by formula [5].
where Н—Residual gas content of dry ash-free coal mass at atmospheric pressure, m3/t d.a.f., is taken from Table 3.
If coal seams or closely associated layers were overlain or underlain before development, the natural methane content of the seam (X) is replaced in the calculation formulas by the residual methane content (X o.g.), the value of which is determined by formula (7).
With repeated overlying or underlying operations, the residual methane content is determined using the same formulas by substituting the value of Ho.g. instead of X after the previous overlying or underlying operation.
Based on the fact that the isotherm of coal gas capacity flattens at high methane pressures, it can be assumed that with increasing depth of occurrence, the rate of gas content increase slows down.
It has been established (I.M. Pechuk, L.N. Bykov, A.I. Pokrovsky, M.A. Yermekov, et al.) that methane pressure Pg in coal seams increases according to a law close to hydrostatic [6]:
Numerous measurements of gas pressure under mining conditions confirm this relationship.
Equation (5) reflects a gradual increase in gas pressure with depth of seam occurrence. However, practical observations have noted significant methane emissions from fluvial-type coal seams, indicating the presence of localized zones within the coal seam with anomalous increases in gas pressure and gas content compared to neighboring areas [6,7].
The calculated variation of natural gas content of the seam K10, taking into account ash content, is presented in Figure 4. When calculating, Langmuir coefficients c and b were taken as 0.265 and 0.0119 respectively. Ho—133 m, Az—25.4%, W—4.3% (Classifier of Methane Content in Coal Seams of the Karaganda Basin).
As seen in the figure, the variation in gas content is described by the equation.:
where Х—Natural gas content of the seam, considering moisture and ash content., m3/t; Н—Depth of seam occurrence, ms.; А, В, С—empirical coefficients, respectively equal to -0.00006, 0.0686, and 1.9857.
Х = AH2 + BH + C, m3/t
Practical gas content of coal seams can be determined by sampling from the coal mass and by recalculating gas abundance during mining operations in the seam.
At the “Special Mine Construction and Gasification Management” of ArcelorMittal Temirtau, there is a laboratory equipped with equipment from the German company DMT, which employs its methodology for sampling and preparing samples [12]. A specialized pneumatic drilling tool is used to drill holes through the seam. Coal samples are taken every 2 m and placed in sealed containers. The length of each borehole ranges from 20 to 22 m. In the laboratory, a gas analyzer is used to determine the amount of gas released from each sample container. The sample is then ground and the amount of methane released is determined again. Additionally, besides methane content, the lab determines its moisture, ash content, and volatile matter yield.
Based on the methane content from multiple samples taken at different depths, a resulting methane content curve of the coal is constructed [10]. This curve reflects the state of the coal mass. The coal mass directly adjacent to the excavation walls undergoes unloading and fragmentation into blocks, resulting in significant fracturing. In this zone, the gas content of the seam is minimal. As the distance from the excavation walls increases, the influence of unloading diminishes, and the block fragmentation zone transitions to a zone of less elastic deformation, with a gradual decrease in the number of fractures in the mass. In this zone, gas content increases. At a distance of 10-15 m from the excavation walls, where the influence of unloading on the mass is minimal, there exists a zone of elastic deformation, and the gas content approaches natural levels.
The results from coal sample collection from wells drilled at distances of 65 and 55 m from the mounting chamber 33K10-S of the “Abaiskaya” shaft confirm the previously described variations in gas content.
For the well drilled at a distance of 65 m:
- Total gas content of the coal: 19.3 m3/ton
- Gas content at 1 bar pressure: 2.8 m3/ton
- Desorbable gas: 16.5 m3/ton
For the well drilled at a distance of 55 m:
- Total gas content of the coal: 18.9 m3/ton
- Gas content at 1 bar pressure: 3.0 m3/ton
- Desorbable gas: 15.9 m3/ton
The gas content of the coal in the interval of the well from 2 to 4 m increases at a slow rate due to the formation of significant fractures resulting from unloading (block fragmentation). From 4 to 8 m, an increase in gas content is observed (zone of less elastic deformation, with a sharp reduction in the number of fractures). From 8 to 9 m, the growth curve flattens out, reaching its maximum in the zone of elastic deformation. The gas content of the K10 seam in the area of mounting chamber 33K10-S of the “Abaiskaya” shaft at a depth of 520 m ranges from 18.9 to 19.3 m3/ton.
At the “Abaiskaya” mine, work was conducted to determine the gas content of the K10 seam in the southern block. The depth of the seam at the sampling location was 435 m. Samples were taken from a borehole drilled through the seam using the SBG-1M machine at depths of 38, 40, and 42 m. Research results indicate that in the nearly undisturbed mass within 38-42 m from the borehole mouth, the gas content remains constant. Variations may occur in zones affected by geological disturbances, increased rock pressure, and other factors. The total gas content was 14.5 m3/ton, gas content at 1 bar pressure was 2.7 m3/ton, and desorbable gas was 11.8 m3/ton.
The variation in gas content characteristics with distance from the mining walls is determined by properties of the coal mass such as plasticity, moisture content, fracturing, degree of unloading, among others.
For example, at the T. Kuzembayev mine, coal samples were collected from the paired development in ventilation heading 37K10-B of the K10 seam. Processing results showed that at a depth of 570 m, the gas content of the K10 seam steadily increases to its maximum value, indicating that block fragmentation is practically absent or occurs within 2 m from the mining wall. The zone of less elastic deformation extends from 2 to 10 m. From 10 to 21 m, there is a zone of elastic deformation where no fracturing occurs, and the gas content of the coal mass remains nearly unchanged. The total gas content of the seam at this depth is 17.2 m3/ton, gas content at 1 bar pressure is 2.7 m3/ton, and desorbable gas is 14.5 m3/ton.
If a straight line is drawn through a point within the zone of elastic deformation, the tangent of its slope angle characterizes the state of the coal mass as a whole. Specifically, a higher tangent indicates that the mass is less susceptible to deformation and fracturing, whereas a lower tangent suggests that the mass has undergone more significant changes.
Natural gas content of coal seams can also be determined by measuring the amount of methane released during their extraction.
At the “Abaiskaya” mine, from May 2011 to February 2012, mining operations were conducted in the southern wing of the K10 seam using the 321k10-S roadway. The ventilation roadway 321k10-S was located at a depth of 540 m, while the conveyor roadway 321k10-S was at a depth of 480 m. The thickness of the seam being extracted was 3.2 m. According to the classification, the calculated gas content of the K10 seam ranged from 16.2 to 16.9 m3/ton.
During the operation of this area, 74.8 million cubic meters of methane were extracted through ventilation means, alongside a total coal production of 629 thousand tons. Additionally, 40.2 million cubic meters of methane were captured through pre-drainage and advance degassing wells. Consequently, when the methane released from the mined coal into the ventilation stream and degassing wells is divided by the total coal production, the relative gas content of the mining area amounts to 14.6 m3/ton.
The results of the research [13] showed that approximately 80% of methane contained in coal is released due to mechanical destruction during the operation of the mining machine, while about 20% remains in a bound state. Therefore, the gas content of the K10 seam can be estimated on average at 17.5 m3/ton. However, the method of calculating the natural gas content of seams based on the amount of methane released provides a highly averaged value, as it is challenging to accurately account for the exact amount of methane released from the extracted part of the seam, unextracted part of the seam, mined coal, and surrounding rocks.
From September 2012 to December 2013, mining operations were conducted on the northern block of the K10 seam using the 33k10-S roadway at the “Abaiskaya” mine.
The ventilation drift was conducted at a depth of 470 m, and the conveyor drift at 540 m. The calculated gas content of the seam was 16.3–16.9 m3/ton. During the operation of the seam, 1.15 million tons of coal were extracted, with 112.5 million m3 of methane extracted by ventilation means, and 4.6 million m3 captured by seam degassing wells. Thus, the relative gas content of the extraction area was 6.5 m3/ton. Considering that 20% of the gas remains in the coal, the average gas content of the seam was 7.8 m3/ton.
It should be noted that the absolute gas content of the extraction areas reached 140 m3/min with a load on the seam of approximately 3000 tons/day. However, the degassing methods employed at the mine ensured the necessary level of methane emission reduction from the mine workings.
Studies to determine the specific content of hydrogen sulfide and sulfur-containing gases in the seams during the extraction of hydrogen sulfide zones in the Karaganda Basin mines were conducted under laboratory conditions using coal samples from the d6 and d10 seams.
Samples of coal were collected from hydrogen sulfide zones with freshly exposed surfaces of the breast of the longwall panels 264-d6-1B, 274-d6-1B, 134-d6-2B, 254-d6-2B, 284-d6-1B at the “Kazakhstanskaya” mine and 316-d6-C at the “Molodezhnaya” mine at depths of 0.4–0.5 m into hermetically sealed glass bottles with a capacity of 0.5 L.
It should be noted that sulfur-containing gases are almost not released from coal at temperatures of 18–22 °C under vacuum conditions.
To initiate gas release, the coal samples were heated to 90–100 °C. Subsequently, the measurement of hydrogen sulfide released and the determination of gas content were conducted using the GH-4 apparatus according to the methods of the Central Research Institute for Mining and Fuel Research (McNII) and the Eastern Scientific Research Institute (VostNII) [14,15].
In laboratory conditions, it was found that hydrogen sulfide was completely pumped out from the coal samples of layer d6 within 3.1–4.7 days. Actual data from the analysis of coal samples taken from layer d6 of the “Kazakhstanskaya”, named after V.I. Lenin, and “Molodezhnaya” mines are presented in Table 4 [16].
As seen from Table 4, the gas content varies significantly among these results. Particularly notable for higher gas content are the coal samples from the “Kazakhstanskaya” mine (lava 274-d6-1B). The coal seam d6, developed at the named after V.I. Lenin mine, shows lower gas content. In all cases, gas content is not influenced by the dip angle, seam thickness, or depth of mining.
Laboratory studies of gas content in seams d6 and d10 yielded the following results. During artificial degassing and sample heating, 0.0001 m3/ton of hydrogen sulfide was released. Conversely, spontaneous combustion tendencies were observed without heating.
The highest hydrogen sulfide concentration was recorded on April 4, 1983, during the excavation of conveyor roadway 134-d6-2B. Its concentration in the mine atmosphere reached 1000 mg/m3.
In November 1983, during the excavation of conveyor roadway 284-d6-1B, hydrogen sulfide emission from the extracted coal was detected. The hydrogen sulfide zone extended over 150 m. The concentration of hydrogen sulfide ranged from 0.5 to 25 norms, exceeding safety regulations by 25 times.
It should be noted that in most cases, the gas content isolines are nearly parallel to the gas yield isolines. However, the latter significantly depend on the mining method adopted, the type of mining machinery used, and the loading onto the conveyor of the rock mass.
4. Results
Geometric modeling of hydrogen sulfide gas content and gas yield isolines at the “Kazakhstanskaya” mine, based on the mining area of the eastern lava 274-d6-1B, is grounded on experimental-statistical data from the KarPTI (Karaganda Polytechnic Institute) spanning from 1983 to 1985.
By the end of 1983, initial signs of hydrogen sulfide appeared in the eastern lava 274-d6-1B. During this period, the lava, equipped with a high-performance mechanized complex OKP-70 with the KSh-ZM combine, occasionally produced coal output of up to 2600 tons per day against a planned target of 1410 tons per day.
Upon retreat from the installation (starting) chamber, at a distance of 230 m, intense hydrogen sulfide emission was observed during coal extraction and transportation. The extent of the hydrogen sulfide zone in this section ranged from 120 to 250 m, with H2S concentrations fluctuating between 1 and 55 norms depending on the gas content of the seam and the mining regime implemented [16].
The main factors determining the gas content in coal seams are sorption capacity, gas pressure, and gas permeability. Gas content increases with depth following a hyperbolic law. As depth increases, the rate of gas content growth slows down.
The natural gas content of coal seams can be determined by sampling and dividing coal samples using the DMT method, which allows for assessing changes in the stress-strain state of the mass based on variations in gas content in boreholes drilled through the coal seam. It has been established that the natural gas content of the K10 seam in the “Abayskaya” mine’s northern wing is slightly higher than that in the southern wing (18-19 m3/ton compared to 14.5 m3/ton), while the gas yield from the K10 seam in the southern wing significantly exceeds that of the northern wing.
For planning cleaning operations, the “Classifier.” can be utilized. However, to detail potential gas emissions in the cleaning faces, coal samples must be collected along the entire length of the conveyor roadway.
5. Conclusions
Results the gas yield of the lava is largely determined by both the gas content of the seam in a chemisorbed state of hydrogen sulfide and the intensity of sulfur-containing gas emissions, depending on the method of breaking up the rock mass and loading it onto the conveyor:
- the gas content of the seam depends on the physico-chemical properties of the coal mass, its condition influenced by mining and technical factors, as well as the physico-chemical properties of sulfur-containing gases.
- isolines of gas content and gas yield exhibit different patterns of divergence, which can be explained by the influence of various factors during the development of the coal seam.
These findings highlight the complex interactions between gas content, gas yield, and various mining practices, essential for understanding and managing coal seam development effectively.
Acknowledgments
the writing team expresses their gratitude to colleagues who helped to perform mathematical modeling. Particular gratitude should be expressed to the editors and reviewers of the journal for their valuable advice taken into account to improve the quality of the publication.
References
- Drizhd, N.A. , Kamarov R.K., Akhmatnurov D.R., Zamaliyev N.M. Coal bed methane Karaganda basin in the gas balance of the Republic of Kazakhstan: status and prospects, Naukovyi visnyk Natsionalnoho hirnychoho universytetu. 2017. №1, p. 12-20 (in English). http://nvngu.in.ua/index.php/en/component/jdownloads/finish/66-01/8600-01-2017-drizh.
- Kamarov RK, Akhmatnurov DR, Mussin RA, Zamaliyev NM.Setting the volume and location of the gas collectors of abandoned coal mines. Naukovyi Visnyk Natsionalnogo Hirnychoho Universytetu, Dnepropetrovsk. 2018; 2:5-11. http://www.nvngu.in.ua/jdownloads/pdf/2018/02/NVNGU02_2018_Kamarov-1.pdf.
- Physicochemical effects on sulfur-containing gases during underground mining operations: Monograph / N.A. Drizd, R.K. Physicochemical effects on sulfur-containing gases during underground mining operations: Monograph / N.A. Drizd, R.K. Kamarov, T.K. Isabek, V.S. Portnov. - Karaganda: Publishing house of KarSTU, 2013. - 186 p.
- Khari, M. , Dehghanbandaki, A. and Armaghani, D.J. (2021), “Physical modelling of bending moments in single piles under combined loads in layered soil”, Geomech. Eng., 25(5), 373-381. [CrossRef]
- Drizhd NA, Mussin RA, Alexandrov A Ju. Improving the Technology of Hydraulic Impact Based on Accounting Previously Treated Wells. International science and technology conference Earth science. IOP Conf. Series: Earth and Environmental Science. 2019; 272: 022031. IOP Publishing. https://iopscience.iop.org/article/10.1088/1755-1315/272/2/022031/pdf.
- Mihajlov, V.A. , Unconventional sources of hydrocarbons of Ukraine. In: Coalbed methane, gas hydrates, impact structures and superimposed depressions of the Ukrainian shield, Kiev: Nika-Tsentr - 2013.
- Dumenko, S.S. Priority objects for gas exploration within Donbas, Naukovyi visnyk Natsionalnoho hirnychoho universytetu, No. 6, 2014. pp. 28‒32. http://nvngu.in.ua/index.php/en/archive/on-the-issues/1008-2014/contents-no-6-2014/geology/2855-priority-objects-for-gas-exploration-within-donbas.
- Xu, S. , Liang, R., Suorineni, F.T., Li, Y. Evaluation of the use of sublevel open stoping in the mining of moderately dipping medium-thick orebodies (2021) International Journal of Mining Science and Technology, 31 (2), pp. 333-346. http://www.elsevier.com/wps/find/journaldescription.cws_home/727915/description#description. [CrossRef]
- Wu, J. Research on sublevel open stoping recovery processes of inclined medium-thick orebody on the basis of physical simulation experiments (2020) PLoS ONE, 15 (5), art. no. e0232640. https://journals.plos.org/plosone/article/file?id=10.1371/journal.pone.0232640&type=printable. [CrossRef]
- Ivadilinova, D.T. , Issabek, T.K., Takhanov, D.K., Yeskenova, G.B. PREDICTING UNDERGROUND MINING IMPACT ON THE EARTH’S SURFACE (2023) Naukovyi Visnyk Natsionalnoho Hirnychoho Universytetu, (1), pp. 32-37. http://www.nvngu.in.ua/index.php/en/archive/on-the-issues/1890-2023/content-1-2023/6475-32. [CrossRef]
- Zepeng W, Zhaolong G, Ruihui L, Haoming W, Shihui G. Effects of acid-based fracturing fluids with variablehydrochloric acid contents on the microstructure of bituminous coal: An experimental study.Energy.2022; 244(PA). [CrossRef]
- Zou G, Zhang Q, Peng SJin C, Che Y.Influence of geological factors on coal permeability in the Sihe coal mine. 2022; 9(6).International Journal of Coal Science and Technology. [CrossRef]
- Solar, J. Sizing the thickness of the coated insulation against methane leakage coming out of bedrock. Applied Mechanics and Materials. 2014. [Google Scholar] [CrossRef]
- Plaksin M S and RodinR, I. Improvement of degasification efficiency by pulsed injection of water in coal seam. IOP Conf. Ser.: Earth Environ. Sci. 2019; 377:012052. [CrossRef]
- Chen L, Wang E, Ou J,et al. Coal and gas outburst hazards and factors of the No. B-1 Coalbed, Henan, China. Geosci J. 2018; 22:171-182. [CrossRef]
- Oleksandr Inkin, Volodymyr Tishkov, Nataliia Dereviahina and Vadym Sotskov.Integrated analysis of geofiltrational parameters in the context of underground coal gasification relying upon calculations and modeling.Ukrainian School of Mining Engineering. 2018. [CrossRef]
Figure 1.
Graph showing the relationship between gas permeability k of coal seams and gas pressure P as a function of depth of mining operations Hm: 1—hydrostatic pressure; 2—static pressure of rock formations; 3—methane pressure in coal seams; 4—gas permeability of coal seams; Zones I, II, III—zones of pressure and gas permeability variation.
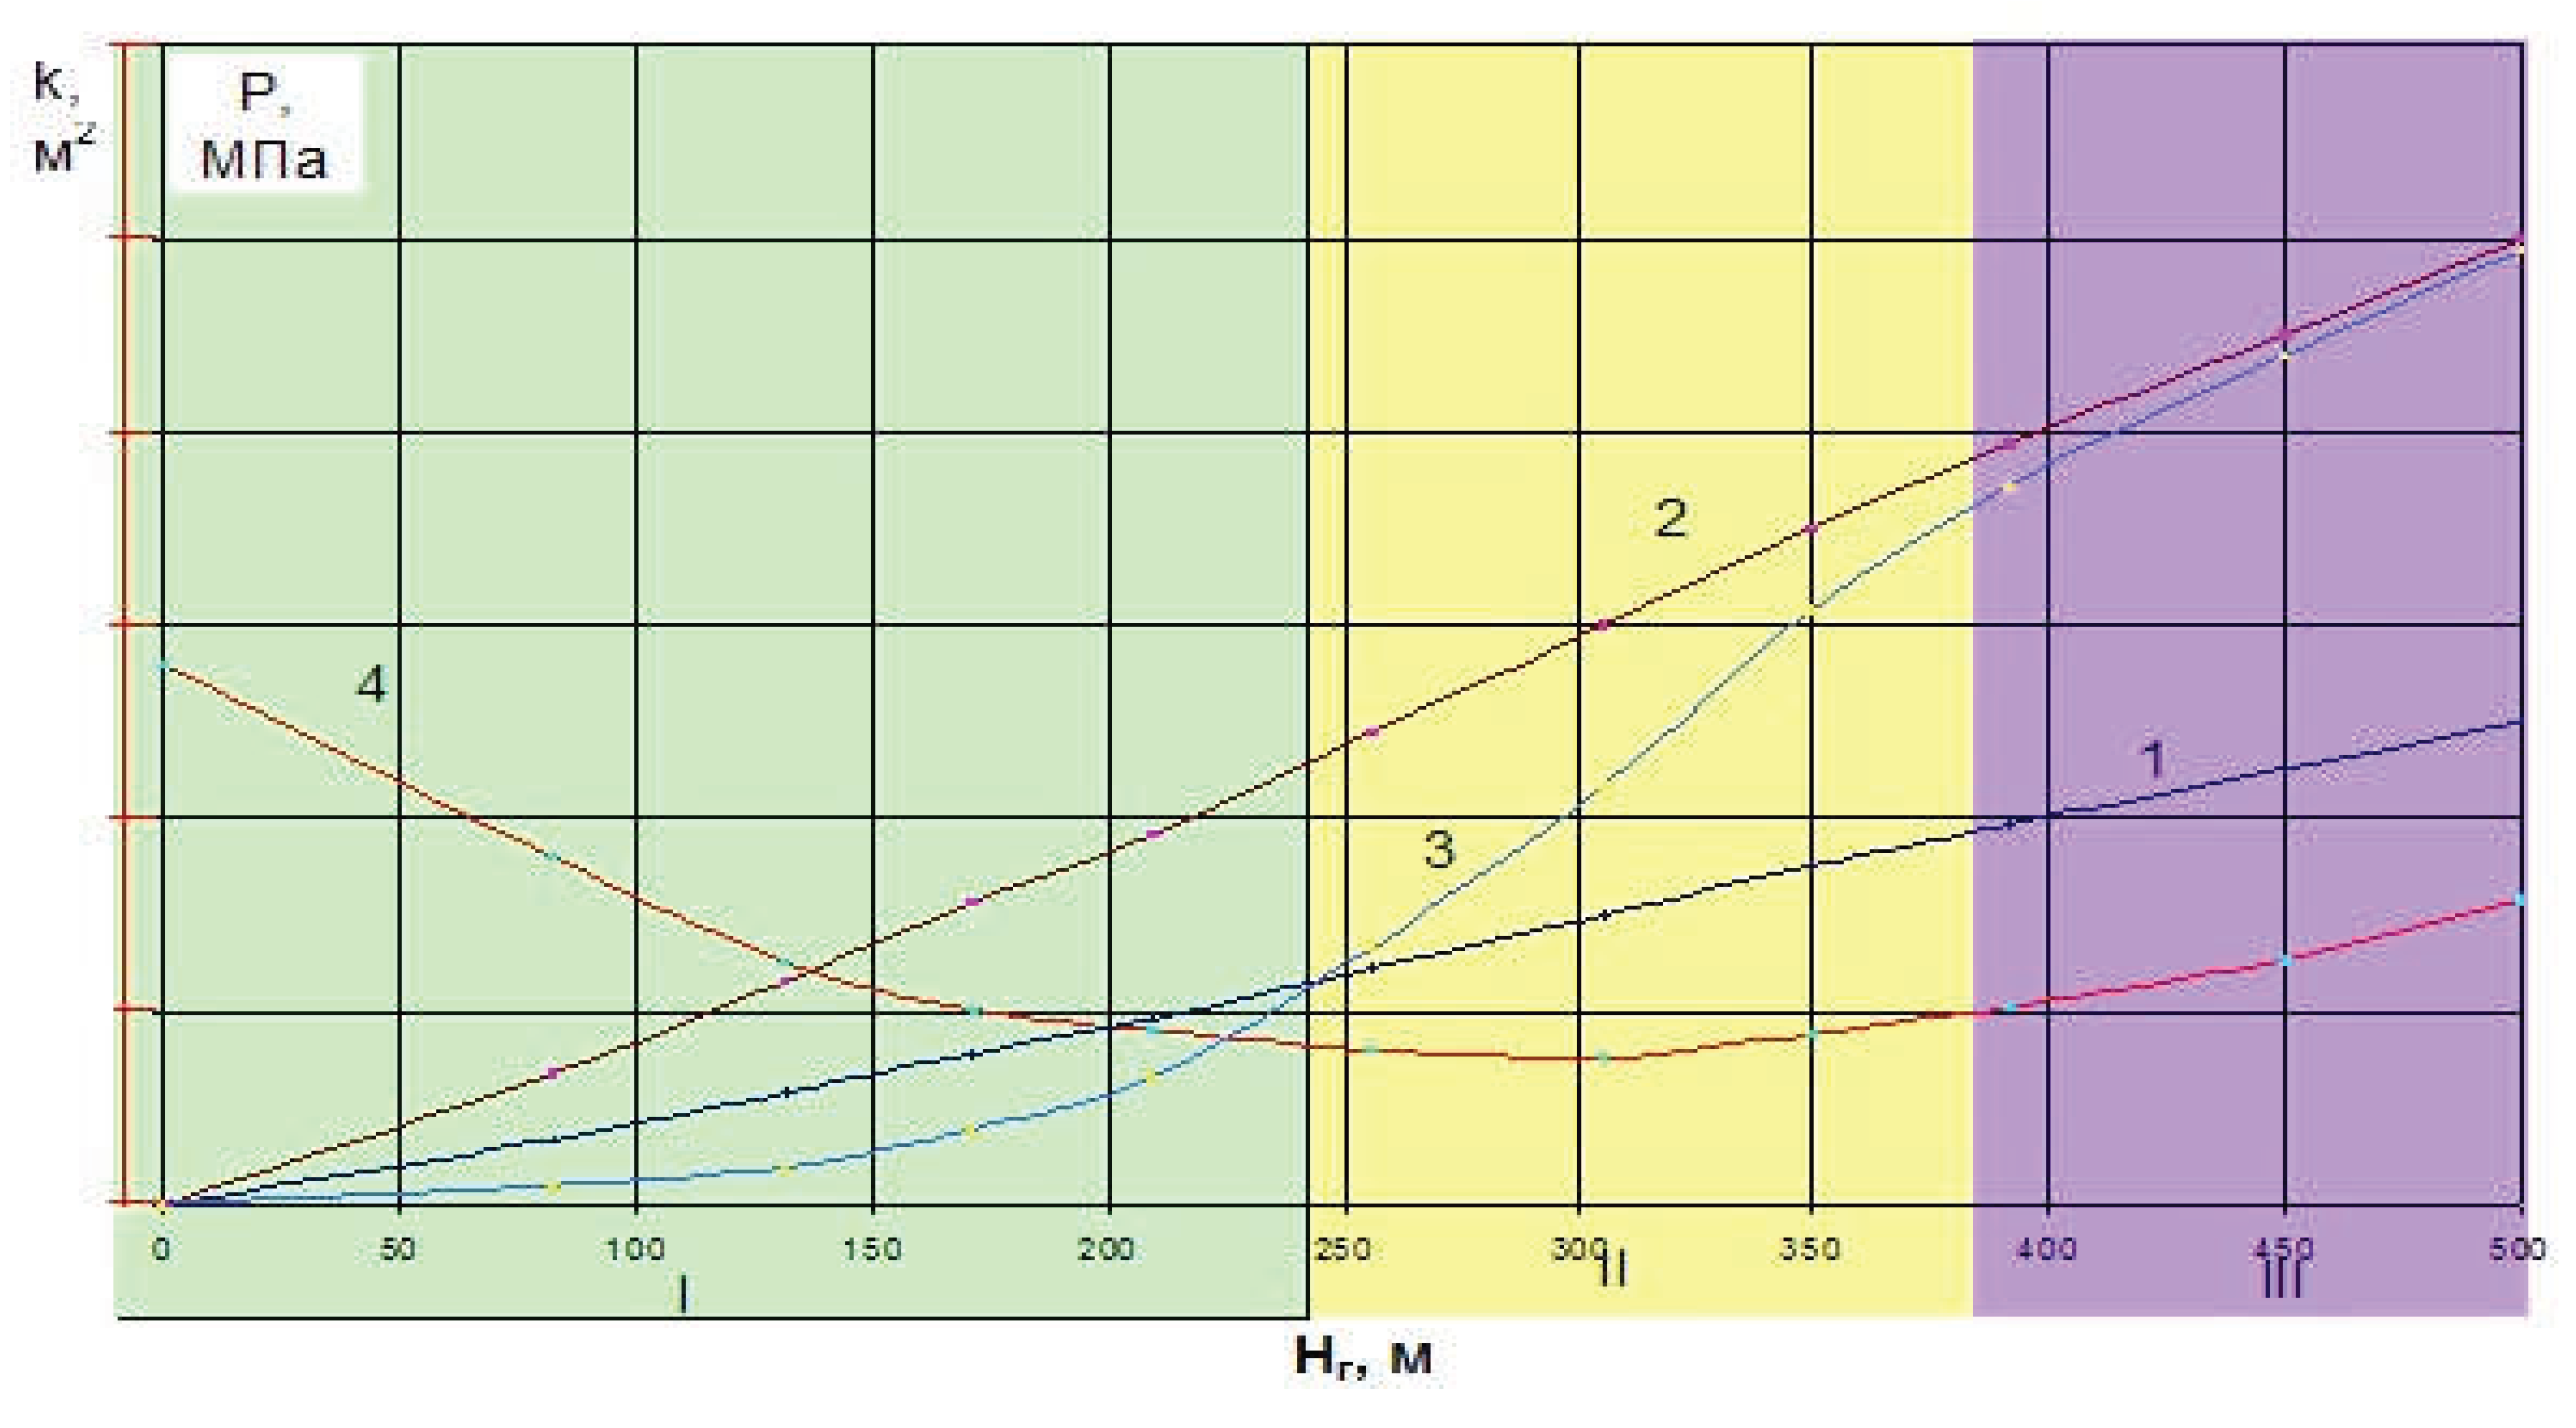
Figure 2.
Graph showing the dependence of gas pressure P in the developed coal seam on the distance x to the face, considering the rheological properties of the rocks (solid lines—at the moment of seam exposure, dashed lines—at the moment of deformation damping). 1, 2, 3, 4—different seams.
Figure 2.
Graph showing the dependence of gas pressure P in the developed coal seam on the distance x to the face, considering the rheological properties of the rocks (solid lines—at the moment of seam exposure, dashed lines—at the moment of deformation damping). 1, 2, 3, 4—different seams.
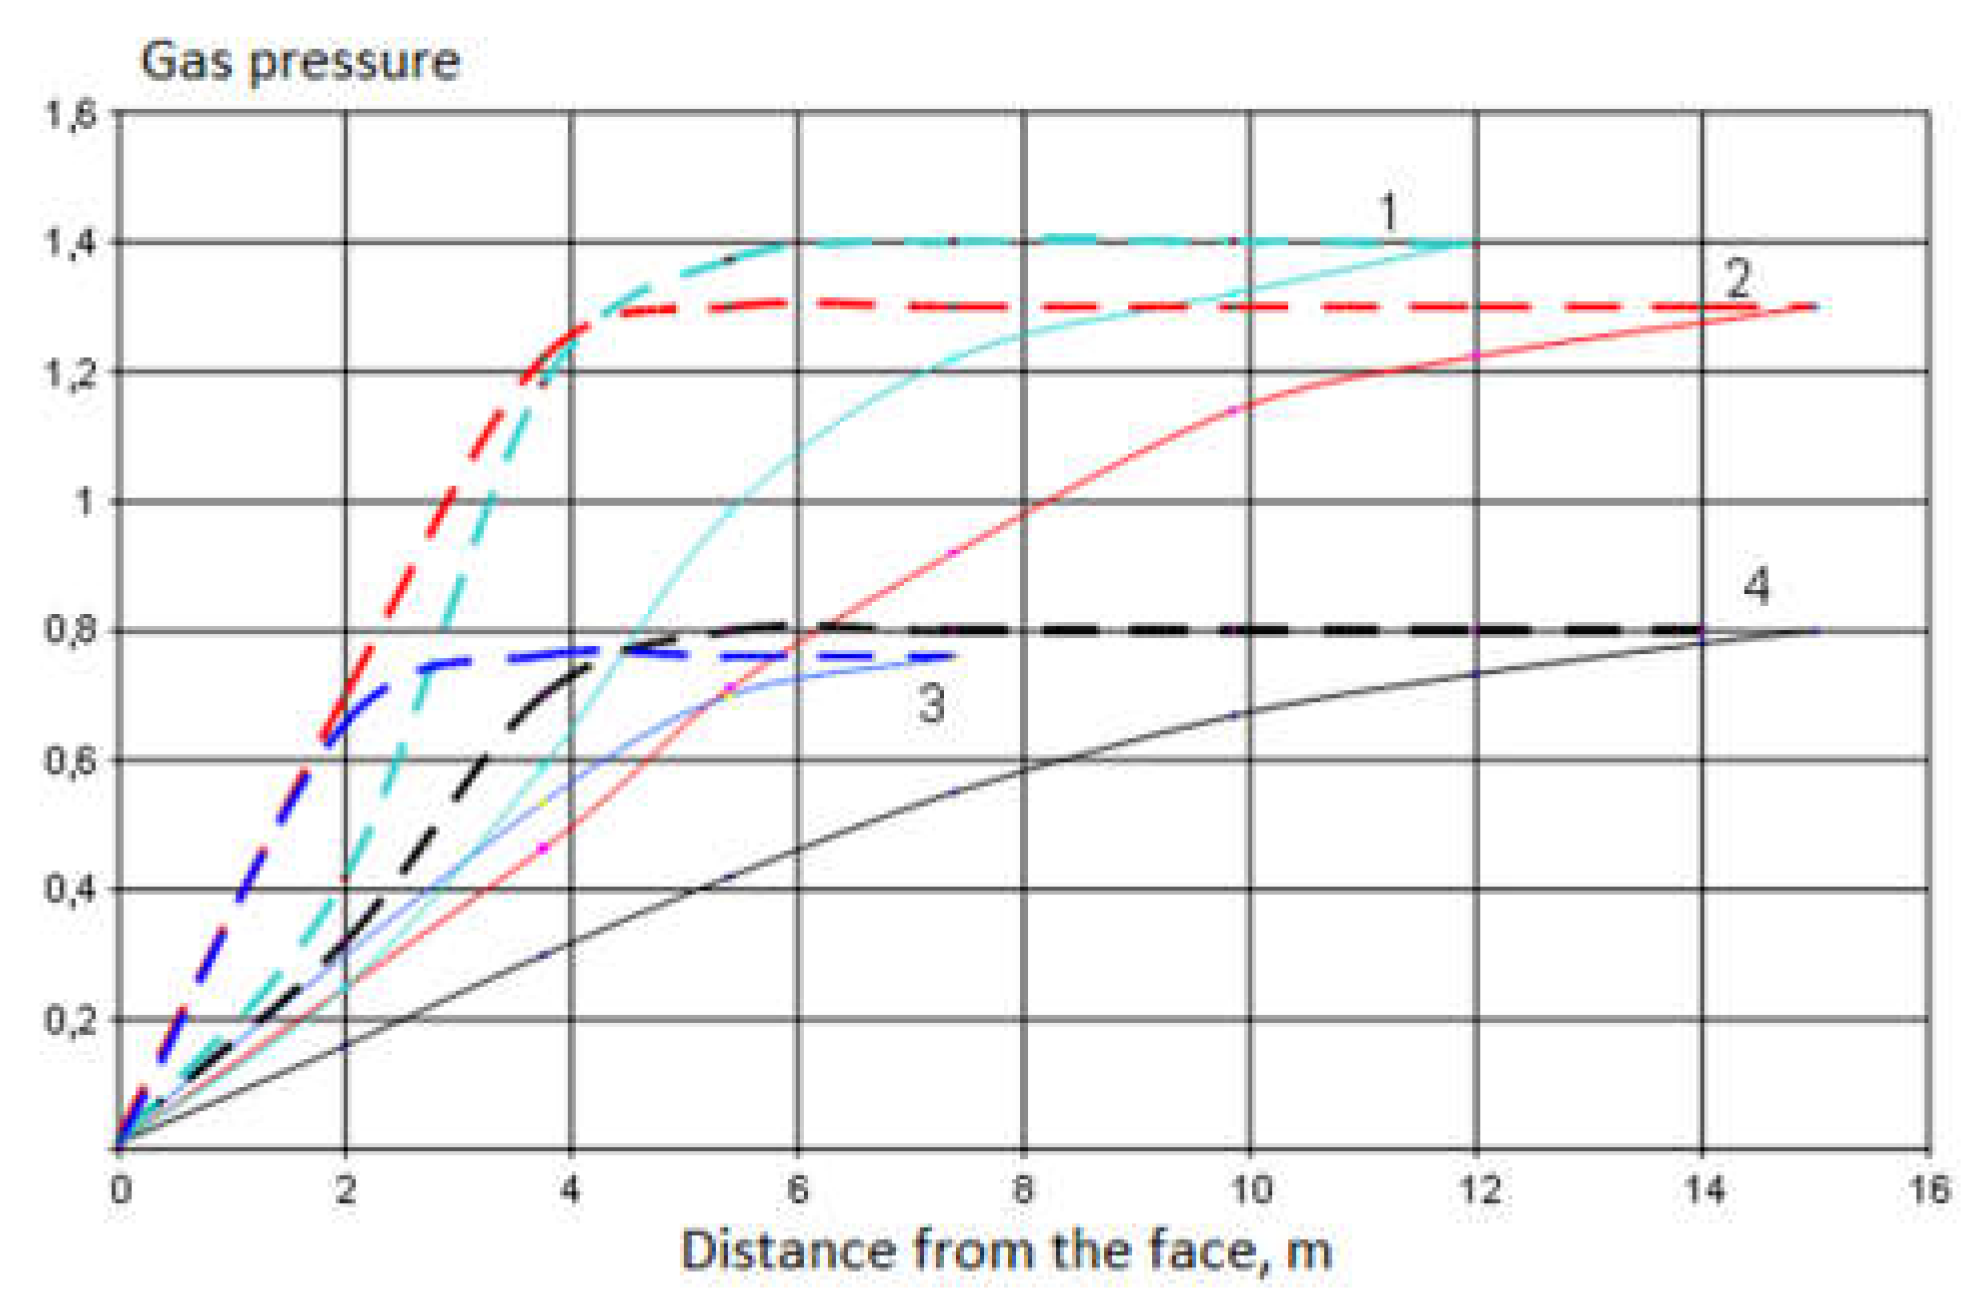
Figure 3.
Graph of methane content variation with depth in the Sherubainurinsky area (seam K10): 1—Methane content; I—Without considering sampling losses; II—Considering sampling losses.
Figure 3.
Graph of methane content variation with depth in the Sherubainurinsky area (seam K10): 1—Methane content; I—Without considering sampling losses; II—Considering sampling losses.
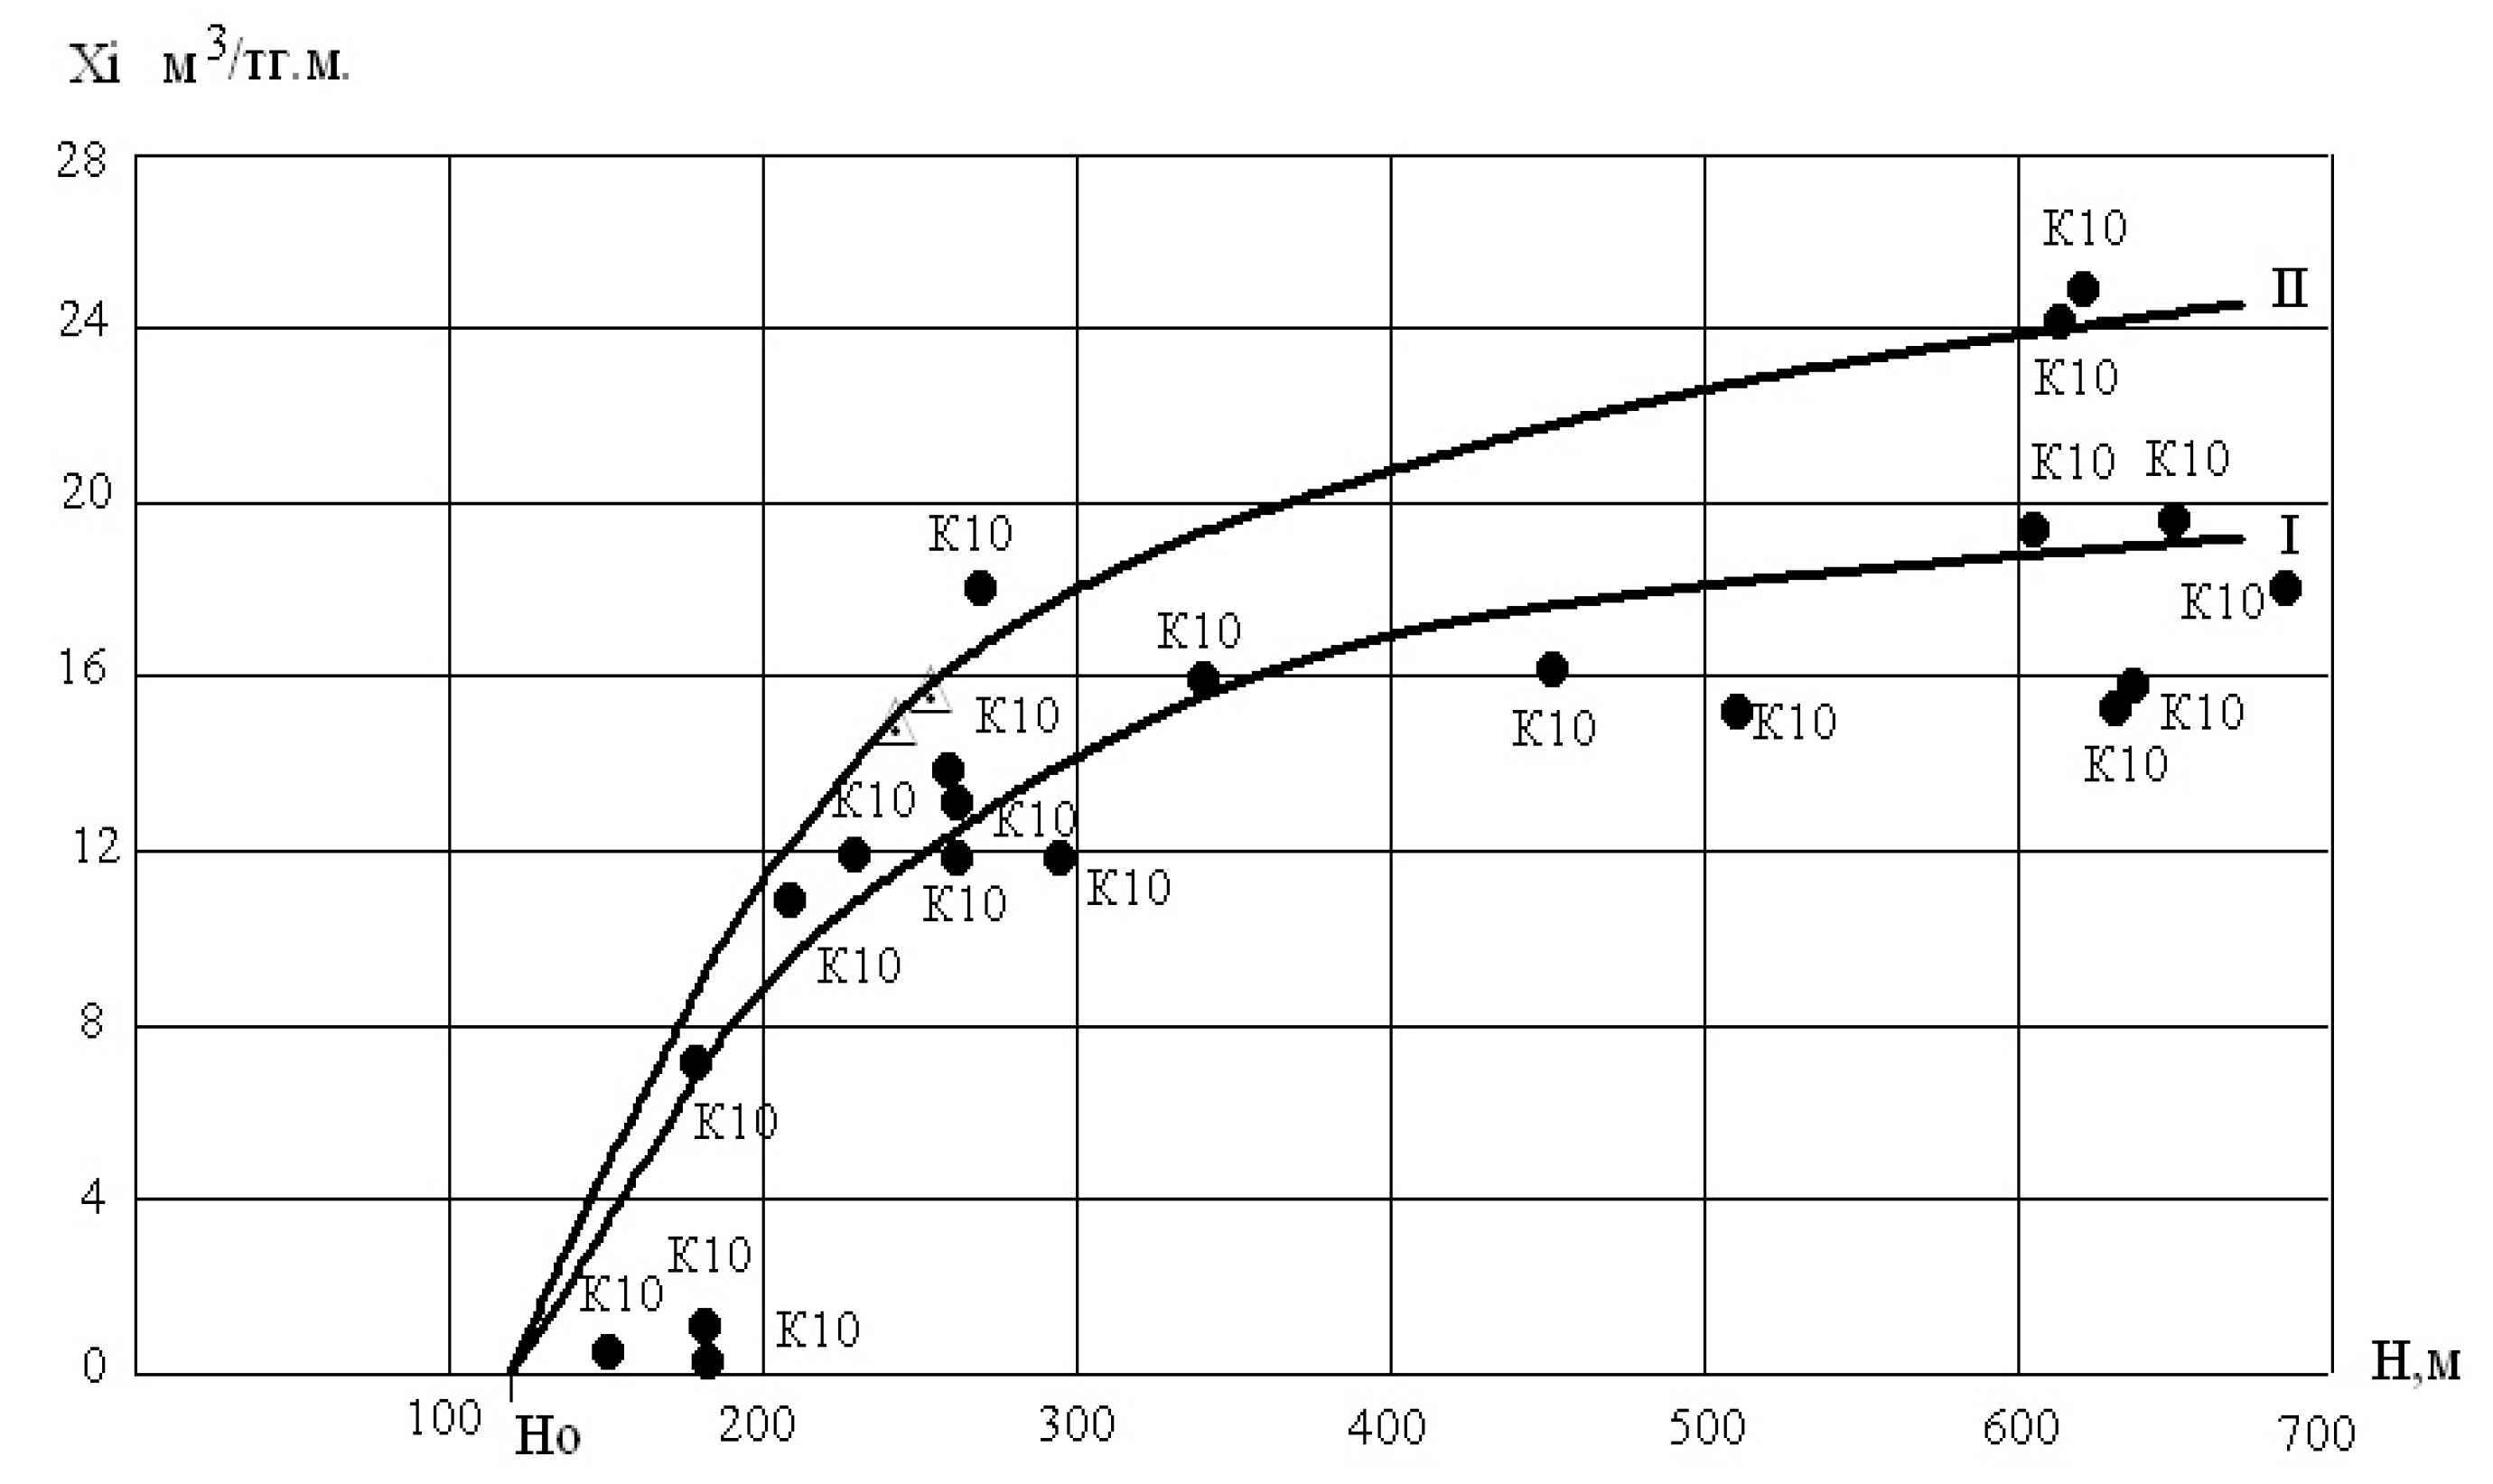

Table 1.
Average gas permeability values of developed coal seams in the Karaganda Basin [8].
Table 1.
Average gas permeability values of developed coal seams in the Karaganda Basin [8].
| Seam | Depth from the surface, m | Coal seam, % | Average gas permeability, 10−2 mD |
| к18 new | 400–500 | 28–32 | 0,6–0,9 |
| к14 Four-foot | 350–500 | 26–31 | 0,3–0,7 |
| к13 six-foot | 400–500 | 25–30 | 0,9–1,1 |
| к12 Upper Mariana | 250–450 | 23–28 | 3,3–5,5 |
| к10 Felix | 400–450 | 21–27 | 1,0–1,5 |
| к7 wonderful | 400–500 | 20–26 | 1,2–1,8 |
| к4 above average | 250–400 | 20–25 | 1,0–1,1 |
| к3 average | 300–400 | 19–24 | 0,8–1,0 |
| к2 below average | 200–300 | 22–28 | 0,7–0,9 |
| а5 double | 300–450 | 23–25 | 0,7–0,9 |
Table 2.
Calculated values of gas permeability for coal seams based on stratigraphy (Akimbekov A.K., Makhov A.A., KarTU).
Table 2.
Calculated values of gas permeability for coal seams based on stratigraphy (Akimbekov A.K., Makhov A.A., KarTU).
| Seam | Depth interval, m | Gas permeability, 10−2 mD |
| к10 | 400 600 800 |
1,51 0,19 0,05 |
| к12 | 400 600 800 |
2,77 0,35 0,09 |
| d1–d5 | 400 600 800 |
5,85 0,75 0,19 |
| d6 | 400 600 800 |
3,89 0,50 0,13 |
Table 3.
Residual methane content Хo.g. of coals [8].
Table 3.
Residual methane content Хo.g. of coals [8].
| The values of Хo.g., m3/t d.a.f., are given at the volatile matter yield, %. | ||||
| 12–18 | 18–26 | 26–35 | 35–42 | 42–50 |
| 7–6 | 6–5 | 5–4 | 4–3 | 3–2 |
Table 4.
Analysis of coal samples from layer D6 for hydrogen sulfide.
| Mine | Number of samples | Gas content, m3/ton | Gas yield, m3/ton | ||
| max | average | max | average | ||
| «Kazakhstan» «Lenin» «Shakhtinsk» «Tentek» «Molodezh» «Shakhansk» |
27 16 21 17 8 9 |
0,388 0,236 0,054 0,072 0,174 0,076 |
0,191 0,089 0,019 0,038 0,063 0,024 |
0,021 0,006 – 0,002 0,001 0,002 |
0,0038 0,0018 –0,0014 0,0004 0,0012 |
Note: The coal samples were taken from cleaning faces.
Disclaimer/Publisher’s Note: The statements, opinions and data contained in all publications are solely those of the individual author(s) and contributor(s) and not of MDPI and/or the editor(s). MDPI and/or the editor(s) disclaim responsibility for any injury to people or property resulting from any ideas, methods, instructions or products referred to in the content. |
© 2025 by the authors. Licensee MDPI, Basel, Switzerland. This article is an open access article distributed under the terms and conditions of the Creative Commons Attribution (CC BY) license (http://creativecommons.org/licenses/by/4.0/).
Copyright: This open access article is published under a Creative Commons CC BY 4.0 license, which permit the free download, distribution, and reuse, provided that the author and preprint are cited in any reuse.


