Submitted:
10 October 2025
Posted:
15 October 2025
You are already at the latest version
Abstract
Páramos, high-mountain tropical ecosystems, are crucial for carbon storage and water regulation for many Andean cities. However, they are subjected to wildland fires that threaten the ecosystem services they provide. Fire activity varies substantially among páramos, making it essential to understand the drivers of this spatial variability. This study evaluates the relative influence of anthropogenic and biophysical factors on fire occurrence in Colombian páramos, analyzing burned area data from 2000 to 2022 using a Random Forest model. Result indicate that fire occurrence is shaped by the interaction between human pressures and biophysical characteristics. Annual precipitation was the most influential predictor: areas with lower mean annual precipitation (< 1000–1500 mm/year) were linked to greater burned area. Vegetation cover, assessed using the Nor-malized Difference Vegetation Index (NDVI), showed a hump-shaped relationship, with intermediate greenness levels (0.13–0.25) being most prone to burning. Anthropogenic factors, especially proximity to buildings and agricultural zones, also had a significant impact. Our results show that fire occurrence in páramos cannot be attributed solely to human pressures but results from the combined effect of anthropogenic and biophysical drivers. Understanding of these interactions underscores the need for socio-ecological perspectives to guide integrated and adaptive management of strategic high-mountain ecosystems.
Keywords:
Paramos
; fire drivers
; Random Forest
; anthropogenic pressure
; tropical alpine ecosystems
; Colombia
; Burned area
1. Introduction
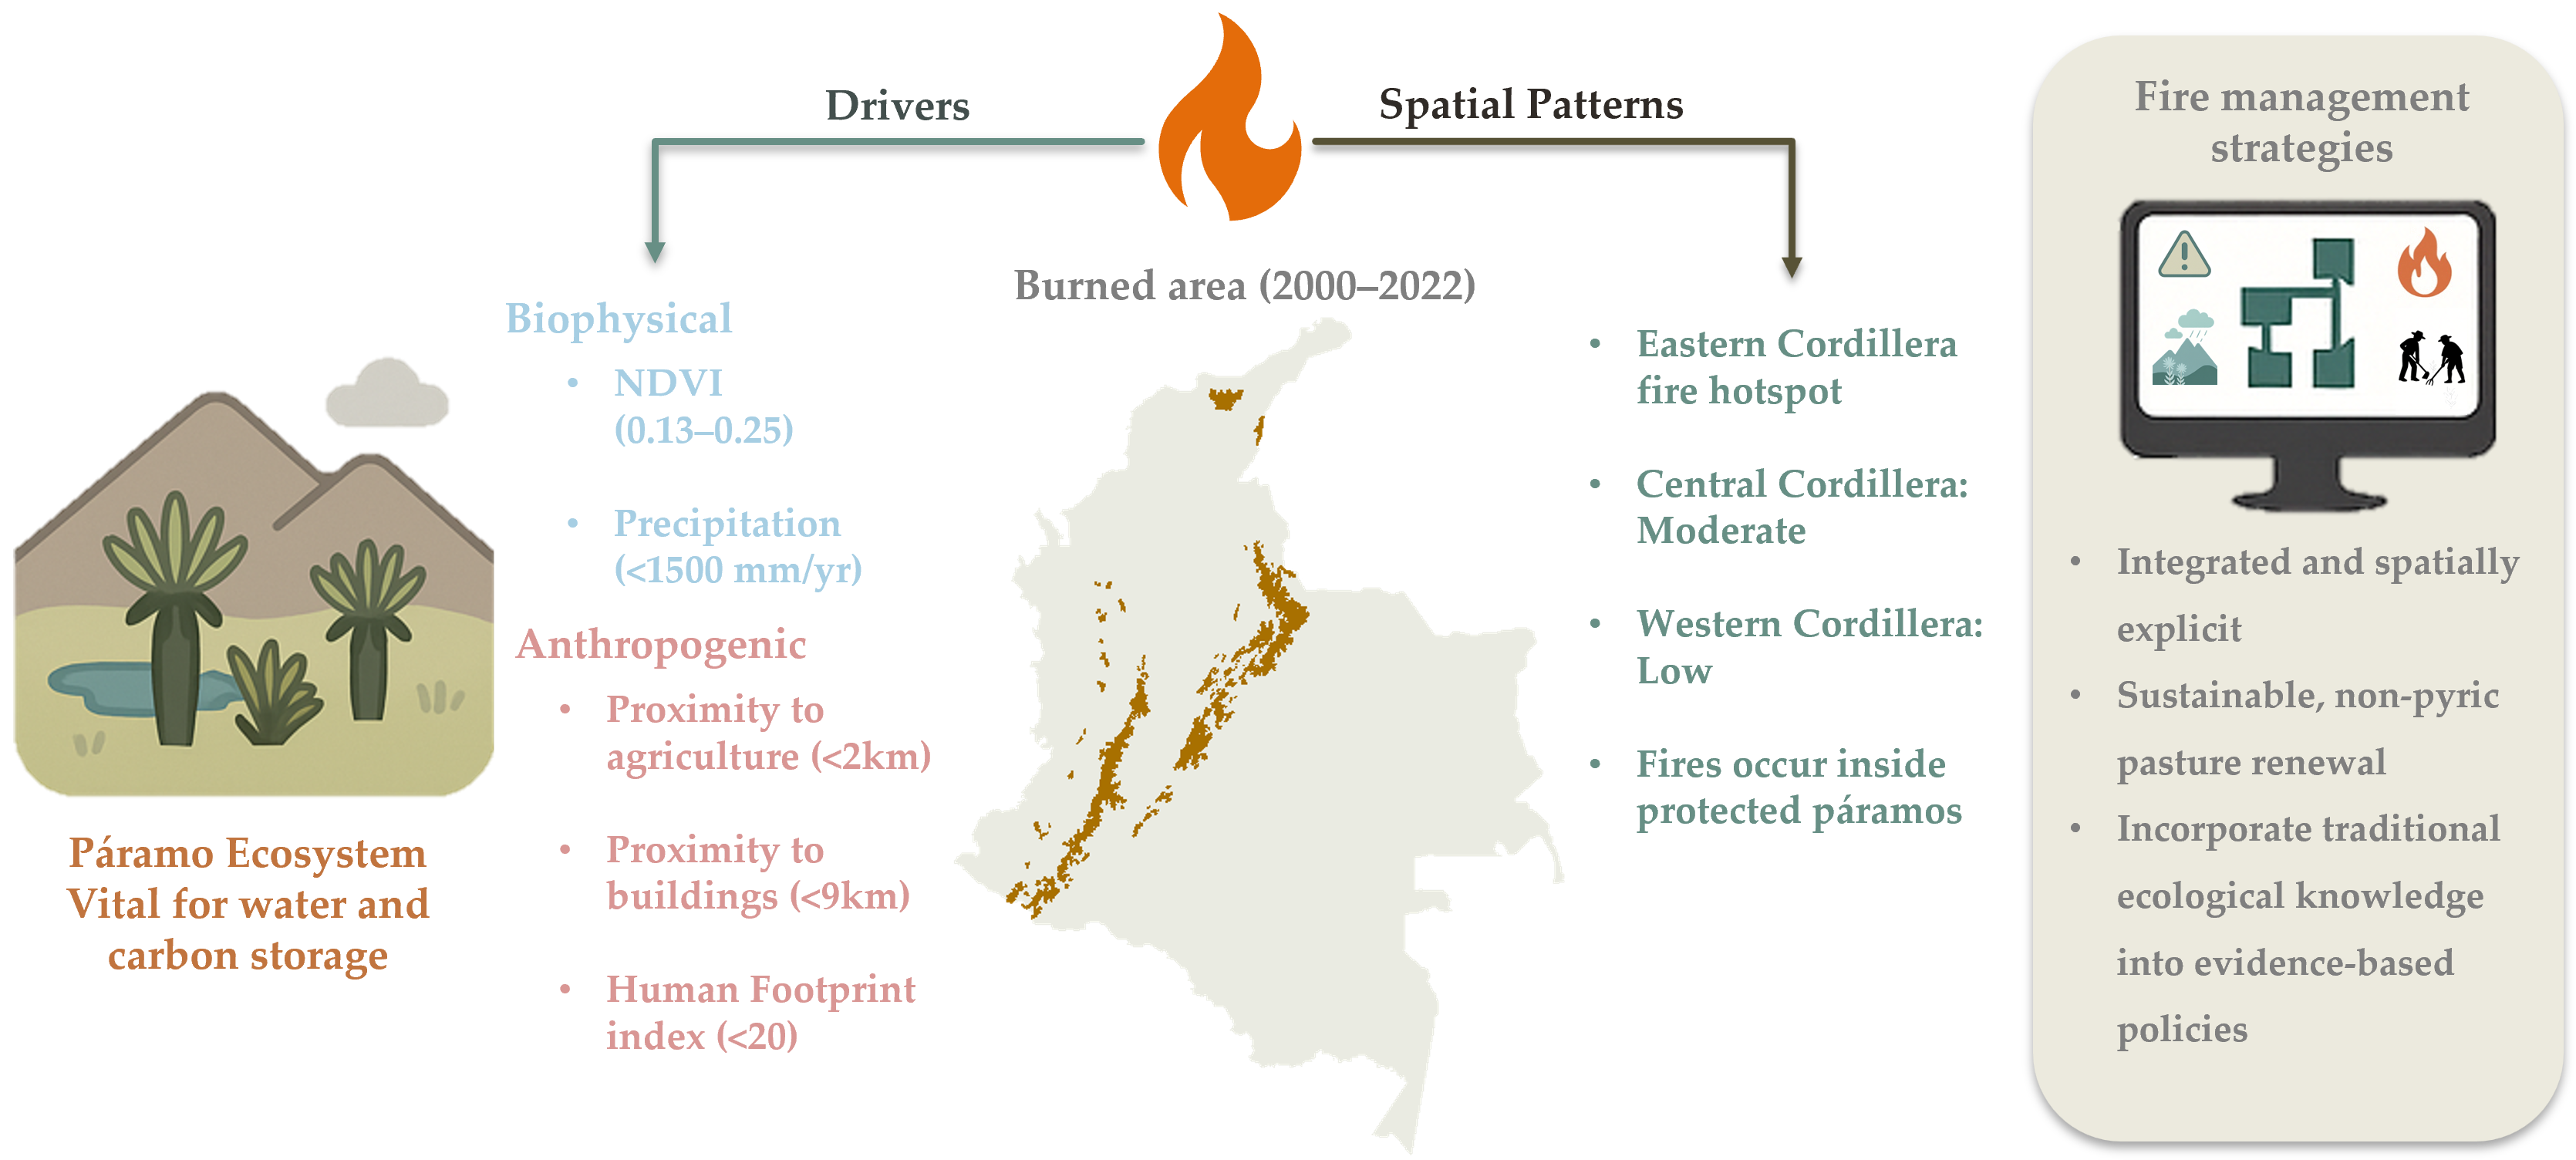
Páramos are high-mountain tropical ecosystems located primarily in the Andes. Occupying the transition zone above dense tropical mountain cloud forest until reaching glaciers, ranging from altitudes between 3000 and 4800 m [1]. Páramos cover approximately 35,000 km2, spanning Venezuela, Colombia, Ecuador, northern Peru, and small regions in Costa Rica and Panama [2]. Páramos are highly valued for their ecosystem services, particularly as "water towers" of South America [3]. They store vast amounts of water that supply major Andean cities [4,5] and play a role as significant carbon sinks, mitigating global warming by capturing and storing atmospheric carbon [5,6,7]. Despite their regional importance in providing ecosystem services, páramos face growing threats from climate change, land-use expansion, and fire—one of the most frequent drivers of ecological change [5,8].
The fire of Páramo has been an integral and transformative force in human-páramo interactions for thousands of years (at least 7,000), and this must be acknowledged given its ecological importance [9,10,11,12]. As a result, páramos have burned relatively frequently [13], with fire acting as a natural and anthropogenic disturbance agent that influences the dynamics of vegetation [8,14,15]. Although natural phenomena such as lightning strikes and volcanic eruptions can cause fires, they alone cannot explain the historical fire patterns [11,16]. Instead, human activities have been the dominant cause to date, through deliberate land management or accidental ignition [11,16,17,18]. The ecological effects of páramo fires range from beneficial outcomes, such as the regeneration of fire-resistant species [19], to harmful impacts, including soil erosion, hydrological alteration, and the loss of peat and organic matter essential for carbon storage and water regulation [1,16,20]. These effects of fire and its dynamics are amplified by broader anthropogenic factors that go beyond direct burning.
On a global scale, the occurrence of fires in ecosystems has been extensively investigated and is now recognized as the emerging result of complex interactions among climatic factors, fuel availability and continuity, topography, and human activities [21,22]. These drivers operate and interact on spatial and temporal scales: climate modulates vegetation productivity and flammability, thereby defining broad windows of fire susceptibility; vegetation structure and composition determine fuel continuity; topography shapes local microclimates and influences fire spread; and human activities contribute most ignition sources and alter fuel regimes [23,24].
In contrast to other ecosystems worldwide, knowledge of fire drivers in páramo ecosystems remains scarce and fragmented, largely limited to localized case studies. Existing research highlights the influence of human access, traditional burning practices, and seasonal droughts acting on grass-dominated fuels [7,25,26,27]. However, only a few studies have analyzed fire occurrence patterns or quantified the relative importance of these drivers at broader spatial and temporal scales [7,13,28,29]. This limited understanding leaves key processes unexplored, particularly those explaining the spatial variability of fire occurrence, a gap that becomes increasingly concerning under climate change, which is expected to intensify fire regimes through rising temperatures and expanding human pressures [10,30].
To address this gap, our study analyzes the anthropogenic and biophysical drivers of fire in Colombian páramos. We develop a spatio-temporal analysis of burned area dynamics using the páramo Fire Atlas data [13], for the period 2000–2022, and apply a Random Forest (RF) model to identify the main drivers of the spatial pattern. We hypothesize that the spatial pattern of burned area across Colombian páramos is primarily driven by anthropogenic factors such as land use and accessibility. We further expect that biophysical conditions—including vegetation cover, climate, and altitude—modulate these patterns and contribute significantly to local variation in burned area.
2. Materials and Methods
2.1. Study Area
The study area is located in the Colombian Andes (Figure 1), which concentrates nearly half of the world’s páramo ecosystems [6]. In Colombia, páramos are distributed across the three main mountain ranges and isolated massifs, forming a mosaic of landscapes shaped by strong altitudinal gradients [2]. These ecosystems are characterized by cold temperatures, frequent cloud cover, and intense solar radiation [8,16], conditions that create a distinctive microclimatic variability [31]. Such environmental heterogeneity has driven the evolution of highly specialized flora and fauna, resulting in exceptional endemism and the highest recorded plant diversity among high-mountain ecosystems worldwide [3,32]. Along elevation gradients, vegetation transitions from dense woody cover at lower limits to open grasslands, wetlands, and rocky outcrops at higher elevations [33,34]. These transitions are accompanied by differences in soil depth, moisture, and fuel availability that are critical for understanding fire dynamics [20,25,35].
We use the same páramo area proposed in the páramo fire atlas [13] that considers the boundaries of the WWF Ecoregion map [36], a map of land cover specific to the páramos of the northern Andes [37], and the páramo map created by the Humboldt Institute [6]. This boundary also includes a 500-meter buffer to account for the transition between high Andean forest and páramo and excludes all agricultural areas, which lets us focus on fire impact on nontransformed páramo vegetation. In this study, we use the term "páramo unit" to refer to the official complejo de páramo classification adopted by the Colombian National Environmental System (SINA). Each páramo unit represents a defined high-mountain ecosystem area with a specific name, as recognized in national environmental planning and monitoring frameworks. Similarly, each páramo unit has been geographically separated by the cordillera to facilitate some analysis Table A1.
2.2. Data Sets
2.2.1. Burned Area Data for the Páramos Unit
We examined the burned area using the Páramo Fire Atlas, a burned-area database developed for South America’s páramos providing annual burned area data from 1985 to 2022 at 30 m spatial resolution [13]. Accuracy assessments report low commission errors ( 8%) and relatively low omission errors ( 47%), although some underestimation occurs for small fires. Compared to MODIS MCD64A1, The Páramo Fire Atlas detects a higher proportion of small fires, resulting in approximately four times higher burned-area estimates. Our analysis focused on the 2000–2022 time period because pre-2000 estimates have larger uncertainty due to limited imagery availability (See Figure A1). Figure 2 shows an example of the burned area in the Tota-Bijagual-Mamapacha páramo unit in Colombia.
2.2.2. Explanatory Variables
A set of potential explanatory variables was compiled to represent a broad set of biophysical and anthropic factors hypothesized to influence burned area in the páramo ecosystem. Climatic variables included multi-annual averages of max temperature and accumulation of precipitation, as well as human-related variables relevant to high-Andean environments such as the human footprint, distances to forest, buildings and roads. We also included the density of conflict events, given long-standing internal conflict. Because conflict density showed a highly skewed concentration of near-zero values, it was log-transformed as .
On the other hand, protected areas represent a central dimension of conservation in Colombia, where more than half of páramo regions fall under some protection category [38]. We use the database of protected areas in Colombian páramos [39], which are classified into four categories according to their legal restrictions. No protected areas, areas without any degree of protection, high-restriction areas, comprised of national and regional natural parks, wildlife sanctuaries, and flora sanctuaries. Medium-restriction areas included regional and national protected forest reserves, while low-restriction areas encompassed Civil Society Nature Reserves, Regional Integrated Management Districts, and Soil Conservation Districts. To enable a fair comparison between burned areas inside and outside protected areas, burned area values were normalized by the total surface area of each páramo unit. This normalization allowed proportional comparisons of fire occurrence, minimizing biases caused by differences in páramo size or the extent of protected coverage (Figure A2). A detailed summary of each explanatory variable is provided Table 1.
2.2.3. Spatial Analysis
We based the spatial analysis on “The Paramo Fire Atlas” database, using it as the dependent variable. We aggregated the dataset into a 500 × 500 meter grid and calculated the percentage of burned area for each cell. This aggregation reduced the stochastic variability of individual fire events and ensured greater consistency with the resolution of the explanatory variables. We resampled all explanatory variables to the same spatial resolution using bilinear interpolation to maintain consistency.
We evaluated multicollinearity among predictors using Pearson’s correlation coefficient, applying a ±0.65 threshold to exclude one variable from each highly correlated pair, which indicated that elevation and conflict density were correlated with maximum temperature (-0.83) and distance to buildings (-0.69), respectively. Given that exploratory analyses revealed nonlinear relationships between predictors and burned area, we opted not to use traditional parametric approaches such as linear or logistic regression, which rely on assumptions of linearity [47,48,49].
Instead, we developed a predictive model using Random Forest, a non-parametric ensemble learning method well suited to capture nonlinear interactions and complex predictor–response relationships [50]. This approach enabled us to evaluate how biophysical and anthropogenic variables contribute to the spatial patterns of burned area. Variable importance was assessed using the permutation importance metric, which measures the increase in prediction error when a variable’s values are randomly permuted. We report this metric as the percentage increase in mean squared error (%IncMSE). To further explore predictor effects, partial dependence plots were generated to describe the functional relationships between individual predictors and burned area [51]. These plots estimate the average marginal effect of a single variable on the response while holding all others constant, thereby isolating its contribution to the model’s prediction. The RF model was parameterized with 500 trees and three variables considered at each split. All analyses were performed in R, using the terra package for spatial analysis [52] and the randomForest [50] and corrplot packages for statistical analysis [53].
3. Results
3.1. Burned Area
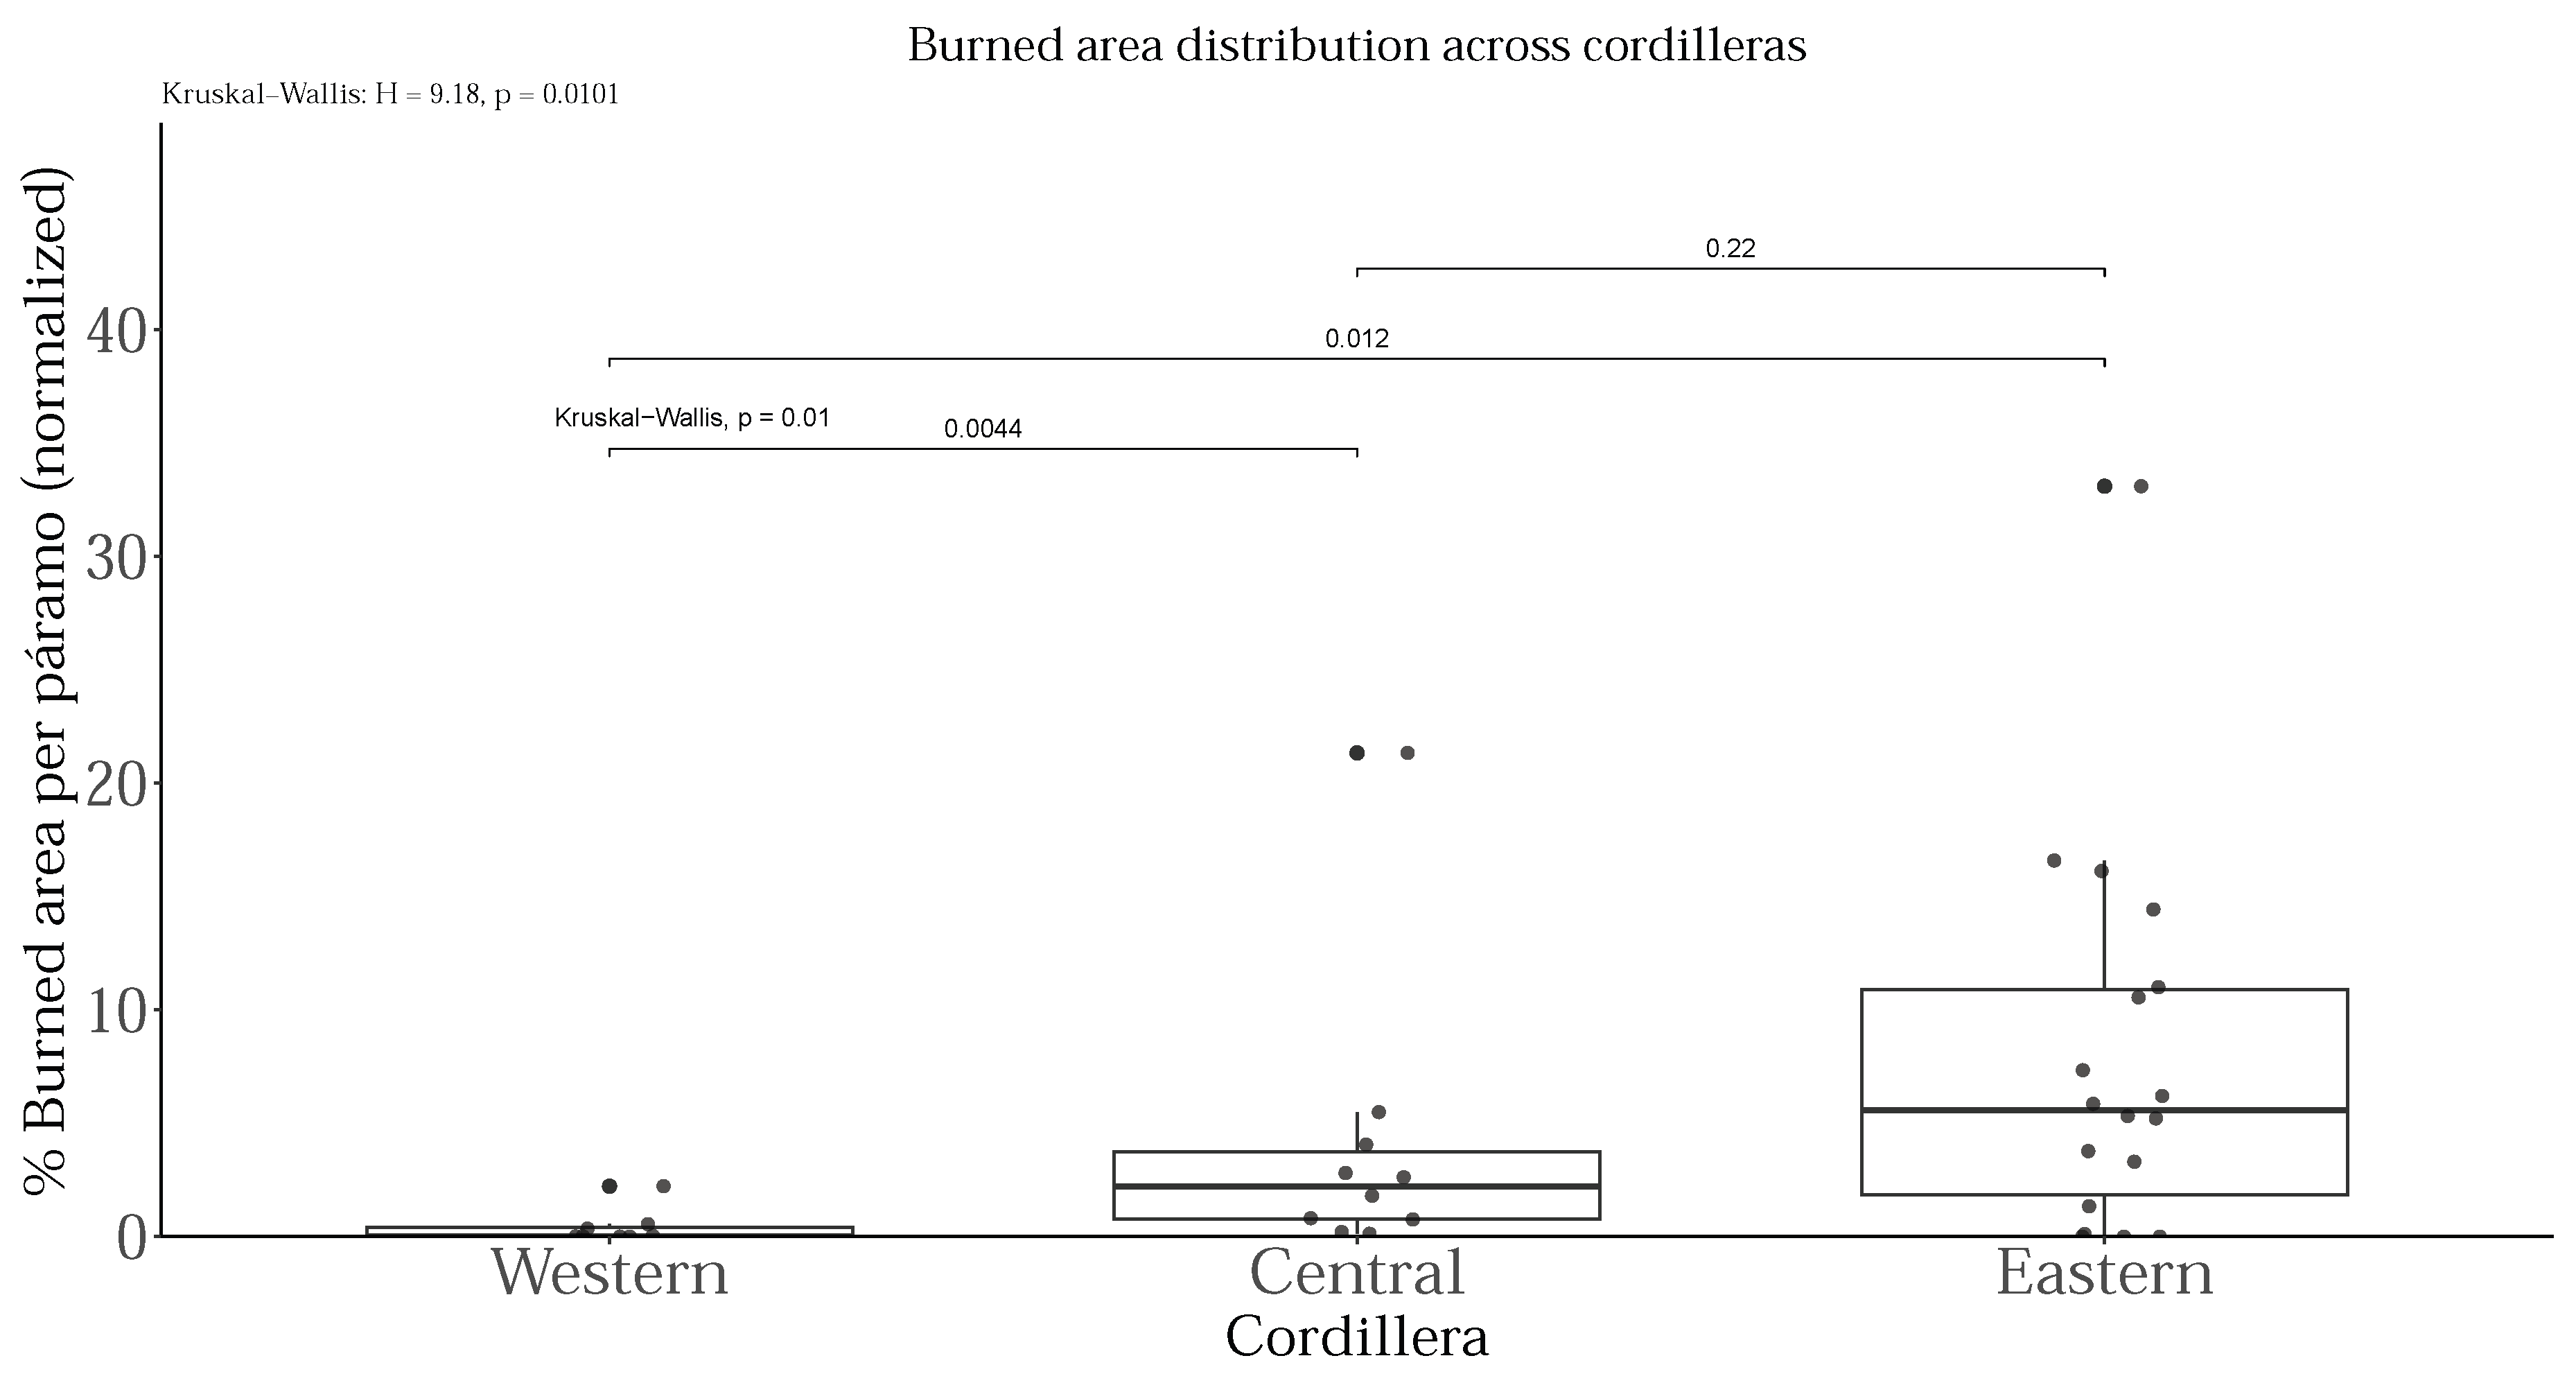
Figure 3 shows the total burned area across each Colombian páramo unit between 2000 and 2022, revealing the persistence of fires over the 22-year period. Burned area distribution varied widely among the three cordilleras: the Eastern cordillera recorded the largest proportion (8.9%), the Central reached intermediate levels (3.5%), and the Western was least affected (0.5%), with near-zero values in páramo units such as Citará and El Duende (Table A1 and Table A2). These results underscore the heterogeneous distribution of burned areas in Colombian páramos, with marked contrasts both among and within cordilleras (Figure A3).
Within this general pattern, the Eastern Cordillera stands out with the most burned páramos units, especially those near major cities—such as Tota-Vijagual (34), Cruz Verde–Sumapaz (9), and Altiplano Cundiboyacense (2)—and in binational systems like Perijá (36), where one-third of its area has burned. In the Central Cordillera, the Chiles–Cumbal páramo (5) shows the highest impact, with one-fifth of its surface burned during the study period.
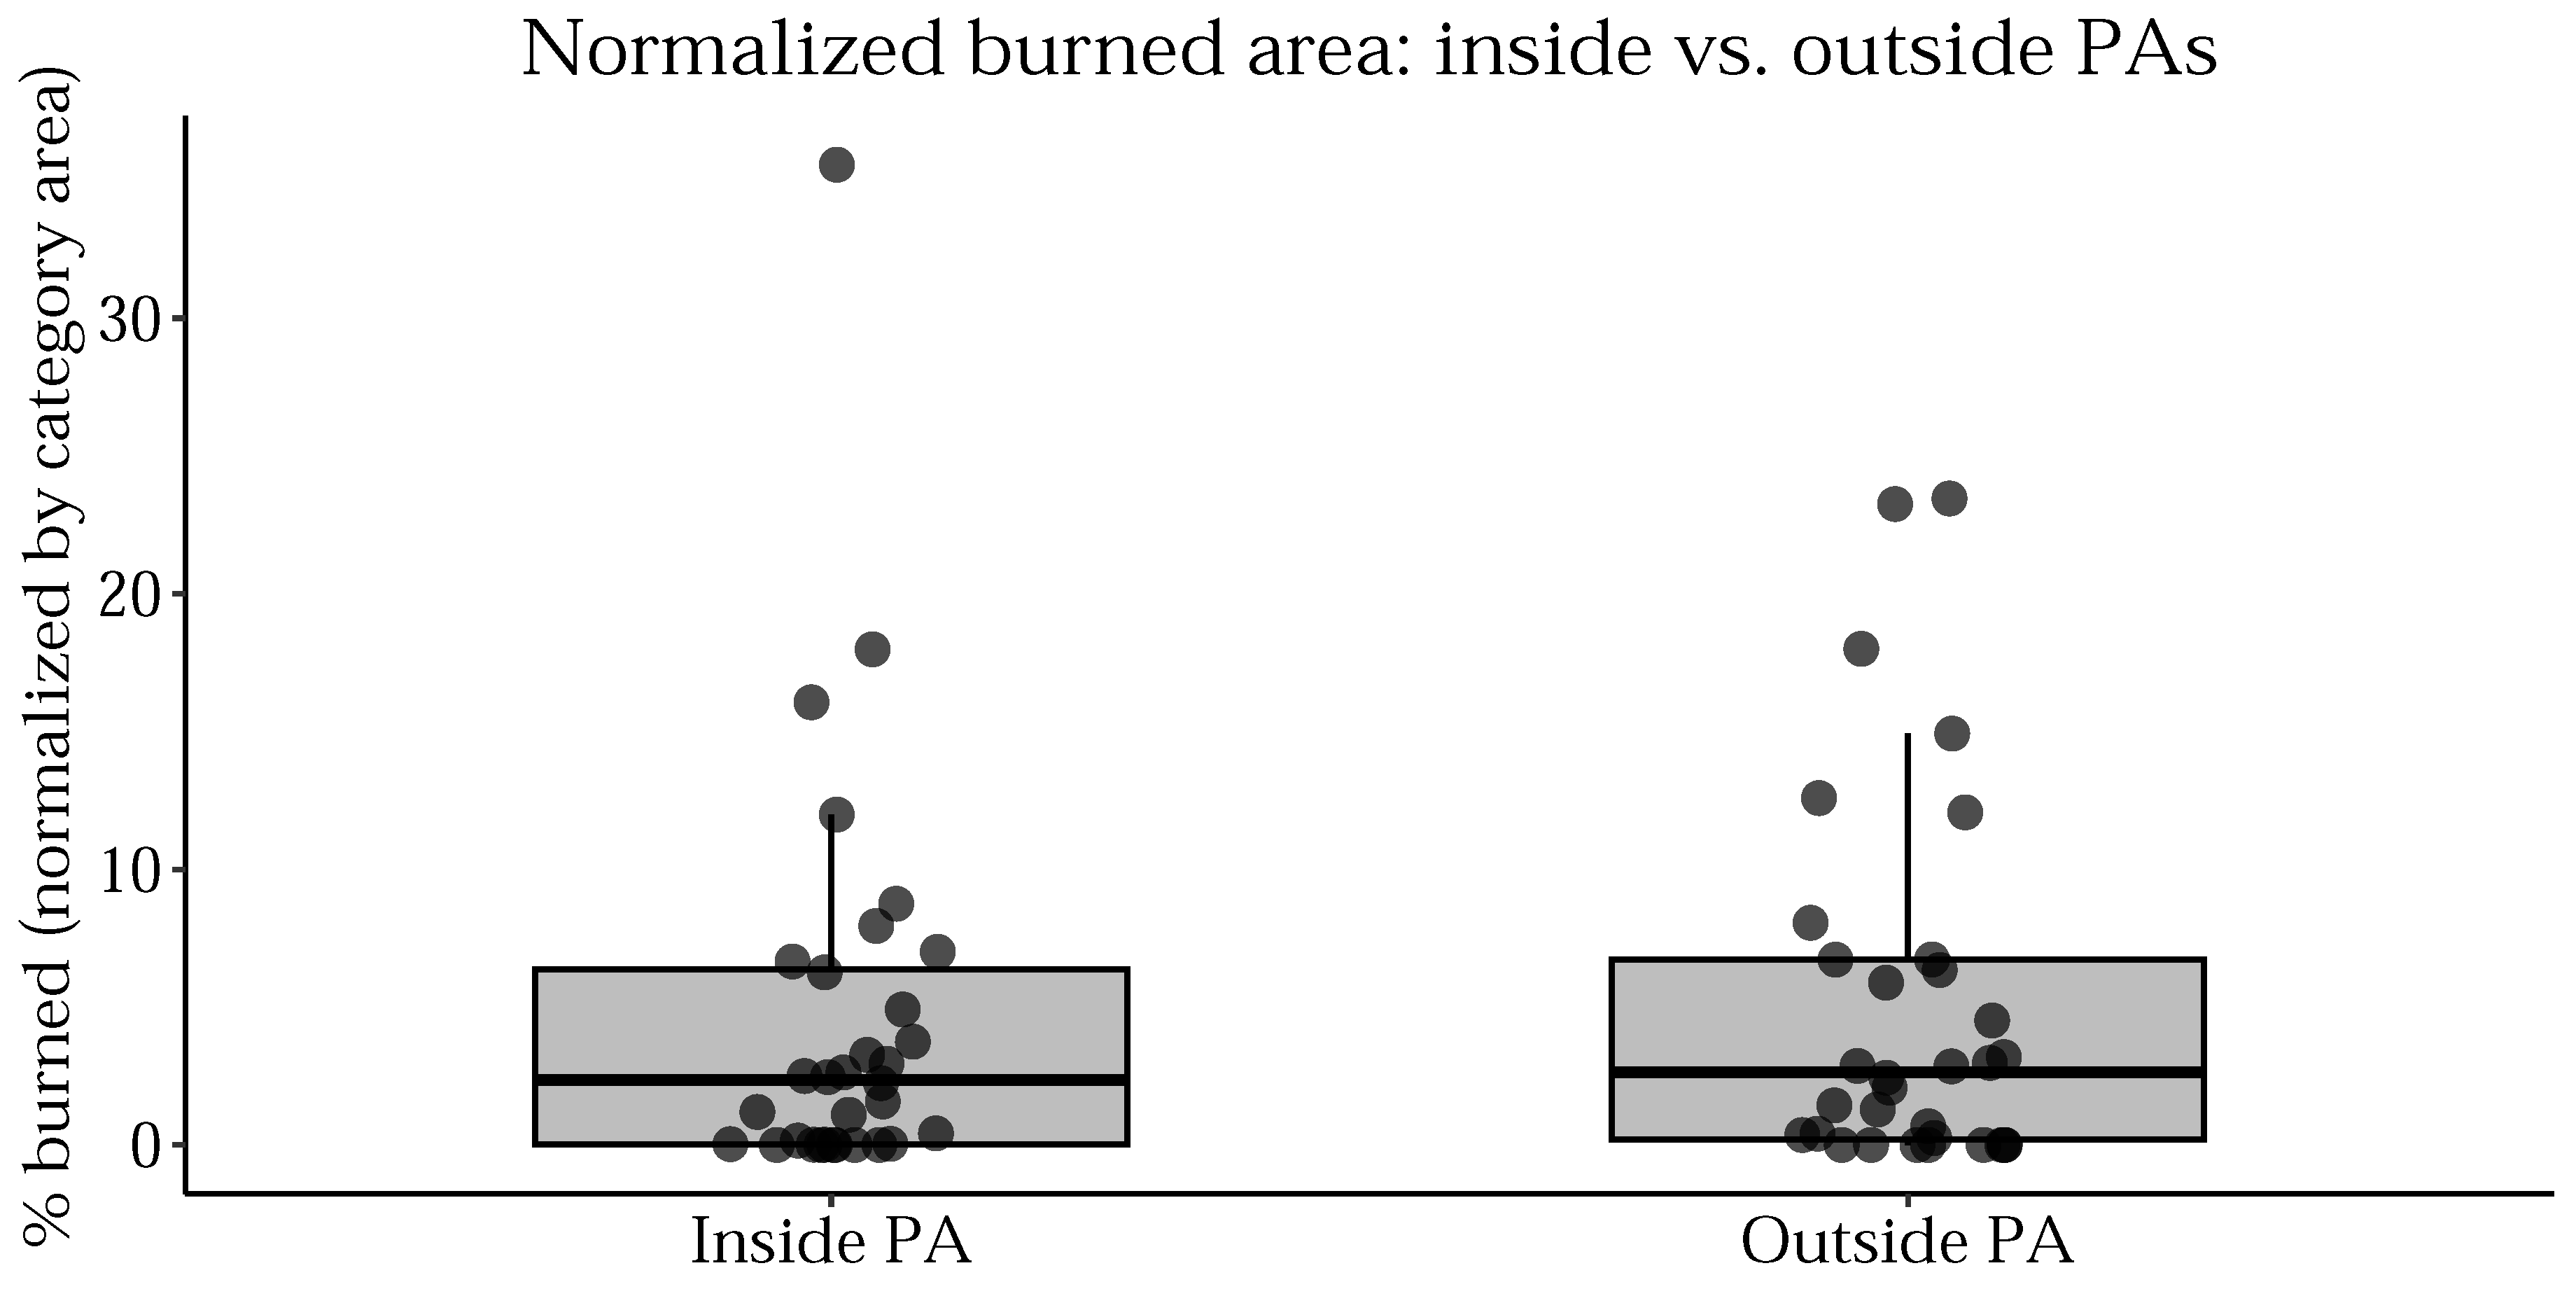
The largest burned areas were concentrated in a small number of páramos units, with ten areas accounting for most of the burned area (see Figure 4). All of these overlap, at least partially, with the National System of Protected Areas (SINAP). Although a substantial share of the total burned area occurred within protected páramos, comparisons with non-protected zones showed no significant differences in the proportion of burned area (Figure A2 and Table A1).
3.2. Drivers of burned area across the páramo ecosystem
The RF model was used to predict burned area (BA), and the out-of-bag (OOB) statistics showed a mean squared residual of 137.7, corresponding to an RMSE of 11.7 and an explained variance of 54.3%. These results indicate that the model captures patterns in burned area and provides estimates of predictive performance.
Figure 5 presents the ranked importance of each predictor variable (%IncMSE). Precipitation emerged as the most influential driver in burned area within the páramo region (150%), followed by anthropogenic variables such as distance to buildings (138.4%), distance to agricultural areas (134.3%), and the human footprint index (126.3%), and NDVI ranked fifth in importance (122.5%). Variables such as distance to forests, temperature, distance to roads, and protected area category exhibited lower importance in explaining burned area (< 97%).
3.2.1. Biophysical Variables
Annual precipitation was the strongest predictor of burned area variability. Partial dependence plots (Figure 6) show that burned area is 75% higher under drier conditions, particularly when precipitation falls below 1500 mm/year (see Table A3) compared to wetter areas. Burned area is also 80% higher in areas with a higher mean temperature, above 16 °C, relative to cooler páramo zones (<12 °C). Vegetation greenness (NDVI) shows a hump-shaped response: areas with intermediate density (0.13–0.20) nearly double the predicted burned area compared to sparsely vegetated (<0.1) or densely forested areas (>0.25).
Although distance to forests and proximity to roads ranked low in the model results, they still influenced burned area (Figure 6). The burned area increased beyond 2 km from each one, which, in the case of forest, is consistent with the NDVI pattern in which more forested areas experienced fewer fires.
3.2.2. Human Pressure
Agricultural areas and distances to buildings increase the probability of burned areas (Figure 6). Burned area peaks within the first two kilometers (agriculture) and nine kilometers (buildings) of these features and declines with distance, although secondary peaks emerge at greater distances (see Table A3). Both variables are strong predictors of burned areas, and their functional responses indicate average burned areas between 4% and 16%.
In the case of buildings, the burned area increases sharply beyond 8 km. The Human Footprint Index—whose values range from 0 to 100 (where 0 = null impact and 100 = maximum impact)—shows a decreasing trend in predicted burned area between values of 0 and 30 (see Table A3), with the highest burned area concentrated at the lower end (0–20). Beyond index values of 20, variability remains minimal, making the pattern somewhat counterintuitive.
For the protected area category, predicted burned area differs little between protected and unprotected regions. However, within protected areas, zones under medium and high restriction show lower predicted values than those under low restriction, with medium-restriction areas showing the lowest. This variable contributes the smallest effect in the model, with functional responses ranging from 0% to 7% burned area.
4. Discussion
This study shows that fire dynamics in páramo ecosystems result from the combined influence of anthropogenic and biophysical drivers. While human activities have been widely recognized as the main source of ignitions [8,26], our findings demonstrate that biophysical variables also play a critical role in shaping spatial fire patterns (Figure 5). Likewise, our analysis of burned areas across Colombian páramos over the past 22 years reveals strong spatial heterogeneity (Figure 3). Burned area varies significantly among regions, with the Eastern Cordillera—recording the highest frequency and extent—emerging as a critical hotspot (Figure A3).
Contrary to our initial hypothesis, where we expected human variables to explain most of the spatial variability in burned area, the RF model revealed that mean annual precipitation is the most influential predictor. Drier areas exhibit higher burned areas, but the relationship is not linear; instead, precipitation shows a critical threshold, with burned area increasing sharply in regions receiving less than 1500 mm of annual rainfall (Figure 6). This pattern aligns with findings from other Andean ecosystems, where rainfall preceding the fire season and during dry periods regulates fire dynamics [25,26,35]. Overall, these results highlight how moisture availability, interacting with fuel loads and human activities, shapes fire regimes in high-altitude landscapes.
The second most important biophysical predictor was NDVI, which explained a substantial share of burned area variability. The model revealed a unimodal relationship between vegetation greenness (NDVI 0.15–0.25) and burned area (Figure 6), indicating that areas with intermediate vegetation density —such as grasslands dominated by clumped grasses in a continuous layer [54] —are the most susceptible to fire. These grasslands dominate much of the páramo landscape, providing the primary fuel that drives fire behavior [19]. This pattern reflects fuel availability thresholds: low NDVI areas lack sufficient continuous biomass to sustain fire, whereas high NDVI areas usually retain more moisture, which limits ignition [55]. These areas are generally occupied by Andean forests or shrubs [2]. Although the most important variable is biophysical, human pressures have a strong impact, shaping ignition patterns and reinforcing fire pressure across páramos units.
Anthropogenic factors exerted a strong influence on burned area [8]. Proximity to buildings and croplands was closely linked to higher burned area (Figure 6). This pattern reflects greater accessibility for ignition sources, both intentional and accidental. Intentional uses include agricultural expansion, burning to promote regrowth for livestock, deforestation, and the clearing of woody vegetation [19,26]. Accidental ignitions and vandalism have also been reported[26,56]. Historically, páramos have been shaped by the combined influence of fire and grazing as part of their land-use history [8,19,26], as well as domestic fuel use and charcoal production [16]. Cultural practices and local beliefs promote the use of fire, such as burning páramo vegetation during dry periods under the assumption that smoke induces cloud formation and rainfall [16,27]. More recently, demographic pressures, including population growth and the proximity of urban centers, have been linked to heightened fire pressure [20,26].
Despite fire suppression policies—including the prohibition of burning in páramo ecosystems under Colombian law (Law 2111 of 2021; Decree 1076 of 2015; Resolution 358 of 2024), the effectiveness of formal protection measures appeared limited. Our analysis indicates that protection status, as a categorical variable, did not significantly reduce burned area (Figure 5). Although overall burned area did not differ markedly between protected and unprotected areas, zones under medium and high restriction exhibited slightly lower proportions of burned area (Figure 6). Although the National System of Protected Areas (SINAP) provides guidelines for fire prevention and control, its effectiveness is limited by weak institutional coordination, scarce financial resources, and insufficient enforcement capacity. According to the Colombia Country Dossier (2021)[57], only about 14% of the national environmental budget is allocated to SINAP, and its overall management effectiveness index is approximately 65%. These figures reveal persistent gaps between policy design and on-the-ground implementation. Combined with the persistence of local land-use practices that depend on fire, these institutional shortcomings help explain why fire events continue to occur even within protected páramo areas.
Ultimately, our results confirm that burned areas in páramo units do not occur randomly in space or time but rather emerge from predictable dynamics within coupled human–natural systems. Looking ahead, projected reductions in precipitation and rising temperatures are likely to increase flammability, while expanding agriculture, grazing, and urban growth may intensify human pressures [21]. These trends suggest that fire regimes in páramos will be shaped by the combined effects of climate change and evolving socio-economic dynamics. This highlights the urgent need for targeted, adaptive management strategies.
It is crucial to recognize these predictable dynamics, as they enable the design of targeted interventions that address the most influential drivers of fire risk. These insights highlight the urgent need for integrated and spatially explicit fire management strategies in páramo ecosystems. Key actions include implementing early warning systems during dry seasons and promoting sustainable, non-pyric alternatives for pasture renewal where feasible. Monitoring vegetation transitions is equally important to avoid the buildup of continuous, fire-prone fuel matrices. Integrated fire management (IFM) should also incorporate traditional ecological knowledge into evidence-based policies, ensuring strategies are both scientifically sound and socially legitimate. Beyond prevention and control, it is urgent to understand how fire affects biodiversity and ecosystem services, given the limited knowledge available. Addressing this gap is critical to strengthen fire prevention, enhance ecosystem resilience, and align conservation efforts with local practices.
Author Contributions
Conceptualization, JJD-T, SH.; methodology, JJD-T and SH.; formal analysis, JJD-T; investigation, JJD-T, LO-C, SH and SA.; data curation,JJD-T and LO-C.; software, JJD-T;writing—original draft preparation, JJD-T.; writing—review and editing,JJD-T, LO-C,SH and SA; supervision, SH and SA. All authors have read and agreed to the published version of the manuscript.
Funding
SH, JJD-T, LO-C acknowledge support from the Max Planck Tandem group program. SH acknowledges support from Universidad del Rosario within the program of Fondos de arranque.
Institutional Review Board Statement
Not applicable
Informed Consent Statement
Not applicable
Data Availability Statement
All data used in this study in publicly available. Links to each dataset are provided in Table 1
Acknowledgments
During the preparation of this manuscript, the authors used ChatGPT (OpenAI, GPT-5) to assist in language editing and improving the clarity of expression. The authors reviewed and revised all AI-generated suggestions and take full responsibility for the content of this publication.
Conflicts of Interest
The authors declare no conflicts of interest.
Abbreviations
The following abbreviations are used in this manuscript:
| MDPI | Multidisciplinary Digital Publishing Institute |
| DOAJ | Directory of open access journals |
| TLA | Three letter acronym |
| LD | Linear dichroism |
| SINA | Sistema Nacional Ambiental |
| SINAP | Sistema Nacional de Areas Protegidas |
Appendix A
Appendix A.1
Figure A1.
The frequency distribution of burned area percentages across all páramo units reveals a strong right-skewed pattern. Most observations correspond to less than 5% of burned area, while only a small proportion exceed 25%. This indicates that, although fire events are widespread, they tend to affect limited portions of the landscape. The long tail of the distribution suggests that extensive burns are rare but occur occasionally.
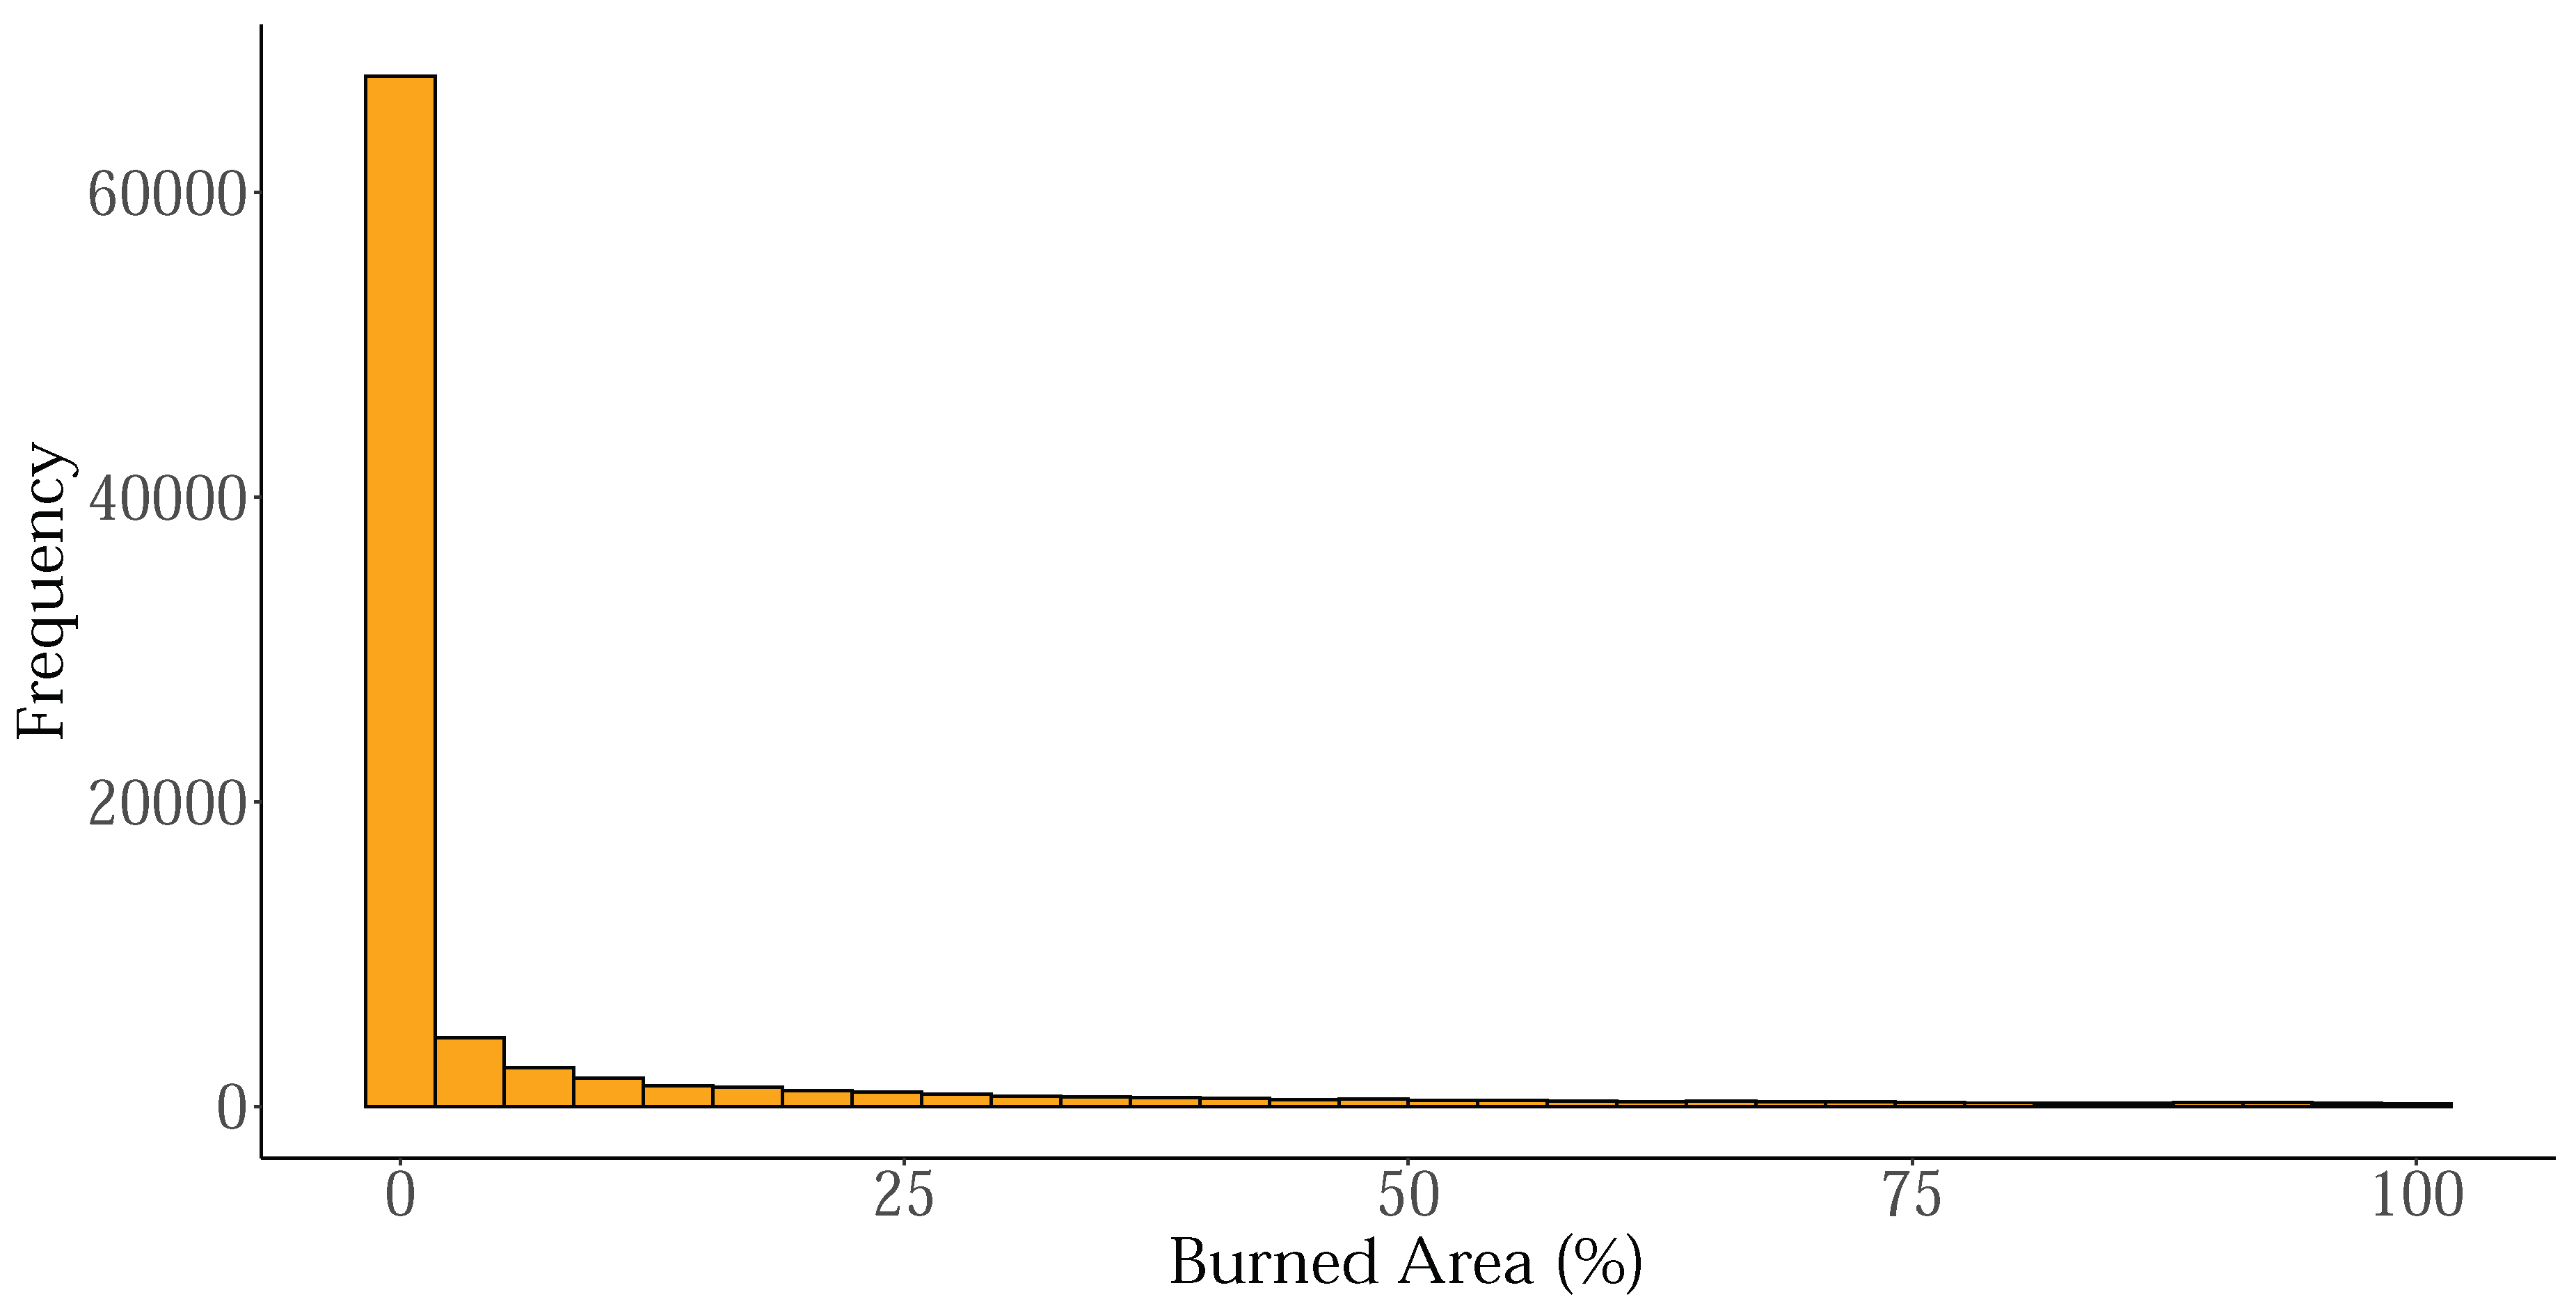

Table A1.
Páramo units grouped by Cordillera, with burned and protected proportions.
| Páramo | % burned | % protected area | Cordillera |
|---|---|---|---|
| Belmira | 2.23 | 100.00 | Western |
| Cerro Plateado | 0.55 | 18.22 | |
| Frontino - Urrao | 0.35 | 84.49 | |
| Paramillo | 0.04 | 99.88 | |
| Farallones de Cali | 0.02 | 100.00 | |
| Tatamá | 0.01 | 100.00 | |
| Citará | 0.00 | 56.11 | |
| El Duende | 0.00 | 39.77 | |
| Chiles - Cumbal | 21.34 | 16.99 | Central |
| Los Nevados | 5.49 | 56.03 | |
| Nevado del Huila - Moras | 4.06 | 78.22 | |
| Guanacas - Puracé - Coconucos | 2.81 | 24.96 | |
| Las Hermosas | 2.62 | 65.08 | |
| Chilí - Barragán | 1.80 | 35.73 | |
| La Cocha - Patascoy | 0.82 | 34.98 | |
| Sotará | 0.76 | 42.05 | |
| Sonsón | 0.20 | 43.39 | |
| Doña Juana - Chimayoy | 0.13 | 50.85 | |
| Perijá | 33.11 | 79.67 | Eastern |
| Tota - Bijagual - Mamapacha | 16.59 | 54.60 | |
| Altiplano Cundiboyacense | 16.13 | 11.89 | |
| Cruz Verde - Sumapaz | 14.44 | 53.23 | |
| Sierra Nevada de Santa Marta | 11.00 | 100.00 | |
| Pisba | 10.56 | 29.86 | |
| Guantiva - La Rusia | 7.34 | 50.82 | |
| Iguaque - Merchán | 6.21 | 54.27 | |
| Almorzadero | 5.86 | 0.64 | |
| Sierra Nevada del Cocuy | 5.33 | 71.27 | |
| Rabanal y río Bogotá | 5.22 | 68.56 | |
| Guerrero | 3.78 | 85.34 | |
| Jurisdicciones - Santurbán - Berlín | 3.31 | 43.00 | |
| Chingaza | 1.34 | 81.53 | |
| Tamá | 0.12 | 75.03 | |
| Los Picachos | 0.00 | 88.20 | |
| Miraflores | 0.00 | 84.57 | |
| Yariguíes | 0.00 | 99.36 |
Table A2.
Distribution of burned area by cordillera.
| Cordillera | Total area (ha) | Burned cells | % burned |
|---|---|---|---|
| Central | 1,013,731 | 35,121 | 3.46 |
| Eastern | 1,490,635 | 133,452 | 8.95 |
| Western | 77,968 | 362 | 0.46 |
Table A3.
Thresholds were derived from Random Forest partial dependence plots using the Bai–Perron method (strucchange::breakpoints), with the number of breaks selected by BIC. Values are in the original units of each predictor (excluding categorical variables such as ProtectedAreas).
Table A3.
Thresholds were derived from Random Forest partial dependence plots using the Bai–Perron method (strucchange::breakpoints), with the number of breaks selected by BIC. Values are in the original units of each predictor (excluding categorical variables such as ProtectedAreas).
| Variable | Thresholds |
|---|---|
| DistForest | 1.72 |
| Temperature | 17.08 |
| Precipitation | 1577.41 |
| DistBuildings | 9.60 |
| DistRoads | 5.60 |
| DistAgriculture | 2.14 |
| NDVI | 0.14 |
| ProtectAreas | – |
| Human Footprint | 20.50 |
Figure A2.
Normalized burned area inside and outside protected areas (PAs; % relative to the available area in each category). Boxplots display the distribution of páramo-level values, paired within complexes to account for variation in total size. Statistical comparison using the Wilcoxon signed-rank test revealed no significant differences between inside and outside fractions (two-sided p = 0.741; one-sided test for inside < outside p = 0.371)
Comparison between Cordilleras
Kruskal–Wallis tests based on normalized values (% burned area relative to total páramo area) indicated significant differences among cordilleras (H = 9.18, p = 0.0101). Post-hoc pairwise Mann–Whitney tests revealed that the Western cordillera differed significantly from both the Central (p = 0.0044) and Eastern (p = 0.0123), whereas no significant difference was detected between Central and Eastern cordilleras (p = 0.2212).
Figure A3.
Boxplots of burned area normalized by páramo size (percent of each páramo’s area burned) across the Western, Central, and Eastern Cordilleras. A Kruskal–Wallis test detected differences among cordilleras (H = 9.18, ). Post-hoc pairwise Mann–Whitney U tests showed Western < Central () and Western < Eastern (), whereas Central vs Eastern was not significant (). Points represent individual páramos units.
References
- Ramsay, P.M.; Oxley, E.R. Fire temperatures and postfire plant community dynamics in Ecuadorian grass páramo. Vegetatio 1996, 124, 129–144. [Google Scholar] [CrossRef]
- Hofstede, R.G.; Llambí, L.D. Plant Diversity in Páramo—Neotropical High Mountain Humid Grasslands. In Encyclopedia of the World’s Biomes; Elsevier, 2020; Vol. 1-5, pp. 362–372. [CrossRef]
- Madriñán, S.; Cortés, A.J.; Richardson, J.E. Páramo is the world’s fastest evolving and coolest biodiversity hotspot. Frontiers in genetics 2013, 4, 192. [Google Scholar] [CrossRef] [PubMed]
- Bond, W.J.; Woodward, F.I.; Midgley, G.F. The global distribution of ecosystems in a world without fire. New Phytologist 2005, 165, 525–538. [Google Scholar] [CrossRef]
- Chuncho, C.; Chuncho, G. Páramos del Ecuador, importancia y afectaciones: Una revisión. Technical report, 2019.
- Sarmiento, P.C.E.; Cadena, V.C.E.; Sarmiento, G.M.V.; Zapata, J.J.A. Aportes a la conservación estratégica de los páramos de Colombia : actualización de la cartografía de los complejos de páramo a escala 1:100.000; 2013; p. 87.
- Borrelli, P.; Armenteras, D.; Panagos, P.; Modugno, S.; Schütt, B. The implications of fire management in the andean paramo: A preliminary assessment using satellite remote sensing. Remote Sensing 2015, 7, 11061–11082. [Google Scholar] [CrossRef]
- Le Stradic, S.; Alvarado, S.T.; Ríos, O.V.; Silveira, F.A.O.; Le Stradic, S.; Alvarado, S.T.; Ríos, O.V.; Silveira, F.A.O. Fire Ecology on Megadiverse Montane Grasslands 2025. pp. 187–211. [CrossRef]
- Keating, P.L. Fire ecology and conservation in the high tropical Andes: Observations from northern Ecuador. Journal of Latin American Geography 2007, 6, 43–62. [Google Scholar] [CrossRef]
- Young, B.E.; Young, K.R.; Josse, C. Vulnerability of Tropical Andean Ecosystems to Climate Change. Technical report, 2011.
- White, S. Grass páramo as hunter-gatherer landscape. The Holocene 2013, 23, 898–915. [Google Scholar] [CrossRef]
- Bush, M.B.; Rozas-Davila, A.; Raczka, M.; Nascimento, M.; Valencia, B.; Sales, R.K.; McMichael, C.N.; Gosling, W.D. A palaeoecological perspective on the transformation of the tropical Andes by early human activity, 2022. [CrossRef]
- Obando-Cabrera, L.; Díaz-Timoté, J.J.; Bastarrika, A.; Celis, N.; Hantson, S. The Paramo Fire Atlas: quantifying burned area and trends across the Tropical Andes. Environmental Research Letters 2025, 20. [Google Scholar] [CrossRef]
- Espinoza, I.G.; Franco-Gaviria, F.; Castañeda, I.; Robinson, C.; Room, A.; Berrío, J.C.; Armenteras, D.; Urrego, D.H. Holocene Fires and Ecological Novelty in the High Colombian Cordillera Oriental. Frontiers in Ecology and Evolution 2022, 10, 475. [Google Scholar] [CrossRef]
- Vásquez, D.L.; Balslev, H.; Sklenář, P. Human impact on tropical-alpine plant diversity in the northern Andes. Biodiversity and Conservation 2015, 24, 2673–2683. [Google Scholar] [CrossRef]
- Horn, S.P.; Kappelle, M. Fire in the páramo ecosystems of Central and South America. In Tropical Fire Ecology; Springer Berlin Heidelberg: Berlin, Heidelberg, 2009; pp. 505–539. [Google Scholar] [CrossRef]
- League, B.L.; Horn1, S.P. A 10 000 year record of Páramo fires in Costa Rica. Journal of Tropical Ecology 2000, 16, 747–752. [Google Scholar] [CrossRef]
- Carrión-Paladines, V.; Correa-Quezada, L.; Valdiviezo Malo, H.; Zurita Ruáles, J.; Pereddo Tumbaco, A.; Zambrano Pisco, M.; Lucio Panchi, N.; Jiménez Álvarez, L.; Benítez; Loján-Córdova, J. Exploring the ethnobiological practices of fire in three natural regions of Ecuador, through the integration of traditional knowledge and scientific approaches. Journal of Ethnobiology and Ethnomedicine 2024, 20, 60. [Google Scholar] [CrossRef]
- Gutiérrez-Salazar, P.; Ramsay, P.M. Physiognomic responses of páramo tussock grass to time since fire in northern Ecuador. Revista Peruana de Biología 2020, 27, 205–214. [Google Scholar] [CrossRef]
- Zomer, M.A.; Ramsay, P.M. Post-fire changes in plant growth form composition and diversity in Andean páramo grassland. Applied Vegetation Science 2021, 24, e12554. [Google Scholar] [CrossRef]
- Jones, M.W.; Abatzoglou, J.T.; Veraverbeke, S.; Andela, N.; Lasslop, G.; Forkel, M.; Smith, A.J.; Burton, C.; Betts, R.A.; van der Werf, G.R.; et al. Global and Regional Trends and Drivers of Fire Under Climate Change. Reviews of Geophysics 2022, 60, e2020RG000726. [Google Scholar] [CrossRef]
- Haas, O.; Keeping, T.; Gomez-Dans, J.; Prentice, I.C.; Harrison, S.P. The global drivers of wildfire. Frontiers in Environmental Science 2024, 12, 1438262. [Google Scholar] [CrossRef]
- Ochoa, C.; Bar-Massada, A.; Chuvieco, E. A European-scale analysis reveals the complex roles of anthropogenic and climatic factors in driving the initiation of large wildfires. Science of The Total Environment 2024, 917, 170443. [Google Scholar] [CrossRef] [PubMed]
- Calviño-Cancela, M.; Chas-Amil, M.L.; García-Martínez, E.D.; Touza, J. Interacting effects of topography, vegetation, human activities and wildland-urban interfaces on wildfire ignition risk. Forest Ecology and Management 2017, 397, 10–17. [Google Scholar] [CrossRef]
- Román-Cuesta, R.M.; Carmona-Moreno, C.; Lizcano, G.; New, M.; Silman, M.; Knoke, T.; Malhi, Y.; Oliveras, I.; Asbjornsen, H.; Vuille, M. Synchronous fire activity in the tropical high Andes: an indication of regional climate forcing. Global Change Biology 2014, 20, 1929–1942. [Google Scholar] [CrossRef]
- Zapata-Ríos, X.; Lopez-Fabara, C.; Navarrete, A.; Torres-Paguay, S.; Flores, M. Spatiotemporal patterns of burned areas, fire drivers, and fire probability across the equatorial Andes. Journal of Mountain Science 2021, 18, 952–972. [Google Scholar] [CrossRef]
- Díaz, S.C.; Quezada, L.C.; Álvarez, L.J.; Loján-Córdova, J.; Carrión-Paladines, V. Indigenous use of fire in the paramo ecosystem of southern Ecuador: a case study using remote sensing methods and ancestral knowledge of the Kichwa Saraguro people. Fire Ecology 2023, 19, 1–18. [Google Scholar] [CrossRef] [PubMed]
- Zomer, M.A. Fire Ecology of Northern Andean grasslands: Estimating recent fire history and its impact on páramo plants 2016.
- Oliveras, I.; Anderson, L.O.; Malhi, Y. Application of remote sensing to understanding fire regimes and biomass burning emissions of the tropical Andes. Global Biogeochemical Cycles 2014, 28, 480–496. [Google Scholar] [CrossRef]
- Zomer, M.A.; Ramsay, P.M. The impact of fire intensity on plant growth forms in high-altitude Andean grassland. bioRxiv, 2020. [Google Scholar] [CrossRef]
- Vargas-Ríos, O. Bases ecológicas y sociales para la restauración de los páramos. Technical report, 2021.
- Zomer, M.A.; Ramsay, P.M. Espeletia giant rosette plants are reliable biological indicators of time since fire in andean grasslands. Plant Ecology 2018, 219, 79–88. [Google Scholar] [CrossRef]
- Luteyn, J.L. Páramos: A checklist of Plant Diversity, Geographical Distribution and Botanical Literature. Technical report, 1999.
- Balslev, H.; Luteyn, J.L. Paramo: an Andean ecosystem under human influence. Paramo: an Andean ecosystem under human influence. 1992.
- Curatola Fernández, G.F.; Obermeier, W.A.; Gerique, A.; López Sandoval, M.F.; Lehnert, L.W.; Thies, B.; Bendix, J. Land cover change in the Andes of southern Ecuador-Patterns and drivers. Remote Sensing 2015, 7, 2509–2542. [Google Scholar] [CrossRef]
- Olson, D.M.; Dinerstein, E.; Wikramanayake, E.D.; Burgess, N.D.; Powell, G.V.; Underwood, E.C.; D’Amico, J.A.; Itoua, I.; Strand, H.E.; Morrison, J.C.; et al. Terrestrial ecoregions of the world: A new map of life on Earth, 2001. [CrossRef]
- Peyre, G.; Osorio, D.; François, R.; Anthelme, F. Mapping the páramo land-cover in the Northern Andes. International Journal of Remote Sensing 2021, 42, 7777–7797. [Google Scholar] [CrossRef]
- Burbano-Girón, J.; Molina Berbeo, M.A.; Gutiérrez Montoya, C.; Ochoa-Quintero, J.M. Estado de conservación de los páramos en colombia. Biodiversidad 2020. Estado y tendencias de la biodiversidad continental de Colombia 2020. [Google Scholar]
- Parques Nacionales Naturales de Colombia (PNN). Mapa de áreas protegidas de Colombia (RUNAP). Shapefile y metadatos, 2023.
- Instituto de Hidrología Meteorología y Estudios Ambientales (IDEAM).; Ministerio de Ambiente y Desarrollo Sostenible (MADS). Actualización de cifras de monitoreo de la superficie de bosque – Año 2024. Resumen de resultados de monitoreo. Technical report, República de Colombia, 2025.
- Instituto Geográfico Agustín Codazzi (IGAC). Cartograf\’\ia vectorial a escala 1:100,000 con cobertura total de la República de Colombia, 2022.
- Centro Nacional de Memoria Histórica (CNMH). Geoportal de Datos Abiertos: Casos Acciones bélicas, 2022.
- Instituto de Hidrología Meteorología y Estudios Ambientales (IDEAM). Cobertura de la Tierra. Metodolog\’\ia CORINE Land Cover Adaptada para Colombia. Per\’\iodo 2018. República de Colombia. Escala 1:100,000, 2021.
- Abatzoglou, J.T.; Dobrowski, S.Z.; Parks, S.A.; Hegewisch, K.C. TerraClimate, a high-resolution global dataset of monthly climate and climatic water balance from 1958–2015. Scientific Data 2018, 5, 170191. [Google Scholar] [CrossRef]
- Instituto Geográfico Agustín Codazzi (IGAC). Modelo Digital de Elevación. Colombia. SRTM 30 metros, 2011.
- Correa Ayram, C.; Etter, A.; Díaz-Timoté, J.; Buriticá, S.; Ramírez, W.; Corzo, G. Spatiotemporal evaluation of the human footprint in Colombia: Four decades of anthropic impact in highly biodiverse ecosystems, 2020. [CrossRef]
- Collins, L.; McCarthy, G.; Mellor, A.; Newell, G.; Smith, L. Training data requirements for fire severity mapping using Landsat imagery and random forest. Remote Sensing of Environment 2020, 245, 111839. [Google Scholar] [CrossRef]
- Ma, W.; Feng, Z.; Cheng, Z.; Chen, S.; Wang, F. Identifying Forest Fire Driving Factors and Related Impacts in China Using Random Forest Algorithm. Forests 2020, Vol. 11, Page 507 2020, 11, 507. [Google Scholar] [CrossRef]
- Oliveira, S.; Oehler, F.; San-Miguel-Ayanz, J.; Camia, A.; Pereira, J.M. Modeling spatial patterns of fire occurrence in Mediterranean Europe using Multiple Regression and Random Forest. Forest Ecology and Management 2012, 275, 117–129. [Google Scholar] [CrossRef]
- Breiman, L. Random forests. Machine Learning 2001, 45, 5–32. [Google Scholar] [CrossRef]
- Friedman, J.H. Greedy Function Approximation: A Gradient Boosting Machine on JSTOR.
- Hijmans, R. terra: Spatial Data Analysis. R package version 1.8-73, 2025.
- Taiyun, W.; Viliam, S. R package ’corrplot’: Visualization of a Correlation Matrix (Version 0. 95) 2024. [Google Scholar]
- Zhang, X.; Lu, X.; Wang, X. Spatial-Temporal NDVI Variation of Different Alpine Grassland Classes and Groups in Northern Tibet from 2000 to 2013. https://doi.org/10.1659/MRD-JOURNAL-D-14-00110.1 2015, 35, 254–263. [CrossRef]
- Chuvieco, E.; Cocero, D.; Riaño, D.; Martin, P.; Martínez-Vega, J.; de la Riva, J.; Pérez, F. Combining NDVI and surface temperature for the estimation of live fuel moisture content in forest fire danger rating. Remote Sensing of Environment 2004, 92, 322–331. [Google Scholar] [CrossRef]
- Podwojewski, P.; Poulenard, J. La degradación de los suelos de los páramos Risque hydrométéorologique à Quito View project PALAS : PAleoclimate from LAke Sediments on Kerguelen Archipelago View project. Technical report, 2000.
- Convention on Biological Diversity (CBD). Colombia: Country dossier 2021 – National Biodiversity Strategy and Action Plan / Protected Areas Management Effectiveness. Technical report, Convention on Biological Diversity (CBD), 2021.
Figure 1.
Location of the study area showing all Colombian páramos.
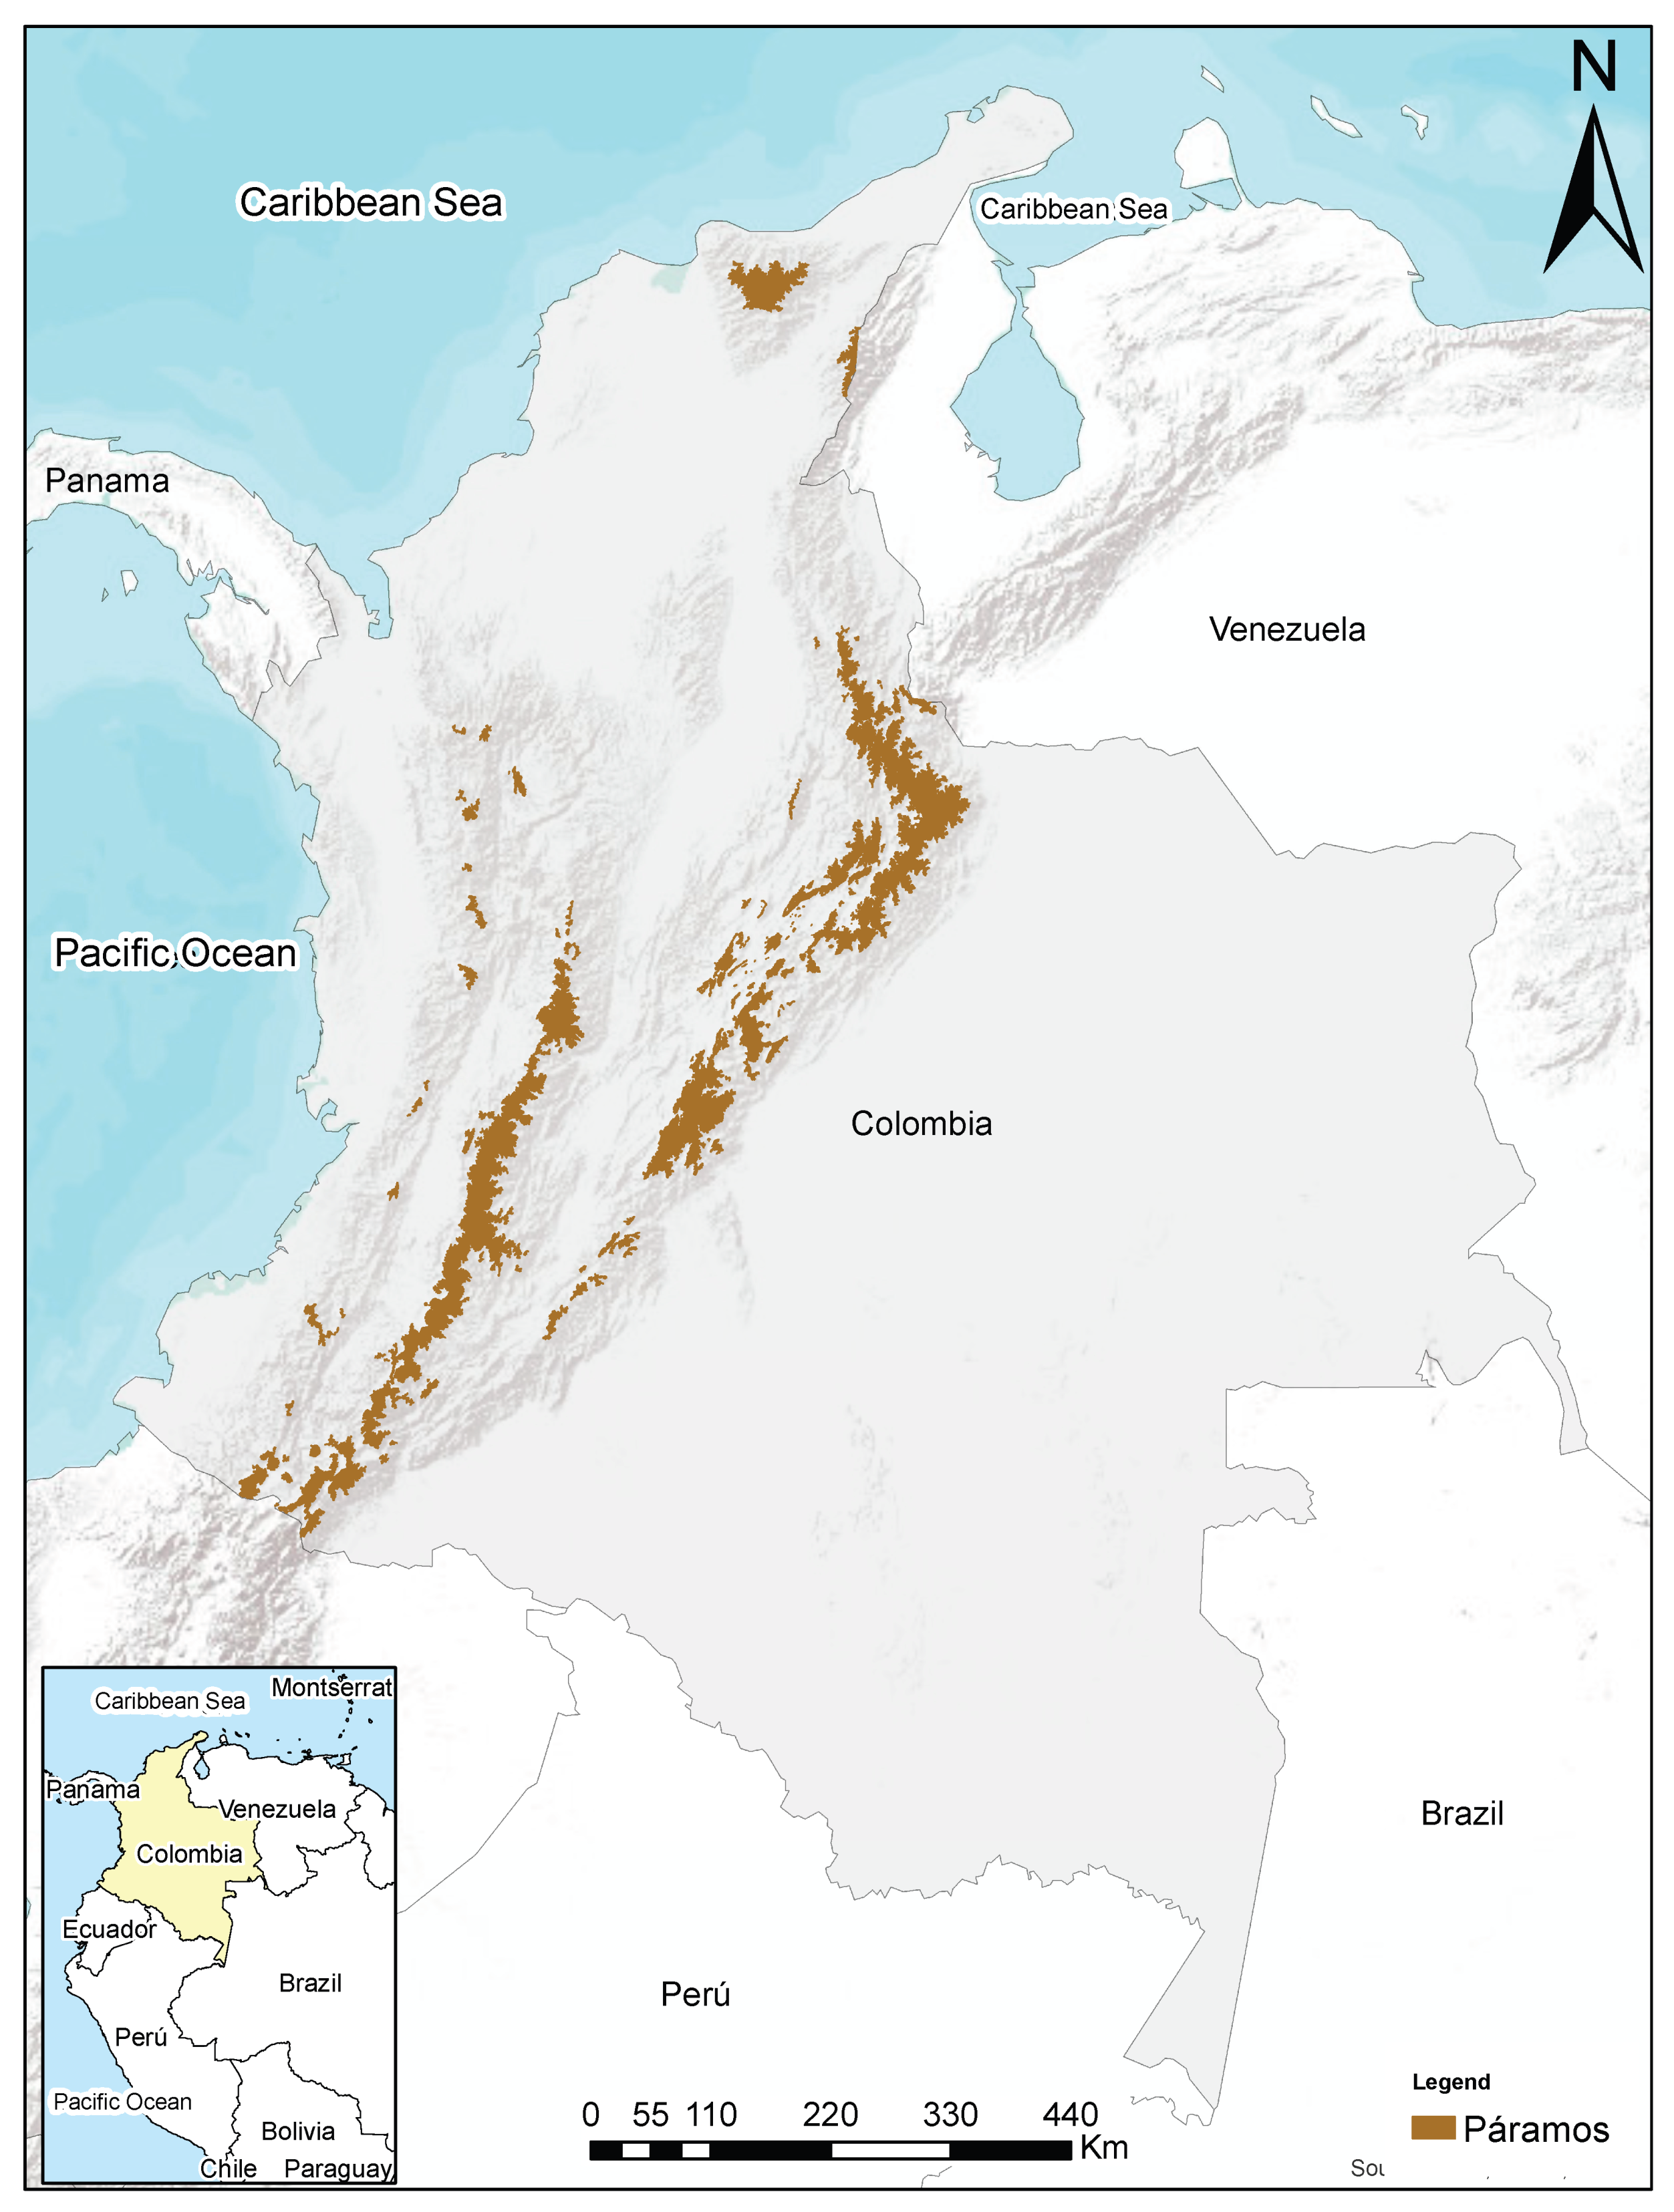
Figure 2.
Example of the burned area dataset for one páramo unit. Shown is the Tota-Bijagual-Mamapacha páramo unit, where annual fire scars are distinguished by different colors.
Figure 2.
Example of the burned area dataset for one páramo unit. Shown is the Tota-Bijagual-Mamapacha páramo unit, where annual fire scars are distinguished by different colors.
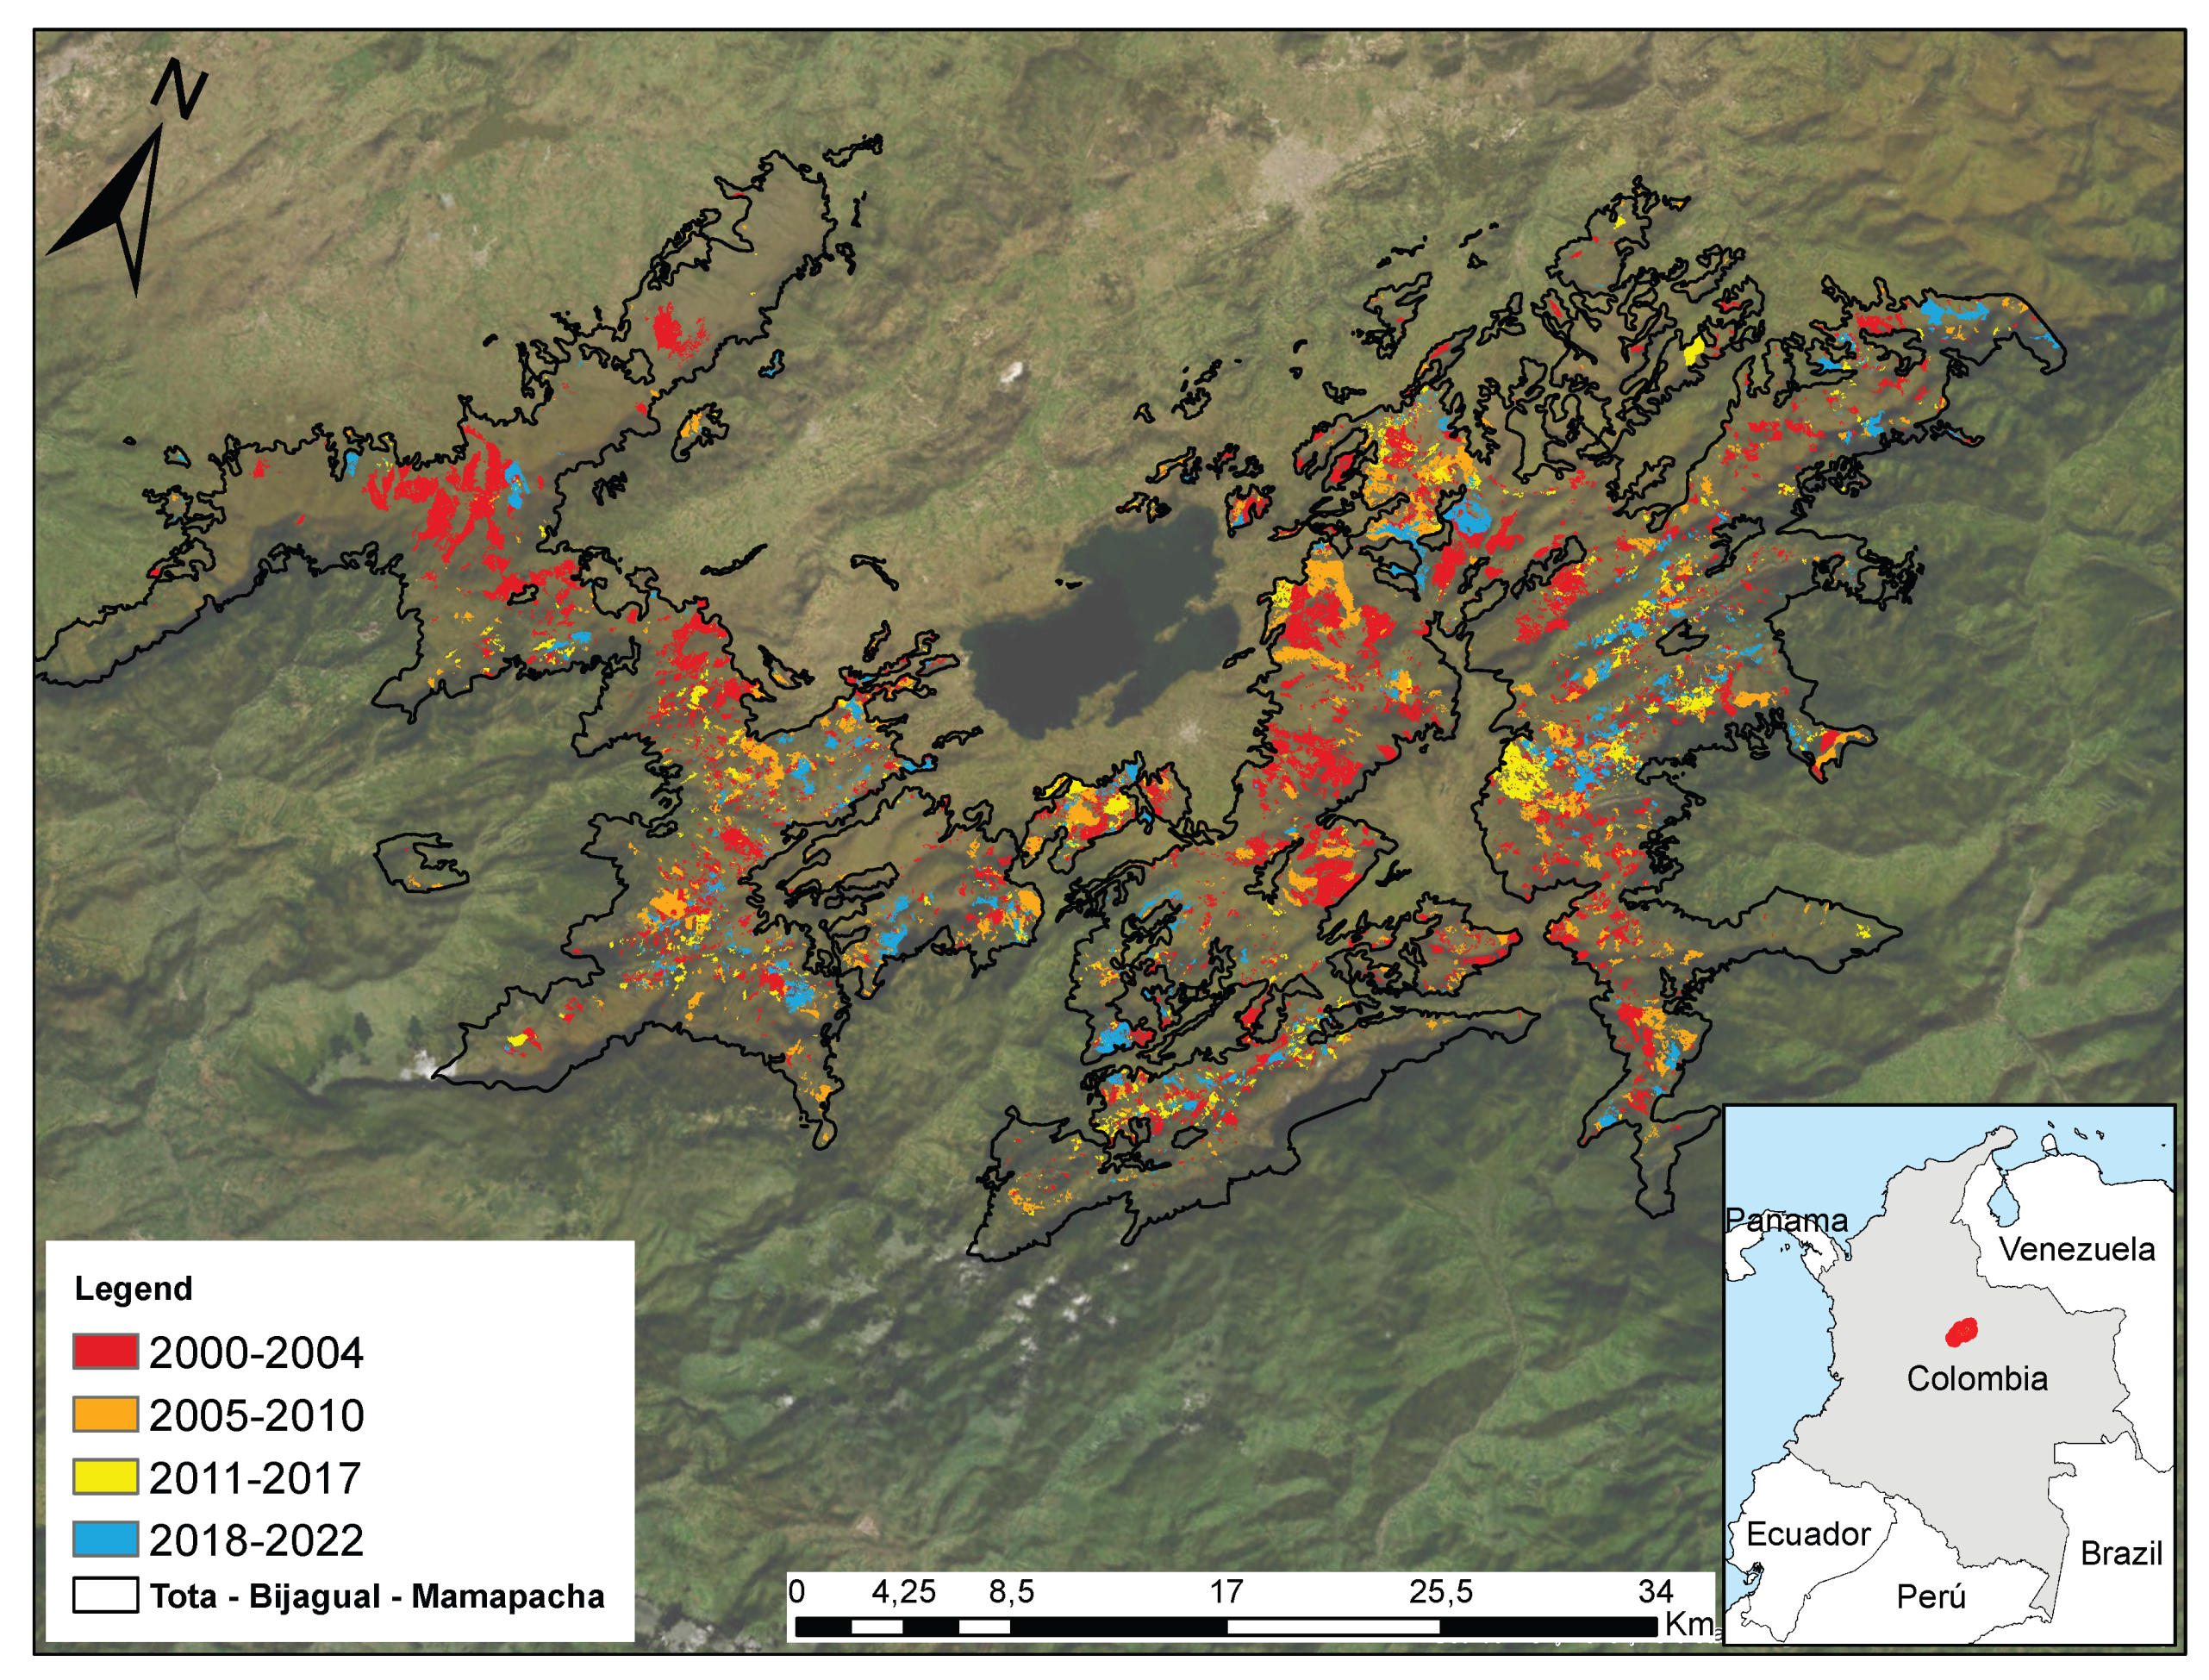
Figure 3.
Percentage of burned area of each páramo unit in Colombia from 2000 to 2022 based on data from the páramo Fire Atlas [13]. Each páramo unit is numbered from 1 to 36 to facilitate its location on the map.
Figure 3.
Percentage of burned area of each páramo unit in Colombia from 2000 to 2022 based on data from the páramo Fire Atlas [13]. Each páramo unit is numbered from 1 to 36 to facilitate its location on the map.
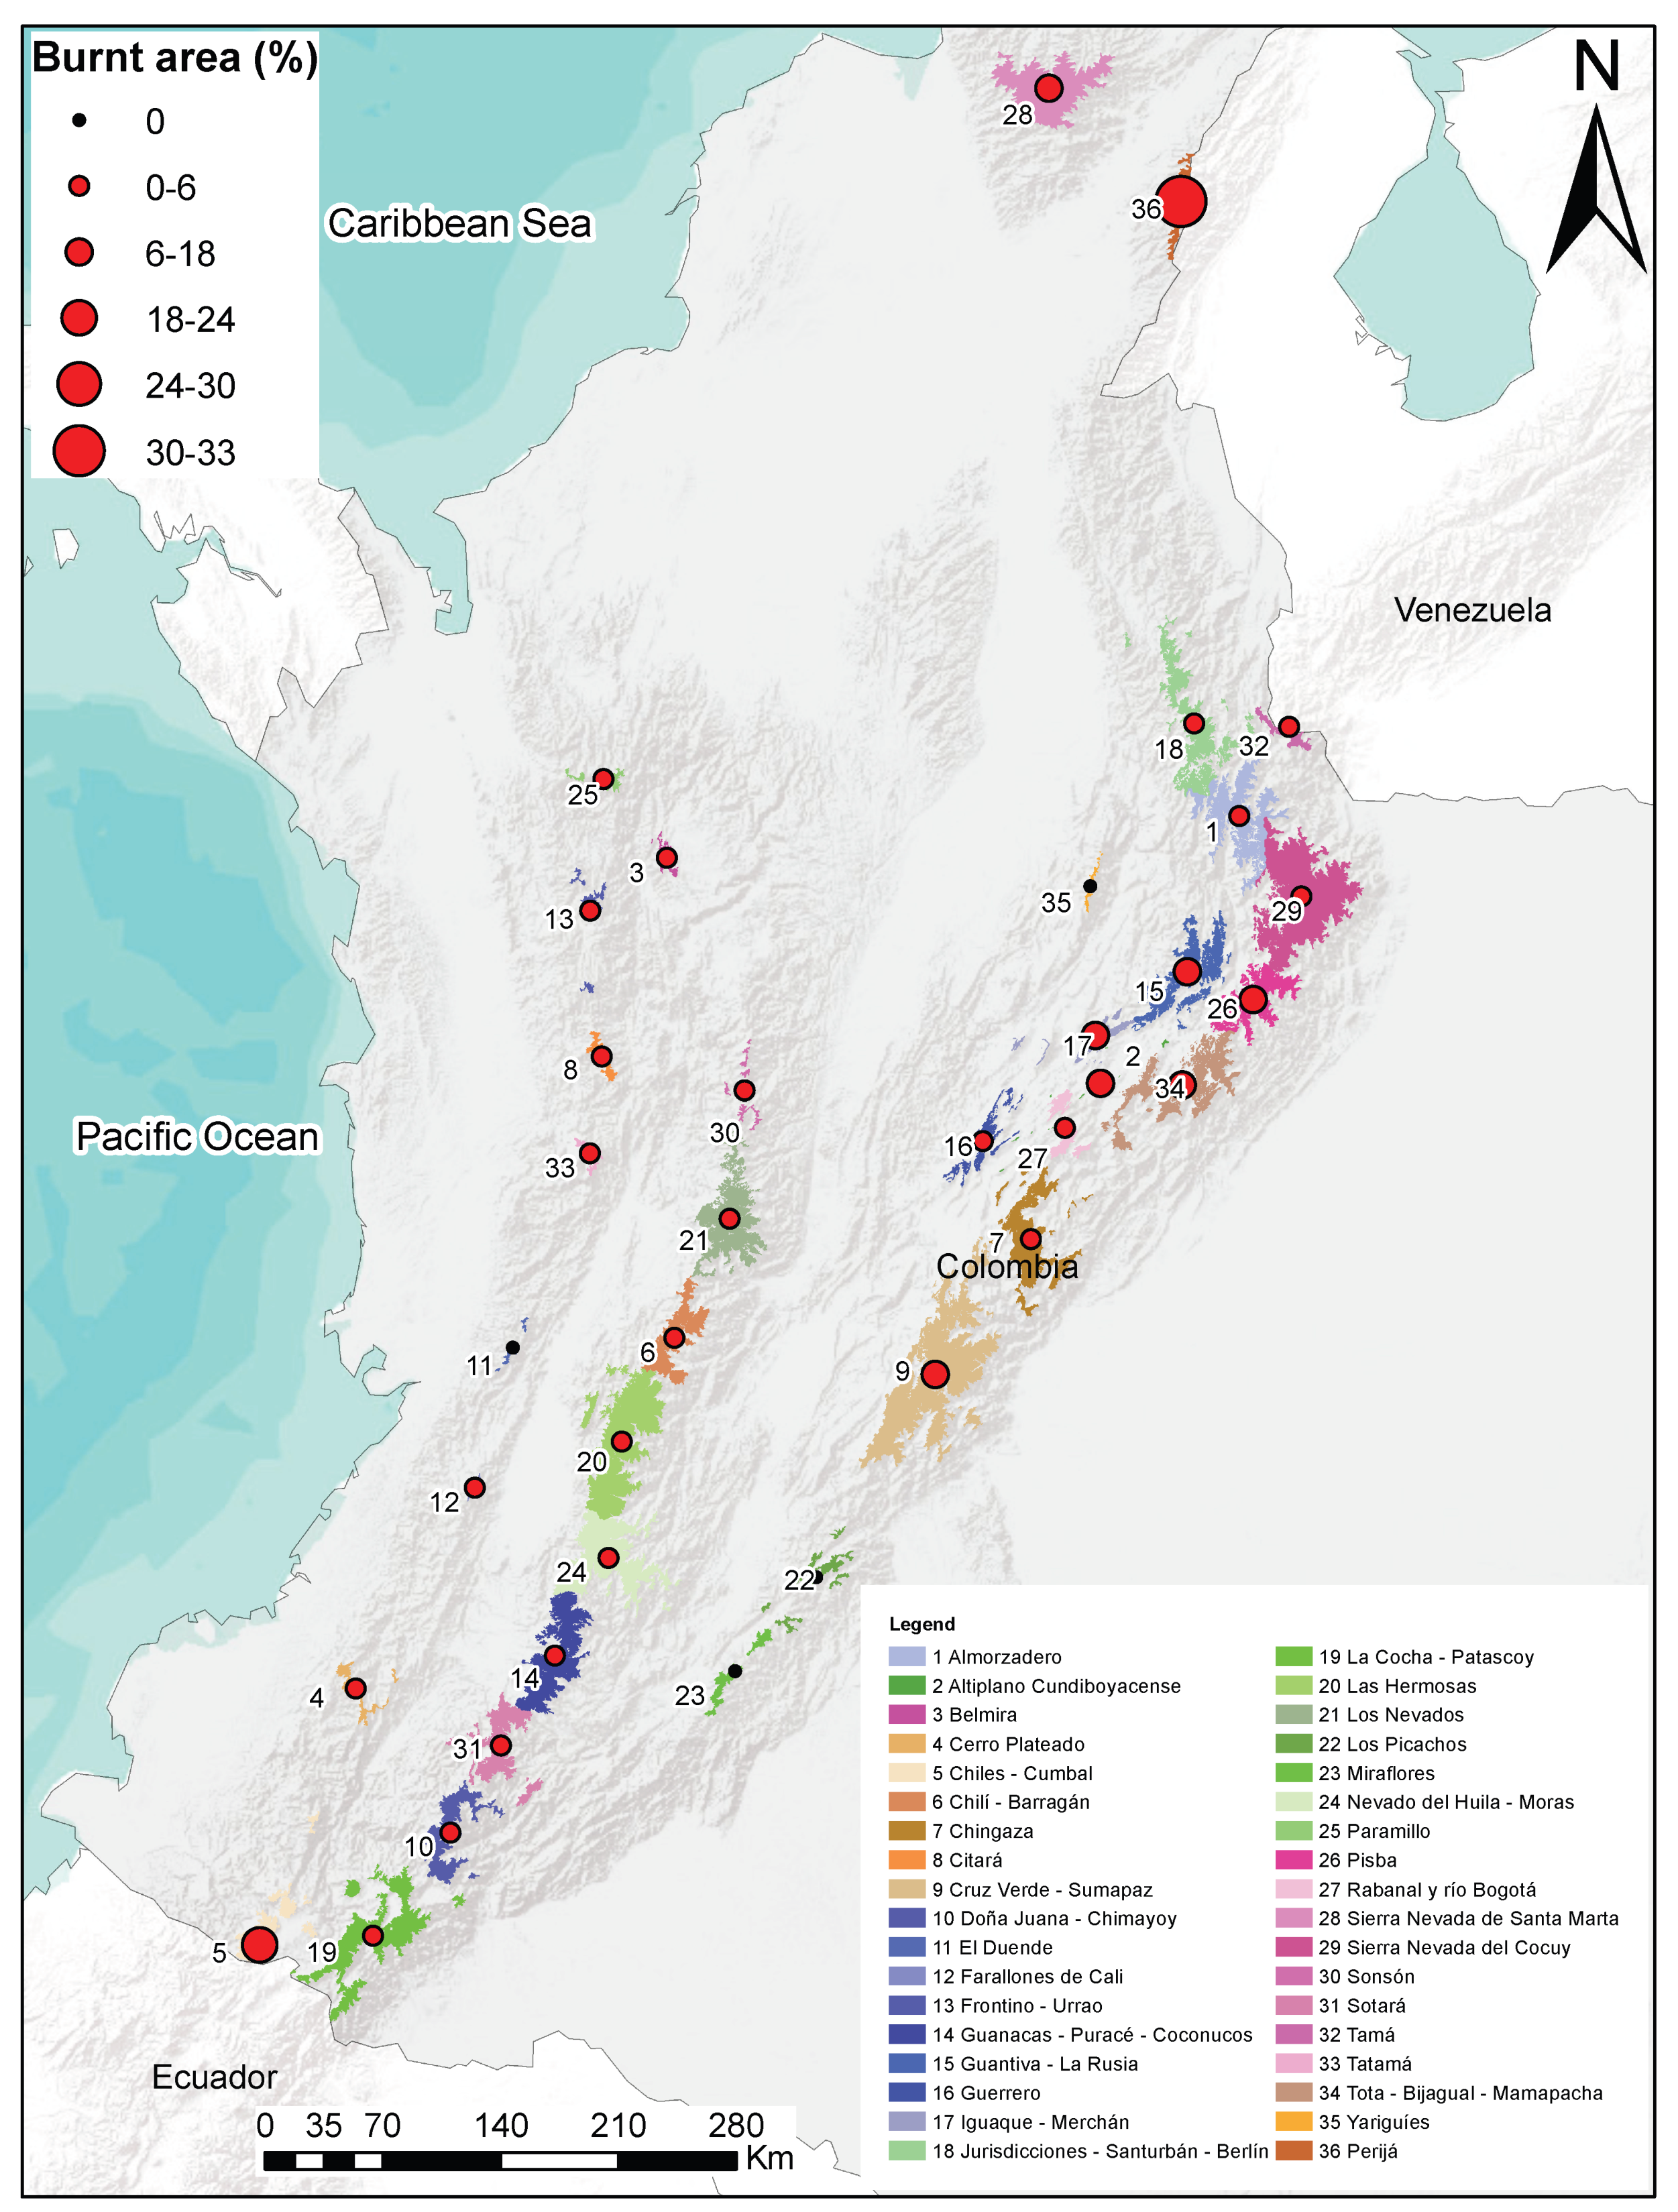
Figure 4.
Top 10 páramo units with the largest burned area between 2000 and 2022. Values indicate the total burned area per páramo unit and include all categories of protected areas. Data for all páramo units are provided in Supplementary Table A2.
Figure 4.
Top 10 páramo units with the largest burned area between 2000 and 2022. Values indicate the total burned area per páramo unit and include all categories of protected areas. Data for all páramo units are provided in Supplementary Table A2.
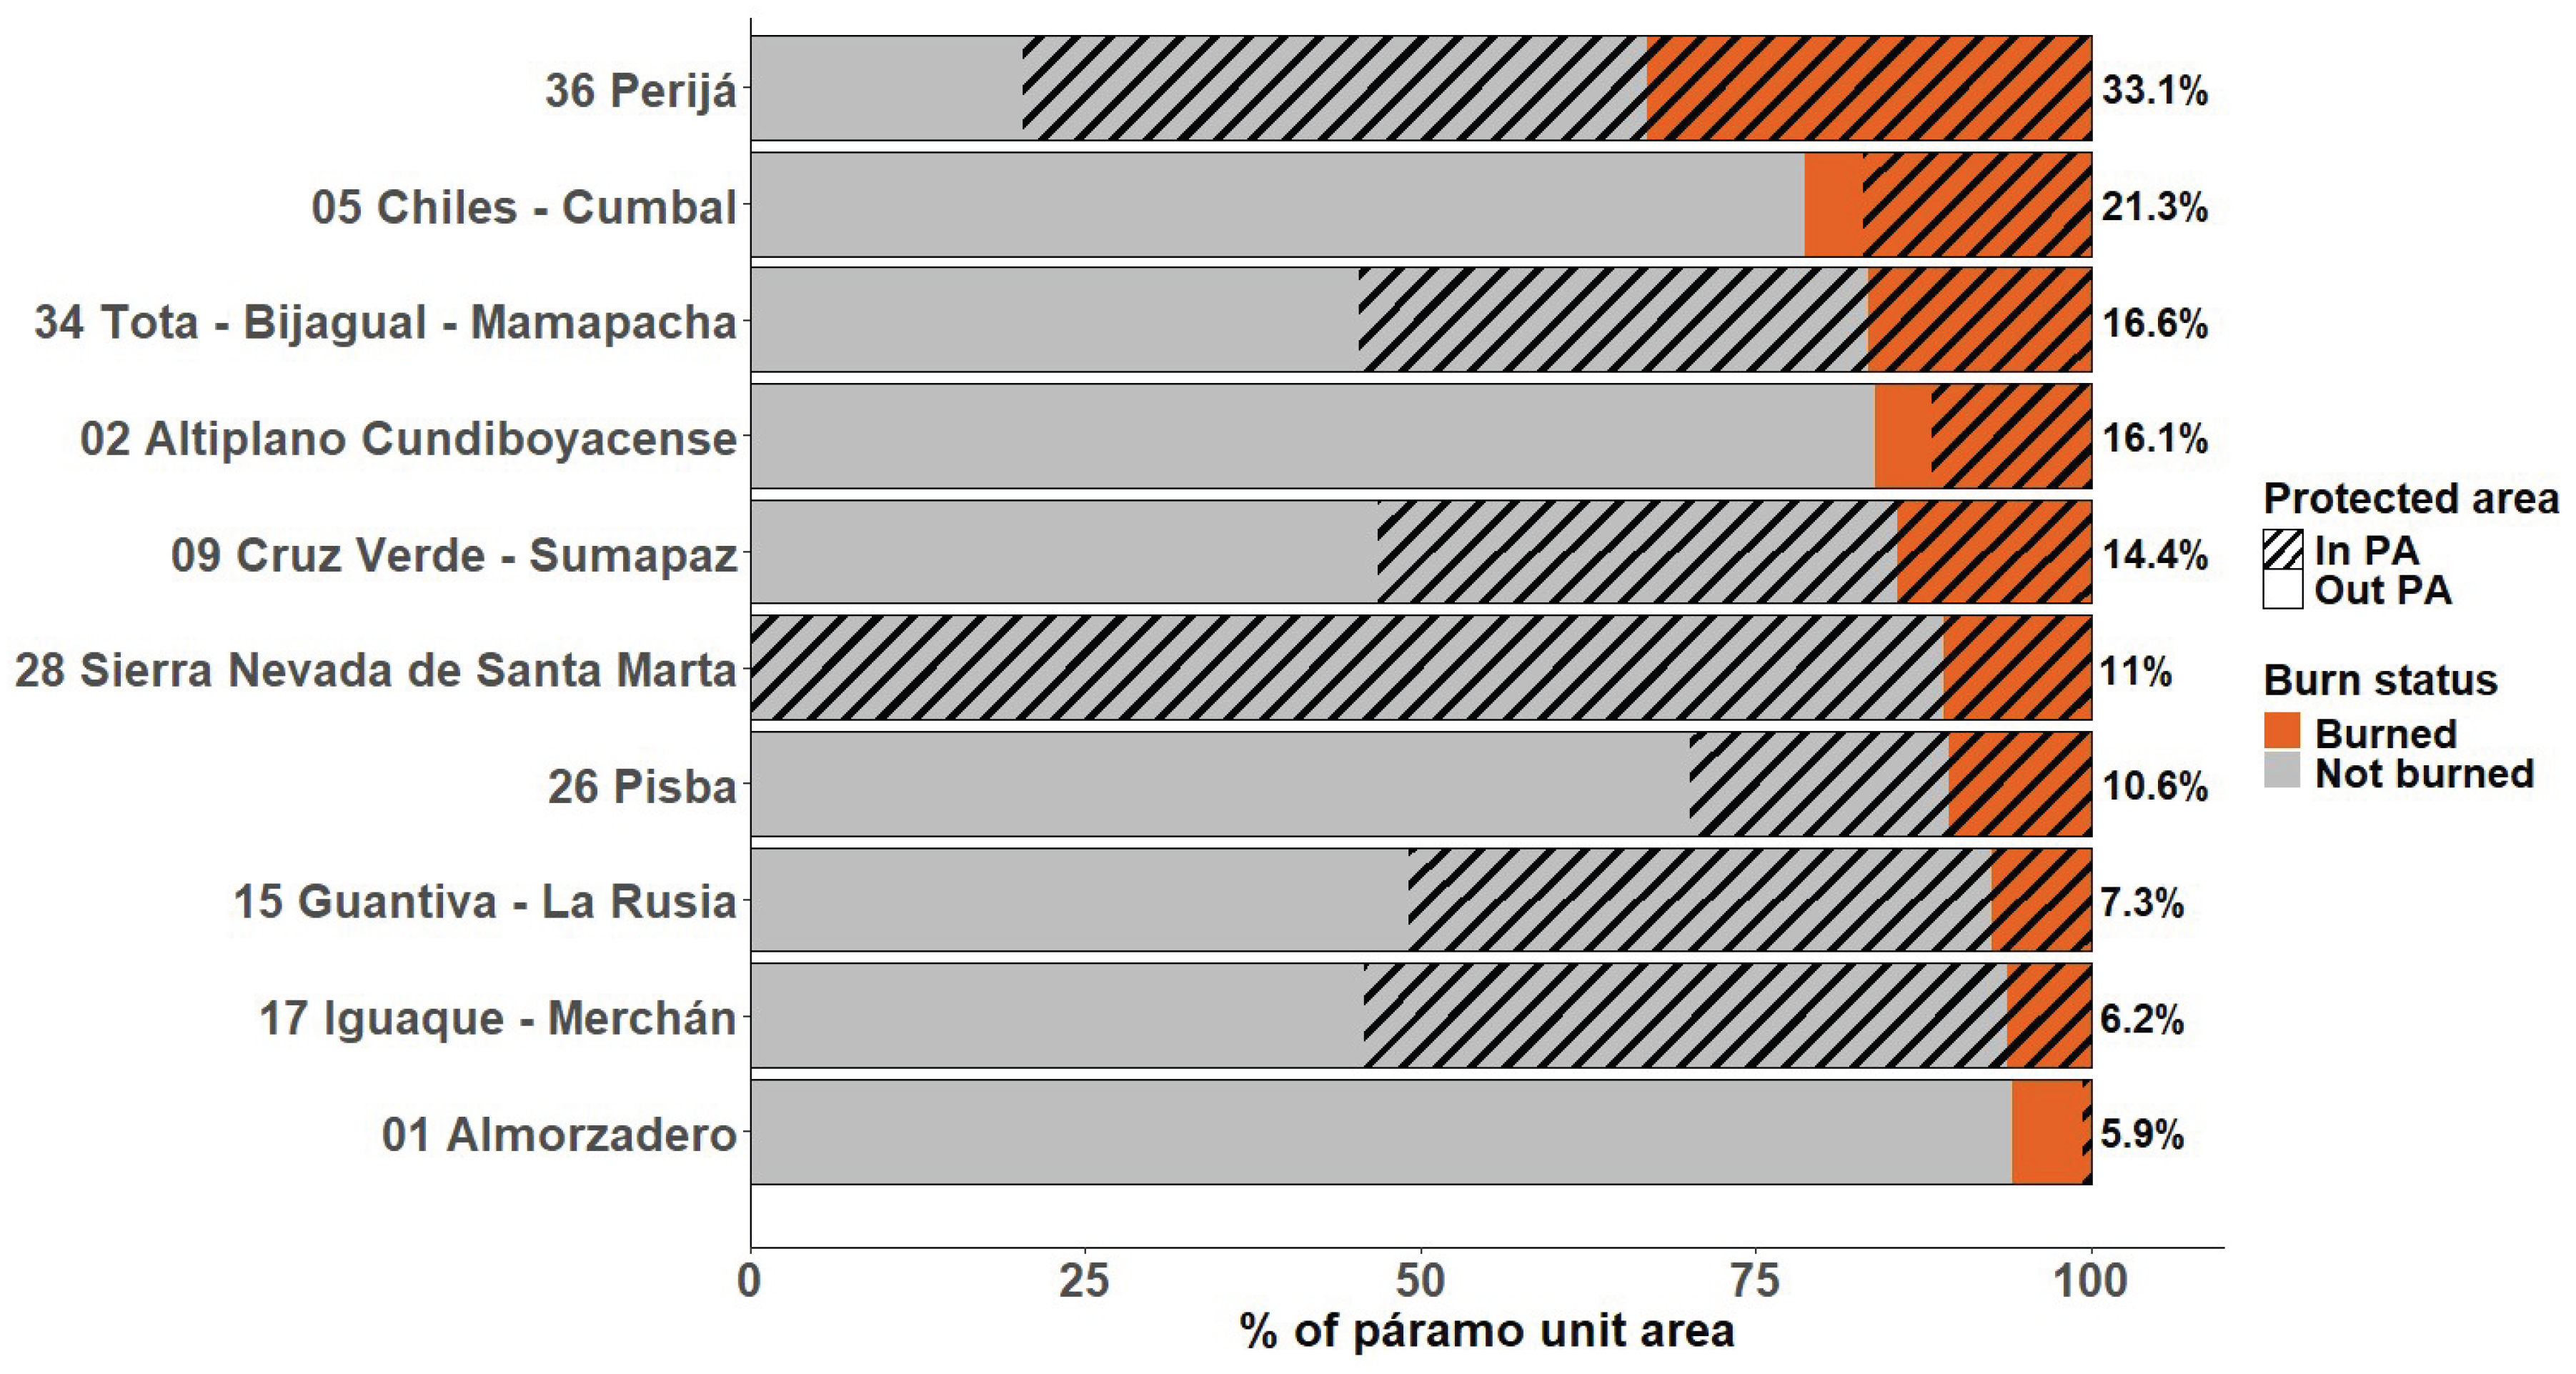
Figure 5.
Variable importance of biophysical and anthropogenic predictors for burned area. Variable importance was assessed using the percentage increase in mean squared error (%IncMSE) from the Random Forest model. Predictors are grouped by category (biophysical and anthropogenic). The abbreviated variable names are in Table 1.
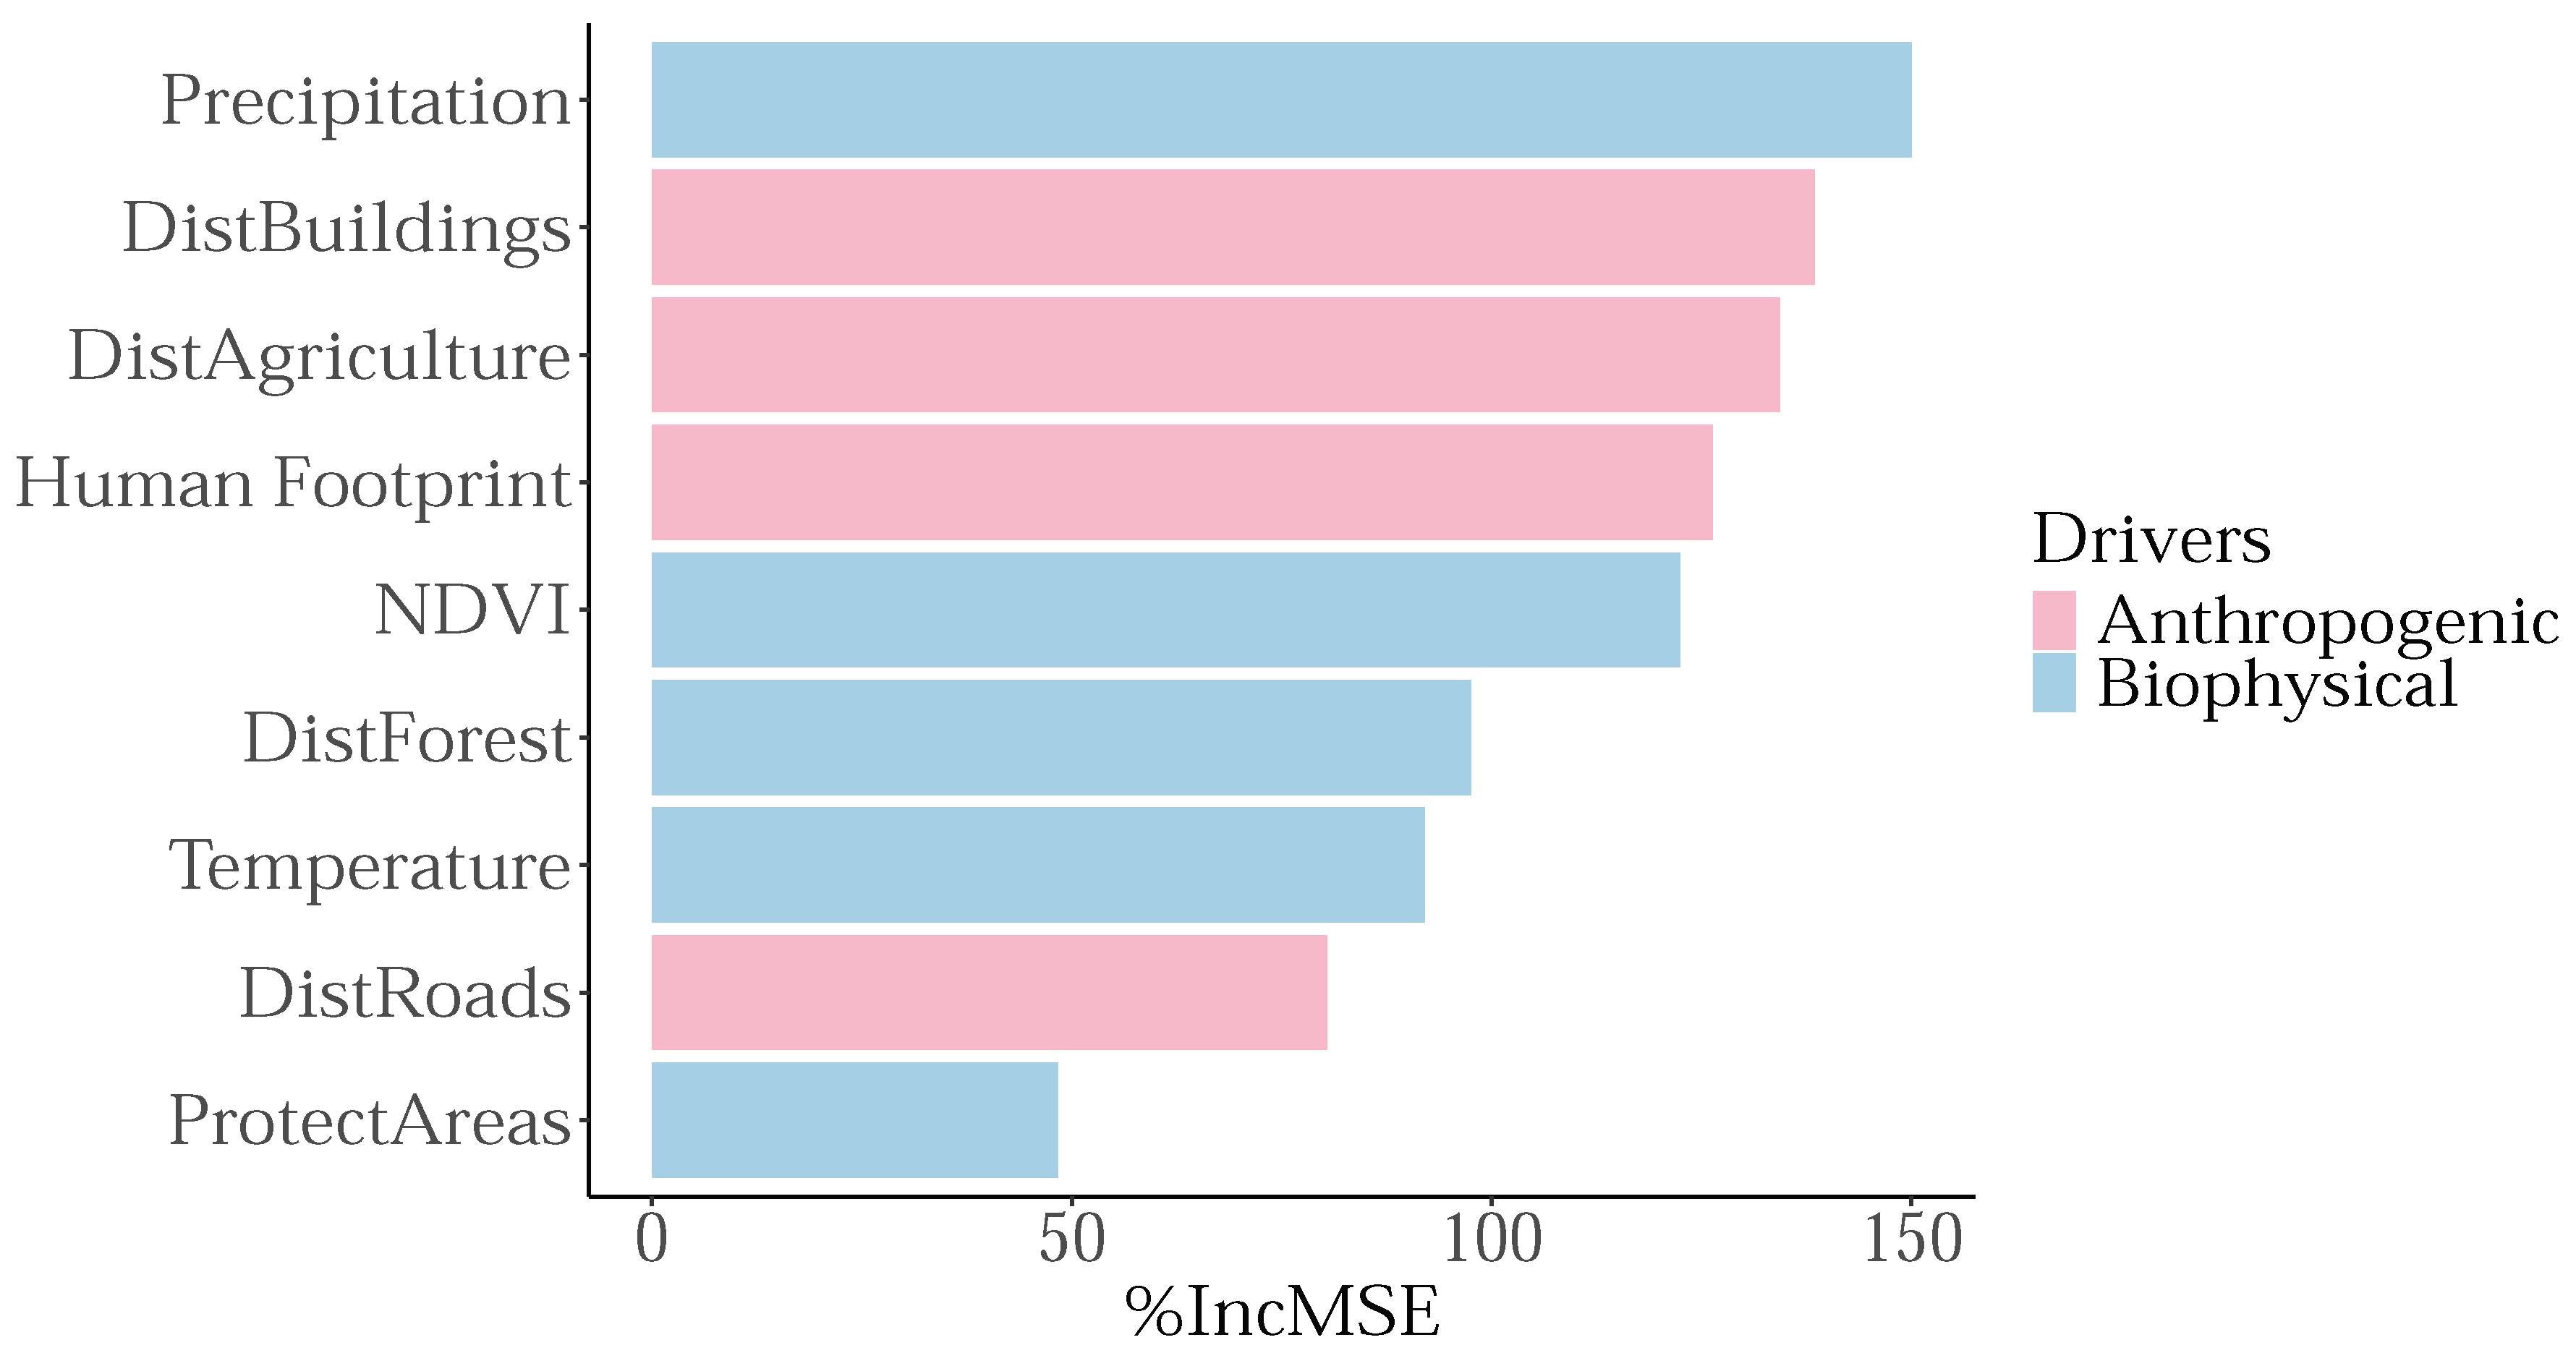
Figure 6.
Partial dependence plots of each páramo fire driving. The partial dependence plots show the values of the predictor variables (x-axis) and the average model response (in this case, the percentage of area burned predicted by the model), holding all other variables constant (y-axis). Thresholds are in Table A3.
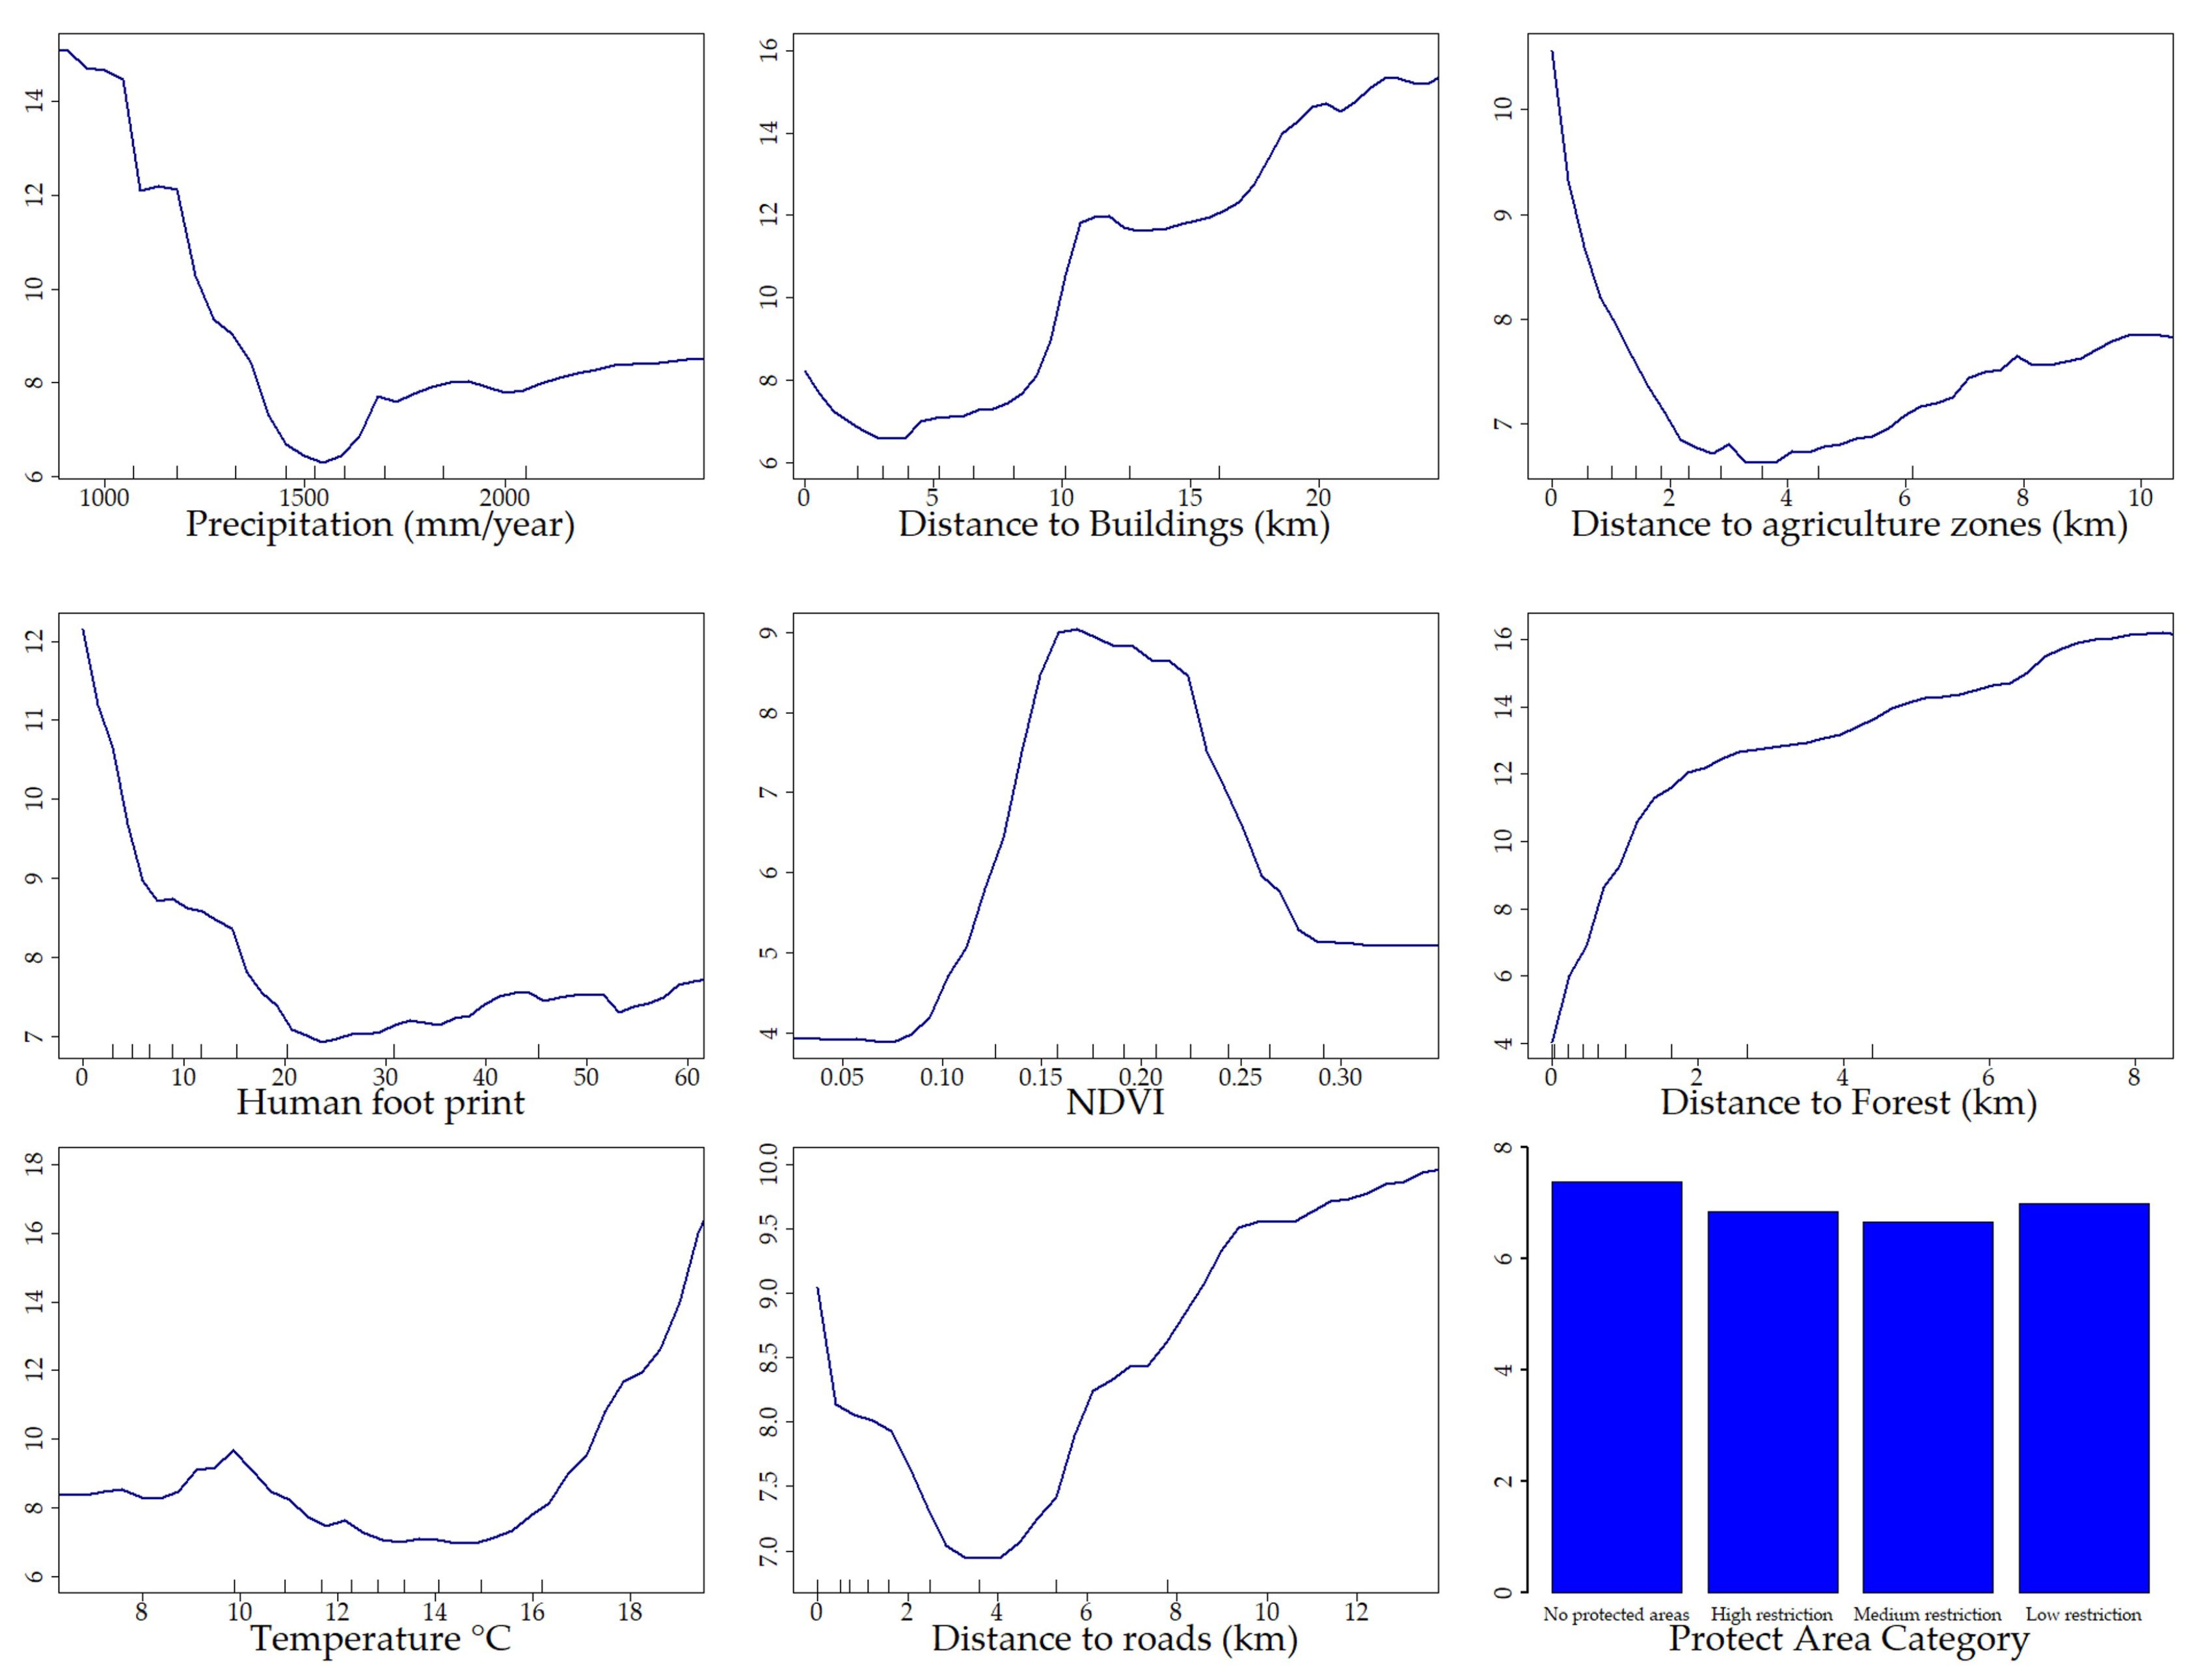
Table 1.
Spatial variables used as predictors, with definitions and sources.
| Spatial variable (Abbrev.) | Description | Reference | Data source (URL) | Resolution/Scale | Time series |
|---|---|---|---|---|---|
| Distance to Forest (DistForest, DF) | Euclidean distance from forest in km calculated for the forest to the nearest source. | IDEAM (2024)[40] | https://www.ideam.gov.co/transparencia/datos-abiertos/seccion-de-datos-abiertos/resultados-monitoreo-de-bosques | 30 m | 2024 |
| Distance to buildings (DistBuildings, DB) | Euclidean distance from buildings in km calculated for the buildings to the nearest source. | IGAC (2022)[41] | https://www.colombiaenmapas.gov.co/?e=-82.43784778320864,-0.17644239911865092,-71.23179309571162,9.90326984502256,4686&b=igac&u=0&t=23&servicio=205 | 1:100,000 | 2016–2022 |
| Distance to roads (DistRoads, DR) | Euclidean distance from roads in km calculated for the roads to the nearest source. | IGAC (2022)[41] | https://www.colombiaenmapas.gov.co/?e=-82.43784778320864,-0.17644239911865092,-71.23179309571162,9.90326984502256,4686&b=igac&u=0&t=23&servicio=205 | 1:100,000 | 2014–2016 |
| Log conflict density (ConflictDens_log, CDl) | Based on kernel density from conflict-related places; transformation was applied due to strong concentration near zero. | CNMH (2022)[42] | https://geoportal-de-datos-abiertos-cnmh-cnmh.hub.arcgis.com/datasets/285a0cfe6aa34f65ab49c95aee298d0e_1/about | 30 m | 1980–2024 |
| Distance to agricultural areas (DistAgriculture, DA) | Euclidean distance from agricultural areas in km to the nearest source. | IDEAM (2021)[43] | https://www.colombiaenmapas.gov.co/?e=-90.24363391601412,-5.572398896778716,-55.74656360352328,13.859268426770145,4686&b=igac&l=881&u=0&t=4302&servicio=881 | 1:100,000 | 2018 |
| Precipitation (P) | Multi-annual accumulated precipitation from TerraClimate. | TerraClimate (2024)[44] | https://www.climatologylab.org/terraclimate.html | 4,000 m | 2000–2022 |
| Max Temperature (°C) (T) | Multi-year mean of maximum temperature from TerraClimate. | TerraClimate (2024)[44] | https://www.climatologylab.org/terraclimate.html | 4,000 m | 2000–2022 |
| Elevation (E) | Altitude above sea level. | IGAC (2011)[45] | https://www.colombiaenmapas.gov.co/?e=-82.66306750976614,-1.8784752954619761,-65.83201282227061,11.877955613394604,4686&b=igac&u=0&t=23&servicio=159 | 30 m | 2011 |
| NDVI (NDVI) | Median normalized difference vegetation index computed from Landsat 5, 7, 8, and 9. | Processing was performed in Google Earth Engine using code developed by the authors of this study | https://code.earthengine.google.com/b14e1f08d76eb28c45e35148517f485d | 30 m | 2000–2024 |
| Human footprint (HFP) | Degree of impact of human activities (0=no impact, 100=maximum impact). | Correa et al. (2020)[46] | https://geonetwork.humboldt.org.co/geonetwork/srv/spa/catalog.search#/metadata/e29b399c-24ee-4c16-b19c-be2eb1ce0aae | 300 m | 1990–2015 |
| Protected Areas (PA) | Boundary of protected areas in Colombia. | RUNAP (2025)[39] | https://storage.googleapis.com/pnn_geodatabase/runap/latest.zip | 1:100,000 | 2025 |
Disclaimer/Publisher’s Note: The statements, opinions and data contained in all publications are solely those of the individual author(s) and contributor(s) and not of MDPI and/or the editor(s). MDPI and/or the editor(s) disclaim responsibility for any injury to people or property resulting from any ideas, methods, instructions or products referred to in the content. |
© 2025 by the authors. Licensee MDPI, Basel, Switzerland. This article is an open access article distributed under the terms and conditions of the Creative Commons Attribution (CC BY) license (http://creativecommons.org/licenses/by/4.0/).
Copyright: This open access article is published under a Creative Commons CC BY 4.0 license, which permit the free download, distribution, and reuse, provided that the author and preprint are cited in any reuse.


