
Submitted:
13 October 2025
Posted:
14 October 2025
You are already at the latest version
Abstract
Coal mining leaves behind extensive tailings dumps that pose long-term ecological and soil degradation challenges. This study investigates the restoration potential of vegetation on coal mine tailings in the Jiu Valley, Romania, focusing on soil nutrient dynamics and heavy metal distribution. Field sampling was conducted across three vegetation types—unvegetated (UV), herbaceous (HV), and arboreal (AV, Robinia pseudoacacia)—at two intervals: three- and six-years post-plantation. Soil samples were analyzed for pH, organic carbon, macronutrients, micronutrients, and heavy metals using standardized spectrometric and titrimetric methods. Results showed that vegetated plots, particularly AV, exhibited significant improvements in total nitrogen, organic carbon, and base cation availability, alongside reductions in pH and certain heavy metals. HV plots demonstrated enhanced manganese and copper mobilization, while UV soils retained higher levels of total potassium and zinc, likely due to limited biological uptake. Heavy metal concentrations remained below European safety thresholds for lead and chromium, though nickel levels exceeded recommended limits across all variants. Vegetation type influenced nutrient cycling and metal stabilization, with arboreal cover showing the most consistent ameliorative effects. These findings underscore the role of targeted revegetation in improving soil quality and mitigating ecological risks in post-mining landscapes.
Keywords:
soil
; nutrients
; heavy metals
; metal(loid)s
; revegetation/vegetation
; mine waste/tailings
1. Introduction
Coal mining has long driven industrial growth, yet its legacy—waste dumps and tailings—continues to degrade ecosystems and soil health well beyond site closure. With sustainability now a global priority, restoring these landscapes has become increasingly urgent [1]. Surface mining severely disrupts soil structure and microbial communities, impairing nutrient cycling and ecological resilience. Effective reclamation must rebuild soil fertility and biodiversity to support future land use [2]. Beyond ecological recovery, the integration of tailings dumps into agricultural use offers a dual benefit: mitigating mining’s environmental impact while promoting sustainable development with lasting economic, ecological, and social gains.
In Romania, mining activities have affected roughly 17,000 hectares, leaving behind 137 waste dumps and six tailing ponds containing nearly 2 billion cubic meters of residual material. Yet, only a fraction—about 2,000 hectares—has been reclaimed. The Jiu Valley region exemplifies both the scale of degradation and the promise of restoration, with 64 dumps covering over 250 hectares and holding approximately 37 million cubic meters of waste [3]. Sites like the dormant E.M. Uricani dump underscore the pressing need for eco-logical rehabilitation, especially as Romania advances toward sustainable land use and a green economy [4,5].
Tailings dumps are typically marked by poor structure, low biological activity, and severe nutrient deficiencies, despite containing macronutrients (N, P, K, Ca, Mg) and micronutrients (Fe, Cu, Mn, Mo, Zn) alongside heavy metals that complicate reclamation efforts [6]. Their coarse texture, high bulk density, and limited water infiltration hinder natural regeneration, which can take several generations—nitrogen levels alone may require up to 200 years to match those of native forest soils [7]. Reclaimed soils often lose up to 80% of organic carbon and 50% of total nitrogen compared to undisturbed counterparts [8], though long-term studies show that soil properties can improve over time, following polynomial recovery trajectories influenced by substrate composition, topography, microclimate, and reclamation strategy [9,10,11]. Technical reclamation typically involves land reshaping, amendment application, and vegetation establishment to stabilize substrates and initiate ecological succession [12]. Vegetation enhances soil development through root growth, litter deposition, and exudates that stimulate microbial communities essential for nutrient cycling and detoxification [13,14]. Robinia pseudoacacia is widely used for its nitrogen-fixing ability and tolerance to poor soils [9,15], while spontaneous succession—though slower—promotes biodiversity, improves soil structure, and attenuates heavy metals through natural ecological processes [16,17].
To evaluate the agricultural viability of reclaimed tailings, detailed soil chemical analyses are essential for tracking improvements in fertility, structure, and contaminant attenuation. Long-term revegetation efforts in Transylvania have demonstrated measurable gains in soil quality [18], and broader studies confirm that both spontaneous and targeted vegetation enhance organic matter, nutrient cycling, and reduce toxic metal bioavailability [12,15]. Misebo et al. (2021) [19] showed that vegetation type influences bulk density and water retention, with grasses and forbs improving topsoil and trees benefiting deeper layers. Hu et al. (2020) [20] found that Elymus nutans restoration increased organic matter and nitrogen while lowering pH and stabilizing cadmium, chromium, and lead. In tropical settings, Saidy et al. (2024) [21] reported that vegetation combined with organic amendments reduced exchangeable aluminum and improved nutrient retention, supporting plant growth and limiting metal uptake.
The aim of this study is to evaluate the effectiveness of vegetation in restoring coal mine tailings, with a focus on soil nutrient dynamics and heavy metal distribution. By comparing soils without vegetation, soils with spontaneous herbaceous cover, and soils planted with Robinia pseudoacacia, the research investigates how vegetation type influences substrate quality over time. Soil parameters were assessed at two key intervals—3 and 6 years after plantation—to capture the early and intermediate stages of amelioration. Through integrated field sampling, laboratory analysis, and ecological evaluation, the study seeks to identify viable strategies for transforming degraded mining landscapes into ecologically stable and productive environments.
2. Materials and Methods
2.1. Experimental Site
The experimental site, presented in Figure 1 and located at GPS coordinates 45°19’50.93”N, 23°9’6.08”E, is situated on the waste dump of the Uricani mine in the Jiu Valley, Hunedoara County, Romania, characterized by annual precipitation level of 878 mm and annual average temperature of 6.6 °C.
The dump spans approximately 27,000 m² and contains an estimated 550,000 m³ of sterile material, with a mineralogical composition dominated by quartz (50%), and a mixture of potassium feldspar, biotite, and calcite (50%) [22]. In 2018, an ecological rehabilitation program was initiated, involving the afforestation of part of the dump with Robinia pseudoacacia. As a result, the site now comprises three distinct vegetation zones: (i) areas afforested with Robinia pseudoacacia (arboreal vegetation, AV), (ii) areas colonized by spontaneous herbaceous vegetation (HV), and (iii) barren, unvegetated surfaces (UV), which served as the control. These zones represent the experimental variants illustrated in Figure 2.
2.2. Soil Sampling
To assess the impact of vegetation on soil quality, sampling was conducted along a diagonal transect across all three variants at two time points: in 2021 (three years post-afforestation) and in 2024 (six years post-afforestation). These intervals were selected based on evidence that biochemical and structural changes in mine substrates emerge gradually through sustained plant–soil interactions [23]. Early improvements in total nitrogen and organic matter typically occur around year 3, while by year 6, cumulative effects become more pronounced, including enhanced base cation levels, increased phosphorus and potassium availability, and improved soil structure [24].
At each vegetation zone, composite samples were prepared from seven subsamples collected within a 10 × 10 m area at a depth of 0–25 cm, to ensure representativeness and minimize small-scale heterogeneity. Subsamples were placed in labeled polyethylene bags, air-dried at ambient temperature, and sieved to 2 mm prior to analysis. A total of 42 soil samples were analyzed, with 16 physicochemical parameters determined for each sample. These included: pH, organic carbon (OC), macronutrients (total nitrogen – TN, total potassium – KT, total phosphorus – PT, exchangeable potassium – KAL, available phosphorus – PAL, available calcium – Caav, and available magnesium – Mgav), pseudototal concentrations of micronutrients (manganese – Mn, zinc – Zn, iron – Fe, and copper – Cu), and pseudototal concentrations of heavy metals (nickel – Ni, lead – Pb, and chromium – Cr). In total, 672 individual determinations were performed.
2.3. Soil Analysis
2.3.1. pH Determination
Soil pH was determined using a 1:2.5 soil-to-water ratio. Measurements were performed with a Mettler Toledo digital pH meter equipped with a combined glass electrode, previously calibrated with buffer solutions at pH 4, 7, and 10 (analytical grade, Merck).
2.3.2. Determination of Organic Carbon (OC) Content
Organic carbon (OC) content was carried out using the Walkley-Black wet oxidation method. 1 g of air dried and sieved soil is treated with 10 mL of K2Cr2O7 1N, 20 mL concentrated H2SO4 (Merk grade) and 200 mL distillated water. After completing of the reaction, 3-4 drops of o-phenanthroline indicator are added and the excess of K2Cr2O7 is back-titrated with a ferrous ammonium sulphate solution 0.5N. The difference between the initial and the remain amount of Cr2O72- provide an indirect measure of organic carbon.
2.3.3. Determination of Total Potassium KT and Pseudo-Total Metal Content – Aqua Regia Extractable, Microelements (Mn, Zn, Fe, Cu) and Pseudo-Total Heavy Metals (Ni, Pb, Cr)
Pseudo-total metal content was determined using atomic absorption spectrometry (AAS) with a VARIAN 240FS (Palo Alto, USA) spectrophotometer. 0.5 grams of the dried samples were subjected to mineralization with a 3:1 HCl:HNO3 mixture in a TOPWAVE Analytic Jena microwave digester for 60 minutes at 360 °C to bring the metal ions into solution. After cooling and filtration, the samples were brought to a 50 ml volumetric flask with deionized water. Merck grade acids were used. For calibration were used standard solutions with the concentration ranging from 0.3 to 3 μg L-1, prepared from multielement solution ICP Standard solution 1000 mg/L (Merck). Working conditions were: Air: acetylene ratio 13,50:2; Nebulizer uptake rate: 5l min-1; K (404 nm, 4mA, 0.8nm); Mn (279.5 nm, 4mA, 0.5nm); Fe (248.3nm, 5mA, 0.2nm); Zn (213nm, 5mA, 1nm); Cu (324.8nm, 4mA, 0.5nm); Ni (232nm, 4mA, 0.2nm); Pb (283,3nm, 10mA, 1.2nm); Cr (357.9nm, 7mA, 0.2nm).
2.3.4. Determination of Total Phosphorus PT Content
Total phosphorus was quantified from the 50 mL aqua regia digest (Section 2.3.3) by UV–Vis spectrophotometry using a Cintra spectrophotometer (GBC, Edinburgh, UK). An aliquot of the digest was reacted with an acidic solution of ammonium molybdate and stannous chloride, resulting in the formation of ammonium phosphomolybdate, which was subsequently measured calorimetrically at 715 nm. Calibration was achieved with standard solutions in the range of 2–60 μg 100 mL-1, prepared from a 1000 mg L-1 multielement ICP stock solution. All reagents employed were of analytical grade (Merck).
2.3.5. Determination of Available Phosphorus PAL and Available Potassium KAL
Available phosphorus (PAL) and available potassium (KAL) were determined by extracting 5 g of air-dried, sieved soil with 100 mL of ammonium acetate–lactate solution (pH 3.8 ± 0.05) under continuous shaking for 120 minutes to ensure transfer of the soluble fractions into solution. The suspension was subsequently filtered, and the extract analyzed for PAL using the Egner–Riehm–Domingo method, based on colorimetric measurement at 715 nm (Section 2.3.4).
Potassium availability (KAL) was quantified in the same extract by atomic absorption spectrometry at 766 nm (Section 2.3.3).
2.3.6. Determination of Available Calcium (Caav) and Magnesium (Mgav)
Available Ca (Caav) and Mg (Mgav) were determined in 0.1 M BaCl₂·2H₂O soil extracts by atomic absorption spectrometry - VARIAN 240FS (Palo Alto, USA) spectrophotometer. Soil samples (2 g, <2 mm) were repeatedly extracted with 20 ml of 0.1 M BaCl₂·2H₂O to obtain a final volume of ~100 ml. Analytical-grade reagents (Merck) were used. After filtration and volume adjustment, Caav, Mgav concentrations were measured with a Varian 240 FS atomic absorption spectrophotometer (Palo Alto, USA) under the following conditions: air:acetylene ratio = 13.50:2, nebulizer uptake = 5 ml min⁻¹, Ca (422.7 nm, 3mA, 1,2nm), and Mg (282.5 nm, 1.5mA, 1.2nm). Calibration employed standard solutions (0.3–3 mg L⁻¹) prepared from a 1000 mg L⁻¹ multielement ICP standard solution (Merck).
2.4. Statistical Analyses
Statistical analysis were carried out using Microsoft Excel and OriginPro 2025b. The effects of the presence of different types of vegetation, or the absence, were evaluated through analysis of variance (ANOVA) and two-sample t-tests assuming equal variances, with statistical significance set at p < 0.05. Relationships between macronutrients, micronutrients, heavy metals, and soil parameters (pH, OC) were assessed by regression analysis. To reduce dimensionality and obtain a concise representation of the dataset, principal component analysis (PCA) with varimax rotation was applied.
3. Results
Table 1 summarizes the temporal dynamics of soil macronutrients across three vegetation types—arboreal (AV), herbaceous (HV), and unvegetated (UV)—over monitoring period atop coal mine tailings.
Soil pH measurements in 2021 and 2024 revealed a predominantly alkaline environment across all experimental plots, with values influenced by vegetation type. In 2021, arboreal vegetation (AV) plots had a mean pH of 8.13, herbaceous vegetation (HV) plots recorded 8.05, and unvegetated (UV) surfaces showed the highest pH at 8.57. By 2024, a consistent decline in pH was observed: AV dropped to 8.07, HV to 7.89, and UV to 8.52. These changes suggest progressive acidification driven by biological activity and environmental factors, with the most pronounced shift occurring in HV plots.
The data reveal consistent patterns in total nitrogen (TN) concentrations across vegetation types during the three-year monitoring interval. In both 2021 and 2024, soils under arboreal (AV) and herbaceous vegetation (HV) exhibited higher TN levels compared to unvegetated (UV) plots. Specifically, AV soils recorded a mean TN content of 0.230% in 2021, while HV soils showed a slightly lower value of 0.210%, indicative of active nitrogen turnover driven by plant-microbe interactions. In contrast, UV soils had the lowest TN concentration (0.163%), reflecting minimal biological input. By 2024, TN levels increased most notably in AV (0.247%) and HV (0.230%), whereas UV soils remained comparatively nitrogen-poor (0.170%), suggesting subdued microbial activity in the absence of vegetation.
Parallel trends were observed in organic carbon (OC) content, with vegetation presence strongly influencing carbon accumulation. In 2021, HV soils exhibited the highest OC levels (21.51 g kg-1), followed closely by AV soils (20.26 g kg-1). UV soils remained significantly lower (14.51 g kg-1), consistent with minimal organic matter input. In 2024, both HV and AV variants sustained elevated OC concentrations (22.63 and 21.13 g kg-1, respectively), while UV soils showed only a slight increase (15.63 g kg-1), reinforcing the role of vegetation in enhancing soil carbon stocks through litter deposition and microbial activity.
Figure 3 captures notable temporal variations in the organic carbon-to-total nitrogen (OC/TN) ratio across different vegetation types, underscoring the distinct influence of plant cover on soil organic matter dynamics.
In both years, a positive linear trend is evident, indicating that C/N ratios generally increase with vegetation complexity. The 2021 dataset exhibits a steeper regression slope (y = 0.67x + 7.9733, R² = 0.6943) compared to 2024 (y = 0.32x + 8.55, R² = 0.25), suggesting a stronger correlation between vegetation type and C/N ratio in 2021. The highest C/N values were recorded in HV plots, followed by AV, with UV plots consistently showing the lowest ratios. Notably, the 2024 data show a flatter slope and lower coefficient of determination, indicating greater variability and weaker predictability in C/N behavior across vegetation types.
The moderately alkaline pH observed across the study area provided a stable geochemical setting that supports mineral preservation while permitting biologically mediated nutrient transformations. Soils under arboreal vegetation (AV) consistently exhibited the highest concentrations of both exchangeable (PAL) and total phosphorus (PT) (Table 1), with values rising from 0.024 mg kg-1 and 448 mg kg-1 in 2021 to 0.029 mg kg-1 and 467 mg kg-1 in 2024. These elevated levels are likely attributable to deep-rooting systems and substantial organic matter inputs from tree biomass, which enhance phosphorus mobilization even under alkaline conditions. Unexpectedly, unvegetated (UV) soils showed markedly higher levels of PAL—0.226 mg kg-1 in 2021 and 0.260 mg kg-1 in 2024—alongside moderate PT concentrations (403–432 mg kg-1). This pattern may reflect surface-level accumulation and limited biological uptake due to the absence of vegetation. Herbaceous vegetation (HV) plots recorded the lowest concentrations of both PAL and PT, indicating restricted phosphorus mobilization—likely due to shallower root architecture and reduced organic inputs
Potassium concentrations followed a similar trend, with AV soils showing enrichment in both exchangeable and total forms. KAL ranged from 149 to 166 mg kg-1, while KT varied between 635 and 670 mg kg-1. Although KT slightly lower than in UV soils, the presence of vegetation suggests active nutrient cycling and uptake, promoting turnover rather than passive accumulation. KAL in HV soils were marginally lower than those in AV plots, while total potassium remained comparable, suggesting minimal variation in long-term accumulation. In contrast, UV soils exhibited the highest KT concentration in 2024 (1127 mg kg-1), likely resulting from continued weathering of potassium-bearing minerals such as feldspar, in the absence of biological export mechanisms.
As shown in Table 1, soils under arboreal vegetation (AV) exhibited exceptionally high available calcium (Caav)concentrations (2854–3062 mg kg-1), indicative of accelerated calcite dissolution likely driven by biological activity. Magnesium availability in these soils was also elevated (758–869 mg kg-1), suggesting active biotite weathering facilitated by root exudates and microbial interactions typical of tree-dominated systems. In contrast, soils under herbaceous vegetation (HV) displayed reduced calcium and magnesium levels relative to both AV and unvegetated (UV) soils, pointing to subdued mineral weathering and diminished nutrient retention. Mgav concentrations in HV soils showed a modest increase in 2024 (810 mg kg-1), potentially reflecting seasonal variation or enhanced biotite decomposition during that period. Unvegetated soils presented intermediate Caav (1298–1563 mg kg-1) and the lowest magnesium concentrations among all vegetation types (323–503 mg kg-1). These findings suggest limited biotite degradation and poor nutrient retention dynamics in the absence of biological mediation.
Pseudo-total Manganese (Mn) concentrations in the analyzed samples (Figure 4a) ranged from 392 to 543 mg kg. The highest Mn levels were recorded in the HV plots (543 mg kg-1 in 2021; 413 mg kg-1 in 2024), indicating enhanced Mn mobilization under herbaceous vegetation. A comparative analysis revealed a decline in Mn concentrations between 2021 and 2024: −130 mg kg-1 in HV and −23 mg kg-1 in AV, suggesting diminished retention or elevated biological uptake and leaching. Conversely, UV exhibited a slight increase (+6 mg kg-1), potentially attributable to surface accumulation in the absence of active plant uptake.
Pseudo-total zinc (Zn) concentrations (Figure 4b) varied between 127.03 and 161.20 mg kg-1. In 2024, UV plots exhibited the highest Zn level (161.20 mg kg-1), whereas HV showed the peak value in 2021 (160.17 mg kg-1). Relative to 2021, Zn concentrations in 2024 increased in AV and UV plots, while HV experienced the most substantial reduction (−11.94 mg kg-1).
Pseudo total iron (Fe) concentrations ranged from 2144 to 2508 mg kg-1 (Figure 4c). The AV variant recorded the highest Fe content (2475 mg kg-1 in 2021; 2508 mg kg-1 in 2024), likely linked to interactions between deeper root systems and Fe-rich minerals such as biotite. UV samples (2250 mg kg-1 in 2021; 2144 mg kg-1 in 2024) presented consistently lower values, underscoring the influence of vegetation in Fe stabilization and mobilization. All variants experienced pseudo-total Fe reductions from 2021 to 2024, with the steepest decline observed in UV (−106 mg kg-1), presumably due to rainfall-induced leaching in the absence of stabilizing vegetation. Lesser declines in AV and HV may be attributed to root-mediated retention processes.
Pseudo-total copper (Cu) concentrations (Figure 4d) were generally higher in 2021, ranging from 38.25 to 62.19 mg kg-1, compared to 2024 values, which declined to a range of 31.52 to 51.53 mg kg-1. The highest Cu concentration was recorded in herbaceous vegetation (HV) plots in 2021 (62.19 mg kg-1), suggesting active Cu cycling driven by the dense, shallow root systems and rapid organic matter turnover typical of herbaceous cover. In contrast, unvegetated (UV) plots consistently exhibited the lowest Cu levels, with a minimum of 31.52 mg kg-1 in 2024. A uniform decline in Cu concentrations across all vegetation types in 2024—most notably in HV plots, which showed a reduction of 10.66 mg kg-1—may reflect increased leaching susceptibility or intensified uptake during peak vegetative growth.
Pseudo-total heavy metal concentrations presented in Figure 4 showed notable year-to-year variation across vegetation types. Pb levels decreased in HV soils but increased in AV and UV plots from 2021 to 2024. Ni and Cr concentrations generally rose in AV soils, while HV and UV plots exhibited slight declines or stabilization. These shifts suggest vegetation cover influences metal retention and mobility over time.
To contextualize the heavy metal concentrations reported in Figure 5, soil data from 2021–2024 were compared against European agricultural soil thresholds and guideline values established by Tóth et al. (2016) [25]. Across all samples, Pb concentrations ranged from 16.47 to 34.56 mg kg-1, remaining below the EU threshold of 60 mg kg and well under both the lower (200 mg kg-1) and upper (750 mg kg-1) guideline values. These findings suggest minimal immediate risk to food safety. However, the elevated Pb levels observed in HV plots—particularly the 2021 peak—may warrant continued monitoring due to potential seasonal accumulation and root-zone interactions. Nickel concentrations, ranging from 76.08 to 94.62 mg kg-1, exceeded the EU threshold of 50 mg kg-1 in all variants. Several samples, especially those from HV and UV plots, approached the ecological risk guideline of 100 mg kg-1. These elevated values raise concerns regarding potential phytotoxicity and the risk of leaching into groundwater, particularly in areas lacking deep-rooted vegetation that could buffer metal mobility. Chromium concentrations varied between 79.17 and 103.37 mg kg-1, hovering near the EU threshold of 100 mg kg-1. UV soils slightly exceeded this benchmark in 2024, suggesting enhanced surface accumulation in the absence of vegetative stabilization. Although Cr levels remained below the ecological risk guideline of 200 mg kg-1, their proximity to critical thresholds—combined with the potential toxicity of hexavalent Cr—calls for cautious interpretation and further investigation.
The Pearson correlation analysis revealed consistent patterns across both years, highlighting strong interdependencies among soil chemical properties. In 2021 (Figure 6), organic carbon (OC) showed strong positive correlations with TN (R = 0.91), PAL (R = 0.88), and Caav (R = 0.85), indicating that nutrient accumulation is closely linked to organic matter enrichment. Soil pH was positively correlated with Caav (R = 0.76) and Mgav (R = 0.72), suggesting that higher pH levels favor the availability of base cations. In contrast, heavy metals such as lead (Pb), nickel (Ni), and chromium (Cr) exhibited moderate to strong negative correlations with pH (R = –0.67, –0.70, and –0.74, respectively), implying increased metal mobility under acidic conditions. Notably, Pb also showed negative associations with OC (R = –0.62) and TN (R = –0.59), reinforcing the antagonistic relationship between heavy metal presence and soil fertility indicators.
By 2024, Pearson correlation analysis presented in Figure 7, revealed strong interrelationships among soil chemical parameters, indicating early signs of substrate transformation. Organic carbon (OC) exhibited a robust positive correlation with total nitrogen (TN, R = 0.93), available phosphorus (PAL, R = 0.89), and exchangeable calcium (Caav, R = 0.86), suggesting that organic matter accumulation is tightly linked to nutrient availability. Soil pH showed moderate positive correlations with Caav (R = 0.74) and Mg av (R = 0.71), while negatively correlating with PAL (R = –0.62) and heavy metals such as Fe (R = –0.69), Ni (R = –0.66), and Cr (R = –0.68), indicating that lower pH may enhance metal solubility and limit phosphorus retention. Notably, Pb and Cr displayed negative associations with OC (R = –0.61 and –0.64, respectively), reinforcing the antagonistic relationship between heavy metal presence and organic matter buildup. These early-stage correlations highlight the role of vegetation and organic inputs in improving soil fertility and buffering contaminant mobility in degraded substrates.
The PCA analysis offers a clear perspective on the complex interactions among soil chemical parameters under varying vegetation covers. The extraction of two principal components, together explaining 100% of the total variance, reflects a well-defined structure within the dataset. In 2021 (Figure 8), three years after Robinia pseudoacacia cultivation, PC1 accounted for 61.74% of the total variation and was positively associated with total nitrogen (TN), organic carbon (OC), and pseudototal forms of copper (Cu), iron (Fe), and available magnesium (Mgav). These variables reflect early signs of biological activity and nutrient enrichment. PC1 also showed strong negative loadings for pH, available phosphorus (PAL), and total potassium (KT), which are typically elevated in unvegetated substrates due to limited biological uptake. PC2 explained the remaining 38.26% of the variance and was characterized by positive contributions from total phosphorus (PT), exchangeable potassium (KAL), and available calcium (Caav), while showing negative loadings for manganese (Mn), zinc (Zn), and nickel (Ni).
In 2024 (Figure 9), six years post-cultivation, PCA revealed further divergence among vegetation types. PC1, explaining 71.97% of the total variation, showed strong positive correlations with pH, KT, and PAL—parameters predominantly influenced by the UV variant. This suggests that unvegetated plots maintain elevated baseline levels of these elements due to limited biological cycling. Conversely, PC1 exhibited pronounced negative loadings for OC, TN, Mgav, and Fe and Cu, which are more abundant in vegetated plots due to organic matter input and microbial activity. PC2 accounted for 28.03% of the variance and was positively associated with PT, Caav, and pseudototal chromium (Cr), while negatively correlated with pseudototal nickel (Ni).
4. Discussions
Soil pH remained alkaline across all plots in both 2021 and 2024, largely due to the presence of calcite—a strong buffering mineral within the coal mining waste. Quartz and potassium feldspar, being chemically inert, had minimal impact on pH regulation. Over time, a consistent decline in pH was observed, indicating ongoing biogeochemical changes [26]. Vegetated plots (arboreal and herbaceous) showed lower pH values than unvegetated ones, highlighting the acidifying effects of biological activity. Herbaceous plots exhibited the most pronounced pH reduction, likely driven by fibrous roots enhancing microbial activity and organic acid production. Despite differences in root structure, both vegetation types contributed to acidification through organic matter turnover, root exudation, and CO₂ release, which forms carbonic acid in soil moisture. In contrast, unvegetated plots maintained higher pH levels, dominated by geochemical buffering in the absence of biological influence [18].
Vegetation type strongly influenced TN concentrations across plots. Arboreal vegetation (AV) plots recorded the highest TN levels, likely due to stable retention mechanisms such as deeper roots and slower biomass turnover [27]. Herbaceous vegetation (HV) plots showed elevated TN through rapid litter decomposition and active nutrient cycling. From 2021 to 2024, TN increased across vegetated plots, reflecting early pedogenic processes like organic matter accumulation and microbial colonization [28,29]. In contrast, unvegetated (UV) plots maintained low TN levels, constrained by the lack of biological inputs and limited microbial activity, despite mildly alkaline pH conditions [30,31].
OC concentrations followed a similar vegetation-driven gradient: highest in HV plots, moderate in AV, and lowest in UV. Herbaceous species enhanced surface carbon through fast decomposition and dense roots, while arboreal vegetation supported long-term stabilization via woody biomass and extensive root systems. UV plots lacked organic inputs and microbial colonization, resulting in persistently low OC levels despite favorable pH [32]. The upward trend in OC and TN from 2021 to 2024 signals ongoing soil development and aligns with reclamation trajectories reported by Chan et al. (2014) [33].
C/N ratio patterns further highlight vegetation effects. In 2021, steeper slopes and higher R² values indicated strong vegetation control over organic dynamics. By 2024, reduced slopes and R² suggested increased variability due to complex biotic–abiotic interactions. HV plots consistently showed higher C/N ratios, reflecting rapid carbon input and microbial stimulation [34], while AV plots contributed to long-term carbon retention. UV plots exhibited the lowest ratios, reinforcing the critical role of vegetation in soil nutrient recovery [35].
The findings on phosphorus, potassium, calcium, and magnesium concentrations in the studied soils highlight the intertwined roles of mineralogical composition and vegetation cover in governing nutrient availability and cycling within reclaimed mining substrates. Vegetation-induced biological processes play a pivotal role in mobilizing nutrients—particularly phosphorus, calcium, and magnesium—whereas the absence of plant cover shifts nutrient dynamics toward mineral-derived persistence and surface accumulation [36]. Phosphorus behavior varied notably across vegetation types. Arboreal vegetation (AV) plots exhibited the highest levels of bioavailable phosphorus (PAL) and total P, reflecting intensified microbial activity and organic matter turnover. These biological mechanisms are known to enhance phosphorus solubilization and retention in disturbed soils undergoing reclamation [37]. Interestingly, unvegetated (WV) plots also showed elevated PAL concentrations, likely due to limited plant uptake and surface accumulation—patterns previously observed in post-mining environments where phosphorus remains largely unutilized [6]. The presence of minerals such as biotite may serve as slow-release sources of phosphorus, contributing to long-term fertility potential [38]. Potassium concentrations peaked in WV soils, particularly in KT, suggesting ongoing abiotic weathering of potassium feldspar. This supports earlier research indicating that feldspar-rich substrates gradually release potassium in the absence of biological uptake [39]. In contrast, AV and herbaceous vegetation (HV) plots maintained moderate K levels, consistent with active nutrient cycling facilitated by plant uptake. Biotite, a more reactive mineral than feldspar and abundant in the soil matrix, likely contributes to the exchangeable K pool in vegetated soils [40]. The elevated KT in WV soils further confirms the mineral origin of potassium where biological extraction is absent. Available calcium (Caav) concentrations were highest in AV soils, likely driven by enhanced calcite dissolution mediated by root exudates and microbial acidification. This aligns with the known buffering capacity of calcite-rich substrates and their role in releasing calcium under biologically active conditions [6]. In contrast, WV soils exhibited lower Caav levels, indicating reduced mineral weathering in the absence of vegetation. These results reinforce the importance of plant cover in accelerating carbonate breakdown and facilitating nutrient mobilization [41]. Available magnesium (Mgav)levels were most pronounced in AV and HV soils, reflecting intensified biotite weathering—a mineral that hosts both Mg and K. Vegetation enhances Mg availability through synergistic interactions between roots and soil microbes, as well as through organic matter decomposition [42]. WV soils, by comparison, showed diminished Mgav concentrations, consistent with limited biotite degradation and poor nutrient retention. This pattern supports previous findings that magnesium cycling is closely tied to biological activity and organic inputs [6].
In 2024, microelement concentrations declined in vegetated plots due to sustained plant uptake, enhanced microbial activity, and reduced geogenic input from tailing weathering. Vegetation functions as both a sink and a stabilizer, modulating nutrient availability through root absorption, organic matter turnover, and rhizosphere interactions [43,44]. High annual precipitation (~878 mm year-1) further facilitates leaching and ion mobility, intensifying nutrient cycling in vegetated soils while promoting surface accumulation and erosion in unvegetated (WV) areas. The mineral matrix—dominated by quartz, K-feldspar, calcite, and biotite—offers limited nutrient release. Quartz and feldspar are largely inert, while calcite buffers pH and influences metal solubility. Biotite contributes Fe and Mg under biologically active conditions, especially when weathering is accelerated by root exudates and microbial processes [45,46]. Manganese concentrations were highest in HV plots, driven by shallow fibrous roots that intensify organic matter decomposition and microbial mobilization. These conditions promote Mn solubilization and uptake. AV plots showed moderate Mn levels, buffered by deeper root systems that regulate nutrient fluxes. WV plots had the lowest Mn, reflecting minimal biological mobilization and limited microbial activity [47]. Zinc levels varied spatially and temporally. HV plots maintained elevated Zn due to active cycling and rhizosphere acidification. AV plots consistently recorded lower Zn, likely due to canopy-mediated immobilization and reduced bioavailability. WV plots showed Zn accumulation, attributed to limited biological uptake and surface leaching. Sorption onto quartz and feldspar surfaces may further stabilize Zn in unvegetated substrates [45,46]. Iron peaked in AV plots, where deep roots access Fe-bearing minerals like biotite. Organic exudates enhance Fe solubilization and transport, especially in biologically rich soils [44,46]. HV plots had slightly lower Fe, possibly due to competitive uptake among dense root networks. WV plots showed minimal Fe retention, constrained by the absence of vegetation and microbial facilitators. Copper was lowest in WV soils, likely due to leaching and immobilization in non-bioavailable forms. AV plots showed intermediate Cu levels, stabilized by root depth and moderated uptake. HV plots recorded the highest Cu concentrations, consistent with rhizosphere acidification and enhanced microbial cycling that increase Cu bioavailability and mobility [50].
Vegetation cover is a key driver of microelement retention and heavy metal distribution. Herbaceous species (HV) enhanced Mn, Zn, Cu, and Pb concentrations through dense root mats and rapid organic turnover, which stimulate microbial activity and rhizosphere acidification [43,51,52]. Arboreal vegetation (AV) stabilized Fe and reduced Pb and Cr levels via deeper root systems and mineral buffering, limiting erosion and metal redistribution [53]. In contrast, unvegetated (UV) plots lacked biological uptake, resulting in greater metal mobility and surface accumulation, especially under hydrological stress. From 2021 to 2024, pseudo-total concentrations of Pb, Ni, and Cr increased across all vegetation types, reflecting active geochemical weathering, seasonal variation, and potential anthropogenic inputs. With ~870 mm annual precipitation, leaching and vertical migration are plausible, particularly in UV soils with minimal infiltration resistance. Substrate mineralogy further shaped metal behavior, quartz and K-feldspar, being inert and low in cation exchange capacity, contributed to metal mobility [54]. In contrast, biotite adsorbs metals via interlayer exchange, and calcite buffers pH and facilitates metal precipitation as carbonates under alkaline conditions—mechanisms that help retain Pb, Ni, and Cr [55,56]. Although pseudo-total measurements include both bioavailable and residual fractions, environmental risk remains uncertain without speciation data. Nonetheless, observed concentrations approach or exceed thresholds that may impair plant growth and pose food safety risks through bioaccumulation [57,58]. Elevated Ni and Cr levels in HV and UV plots suggest emerging ecological concerns that warrant further investigation.
The comparison of Pearson correlation matrices from 2021 and 2024 underscores the influential role of vegetation and soil chemical dynamics in driving nutrient cycling, while also revealing notable changes in the relationships among soil parameters over time. In unvegetated soils, correlations among nutrients and heavy metals were generally weaker and more erratic, reflecting limited biological activity and poor substrate structure. The emergence of herbaceous vegetation introduced more coherent patterns, particularly among organic carbon, nitrogen, and available macroelements, suggesting early-stage biological stabilization and nutrient cycling. Robinia pseudoacacia, a nitrogen-fixing species with deeper rooting systems, further intensified positive correlations among organic matter, nutrient availability, and base cations, indicating enhanced soil development and amelioration. Simultaneously, negative associations between pH and heavy metals became more pronounced, implying improved buffering capacity and reduced metal mobility in vegetated plots. These evolving correlation structures underscore the role of vegetation—especially leguminous trees—in accelerating soil functional recovery and mitigating contamination risks on post-mining landscapes [59].
Principal Component Analyses (PCA) conducted in both 2021 and 2024 consistently underscore the ecological impact of vegetation cover on key soil parameters. While this overarching trend remains evident, the evolution of principal component structures across the two years reveals the dynamic nature of soil–vegetation interactions. In 2021, the PCA captured early-stage differentiation among soil samples based on vegetation type. Unvegetated (UV) plots were distinctly separated from those with spontaneous herbaceous (HV) and cultivated arboreal (AV) cover, indicating that even three years post-intervention, vegetation had begun to influence soil chemistry. The clustering of AV samples suggests that Robinia pseudoacacia was already contributing to soil transformation—likely via litter deposition, root exudation, and microbial stimulation. The biplot further illustrates that the AV variant exerted strong influence over PT, KAL, and Caav, pointing to initial nutrient accumulation under Robinia cover. In contrast, HV plots were associated with elevated total nitrogen (TN) and pseudototal concentrations of Pb and Cu, reflecting the effects of spontaneous colonization. UV plots remained linked to higher pH, PAL, and KT values, consistent with the characteristics of minimally altered waste substrates. By 2024, the PCA reveals a more pronounced separation of AV samples from both UV and HV plots, signifying that Robinia pseudoacacia had markedly transformed the soil environment over six years. The shift in AV cluster positioning suggests cumulative improvements in soil quality—potentially driven by enhanced nutrient cycling, organic matter buildup, and contaminant stabilization. These patterns emphasize the dominant role of AV cover in shaping Caav and PT levels, reflecting sustained nutrient enrichment and soil amelioration under Robinia pseudoacacia. Moreover, the data continue to highlight the contrast between active (AV) and passive (HV) revegetation strategies in steering soil chemical trajectories.
5. Conclusions
This study demonstrates the critical role of vegetation in improving the ecological resilience of coal mine tailings. Both arboreal and herbaceous cover significantly influenced soil chemistry—modifying pH, enhancing nutrient availability, and reducing heavy metal mobility. Robinia pseudoacacia notably increased calcium and phosphorus levels, while herbaceous vegetation contributed to organic carbon enrichment and micronutrient availability (Mn, Zn, Cu). In contrast, unvegetated plots remained chemically unstable, with poor nutrient retention and elevated leaching risks. Principal component analysis revealed progressive differentiation among vegetation types, indicating cumulative improvements in soil quality and soil–plant interactions over time. Although lead concentrations remained within safe limits, elevated nickel and borderline chromium levels in unvegetated and herbaceous plots suggest potential ecological risks. Arboreal systems showed greater capacity for contaminant immobilization and fertility enhancement, rein-forcing their value in phytoremediation. These findings support restoration strategies that integrate mixed vegetation types to optimize nutrient cycling, stabilize contaminants, and improve soil structure. Long-term monitoring and fractionation studies are recommended to assess metal bioavailability and guide adaptive land-use planning. Integrating mineralogical and ecological perspectives is essential for evaluating the environmental impact of mining residues and informing sustainable reclamation practices.
Author Contributions
Conceptualization, G.P. and I.R; methodology, A.B.; validation, A.H. and C.M.; formal analysis, A.B.; investigation, X.X.; resources, A.H. and F.C.; data curation, A.B. and C.A.P.; writing—original draft preparation, G.P. and L.D.; writing—review and editing, I.R.; visualization, C.A.P.; supervision, C.M. All authors have read and agreed to the published version of the manuscript.
Funding
This research received no external funding.
Data Availability Statement
The original contributions presented in the study are included in the article. Further inquiries can be directed to the corresponding authors.
Acknowledgments
Not applicable.
Conflicts of Interest
The authors declare no conflicts of interest.
References
- Salgado, L.; Aparicio, L.; Afif, E.; et al. A Second Life for Mining Waste as an Amendment for Soil Remediation. J. Mater. Cycles Waste Manag. 2024, 26, 2971–2979. [CrossRef]
- Ciarkowska, K.; Gargiulo, L.; Mele, G. Natural Restoration of Soils on Mine Heaps with Similar Technogenic Parent Material: A Case Study of Long-Term Soil Evolution in Silesian-Krakow Upland, Poland. Geoderma 2016, 261, 141–150. [CrossRef]
- Agenția Națională pentru Resurse Minerale (ANRM). Raport Statistic 2021. Available online: https://www.anrm.ro (accessed on 10 September 2025).
- Mocanu, V.; Petrescu, D.; Rusu, C. Sustainable Rehabilitation of Mining Waste Dumps in Romania. Sustainability 2022, 14, 10544. [CrossRef]
- Popescu, G.; Popescu, C. A.; Dragomir, L. O.; Herbei, M. V.; Horablaga, A.; Țenche-Constantinescu, A.M.; Sălăgean, T.; Bruma, S.; Dinu-Roman (Szabo), M.; Colisar, A.; Ceuca, V.; Kader, S.; Sestras, P. Utilizing UAV Technology and GIS Analysis for Ecological Restoration: A Case Study on Robinia Pseudoacacia L. In a Mine Waste Dump Landscape Rehabilitation. Not Bot Horti Agrobo 2024, 52, 13937. https://www.notulaebotanicae.ro/index.php/nbha/article/view/13937.
- Więckol-Ryk, A.; Pierzchała, Ł.; Bauerek, A.; Krzemień, A. Minimising Coal Mining’s Impact on Biodiversity: Artificial Soils for Post-Mining Land Reclamation. Sustainability 2021, 15, 9707. [CrossRef]
- Bradshaw, A. Restoration of mined lands—using natural processes, Ecolog Eng, 1997, 8, Issue 4, 255-269, ISSN 0925-8574. [CrossRef]
- Zipper, C.E.; Burger, J.A.; Skousen, J.G.; Angel, P.; Barton, C.; Davis, V.; Franklin, J.; Jacobs, D.; Jordan, D.; McGrath, J.; et al. Restoring Forests and Associated Ecosystem Services on Appalachian Coal Surface Mines. Environ. Manag. 2011, 47, 751–765. [CrossRef]
- Yuan, Y.; Zhao, Z.; Niu, S.; Li, X.; Wang, Y.; Bai, Z. Reclamation Promotes the Succession of the Soil and Vegetation in Opencast Coal Mine: A Case Study from Robinia pseudoacacia Reclaimed Forests, Pingshuo Mine, China. Catena 2018, 165, 72–79. [CrossRef]
- Haering, K.C.; Daniels, W.L.; Galbraith, J.M. Appalachian Mine Soil Morphology and Properties: Effects of Weathering and Mining Method. Soil Sci. Soc. Am. J. 2000, 64, 1011–1021. [CrossRef]
- Tordoff, G.M.; Baker, A.J.M.; Willis, A.J. Current Approaches to the Revegetation and Reclamation of Metalliferous Mine Wastes. Chemosphere 2000, 41, 219–228. [CrossRef]
- Frouz, J.; Prach, K.; Pižl, V.; Háněl, L.; Starý, J.; Tajovský, K.; Materna, J.; Balík, V.; Kalčík, J.; Řehounková, K. Interactions between Soil Development, Vegetation and Soil Fauna during Spontaneous Succession in Post-Mining Sites. Eur. J. Soil Biol. 2008, 44, 109–121. [CrossRef]
- Bardgett, R.D.; van der Putten, W.H. Belowground Biodiversity and Ecosystem Functioning. Nature 2014, 515, 505–511. [CrossRef]
- Harris, J. Soil Microbial Communities and Restoration Ecology: Facilitators or Followers? Science 2003, 300, 1077–1078. [CrossRef]
- Ciobanu, C.; Mălăescu, M.; Costea, G. Forest Vegetation and Soil Reclamation on Mining Dumps in the Jiu Valley, Romania. Rev. Pădurilor 2016, 131, 25–34.
- Wali, M.K. Ecological Succession and the Rehabilitation of Disturbed Terrestrial Ecosystems. Plant Soil 1999, 213, 195–220. [CrossRef]
- Munteanu, I.; Dumitru, M.; Irimia, G.I. Natural Succession and Soil Evolution on Coal Mining Dumps in Romania. Carpathian J. Earth Environ. Sci. 2021, 16, 561–574. [CrossRef]
- Buta, M.; Blaga, G.; Paulette, L.; Păcurar, I.; Roșca, S.; Borsai, O.; Grecu, F.; Păcurar, H.; Negrușier, C. Soil Reclamation of Abandoned Mine Lands by Revegetation in Northwestern Part of Transylvania: A 40-Year Retrospective Study. Sustainability 2019, 11, 3393. [CrossRef]
- Misebo, A.M.; Szostak, M.; Sierka, E.; Pietrzykowski, M.; Woś, B. The Interactive Effect of Reclamation Scenario and Vegetation Types on Physical Parameters of Soils Developed on Carboniferous Mine Spoil Heap. Land Degrad. Dev. 2021, 34, 3593–3605. [CrossRef]
- Hu, Y.; Yu, Z.; Fang, X.; Zhang, W.; Liu, J.; Zhao, F. Influence of Mining and Vegetation Restoration on Soil Properties in the Eastern Margin of the Qinghai–Tibet Plateau. Int. J. Environ. Res. Public Health 2020, 17, 4288. [CrossRef]
- Saidy, A.R.; Priatmadi, B.J.; Septiana, M.; Ratna, R.; Fachruzi, I.; Ifansyah, H.; Hayati, A.; Mahbub, M.; Haris, A. Changes in Properties of Reclaimed-Mine Soil, Plant Growth, and Metal Accumulation in Plants with Application of Coal Fly Ash and Empty Fruit Bunches of Oil Palm. J. Degraded Min. Lands Manag. 2024, 11, 5767–5778. [CrossRef]
- Brasovan, A.G. Ambiental Impact and Reclamation of Mining Dump from Western Part of Petrosani Basin; 2012; Babes-Bolyai University, Cluj Napoca, Romania.
- Luo, C.; Zhang, B.; Liu, J.; Wang, X.; Han, F.; Zhou, J. Effects of Different Ages of Robinia pseudoacacia Plantations on Soil Physiochemical Properties and Microbial Communities. Sustainability 2020, 12, 9161. [CrossRef]
- 59. Vlachodimos, K.; Papatheodorou, E.M.; Diamantopoulos, J.; et al. Assessment of Robinia pseudoacacia Cultivations as a Restora-tion Strategy for Reclaimed Mine Spoil Heaps. Environ. Monit. Assess. 2013, 185, 6921–6932. [CrossRef]
- Tóth, G.; Hermann, T.; da Silva, M.R.; Montanarella, L. Heavy Metals in Agricultural Soils of the European Union with Implications for Food Safety. Environ. Int. 2016, 88, 299–309. [CrossRef]
- Lațo, A.; Berbecea, A.; Lațo, I.; Crista, F.; Crista, L.; Sala, F.; Radulov, I. Mitigating Soil Acidity: Impact of Aglime (CaCO3) Particle Size and Application Rate on Exchangeable Aluminium and Base Cations Dynamics. Sustainability 2025, 17, 8135. [CrossRef]
- Islam, N.; Rabha, S.; Subramanyam, K.S.V.; Saikia, B.K. Geochemistry and Mineralogy of Coal Mine Overburden (Waste): A Study towards Their Environmental Implications. Chemosphere 2021, 274, 129736. [CrossRef]
- 28. Liu, X.; Zhang, Y.; Yang, S.; Chen, L.; Wang, H. Vegetation Type and Soil Organic Carbon in Reclaimed Mining Soils: A Case Study from Northern China. Land 2021, 10, 151. [CrossRef]
- Tenche-Constantinescu, A.-M.; Lalescu, D.V.; Popescu, S.; Sarac, I.; Petolescu, C.; Camen, D.; Horablaga, A.; Popescu, C.A.; Herbei, M.V.; Dragomir, L.; et al. Juglans regia as Urban Trees: Genetic Diversity and Walnut Kernel Quality Assessment. Horticulturae 2024, 10, 1027. [CrossRef]
- Roman, A.; Gafta, D.; Ursu, T.-M.; Cristea, V. Plant Assemblages of Abandoned Ore Mining Heaps: A Case Study from Roșia Montană Mining Area, Romania. In Greller, A.M.; Fujiwara, K.; Pedrotti, F. (Eds.) Geographical Changes in Vegetation and Plant Functional Types; Springer: Cham, Switzerland, 2018; pp. 283–298. [CrossRef]
- 31. Anon. Improving the Content of Chemical Elements from the Soil of Waste Heaps Influenced by Forest Vegetation—A Case Study of Moldova Nouă Waste Heaps, South-West Romania. Appl. Sci. 2024, 14, 5221. [CrossRef]
- Vo, T.; Hillier, S.; Rezania, M. The Mineralogical Composition and Mechanical Characteristics of Selected European Coal Mining Waste Samples and Their Experimental Correlation. J. Geotech. Geoenviron. Eng. 2024, 151, 1. [CrossRef]
- Chan, J.; Baumgartl, T.; Pihlap, E.; Bucka, F. Soil Organic Carbon in Rehabilitated Coal Mine Soils as an Indicator for Soil Health. In Fourie, A.; Tibbett, M.; Sharkuu, A. (Eds.) Mine Closure 2014: Proceedings of the Ninth International Conference on Mine Closure; Australian Centre for Geomechanics: Perth, Australia, 2014; pp. 121–129. [CrossRef]
- Nickels, A.; Prescott, C.E. Soil Carbon Stabilization under Coniferous, Deciduous and Grass Vegetation in Post-Mining Reclaimed Ecosystems. Front. For. Glob. Change 2021, 4, 689594. [CrossRef]
- Sun, Y.; Li, J.; Wang, Z.; Zhang, Y.; Liu, X. Vegetation Types Can Affect Soil Organic Carbon and δ¹³C by Influencing Plant Inputs and Microbial Residue Composition. Sustainability 2024, 16, 4538. [CrossRef]
- Oz Soils. Soil Chemistry and Nutrient Dynamics in Post-Mining Environments. Oz Soils Technical Report 2021. Available online: https://www.ozsoils.com.au (accessed on 20 September 2025).
- Wulandari, D.; Saridi; Herika, D.; Agus, C.; Cheng, W.; Tawaraya, K. Soil Chemical Properties of Opencast Coal Mining Site in Indonesia and Its Effect on Plant Growth. Ecol. Environ. Conserv. 2020, 26 (Suppl. Issue August), S277–S286.
- Rutkowska, A. Sensitivity of Plant and Soil Indices in Evaluating the Long-Term Consequences of Soil Mining from Reserves of Phosphorus, Potassium, and Magnesium. Commun. Soil Sci. Plant Anal. 2013, 44, 1609–1623. [CrossRef]
- Radulov, I.; Goian, M. Potasiul in Agricultură și nutriție. Mirton Press, 2004, Timișoara, Romania,.
- Radulov, I.; Berbecea, A. Nutrient Management for Sustainable Soil Fertility. IntechOpen. 2024. [CrossRef]
- Tomaszewicz, T.; Chudecka, J.; Stankowski, S.; Bashutska, U.; Gibczyńska, M. The Assessment of Physicochemical Properties and Macronutrient Content of Reclaimed Soil Material and Hard Coal Ash 15 Years after the Experiment Setup. Pol. J. Agron. 2022, 48, 21–27. [CrossRef]
- Wulandari, D.; Saridi; Herika, D.; Agus, C.; Cheng, W.; Tawaraya, K. Soil Biological Processes and Nutrient Cycling in Indonesian Post-Mining Soils. Eco. Env. Conserv. 2020, 26, S286–S295.
- Mendez, M.O.; Maier, R.M. Phytostabilization of Mine Tailings in Arid and Semiarid Environments—An Emerging Remediation Technology. Environ. Health Perspect. 2007, 115, 278–284. [CrossRef]
- Colombo, C.; Palumbo, G.; He, J.-Z.; Pinton, R.; Cesco, S. Review on Iron Availability in Soil: Interaction of Fe with Other Nutrients in the Rhizosphere. J. Soil Sci. Plant Nutr. 2014, 14, 467–482. [CrossRef]
- Wu, Q.; Zhang, L.; Li, P.; Zhou, H. Weathering Processes of Mining Waste and Their Implications for Soil Fertility. Environ. Earth Sci. 2024, 83, 215. [CrossRef]
- Li, H.; Wang, J.; Zhou, D.; Chen, X. Effect of Vegetation on Iron Mobilization in Contaminated Soils. J. Hazard. Mater. 2020, 398, 122867. [CrossRef]
- Tripathi, V.; Singh, A.; Mishra, S. Microbial Processes in Metal Biogeochemistry. Adv. Agron. 2018, 149, 1–70. [CrossRef]
- Fomina, M.; Hillier, S.; Charnock, J.M.; Melville, K.; Alexander, I.J.; Gadd, G.M. Metal Sorption and Mineral Transformation by Fungi. Geomicrobiol. J. 2005, 22, 291–302. [CrossRef]
- Di Luca, G.; Barontini, S.; Mancini, M.; Ranzi, R. Heavy Metal Retention in Soils under Variable Hydrological Regimes. Environ. Monit. Assess. 2016, 188, 237. [CrossRef]
- Zhou, T.; Chen, H.; Gao, J.; Liu, J. Rhizosphere Interactions Influence Copper Mobility. Soil Biol. Biochem. 2017, 115, 312–320. [CrossRef]
- Adriano, D.C. Trace Elements in Terrestrial Environments: Biogeochemistry, Bioavailability, and Risks of Metals; Springer: New York, NY, USA, 2001.
- Banerjee, S.; Mukhopadhyay, S.; Yadav, A.; George, J.; Ram, L.C. Vegetation-Induced Rhizosphere Changes and Metal Mobility in Reclaimed Soils. Land 2025, 14, 1885. [CrossRef]
- Pulford, I.D.; Watson, C. Phytoremediation of Heavy Metal-Contaminated Land by Trees—A Review. Environ. Int. 2003, 29, 529–540. [CrossRef]
- Alloway, B.J. Heavy Metals in Soils: Trace Metals and Metalloids in Soils and Their Bioavailability; Springer: Dordrecht, The Netherlands, 2013.
- Kabata-Pendias, A.; Mukherjee, A.B. Trace Elements from Soil to Human; Springer: Berlin, Germany, 2007.
- McBride, M.B. Environmental Chemistry of Soils; Oxford University Press: New York, NY, USA, 1994.
- Kabata-Pendias, A. Soil–Plant Transfer of Trace Elements—An Environmental Risk. Geoderma 2004, 122, 143–149. [CrossRef]
- McLaughlin, M.J.; Parker, D.R.; Clarke, J.M. Metals and Micronutrients—Food Safety Issues. Field Crops Res. 2000, 60, 143–163. [CrossRef]
- Mukhopadhyay, R.E. Masto, A. Yadav, J. George, L.C. Ram, S.P. Shukla, Soil quality index for evaluation of reclaimed coal mine spoil, Science of The Total Environment, Volume 542, Part A, 2016, Pages 540-550, ISSN 0048-9697. [CrossRef]
Figure 1.
Experimental site (a) and dump before reclamation (b).
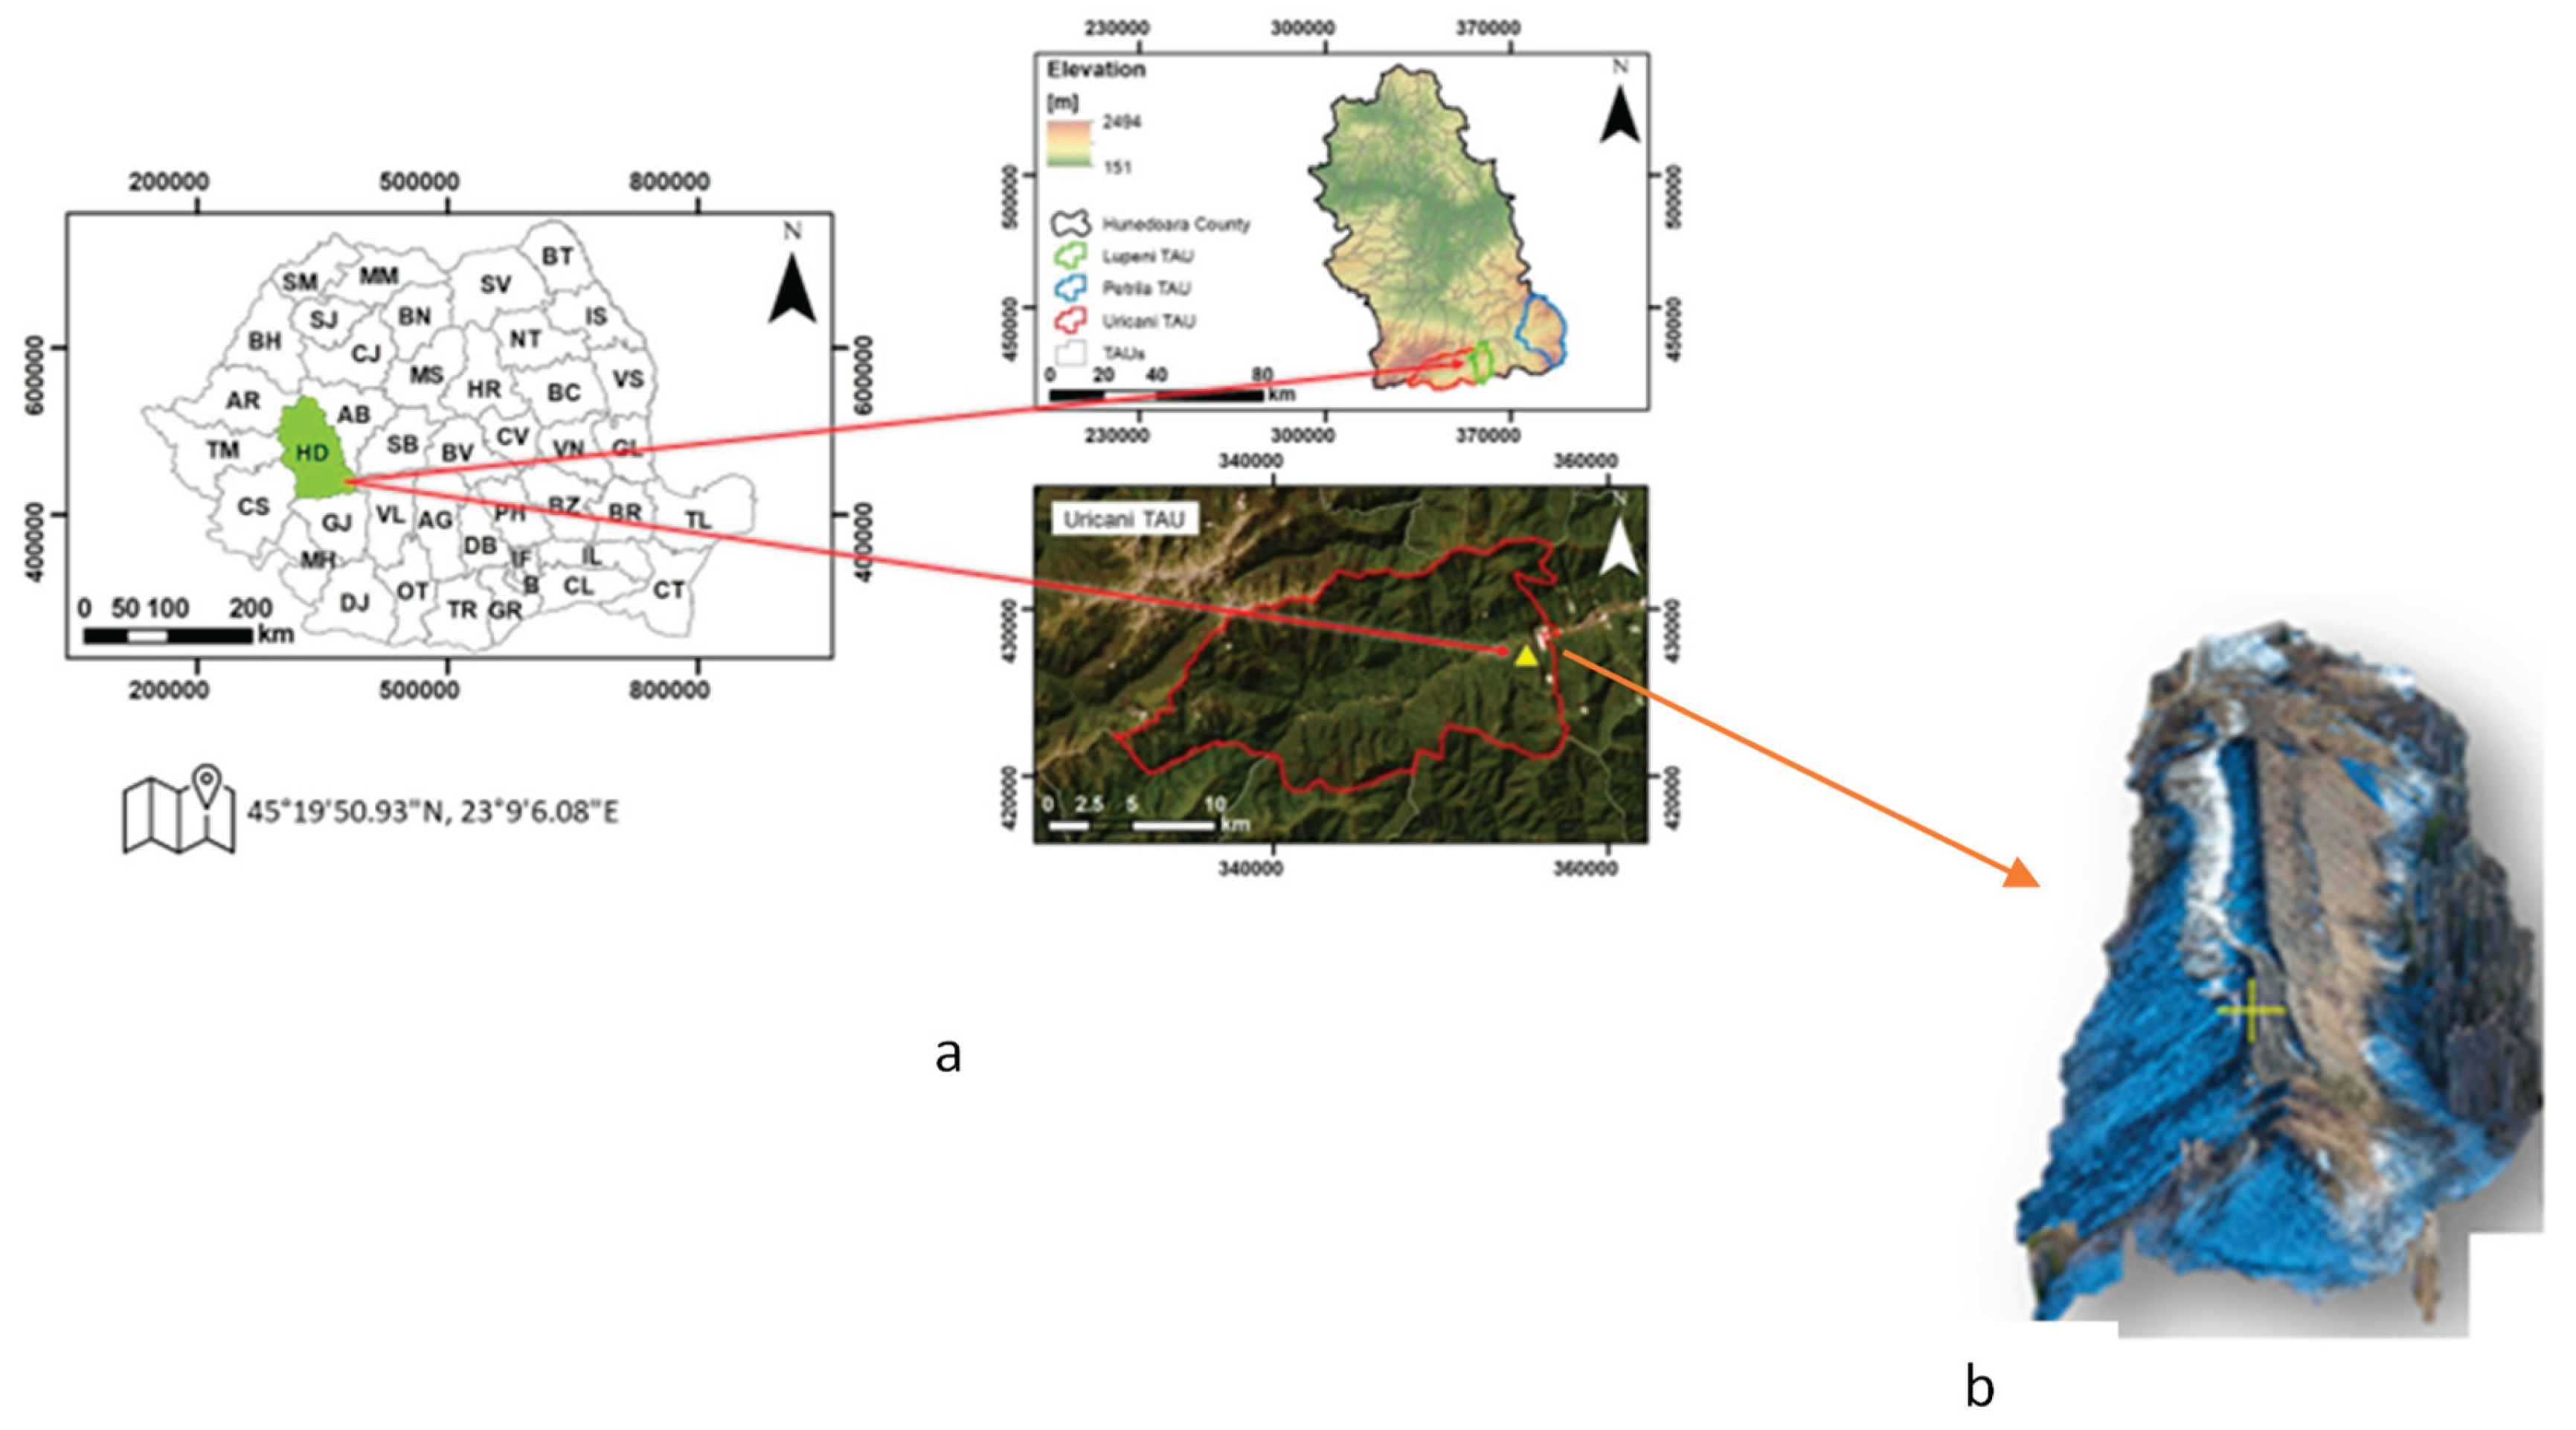
Figure 2.
Experimental variants: UV-unvegetated, HV-herbaceous vegetation, AV – arboreal vegetation.
Figure 2.
Experimental variants: UV-unvegetated, HV-herbaceous vegetation, AV – arboreal vegetation.
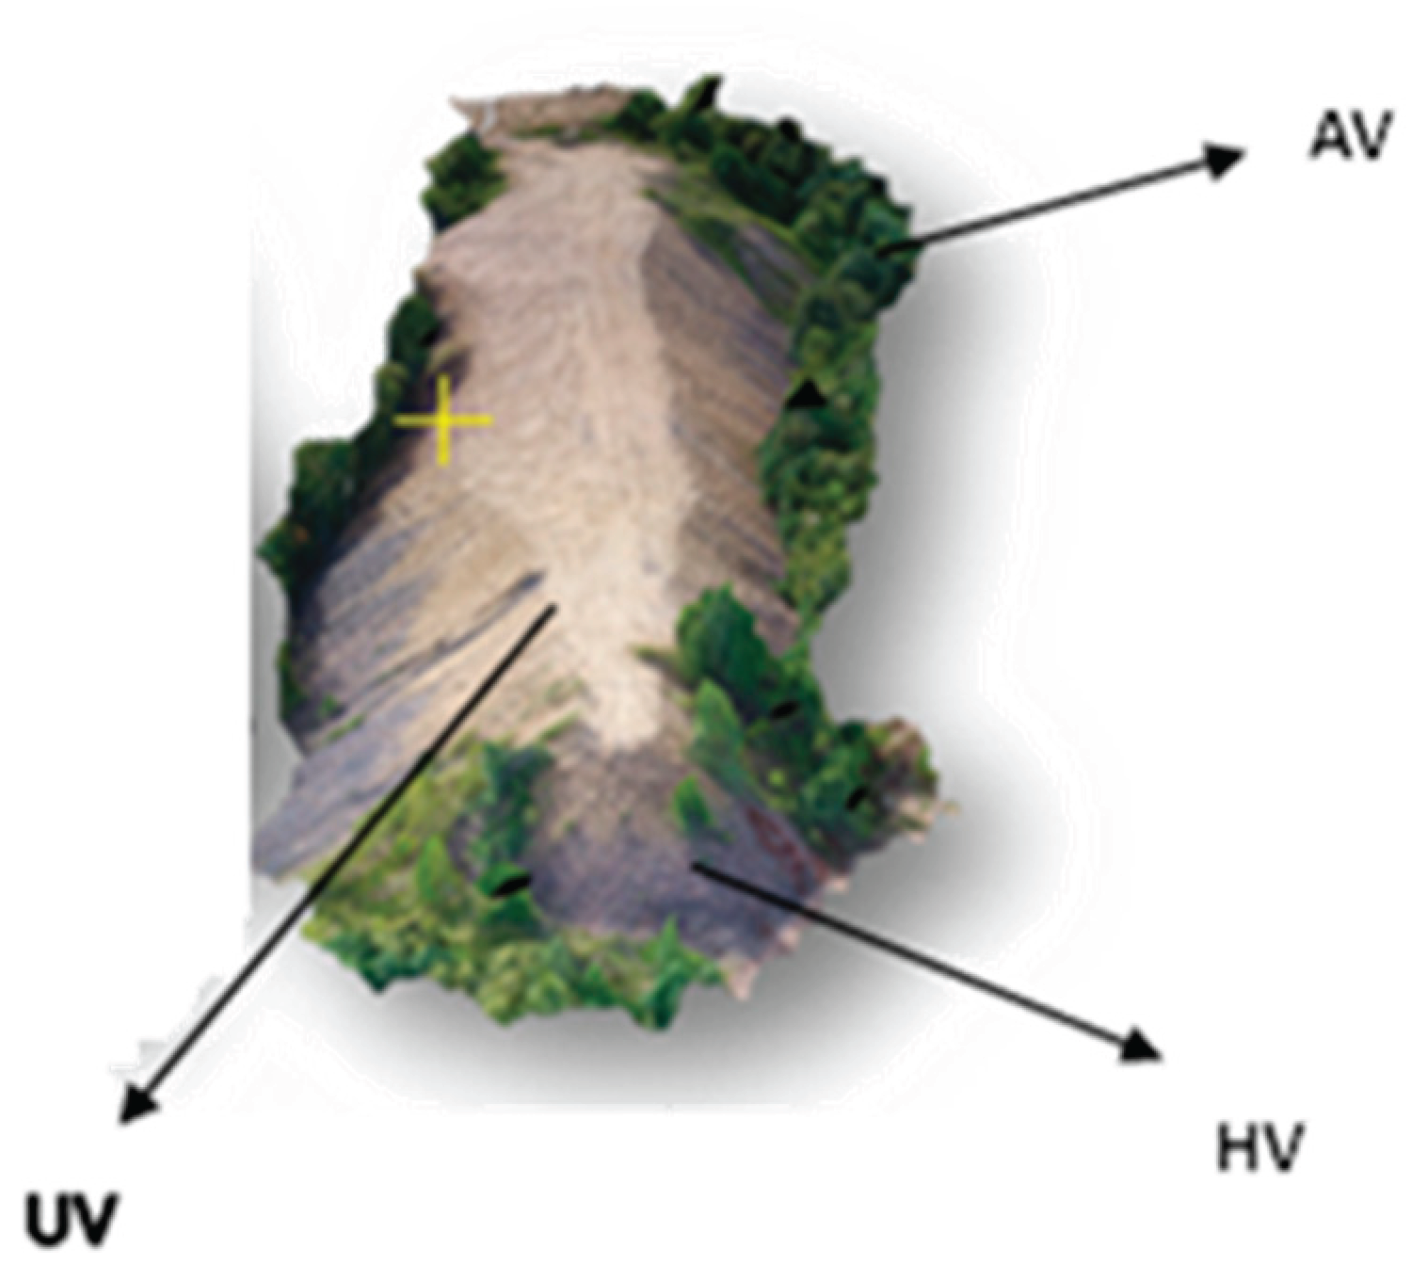
Figure 3.
OC/TN Ratio Dynamics Across Vegetation Types and Years.
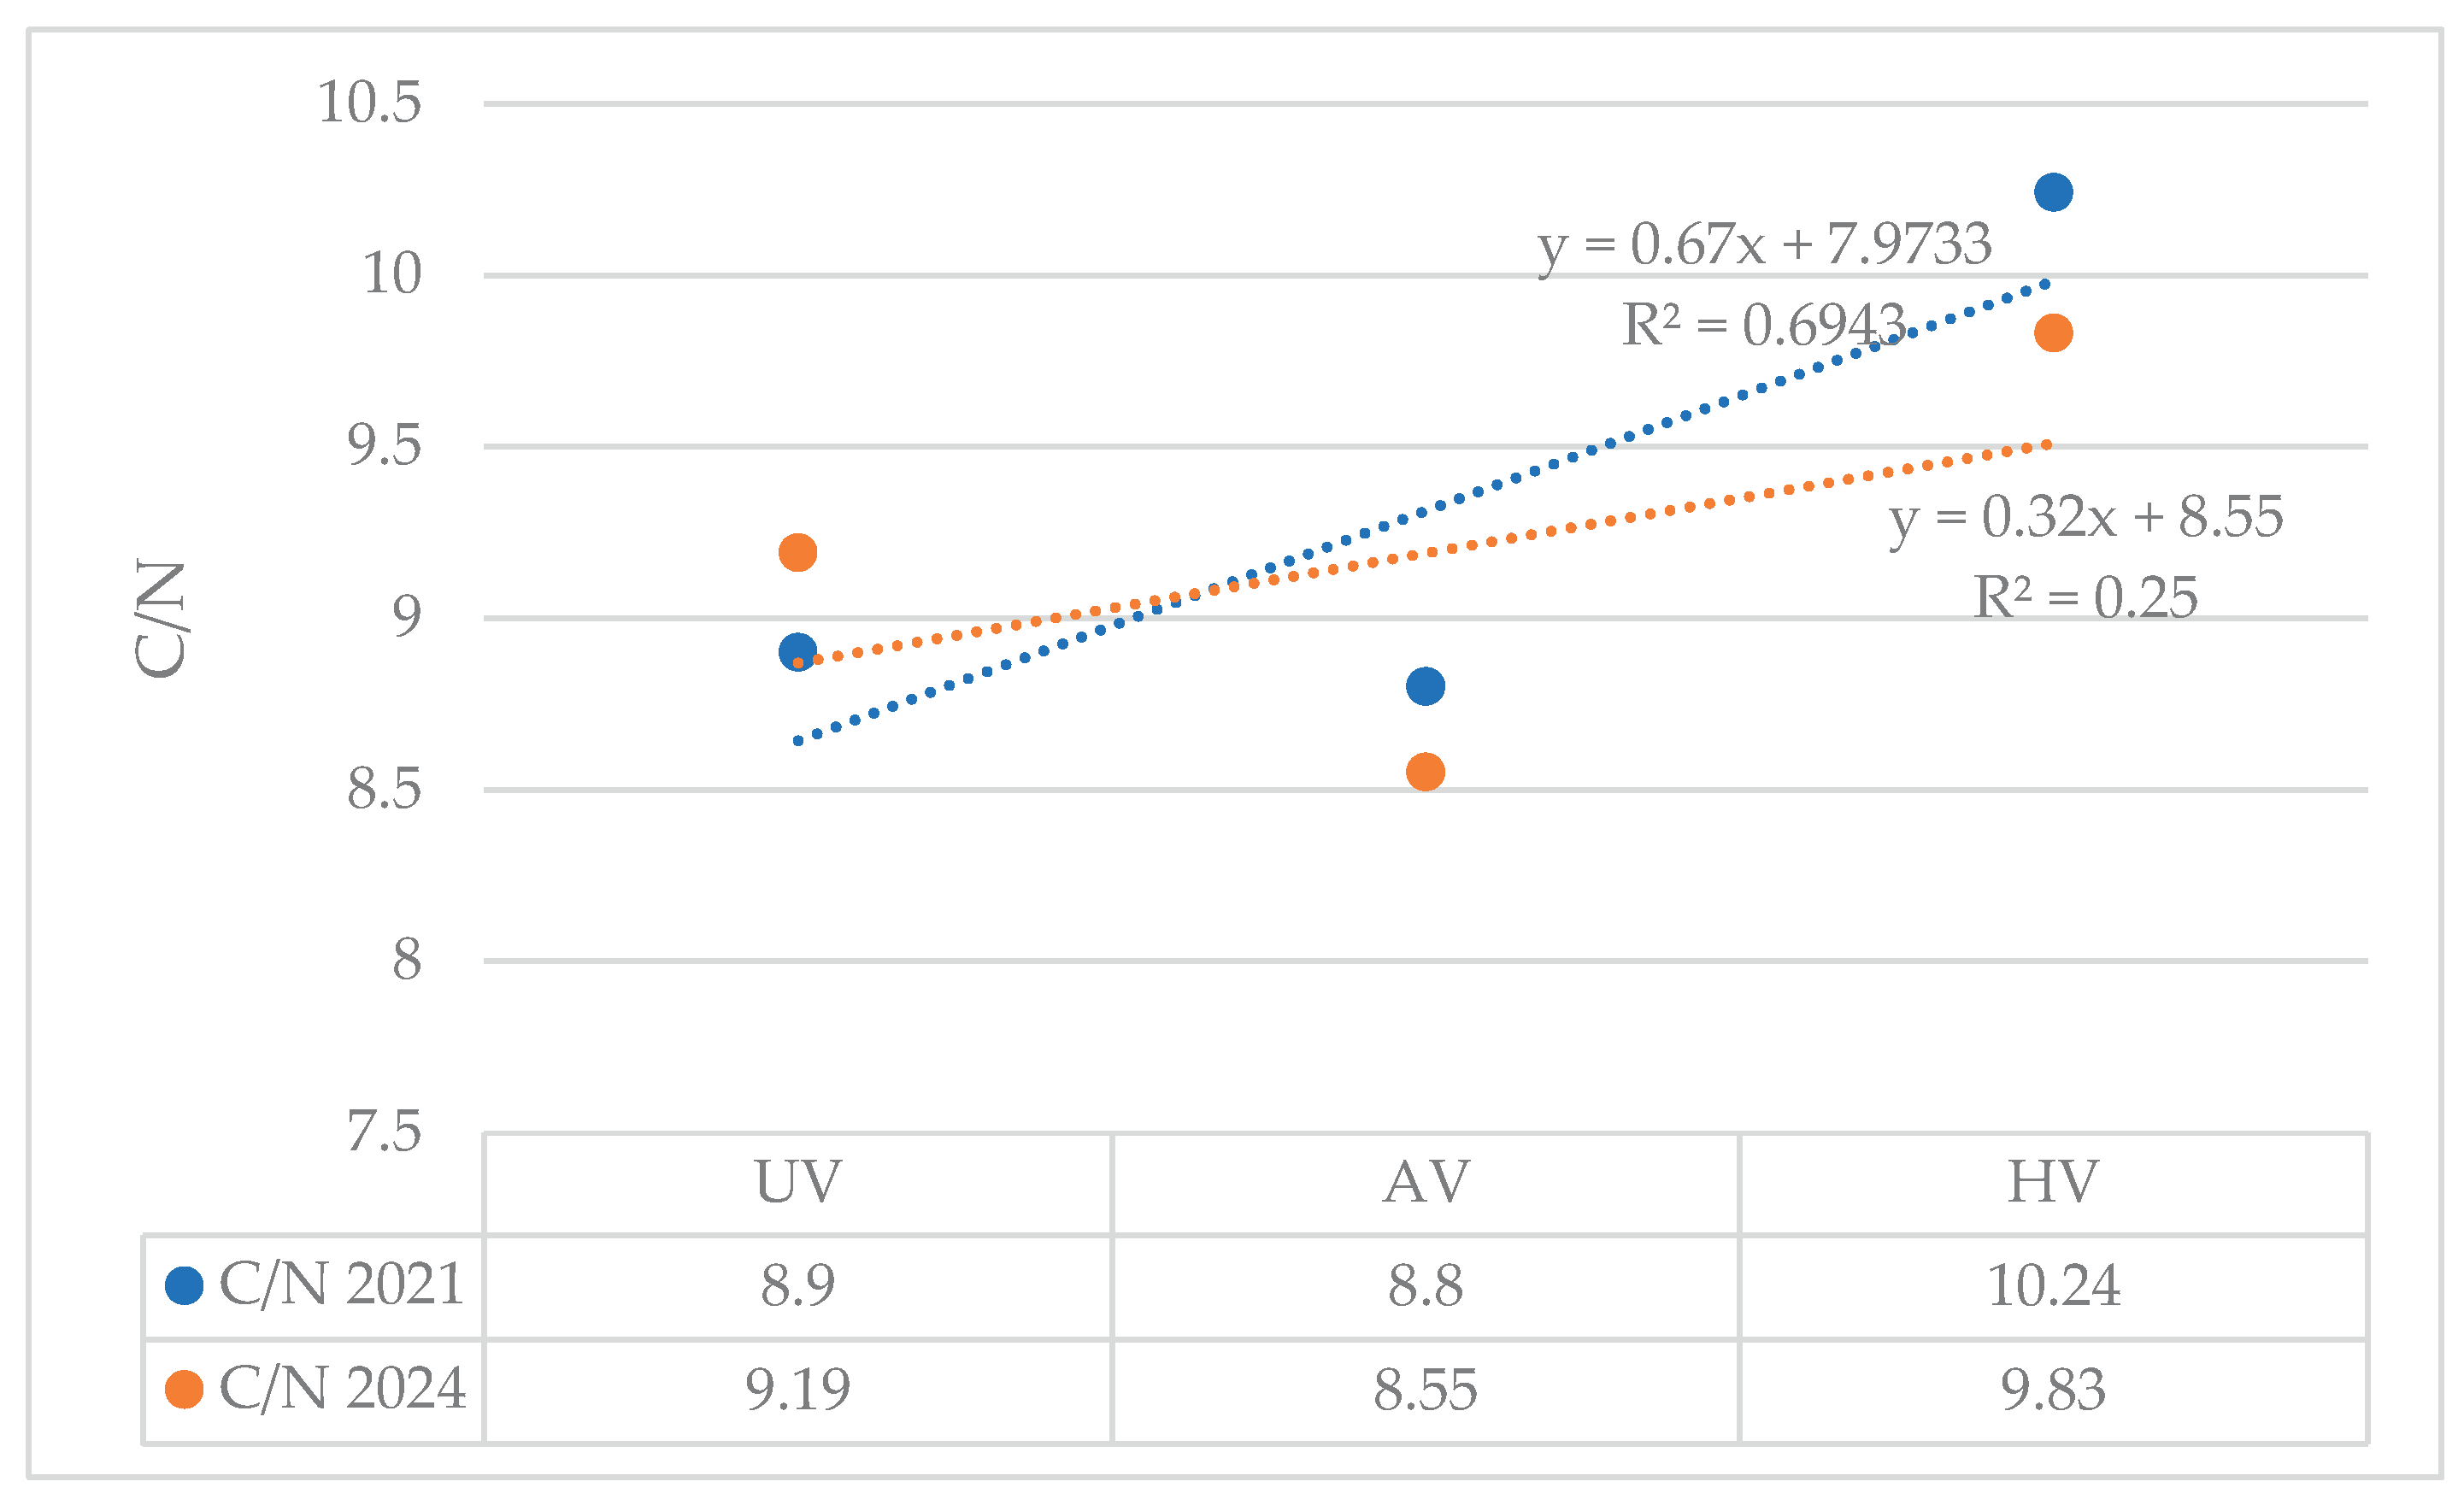
Figure 4.
Microelements content: Mn (a), Zn (b), Fe (c) and Cu (d). Means that do not share a letter or a number are statistically significant different at p<0.05. Lowercase letters are used to denote statistically significant differences between groups within year 2021. Uppercase letter indicates statistically significant differences between groups within year 2024, and numbers indicate significant differences within the same group in different years. AV – arboreal vegetation; HV – herbaceous vegetation; UV – unvegetated.
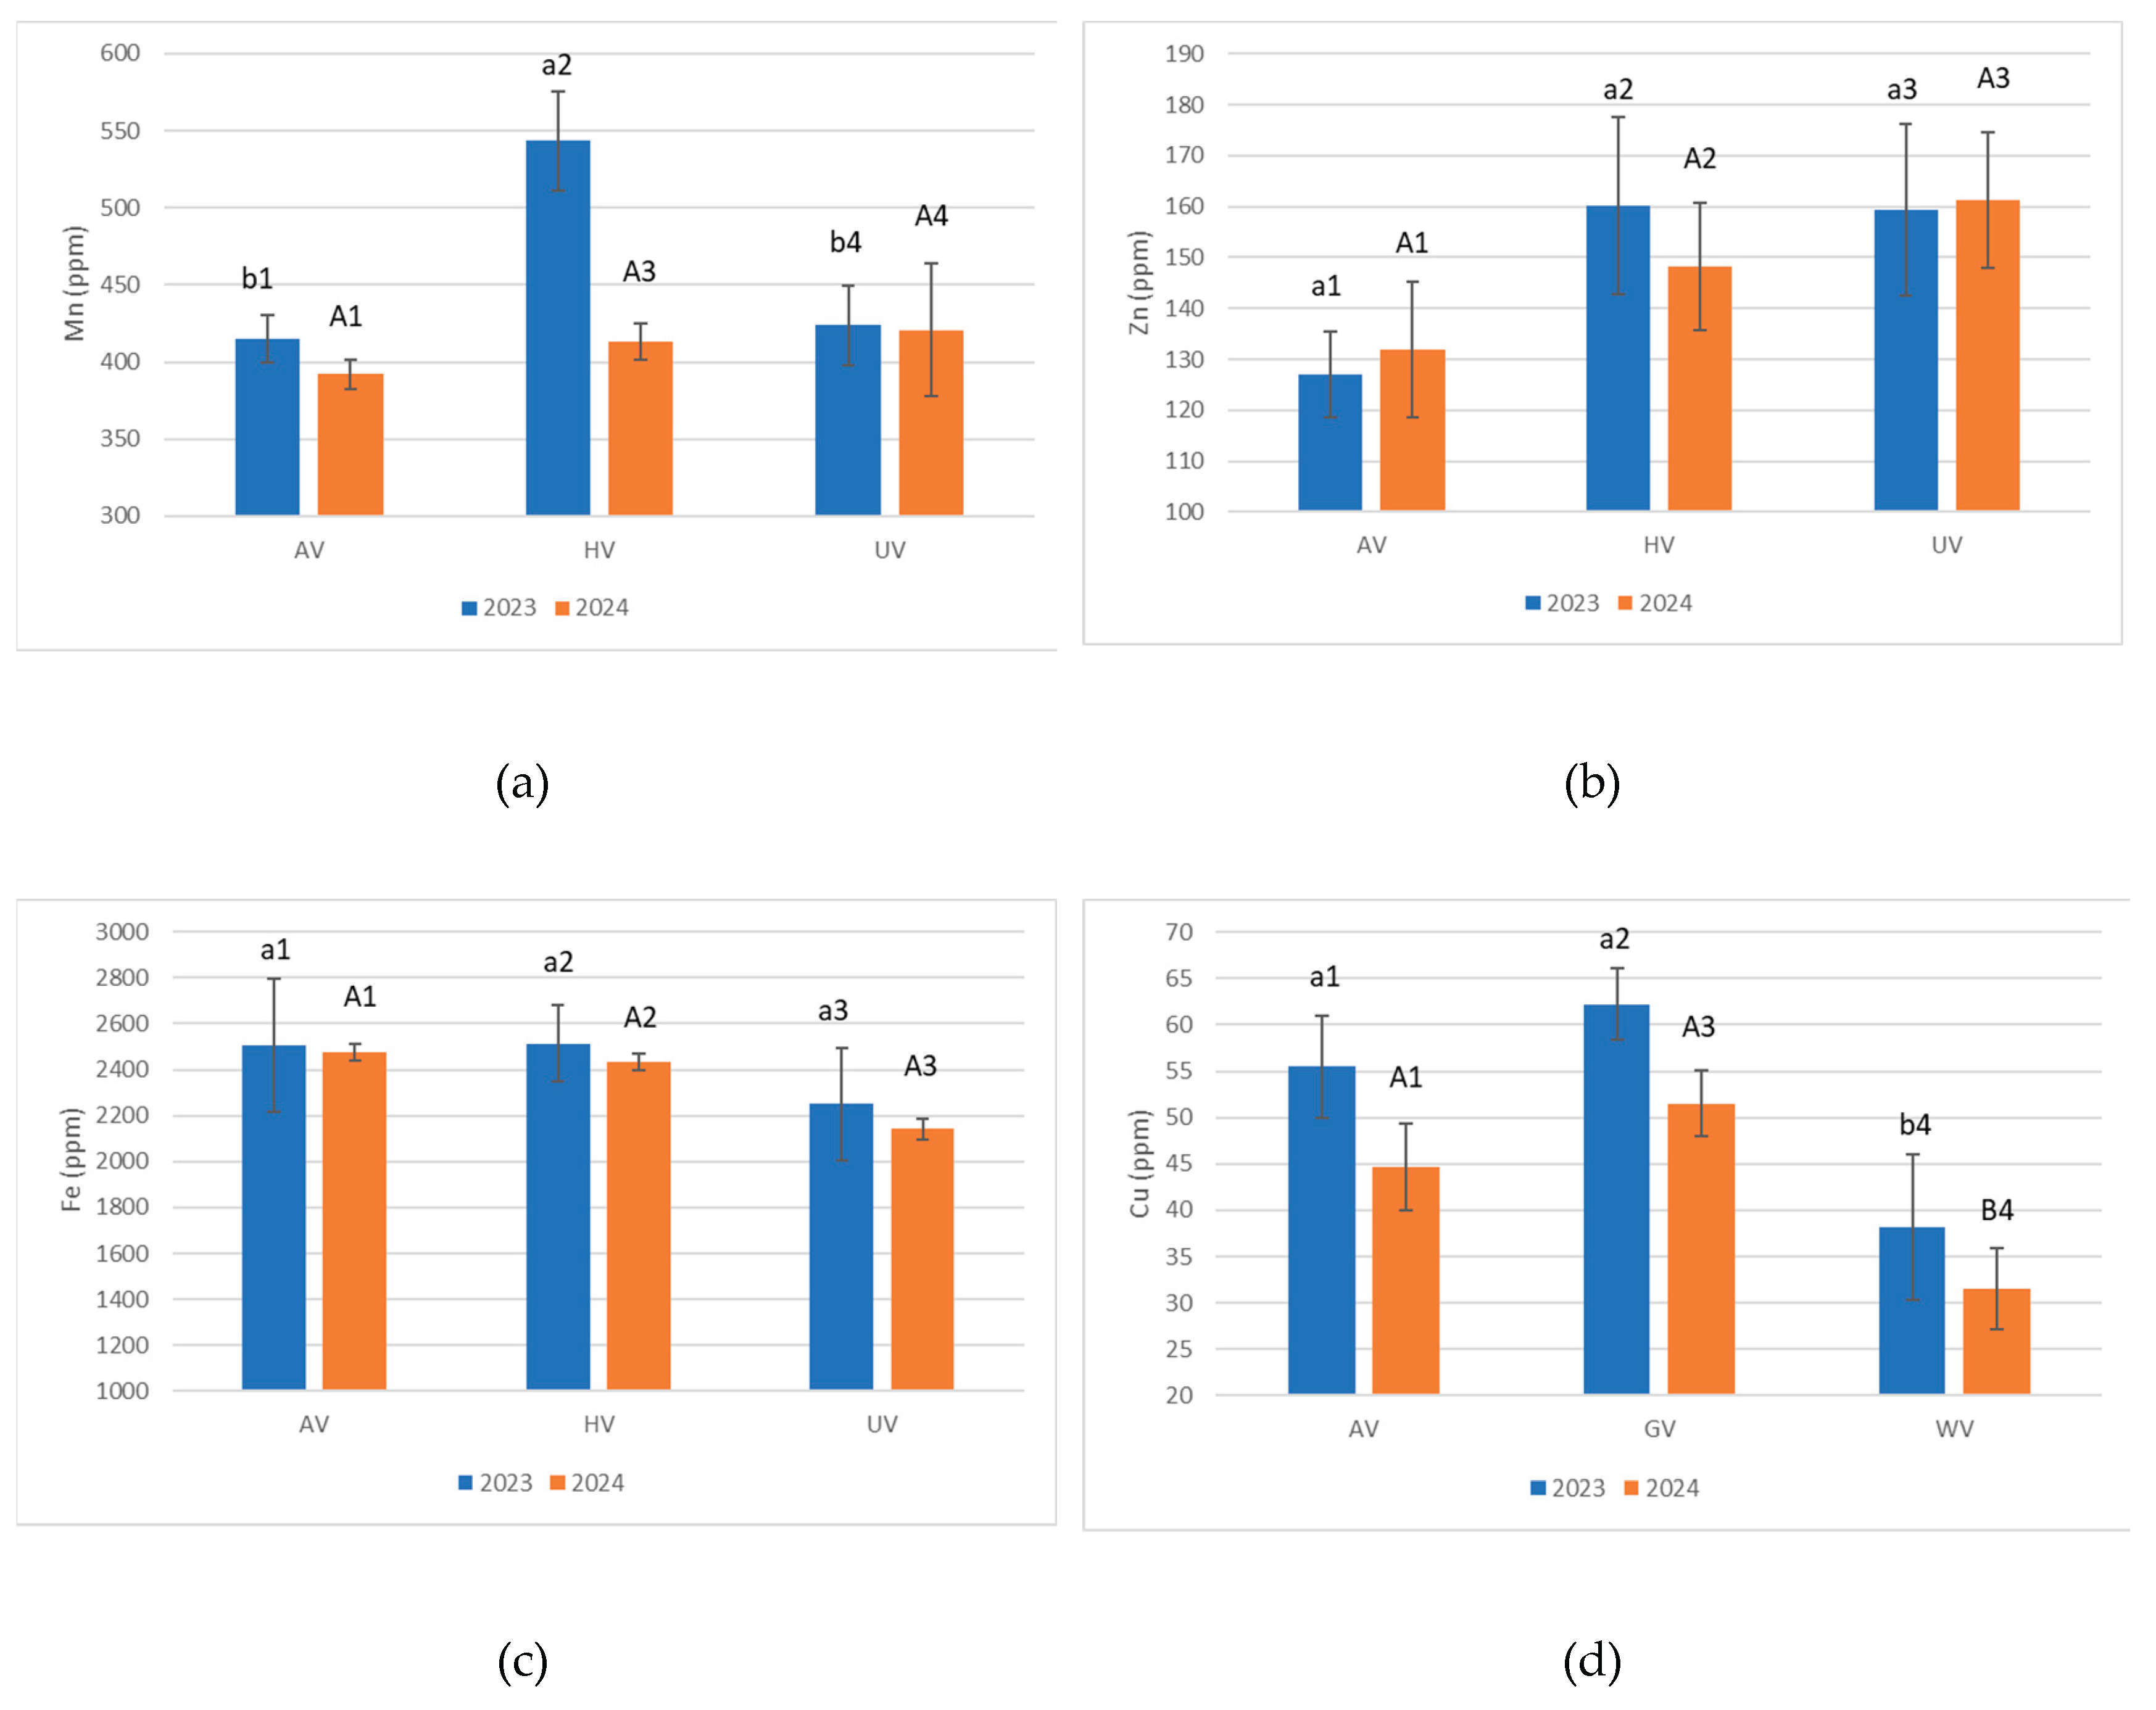
Figure 5.
Variations in the pseudo total heavy metal content of soil, covered with different types of vegetation - arboreal (AV), herbaceous (HV) and non-vegetative (UV) - monitored over a period of two years. Means that do not share a letter or a number are statistically significant different at p<0.05. Lowercase letters are used to denote statistically significant differences between groups within year 2021. Uppercase letter indicates statistically significant differences between groups within year 2024, and numbers indicate significant differences within the same group in different years.
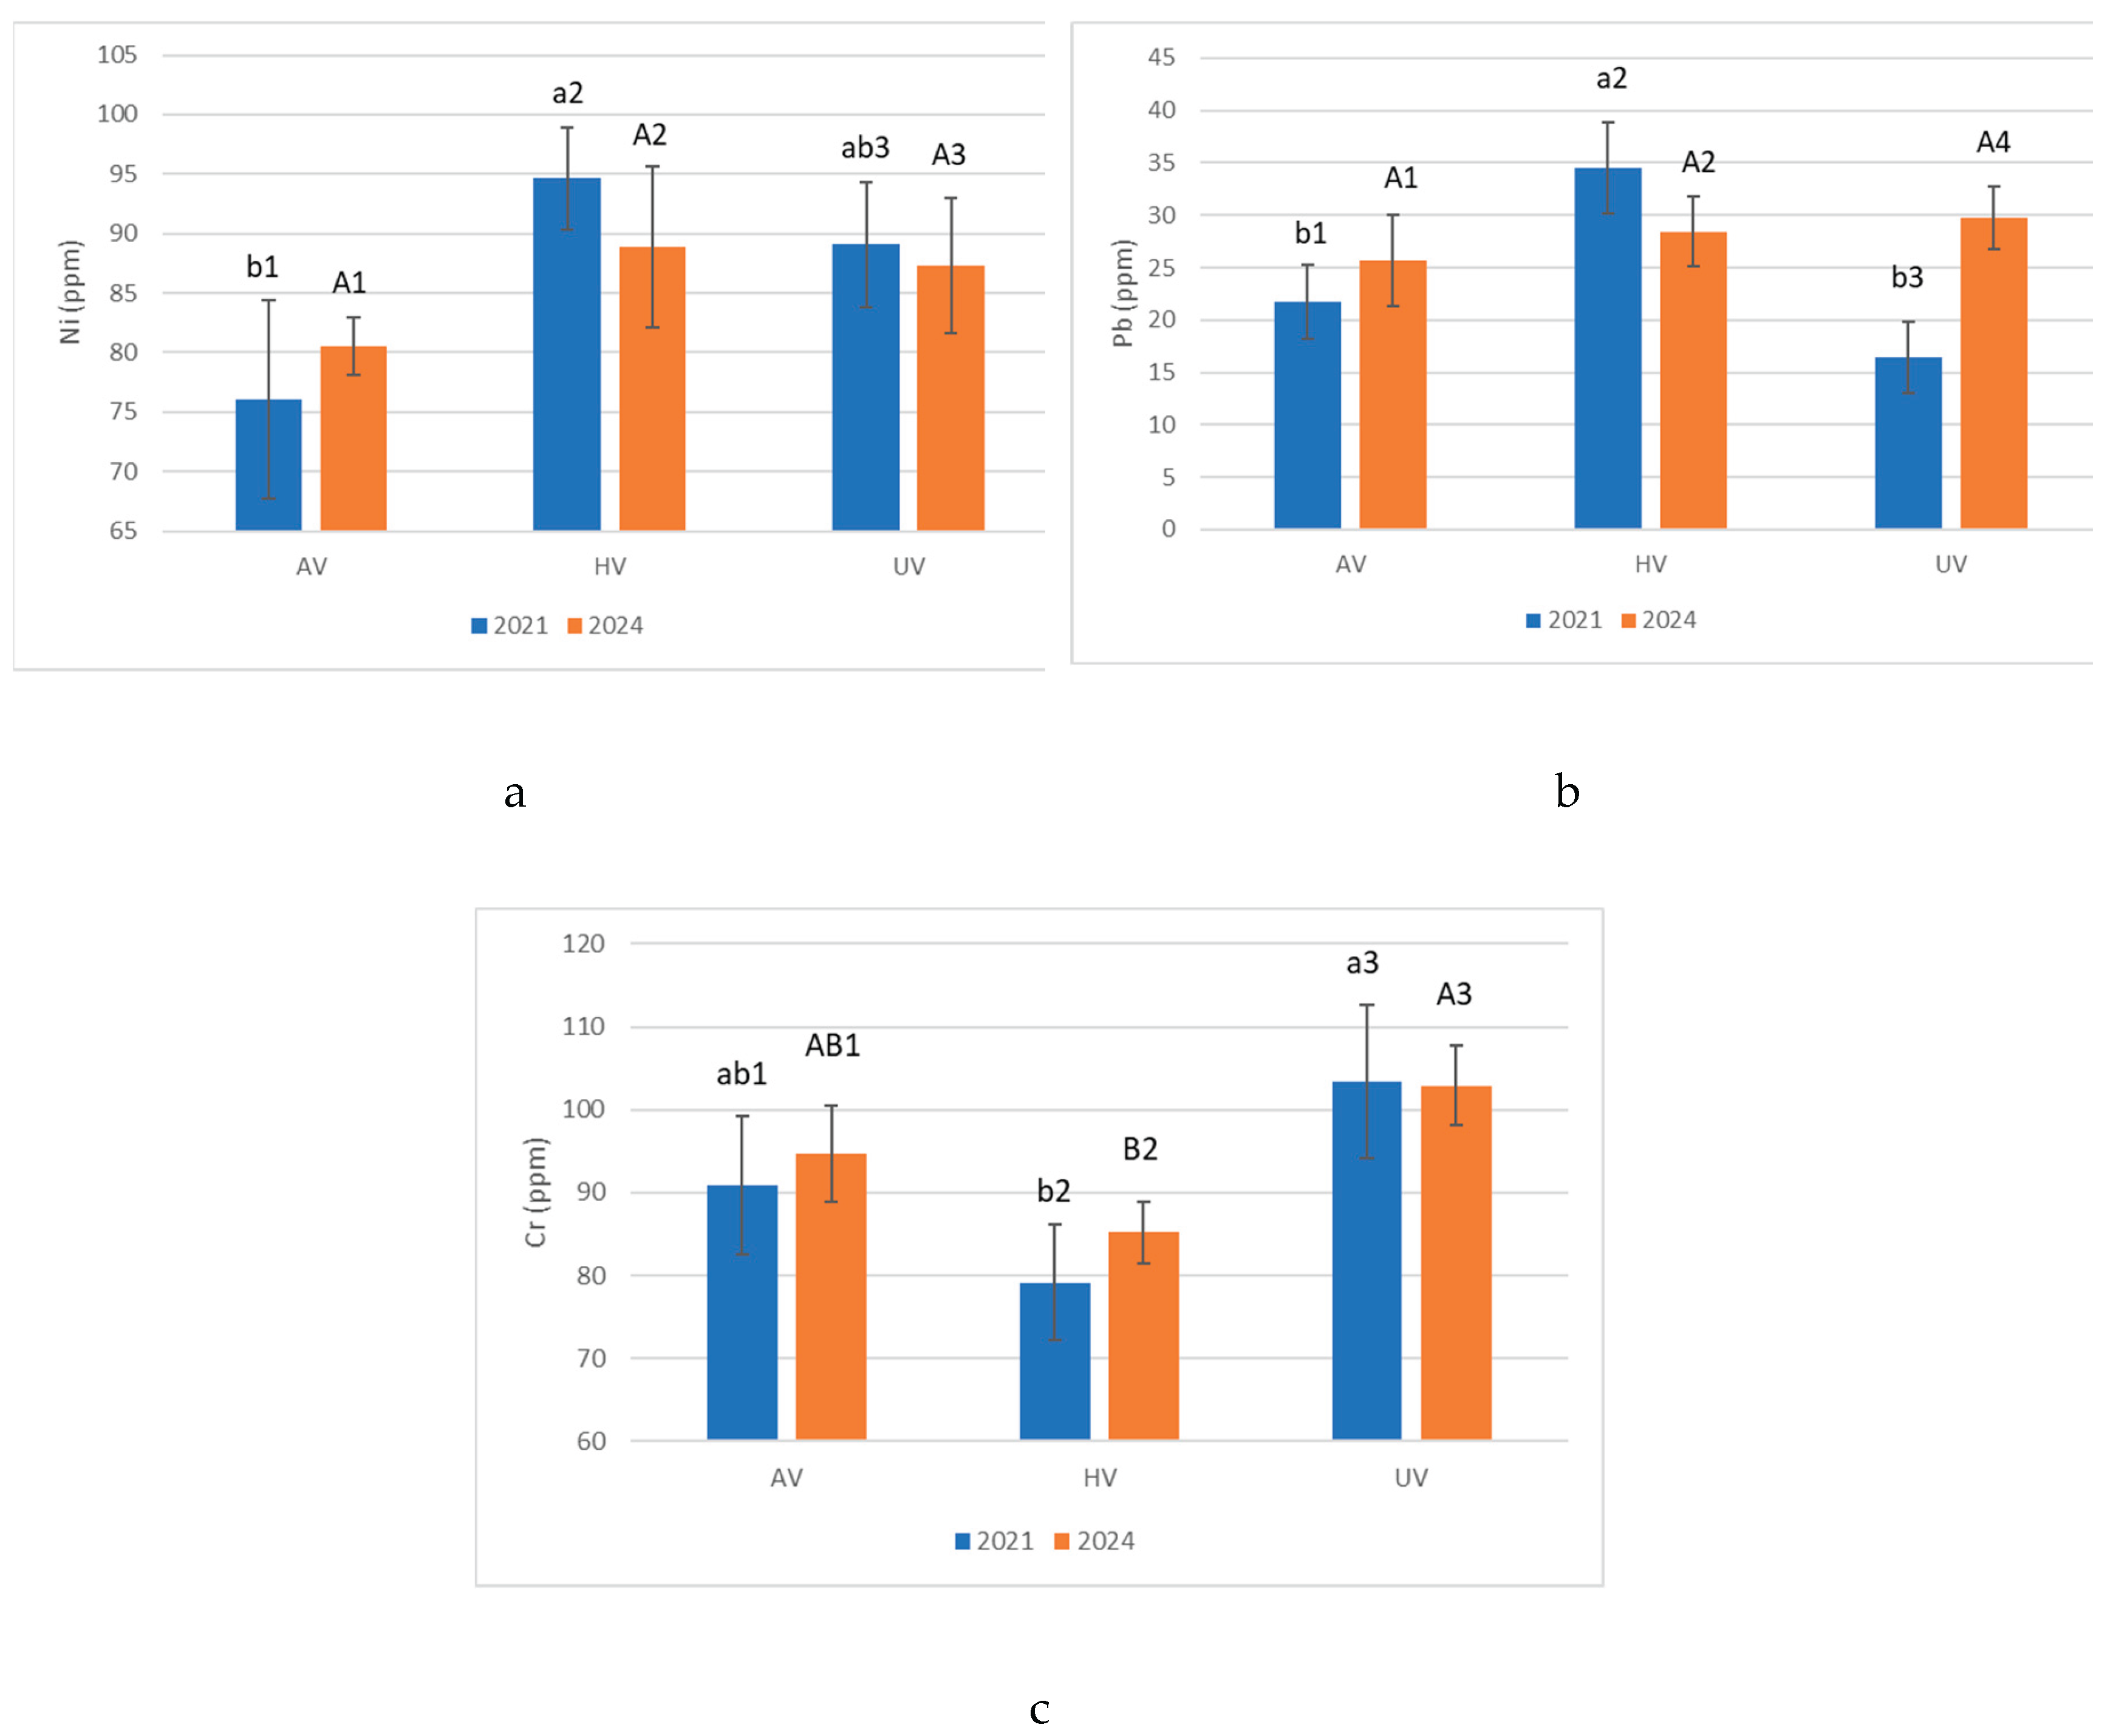
Figure 6.
Pearson correlation matrix in 2021.
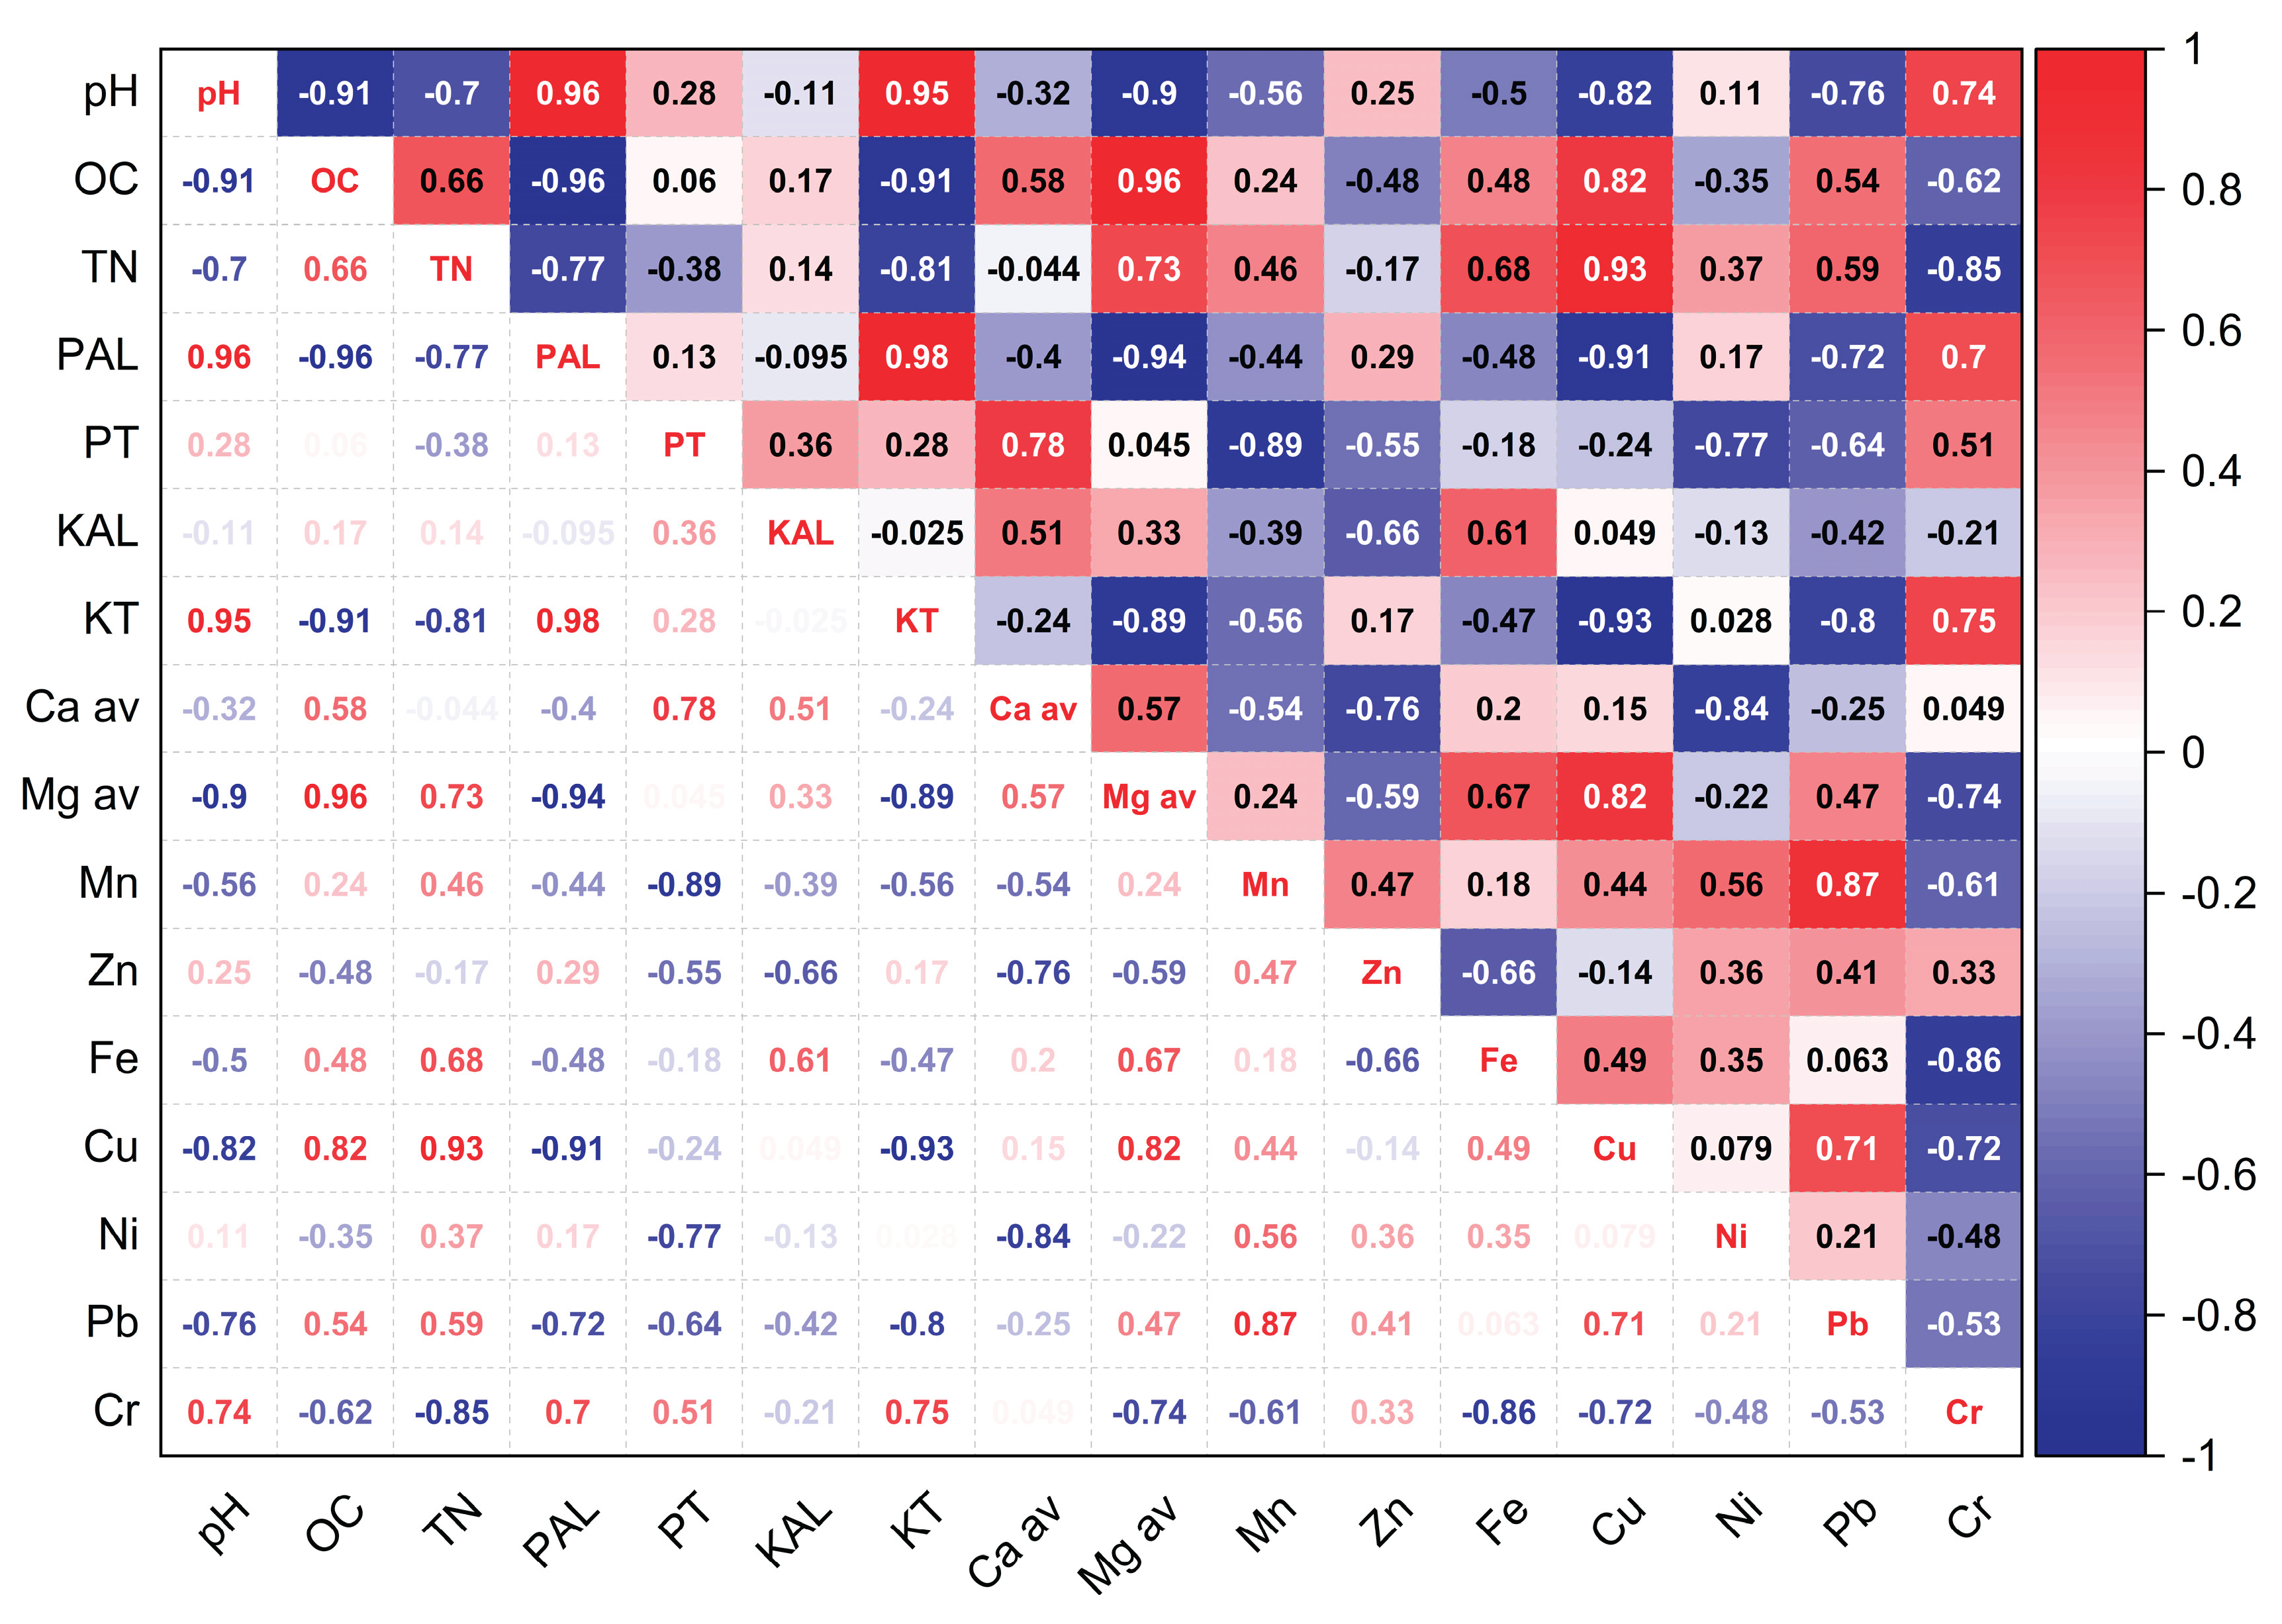
Figure 7.
Pearson correlation 2024.
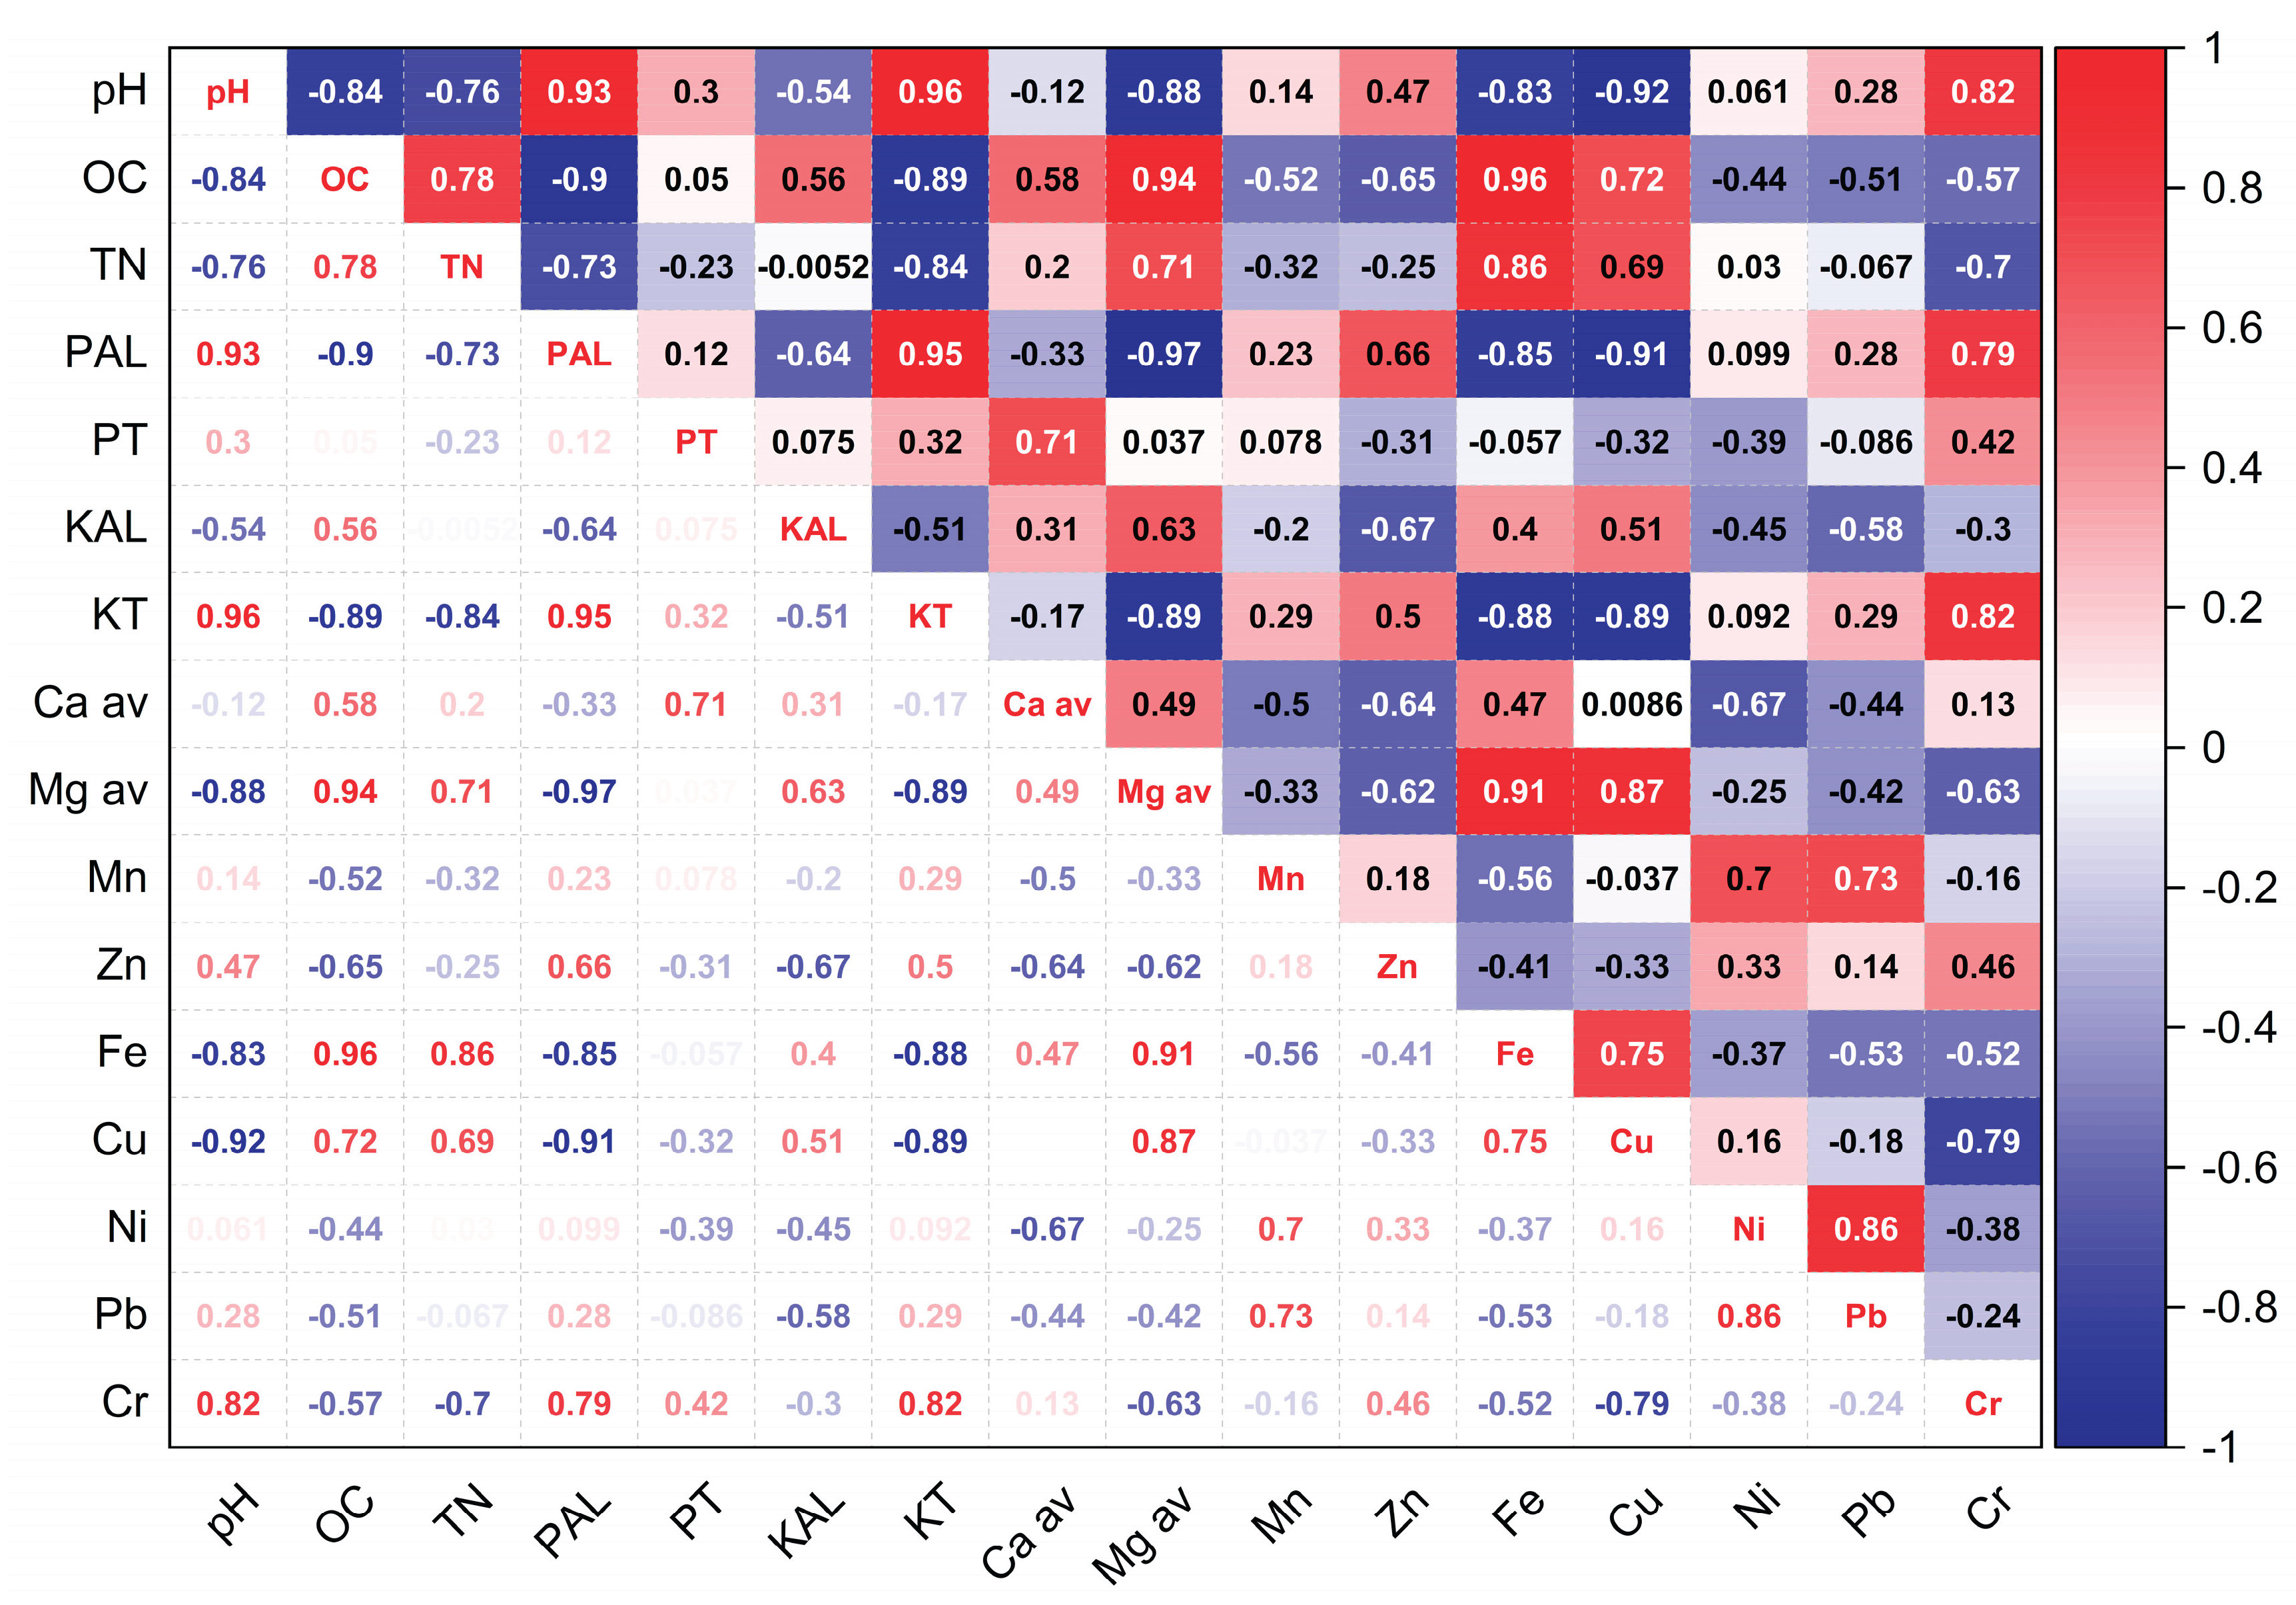
Figure 8.
PCA biplot – 2021.
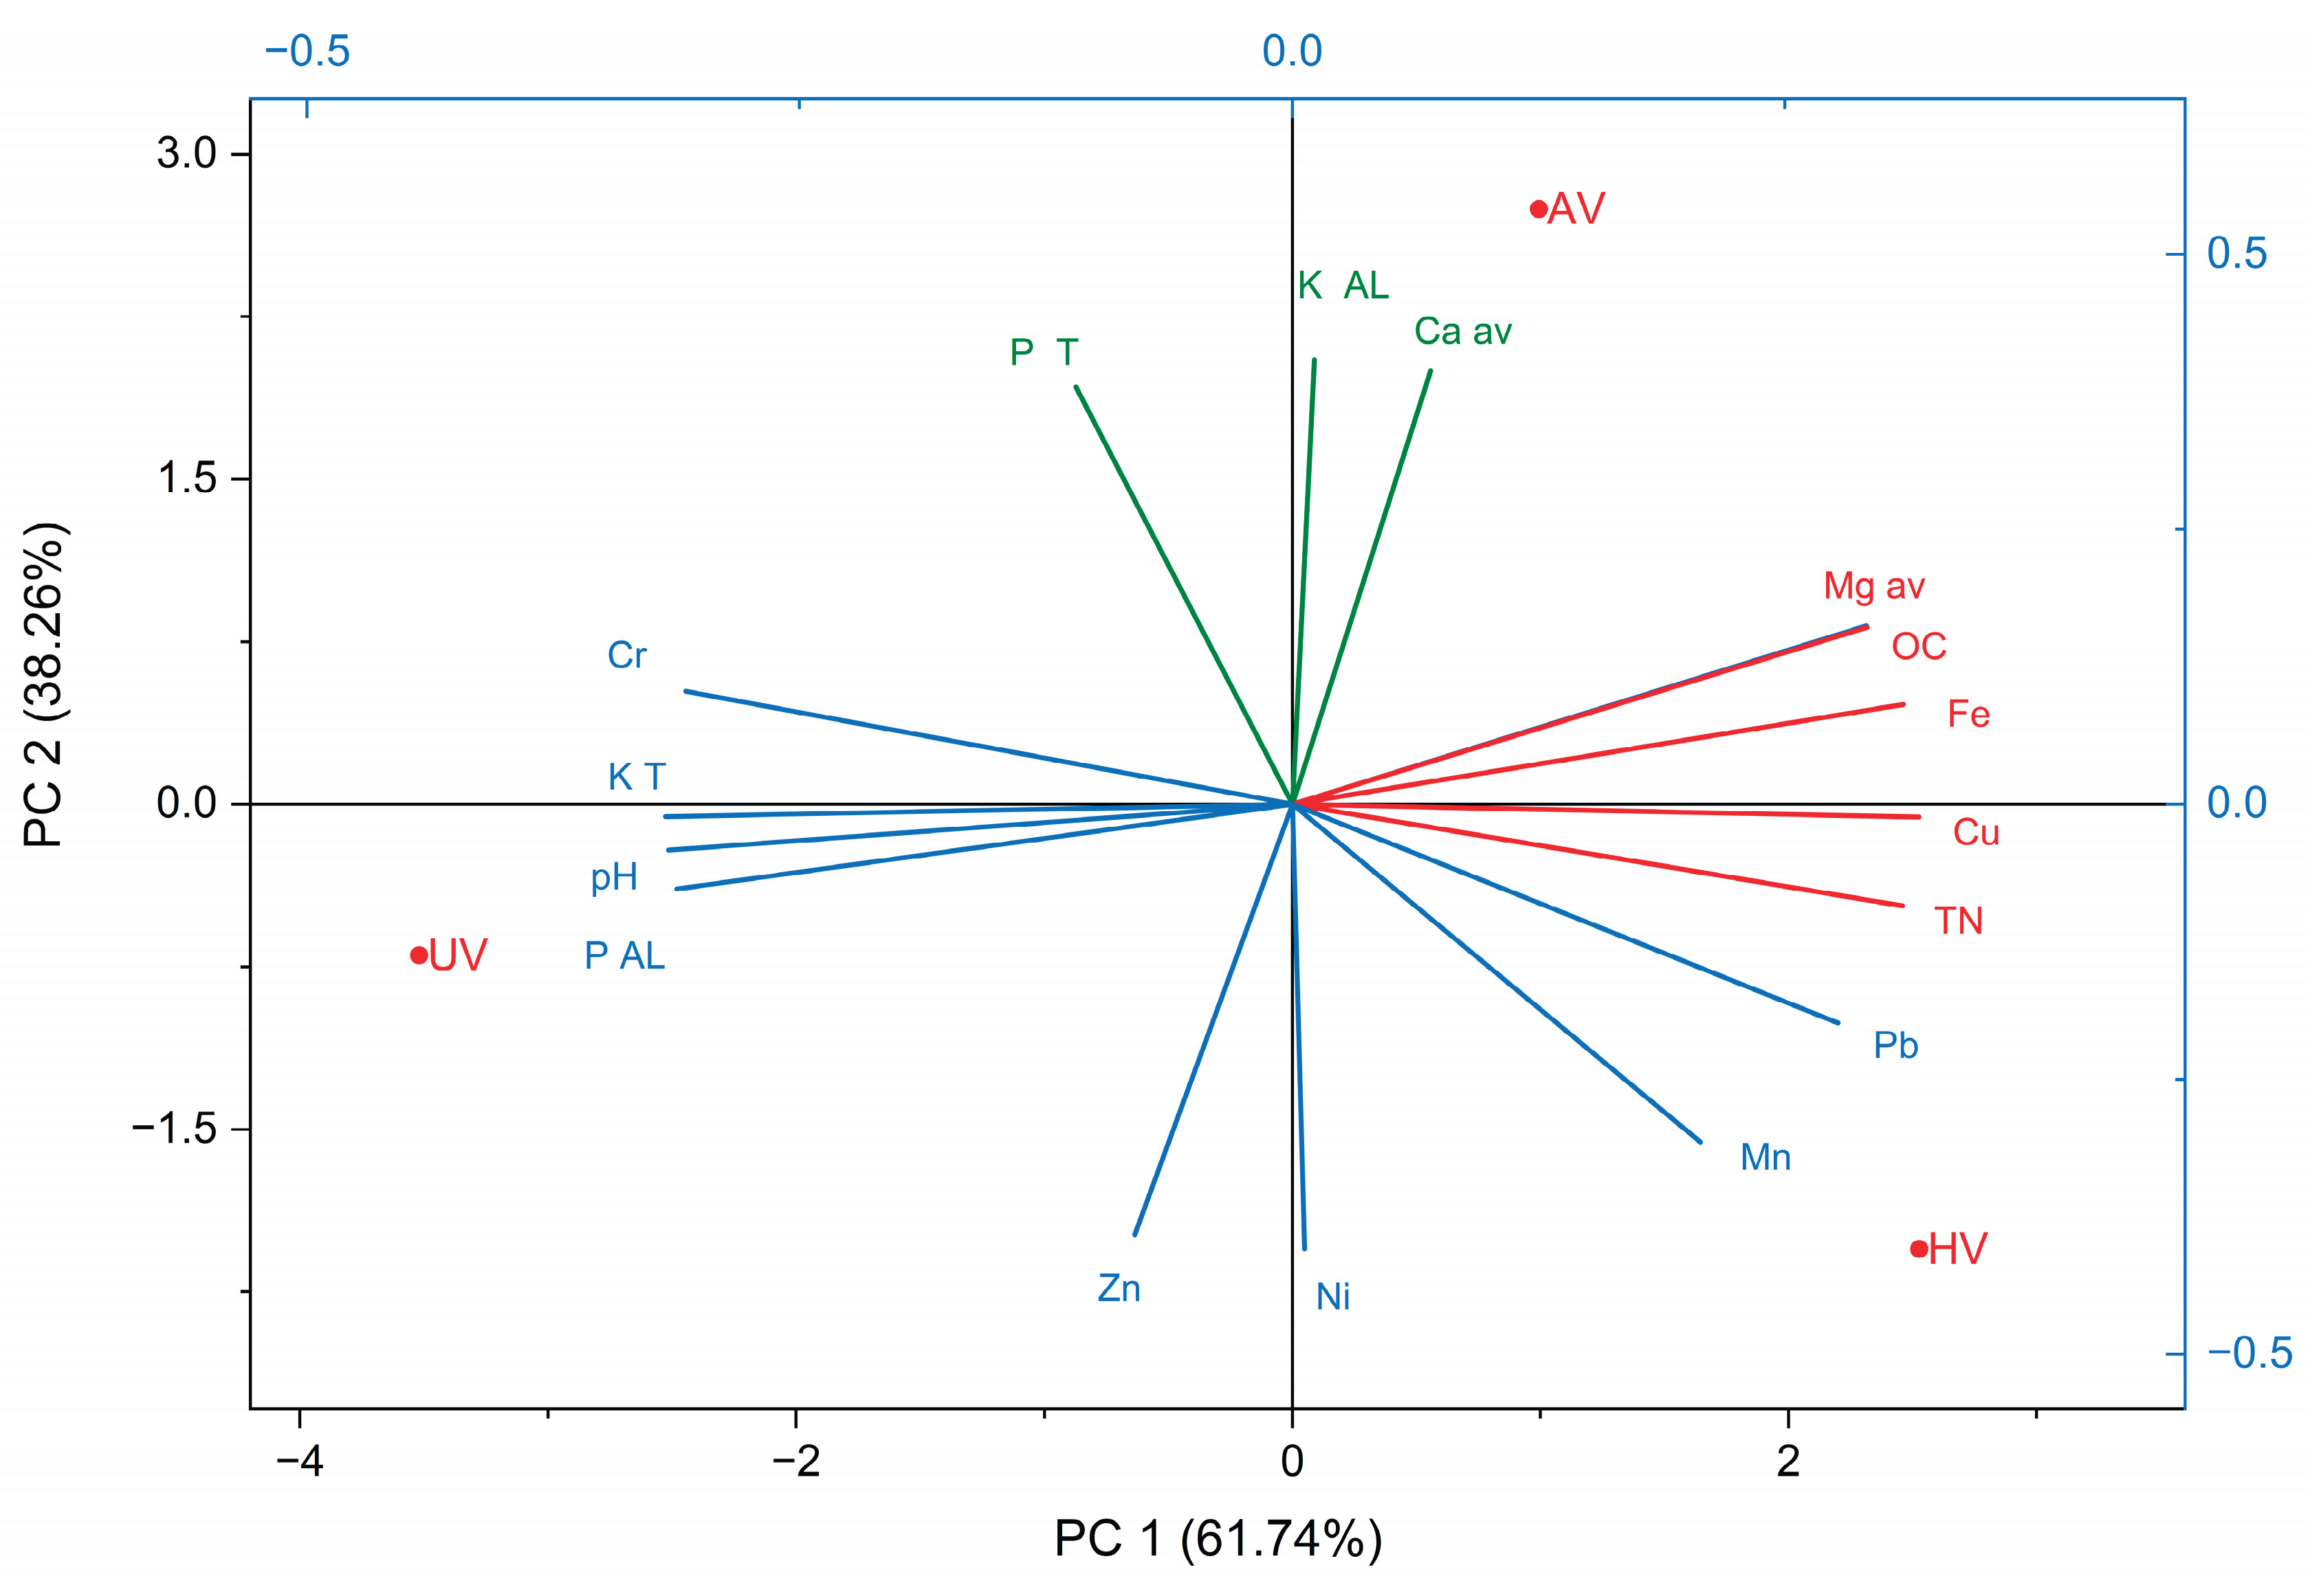
Figure 9.
PCA biplot – 2024.
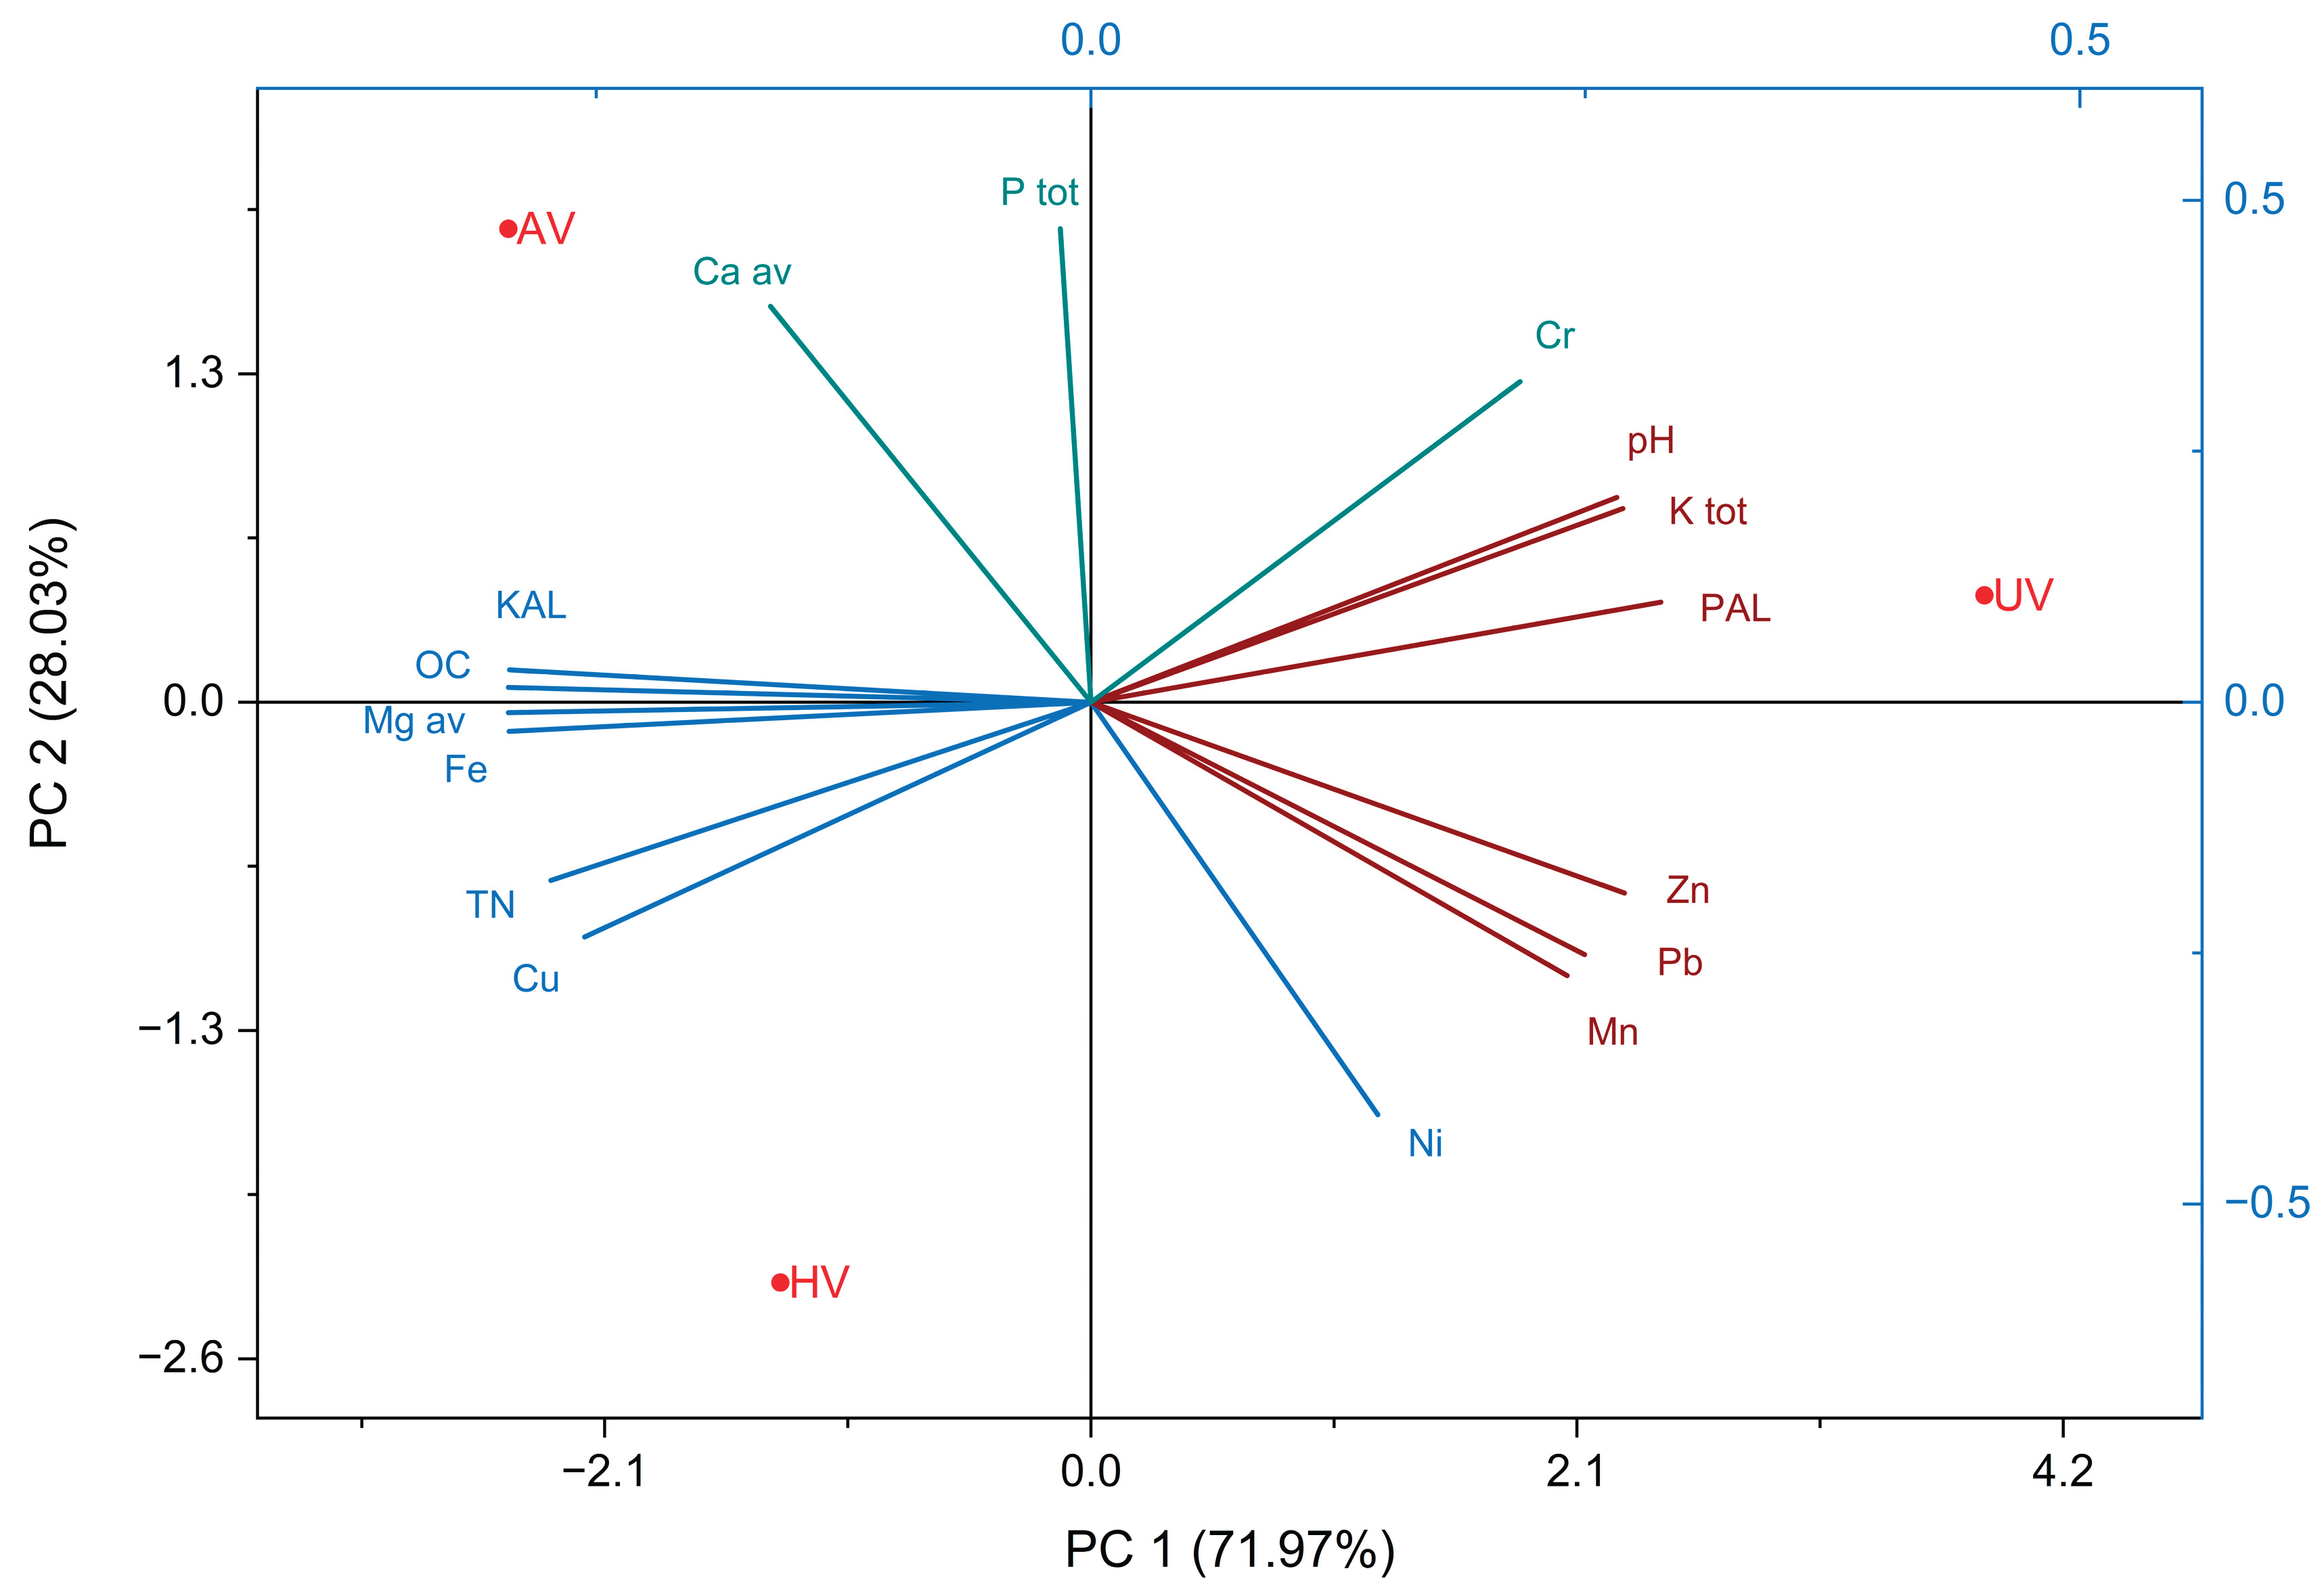

Table 1.
Dynamics of macronutrients in soil across distinct vegetation types—arboreal (AV), herbaceous (HV), and unvegetated (UV).
Table 1.
Dynamics of macronutrients in soil across distinct vegetation types—arboreal (AV), herbaceous (HV), and unvegetated (UV).
| Year | UV | AV | HV | |
|---|---|---|---|---|
| TN (%) | 2021 | 0.163±0.031b3 | 0.210±0.020ab1 | 0.250±0.026a2 |
| 2024 | 0.170±0.025B3 | 0.230±0.036AB1 | 0.247±0.050A2 | |
| OC (g kg-1) | 2021 | 14.51±0.40b3 | 21.51±0.81a1 | 20.26±0.71a2 |
| 2024 | 15.63±0.40B3 | 22.63±0.25A1 | 21.13±0.90A2 | |
| pH | 2021 | 8.57±0.036a4 | 8.13±0.072b1 | 8.05±0.062b2 |
| 2024 | 8.52±0.093A4 | 8.07±0.0911B1 | 7.89±0.081B3 | |
| PT (mg kg-1) | 2021 | 393±26.10a4 | 448±29.54a1 | 314±13.32b2 |
| 2024 | 432±39.61AB4 | 467±26.35A1 | 378±10.26B3 | |
| PAL (mg kg-1) | 2021 | 0.226±0.0235b3 | 0.024±0.0015a1 | 0.013±0.0015a2 |
| 2024 | 0.260±0.0458B3 | 0.029±0.003A1 | 0.017±0.0021A2 | |
| KT (mg kg-1) | 2021 | 1025±71c3 | 635±14a1 | 520±10b2 |
| 2024 | 1127±31C3 | 670±19A1 | 515±14B2 | |
| KAL (mg kg-1) | 2021 | 140±16.24a3 | 149±13.53a1 | 137±16.24a2 |
| 2024 | 144±12.50A3 | 166±10.97A1 | 160±20.01A2 | |
| Caav (mg kg-1) |
2021 | 1298±47b3 | 2854±80a1 | 1196±91b2 |
| 2024 | 1563±140B4 | 3062±159A1 | 1347±58B2 | |
| Mgav (mg kg-1) | 2021 | 323±33b5 | 758±46a1 | 682±57a3 |
| 2024 | 503±37B6 | 869±52A2 | 810±21A4 |
1 Means that do not share a letter or a number are statistically significant different at p<0.05. Lowercase letters are used to denote statistically significant differences between groups within year 2021. Uppercase letter indicates statistically significant differences between groups within year 2024, and numbers indicate significant differences within the same group in different years. AV – arboreal vegetation; HV – herbaceous vegetation; UV – unvegetated.
Disclaimer/Publisher’s Note: The statements, opinions and data contained in all publications are solely those of the individual author(s) and contributor(s) and not of MDPI and/or the editor(s). MDPI and/or the editor(s) disclaim responsibility for any injury to people or property resulting from any ideas, methods, instructions or products referred to in the content. |
© 2025 by the authors. Licensee MDPI, Basel, Switzerland. This article is an open access article distributed under the terms and conditions of the Creative Commons Attribution (CC BY) license (http://creativecommons.org/licenses/by/4.0/).
Copyright: This open access article is published under a Creative Commons CC BY 4.0 license, which permit the free download, distribution, and reuse, provided that the author and preprint are cited in any reuse.


