
Submitted:
13 October 2025
Posted:
14 October 2025
You are already at the latest version
Abstract
Plastic trash is one of the world's fastest growing environmental issues, with millions of tons ending up in landfills and natural ecosystems each year. At the same time, the road construction industry is facing escalating costs and sustainability problems as a result of its strong reliance on petroleum-based bitumen. Integrating recycled plastic into asphalt provides a twofold benefit, it reduces waste accumulation while also increasing pavement performance. This review compiles data from 51 papers and 251 experimental records to investigate the impacts of plastic alteration on bitumen properties, with an emphasis on penetration, softening point, and viscosity. Consistent trends suggest that adding plastic stiffens the binder, as evidenced by reduced penetration and increased softening point and viscosity. These enhancements improve rutting resistance, but they may make mixing and handling more difficult. This paper uses machine learning (ML) methodologies such as Random Forest and XGBoost to improve predictive understanding by outperforming linear models in capturing nonlinear relationships between dosage, plastic type, and processing conditions. The review identifies knowledge gaps, such as variability across studies, a lack of standardized test methodologies, and insufficient consideration of long-term environmental and economic repercussions. This study provides a synthesis of experimental findings as well as a data-driven methodology for developing long-lasting, high-performance asphalt binders supplemented with plastic waste.
Keywords:
plastic waste
; sustainable pavement
; mean absolute error (MAE)
; XGBoost
; dosage
; Root means square error (RMSE)
; coefficient of determination(r2)
; modified bitumen
; temperature
1. Introduction
Plastic production has increased worldwide in recent decades, creating a substantial waste management problem. Landfilling and incineration are traditional disposal methods that pose significant environmental risks, such as soil damage, greenhouse gas emissions, and ocean contamination. Since its inception, an estimated 8,300 million tons of plastic have been produced [1]. By 2015, around 6,300 million tons of garbage had been generated. Only 9% was recycled, 12% was burned, and the rest 79% wound up in landfills or the environment. If current trends continue, by 2050, approximately 12,000 million tons of plastic waste will have accumulated in landfills and natural places [1]. Natural resources are used extensively in road construction. Bitumen, the major binder in asphalt, is derived from petroleum, hence its price and availability fluctuate with the market. There is currently a critical need to increase the quality of asphalt mixes while simultaneously making them more sustainable.
The use of recycled plastic trash in bitumen has emerged as a viable road construction solution. This strategy not only reduces the quantity of plastic that ends up in landfills, but it also reduces reliance on virgin bitumen, which is expensive and restricted. By combining these advantages, the strategy promotes a more sustainable and circular economy, benefiting both waste management and the building industries [2]. Over the last 20 years, research has shown that plastics can operate as efficient modifiers, altering the rheological properties of bitumen to increase the performance of asphalt concrete in terms of rutting resistance, fatigue life, and durability. The findings revealed that the penetration values of the plastic-modified bitumen dropped as the amount of plastic increased. According to [3] the penetration values for 5%, 10%, and 20% plastic were 7.7 mm, 7.3 mm, and 2.0 mm, respectively. In contrast, as the plastic percentage increased, so did the softening point and ductility.
Another experiment was conducted where the dose of plastic used were 2,4,6,8 & 10% and it was concluded that replacing bitumen with plastic waste significantly improves tensing point, ductility, and penetration in flexible pavement construction, making it a cost-effective alternative to bitumen [4]. Also with the same amount of dose, researcher [5] conducts test on different quantities of 80/100 bitumen which showed, qualities such as elastic modulus, tensile strength, durability, resistance to permanent deformation, heat susceptibility, and fatigue resistance improved. Experiment conducted by [6], where he used 2,3,6,8 and 10% of PET, showed a result as by adding 3 % PET waste improves the properties of modified bitumen, reducing penetration by 12 units and increasing softening point by 5°C.
This review paper assembles over 250 data points from 51 distinct investigations to provide a thorough understanding of plastic-modified bitumen. The study looks at how different plastics, such as PET, LDPE, HDPE, PP, hybrid and PVC, as well as dose levels, mixing temperature and mixing rate, affect essential bitumen qualities like penetration, softening point, and viscosity. Machine learning models are applied to the combined dataset to improve the analysis by predicting material behavior and providing fresh insights into the complicated interactions between processing conditions and performance outcomes. The review aims to integrate existing knowledge, identify consistent trends and gaps, recommend optimal parameters, and discuss future difficulties and opportunities for the wider use of plastic-modified bitumen in road building.
2. Materials and Methods
To describe and analyze the behavior of plastic-modified bitumen, this project took a data-driven method. A tabular dataset of 251 records (Table 1) was generated from published studies, including three important bitumen target properties: softening point, penetration, and viscosity. Each row represents one experimental condition, and each row is labeled with a “study id” to indicate the original study for grouping validation. Modeling and analysis were done in the help of Python as well as Google Colab to facilitate sharing and repeatability.
Categorical fields (such as plastic types) were saved as categories, whereas numerical variables were saved as floats. To maintain traceability, values reported in different units in source studies were preserved as reported and their units indicated in the data dictionary. To prevent information leakage across studies, all evaluations employed grouped K-fold splits with ‘study id’ as the grouping key—that is, the same study was never included in both the training and validation folds. This design more properly assesses generalization to previously unseen investigations. We created three different regression tasks to predict (i) softening point, (ii) penetration, and (iii) viscosity, so that each attribute could be modeled and assessed independently. This ensures that metrics for each engineering property are understandable.
Three models were constructed and assessed to establish a performance baseline and examine different algorithmic techniques such as Baseline Model, Linear Regression Model and Tree-Based Model. We used three popular regression measures to assess the model’s performance.
- Mean absolute error (MAE)
It tells how far a model’s predictions are from the actual values on average, without regard for whether they were too high or too low. A high MAE could indicate that the model should be retrained or modified. A lower MAE increases confidence that the model generates useful estimates [46]. According to the research [47] equation to find the mean absolute error is
MAE = 2
- Root means square error (RMSE)
The difference between predicted and actual values in a regression model is measured, and the standard deviation of the residuals (errors) is used to determine its accuracy. A lower RMSE suggests that the model fits the data better, with 0 indicating a perfect model [48]. The root mean square error is determined as follows:
- Coefficient of Determination (R2)
The coefficient of determination is a summary statistic that shows how well the independent variable in the regression explains the variation in the dependent variable [49]. The coefficient of determination R2 is the following ratio:
To supplement these measurements, diagnostic charts such as Predicted vs. Observed charts and Feature Importance Plot were created.

Table 2.
Data Dictionary.
| Column Name |
Data Type |
Data Category |
Sample Value |
Null Count | Completeness (%) |
Unique Value |
Value Range |
Mean |
| Study_id Type of plastic Dose of plastic (%) Mixing Temp. Mixing Rate Mixing Time Type of Bitumen Age/unage Softening point Penetration Viscosity |
object object float64 float64 float64 float64 object object float64 float64 float64 |
Text Text Numeric Numeric Numeric Numeric Text Text Numeric Numeric Numeric |
St_01, St_01, St_01 R-LLDPE, R-LLDPE, R-LLDPE 3.0, 3.0, 3.0 170.0, 170.0, 170.0 3500.0, 3500.0, 3500.0 90.0, 90.0, 90.0 C320, C320, C320 Unaged, Unaged, Unaged 49.5, 83.7, 119.3 547.0, 403.0, 253.0 0.81, 1.46, 3.52 |
0 0 0 15 85 42 11 231 57 44 144 |
100 100 100 94 66 83 95 7.6 77.2 82.4 42.4 |
51 28 25 17 16 17 39 2 102 120 94 |
NA NA 0-36 120-250 20-13000 2-180 NA NA 3.83-131 15-820 0.16-10 |
NA NA 5.43 170 2110 49 NA NA 61 320 2.2 |
The table above shows data dictionary that provides a comprehensive overview of the variables associated with plastic-modified bitumen. The dataset includes both categorical variables and essential numerical values. An initial data quality check, which is reported in the dictionary, indicated different levels of completeness. While most of the parameters are well-populated. This understanding is vital for maintaining the dependability of subsequent analysis and model construction.
3. Results and Discussion
The combined data shows that experimental parameters are highly variable. Plastic incorporation rates were primarily between 0.5% and 12%, with a subset of research looking at concentrations as high as 36%. The mixing temperature was primarily kept between 160 and 180°C. The most evaluated plastic modifiers were polyethylene variations (LDPE, HDPE, LLDPE) and PET.
A continuous tendency across multiple tests is an increase in softening point and a decrease in penetration value with the addition of plastic waste, showing that the binder stiffens. For example, adding 8% LDPE improved the softening temperature from 43°C to 63°C [50]. Similarly, at 12% dose, R-LLDPE enhanced the softening point from 44.1°C to 122.3°C [7]. This stiffening effect is ideal for boosting asphalt rutting resistance in hot areas. Viscosity often rises with plastic content, improving binder cohesion but boosting mixing and compaction temperatures, which is an important concern in plant manufacturing.
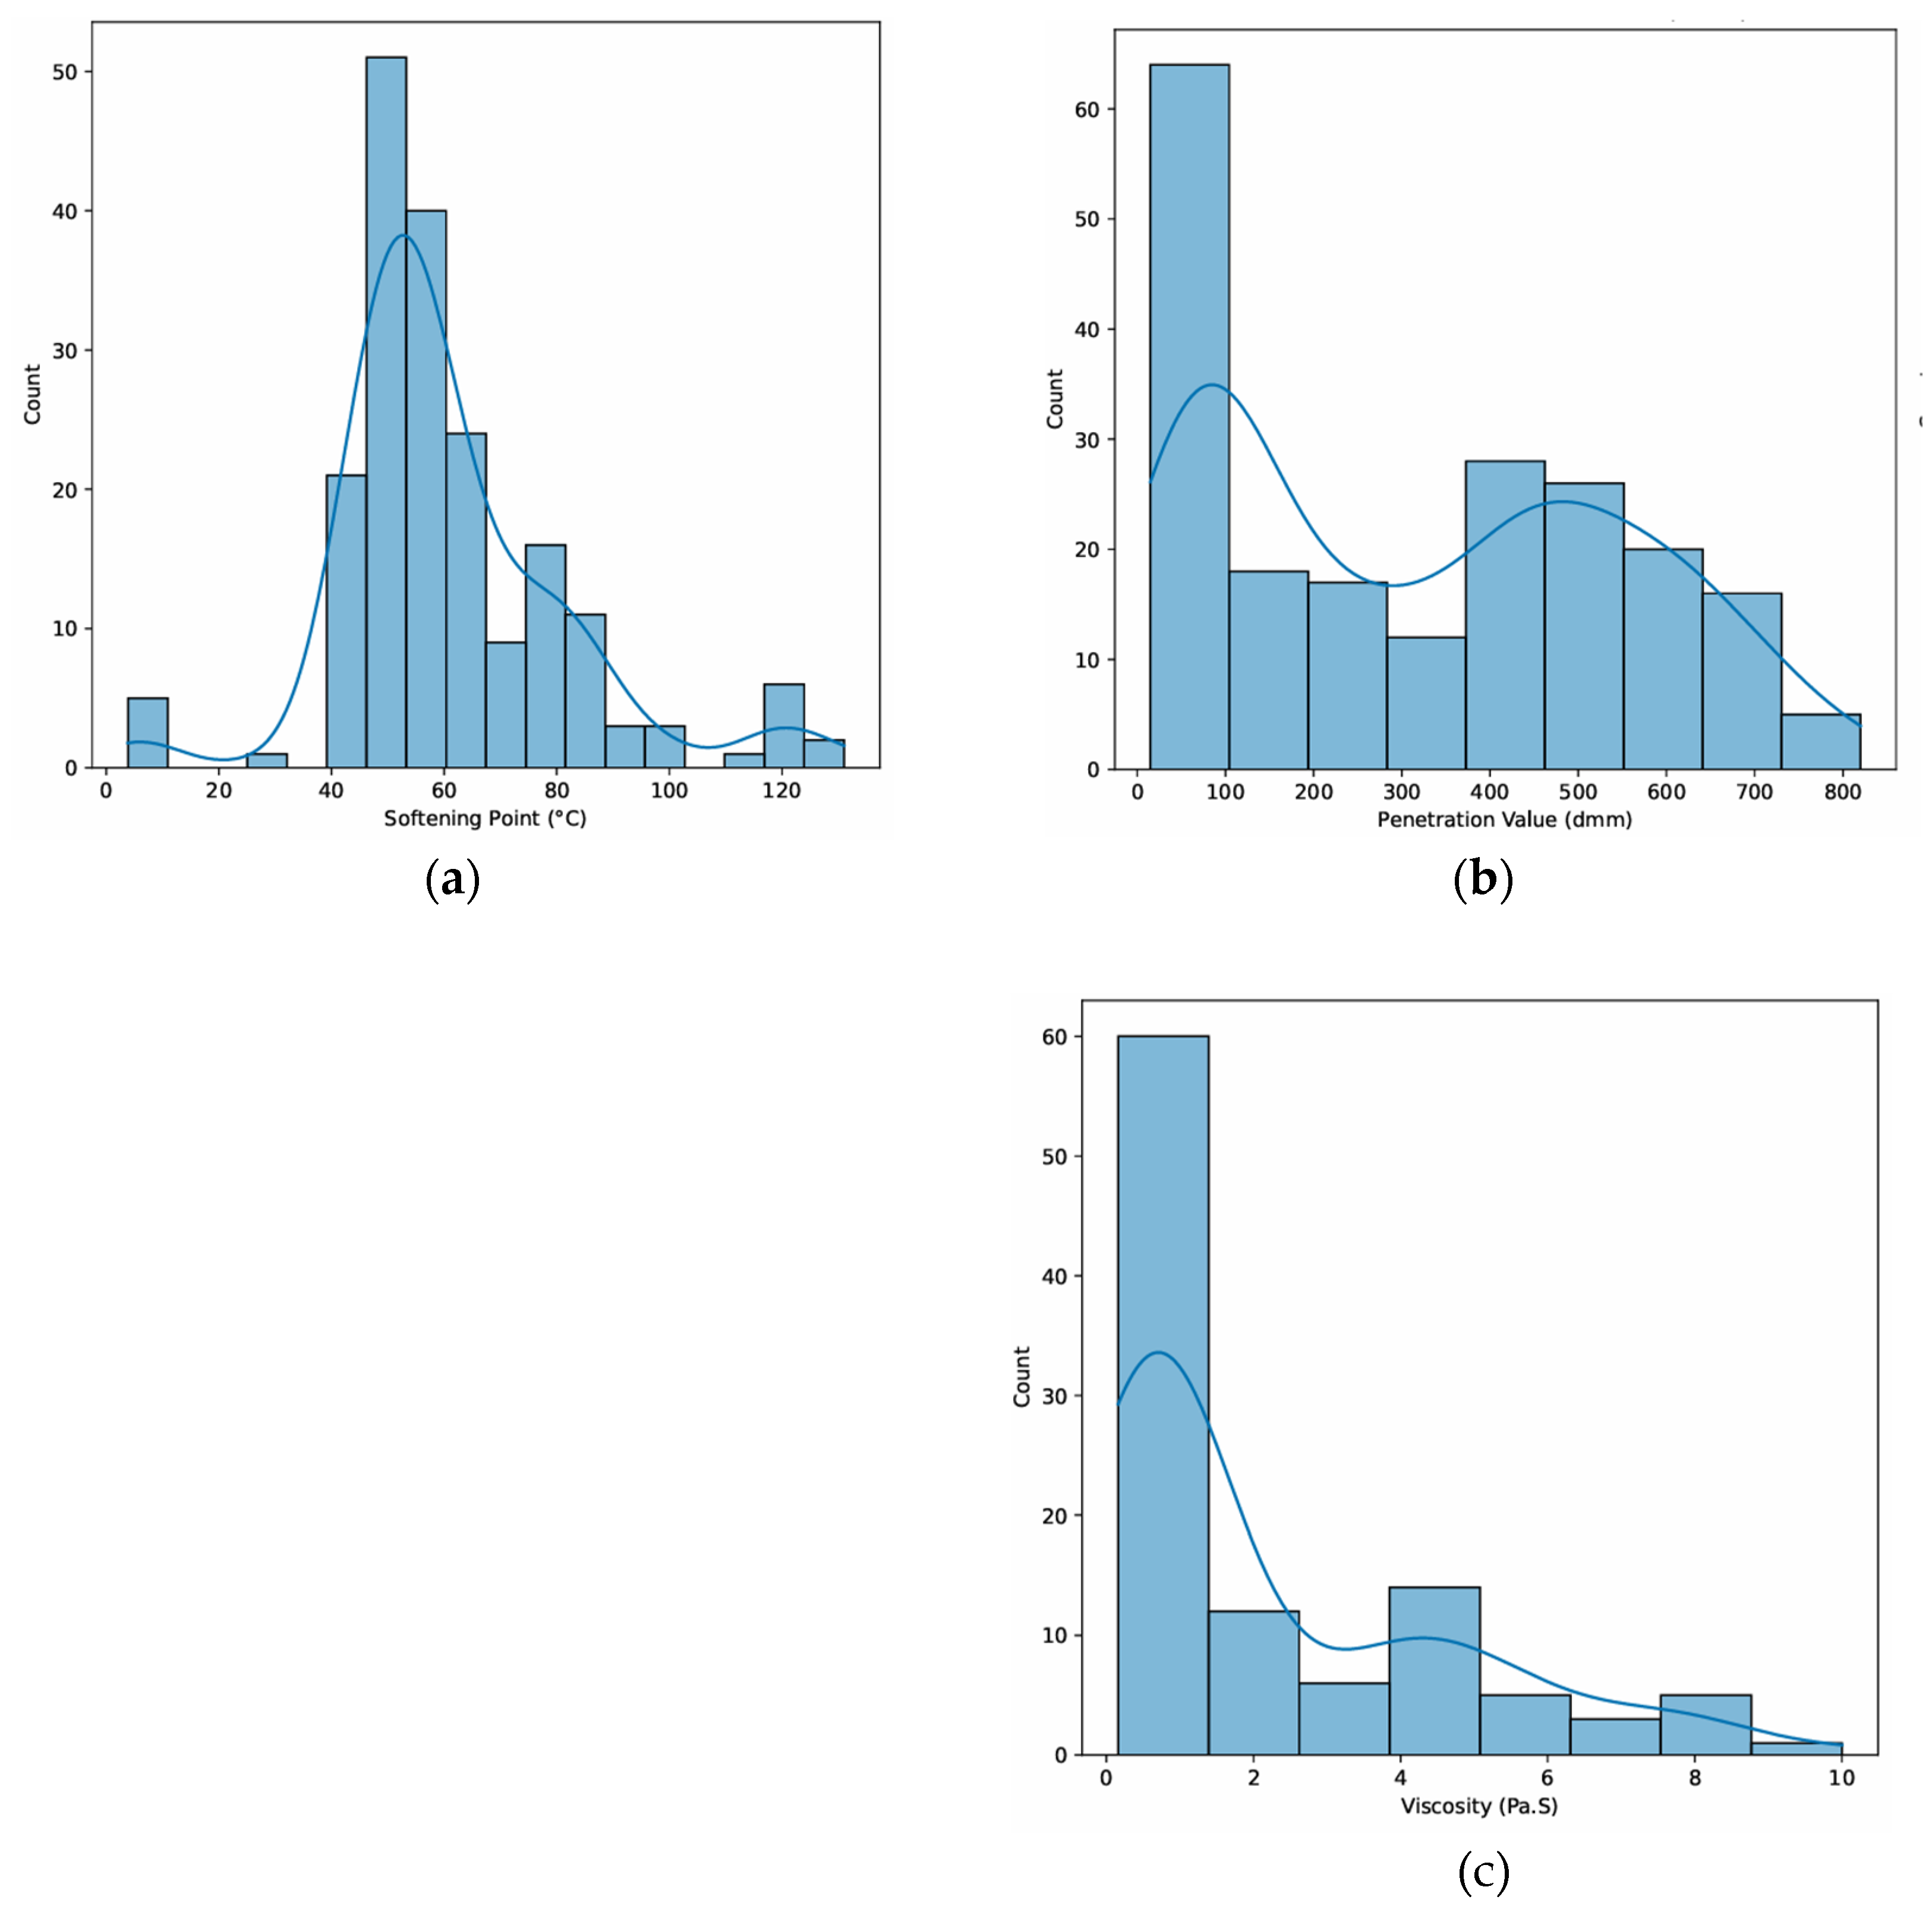
Figure 1.
The graph shows key target distribution variables. (a) Distribution of Softening point; (b) Distribution of Penetration values and (c) Distribution of viscosity.
Figure 1.
The graph shows key target distribution variables. (a) Distribution of Softening point; (b) Distribution of Penetration values and (c) Distribution of viscosity.
As shown in Table 3 above, tree-based models (Random Forest and XGBoost) outperformed linear and baseline models in terms of predicting Softening Point and Viscosity. XGBoost (R2 = 0.39, MAE = 11.1°C) and Random Forest (R2 = -0.87, MAE = 1.76 Pa.S) were the most effective models for Softening Point and Viscosity, respectively. Some models have negative R2 values for Penetration and Viscosity, indicating poor performance compared to a baseline model. This highlights the complexity and noise in the data for these targets. The good Softening Point prediction performance shows a more consistent link between inputs and outputs.
Figure 2 compares model performance using MAE, RMSE, and R2, revealing significant variances between tested methodologies. The tree-based model outperforms the baseline and linear models in capturing complicated relationships in the dataset, with lower MAE and RMSE values and a higher R2. This suggests that nonlinear models are more suited to predicting binder behavior when numerous interacting variables are involved.
In a Figure 3(a), the graph successfully explained about 79% of the variation in Softening Point, as seen by the predicted versus real plot (R2 = 0.791). The mean absolute error (MAE) of 0.834 means that the average difference between projected and actual values is less than one unit, indicating high predictive accuracy. Most of the points are closely aligned with the red 1:1 line, suggesting that the model can accurately capture the trend between actual and anticipated values. However, at higher Softening Point values, there is visible scattering, indicating that the model underestimates actual performance. This shows that, while the model is generally useful, it may have limitations when dealing with extreme values, or that additional contributing elements, such as polymer type, dosage, or dispersion quality, are not adequately accounted for in the existing features.
The Penetration test as shown in Figure 3(b) has moderate accuracy, with a R2 value of 0.614, as seen in the anticipated versus actual plot. This shows that the model can explain around 61% of the variation in penetration values. The mean absolute error (MAE) of 7.511 is a larger average difference between anticipated and actual values than the softening point model, implying that penetration is more difficult to predict effectively. While many points match the 1:1 line, the scatter pattern indicates significant variance, particularly at lower and higher penetration rates. This dispersion suggests that additional parameters, such as plastic waste type, particle size, and mixing homogeneity, may have a significant impact on penetration.
Furthermore, in Figure 3(c), the model effectively gives about 79% of the variability in viscosity, as shown in the predicted versus real graphic (R2 = 0.791). The mean absolute error (MAE) of 0.834 demonstrates that the average forecast error is quite tiny, indicating great accuracy. The scatter points are closely aligned with the 1:1 line, particularly for lower and mid-range viscosity values, indicating that the model accurately predicts these ranges. Some variance can be seen at higher actual viscosity levels, when the model tends to slightly underestimate performance, but the overall trend good.
Similar findings were discovered in plastic-waste modification research, Such as by adding waste polyethylene reliably boosts the softening point, increases viscosity, and decreases the penetration [51]. Experiments demonstrate that as plastic content increases, viscosity increases, and penetration decreases, often with nonlinear behaviour that complicates straightforward modelling [52]. PET-modified bitumen performs similarly, increasing hardness and improving high-temperature responsiveness at the expense of ductility, which adds scatter to Softening Point or Penetration modelling [53]. Furthermore, ML-based studies on polymers or modified binders underscore the importance of nonlinear approaches in capturing complicated interactions, explaining why viscosity (which is more directly related to polymer content) is more predictable than penetration or softening point [54]. Finally, morphological investigations of polymer dispersion show that microstructure and compatibility play a role in variability, particularly in softening point and penetration predictions [55].
Figure 4.
Showing the Correlation Matrix of Numerical variables.
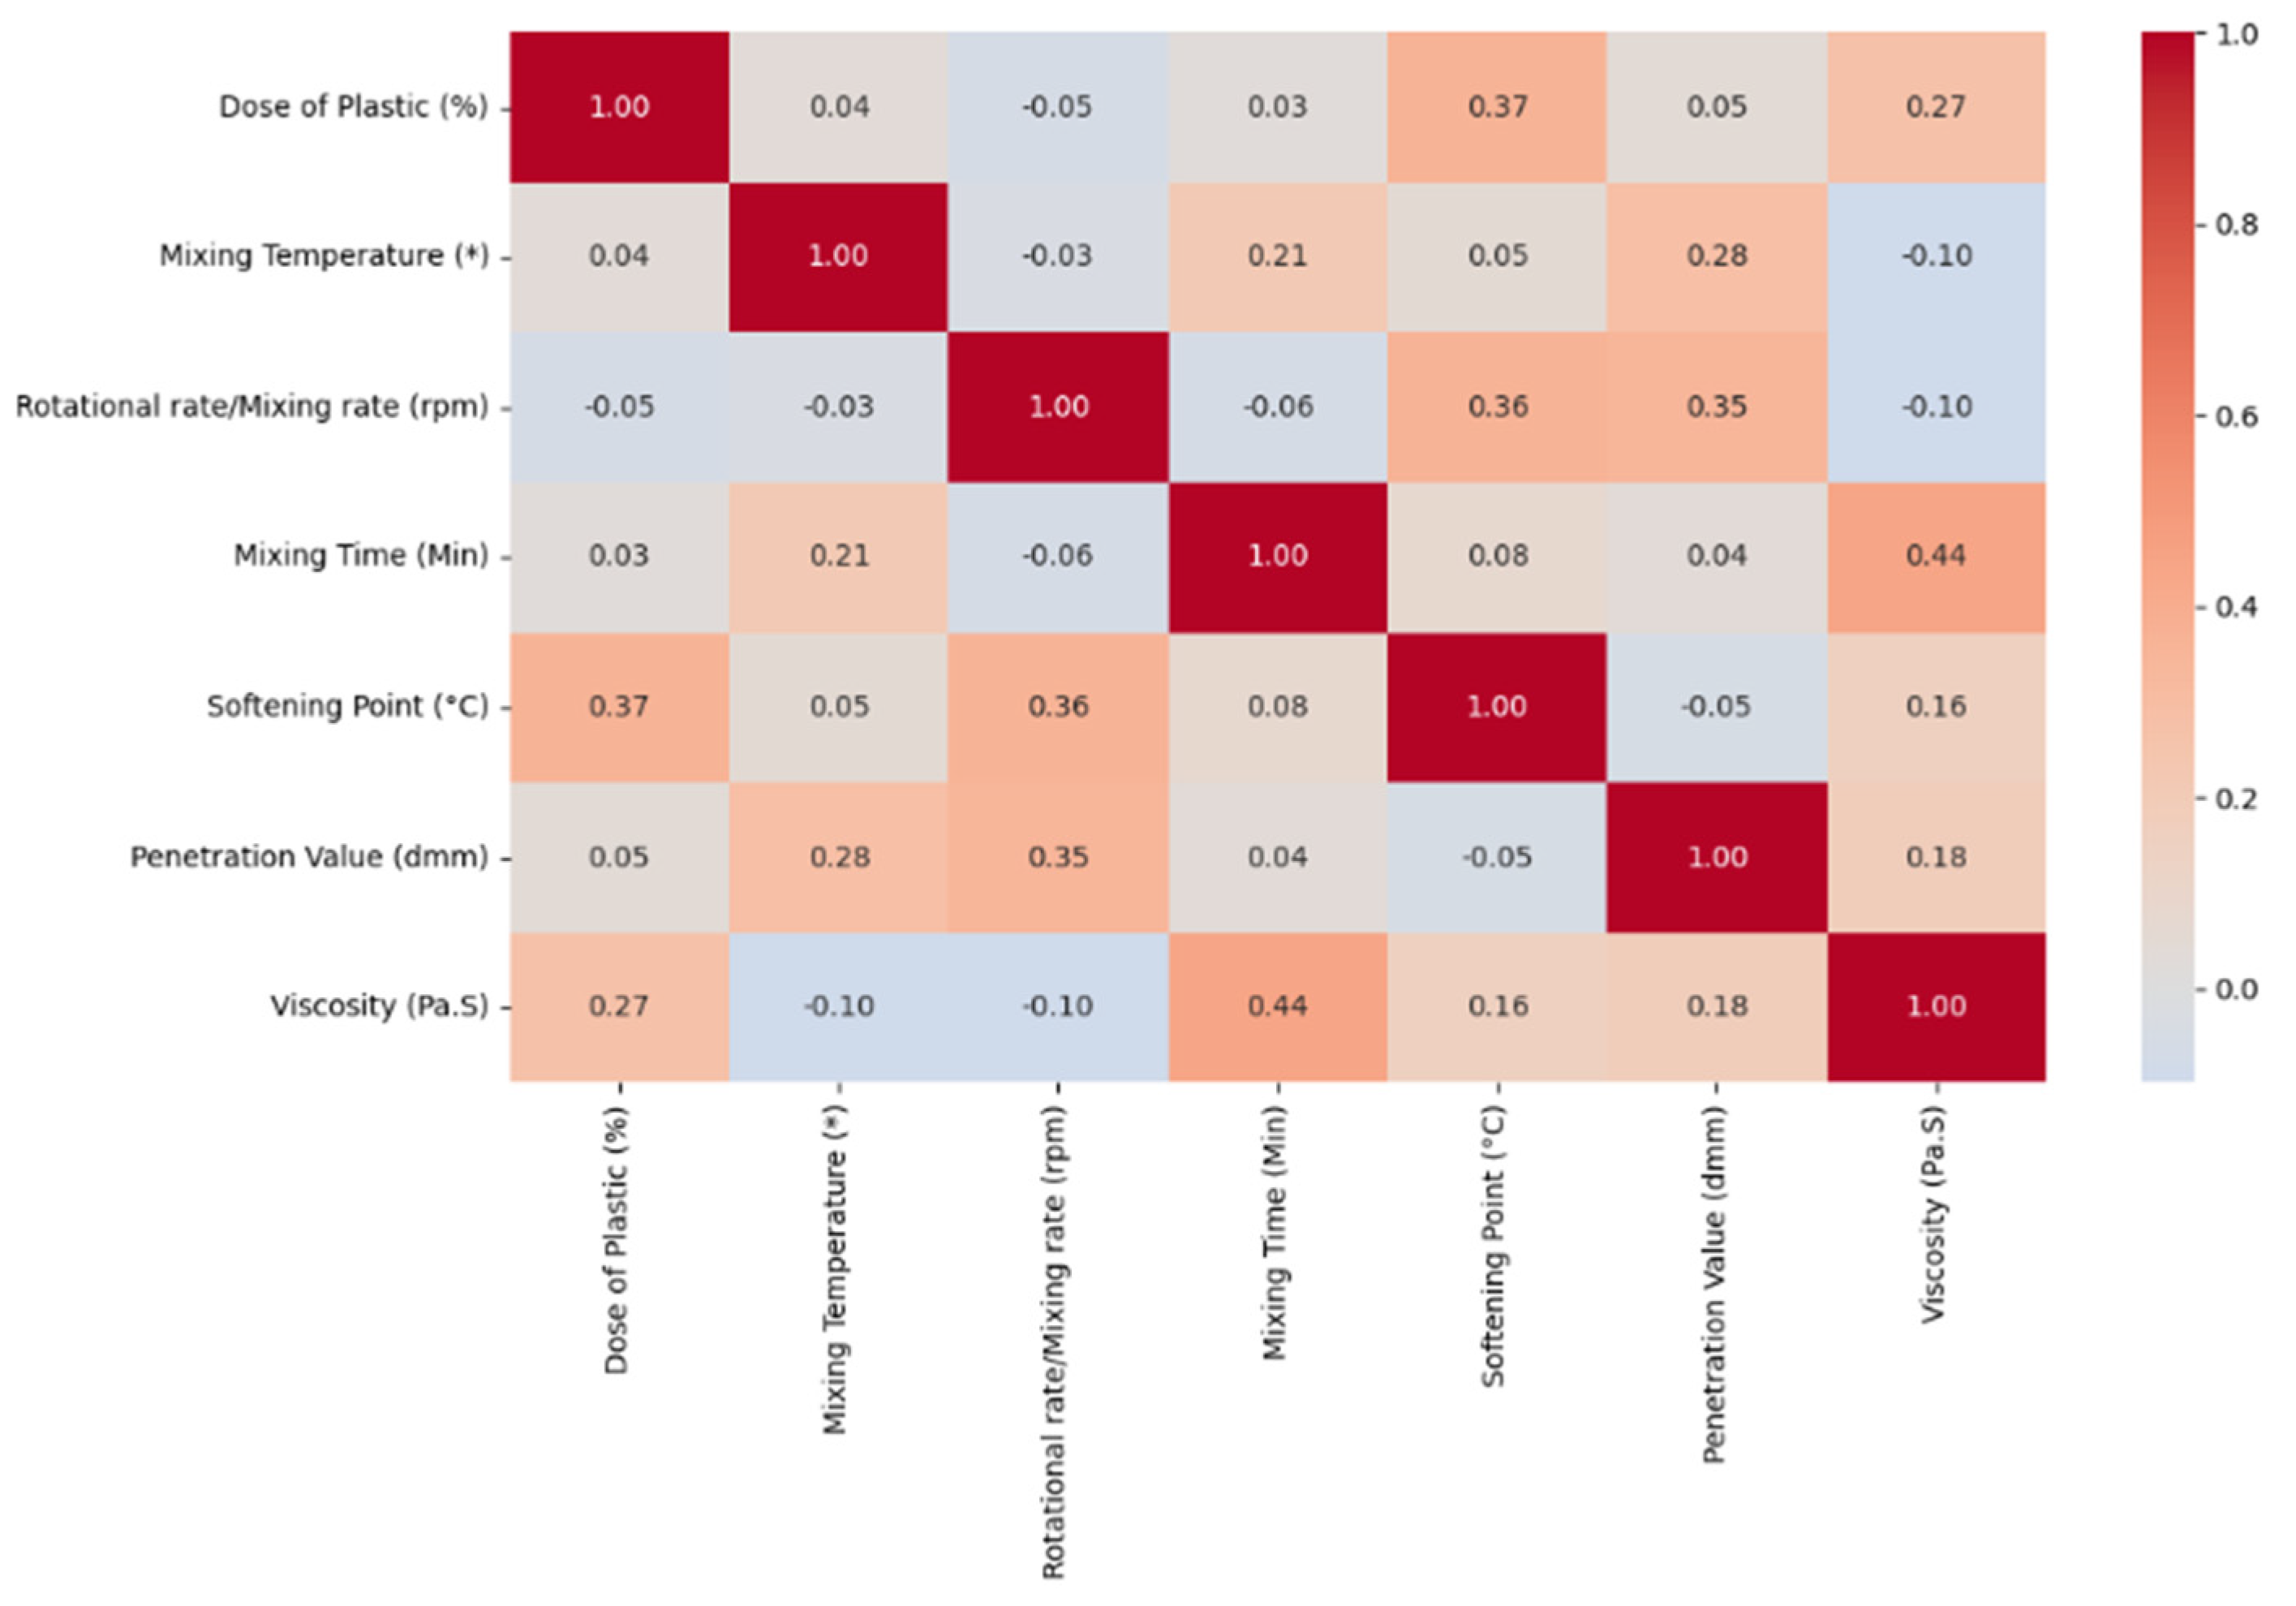
A correlation matrix above containing numerical variables was examined. Plastic dose correlated with softening point (≈0.37), viscosity (≈0.27), and penetration value (≈-0.28), indicating a stiffening effect. Temperature and time of mixing revealed very modest relationships with final attributes, implying that within the generally reported ranges, plastic type and volume are more relevant factors.
4. Discussion
- Incorporating plastic waste results in a higher softening point, decreased penetration, and increased viscosity, confirming the stiffening effect that improves rut resistance.
- The Softening Point model has high prediction accuracy (R2 = 0.79) but underestimated at extreme values.
- The Penetration model (R2 = 0.61) had small scale accuracy due to its susceptibility to parameters such as plastic type, particle size, and mixing consistency.
- The Viscosity model (R2 = 0.79) made accurate predictions, notably in the low to mid ranges, demonstrating a greater correlation with observable process parameters.
- Tree-based ML algorithms (Random Forest, XGBoost) outperformed linear models, demonstrating the usefulness of nonlinear techniques in predicting binder characteristics.
- Previous research has shown that PE, PET, and other plastic wastes improve high-temperature stability while decreasing ductility.
For further studies, the researcher should use larger datasets and dosage ranges. Microstructural and compatibility studies with microscopy and spectroscopy could give clear result on how dispersion and bonding affect attributes like penetration and softening point. The environmental and economic viability of large-scale adoption should be evaluated using life cycle assessment (LCA) and cost-benefit analysis.
5. Conclusions
In this report the efficiency of machine learning (ML) techniques for predicting the engineering features of plastic-modified bitumen was explored. Using a dataset of 251 experimental records from the literature, three regression tasks were built to model binders’ softening point, penetration, and viscosity. To increase model dependability, data from the same research were excluded using grouped K-fold cross-validation. MAE, RMSE, and R2 were used to evaluate model performance. Predicted vs. real plots were also reviewed for interpretation. The following is a summary of the conclusions:
- Four models were evaluated: median baseline, linear regression, random forest, and xgboost. Tree-based models (Random Forest and XGBoost) outperformed other models in predicting softening point and viscosity, with R2 values of 0.79 and 0.61, respectively, demonstrating their ability to capture nonlinear interactions.
- Softening Point predictions were highly accurate (R2 = 0.79, MAE = 0.83), with consistent alignment between anticipated and actual values, but underestimate occurred at greater ranges.
- The penetration predictions demonstrated modest accuracy (R2 = 0.61, MAE = 7.51), showing more sensitivity to uncontrolled parameters such as plastic type, particle size, and mixing homogeneity.
- Viscosity predictions were extremely trustworthy (R2 = 0.79, MAE = 0.83), notably in the low to mid ranges, showing viscosity as a feature closely related to quantifiable processing factors.
- The results are consistent with existing research that show that plastic modification regularly increases softening point and viscosity while decreasing penetration, stiffening the binder and enhancing rutting resistance at high service temperatures.
- The findings demonstrate that nonlinear machine learning techniques outperform baseline or linear models in predicting binder performance, encouraging its usage in sustainable pavement design research.
References
- R. Geyer, J. R. Jambeck, and K. L. Law, “Production, use, and fate of all plastics ever made,” Science Advances, vol. 3, no. 7, p. e1700782, 2017, doi: doi:10.1126/sciadv.1700782.
- G. White, “RECYCLED WASTE PLASTIC FOR EXTENDING AND MODIFYING ASPHALT BINDERS “ 2018. [Online]. Available: https://www.researchgate.net/profile/Greg-White/publication/324908837_RECYCLED_WASTE_PLASTIC_FOR_EXTENDING_AND_MODIFYING_ASPHALT_BINDERS/links/5aea9deda6fdcc03cd90c94c/RECYCLED-WASTE-PLASTIC-FOR-EXTENDING-AND-MODIFYING-ASPHALT-BINDERS.pdf.
- A. O. Sojobi, S. E. Nwobodo, and O. J. Aladegboye, “Recycling of polyethylene terephthalate (PET) plastic bottle wastes in bituminous asphaltic concrete,” Cogent Engineering, vol. 3, no. 1, p. 1133480, 2016/12/31 2016. [CrossRef]
- S. Huda and H. Anzar, “Plastic Roads: A Recent Advancement in Waste Management,” vol. 5, 2016. [Online]. Available: https://www.ijert.org/research/plastic-roads-a-recent-advancement-in-waste-management-IJERTV5IS090574.pdf.
- k. Edukondalu et al., “Use of Waste Plastic Materials in Flexible Pavements,” International Journal of Innovative Research in Computer Science and Technology, vol. 10, no. 5, 2022. [CrossRef]
- A.Gulzat, Y. Madeniyet, Y. Dana, I. Aiganym, and M. Sofya, “The use of polyethylene terephthalate waste as modifiers for bitumen systems,” Eastern-European Journal of Enterprise Technologies, vol. 3, no. 6(117), pp. 6-13, 2022. [CrossRef]
- S. Nizamuddin, M. Jamal, R. Gravina, and F. Giustozzi, “Recycled plastic as bitumen modifier: The role of recycled linear low-density polyethylene in the modification of physical, chemical and rheological properties of bitumen,” Journal of Cleaner Production, vol. 266, p. 121988, 2020/09/01/ 2020. [CrossRef]
- V. Ayush, “Utilization of Recycled Plastic Waste in Road Construction,” vol. 10, 2021. [Online]. Available: https://www.ijert.org/research/utilization-of-recycled-plastic-waste-in-road-construction-IJERTV10IS050289.pdf.
- Y. Imanbayev et al., “Modification of Bitumen with Recycled PET Plastics from Waste Materials,” Polymers, vol. 14, no. 21. [CrossRef]
- B. Saleh and R. Ms, “Study on Effect of Plastic Waste on Softer Grade (Vg-10) Bitumen,” pp. 2350-0557, 2023. [CrossRef]
- S. Tri, A. Chusnul, E. Shaopeng, and S. Fardzanela, “Rutting Resistance of Agricultural-Waste-Plastic Based Modified Bitumen,” Civil Engineering and Architecture, vol. 13, no. 3, 2025. [CrossRef]
- N. Mashaan, A. Chegenizadeh, and H. Nikraz, “Laboratory Properties of Waste PET Plastic-Modified Asphalt Mixes,” Recycling, vol. 6, p. 49, 07/14 2021. [CrossRef]
- M. Li, Y. Fang, L. Liu, and Q. Zhu, “Multi-Damage Healing Ability of Modified Bitumen with Waste Plastics Based on Rheological Property,” Materials, vol. 18, no. 16. [CrossRef]
- I. Elnaml et al., “Recycling waste plastics in asphalt mixture: Engineering performance and environmental assessment,” Journal of Cleaner Production, vol. 453, p. 142180, 2024/05/10/ 2024. [CrossRef]
- S. Köfteci, P. Ahmedzade, and B. Kultayev, “Performance evaluation of bitumen modified by various types of waste plastics,” Construction and Building Materials, vol. 73, pp. 592-602, 2014/12/30/ 2014. [CrossRef]
- k. Edukondal et al., “Use of Waste Plastic Materials in Flexible Pavements,” International Journal of Innovative Research in Computer Science & Technology, vol. 10, no. 5, 2022. [CrossRef]
- H. Isaac, “Recycling Waste Plastics in Asphalt Pavements,” 2023. [Online]. Available: https://onlinepubs.trb.org/onlinepubs/circulars/ec291.pdf.
- X. Dai, Lu, E. Marie, M. Hassan, and G. Filippo, “ Performance Evaluation of Post-Consumer and Post-Industrial Recycled Plastics as Binder Modifier in Asphalt Mixes,” International Journal of Pavement Research and Technology, 2023. [CrossRef]
- N. Mashaan, A. Chegenizadeh, and H. Nikraz, “A Comparison on Physical and Rheological Properties of Three Different Waste Plastic-Modified Bitumen,” Recycling, vol. 7, no. 2. [CrossRef]
- M. Abdelaziz and K. Mohamed, “RHEOLOGICAL EVALUATION OF BITUMINOUS BINDER MODIFIED WITH WASTE PLASTIC MATERIAL,” 2010. [Online]. Available: https://eprints.um.edu.my/3186/1/MAHREZ_Abdelaziz.pdf.
- T. Hu, Y. Luo, Y. Zhu, Y. Chu, G. Hu, and X. Xu, “Mechanochemical preparation and performance evaluations of bitumen-used waste polypropylene modifiers,” Case Studies in Construction Materials, vol. 21, p. e03471, 2024/12/01/ 2024. [CrossRef]
- U. Ghani, B. Zamin, M. Tariq Bashir, M. Ahmad, M. M. Sabri, and S. Keawsawasvong, “Comprehensive Study on the Performance of Waste HDPE and LDPE Modified Asphalt Binders for Construction of Asphalt Pavements Application,” Polymers, vol. 14, no. 17. [CrossRef]
- N. Van Hung, L. Van Phuc, and N. Thanh Phong, “Performance Evaluation of Waste High Density Polyethylene as a Binder Modifier for Hot Mix Asphalt,” International Journal of Pavement Research and Technology, 2023. [CrossRef]
- M. Moses, K. Reneta, N. Nsahlai, N. Jules, B. Kingsly, and C. Adriel, “Physico-Mechanical Characterization Of Polyethylene Terephthalate (PET)-Modified Ashalt For Enchanced Flexible Pavements,” IOSR Journal of Mechanical and Civil Engineering (IOSR-JMCE, vol. 22, 2025. [CrossRef]
- M. R. Kakar, P. Mikhailenko, Z. Piao, M. Bueno, and L. Poulikakos, “Analysis of waste polyethylene (PE) and its by-products in asphalt binder,” Construction and Building Materials, vol. 280, p. 122492, 2021/04/19/ 2021. [CrossRef]
- H. Li et al., “Analysis of the Influence of Production Method, Plastic Content on the Basic Performance of Waste Plastic Modified Asphalt,” Polymers, vol. 14, no. 20. [CrossRef]
- M. S. Ahmad and S. A. Ahmad, “The impact of polyethylene terephthalate waste on different bituminous designs,” Journal of Engineering and Applied Science, vol. 69, no. 1, p. 53, 2022/06/22 2022. [CrossRef]
- H. H. Joni, R. H. A. Al-Rubaee, and M. A. Al-zerkani, “Characteristics of asphalt binder modified with waste vegetable oil and waste plastics,” IOP Conference Series: Materials Science and Engineering, vol. 737, no. 1, p. 012126, 2020/02/01 2020. [CrossRef]
- G. White and F. Hall, “Comparing asphalt modified with recycled plastic polymers to conventional polymer modified asphalt,” 2021, pp. 3-17.
- I. Elnaml, J. Liu, L. N. Mohammad, N. Wasiuddin, S. B. Cooper, and S. B. Cooper, “Developing Sustainable Asphalt Mixtures Using High-Density Polyethylene Plastic Waste Material,” Sustainability, vol. 15, no. 13. [CrossRef]
- M. Gürü, M. K. Çubuk, D. Arslan, S. A. Farzanian, and İ. Bilici, “An approach to the usage of polyethylene terephthalate (PET) waste as roadway pavement material,” Journal of Hazardous Materials, vol. 279, pp. 302-310, 2014/08/30/ 2014. [CrossRef]
- S. Nizamuddin, Y. J. Boom, and F. Giustozzi, “Sustainable Polymers from Recycled Waste Plastics and Their Virgin Counterparts as Bitumen Modifiers: A Comprehensive Review,” Polymers, vol. 13, no. 19. [CrossRef]
- A. Jexembayeva, M. Konkanov, L. Aruova, A. Kirgizbayev, and L. Zhaksylykova, “Modifying Bitumen with Recycled PET Plastics to Enhance Its Water Resistance and Strength Characteristics,” Polymers, vol. 16, no. 23. [CrossRef]
- S. Haider, I. Hafeez, Jamal, and R. Ullah, “Sustainable use of waste plastic modifiers to strengthen the adhesion properties of asphalt mixtures,” Construction and Building Materials, vol. 235, p. 117496, 2020/02/28/ 2020. [CrossRef]
- H. Umar, R. Abdur, K. Ammad Hassan, and R. Zia Ur, “USE OF PLASTIC WASTES AND RECLAIMED ASPHALT FOR SUSTAINABLE DEVELOPMENT,” THE BALTIC JOURNAL OF ROAD AND BRIDGE ENGINEERING, vol. 15, no. 2, 2020. [Online]. Available: https://bjrbe-journals.rtu.lv/bjrbe/article/download/bjrbe.2020-15.479/503.
- R.Manju, S. Sathya, and K. Sheema, “Use of Plastic Waste in Bituminous Pavement “ International Journal of ChemTech Research vol. 10, 2017. [Online]. Available: https://www.researchgate.net/profile/Rmanju-Anand/publication/320243162_Use_of_Plastic_Waste_in_Bituminous_Pavement/links/59d70660458515db19c5d8a3/Use-of-Plastic-Waste-in-Bituminous-Pavement.pdf.
- J. K. Appiah, V. N. Berko-Boateng, and T. A. Tagbor, “Use of waste plastic materials for road construction in Ghana,” Case Studies in Construction Materials, vol. 6, pp. 1-7, 2017/06/01/ 2017. [CrossRef]
- B. Ambika, S. Girish, and K. Gajendra, “A sustainable approach: Utilization of waste PVC in asphalting of roads “ Construction and Building Materials, vol. 54, 2014. [CrossRef]
- K. Imran M, K. Shahid, A. Majed A, and A. Feras F, “Asphalt Design Using Recycled Plastic and Crumb-rubber Waste for Sustainable Pavement Construction,” Procedia Engineering, vol. 145, 2016. [CrossRef]
- A.-M. Jaffar and M. Sahar, “Preparation of sustainable asphalt pavements using polyethylene terephthalate waste as a modifier,” Zastita materijala, vol. 58, no. 3, 2017. [CrossRef]
- A. Malik Shoeb and M. Fareed, “Characterization of Bitumen Mixed With Plastic Waste,” International Journal of Transportation Engineering, vol. 3, 2016. [Online]. Available: https://www.sid.ir/en/VEWSSID/J_pdf/5060520150201.pdf.
- S. Needhidasan, R. B., and G. A. S., “Experimental investigation of bituminous pavement (VG30) using E-waste plastics for better strength and sustainable environment,” Materials Today: Proceedings, vol. 22, 2020. [CrossRef]
- W. Abhaykumar and W. Mudassir, “Use of Waste Plastic and Waste Rubber in Aggregate and Bitumen for Road Materials,” International Journal of Emerging Technology and Advanced Engineering Website: www.ijetae.com, vol. 9001, no. 7, 2008. [Online]. Available: https://xilirprojects.com/wp-content/uploads/2023/01/1.-Use-of-Waste-Plastic-and-Waste-Rubber-in-Aggregate-and.pdf.
- X. Xu et al., “Sustainable Practice in Pavement Engineering through Value-Added Collective Recycling of Waste Plastic and Waste Tyre Rubber,” Engineering, vol. 7, no. 6, pp. 857-867, 2021/06/01/ 2021. [CrossRef]
- N. Agha, A. Hussain, A. S. Ali, and Y. Qiu, “Performance Evaluation of Hot Mix Asphalt (HMA) Containing Polyethylene Terephthalate (PET) Using Wet and Dry Mixing Techniques,” Polymers, vol. 15, no. 5. [CrossRef]
- J. Waples, “Mean Absolute Error Explained: Measuring Model Accuracy,” 2025. [Online]. Available: https://www.datacamp.com/tutorial/mean-absolute-error.
- P. Schneider, “Mean Absolute Error - an overview | ScienceDirect Topics,” 2022. [Online]. Available: https://www.sciencedirect.com/topics/engineering/mean-absolute-error.
- ScienceDirect, “Root Mean Square Error - an overview | ScienceDirect Topics,” 2022. [Online]. Available: https://www.sciencedirect.com/topics/engineering/root-mean-square-error.
- G. Romeo, “Determination Coefficient - an Overview | ScienceDirect Topics,” 2020. [Online]. Available: https://www.sciencedirect.com/topics/mathematics/determination-coefficient.
- S. Huda and H. Anzar, “Plastic Roads: A Recent Advancement in Waste Management,” International Journal of Engineering Research & Technology (IJERT), vol. 5, no. 09, 2016. [Online]. Available: https://www.ijert.org/research/plastic-roads-a-recent-advancement-in-waste-management-IJERTV5IS090574.pdf.
- A. A. Amani, A.-M. Abeer, B. Gabriel, A. Sameh, S. B. A. Ahmed, and A. Ali, “Utilizing waste polyethylene for improved properties of asphalt binders and mixtures: A review,” Advances in Science and Technology Research Journal, 2024. [CrossRef]
- W. Zeiada, G. Al-Khateeb, E. Y. Hajj, and H. Ezzat, “Rheological properties of plastic-modified asphalt binders using diverse plastic wastes for enhanced pavement performance in the UAE,” Construction and Building Materials, vol. 452, p. 138922, 2024/11/22/ 2024. [CrossRef]
- G. Chen, J. Ma, X. Xu, T. Pu, Y. He, and Q. Zhang, “Performance Evaluation of Using Waste Polyethylene Terephthalate (PET) Derived Additives for Asphalt Binder Modification,” Waste and Biomass Valorization, vol. 16, no. 2, pp. 601-611, 2025/02/01 2025. [CrossRef]
- A. Sadat Hosseini, P. Hajikarimi, M. Gandomi, F. Moghadas Nejad, and A. H. Gandomi, “Optimized machine learning approaches for the prediction of viscoelastic behavior of modified asphalt binders,” Construction and Building Materials, vol. 299, p. 124264, 2021/09/13/ 2021. [CrossRef]
- N. Gopakumar and K. P. Biligiri, “Morphological and Rheological Assessment of Waste Plastic-Modified Asphalt-Rubber Binder,” in Proceedings of the 10th International Conference on Maintenance and Rehabilitation of Pavements, Cham, P. Pereira and J. Pais, Eds., 2024// 2024: Springer Nature Switzerland, pp. 405-415.
Figure 2.
Figure showing the Model Comparison as (a) Mean Absolute Error [MAE], (b) Root Mean Square Error [RMAE] and (c) R2 Score.
Figure 2.
Figure showing the Model Comparison as (a) Mean Absolute Error [MAE], (b) Root Mean Square Error [RMAE] and (c) R2 Score.
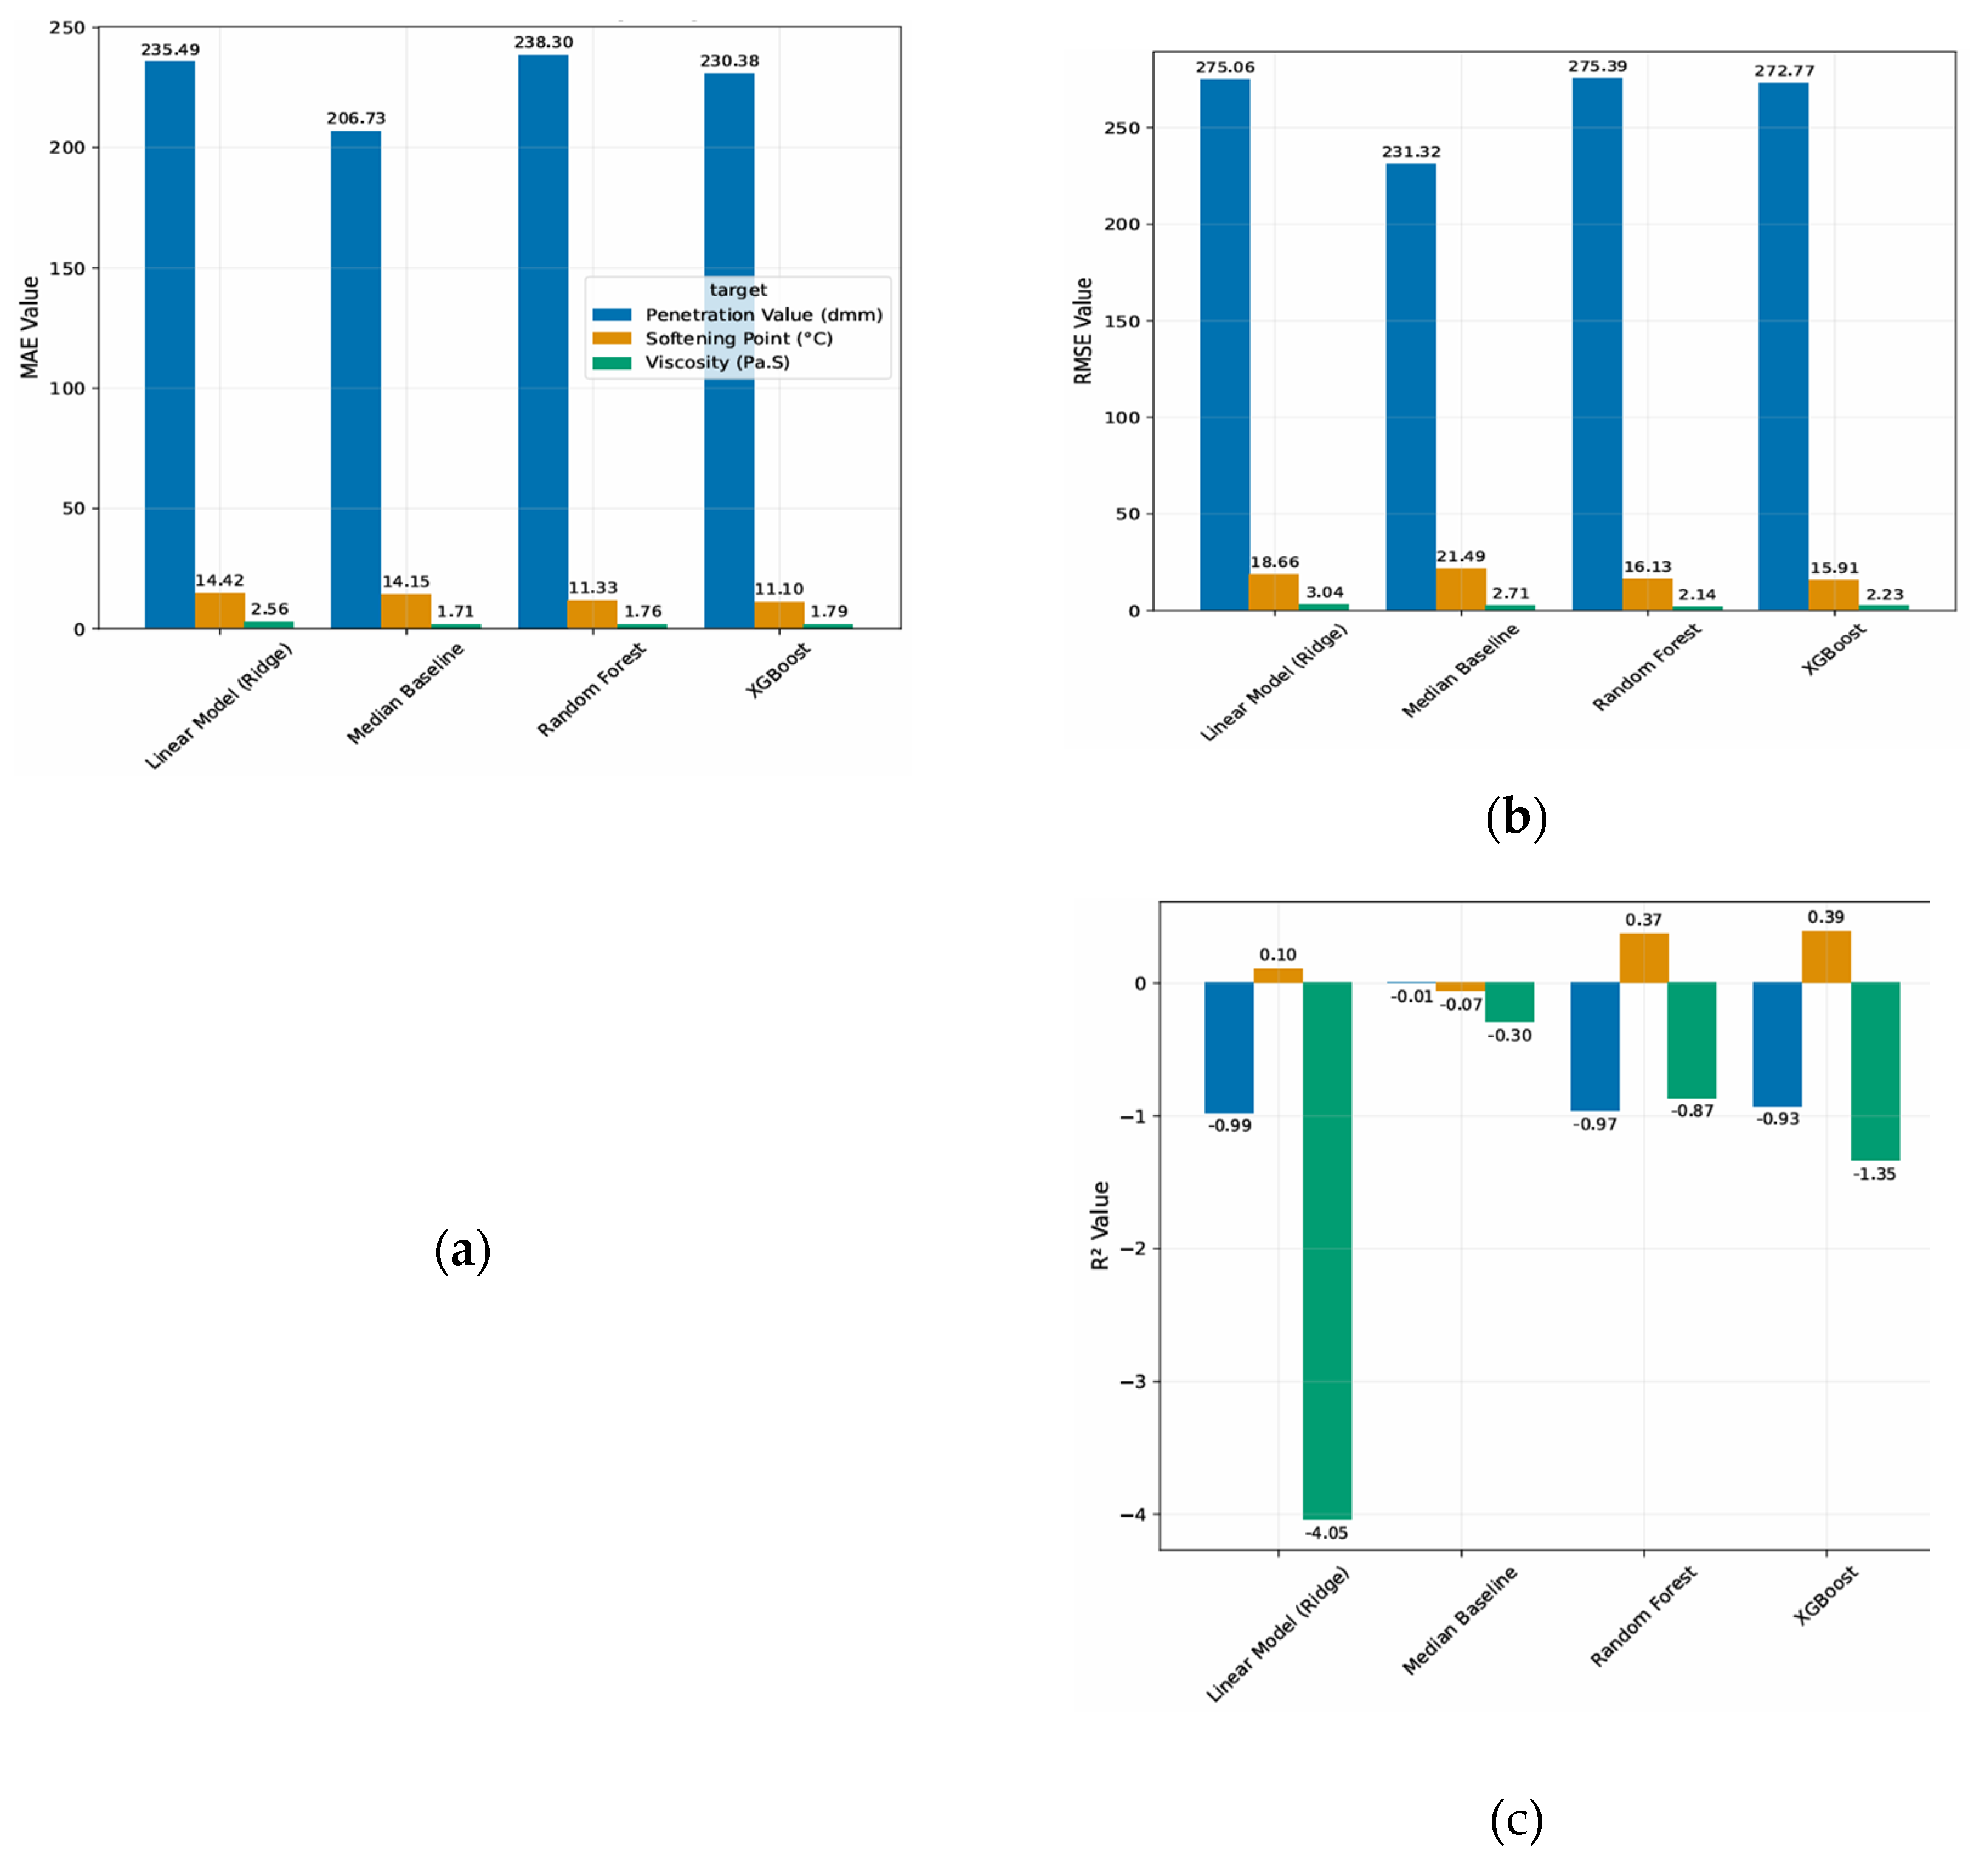
Figure 3.
Showing Predicted vs. Actual values for best-performing models: (a) Softening Point (°C) predicted by XGBoost (R2 = 0.61), (b) Penetration Value (dmm), and (c) Viscosity (Pa.S) predicted by Random Forest (R2 = 0.79).
Figure 3.
Showing Predicted vs. Actual values for best-performing models: (a) Softening Point (°C) predicted by XGBoost (R2 = 0.61), (b) Penetration Value (dmm), and (c) Viscosity (Pa.S) predicted by Random Forest (R2 = 0.79).
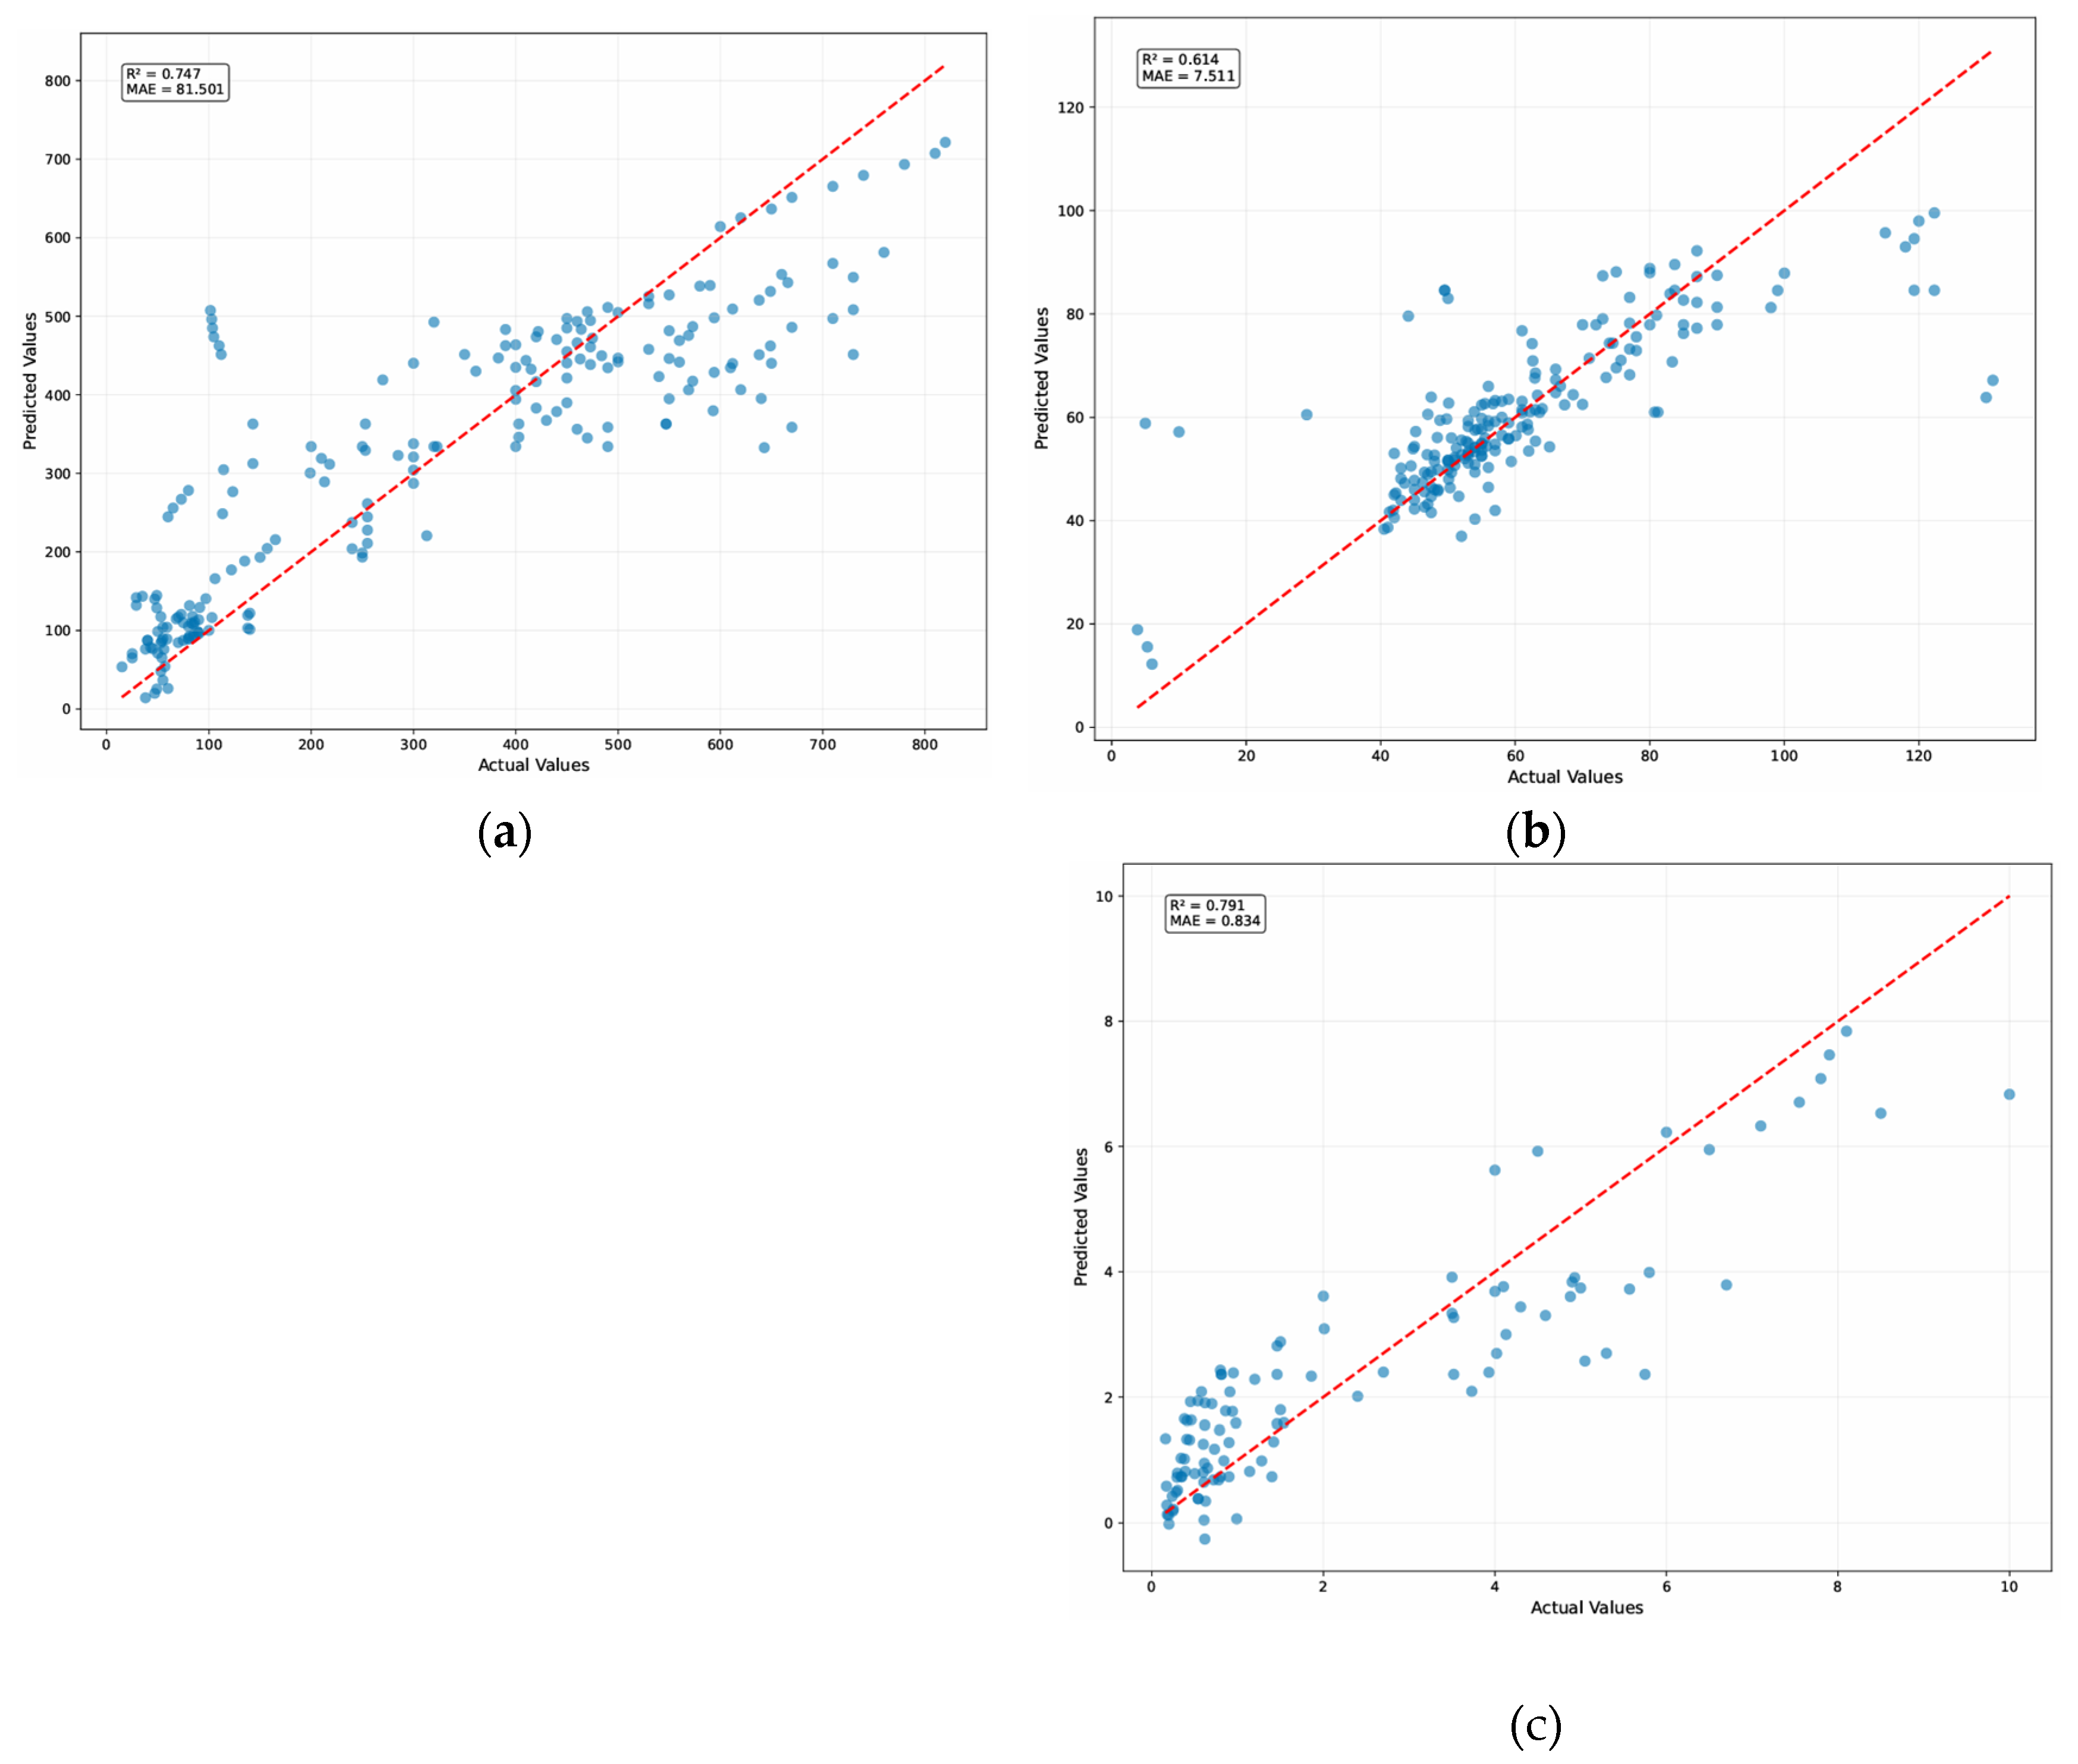
Table 1.
Data set and reference.
| Sl.no. | Data | Reference | ||
| Softening | Penetration | Viscosity | ||
| St_01 St_01 St_01 St_01 St_02 St_02 St_02 St_02 St_02 St_03 St_03 St_03 St_04 St_04 St_04 St_04 St_04 St_04 St_05 St_05 St_05 St_05 St_06 St_06 St_06 St_07 St_07 St_07 St_07 St_07 St_07 St_08 St_08 St_08 St_08 St_09 St_09 St_09 St_09 St_09 St_10 St_10 St_10 St_10 St_11 St_11 St_11 St_12 St_12 St_12 St_12 St_12 St_13 St_13 St_13 St_14 St_14 St_14 St_14 St_14 St_14 St_14 St_14 St_15 St_15 St_15 St_16 St_16 St_16 St_16 St_16 St_17 St_17 St_17 St_18 St_18 St_18 St_18 St_18 St_19 St_19 St_19 St_20 St_20 St_20 St_20 St_20 St_20 St_20 St_20 St_20 St_20 St_20 St_20 St_20 St_20 St_20 St_21 St_21 St_21 St_21 St_22 St_22 St_22 St_22 St_22 St_22 St_23 St_23 St_23 St_24 St_24 St_24 St_24 St_24 St_24 St_24 St_25 St_25 St_25 St_25 St_25 St_26 St_26 St_26 St_26 St_27 St_27 St_27 St_27 St_27 St_28 St_28 St_28 St_28 St_29 St_29 St_30 St_30 St_30 St_30 St_30 St_30 St_30 St_31 St_31 St_31 St_31 St_31 St_31 St_31 St_32 St_32 St_32 St_33 St_33 St_33 St_33 St_33 St_33 St_33 St_33 St_34 St_34 St_34 St_35 St_35 St_35 St_36 St_36 St_36 St_36 St_36 St_37 St_37 St_37 St_37 St_37 St_37 St_38 St_38 St_38 St_38 St_38 St_38 St_39 St_39 St_39 St_39 St_39 St_39 St_39 St_39 St_40 St_40 St_40 St_41 St_41 St_42 St_42 St_42 St_42 St_42 St_42 St_43 St_43 St_44 St_44 St_44 St_44 St_45 St_45 St_45 St_46 St_46 St_46 St_46 St_46 St_46 St_46 St_47 St_47 St_47 St_47 St_47 St_48 St_48 St_48 St_48 St_49 St_49 St_50 St_50 St_50 St_50 St_50 St_50 St_50 St_50 St_50 St_50 St_50 St_50 St_50 St_50 St_51 St_51 St_51 St_51 St_51 |
49.5 83.7 119.3 122.3 70 72 80 85 90 43 51 62 47.5 48.5 50 51.25 53 55 NA NA NA NA 80 75 90 43 48 57 61 63 66 NA NA NA NA NA NA NA NA NA NA NA NA NA 42 43 43.55 67.33 83.33 73 73 115 40.5 41.3 42 55 59 61 66 71 78 81 83 6 5.3 3.833 44.1 49.5 83.7 119.3 122.3 45 46.25 51 10 5 29 130 131 41.05 41.85 42.25 NA NA NA NA NA NA NA NA NA NA NA NA NA NA NA 46.9 48.4 48.8 50.1 NA 44.5 44.8 45.2 47 47.5 55.7 54.4 53.9 NA NA NA NA NA NA NA 52 54 57 56 55 50 80 118 120 62.2 68.6 73.5 75.7 74 56 59.4 60.1 61 66 90 65.1 61.9 63.6 63.3 62.9 62.6 62.5 45 46.5 48 50.5 53 55.5 56 52.5 52.7 61.8 NA NA NA NA NA NA NA NA 45 47.5 53 NA NA NA 51.6 50.3 50.1 50 49.8 63 61 59 63 57 58 75 78 85 98 99 100 77 77 77 77 87 87 87 87 47 47.5 48.5 80.7 81.2 50 55 54 54 55 59 55 58 NA NA NA NA 52 53 57 46.5 48 50.5 53 55.5 56 56.7 54 55 66.7 74.5 85 48.5 45 47.5 42 NA NA 54 56 57 58 61 64 70 54 50 55 53 54 53 59 45 46.5 47 51 52 |
547 403 253 143 490 400 320 250 200 550 450 400 820 810 780 740 710 670 NA NA NA NA 250 250 240 730 580 550 530 500 460 420 400 400 420 NA NA NA NA NA NA NA NA NA 97 91 84 29 59 56 53 47 165 157 150 760 710 660 590 530 490 450 390 463 490 540 593 547 403 253 143 81 73 83 NA NA NA NA NA 135 122 106 450 420 390 350 300 450 440 430 460 470 460 450 410 415 450 80 73 65 60 101.5 102.75 103.5 104.75 110 112 47 49 53 NA NA NA NA NA NA NA 730 650 610 620 640 55 40 25 15 323 285 218 199 213 422 400 383 361 NA NA 470 473 464 475 473 484 473 666 649 638 612 594 573 569 55 49 38 NA NA NA NA NA NA NA NA 55 53 43 NA NA NA 45 50 54 57 60 320 270 210 240 500 560 730 710 670 560 530 500 300 300 300 300 255 255 255 255 650 620 600 670 490 138 100 90 85 85 80 550 440 NA NA NA NA 49 35 29 649 638 612 594 573 569 550 643 114.33 123.33 113.33 313 70 59 68 54 NA NA 140 89 90 81 80 75 70 140 138 103 90 86 85 80 75 50 40 38 25 |
0.81 1.46 3.52 5.75 0.35 0.34 0.8 0.9 1.4 NA NA NA 6.5 7.1 7.55 7.8 7.9 8.1 NA NA NA NA NA NA NA NA NA NA NA NA NA NA NA NA NA NA NA NA NA NA 2.4 0.9 0.5 1.2 NA NA NA NA NA NA NA NA 0.245 0.282 0.298 NA NA NA NA NA NA NA NA NA NA NA 0.62 0.81 1.46 3.52 5.57 NA NA NA NA NA NA NA NA 0.25 0.3 0.39 NA NA NA NA NA NA NA NA NA NA NA NA NA NA NA 0.38 0.44 0.41 0.45 0.65 0.73 0.79 0.86 0.91 0.95 NA NA NA NA NA NA NA NA NA NA NA NA NA NA NA 0.8 1.5 3.5 6.7 0.54 0.78 1.28 1.42 1.54 NA NA NA NA 1.5 2.7 0.618 0.609 0.626 0.606 0.612 0.6 0.617 0.196 0.238 0.293 0.341 0.407 0.459 0.537 0.54 0.72 0.84 NA NA NA NA NA NA NA NA NA NA NA NA NA NA 0.2 0.18 0.175 0.17 0.16 0.7 0.578 0.38 0.6 0.98 0.94 NA NA NA NA NA NA NA NA NA NA NA NA NA NA NA NA NA NA NA 2 4 4.1 4.9 3.5 5.8 4.3 5 NA NA NA NA NA NA NA 3.73 3.93 4.02 4.13 4.59 4.88 4.93 0.99 1.14 1.46 1.86 2.01 NA NA NA NA 5.3 5.05 NA NA NA NA NA NA NA NA NA NA NA NA NA NA 4 4.5 6 8.5 10 |
[7] [7] [7] [7] [8] [8] [8] [8] [8] [9] [9] [9] [10] [10] [10] [10] [10] [10] St_05 St_05 St_05 St_05 [11] [11] [11] [4] [4] [4] [4] [4] [4] [12] [12] [12] [12] [13] [13] [13] [13] [13] [14] [14] [14] [14] [15] [15] [15] [16] [16] [16] [16] [16] [15] [15] [15] [17] [17] [17] [17] [17] [17] [17] [17] [15] [15] [15] [7] [7] [7] [7] [7] [15] [15] [15] [18] [18] [18] [18] [18] [15] [15] [15] [19] [19] [19] [19] [19] [19] [19] [19] [19] [19] [19] [19] [19] [19] [19] [20] [20] [20] [20] [5] [5] [5] [5] [5] [5] [21] [21] [21] [22] [22] [22] [22] [22] [22] [22] [6] [6] [6] [6] [6] [7] [7] [7] [7] [23] [23] [23] [23] [23] [24] [24] [24] [24] [25] [25] [26] [26] [26] [26] [26] [26] [26] [27] [27] [27] [27] [27] [27] [27] [28] [28] [28] [29] [29] [29] [29] [29] [29] [29] [29] [9] [9] [9] [30] [30] [30] [31] [31] [31] [31] [31] [32] [32] [32] [32] [32] [32] [33] [33] [33] [33] [33] [33] [34] [34] [34] [34] [34] [34] [34] [34] [35] [35] [35] [36] [36] [37] [37] [37] [37] [37] [37] [38] [38] [39] [39] [39] [39] [40] [40] [40] [41] [41] [41] [41] [41] [41] [41] [42] [42] [42] [42] [42] [43] [43] [43] [43] [44] [44] [37] [37] [37] [37] [37] [37] [37] [37] [37] [37] [37] [37] [37] [37] [45] [45] [45] [45] [45] |
Table 3.
Summary of Model performance results.
| Model | Target | Avg. mae | Avg. rsme | Avg_R2 | samples |
| Median Baseline Linear Model (Ridge) Random Forest XGBoost Median Baseline Linear Model (Ridge) Random Forest XGBoost Median Baseline Linear Model (Ridge) Random Forest XGBoost |
Softening Point (°C) Softening Point (°C) Softening Point (°C) Softening Point (°C) Penetration (dmm) Penetration (dmm) Penetration (dmm) Penetration (dmm) Viscosity (Pa.S) Viscosity (Pa.S) Viscosity (Pa.S) Viscosity (Pa.S) |
14.154 14.4171 11.3263 11.0965 206.7258 235.4897 238.3021 230.3848 1.7106 2.557 1.7616 1.7879 |
21.4906 18.6615 16.1304 15.9136 231.3153 275.0583 275.3899 272.7678 2.7141 3.0389 2.1424 2.2275 |
-0.0682 0.1014 0.3674 0.3894 -0.0081 -0.9856 -0.9717 -0.9346 -0.3008 -4.0487 -0.8741 -1.3455 |
193 193 193 193 206 206 206 206 106 106 106 106 |
Disclaimer/Publisher’s Note: The statements, opinions and data contained in all publications are solely those of the individual author(s) and contributor(s) and not of MDPI and/or the editor(s). MDPI and/or the editor(s) disclaim responsibility for any injury to people or property resulting from any ideas, methods, instructions or products referred to in the content. |
© 2025 by the authors. Licensee MDPI, Basel, Switzerland. This article is an open access article distributed under the terms and conditions of the Creative Commons Attribution (CC BY) license (http://creativecommons.org/licenses/by/4.0/).
Copyright: This open access article is published under a Creative Commons CC BY 4.0 license, which permit the free download, distribution, and reuse, provided that the author and preprint are cited in any reuse.


