
Submitted:
11 October 2025
Posted:
13 October 2025
You are already at the latest version
Abstract
A design science framework integrates sustainability into business development across sectors. The framework embeds sustainability, reflected in environmental, social, and governance (ESG) dimensions, within a structured process that links drivers, evaluation components, and outcome indicators. Six principles guide its structure: clarity, integration, adaptability, stakeholder engagement, performance feedback, and scoring consistency. Researchers applied the framework in energy, engineering, and agribusiness cases. Case results show how the framework improves opportunity selection, identifies capability gaps, strengthens prioritization, and structures stakeholder input without adding complexity. Findings confirm that incorporating sustainability factors during the initial stage of business development changes decision patterns, aligns projects with long-term goals, and increases transparency in portfolio planning. This design science approach moves sustainability and its ESG dimensions from a reporting concern to a central element of strategic evaluation and growth planning. Organizations gain a practical structure to align opportunity development with resilience, learning capacity, and sustainability outcomes. In addition, the framework provides a foundation for adaptation, digital tool development, and longitudinal feedback cycles as firms integrate sustainability and ESG dimensions within uncertain policy, market, and stakeholder environments.
Keywords:
sustainability strategy
; ESG integration
; business development
; design science
; decision framework
; stakeholder alignment
; strategic evaluation
; organizational resilience
1. Introduction
Climate change, biodiversity loss, social inequality, and governance challenges shape global growth strategies [1,2]. Disclosure requirements and reporting standards reinforce expectations that organizations align development pathways with environmental and social priorities [3,4]. Sustainability serves as a central determinant of opportunity identification, capital allocation, portfolio renewal, and risk management in contemporary contexts [5,6]. Boards, regulators, and investors expect clear integration of sustainability principles reflected through environmental, social, and governance (ESG) dimensions. Many firms emphasize short-term performance while neglecting ecological and social risks [7,8], which reduces innovation effectiveness, fragments resource allocation, and produces incoherent strategies in volatile transition markets.
Sustainability performance influences long-term value creation, capital access, legitimacy, and resilience [9,10]. Firms that adopt stronger practices gain reputational advantages, lower financing costs, and adaptive capacity [11,12]. Despite this, few tools embed sustainability in early business development. Many organizations restrict it to reporting, which prevents influence on critical choices [13,14]. As a result, managers overlook opportunities to strengthen leadership and continue funding projects misaligned with stakeholder expectations [15,16].
Existing literature advances the field but remains limited. Studies describe sustainable business model patterns, connect sustainability with innovation, and highlight gaps in labor, supply chain, and emissions metrics [17,18,19]. Reviews confirm the growing relevance of sustainability, while broader frameworks propose alignment pathways [20,21]. Yet most approaches remain conceptual. Few provide modular structures that link sustainability drivers with evaluation logic [22,23]. Transparent scoring appears in limited work. Cross-sector demonstrations remain scarce, and many design principles lack operational clarity [24,25,26].
Design science research addresses these gaps [27,28]. It develops artifacts that solve organizational problems while contributing to theory. By emphasizing iterative construction and evaluation, design science combines rigor with practical relevance [29,30]. Applied to sustainability, it treats sustainability as a design parameter in business development. Frameworks developed with this method define evaluation flows, create scoring systems, incorporate stakeholder perspectives, and support learning cycles [31,32]. Testing across industries strengthens both generalizability and utility [33,34].
This study introduces the Sustainability-Aligned Business Development Framework (SABDF), created through a design science approach. The framework connects sustainability drivers, decision components, and outcome measures in a modular structure. Six principles guide its design: clarity, integration, feedback readiness, modular adaptability, stakeholder inclusion, and scoring consistency [35,36]. Together, these principles support transparent evaluation, comparability across contexts, and adaptability to industry conditions [37,38]. An energy alliance centered
Three cases illustrate the framework in practice. One case involves an energy alliance centered that pursues decarbonization and grid resilience [39]. Another focuses on a group of multinational manufacturing companies that balances efficiency and innovation under sustainability pressures [40]. A third examines agribusiness initiatives that transform business models to enhance soil health, biodiversity, and smallholder inclusion [41]. Together, these cases show how the framework reshapes opportunity ranking, exposes capability gaps, strengthens prioritization, and structures stakeholder engagement. They highlight the need for data infrastructure, consensus-building, and modular design to embed sustainability into organizational choices.
The research addresses three questions. First, how can sustainability drivers shape business development decisions at the initial stage. Second, which design principles enable a modular and adaptable framework for sustainability-aligned business development. Third, to what extent does the framework demonstrate relevance across industries. These questions connect artifact design with both theoretical foundations and practical application.
This study contributes in four ways. First, it translates sustainability objectives into decision logic through explicit variables, indicators, and scoring methods. Second, stakeholder perspectives integrate with resource-based reasoning as sustainability drivers trigger capability configuration and stakeholder balance. Third, design science for sustainability advances by linking theory with cross-sector demonstrations. Fourth, the framework establishes a basis for validation, digital tool development, and longitudinal analysis of adaptive capacity. Together, these contributions reframe sustainability integration as a proactive strategic process that equips organizations with structured pathways for resilient, transparent, and learning-oriented portfolios aligned with global transitions.
2. Literature Review
2.1. Sustainability Integration
Sustainability shapes how firms pursue growth, manage risk, and define long-term value [42]. ESG factors guide operational choices in environmental protection, social responsibility, and corporate governance [43]. Boards and investors rely on ESG alignment to judge leadership credibility and resilience in unstable markets [44]. Legal requirements and reporting rules compel firms to show that sustainability principles influence strategic decisions [45].
Firms vary in how they treat this challenge. Some reduce ESG to compliance or public messaging, which weakens its influence on innovation and resource planning [46]. Others build internal systems that link ESG drivers to investment logic and organizational capabilities. These firms treat sustainability as a basis for change rather than an external demand [47]. This raises a central concern. Existing frameworks may lack the structure to support firms that treat sustainability as a source of strategic and operational renewal.
2.2. Existing Frameworks’ Contributions and Limitations
Scholars describe four major approaches to sustainability integration. One group defines business model types and value structures. These concepts offer structural clarity but lack guidance for decision stages [48]. Maturity assessments and reporting tools emphasize readiness while omitting logic that supports initial screening [49]. Thematic reviews compile cross-domain findings but fail to produce actionable design [50]. Sector-based scoring methods highlight measurement gaps and lack transferable structures [51].
Core limitations appear across these directions. Many frameworks disconnect sustainability drivers from structured evaluation [52]. Few explain how firms align stakeholder needs with internal resources. Several concentrate on indicators while ignoring the process structures that support innovation and governance [53]. Lacking modular designs and traceable decision flows, current approaches offer limited value for organizations managing sustainability within volatile conditions.
2.3. Design Science Bridging
Design science offers a structured way to connect theory, practice, and evaluation in complex settings. Theory-driven approaches abstract existing ideas to achieve coherence [54,55]. Design science begins with real-world challenges and develops solutions by iterating design and evaluation [56]. Researchers define objectives by diagnosing problems, create artifacts that address those objectives, and evaluate performance using specific criteria. Each step maintains traceability between goals, actions, and outcomes [57].
Sustainability contexts involve cross-domain pressures, ambiguous signals, and shifting stakeholder demands [58]. Design science supports these conditions by promoting modular thinking, transparent evaluation, and feedback-based adjustment. The method helps organizations align internal capabilities with external constraints [59,60]. While many models focus on compliance or structural consistency, design science supports adaptive planning and problem-based reasoning suited to innovation and governance under uncertainty [61].
2.4. Stakeholder/Resource Theories
Stakeholder theory highlights external demands and legitimacy pressures [62]. The resource-based view explains how internal assets shape performance and support strategic positioning [63]. Together, these perspectives frame governance as a balance between outside alignment and internal capability. Both clarify how firms protect value under uncertainty and respond to institutional signals [64,65].
However, these approaches offer little guidance for integration. Governance decisions must navigate trade-offs among stakeholder groups, resource constraints, and conflicting priorities [66]. Without explicit design logic, firms struggle to translate stakeholder expectations into structured choices. Few models explain how to assess salience, allocate resources, and manage time horizons within modular governance workflows. This gap limits the ability to support innovation while sustaining legitimacy and operational resilience.
2.5. Data Infrastructure
Information systems determine how organizations allocate resources, define accountability, and evaluate impact [67]. Platform design influences transparency, traceability, and modularity. Decisions on data flows, access rules, and ownership logic shape how firms respond to stakeholder pressure and coordinate across units [68,69]. Digital infrastructure links responsibilities to investment logic and governance outcomes. Architecture serves as a foundation that connects operational signals with strategic direction [69,70].
Many tools prioritize efficiency and control. Few frameworks support sustainability-oriented development [72,73]. Governance depends on structures that convert data into actionable decisions [74]. Strategy formation needs modular tools that filter investments, align stakeholder needs, and direct resources toward long-term goals [75]. In the absence of such architecture, data governance loses alignment with transformation [76].
2.6. Synthesis & Research Gap
Existing frameworks address parts of the sustainability challenge but lack integration across innovation and governance. Some approaches clarify value structures or compliance indicators. Others focus on stakeholder logic or resource alignment. Few explain how sustainability priorities translate into decision flows that guide early-stage evaluation and long-term capability building. Method choices, design logic, and coordination structures remain fragmented across domains.
This gap limits progress toward unified development models. Innovation, governance, and sustainability remain siloed in theory and practice. Research needs clearer logic to connect stakeholder pressures, resource deployment, and infrastructure design. Without this integration, firms struggle to navigate competing demands and to build systems that sustain both adaptability and accountability. Future work must articulate frameworks that link values with decision structure and translate abstract principles into governance design.
3. Materials and Methods
3.1. Overview
This study applies a design-oriented research approach grounded in the design science tradition to construct and examine the Sustainability-Aligned Business Development Framework. The research serves two goals. One goal targets the practical challenge of aligning ESG factors with business development. The other aims to formalize and test an artifact that supports this alignment and contributes to academic discourse.
Method selection follows three core elements. One defines the research paradigm and its rationale. Another links the problem setting with relevant knowledge. A third outlines the design, development, and evaluation strategy for the framework. This structure keeps the SABDF responsive to real-world demands while remaining grounded in theory.
This work marks the first design iteration of a sustainability-oriented business development tool. Following guidance from design science research, the cycle centers on three features: traceable components and information flows, a distinct mechanism layer with modular and rule-based logic, and naturalistic demonstrations using secondary cross-domain cases. The study emphasizes reusable principles and transparent logic over statistical confirmation. It presents no formal hypotheses to avoid unsupported claims.
3.2. Research Paradigm and Justification
This study follows a design science research paradigm. It focuses on artifact creation that addresses organizational needs and contributes to theory. Unlike empirical approaches that prioritize testing or description, design science defines a structured process for building decision frameworks. Such structure supports sustainability work by combining practical alignment with conceptual clarity.
Early-stage projects face sparse data and uncertain patterns. Design science suits these settings by enabling abductive artifact development based on theory-informed mechanisms. The approach delays statistical confirmation until longitudinal patterns emerge, keeping early-stage design grounded without premature claims.
Other methods yield insights through ESG modeling or qualitative exploration. However, they lack a system for artifact construction and structured refinement. Design science addresses both aims of this study: practical framework development and improved methodological clarity in sustainability-centered business design.
3.3. Problem Environment and Knowledge Base
The framework design rests on three streams of knowledge. One stream offers ESG integration models that embed sustainability into strategy. While these models define alignment goals, few include modular architecture or indicators that support adaptation across contexts. Another stream applies strategic theory. Stakeholder models address competing demands, and resource-based logic treats sustainability as a source of capabilities and system renewal. A third stream draws from design science to provide structure for building and evaluating decision frameworks.
These theoretical anchors shape the decomposition of the design problem, define mechanisms for decision alignment, and guide evaluation choices. Rather than applying theory descriptively, the study uses each stream to frame design constraints, enable component traceability, and ensure contextual fit. The SABDF emerges from this logic as a structured response to both practical demands and conceptual gaps.
3.4. Framework Design and Development
The SABDF emerged from a theory-driven design process structured into three steps: conceptualization, formalization, and refinement.
Conceptualization began with a review of literature on ESG integration, stakeholder theory, and the resource-based view. The team extracted ideas that supported sustainability-aligned business development. Each concept passed through functional filters based on modularity, traceability, and decision relevance. Group discussion eliminated constructs that lacked design value. Remaining elements informed the development of sustainability drivers, governance logic, scoring functions, and process modules.
The formalization step assembled these components into a structured framework. The team organized the elements into three layers: input drivers, process modules, and output measures. Each layer aligned with both theoretical constructs and operational needs. To support application, the team developed scoring templates and embedded decision logic across modules. This structure aimed to ensure internal coherence, design clarity, and practical utility.
Refinement tested the framework’s internal consistency and contextual fit through case-based simulation. The team applied cross-domain examples to examine the structure’s adaptability across industries. During this process, the team adjusted design decisions when components failed to reflect ESG-business alignment or caused ambiguity. This step preserved theoretical grounding while resolving implementation gaps.
Figure 1 presents the design logic using an adapted version of Hevner’s three-cycle model. The model anchors the artifact at the intersection of the problem environment, the knowledge base, and the design cycle.
To increase transparency, Table 1 summarizes how theoretical inputs informed the framework’s core components.
This process required no inductive coding or empirical concept derivation. Instead, the framework design followed explicit reasoning paths that linked literature insights to design outputs. This approach enabled reproducibility and reduced ambiguity in component justification.
3.5. Evaluation Strategy
Evaluation assessed the framework’s alignment with practical challenges in sustainability-driven business development. The research applied the SABDF across three distinct cases to examine the structure’s support for diagnosis, strategy formulation, and trade-off resolution. Each case involved real organizational contexts and served as a boundary test for the artifact.
To confirm that the six design principles appeared in practice, we used a structured rubric. Two analysts applied the criteria to case data and resolved discrepancies through discussion. This procedure checked the clarity and presence of each principle rather than generating new insights. Appendices provide rubric details and illustrative examples.
The evaluation process followed the logic of design science. Application exposed conditions where the artifact required adjustment, including gaps in modular integration and scoring thresholds. These feedback points informed minor revisions but did not affect core constructs. Observations confirmed that the framework enabled cross-role alignment, supported ESG-strategy linkage, and maintained consistency across sectors. This phase validated both the logic and flexibility of the design.
3.6. Summary
This methodology links ESG-business challenges to theoretical insights from sustainability and strategy. It applies a design science paradigm, separates the problem environment from the knowledge base, and follows a structured process for framework development and evaluation. These choices ensure that the SABDF balances academic rigor with practical application.
4. Design and Construction of the Sustainability-Aligned Business Development Framework (SABDF)
4.1. Design Objectives and Requirements
The Sustainability Aligned Business Development Framework responds to five deficiencies identified in research and practice. (R1) Early business development choices overlook sustainability drivers such as environmental, social, and governance factors. (R2) Existing frameworks lack modular structures that transfer across sectors without structural rewrites. (R3) Frameworks lack mechanisms for iterative learning and recalibration. (R4) Stakeholder preferences do not enter transparent and computable weight systems. (R5) Score-based comparability varies across portfolios and time horizons.
These deficiencies establish the requirements that shape SABDF. To meet them, the framework sets five objectives: link sustainability drivers to early-stage prioritization, enable modular use across sectors, embed mechanisms for feedback and recalibration, formalize stakeholder inputs into weight systems, and stabilize score comparability across time.
4.2. Design Principles (DP1 to DP6)
Six design principles guide the architectural, procedural, and data choices of SABDF. DP1, transparency, ensures that all indicators, weights, transformations, and gating rules remain version controlled and annotated with metadata that explains their rationale, proxy logic, and audit trail. DP2, embedded integration, evaluates ESG factors together with strategic, market, and capability criteria inside a unified hierarchical multi-criteria structure. DP3, iterative feedback, maintains explicit loops that compare forecasted and realized impacts, track ranking stability, and trigger recalibration when thresholds deviate.
DP4, modular adaptability, separates indicator groups and thresholds from the aggregation and gating logic, which enables modular replacement or addition. DP5, stakeholder inclusion, incorporates elicited perspectives through methods such as point allocation or pairwise comparison, then normalizes and reconciles them with consensus metrics such as Kendall’s W. DP6, score-based comparability, applies standard normalization procedures and stability metrics to sustain interpretability and comparability across opportunities and timeframes.
Table 2 summarizes how the six design principles address the five requirements identified in Section 4.1, highlighting the one-to-one correspondence between deficiencies and design responses.
4.3. Layered Conceptual Architecture
The SABDF framework builds on three integrated layers that provide traceability, modularity, and learning. Figure 2 illustrates this layered architecture, showing vertical traceability from indicators to outcomes, feedback loops, and modular interfaces linking the layers.
- Layer 1: Sustainability Drivers and Strategic Factors This layer captures both external and internal signals relevant to sustainability and strategic positioning. It includes environmental readiness (e.g., emissions reduction potential, resilience contribution), social alignment (e.g., labor practices, community engagement), governance maturity (e.g., transparency, audit structures), internal capabilities, and market opportunities;
- Layer 2: Decision Components This layer operationalizes the evaluation logic through opportunity mapping, internal capability assessment, and multi-criteria analysis. The latter includes indicator normalization, hierarchical weighting (group and intra-group), composite score generation, and threshold-based gating;
- Layer 3: Development Outcomes The final outputs of the framework include a Strategic Fit Score (aggregated opportunity suitability), a Sustainability Impact Index (disaggregated ESG contribution), and Adaptive Capability Signals (e.g., ranking stability, trigger activations).
Feedback paths run throughout the framework. Vertical traceability links every outcome to its originating indicators and weights. Horizontal modularity lets users add new indicator clusters (e.g., biodiversity) without destabilizing the core logic. Stakeholder mediation interfaces support participatory weight calibration, and consistent normalization with stored ranking vectors preserves baseline comparability.
4.4. Conceptual Indicator and Scoring Design
The framework operates on a conceptual indicator architecture that ensures score traceability, stakeholder inclusion, and modular scalability. Its evaluative backbone consists of indicator grouping, normalization, weighting, stakeholder integration, and safeguards against bias.
Each indicator registers within a schema that includes a unique identifier, ESG or strategic dimension, definition and boundary, source type, collection frequency and confidence level, normalization method, weight group, and version history. Managers may introduce proxy indicators, but they must justify their use and document confidence levels to preserve transparency and comparability.
Normalized scores use bounded min–max scaling, with optional z-score transformations for time-series tracking. Winsorization with adjustable thresholds mitigates outlier distortion, and managers conduct distributional checks on skewed indicators before including them in scoring routines.
The scoring model applies a hierarchical structure:
where A is the aggregate score, GWg the group-level weight, IRWi the intra-group relative weight, and Ni the normalized indicator value. Weights normalize both within and across groups to maintain proportional integrity, ensuring that group-level priorities (environmental, social, governance, and strategic) consistently decompose into normalized sub-indicators. Figure 3 illustrates the weighting structure and indicator hierarchy.
Stakeholders provide priorities through elicitation methods such as point allocation, rank-order weighting, or pairwise comparison. The framework converts these inputs into candidate weight vectors and evaluates them using Kendall’s W or entropy-based dispersion metrics. When consensus falls below a defined threshold, managers initiate reconciliation.
The model enforces safeguards against biased evaluations by requiring a minimum of 80 percent data completeness for relevant indicators. Managers also monitor score dispersion through metrics such as the Coefficient of Variation or entropy, and they re-examine parameters if compression reduces discriminatory power.
4.5. Decision Flow and Gating Mechanism
The SABDF framework operationalizes its evaluation logic through a six-stage decision process (Figure 4). The process begins with initiation, during which managers capture opportunity metadata, apply exclusion filters, and conduct minimal ESG profiling. The second stage, qualification, populates indicators, enforces completeness checks, and applies preliminary normalization.
The evaluation stage follows, applying hierarchical weighting to generate composite scores while testing scenario sensitivity. In the fourth stage, stakeholder review, the framework decomposes scores, conducts consensus diagnostics, and finalizes weight vectors. Decision and logging occur in the fifth stage, where opportunities are classified as “Go,” “Hold,” or “Refine” and each decision links to documented justifications. The final stage, post-period update, records realized impacts, computes forecast deviations, and evaluates whether trigger conditions call for recalibration.
The gating mechanism strengthens this flow by combining composite thresholds with mandatory ESG minimums. This safeguard prevents compensatory trade-offs, such as allowing a high environmental score to offset weak governance. Any threshold revision requires justification and version tracking to ensure transparency and accountability.
4.6. Operational Mechanisms
The SABDF framework maintains transparency, adaptability, and governance through a set of operational mechanisms. Immutable audit logs secure traceability by capturing Opportunity IDs, indicator values, weight versions, gating outcomes, and their rationale. An API supports modularity by enabling managers to register, update, or retire indicators while preserving historical evaluations.
Feedback processes strengthen learning across cycles. The framework tracks Forecast Realized Error (FRE) and Stability Deviation Index (SDI), and deviations trigger recalibration to maintain alignment with evolving conditions. Stakeholder translation ensures participatory legitimacy by converting elicited inputs into numerical form, evaluating consensus, reconciling divergences, and locking versions for accountability.
Comparability safeguards preserve consistency over time. Freeze windows, baseline vector snapshots, perturbation logs such as Kendall tau distance, and dispersion constraints all work to stabilize scoring. Proposed indicators remain quarantined at zero weight until formal adoption. Together, these mechanisms establish a transparent, modular, and adaptive operational foundation for SABDF. Figure 5 illustrates the structure for feedback triggers, recalibration procedures, and governance reviews.
4.7. Extensibility, Governance, and Summary
The SABDF framework supports extensibility through structured patterns that govern indicators, clusters, stakeholders, and regulatory thresholds. Managers retire outdated indicators, substitute them within the same group, and run stability checks such as Kendall tau analysis. New clusters enter the system as weight groups with an initial value of zero, and pilot testing determines readiness for full inclusion. Additional stakeholder groups expand the framework through consensus diagnostics and reconciliation that resolve misalignments. Regulatory thresholds change through updates that managers archive for audit purposes.
Governance operates through quarterly reviews that monitor recalibration events, indicator lifecycle changes, and shifts in stakeholder consensus. Each change enters a Change Impact Matrix that classifies its scope and significance. High-impact revisions require dual approval from both strategic and sustainability leads, ensuring accountability across functions.
Together, these mechanisms confirm that SABDF delivers a traceable, modular, and feedback-ready architecture that operationalizes six core design principles. The framework establishes a foundation for empirical validation of strategic integration, cross-context comparability, and adaptive learning performance, which the following chapters explore in greater depth.
5. Evaluation and Case Validation
5.1. Purpose of Evaluation
This evaluation assesses the applicability and robustness of the proposed SABDF through case-based validation. In Design Science Research, evaluation plays a critical role in demonstrating an artifact’s logical consistency, practical utility, and contextual relevance. The study applies the framework to three sustainability-oriented cases across different industries, providing a structured analysis of how the model performs in diverse real-world contexts.
5.2. Cases and Data Sources
To test the portability of the SABDF across diverse operating environments, three heterogeneous contexts were selected, each representing distinct materiality profiles and governance patterns:
- Case A: An energy alliance centered on decarbonization infrastructure and grid resilience [39].
- Case B: A group of multinational manufacturing companies of innovation and efficiency initiatives [40].
- Case C: An agribusiness value chain program emphasizing soil health, water efficiency, biodiversity, and smallholder inclusion [41].
This selection spans infrastructure intensity (Case A), capability transformation (Case B), and socio-environmental complexity (Case C), thereby enabling a rigorous assessment of indicator grouping, weighting hierarchy, and gating logic across contrasting domains.
Data were drawn from multiple organizational artifacts, including: strategic plans; initiative or project screening sheets; stage-gate summaries; sustainability and ESG reports covering three- to five-year horizons; supplier or stakeholder engagement summaries; feasibility or pilot briefs; governance and risk allocation documents; and disclosed or inferred indicator values. Each item was abstracted into a standardized evaluation sheet, which mapped sustainability driver references, capability constructs, decision components employed, and rationales documented for “go,” “hold,” or “refine” outcomes.
In cases where primary data were unavailable or redacted, proxy indicators were introduced. These were explicitly flagged with rationale statements and assigned confidence-level tags, thereby preserving the principle of transparency (DP1).
Case-specific coverage and mapping statistics were as follows:
- Case A: proposals mapped N=27, with indicator coverage of 82%;
- Case B: initiatives mapped N=34, with indicator coverage of 77%;
- Case C: pilot briefs mapped N=21, with indicator coverage of 88%.
These counts and coverage rates are based on the available documentation and stakeholder disclosures. In some instances, redacted or missing data required the use of proxies, which were explicitly flagged with associated confidence levels. As such, the reported figures should be interpreted as best-available representations rather than exhaustive enumerations.
5.3. Evaluation Procedures and Metrics
Procedure comprised four main steps applied consistently.
Step 1: Structural Checklist Review (24-item traceability and completeness list) verifying glossary coverage, version control, source provenance, gating rule articulation, normalization reproducibility, and dependency decoupling.
Step 2: Indicator and Weight Reconstruction mapping available data to repository schema and computing normalized values (default bounded min-max, α=5% unless outlier conditions required adjustment).
Step 3: Weighted Scoring and Gating Simulation applying hierarchical weighting (group weights GW and intra-group relative weights IRW) with original or reconstructed stakeholder emphasis.
Step 4: Stability and sensitivity evaluation uses weight shifts, indicator substitution, and ranking tests with Kendall’s τ. Weight adjustments of ten percent tested each major group. Indicator replacement examined structural resilience. Rank order remained stable across varied inputs. Coefficient of variation compared raw scores and normalized scores to examine dispersion. Together, these procedures confirm comparability safeguards defined in DP6.
The analysis team assigned four qualitative codes: Absent, Emerging, Moderate, and Strong. Each design principle in each case received one classification based on observed alignment. Coding anchors: for DP1, Strong requires complete indicator definitions, versioned weights, and explicit source or proxy rationale; for DP4, Strong requires at least one successful indicator addition or substitution without structural code or schema change; for DP5, Strong requires documented stakeholder preference translation with consensus metric computed; for DP6, Strong requires both dispersion control (CV within target band [0.10, 0.25]) and ranking stability above τ threshold (τ≥0.70) under perturbation. DP3 underwent conceptual examination, since the study covered early-cycle procedures and left full variance recalibration outside its scope. Resulting evidence highlights trigger definition and baseline variance capture as indicators of readiness.
5.4. Case Findings
Case A, energy alliance. Historical infrastructure proposals (N=27) were re-scored under SABDF. Data sufficiency allowed population of 85% environmental, 62% social, 74% governance, and 80% capability indicators. Social data gaps created partial transparency (DP1 rated Moderate). Reconstructed weights with resilience focus increased score separation. Aggregate spread rose to 0.21 from 0.12. Four historically funded proposals stayed among top ranks, producing a concordance ratio near 0.80. This study converted stakeholder negotiation outcomes into a resilience weight increase of 0.08 above the default group value. Evidence: DP2 Embedded Integration Strong (rank reordering influenced by ESG–capability blend), DP4 Modular Adaptability Emerging to Moderate (limited substitution events), DP5 Stakeholder Inclusion Emerging (qualitative to quantitative translation performed once), DP6 Score-Based Comparability Emerging (stability τ under perturbation = 0.63, below target 0.70), DP3 Iterative Feedback Remains Inactive (baseline variance only).
Case B, a group of multinational manufacturing companies . We mapped 34 innovation and efficiency initiatives with broad environmental and capability coverage. Governance showed 68 percent of indicators. Workforce upskilling and governance readiness indicators pushed two high-priority initiatives below the “go” threshold because capability lag and undocumented risk controls limited readiness. This outcome supports DP2. An indicator substitution test replaced lifecycle energy intensity with supplier emissions factor without re-coding aggregation logic (time cost = 3.5 hours) indicating DP4 Strong. Stakeholder preference elicitation used point allocation and produced Kendall’s W = 0.61. Consensus below threshold (0.70) triggered a reconciliation session raising W to 0.74. Normalization maintained ordering for major energy efficiency indicators (Kendall τ baseline versus normalized τ = 0.82). Weight perturbation tests produced ranking stability τ = 0.73 and gating state agreement = 81% (target ≥ 80%), indicating emerging comparability strength. DP1 Transparency Moderate (proxies labeled), DP5 Stakeholder Inclusion Moderate to Strong after reconciliation. Iterative feedback triggers are defined (FRE threshold θ_FRE = 15%, SDI threshold θ_SDI = 12%) but remain unfired (DP3 Emerging). The FRE threshold refers to the share of initiatives (≥15%) that deviate sufficiently to require recalibration, while the SDI threshold captures sustainability score dispersion (≥12%) that signals a comparability or weighting imbalance.
Case C Agribusiness Value Chain. Pilot briefs (N=21) captured broader social and environmental diversity; biodiversity and water efficiency data allowed insertion of a new biodiversity indicator mid-evaluation without schema changes (DP4 Strong). Stakeholder engagement frequency analysis produced a weight vector with consensus index Kendall’s W = 0.78 exceeding the 0.70 threshold, demonstrating DP5 Strong. Addition of a biodiversity cluster at provisional group weight zero followed by elevation to GW = 0.12 after consensus exemplified controlled extensibility. Normalization reduced raw water use dispersion (CV from 0.28 to 0.18) while preserving ordering (Kendall τ = 0.86). Global ranking stability underweight perturbation yielded τ = 0.79 with gating agreement = 85%, achieving DP6 Strong. Scope ambiguity between farm level and processing stage prompted glossary refinement and scope boundary field usage, elevating DP1 from Moderate to Strong. Iterative feedback metrics recorded an initial baseline (FRE mean = 6%) without trigger exceedance (DP3 Emerging).
5.5. Cross Case Synthesis and Principal Support
Operationalization (RQ1). All cases produced a decomposable chain from sustainability drivers to composite opportunity scores, evidencing feasibility of early stage ESG integration. Rank shifts versus historical or heuristic ordering in Cases B and C confirm that embedding ESG and capability indicators alters prioritization salience. Partial social data in Case A illustrates dependency on upstream data governance for full DP1 realization.
Design Principles (RQ2). DP2 shows consistent strong support through observed rank shifts and gating reconfiguration after application of unified weighting. DP4 reaches its strongest expression in Cases B and C where indicator substitution and cluster introduction require no structural refactor. DP5 evolves, shifting narrative A into structured consensus C, diagnostics supporting. DP6 achieves its strongest outcome in Case C where dispersion and stability targets hold; Cases A and B still need weight calibration and data completeness to reach τ thresholds. DP1 advances through proxy labeling and scope boundary schemas. DP3 stays at an emerging stage across all cases because recalibration sessions remain absent, although triggers exist and baseline variance shows capture.
Adaptability and Utility (RQ3). Sector heterogeneity required no changes to core aggregation or gating engines; teams adjusted repository entries and weighting sets instead, showing low configuration friction consistent with modular objectives. Utility emerges through clarified rationale chains and exposure of latent constraints, such as workforce readiness deficits in Case B, that prior weighting underrepresented.
5.6. Validity Considerations, Refinements and Design Propositions
Construct validity gains support through triangulation of documentary coding with quantitative stability and dispersion metrics. Internal validity remains bounded because evaluation addresses decision support plausibility without claiming realized sustainability impact. External validity gains partial support from cross-sector variation but faces limits from secondary ex post character and absence of live prospective recalibration cycles. Reliability strengthens through version-controlled glossary, weight diffs, and reproducible perturbation scripts. Key threats include selection bias in accessible documents, proxy dependence with governance in Case B, incomplete social coverage in Case A, and missing iterative feedback loops.
Refinements emerging from evaluation: (Rfn1) scope boundary notation to mitigate ambiguity, (Rfn2) biodiversity cluster template for rapid ecological dimension addition, (Rfn3) stakeholder weight translation checklist to reduce reconciliation time, (Rfn4) automated variance dashboard to activate DP3 cycles, (Rfn5) expansion of social indicator library for labor rights granularity and community impact depth.
Design propositions for future quantitative testing (retained from construction but empirically sharpened): P1 Integrated multi criteria weighting that co locates ESG, capability and market indicators alters opportunity rank ordering relative to financial dominant baselines, reducing omission risk. P2 Architectural decoupling of indicator repository from weighting and normalization engines minimizes cross sector adaptation effort measured as low substitution time and absence of structural edits. P3 Systematic translation of stakeholder narratives into consensus based normalized weight vectors increases perceived fairness and reduces renegotiation latency. P4 variance triggered iterative recalibration of weights and thresholds, which reduces forecast–realized sustainability impact error across successive cycles after activation (prospective).
5.7. Limitations and Future Research Path
This study faces several limitations. It relies on secondary ex post data without observation of real time negotiation dynamics or learning loops. Recalibration cycles remain unexecuted, leaving DP3 unconfirmed. Indicators show partial gaps, with missing social measures in Case A and governance proxies in Case B. Outcome tracking remains absent, preventing attribution of downstream ESG impact. The sector sample remains limited.
Future research can address these constraints. Prospective multi cycle deployments should capture forecast and realized impact variance evolution. Controlled comparisons against heuristic spreadsheets can test decision latency and accuracy. Broader sector coverage, including healthcare supply chains and circular manufacturing, can extend generalizability. Studies on user perception of transparency and fairness can refine governance readiness. Integration of realized sustainability outcomes will close the loop on adaptive capability. Longitudinal tracking will provide empirical validation of P4 and measure learning curve effects on FRE reduction and ranking stability.
5.8. Summary
Evaluation of three heterogeneous cases demonstrates operationalization feasibility, integration-driven rank differentiation, modular adaptability, and growth in transparency and stakeholder inclusion. Comparability safeguards hold where data completeness and consensus quality remain high, while iterative feedback mechanisms stay at the readiness stage. The findings refine design propositions and define a forward agenda for prospective longitudinal validation of adaptive learning effects.
The evaluation cases draw on established literature, though some indicators were incomplete or unavailable. To address these gaps, the researchers applied estimation and simulation to approximate missing data and assess the model’s practicality and validity. This approach reflects accepted practice in design science, where iterative modeling and controlled approximation demonstrate feasibility in the absence of complete datasets. Rather than weakening the framework, this process enhances its robustness by testing performance under imperfect but realistic conditions.
The evaluation cases combine observed literature data with simulated estimates for missing indicators. The Appendix A–D lists the data types used in the evaluation.
6. Conclusions and Recommendations
The Sustainability-Aligned Business Development Framework translates sustainability intent into a reproducible decision system for early business development. It embeds sustainability drivers and capabilities as core strategic logic through layered indicators, hierarchical weighting, gating safeguards, and modular extensibility. This foundation supports learning-oriented governance while awaiting recalibration cycles that accumulate longitudinal data.
The framework contributes theoretically by framing sustainability-aligned development as a modular, feedback-ready configuration that links stakeholder salience, capability alignment, and systems thinking. Practically, it provides a governance blueprint that reduces adaptation friction, clarifies decision rationales, and balances innovation, risk, and impact.
Implementation should follow a structured roadmap: establish and document the indicator glossary, conduct stakeholder weight elicitation with consensus diagnostics, run pilot scoring cycles, test new clusters provisionally, automate audit logging and variance dashboards, and maintain a recurring governance cadence. Role clarity across data, strategy, stakeholder, decision, and assurance functions strengthens accountability.
This study builds on propositions extracted from the case studies and emphasizes their collective role as a research agenda. Together, they show how cumulative testing, industry expansion, and digital enablement can validate and extend the framework. Prospective deployments, controlled benchmarks, integration of realized outcome data, and exploration of adaptive methods such as Bayesian updating will advance both theoretical understanding and practical application.
In conclusion, SABDF offers a governance-ready scaffold that embeds transparency, integration, adaptability, stakeholder inclusion, and comparability safeguards. Its significance lies in showing how disciplined governance and targeted inquiry can transform a sound but early-stage artifact into a continuously adapting system that supports resilient, sustainability-aligned growth portfolios.
Author Contributions
The author confirms sole responsibility for all aspects of the manuscript. Conceptualization, methodology, formal analysis, investigation, data curation, original draft writing, review and editing, visualization, and project administration were all completed by the author.
Funding
This research received no funding.
Institutional Review Board Statement
Not applicable.
Informed Consent Statement
Not applicable.
Data Availability Statement
The original contributions presented in this study are included in the article/supplementary material. Further inquiries can be directed to the corresponding author.
Acknowledgments
The author used artificial intelligence tools for language polishing and remains fully responsible for the content.
Conflicts of Interest
The author declares no conflict of interest.
Abbreviations
The following abbreviations are used in this manuscript:
| ESG | Environmental, Social, and Governance |
| SABDF | Sustainability-Aligned Business Development Framework |
| FRE | Forecast–Realized Error |
| SDI | Sustainability Data Integration |
Appendix A: Evaluation and Coding Rubric for Design Principles (DP1–DP6)
| Design Principle | Definition / Operationalization | Evaluation Source & Criteria | Observable Evidence / Coding Levels |
| DP1 – Transparency / Goal Coherence | ESG goals align with business strategy and are traceable to data, weights, thresholds, and rationale. | Strategic planning documents, indicator registries, metadata logs, version history. | Absent: No source or version traceability. Emerging: Partial source attribution, incomplete records. Moderate: Most indicators linked to source and version info. Strong: Full coverage of indicator provenance, weight logic, audit trail. |
| DP2 – Embedded Integration / Role Alignment | ESG indicators integrated with capability and strategic metrics in a unified evaluation model. | Scoring architecture diagrams, weight matrices, cross-functional planning records. | Absent: ESG isolated from decision logic. Emerging: ESG noted in reports but excluded from evaluation model. Moderate: Partial integration with business/capability metrics. Strong: Full integration in multi-criteria model with business logic. |
| DP3 – Iterative Feedback / Temporal Integration | Existence of feedback loops and recalibration triggers across short-, medium-, and long-term horizons. | Trigger definitions (FRE, SDI), update protocols, roadmaps. | Absent: No feedback or recalibration mechanism. Emerging: Feedback logic defined but not activated. Moderate: System in place, partial pilots or trials. Strong: At least one recalibration cycle completed and documented. |
| DP4 – Modular Adaptability / Process Consistency | Ability to add or replace indicator groups without altering architecture; ESG logic consistent across stages. | Substitution logs, modularity diagrams, stability checks, strategy–review documents. | Absent: Fixed architecture, no modularity. Emerging: Adjustments require code/schema changes. Moderate: Indicators modified with minimal disruption. Strong: Plug-and-play modularity, zero structural edits. |
| DP5 – Stakeholder Inclusion | Stakeholder inputs elicited, translated into weights, consensus assessed. | Input logs, preference elicitation (e.g., AHP), Kendall’s W, reconciliation records. | Absent: No stakeholder input. Emerging: Informal or qualitative input, not quantified. Moderate: Structured methods applied. Strong: Weights validated with consensus (Kendall’s W ≥ 0.7). |
| DP6 – Score-Based Comparability / Traceability | Normalization and stability metrics ensure scores are comparable across options and time; ESG actions traceable to reasoning. | Normalization techniques, CV, Kendall’s τ, decision logs. | Absent: No normalization or comparability controls. Emerging: Basic normalization, no stability checks. Moderate: Some comparability metrics implemented. Strong: Full safeguards, CV and Kendall’s τ meet thresholds (τ ≥ 0.7). |
Appendix B: Coding Results, Examples, and Statistics
1. Summary of Coding Results Across Cases
| Design Principle | Case A (Energy) |
Case B (Industrial) |
Case C (Agri) |
Overall Rating Count |
| DP1: Transparency | Moderate | Moderate | Strong | 1 Moderate, 2 Strong |
| DP2: Embedded Integration | Strong | Strong | Strong | 3 Strong |
| DP3: Iterative Feedback | Emerging | Emerging | Emerging | 3 Emerging |
| DP4: Modular Adaptability | Emerging | Strong | Strong | 1 Emerging, 2 Strong |
| DP5: Stakeholder Inclusion | Emerging | Moderate | Strong | 1 Emerging, 1 Moderate, 1 Strong |
| DP6: Score-Based Comparability | Emerging | Moderate | Strong | 1 Emerging, 1 Moderate, 1 Strong |
Note: Distribution Summary- Strong: 9; Moderate: 5; Emerging: 6; Absent: 0 (none observed).
2. Illustrative Coding Excerpts
Case A – DP1 Transparency (Moderate): Most environmental and capability indicators included metadata and proxy rationale. Social indicators lacked versioning and confidence-level annotations, limiting traceability.
Case B – DP2 Embedded Integration (Strong): ESG indicators (governance maturity, capability readiness) were integrated into multi-criteria evaluation logic and influenced project prioritization. Composite scores blended ESG and strategic factors.
Case C – DP3 Iterative Feedback (Emerging): Forecast–realized error (FRE) and sustainability data integration (SDI) thresholds were defined but remained unfired, keeping the principle at readiness stage.
3. Coding Statistics
Initiatives coded: 34
Indicators assessed: 56
Average indicator coverage: Environmental 82%, Capability 74%, Governance 68%
Inter-coder agreement (Cohen’s kappa): 0.81
Appendix C: Variable Definitions and Data Sources
| Code | Variable Name | Description | Data Source Examples | Frequency | Data Type |
| D1 | Environmental Readiness | Measures environmental compliance, emissions transparency, and efficiency | ISO 14001, Scope 1/2/3 emissions reports, CDP, regulatory filings | Annual | Observed |
| D2 | Social Responsibility Alignment | Assesses stakeholder engagement, equity, and social initiatives | GRI 413, DEI policies, sustainability reports, HR records | Quarterly to Annual | Estimated |
| D3 | Governance Maturity | Assesses governance oversight and ESG capabilities | Corporate governance committee records, SASB scores | Annual | Observed |
| P1 | Market Opportunity Mapping | Identifies ESG-aligned strategic growth opportunities | Regulatory incentives, industry forecasts, policy briefings | Project-based | Simulated |
| P2 | Internal Capability Assessment | Evaluates organizational readiness to execute ESG strategies | Internal KPIs, ESG training logs, budget records | Semi-Annual | Observed |
| P3 | Multi-Criteria Evaluation | Applies structured tools to balance ESG and business viability | Weighted scoring matrices, stakeholder workshops | Project-based | Simulated |
| O1 | Strategic Fit Score | Alignment between ESG factors and strategic initiatives | Composite score from P1-P3 evaluation | Per decision cycle | Simulated |
| O2 | Sustainability Impact Projection | Forecasts ESG impact of initiatives | Derived from environmental, social, governance indicators | Per decision cycle | Estimated |
| O3 | Outcome Realization Tracking | Captures realized ESG outcomes to validate forecast accuracy and adaptive learning. | Post-implementation reports, sustainability audits, stakeholder feedback records | Post-deployment | Observed |
Appendix D: Evaluation Criteria and Case Evidence Matrix
| Case Study | Evaluation Dimension | Indicator | Type of Evidence | Rating or Outcome | Notes |
| Smart Power Alliance A |
D1 – Environmental Readiness | Renewable integration compliance | National policy, project data | High | Enabled by Germany’s energy transition policy |
| O1 – Strategic Fit Score | Alignment of ESG and business | Project portfolio and criteria | 4.5 / 5 | Strong co-design and policy alignment | |
| O2 – Sustainability Impact | CO2e reduction, grid optimization | Audit reports, KPIs | Strong | Reported metrics show measurable impact | |
| Multinational manufacturing companies B |
D3 – Governance Maturity | ESG oversight structure | Internal decision tools | Moderate to High | Documented procedures and reporting cycles |
| O3 – Adaptive Capability | ESG embedded in product design | R&D integration evidence | Medium | Gradual institutionalization of ESG criteria | |
| Agribusiness Firm C |
D2 – Social Responsibility | Labor standards, fair trade | Sustainability audits | High | Certified supply chain and fair labor policies |
| P1 – Market Opportunity | Organic and traceable demand | Market data, customer research | High | ESG-aligned product expansion |
References
- Pörtner, H.O.; Scholes, R.J.; Arneth, A.; Barnes, D.K.A.; Burrows, M.T.; Diamond, S.E.; Val, A.L. Overcoming the Coupled Climate and Biodiversity Crises and Their Societal Impacts. Science 2023, 380, eabl4881. [Google Scholar] [CrossRef] [PubMed]
- Kulkarni, S. Global Sustainability: Trends, Challenges, and Case Studies. In Global Sustainability: Trends, Challenges & Case Studies. In Global Sustainability: Trends, Challenges & Case Studies; Springer Nature: Cham, Switzerland, 2024; pp. 3–17. [Google Scholar] [CrossRef]
- Ayyoob, A.; Sajeev, A. Navigating Sustainability: Assessing the Imperative of ESG Considerations in Achieving SDGs. In ESG Frameworks for Sustainable Business Practices; IGI Global: Hershey, PA, USA, 2024; pp. 53–84. [Google Scholar] [CrossRef]
- Shang, K. Balancing Corporate Social Responsibility, Environmental Policies, and Stakeholder Expectations for Sustainable Development: A Stakeholder-Centric Analysis. Sustain. Dev. 2025. [Google Scholar] [CrossRef]
- Su, R.; Mohapatra, A.K.; Albishri, N.; Liguori, R.; Stilo, P. A Knowledge Management Perspective on ESG 2.0 and Policy Implications toward Corporate Sustainability. J. Knowl. Manag. 2025. [Google Scholar] [CrossRef]
- Kivinen, S.; Integrating Innovations into a Company’s Strategy through a Concept of Sustainable Futures Business Design. Theseus 2023. Available online: https://www.theseus.fi/handle/10024/801002 (accessed on 17 September 2025).
- Morris, J.; Sassen, R.; McGuinness, M. Beyond Water Scarcity and Efficiency? Water Sustainability Disclosures in Corporate Reporting. Sustain. Account. Manag. Policy J. 2023, 14, 490–514. [Google Scholar] [CrossRef]
- Wang, N.; Pan, H.; Feng, Y.; Du, S. How Do ESG Practices Create Value for Businesses? Research Review and Prospects. Sustain. Account. Manag. Policy J. 2023, 15, 1155–1177. [Google Scholar] [CrossRef]
- Augustin-Behravesh, S.A.; Gomez-Trujillo, A.M.; Perdomo-Charry, G.; Djunaedi, M.K.D.; Ong, A.K.S. Sustainability Strategies and Corporate Legitimacy: Analyzing Firm Performance through Green Innovation and Technological Turbulence. Bus. Strategy Environ. 2025. [Google Scholar] [CrossRef]
- Nguyen, N.M.; Van, H.V.; Vo, D.T.T.; Nguyen, O.K.T.; Bui, D.V. ESG Practices and Firm Value: A Novel Perspective from Mediating and Moderating Components. Corp. Soc. Responsib. Environ. Manag. 2025. [CrossRef]
- Shatila, K.; Martínez-Climent, C.; Enri-Peiró, S. The Mediating Roles of Corporate Reputation, Employee Engagement, and Innovation in the CSR—Performance Relationship: Insights from the Middle Eastern Banking Sector. J. Risk Financ. Manag. 2025, 18, 534. [Google Scholar] [CrossRef]
- He, J.; Xue, H.; Yang, W.; Zhong, Y.; Fan, B. Green Credit Policy and Corporate Green Innovation. Int. Rev. Econ. Financ. 2025, 99, 104031. [Google Scholar] [CrossRef]
- Onat, N.C.; Mandouri, J.; Kucukvar, M.; Kutty, A.A.; Al-Muftah, A.A. Driving Sustainable Business Practices with Carbon Accounting and Reporting: A Holistic Framework and Empirical Analysis. Corp. Soc. Responsib. Environ. Manag. 2025, 32, 2795–2814. [Google Scholar] [CrossRef]
- Yusif, S.; Hafeez-Baig, A. Impact of Stakeholder Engagement Strategies on Managerial Cognitive Decision-Making: The Context of CSP and CSR. Soc. Responsib. J. 2024, 20, 1101–1121. [Google Scholar] [CrossRef]
- Doh, J.P.; Quigley, N.R. Responsible Leadership and Stakeholder Management: Influence Pathways and Organizational Outcomes. Acad. Manag. Perspect. 2014, 28, 255–274. [Google Scholar] [CrossRef]
- Daraojimba, C.; Okogwu, C.; Egbokhaebho, B.A.; Raji, A.; Kolade, A.O.; Olalere, B.I. Cross-Industry Insights: A Comprehensive Review of Effective Stakeholder Management Benefits. Mater. Corros. Eng. Manag. 2023, 4, 12–19. [Google Scholar] [CrossRef]
- Minatogawa, V.; Franco, M.; Rampasso, I.S.; Holgado, M.; Garrido, D.; Pinto, H.; Quadros, R. Towards Systematic Sustainable Business Model Innovation: What Can We Learn from Business Model Innovation. Sustainability 2022, 14, 2939. [Google Scholar] [CrossRef]
- Krishnan, R.; Phan, P.Y.; Krishnan, S.N.; Agarwal, R.; Sohal, A. Industry 4.0-Driven Business Model Innovation for Supply Chain Sustainability: An Exploratory Case Study. Bus. Strategy Environ. 2025, 34, 276–295. [Google Scholar] [CrossRef]
- Singh, R.K.; Mishra, R.; He, Q. Sustainable Supply Chain and Environmental Collaboration in the Supply Chain Management: Agenda for Future Research and Implications. Bus. Strategy Environ. 2025. [Google Scholar] [CrossRef]
- Shabbir, M.S. Corporate Sustainability Reimagined: A Bibliometric–Systematic Literature Review of Governance, Technology, and Stakeholder-Driven Strategies for SDG Impact. Bus. Strategy Environ. 2025. [Google Scholar] [CrossRef]
- Hammerschmidt, J.; Burtscher, J.; Gast, J.; Kraus, S.; Puumalainen, K. Navigating the Twin Transformation: How Digitalization and Sustainability Shape the Future. Strateg. Change 2025. [Google Scholar] [CrossRef]
- Sciarelli, M.; Cosimato, S.; Landi, G.; Iandolo, F. Socially Responsible Investment Strategies for the Transition towards Sustainable Development: The Importance of Integrating and Communicating ESG. TQM J. 2021, 33, 39–56. [Google Scholar] [CrossRef]
- Aldowaish, A.; Kokuryo, J.; Almazyad, O.; Goi, H.C. Environmental, Social, and Governance Integration into the Business Model: Literature Review and Research Agenda. Sustainability 2022, 14, 2959. [Google Scholar] [CrossRef]
- Feilhauer, S.; Hahn, R. Formalization of Firms’ Evaluation Processes in Cross-Sector Partnerships for Sustainability. Bus. Soc. 2021, 60, 684–726. [Google Scholar] [CrossRef]
- Salo-Lahti, M.; Haapio, H. Possibility-Driven Design and Responsible Use of AI for Sustainability. In Design(s) for Law; Ledizioni: Milan, Italy, 2024. [Google Scholar]
- Almnadheh, Y.; Samara, H.; AlQudah, M.Z. Enhancing ESG Integration in Corporate Strategy: A Bibliometric Study and Content Analysis. Int. J. Law Manag. 2025. [Google Scholar] [CrossRef]
- Hevner, N.; March, N.; Park, N.; Ram, N. Design Science in Information Systems Research. MIS Q. 2004, 28, 75–105. [Google Scholar] [CrossRef]
- Gregor, S.; Hevner, A.R. Positioning and Presenting Design Science Research for Maximum Impact. MIS Q. 2013, 37, 337–355. [Google Scholar] [CrossRef]
- Thuan, N.H.; Antunes, P. Positioning Design Science as an Educational Tool for Innovation and Problem Solving. Commun. Assoc. Inf. Syst. 2022, 51, 1. [Google Scholar] [CrossRef]
- Tuunanen, T.; Winter, R.; vom Brocke, J. Dealing with Complexity in Design Science Research: A Methodology Using Design Echelons. MIS Q. 2024, 48, 427–458. [Google Scholar] [CrossRef]
- Salman, M.S. Strategic Sustainability: ESG Integration in Contemporary Business. Int. J. Sustain. Dev. Sci. 2024, 7, 214–221. [Google Scholar] [CrossRef]
- Gavurova, B.; Polishchuk, I.; Polishchuk, V. Multi-Criteria Hybrid Model of Region Assessment in the Context of Sustainable Tourism. J. Bus. Econ. Manag. 2025, 26, 880–900. [Google Scholar] [CrossRef]
- Weda, I. Autonomous Maritime Logistics in the Age of Sustainable Digital Transformation: An Integrative Framework for Smart and Green Shipping. Int. J. Entrep. Bus. Dev. 2025, 8, 509–519. [Google Scholar] [CrossRef]
- Kırmızı, M.; Kocaoglu, B. Digital Transformation Maturity Model Development Framework Based on Design Science: Case Studies in Manufacturing Industry. J. Manuf. Technol. Manag. 2022, 33, 1319–1346. [Google Scholar] [CrossRef]
- Fiksel, J.; Bakshi, B.R. Designing for Resilience and Sustainability: An Integrated Systems Approach. In Engineering and Ecosystems: Seeking Synergies toward a Nature-Positive World; Springer International Publishing: Cham, Switzerland, 2023; pp. 469–500. [Google Scholar] [CrossRef]
- Bataleblu, A.A.; Rauch, E.; Cochran, D.S. Resilient Sustainability Assessment Framework from a Transdisciplinary System-of-Systems Perspective. Sustainability 2024, 16, 9400. [Google Scholar] [CrossRef]
- Seow, R.Y.C. Transforming ESG Analytics with Machine Learning: A Systematic Literature Review Using TCCM Framework. Corp. Soc. Responsib. Environ. Manag. 2025. [CrossRef]
- Malla, D.; El-Gayar, O. Framework for Benchmarking Machine Learning Models: Integrating Performance Metrics, Explainability Techniques, and Robustness Assessments. In Proceedings of the Americas Conference on Information Systems (AMCIS 2025), SIG-DSA Data Science, Data Science Applications, Austin, TX, USA; 2025; p. 7. Available online: https://aisel.aisnet.org/amcis2025/data_science/sig_dsa/7 (accessed on 1 September 2025).
- Zioło, M.; Bąk, I.; Spoz, A. Incorporating ESG Risk in Companies’ Business Models: State of Research and Energy Sector Case Studies. Energies 2023, 16, 1809. [Google Scholar] [CrossRef]
- Dissanayaka, I.I.K.; Bandara, M.N.G.K. Strategic Integration of Sustainable Development Goals in Manufacturing Multinational Enterprises in Sweden: A Qualitative Case Study on Swedish Multinational Enterprises. Unpublished Manuscript, (accessed on 30 August 2025)5624. [Google Scholar]
- Sadovska, V. Change for Sustainable Agricultural Business. Addressing Business Model Transformation and Sustainable Value Creation. Acta Univ. Agric. Sueciae 2023, 27, 1–150. [Google Scholar] [CrossRef]
- Hart, S.L.; Milstein, M.B. Creating Sustainable Value. Acad. Manag. Perspect. 2003, 17, 56–67. [Google Scholar] [CrossRef]
- Kocmanová, A.; Šimberová, I. Determination of Environmental, Social and Corporate Governance Indicators: Framework in the Measurement of Sustainable Performance. J. Bus. Econ. Manag. 2014, 15, 1017–1033. [Google Scholar] [CrossRef]
- Annesi, N.; Battaglia, M.; Ceglia, I.; Mercuri, F. Navigating Paradoxes: Building a Sustainable Strategy for an Integrated ESG Corporate Governance. Manag. Decis. 2025, 63, 531–559. [Google Scholar] [CrossRef]
- Lashitew, A.A. Corporate Uptake of the Sustainable Development Goals: Mere Greenwashing or an Advent of Institutional Change? J. Int. Bus. Policy 2021, 4, 184–200. [Google Scholar] [CrossRef]
- Yue, S.; Khatib, S.F.; Lee, Y. The Power and Paradox of ESG: Unlocking New Quality Productivity for Sustainable Innovation. Int. J. Product. Perform. Manag. 2025, 1–34. [Google Scholar] [CrossRef]
- Daugaard, D.; Ding, A. Global Drivers for ESG Performance: The Body of Knowledge. Sustainability 2022, 14, 2322. [Google Scholar] [CrossRef]
- Chen, X.; Thapa, D. Clarifying the Business Model Construct: A Theory-Driven Integrative Literature Review through Ecosystems and Open Systems Perspectives. Rev. Manag. Sci. 2025, 1–34. [Google Scholar] [CrossRef]
- Machado, M.C.; Carvalho, T.C.M.D.B. Maturity Models and Sustainable Indicators—A New Relationship. Sustainability 2021, 13, 13247. [Google Scholar] [CrossRef]
- Guandalini, I. Sustainability through Digital Transformation: A Systematic Literature Review for Research Guidance. J. Bus. Res. 2022, 148, 456–471. [Google Scholar] [CrossRef]
- Jasrotia, S.S.; Rai, S.S.; Rai, S.; Giri, S. Stage-Wise Green Supply Chain Management and Environmental Performance: Impact of Blockchain Technology. Int. J. Inf. Manag. Data Insights 2024, 4, 100241. [Google Scholar] [CrossRef]
- Peças, P.; John, L.; Ribeiro, I.; Baptista, A.J.; Pinto, S.M.; Dias, R.; Cunha, F. Holistic Framework to Data-Driven Sustainability Assessment. Sustainability 2023, 15, 3562. [Google Scholar] [CrossRef]
- Doni, F.; Fiameni, M. Can Innovation Affect the Relationship between Environmental, Social, and Governance Issues and Financial Performance? Empirical Evidence from the STOXX200 Index. Bus. Strategy Environ. 2024, 33, 546–574. [Google Scholar] [CrossRef]
- Sayar, D. A Design-Oriented Framework on Theory Development around Emerging Phenomena. J. Eng. Des. 2025, 1–18. [Google Scholar] [CrossRef]
- Coffay, M.; Bocken, N. Sustainable by Design: An Organizational Design Tool for Sustainable Business Model Innovation. J. Clean. Prod. 2023, 427, 139294. [Google Scholar] [CrossRef]
- Dimov, D.; Maula, M.; Romme, A.G.L. Crafting and Assessing Design Science Research for Entrepreneurship. Entrep. Theory Pract. 2023, 47, 1543–1567. [Google Scholar] [CrossRef]
- Bender-Salazar, R. Design Thinking as an Effective Method for Problem-Setting and Needfinding for Entrepreneurial Teams Addressing Wicked Problems. J. Innov. Entrep. 2023, 12, 24. [Google Scholar] [CrossRef]
- Magas, M.; Kiritsis, D. Industry Commons: An Ecosystem Approach to Horizontal Enablers for Sustainable Cross-Domain Industrial Innovation (A Positioning Paper). Int. J. Prod. Res. 2022, 60, 479–492. [Google Scholar] [CrossRef]
- Holmström, J.; Ketokivi, M.; Hameri, A.P. Bridging Practice and Theory: A Design Science Approach. Decis. Sci. 2009, 40, 65–87. [Google Scholar] [CrossRef]
- Osterwalder, A. The Business Model Ontology: A Proposition in a Design Science Approach; Doctoral Dissertation, Université de Lausanne, Faculté des Hautes Études Commerciales, Lausanne, Switzerland, 2004. [Google Scholar]
- De Sordi, J.O. Design Science Research Methodology: Theory Development from Artifacts; Springer Nature: Cham, Switzerland, 2021. [Google Scholar]
- D’Souza, C.; Ahmed, T.; Khashru, M.A.; Ahmed, R.; Ratten, V.; Jayaratne, M. The Complexity of Stakeholder Pressures and Their Influence on Social and Environmental Responsibilities. J. Clean. Prod. 2022, 358, 132038. [Google Scholar] [CrossRef]
- Furr, N.R.; Eisenhardt, K.M. Strategy and Uncertainty: Resource-Based View, Strategy-Creation View, and the Hybrid between Them. J. Manag. 2021, 47, 1915–1935. [Google Scholar] [CrossRef]
- Napier, E.; Knight, G.; Luo, Y.; Delios, A. Corporate Social Performance in International Business. J. Int. Bus. Stud. 2022, 54, 61. [Google Scholar] [CrossRef]
- Hurley, R. An Organizational Capacity for Trustworthiness: A Dynamic Routines Perspective. J. Bus. Ethics 2023, 188, 589–601. [Google Scholar] [CrossRef]
- Raha, A.; Kazemi, S.H. How to Have the Best of Both Worlds: Value-Based Decision-Making through Stakeholder Value Trade-Offs. Bus. Ethics Environ. Responsib. 2025, 34, 1432–1449. [Google Scholar] [CrossRef]
- Vassilakopoulou, P.; Hustad, E. Bridging Digital Divides: A Literature Review and Research Agenda for Information Systems Research. Inf. Syst. Front. 2023, 25, 955–969. [Google Scholar] [CrossRef] [PubMed]
- Jagals, M. Expanding Data Governance across Company Boundaries—An Inter-Organizational Perspective of Roles and Responsibilities. In Proceedings of the IFIP Working Conference on the Practice of Enterprise Modeling, Cham, Switzerland, November 2021; Springer International Publishing: Cham, Switzerland, 2021; pp. 245–254. [Google Scholar] [CrossRef]
- Bodendorf, F.; Bayr, C. Shaping Platform Governance Principles to Manage Interorganizational Data Exchange. Inf. Syst. J. 2025. [Google Scholar] [CrossRef]
- Ross, J.W.; Beath, C.M.; Mocker, M. Designed for Digital: How to Architect Your Business for Sustained Success; MIT Press: Cambridge, MA, USA, 2019. [Google Scholar]
- Benbya, H.; Nan, N.; Tanriverdi, H.; Yoo, Y. Complexity and Information Systems Research in the Emerging Digital World. MIS Q. 2020, 44, 1–17. [Google Scholar] [CrossRef]
- Korsunova, A.; Goodman, J.C.; Halme, M. Activities and Roles of Stakeholders in Sustainability-Oriented Innovation of Firms. In Proceedings of the Academy of Management Annual Meeting, Briarcliff Manor, NY, USA; Academy of Management: Briarcliff Manor, NY, USA, ; No, 2016; 1; Volume 2016, p. 15594. [Google Scholar] [CrossRef]
- Adiatma, T. Integrating Sustainability into Strategic Management. In Proceedings of the 12th Gadjah Mada International Conference on Economics and Business (GAMAICEB 2024), Yogyakarta, Indonesia, May 2025; Springer Nature: Cham, Switzerland, 2025; Volume 319, p. 118. [Google Scholar]
- Nadal, S.; Jovanovic, P.; Bilalli, B.; Romero, O. Operationalizing and Automating Data Governance. J. Big Data 2022, 9, 117. [Google Scholar] [CrossRef] [PubMed]
- Wadström, P. Aligning Corporate and Business Strategy: Managing the Balance. J. Bus. Strategy 2019, 40, 44–52. [Google Scholar] [CrossRef]
- Pixton, P.; Nickolaisen, N.; Little, T.; McDonald, K.J. Stand Back and Deliver: Accelerating Business Transformation; Pearson Education: Boston, MA, USA, 2009. [Google Scholar]
Figure 1.
Adapted Three-Cycle Model for the SABDF. Source: adapted from Hevner et al., 2004.
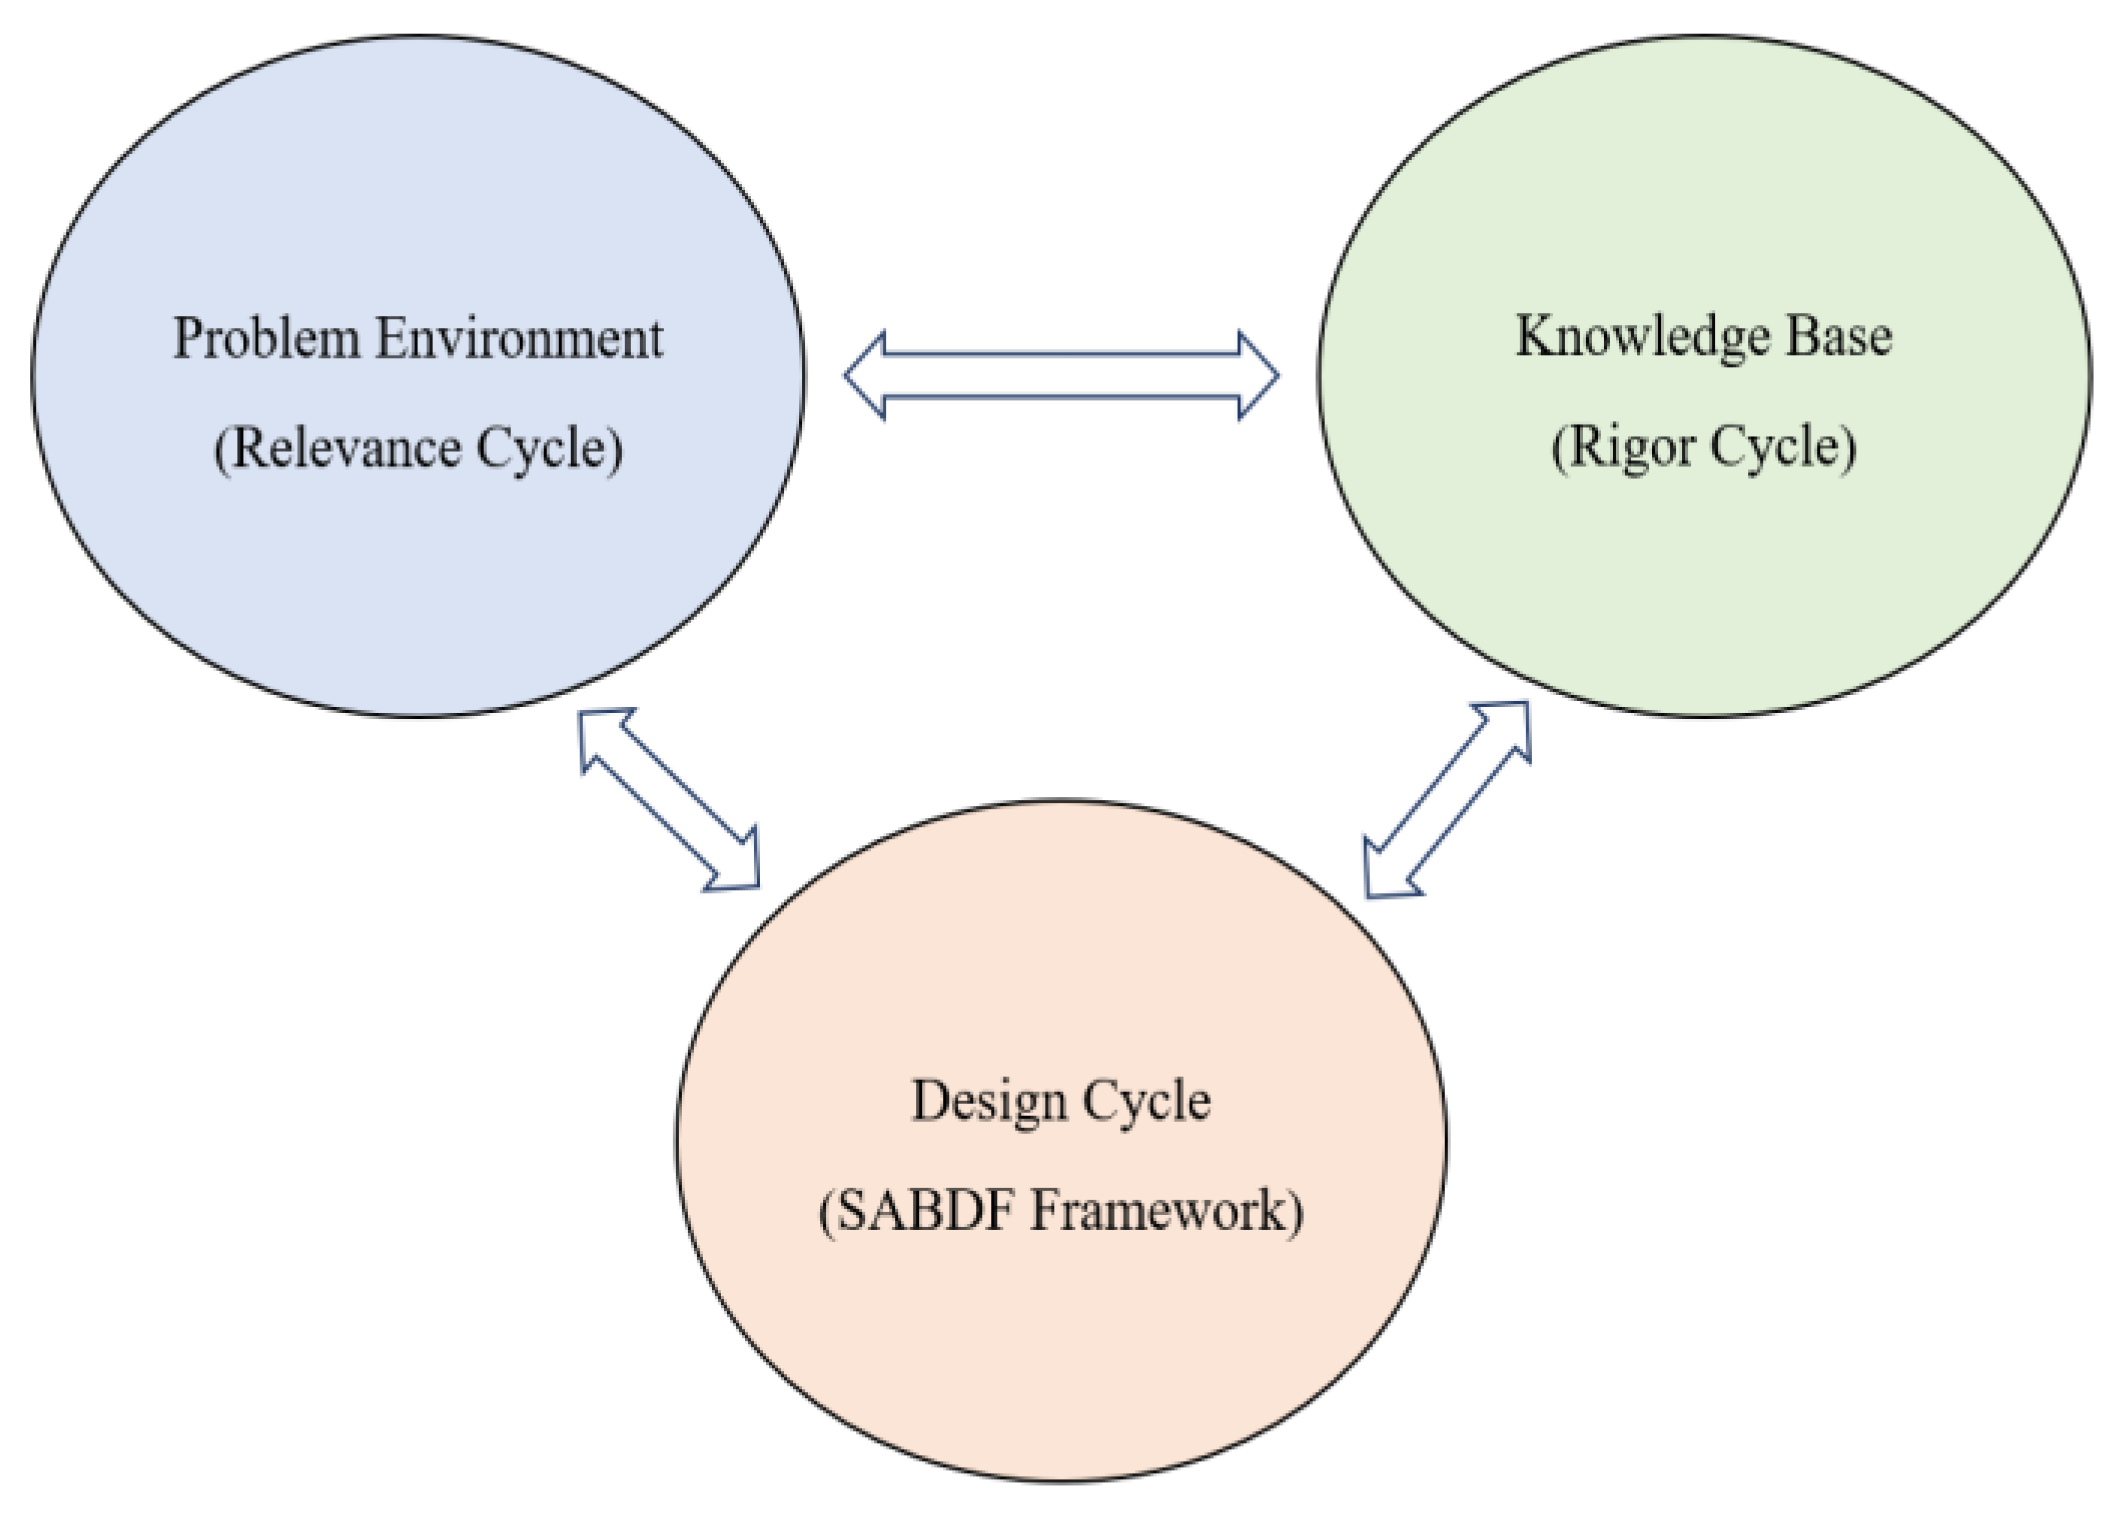
Figure 2.
The Sustainability-Aligned Business Development Framework (SABDF).
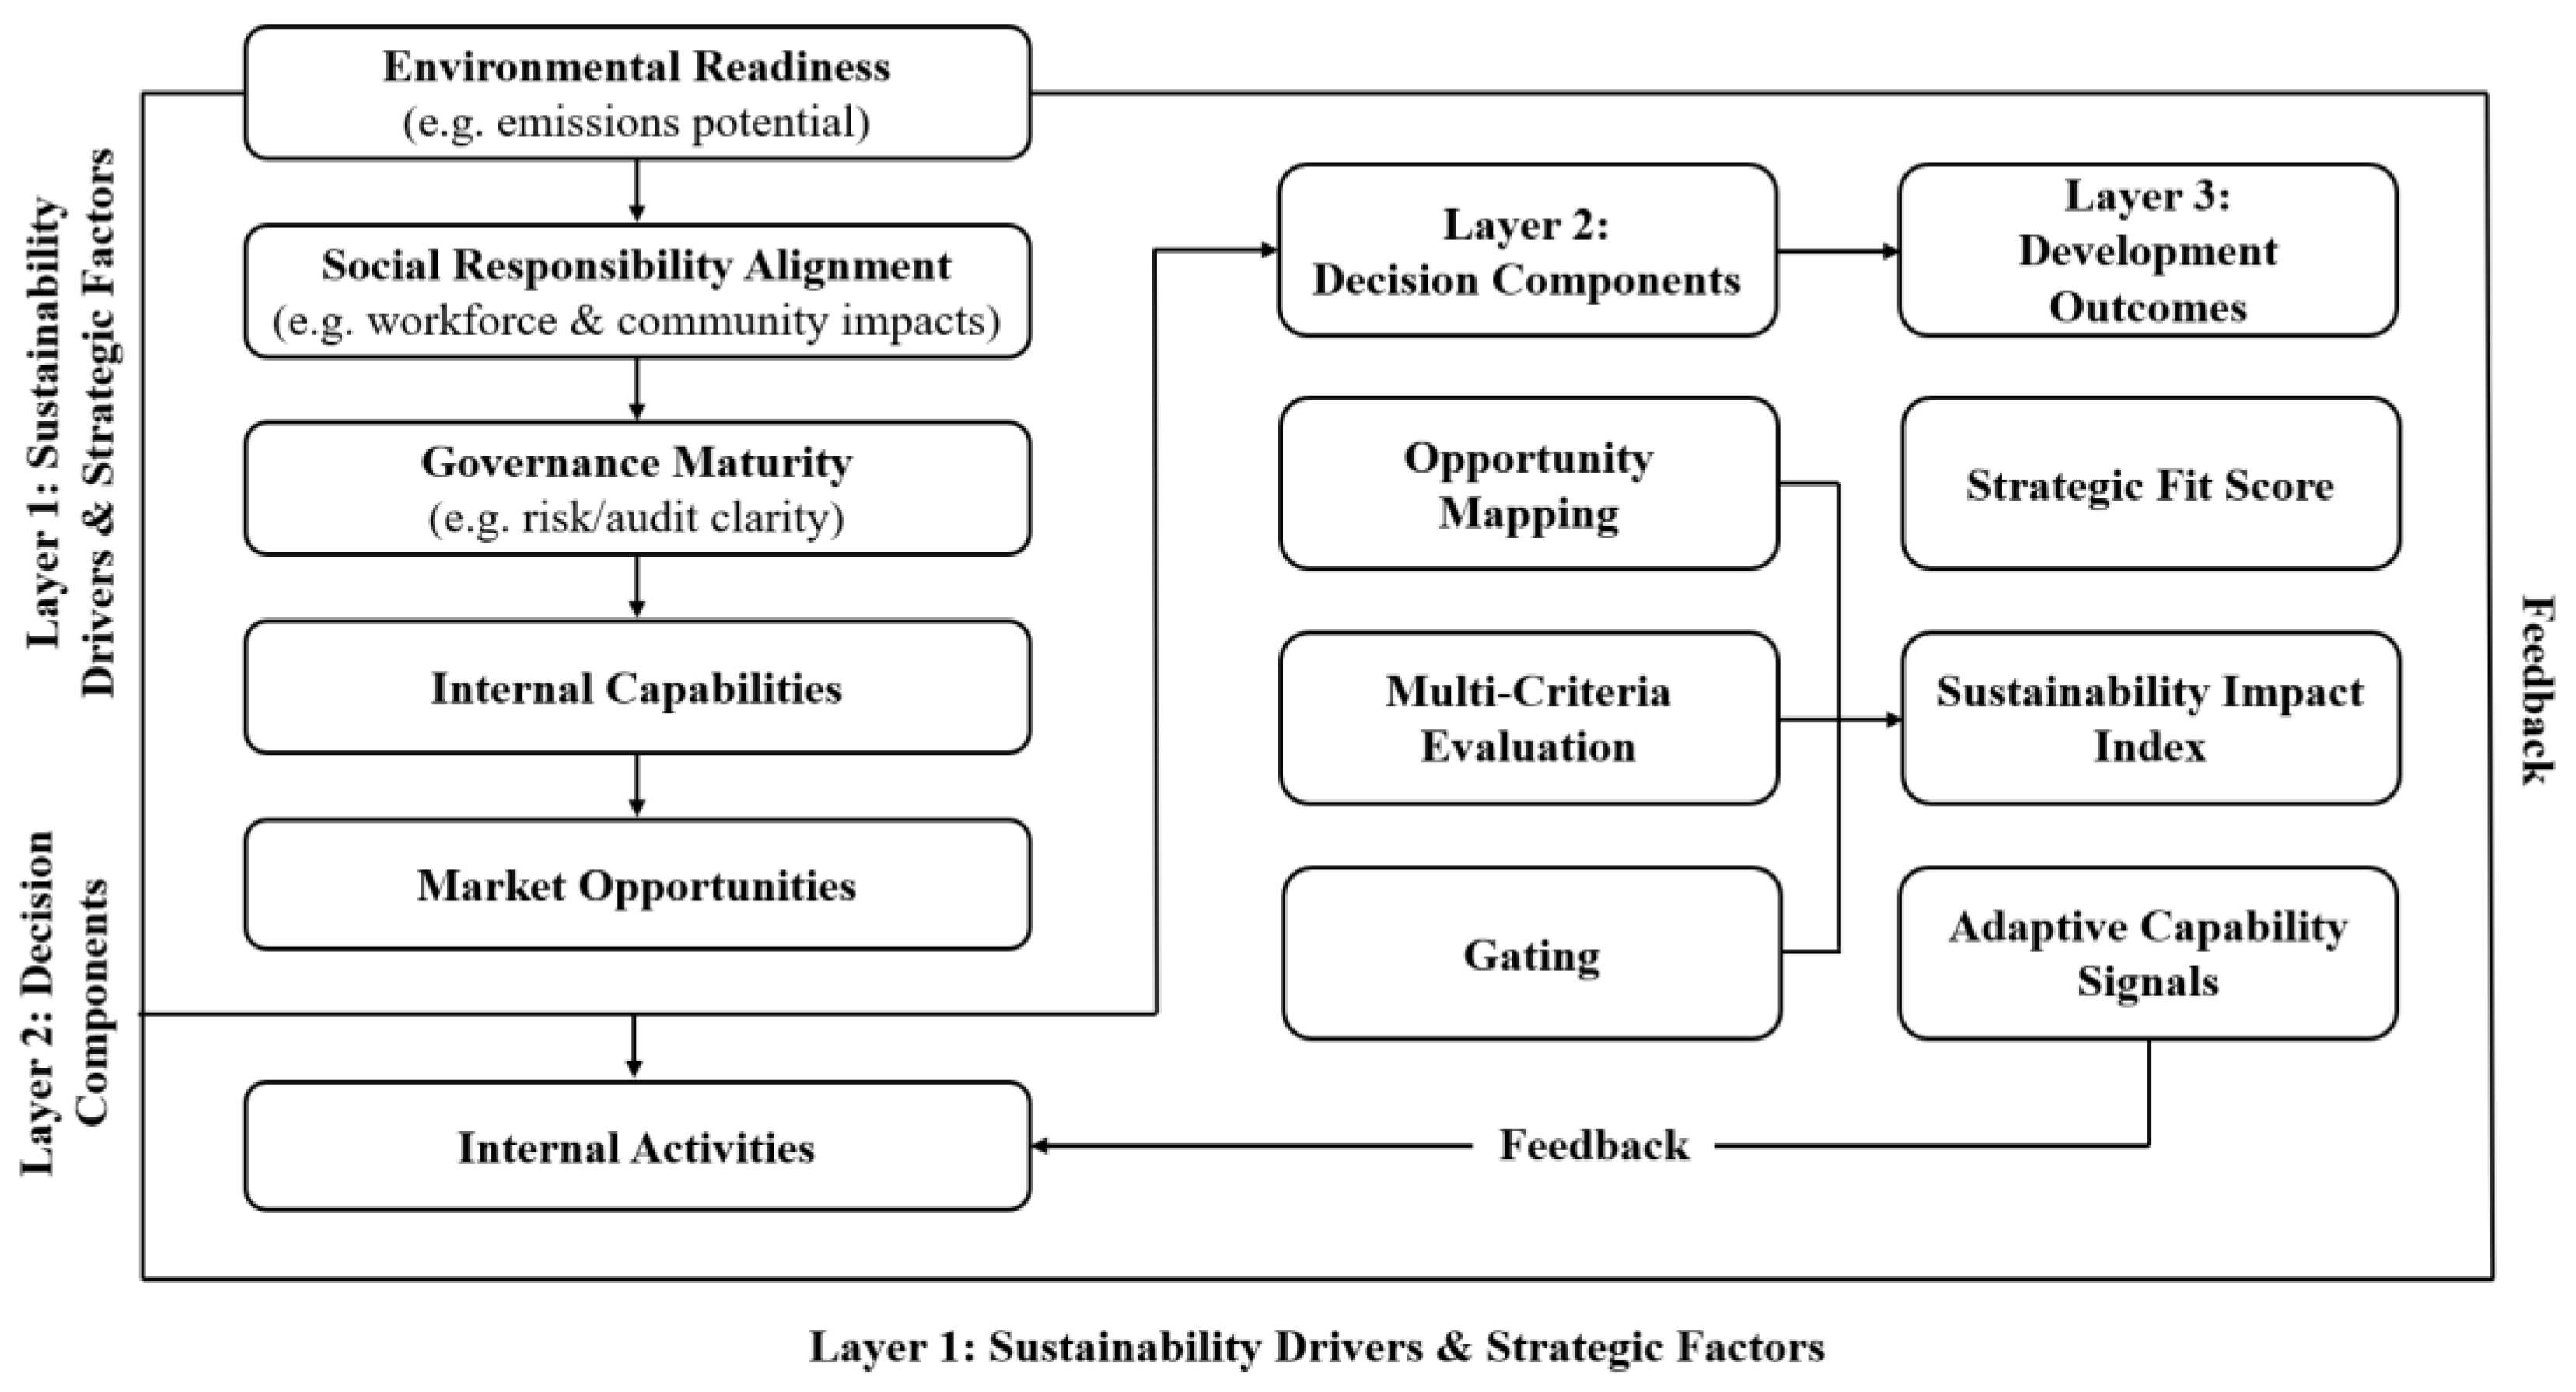
Figure 3.
Weighting Structure and Indicator Hierarchy.
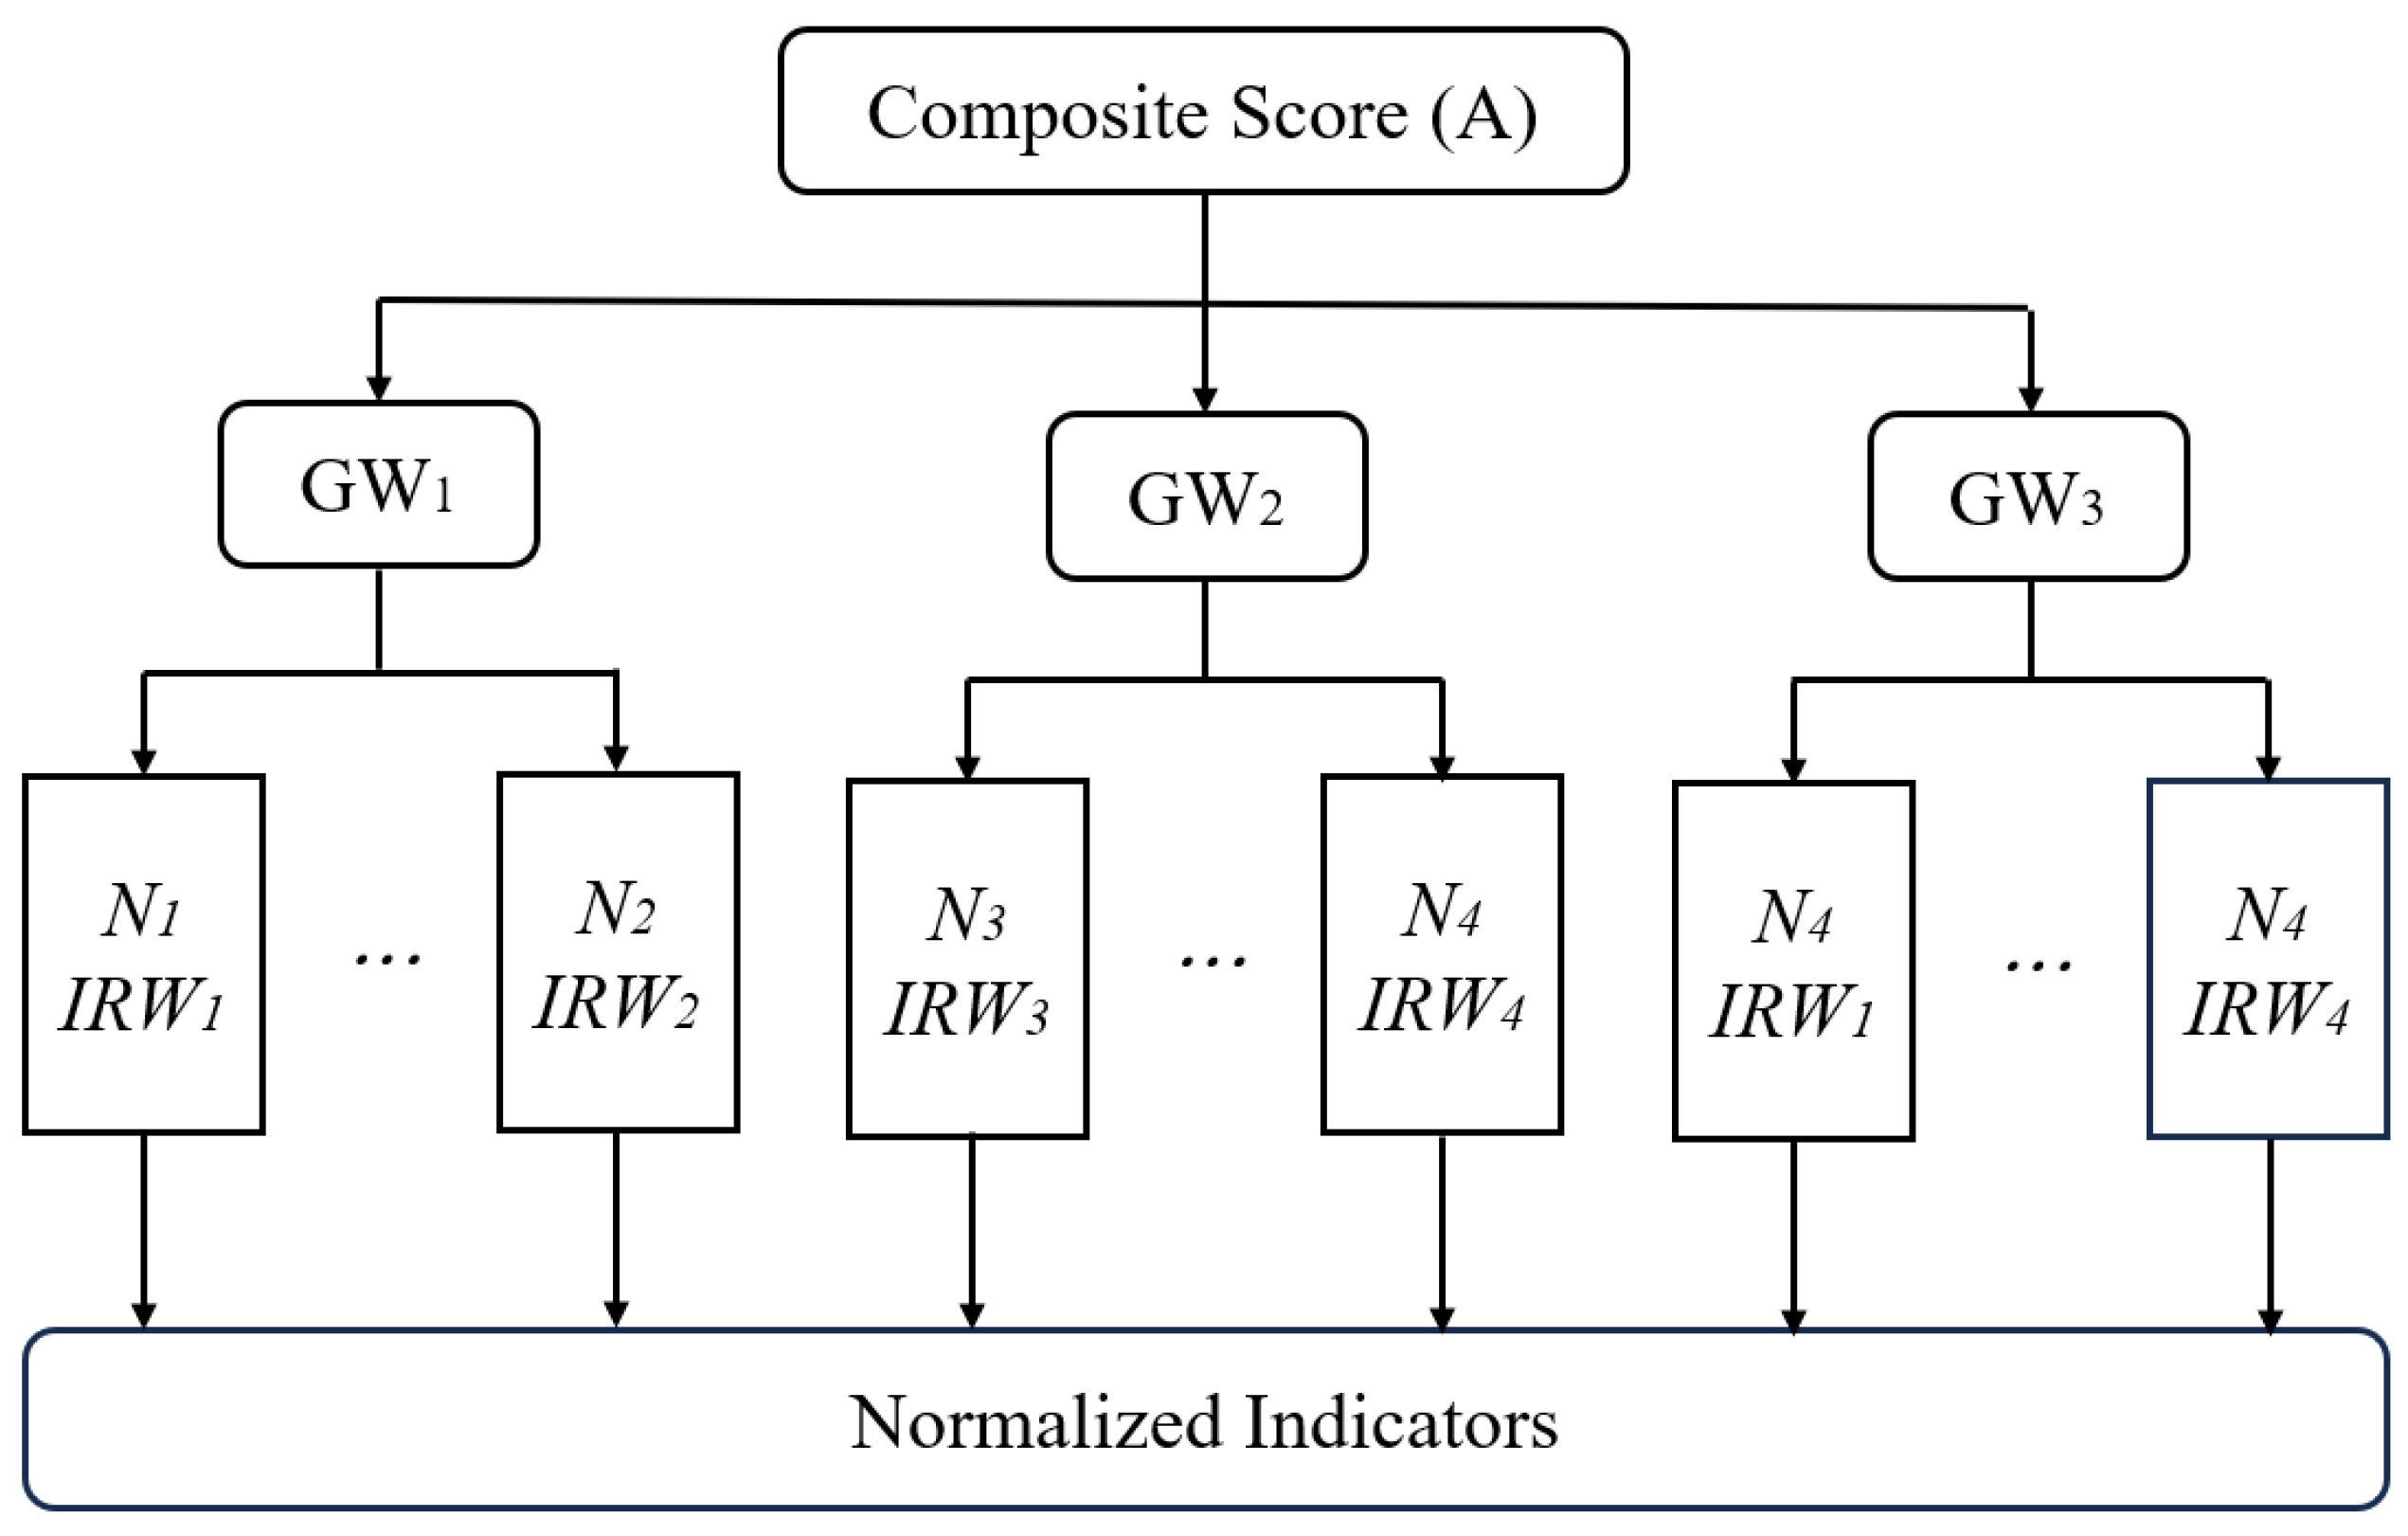
Figure 4.
Decision Flow Process in SABDF.
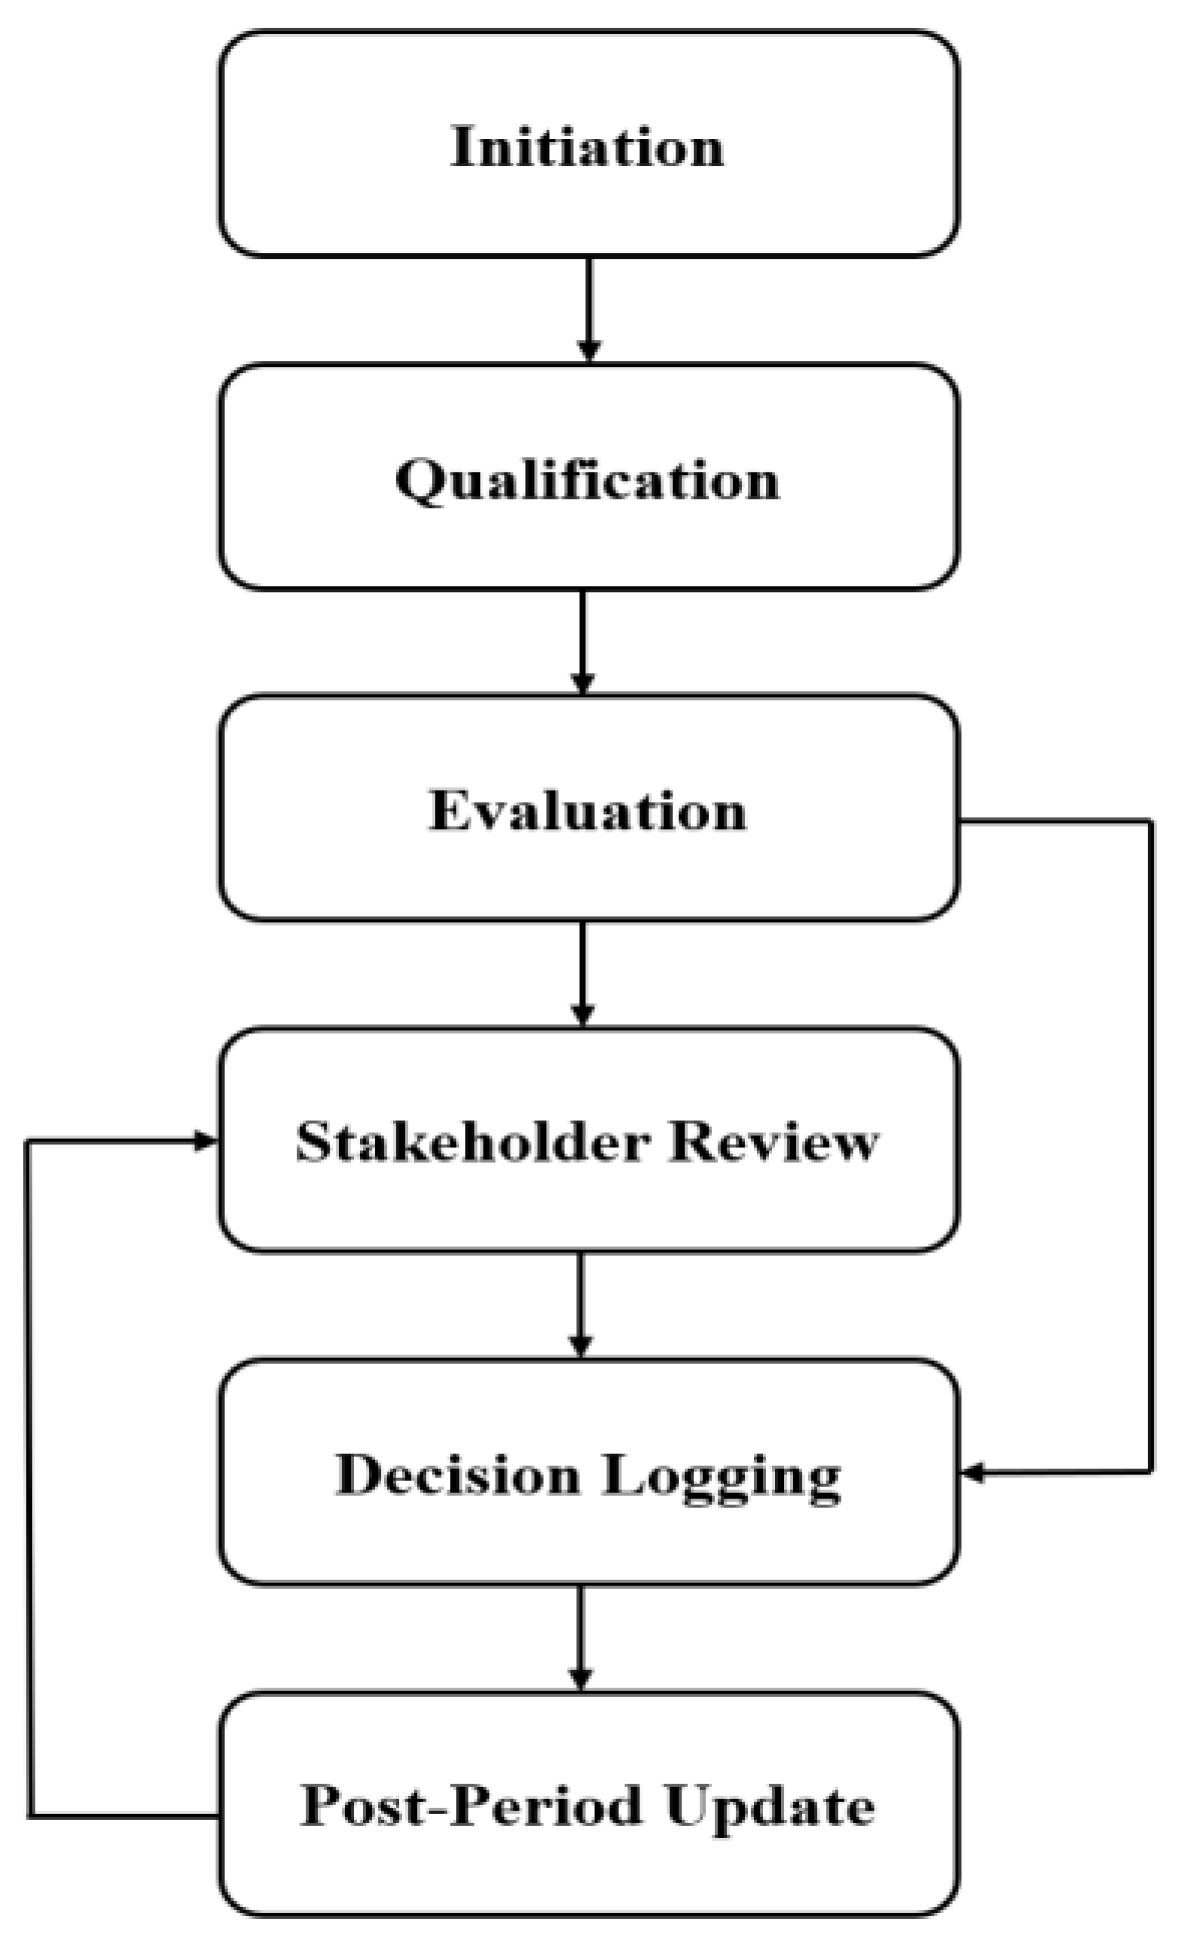
Figure 5.
Feedback and Governance Mechanisms.
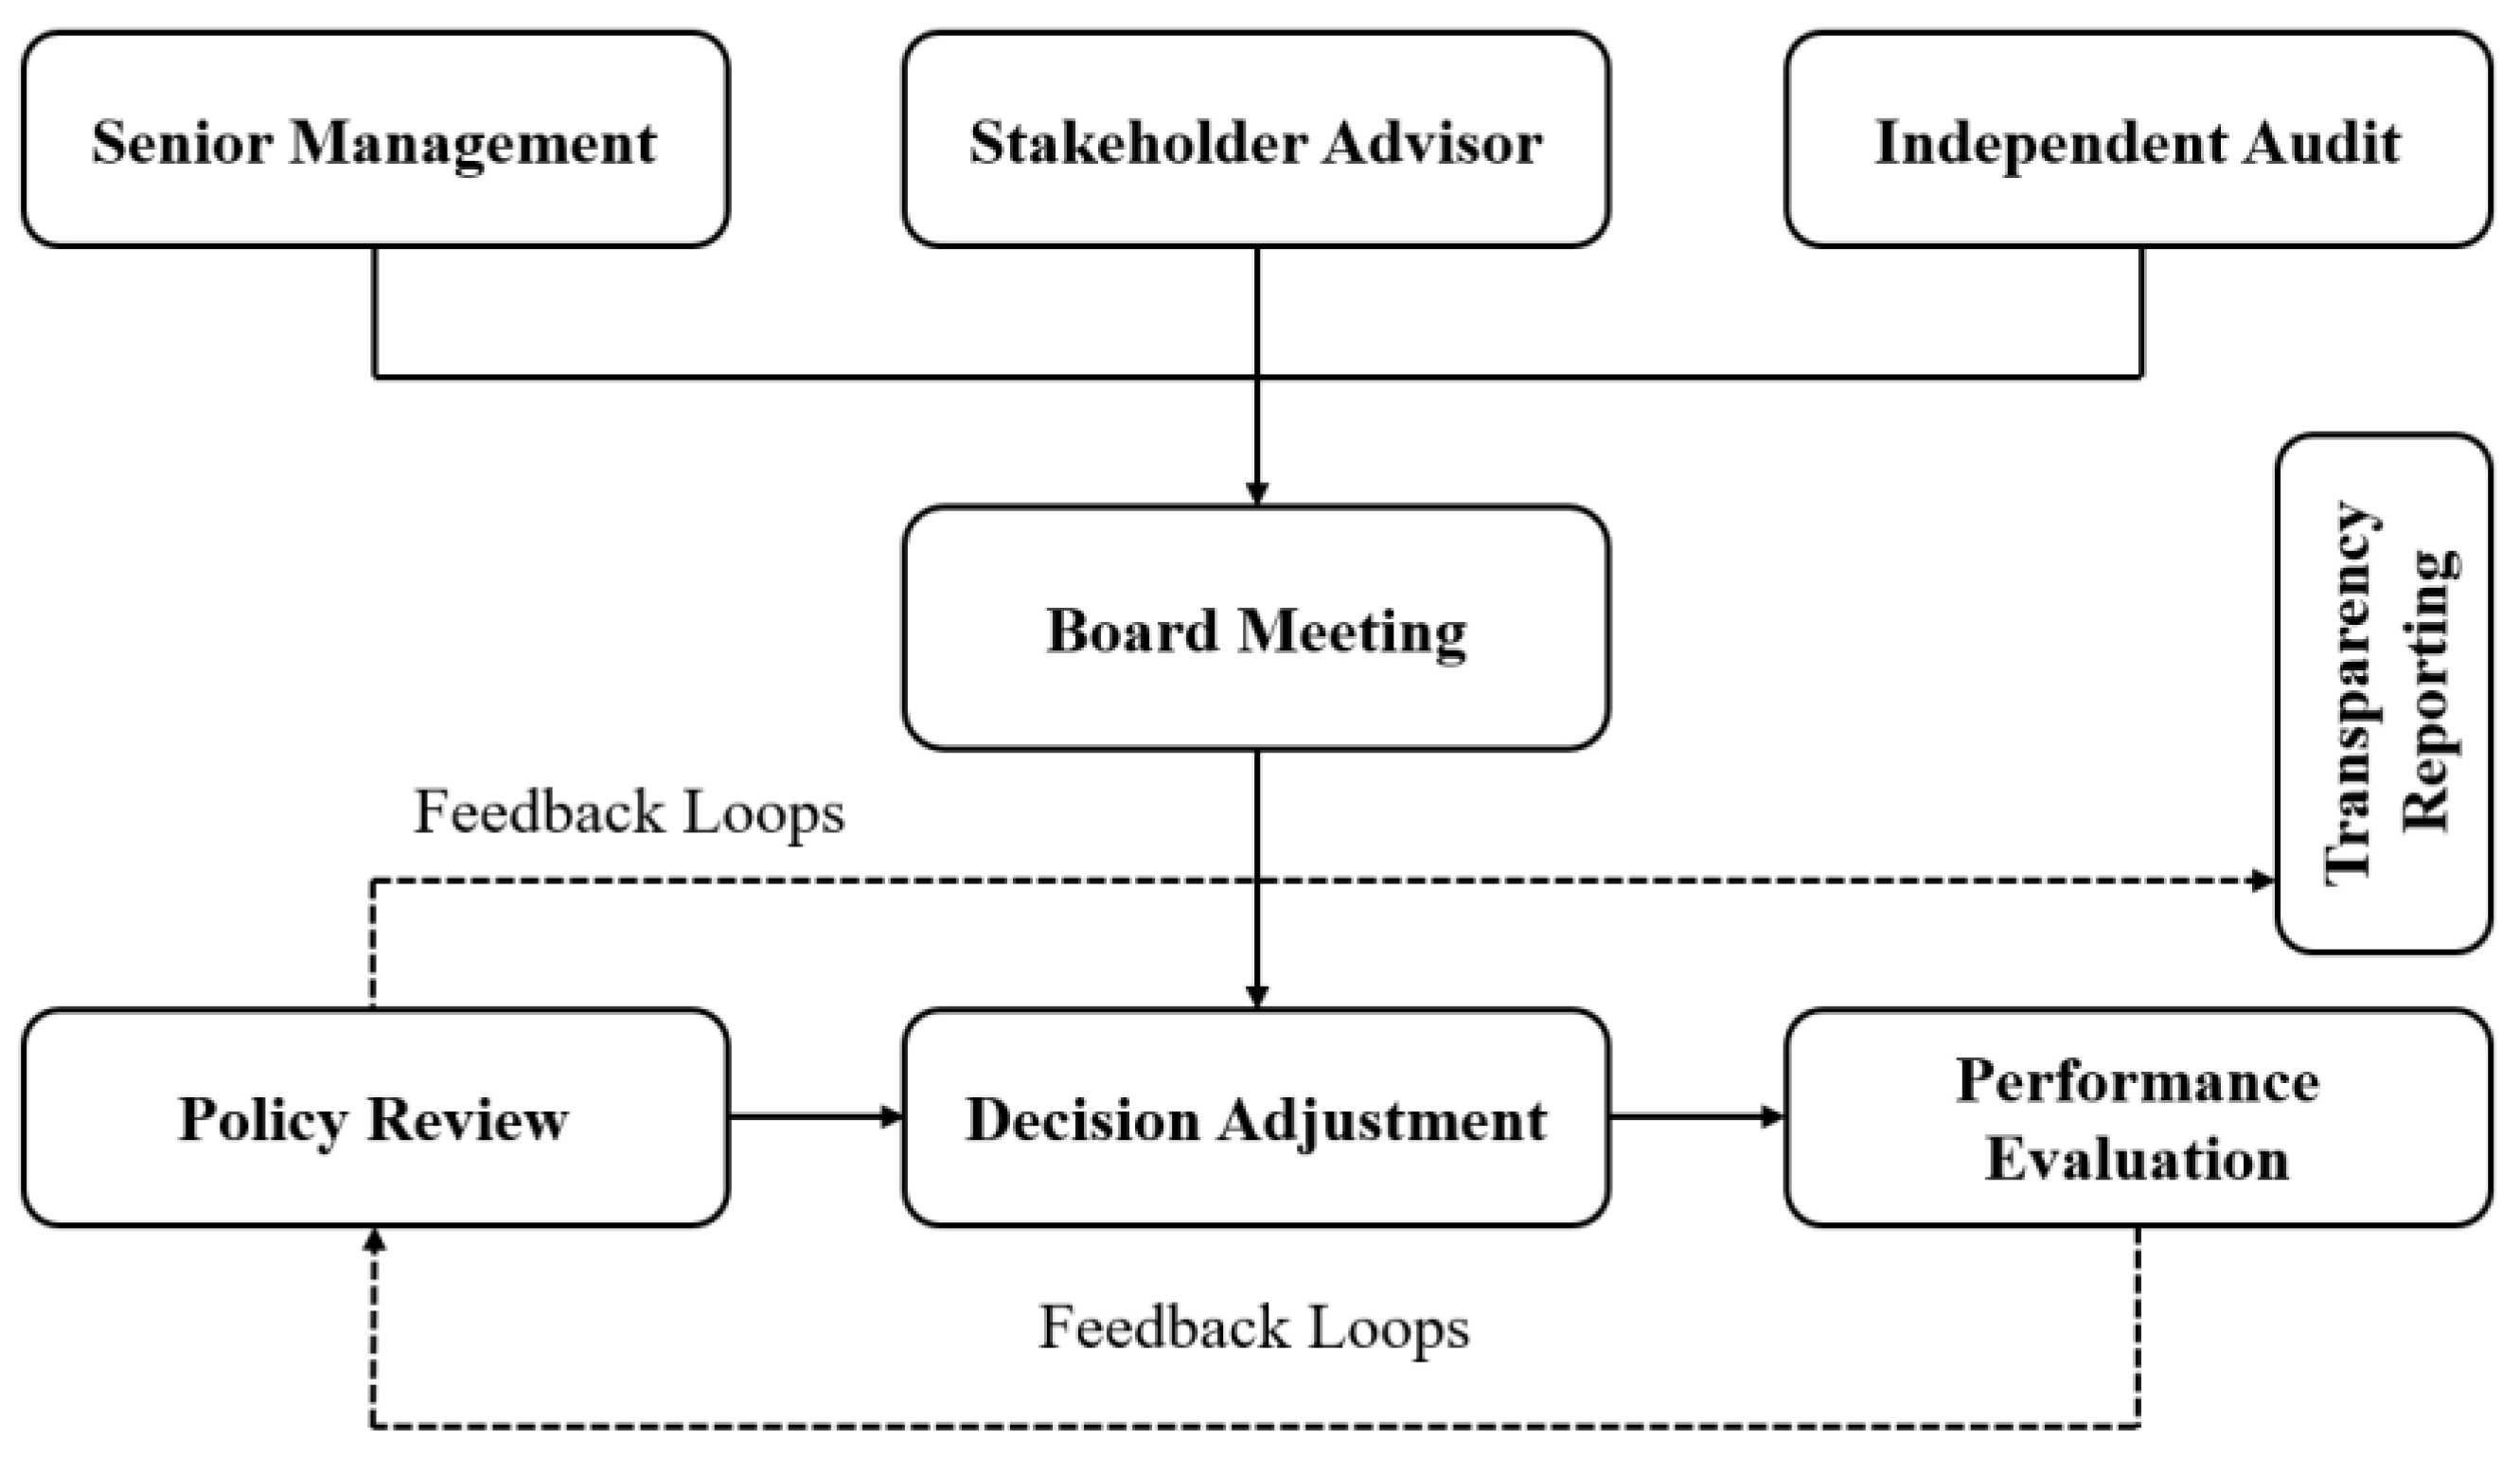

Table 1.
Theory-to-Component Mapping.
| Theoretical Source | Core Concept | Design Translation | Framework Component |
| Stakeholder Theory | Balancing multiple interests and expectations | Supports decision rules for stakeholder alignment | Governance input |
| Resource-Based View | Dynamic capabilities and resource reconfiguration | Shapes drivers linked to strategy flexibility and resilience | Sustainability drivers |
| ESG Integration Literature | Quantitative indicators, reporting consistency, strategic linkage | Enables scoring templates, operational metrics, and process structure | Scoring logic and evaluation components |
Table 2.
Mapping of Design Principles (DP) to Addressed Requirements (R).
| Design Principle (DP) | Description | Addresses Requirement(s) |
| DP1: Transparency | Version control, metadata, audit trail for indicators, thresholds, weights. | R1, R5 |
| DP2: Embedded Integration | ESG logic embedded with strategic and operational metrics. | R1, R2 |
| DP3: Iterative Feedback | Variance triggers initiate recalibration; adaptive design. | R3, R5 |
| DP4: Modular Adaptability | Cluster-level modularity and substitution without redesign. | R2, R3 |
| DP5: Stakeholder Inclusion | Weight generation from participatory processes with consensus metrics. | R4 |
| DP6: Score-Based Comparability | Normalization, dispersion, and time-series comparability safeguards. | R5 |
Disclaimer/Publisher’s Note: The statements, opinions and data contained in all publications are solely those of the individual author(s) and contributor(s) and not of MDPI and/or the editor(s). MDPI and/or the editor(s) disclaim responsibility for any injury to people or property resulting from any ideas, methods, instructions or products referred to in the content. |
© 2025 by the author. Licensee MDPI, Basel, Switzerland. This article is an open access article distributed under the terms and conditions of the Creative Commons Attribution (CC BY) license (https://creativecommons.org/licenses/by/4.0/).
Copyright: This open access article is published under a Creative Commons CC BY 4.0 license, which permit the free download, distribution, and reuse, provided that the author and preprint are cited in any reuse.


