Submitted:
10 October 2025
Posted:
13 October 2025
You are already at the latest version
Abstract
Biofuels offer potential to mitigate climate change, increase energy security, and economically support farmers around world. Licuri (Syagrus coronata) could be an important biofuel feedstock because its kernel (edible seed) has high energy content. This research investigates optimal reaction conditions to convert fatty acids (FA) and fatty acid methyl esters (FAME) (including licuri biodiesel) to hydrocarbons via deoxygenation in a trickle-bed reactor over granular Pd/C catalysts. Our results indicate that a 20 wt.% palmitic acid (PA) feed is optimum for continuous deoxygenation at 300 °C and 15 bar in 5% H2/He because of decarboxylation inhibition at higher concentrations. Deoxygenation rates are higher for PA than for methyl palmitate (MP) because of the slow initial hydrogenolysis of the methoxy bond over Pd/C. The hydrocarbon product distributions from deoxygenation of licuri biodiesel were fully consistent with FA decarboxylation and decarbonylation. A lab-prepared 5 wt.% Pd/C catalyst with higher metal dispersion provided modestly higher hydrocarbon yields from licuri biodiesel than a commercial 1 wt.% Pd/C catalyst.
Keywords:
fatty acid
; fatty acid methyl ester
; decarboxylation
; decarbonylation
; inhibition
1. Introduction
Liquid biofuels have the potential to help mitigate climate change, provide energy security, and support farmers around the world. Many countries began researching alternatives to fossil fuel-based transportation fuels as a result of the OPEC oil embargo of the 1970s. Due to increasing population and global industrialization, the consumption of fossil fuels and demand for energy continues to increase. Alternative (renewable) energy resources are an option to the mitigate fossil fuel demand and help improve logistics. International air travel has expanded at a considerable rate in recent decades, but the commercial aviation industry aims to achieve carbon-neutral growth and reduce 2050 CO2 emissions by 50% relative to 2005. A set of metrics that include technological and operational improvements and replacement of petroleum jet fuel by renewable fuels are being evaluated [1]. Drop-in replacement fuels that do not require jet engine modifications are the most desirable. These replacement fuels must meet the ASTM D7566 standard for synthetic jet fuels. Currently, there are five approved and certified ASTM D 7566 methods to produce bio-jet fuel for blending to jet fuel [1]. Synthetic paraffinic kerosene (SPK) from hydro-processed esters and fatty acids (HEFA) is a leading candidate for process that leverages existing catalytic technology. HEFA production typically comprises catalytic hydrodeoxygenation (HDO) of triglycerides, fatty acids and esters by reaction with hydrogen (H2) at high temperatures and pressures over sulfided CoMo or NiMo catalysts [2]. Because H2 consumption (to form water) is inherent to the HDO process, it typically requires an external source H2.
Catalytic deoxygenation of fatty acids (FA) to hydrocarbons occurs via three reaction pathways: (1) decarboxylation (DCX), (2) decarbonylation (DCN), and (3) HDO.
where n is the FA chain length. The water-gas shift reaction (WGSR) must also be considered under typical reaction conditions:
The DCX pathway (1) offers the advantage of very low H2 consumption (zero, in principle) in comparison to DCN (2) and especially HDO (3). Murzin and coworkers [3,4] were the first to report DCX of stearic acid to n-heptadecane over Pd/C catalyst at 300°C in the absence of H2. Unfortunately, the Pd/C catalyst deactivates rapidly under these conditions because of build-up of carbonaceous residues making a low gas-phase H2 partial pressure necessary to maintain activity. Typically, ~5% H2 at 15 bar is added to the gas phase to minimize hydrogen consumption and because the DCX pathway is inhibited at higher H2 partial pressures [5]. CO added either externally or generated in situ via DCN also has been demonstrated to inhibit the DCN reaction [6].
Most of the FA deoxygenation experiments reported to date have involved semi-batch or fed-batch reactor operation [3,4,5,6,7,8]. Industrially, continuous fixed-bed reactors are more important and are used to evaluate the catalyst properties over longer reaction times [9,10,11,12]. A trickle-bed reactor, where gas and liquid contact catalyst particles in a fixed bed, is an obvious choice for a continuous reactor for deoxygenation of FA and fatty acid methyl esters (FAME). With cocurrent downflow, the liquid phase wets the catalyst surface and the gaseous phase is continuous. The desired effect is to provide three-phase contact between the solid catalyst, liquid and gas phases. In previous work, Madsen et al. reported continuous deoxygenation of C18 fatty feedstocks: stearic acid, ethyl stearate, and tristearin in a trickle-bed reactor at 300°C and 20 bar using a 2 wt.% Pd/Sibunit carbon catalyst and 5% H2/Ar or Ar gas flow [12].
Licuri (Syagrus coronata) could become an important biofuel feedstock because its almond presents a high energetic potential (around 38 wt.% oil content) with high annual production capacity (around 4 tons per hectare) [13]. This Brazilian native palm has well adapted to drier regions and is very common in Brazilian northeast semi-arid region. Its larger scale cultivation should bring benefits to that poor region, increasing economic and social development. The licuri oil fatty acid composition is almost completely inside the jet fuel hydrocarbon range. For this reason, licuri oil could be an important option as renewable jet fuel feedstock [14].
The research reported herein sought to establish optimum reactor operating conditions to convert FA and FAME (both reagent-grade and derived from licuri oil) into hydrocarbons in a continuous trickle-bed reactor using granular Pd/C catalysts. Reactor operating variables, including feed composition and concentration were evaluated at constant weight hourly space velocity (WHSV). Commercial and lab-prepared granular Pd/C catalysts with 1 wt.% and 5 wt.% nominal Pd loadings, respectively, were tested and found to provide similar deoxygenation performance.
2. Experimental
2.1. Materials
A 1 wt.% (nominal) granular Pd/C catalyst (4-8 mesh) was purchased from Sigma-Aldrich. A granular activated carbon (4-8 mesh) was obtained from Calgon Carbon Corporation (OVC 4x8). Palladium (II) chloride, PdCl2 (99.9%), was purchased from Sigma Aldrich. Palmitic acid (PA) (98%) was purchased from Fisher Scientific, and methyl palmitate (MP) (97%) was purchased from Sigma Aldrich. Licuri oil was obtained from northeastern Brazil and transesterified with methanol (99.8%, Sigma Aldrich) [14]. Reagent-grade (99%) n-decane and n-dodecane were purchased from Fisher Scientific. Ultra-high purity (UHP) H2 and He were purchased from Airgas National Welders. Deionized (DI) water (18 MΩ-cm) was obtained from a Nanopure unit.
2.2. Catalyst Preparation and Characterization
A 5 wt. % (nominal) granular Pd/C catalyst (4-8 mesh) was prepared using a modified incipient wetness method [15]. PdCl2 (0.7 g) was dissolved in 4.125 molar HCl at 80°C (4.4 mL). The pH of the solution was increased to approximately 6 by adding 1.5 g NaHCO3. The solution was applied to the Calgon OVC 4-8 support (previously dried overnight at 40°C), and the wet Pd-impregnated activated carbon was aged overnight. Subsequently, the resultant material was washed three times with 1.1 g NaHCO3 in 30 mL DI water. The purpose of the bicarbonate washing steps was to remove residual chlorine and increase the surface pH of the final catalyst. The solid was rinsed with DI water between each bicarbonate wash. After the final wash, the solid was rinsed with ~250 mL DI water. The resultant catalyst was then dried at 40°C in air overnight.
The catalysts were analyzed for Pd content by inductively coupled plasma-optical emission spectrometry (ICP-OES) at Galbraith Laboratories and characterized by CO pulse chemisorption using a Micromeritics AutoChem II 2920 instrument. Pd dispersion was calculated from CO uptake assuming a CO:Pd (surface atom) stoichiometric ratio of 1:1.5. Average Pd particle size (dp) was estimated from fractional dispersion (D), as dp (nm) = 1.1/D.
2.3. Trickle-Bed Reactor for Continuous Deoxygenation
A schematic diagram of the trickle-bed reactor is shown in Figure 1. A 1-inch inner diameter 316 stainless steel (SS) tubular reactor was purchased from the Parr Instrument Company. The maximum working temperature and pressure for the reactor are 550°C and 5000 psig. A Lindberg/Blue three-zone furnace and controllers were used to control the reactor temperature. The reactor temperature was monitored with a Type K thermocouple in a thermowell at the center of the reactor. The three-zone furnace was mounted on a custom-built frame made from 1-inch square steel tube, and the tubular reactor was secured by two custom-built SS brackets bolted to the frame. Gas flow rates were controlled by two Brooks Instrument mass flow controllers (MFCs) with maximum flow rates of 1000 sccm (He) and 500 sccm (H2). Gas and liquid flowed downward (cocurrently) through the tubular reactor into a liquid collection vessel (equipped with two three-way valves for sampling) and through a condenser and back-pressure regulator (BPR) to the exhaust. The composition of the effluent gas stream exiting the BPR was monitored using an on-line quadrupole mass spectrometer (QMS) with a heated capillary inlet system (vide infra). Liquid flow was controlled by an ISCO 260D high-pressure syringe pump. Upon entering the reactor, the liquid passed through the spiral grooves of a SS insert designed to preheat the feed.
A 15-g bed (~3 in. bed height) of granular Pd/C catalyst (4-8 mesh) was used. SS spool pieces with a total height of 12” were added to the bottom of the reactor to support the bed. Quartz wool was placed on top of the spools to ensure that the middle of the catalyst bed was at the center of the reactor tube. The syringe pump was loaded with feed mixture: FA or FAME diluted with n-dodecane and connected to the reactor. The reactor was then purged with 1000 sccm 5% H2/balance He at atmospheric pressure and heated to 300°C at a rate of 5°C/min. After 1 h, the reactor pressure was increased to 15 bar using the manual BPR. After the reactor was pressurized, the syringe pump was started and liquid reactants flowed into the reactor.
2.4. Product Sampling and Analysis
The effluent gas composition was measured by a Prisma QMS 200 equipped with a tungsten ionizer filament. QMS data was recorded using Pfeiffer Quadstar 32-bit software. The H2 (m/z = 2), He (m/z = 4), CH4 (m/z = 16), CO (m/z = 28) and CO2 (m/z = 44) signals were monitored continuously. The signals were calibrated using a gas mixture (National Welders) composed of 1% CH4, 5% H2, 5% CO, 5% CO2, and balance He.
Liquid samples were collected at 20-min intervals via condensate purge and collection valves. First, the purge valve was opened completely to allow the sample to flow into the collection volume. The purge valve was then closed, and the collection valve was opened allowing the sample to flow into the vial. Each vial was labeled with a number, reactant, and collection date. After the sample vial was filled, any remaining condensate was collected in a clean tare-weighed 250-mL beaker. Liquid samples were analyzed using a Shimadzu GC2010-Plus gas chromatograph (GC) equipped with a EconoCap EC-5 column and flame-ionization detector. The GC oven temperature program consisted of a 10°C/min ramp from 120 to 300°C and a hold at 300 °C for 7 min. GC samples were prepared by combining 500 µL of sample with 100 µL of n-decane in a Snap-It GC vial using Eppendorf Research micropipettes. Samples (0.05 μL) were injected at a temperature of 300 °C using a split ratio of 50:1 and a constant linear velocity of 30.3 cm/sec. Sample composition was determined by a three-point calibration method for expected products with n-decane as an internal standard.
FA (or FAME) conversion, n-alkane selectivity, and CO2 selectivity were calculated from the average of the samples taken under steady-state operating conditions. The reaction conversion was the difference between feed reactant concentration and unreacted reactants normalized to feed reactant concentration (Eq. 5). The n-alkane yield was calculated as the product concentration (e.g., C15) divided by the feed reactant concentration (Eq. 6). The n-alkane selectivity was calculated as the ratio of n-alkane yield to conversion (Eq. 7). CO2 selectivity in gas-phase products was evaluated from the QMS data as CO2/(CO + CO2) after correcting for CO2 fragmentation.
3. Results and Discussion
3.1. Catalyst Characterization
ICP-OES and CO pulse chemisorption results for the commercial and lab-prepared catalysts are given in Table 1. The ICP-OES loadings are lower than the nominal loadings consistent with the presence of ~22% moisture. The catalysts had dispersions of 17-25% consistent with average particle sizes of 6 to 4 nm. The lab-prepared 5 wt.% Pd/C catalyst was more highly dispersed than the commercial 1 wt.% Pd/C catalyst.
3.2. PA Deoxygenation: Reactor Operating Conditions and Catalyst Comparison
Deoxygenation experiments using PA in n-dodecane (C12) were performed to establish operating conditions and compare the 1 and 5 wt.% Pd/C catalysts. To achieve efficient deoxygenation and inhibit catalyst deactivation, the reaction was conducted at 300°C and 15 bar under 5% H2/He [5]. Calgon activated carbon (AC) was tested under these conditions and gave only ~5% conversion for a 10 wt.% PA/C12 feed (Table 2). Typical GC results for continuous deoxygenation of 20 and 50 wt.% PA in C12 over the 1 wt.% Pd/C catalyst at equivalent weight-hourly space velocities (WHSV = ~0.8 h-1) are shown in Figure S1. To maintain constant WHSV, the reactor feed flow rate was decreased as the feed concentration was increased. This allowed the effect of feed concentration on conversion/selectivity to be investigated independent of reactant space velocity. At the higher liquid injection rate (1.25 mL/min), it was necessary to reload the syringe pump after ~3.3 h resulting in a brief flow interruption (as indicated by the dashed feed line). The 20 wt.% PA condition was measured with fresh catalyst immediately after in situ reduction at 300°C in 5% H2/He. The 50 wt.% PA condition was run the next day after purging the catalyst in flowing He overnight. In the former case, very high (>95%) PA conversion was achieved with >90% C15 selectivity consistent with deoxygenation via DCX and DCN (Table 2). Conversion and C15 selectivity were lower for 50 wt.% PA indicating either catalyst deactivation and/or inhibition of the DCX pathway at higher feed concentrations [6,7,11].
Figure 2 and Figure 3 illustrate the effects of dynamic switching PA inlet concentrations on deoxygenation performance at constant WHSV (~0.8 h-1). CO and CO2 concentrations (mol %) and CO2 selectivities obtained from on-line QMS measurements are also shown. Typically, CO2 selectivities were >75% indicating the DCX pathway was predominant. Decreasing PA inlet concentration from 20 to 10 wt.% resulted in a decrease in PA conversion and C15 yield; however, C15 selectivity and CO2 selectivity increase at least initially after the switch (Figure 2). CO2 selectivity was ~80% and slowly decreased with time-on-stream (TOS) under either feed condition indicating deactivation of the DCX pathway. Figure 3 was obtained from an experimental run in which the initial feed contained 20 wt. % PA at a flow rate of 1.25 mL/min and was subsequently changed to 50 wt. % PA at 0.5 mL/min. Increasing the PA concentration to 50 wt.% at constant WHSV decreased PA conversion, C15 yield and CO2 selectivity (Table 2). We conclude that increasing or decreasing PA concentration from ~20 wt. % results in lower PA conversion and C15 yield at constant WHSV; however, CO2 selectivity was slightly higher at 10 wt.% PA.
Figure S2 illustrates the deoxygenation of 20 wt.% PA at 300°C and 15 bar under 5% H2/He using the 5 wt.% Pd/C catalyst. The data evidence stable PA conversion >95% for over 6 h TOS with excellent C15 and CO2 selectivity. The performance of the lab-prepared 5 wt.% Pd/C catalyst was indistinguishable from that of the commercial 1 wt.% Pd/C catalyst (Table 2); this is likely because of the very high PA conversions.
We infer that DCX inhibition by CO generated in situ by DCN (Eq. 2) is primarily responsible for the lower PA conversions, C15 yields and CO2 selectivities at higher PA inlet concentrations [6]. DCX inhibition at higher initial concentrations is illustrated in Figure 4 using initial rates of DCX and DCN for PA measured by Ford et al. [7] in semi-batch PA deoxygenation experiments using a 5% Pd/C catalyst (Evonik E117) at 300°C and 15 bar in 5% H2/He. The initial DCN rate is linearly proportional to the molar PA concentration evidencing first-order kinetics. In contrast, the initial DCX rate is inhibited at higher PA concentrations with an inverse power-law exponent of 0.56 consistent with CO poisoning of the catalytic sites. A practical reactor design for a continuous deoxygenation given these reaction kinetics would employ recycle with a reactor inlet concentration of ~20 wt.% PA by returning a fraction of the hydrocarbon (C15) product to the reactor inlet as diluent.
3.3. Deoxygenation of MP and Licuri Biodiesel
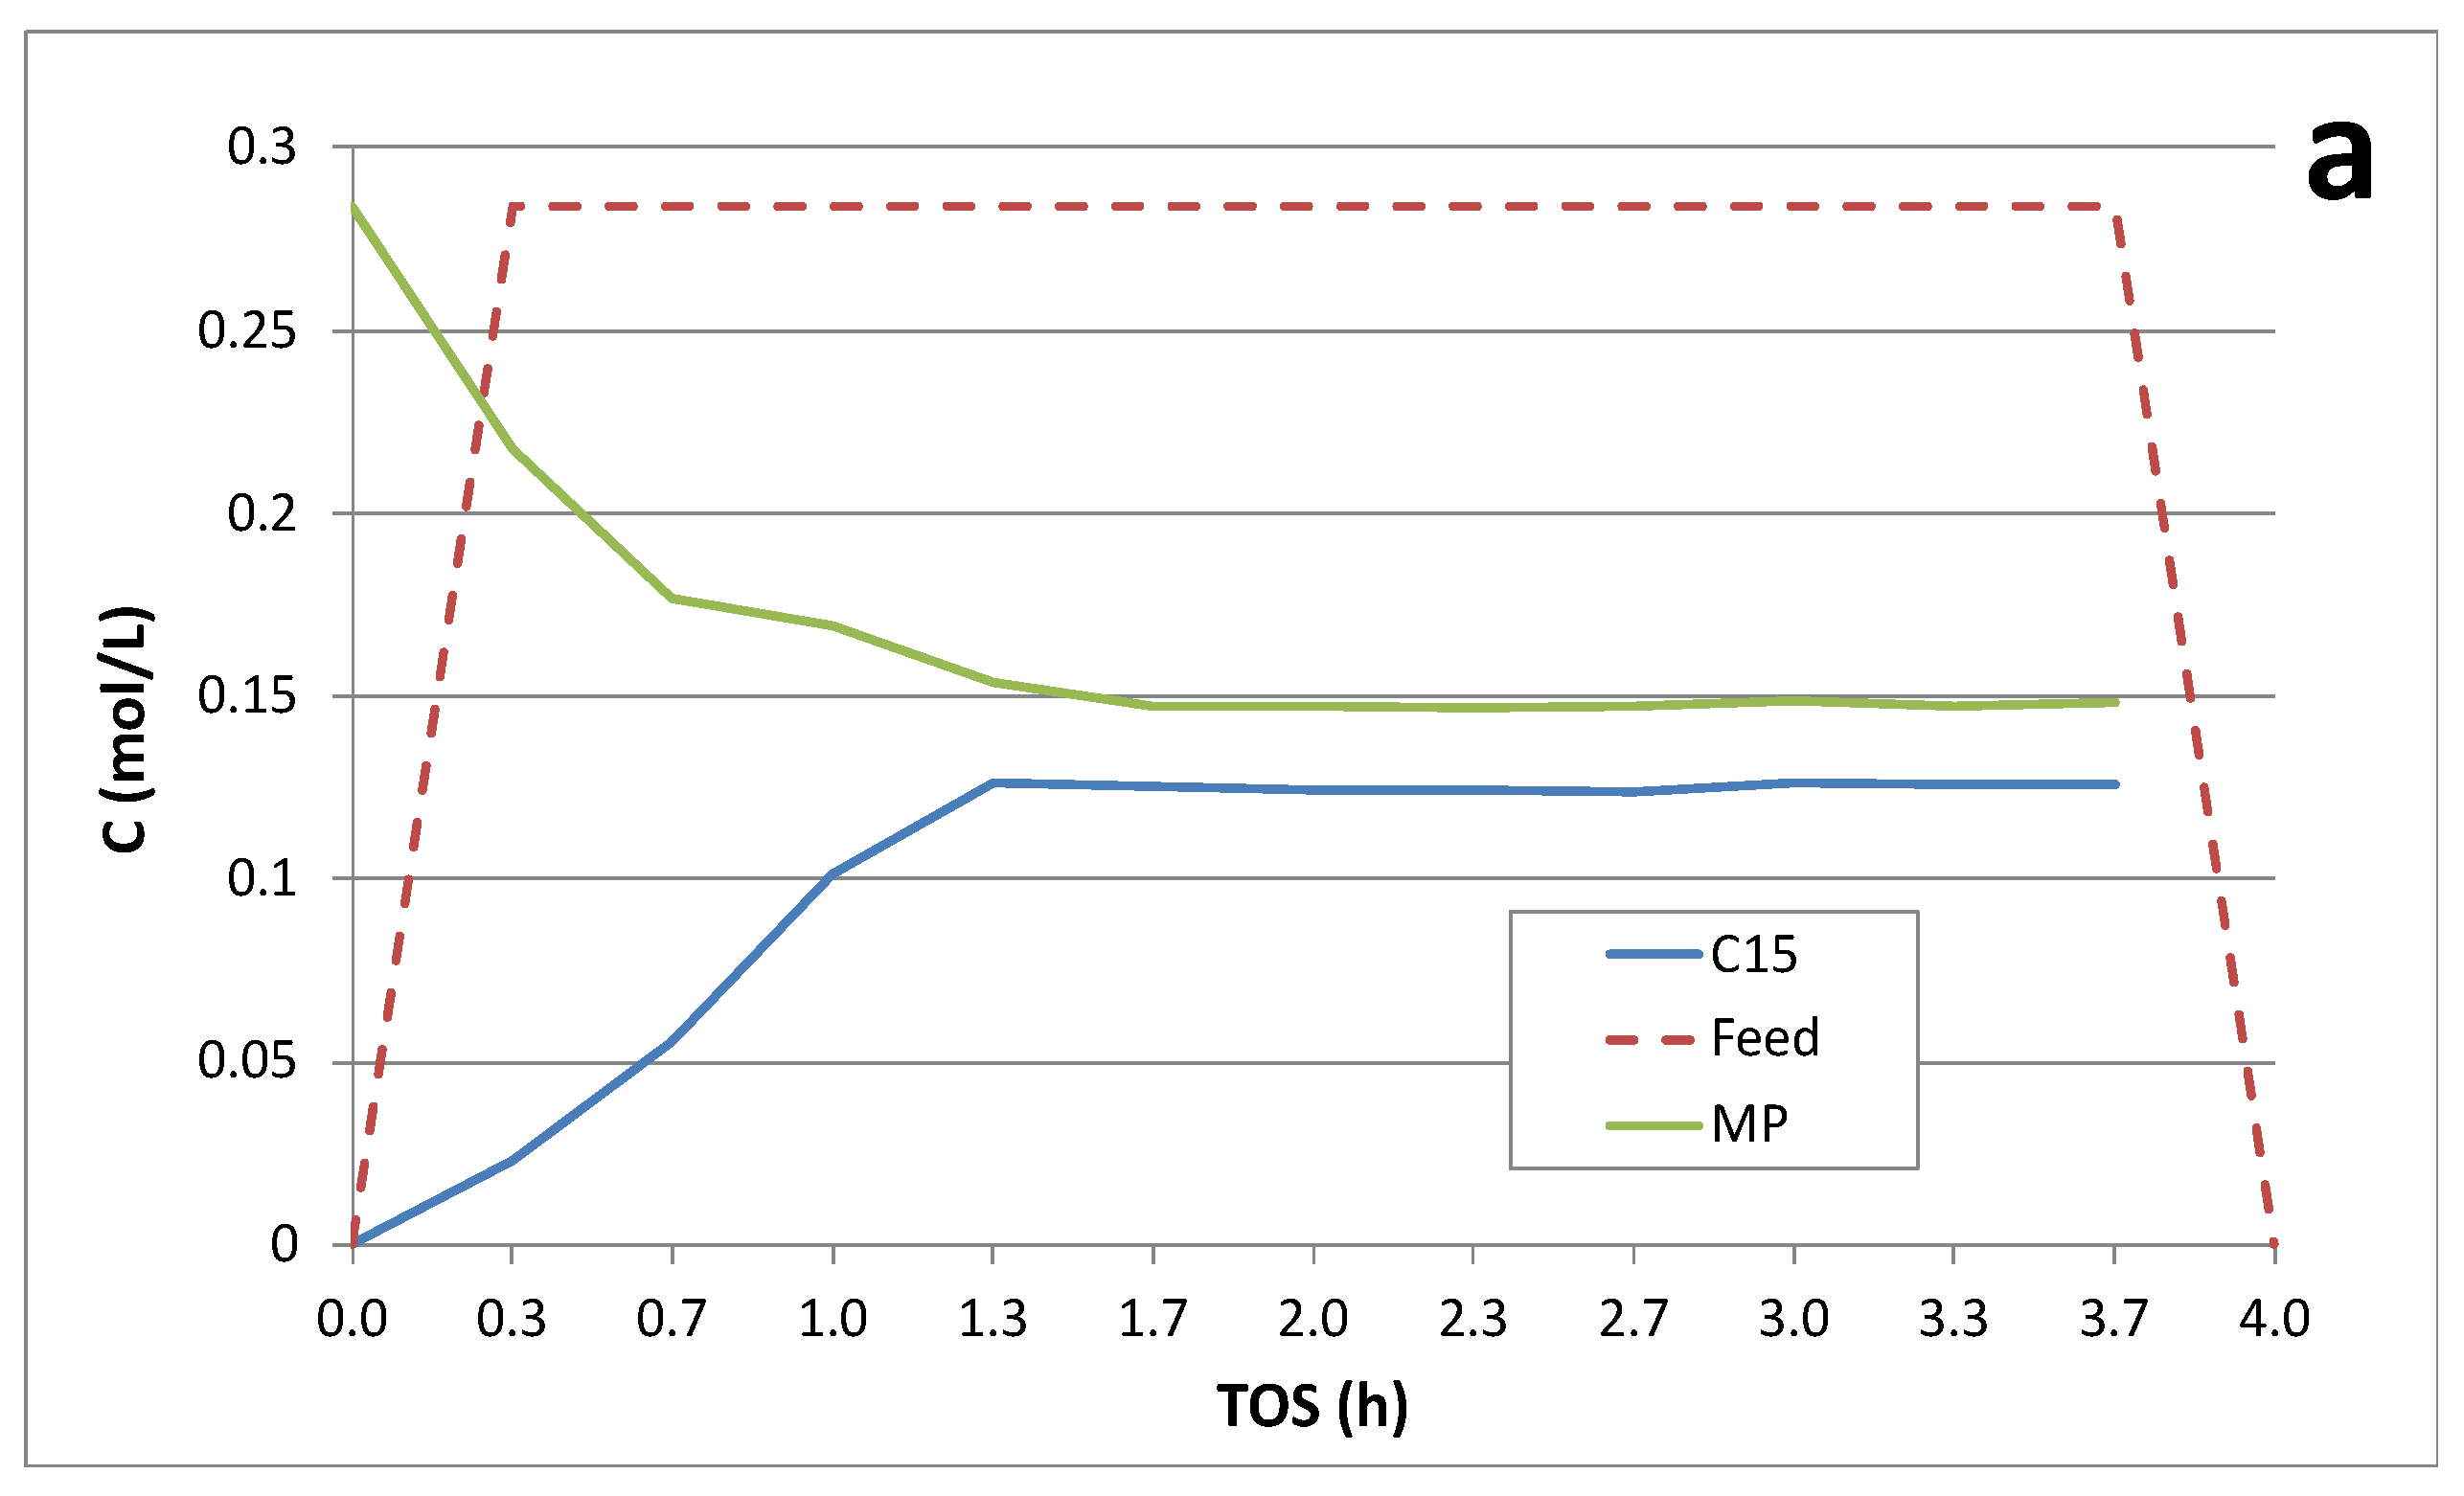
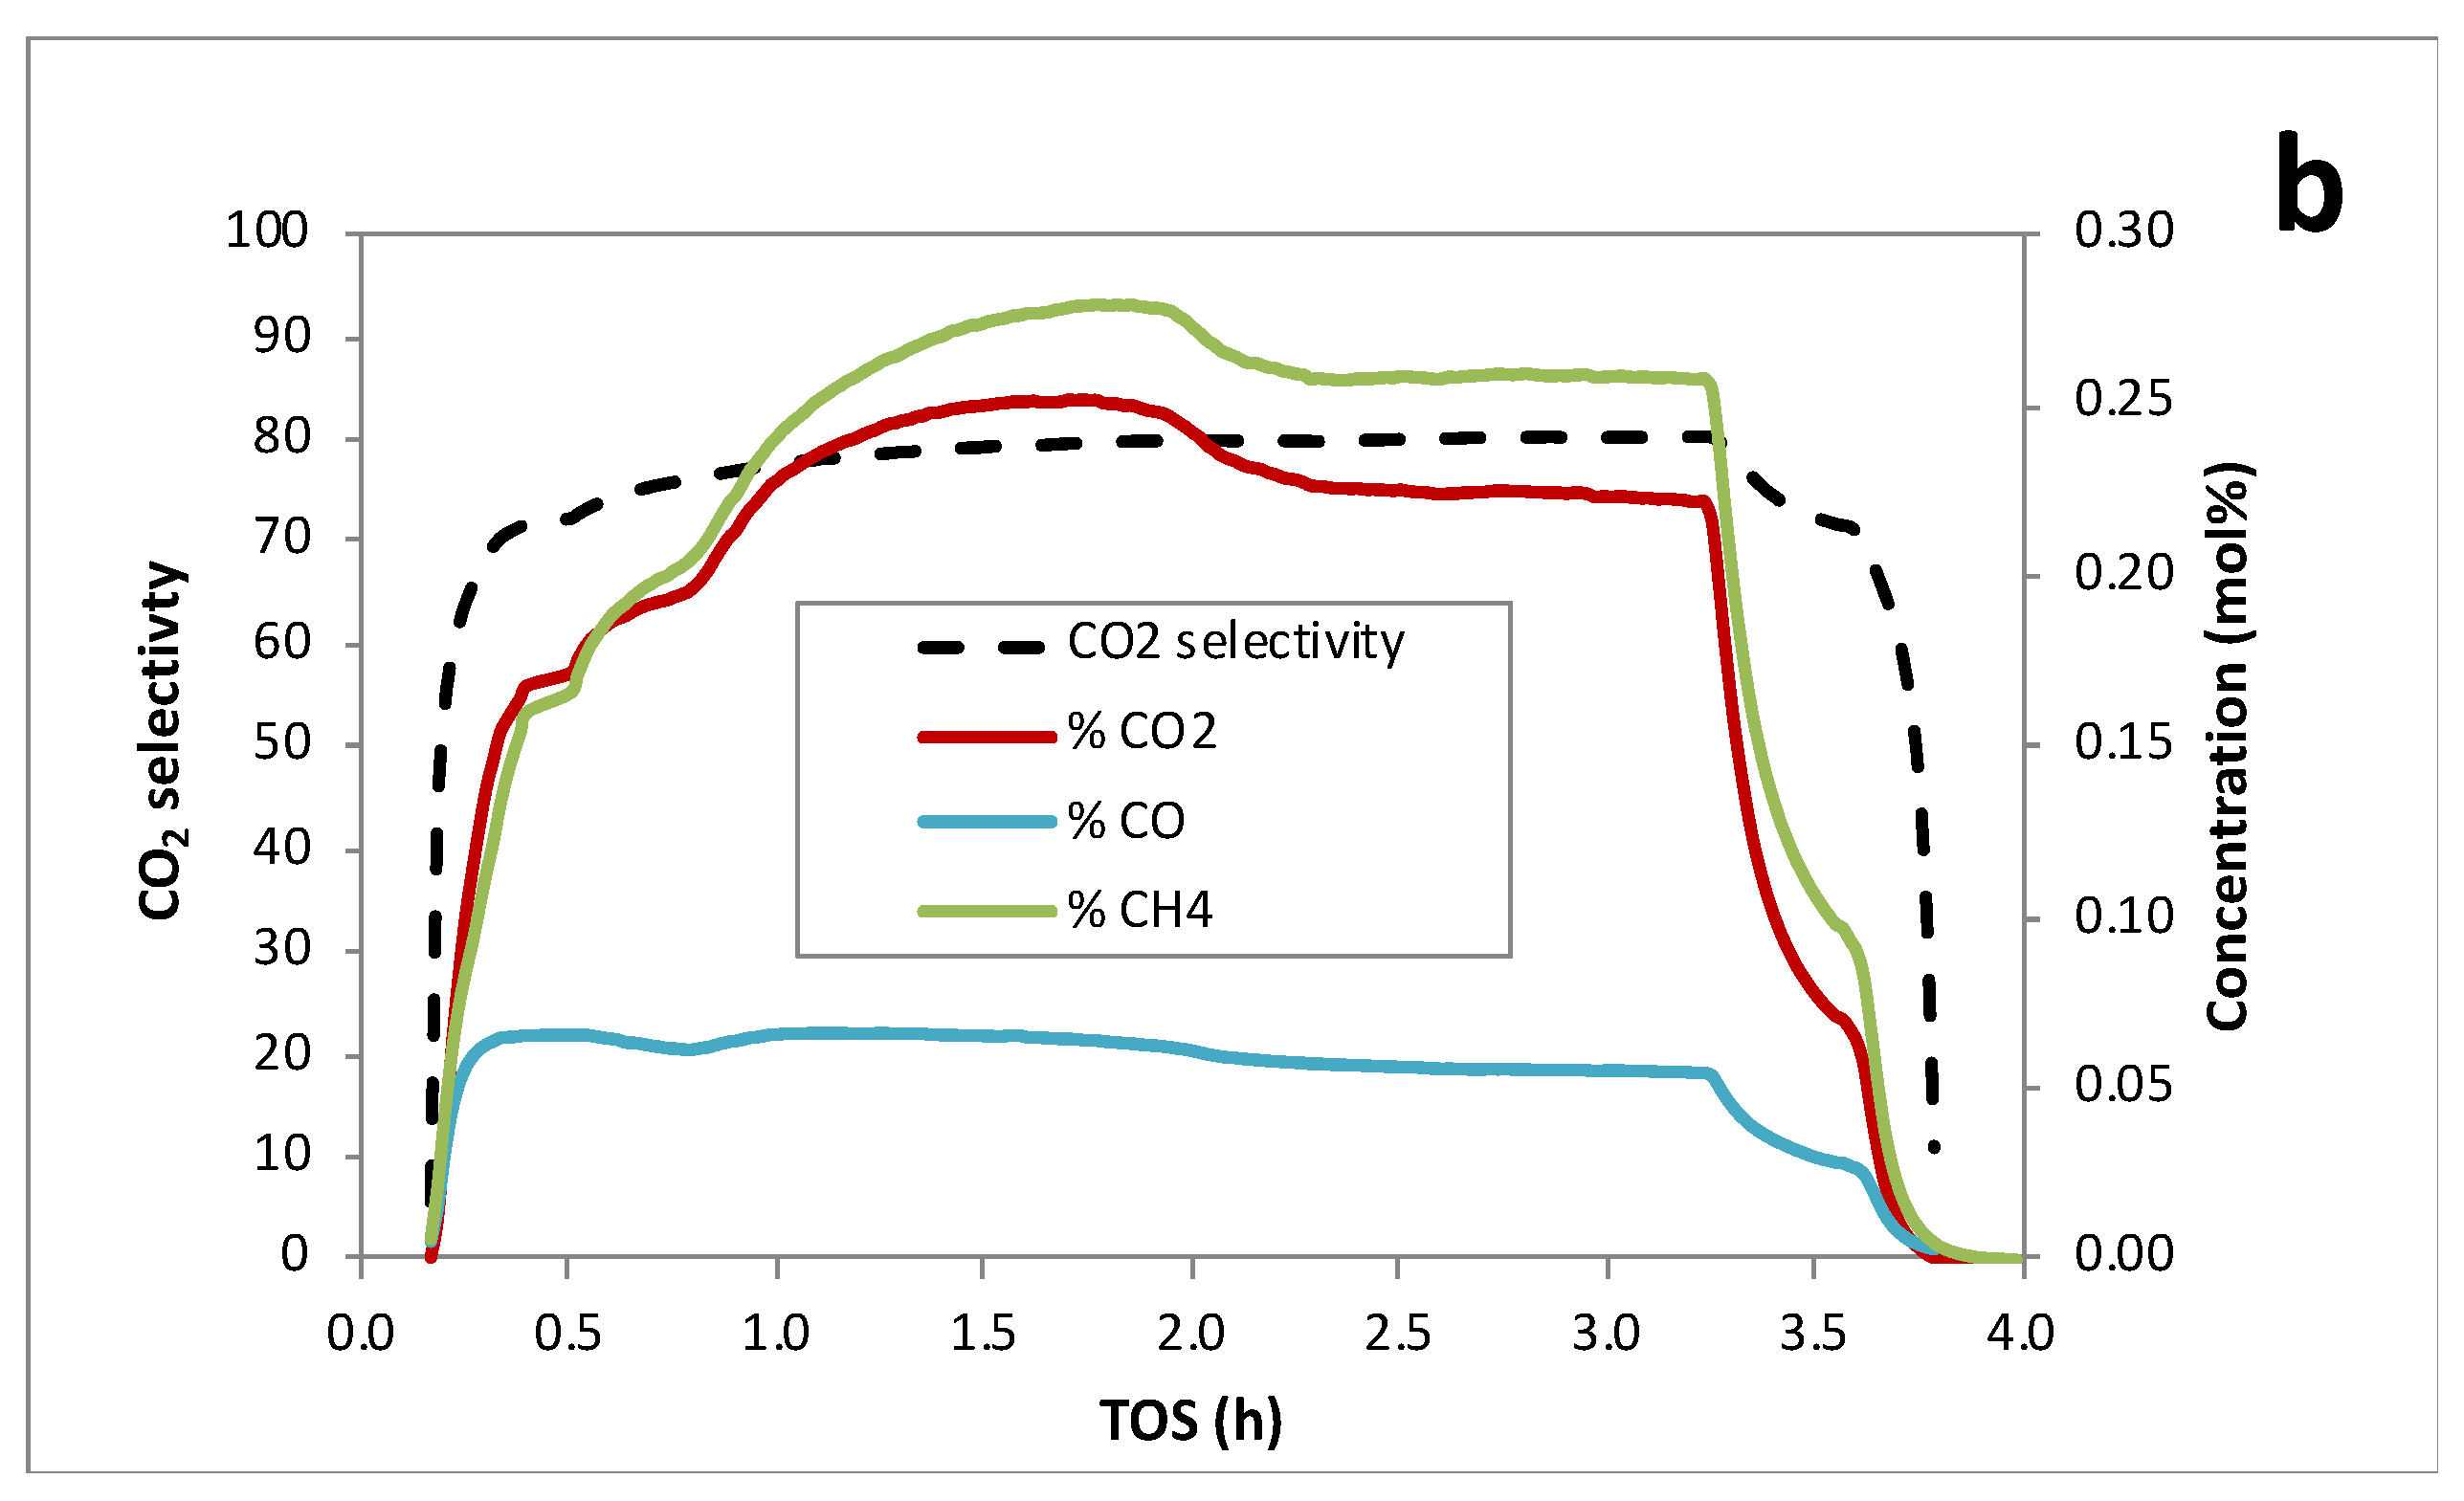
Figure 5 illustrates the continuous deoxygenation of 10 wt.% MP at 300°C and 15 bar under 5% H2/He over the 1 wt.% Pd/C catalyst. In this case, the approach to steady state was also slow requiring ~1.5 h. Steady-state MP conversion was ~50% and C15 selectivity was >90% (Table 3). Gas-phase products included CO2, CO and CH4, as evidenced by QMS (Figure 5b). We infer that the methoxy group is cleaved via hydrogenolysis producing PA and CH4 and this is the slow step in the FAME deoxygenation pathway over Pd/C (Scheme 1) [3,16]. Subsequent DCX/DCN of PA results in C15 hydrocarbons, CO2 and CO. Steady-state CO2 selectivity was ~80% indicating that DCX is predominant under these conditions. The liquid- and gas-phase products are consistent with the following overall stoichiometry:
Figure 6 illustrates the continuous deoxygenation of 10 wt.% MP at 300°C and 15 bar under 5% H2/He over the 5 wt.% Pd/C catalyst. Steady-state MP conversion was only ~55%; however, the approach to steady state was rapid in comparison to the 1 wt.% Pd/C catalyst. The steady-state C15 selectivities of the two catalysts are equivalent (Table 3). As expected, the gas-phase products included CO2, CO and CH4 (Figure 6b) consistent with Scheme 1. The more rapid approach to steady state (compared to the 1 wt.% Pd/C catalyst) is consistent with the larger number of Pd active sites in the 5 wt.% catalyst. Their closely similar steady-state conversions, however, suggest that most of the additional active sites (especially small Pd particles) in the 5 wt.% Pd/C catalyst undergo rapid deactivation. Interestingly, there is a sharp initial peak (spike) in CO2 concentration followed by a decline and then a slow asymptotic approach to steady state. A similar initial concentration spike, albeit it much less prominent, is observed for CO. In contrast, the generation of CH4 is delayed relative to CO2 and CO. We do not have a clear explanation for this initial DCX activity; however, the WGSR (Eq. 4) also should be considered. Steady-state CO2 selectivity was ~70% indicating a strong propensity for DCX under these conditions.
Biodiesel (99.5% ester content) was obtained from licuri oil via transesterification with methanol [14]. The licuri biodiesel composition (Table 4) includes a broad range of FA chain lengths with high saturated FA content. Oleic and linoleic acids are the main unsaturated compounds.
Continuous deoxygenation of 10 wt.% licuri biodiesel over the 1 wt.% Pd/C catalyst at 300°C and 15 bar under 5% H2/He is illustrated in Figure 7. The results are closely similar to those for 10 wt.% MP over 1 wt.% Pd/C except that a distribution of hydrocarbons is produced based on DCX and DCN of the FA chains comprising licuri biodiesel. Again, ~1.5 h was required to achieve steady state. Overall conversion of FAME was ~45% with >90% selectivity to hydrocarbons. Catalyst deactivation appeared minimal based on liquid-phase analysis during >6 h TOS. The gas-phase products (Figure 7b) are consistent with the reactions in Scheme 1, and CO2 selectivity was >70% indicating that the DCX pathway was predominant. The liquid- and gas-phase analyses are consistent with the overall stoichiometry:
Gas-phase analysis (Figure 7b) shows peaks in the CH4, CO2 and CO concentrations prior to asymptotically approaching steady state. In contrast to the liquid-phase analysis, slow decay of the CH4 and CO2 (but not CO) signals is observed during the course of the >6 h run. This might be interpreted as indicating deactivation of the primary DCX pathway.
Continuous deoxygenation of 10 wt.% licuri biodiesel over the 5 wt.% Pd/C catalyst at 300°C and 15 bar under 5% H2/He is shown in Figure 8. Overall conversion of FAME was ~57% with ~92% selectivity to hydrocarbons. The modestly higher performance of this catalyst is consistent with a higher density of Pd active sites. Catalyst deactivation appeared minimal based on liquid-phase analysis during >6 h TOS. The gas-phase products (Figure 8b) are consistent with Scheme 1, and CO2 selectivity was ~70%. Initial peaks in the CH4 and CO2 concentrations are observed prior to reaching steady state. In this case, however, the gas-phase product signals are relatively stable and do not decline noticeably during the >6-h run.
The hydrocarbon product distributions (Table 5) obtained from deoxygenation of licuri biodiesel over the Pd/C catalysts comprise only odd-numbered n-alkanes consistent with catalytic deoxygenation via DCX/DCN. Moreover, the hydrocarbon compositions closely reflect the licuri biodiesel FA composition (Table 4).
4. Conclusions
Scale-up of catalytic deoxygenation for biofuels production was demonstrated using a continuous trickle-bed reactor with granular Pd/C catalysts. Experimental runs at constant WHSV evidenced that 20 wt.% PA is the optimum feed concentration. At higher feed concentrations, the DCX pathway is inhibited by CO (from DCN), and lower feed concentrations are less efficient. The kinetics of MP deoxygenation are slower than PA deoxygenation because of rate-limiting hydrogenolysis of the methoxy bond generating CH4 and PA. FAME derived from licuri oil were deoxygenated to hydrocarbons with similar efficiency to MP over 1 wt.% Pd/C. A lab-prepared 5 wt.% Pd/C with higher loading and metal dispersion gave only modestly better hydrocarbon yield. The hydrocarbon product distributions were consistent with DCX/DCN as the primary reaction pathways.
Supplementary Materials
The following supporting information can be downloaded at the website of this paper posted on Preprints.org.
Acknowledgments
Funding for construction of the trickle-bed reactor system were provided by Ovation Biotech. We gratefully acknowledge Dr. M. Jason Kelly for his significant contributions to the design and construction of the trickle-bed reactor system. Partial support for this research was provided by Conselho Nacional de Desenvolvimento Científico e Tecnológico – Brasil (CNPq) and Coordenação de Aperfeiçoamento de Pessoal de Nível Superior - Brasil (CAPES) - Finance Code 001.
References
- Yang, J.; Xin, Z.; He, Q.; Corscadden, K.; Niu, H. An overview on performance characteristics of bio-jet fuels. Fuel 2019, 237, 916–936. [Google Scholar] [CrossRef]
- Khan, S.; Lup, A. N. K.; Qureshi, K. M.; Abnisa, F.; Daud, W. M. A. W.; Patah, M. F. A. A review on deoxygenation of triglycerides for jet fuel range hydrocarbons. J. Anal. Appl. Pyrolysis 2019, 140, 1–24. [Google Scholar] [CrossRef]
- Kubickova, I.; Snare, M.; Eranen, K.; Maki-Arvela, P.; Murzin, D. Y. Hydrocarbons for diesel fuel via decarboxylation of vegetable oils. Catal. Today 2005, 106, 197–200. [Google Scholar] [CrossRef]
- Snare, M.; Kubickova, I.; Maki-Arvela, P.; Eranen, K.; Murzin, D. Y. Heterogeneous catalytic deoxygenation of stearic acid for production of biodiesel. Ind. Eng. Chem. Res. 2006, 45, 5708–5715. [Google Scholar] [CrossRef]
- Immer, J.G.; Kelly, M.J.; Lamb, H.H. Catalytic reaction pathways in liquid-phase deoxygenation of C18 free fatty acids. Appl Catal A 2010, 375, 134–139. [Google Scholar] [CrossRef]
- Immer, J. G.; Lamb, H. H. Fed-batch catalytic deoxygenation of free fatty acids. Energy Fuels 2010, 24, 5291–5299. [Google Scholar] [CrossRef]
- Ford, J. P. ; Thapaliya; N. ; Kelly, M. J.; Roberts, W. L.; Lamb, H. H. Semi-batch deoxygenation of canola- and lard-derived fatty acids to diesel-range hydrocarbons Energy Fuels 2013, 27, 7489–7496. [Google Scholar]
- Santillan-Jimenez, E.; Crocker, M. Catalytic deoxygenation of fatty acids and their derivatives to hydrocarbon fuels via decarboxylation/decarbonylation. J. Chem. Technol. Biotechnol. 2012, 87, 1041–1050. [Google Scholar] [CrossRef]
- Loe, R.; Lavoignat, Y.; Maier, M.; Abdallah, M.; Morgan, T.; Qian, D.; Pace, R.; Santillan-Jimenez, E.; Crocker, M. Continuous Catalytic Deoxygenation of Waste Free Fatty Acid-Based Feeds to Fuel-Like Hydrocarbons Over a Supported Ni-Cu Catalyst. Catalysts 2019, 9, 123–146. [Google Scholar] [CrossRef]
- Arend, M.; Nonnen, T.; Hoelderich, W.F.; Fischer, J.; Groos, J. Catalytic deoxygenation of oleic acid in continuous gas flow for the production of diesel-like hydrocarbons. Appl Catal A 2011, 399, 198–204. [Google Scholar] [CrossRef]
- Madsen, A. T.; Rozmyszowicz, B.; Simakova, I. L.; Kilpio, T.; Leino, A. R.; Kordas, K.; Eranen, K.; Maki-Arvela, P.; Murzin, D. Y. Step changes and deactivation behavior in the continuous decarboxylation of stearic acid. Ind. Eng. Chem. Res. 2011, 50, 11049–11058. [Google Scholar] [CrossRef]
- Madsen, A. T.; Rozmysłowicz, B.; Maki-Arvela, P.; Simakova, I. L.; Eranen, K.; Murzin, D. Y.; Fehrmann, R. Deactivation in continuous deoxygenation of C18-fatty feedstock over Pd/Sibunit. Top Catal. 2013, 56, 714–724. [Google Scholar] [CrossRef]
- Crepaldi, I.C.; Almeida-Muradian, L.B.; Rios, M.G.D.; Penteado, M.V.C. Composição nutricional do fruto de licuri (Syagrus coronata (Martius) Beccari). Braz. J. Bot. 2001, 24, 155–159. [Google Scholar] [CrossRef]
- Araujo, P. H. M.; Maia, A. S.; Cordeiro, A. M. T. M.; Gondim, A. D.; Santos, N. A. Catalytic deoxygenation of the oil and biodiesel of licuri (Syagrus coronata) to obtain n-alkanes with chains in the range of biojet fuels. ACS Omega 2019, 4, 15849–15855. [Google Scholar] [CrossRef] [PubMed]
- McEvoy, E.J.; Harold, S. Preparation of supported palladium catalysts. U.S. Patent 3,271,327, Sep. 6, 1966. [Google Scholar]
- Han, J.; Sun, H.; Ding, Y.; Hui, L.; Zheng, X. Palladium-catalyzed decarboxylation of higher aliphatic esters: Towards a new protocol to the second generation biodiesel production. Green Chem. 2010, 12, 463–467. [Google Scholar] [CrossRef]
Figure 1.
Schematic diagram of continuous trickle-bed reactor for FA and FAME deoxygenation.
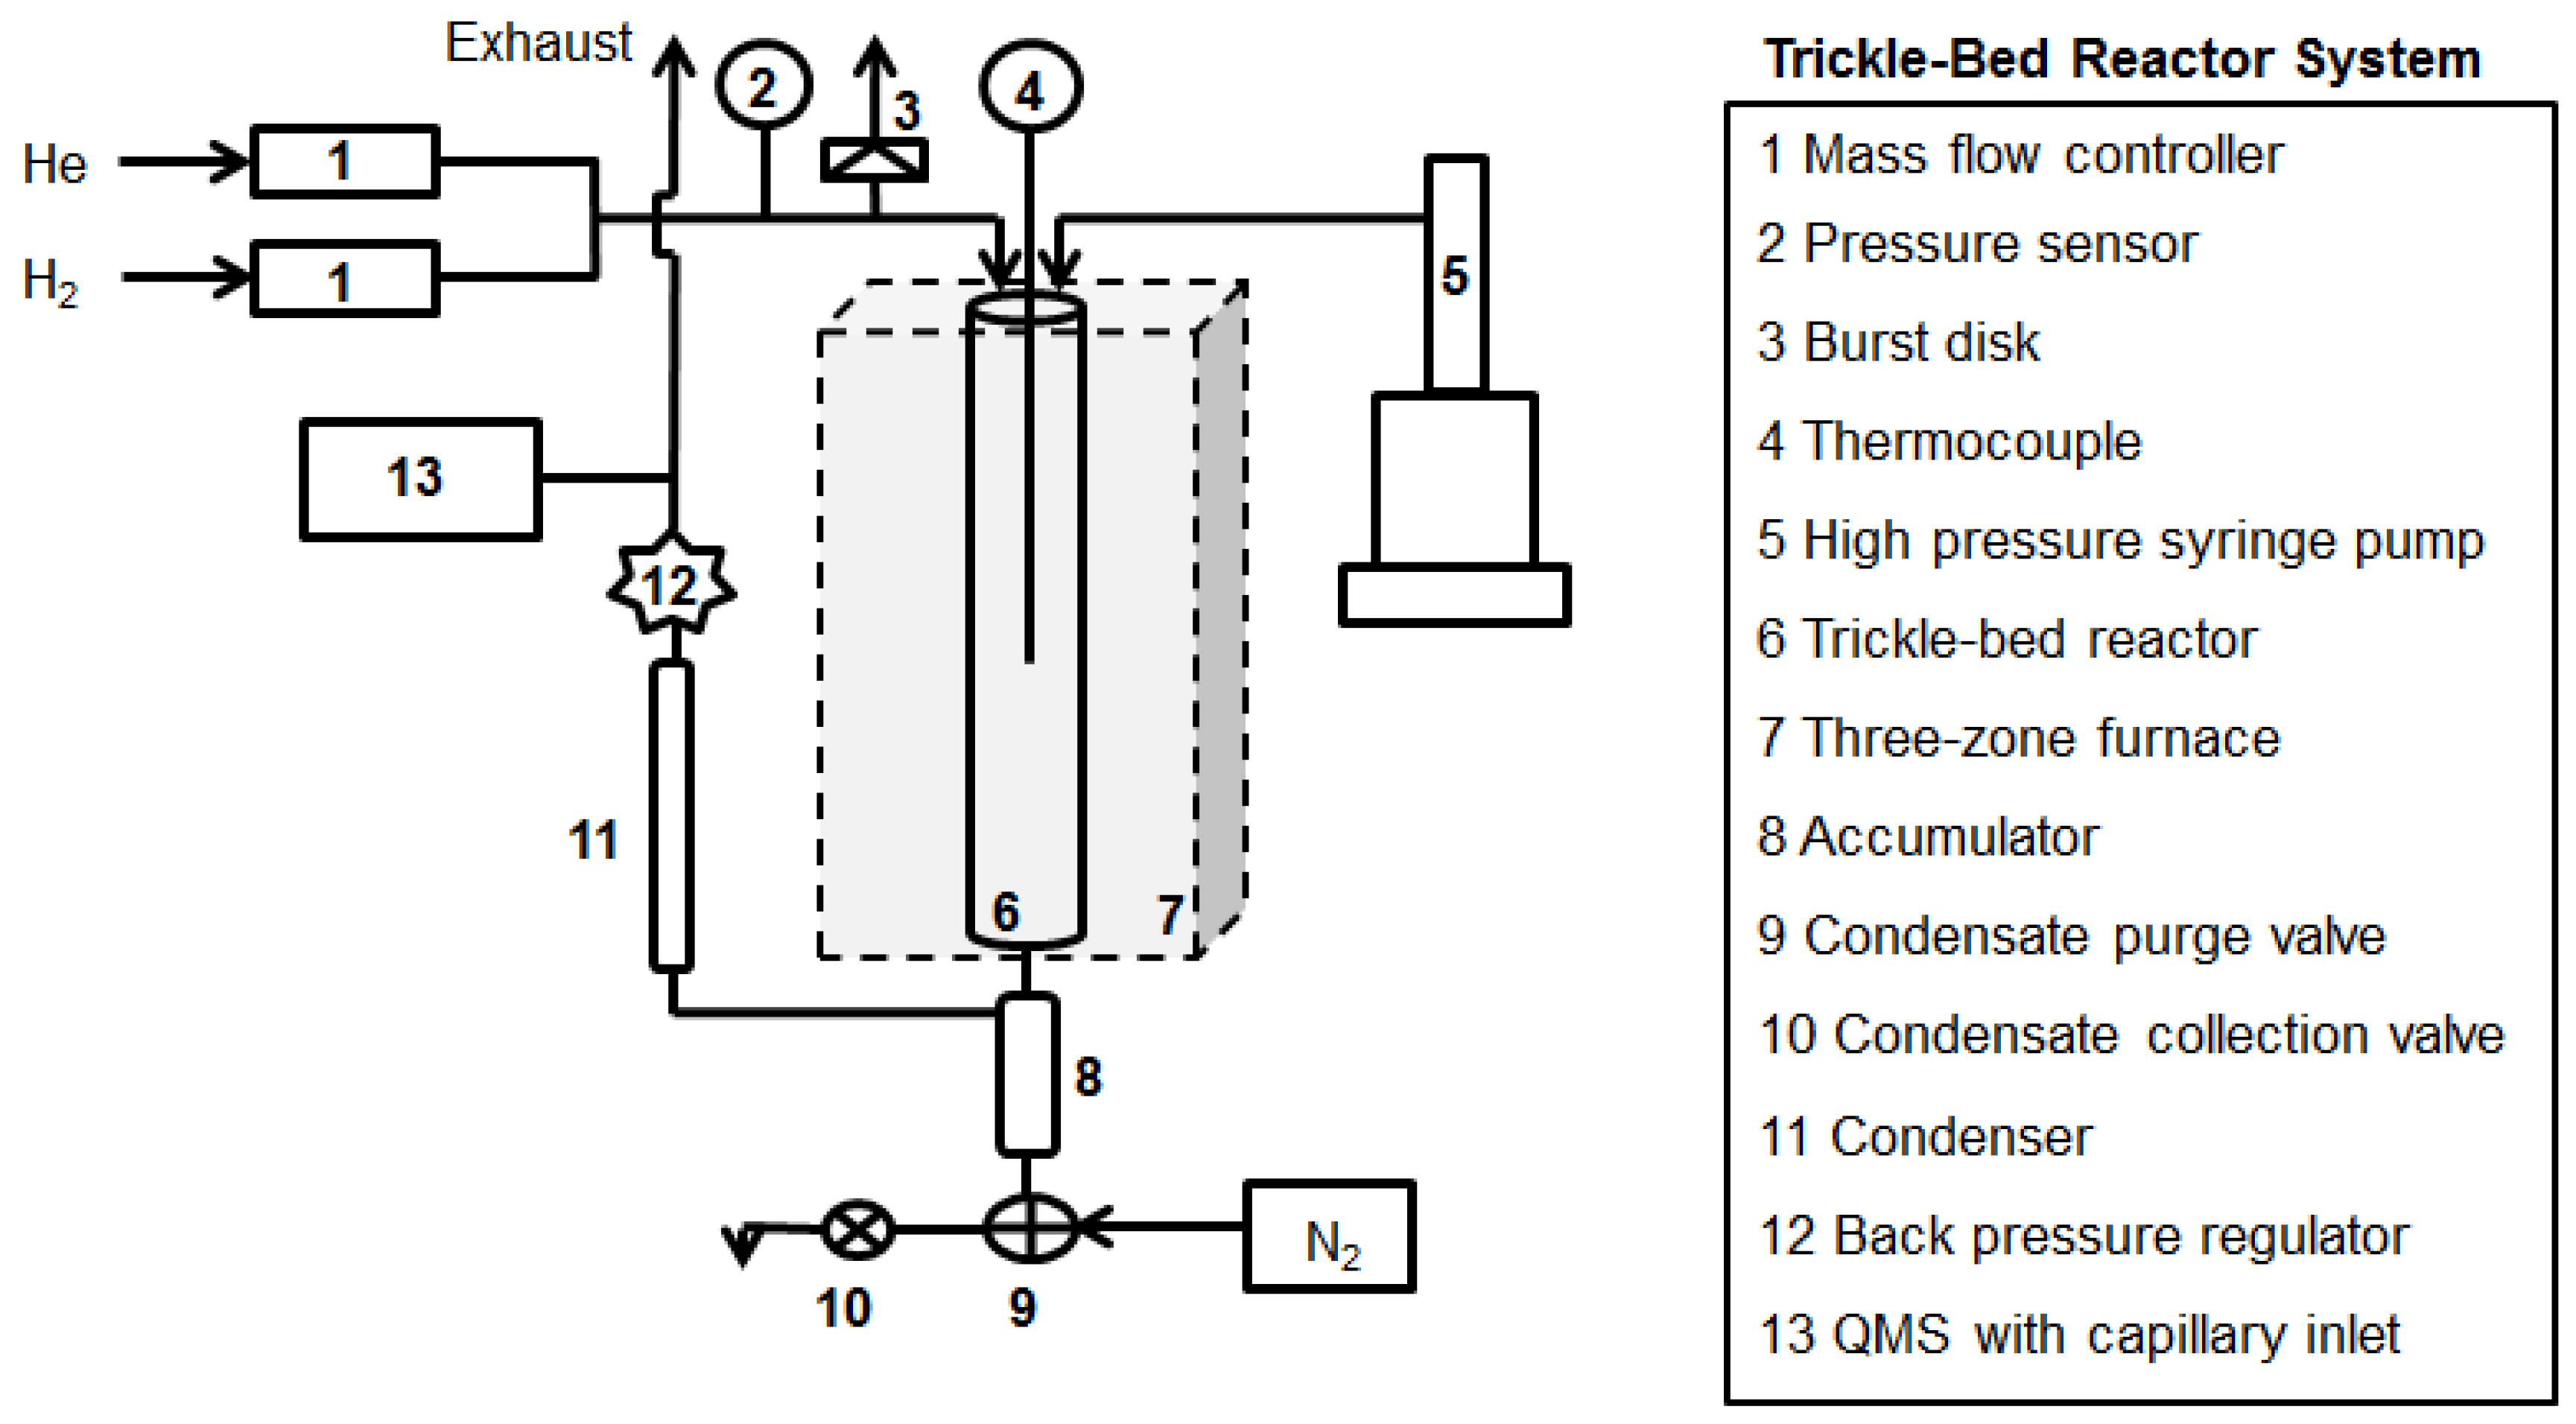
Figure 2.
Catalytic deoxygenation of 20 and 10 wt.% PA/C12 over 1 wt.% Pd/C at constant WHSV (~0.8 h-1): (a) C15 and PA concentrations and (b) on-line QMS analysis of product gases in the reactor effluent.
Figure 2.
Catalytic deoxygenation of 20 and 10 wt.% PA/C12 over 1 wt.% Pd/C at constant WHSV (~0.8 h-1): (a) C15 and PA concentrations and (b) on-line QMS analysis of product gases in the reactor effluent.
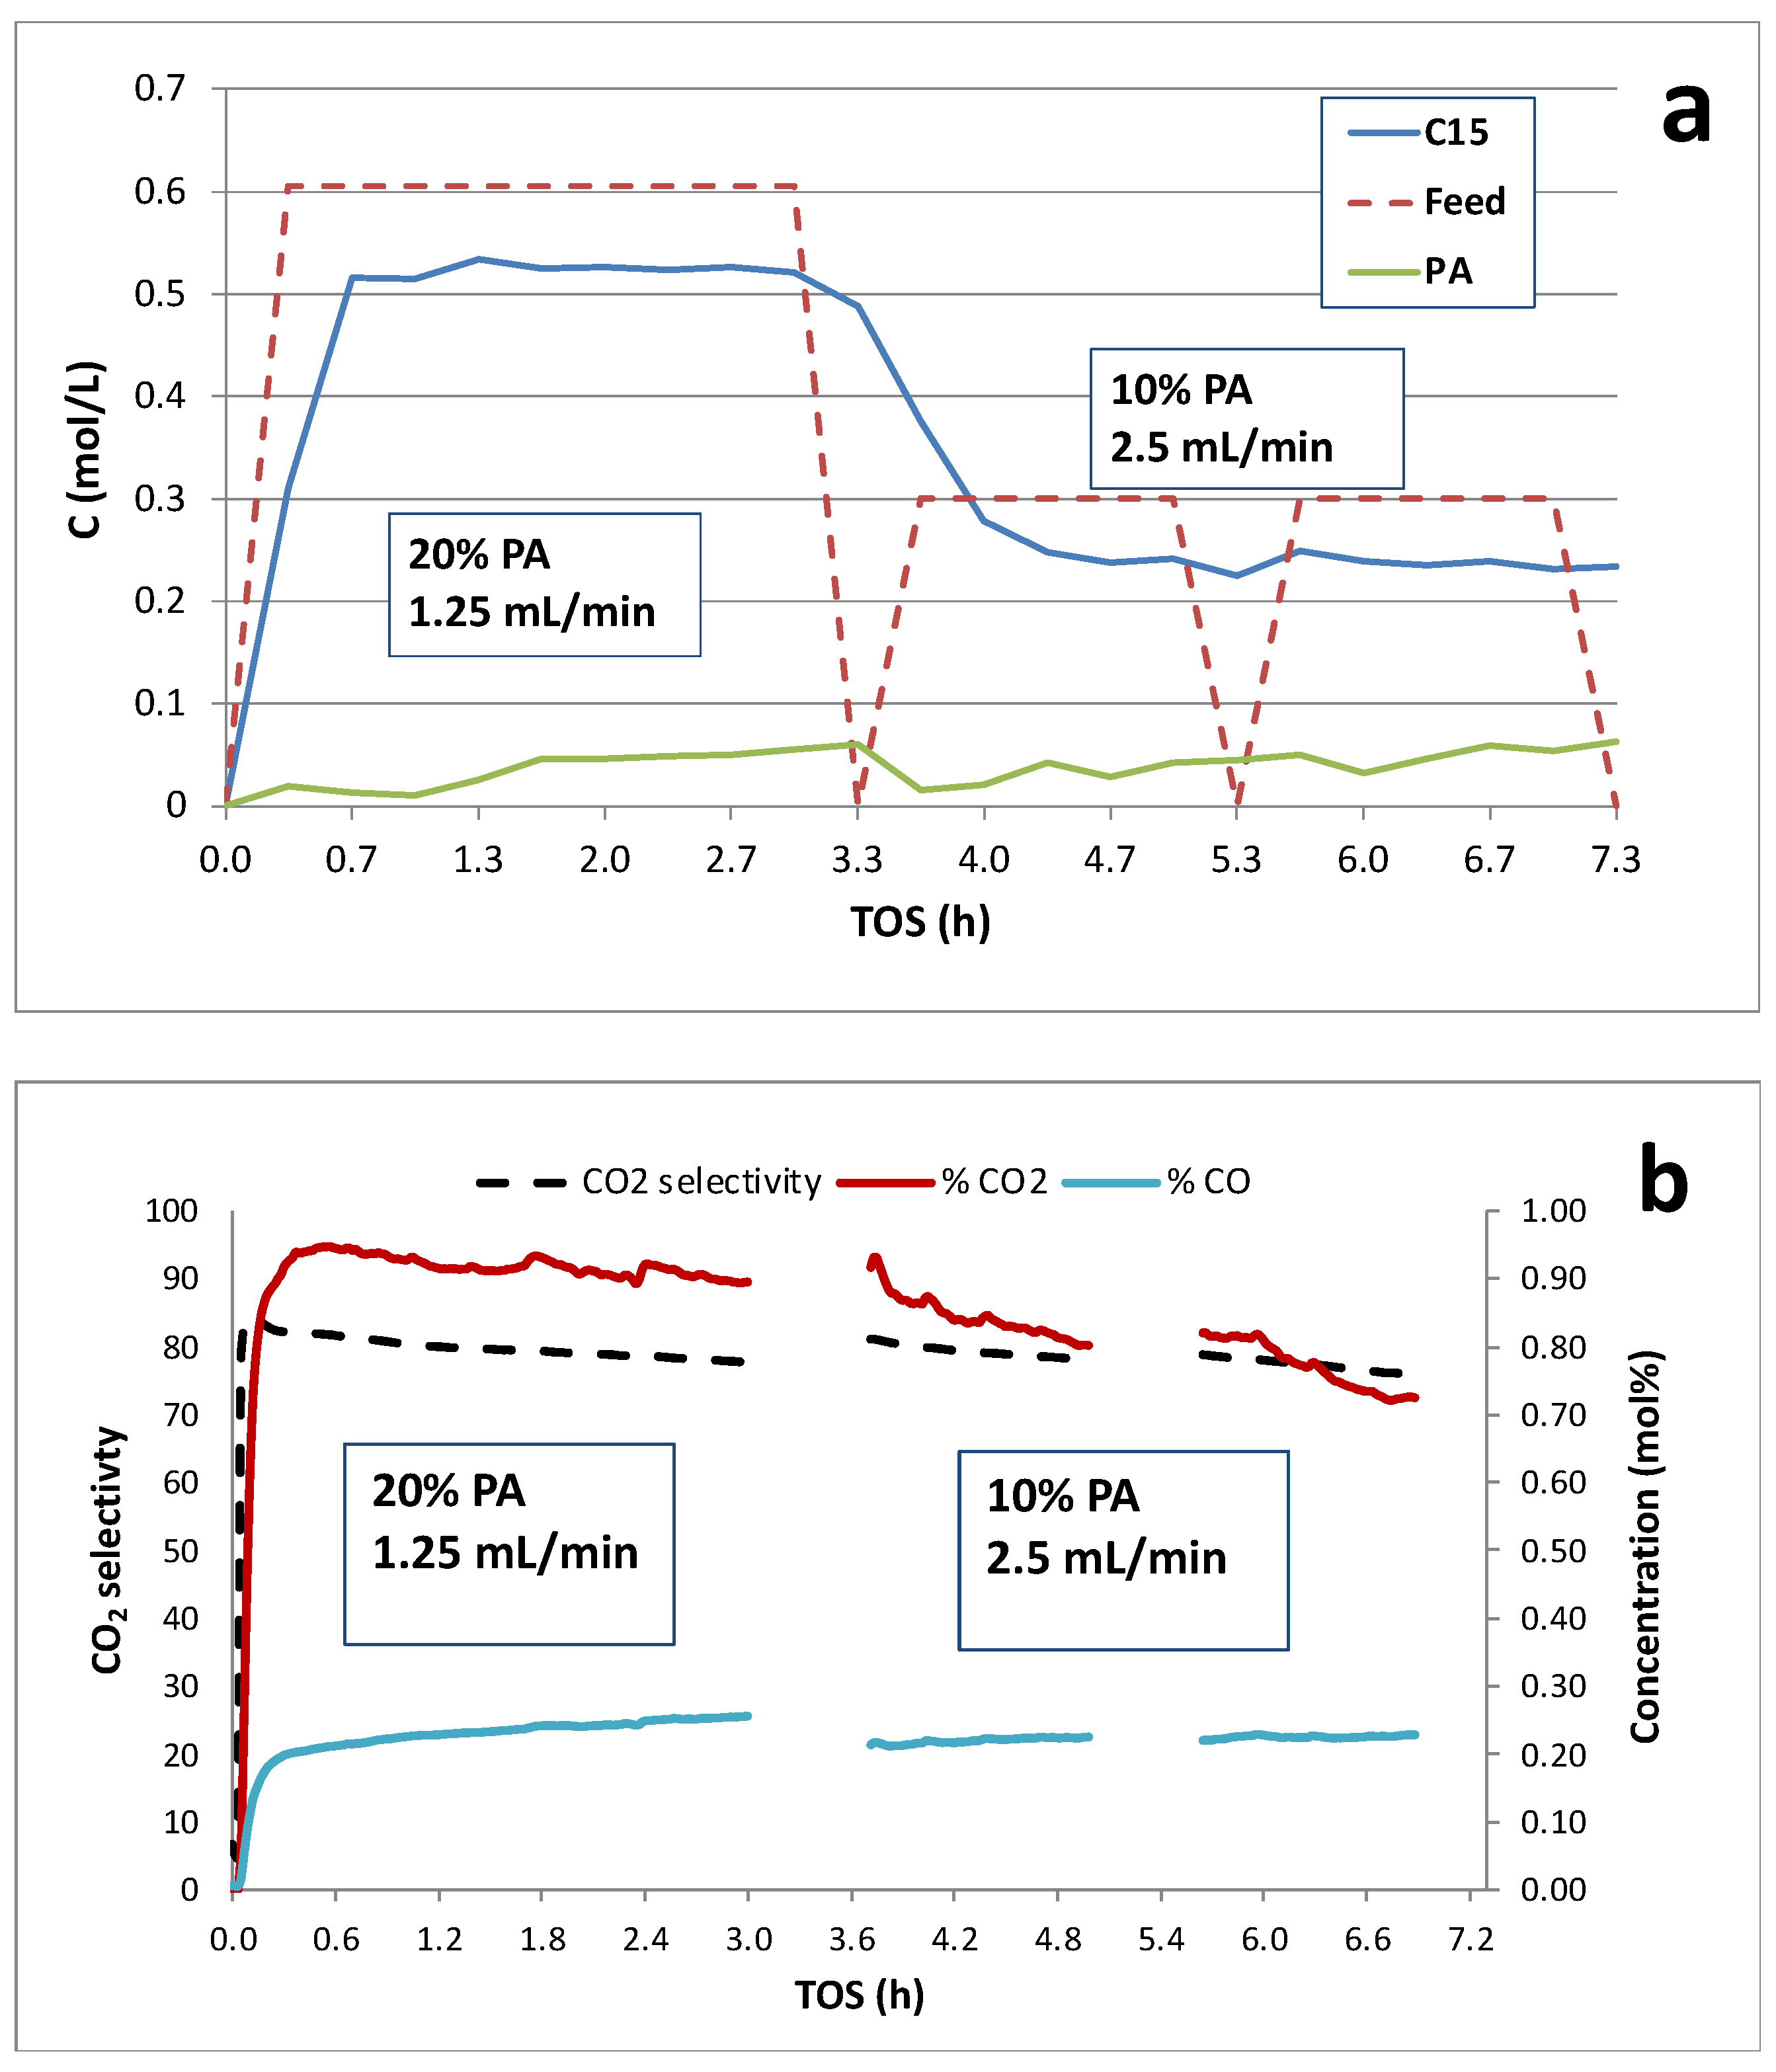
Figure 3.
Catalytic deoxygenation over 1 wt.% Pd/C shifting from 20 to 50 wt.% PA holding WHSV constant (~0.8 h-1): (a) C15 and PA concentrations and (b) on-line QMS analysis of product gases in the reactor effluent.
Figure 3.
Catalytic deoxygenation over 1 wt.% Pd/C shifting from 20 to 50 wt.% PA holding WHSV constant (~0.8 h-1): (a) C15 and PA concentrations and (b) on-line QMS analysis of product gases in the reactor effluent.
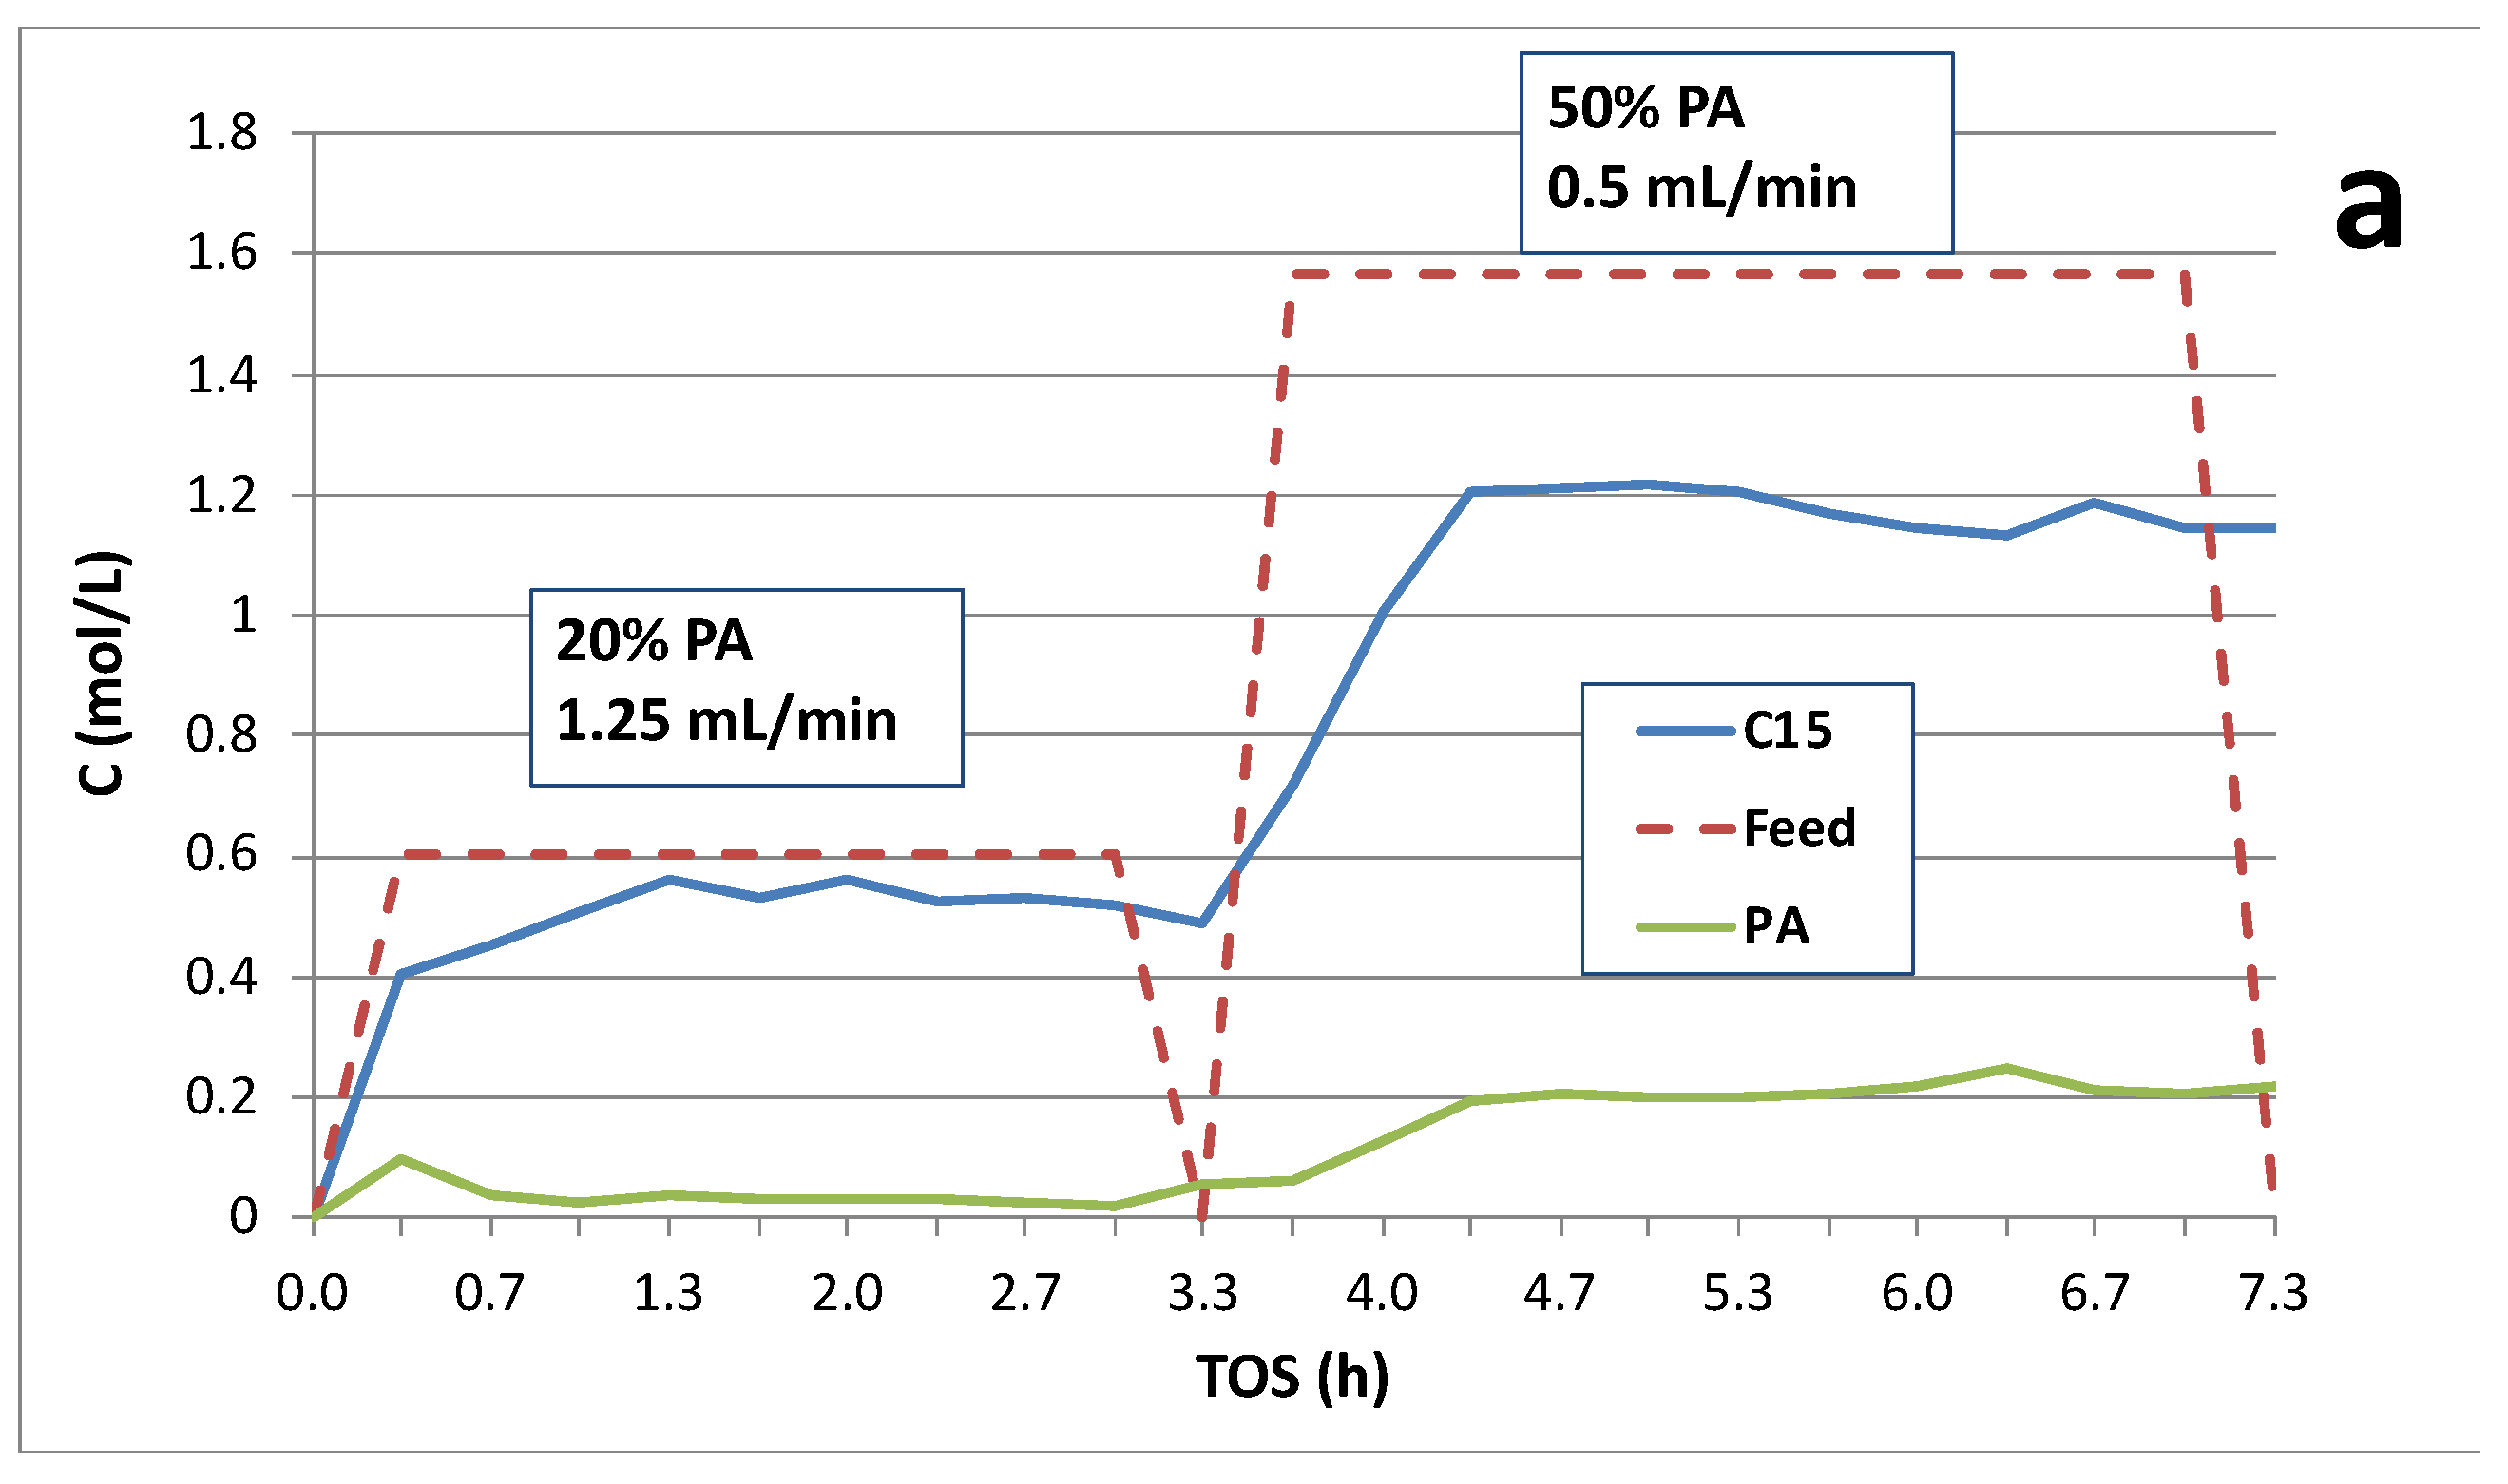
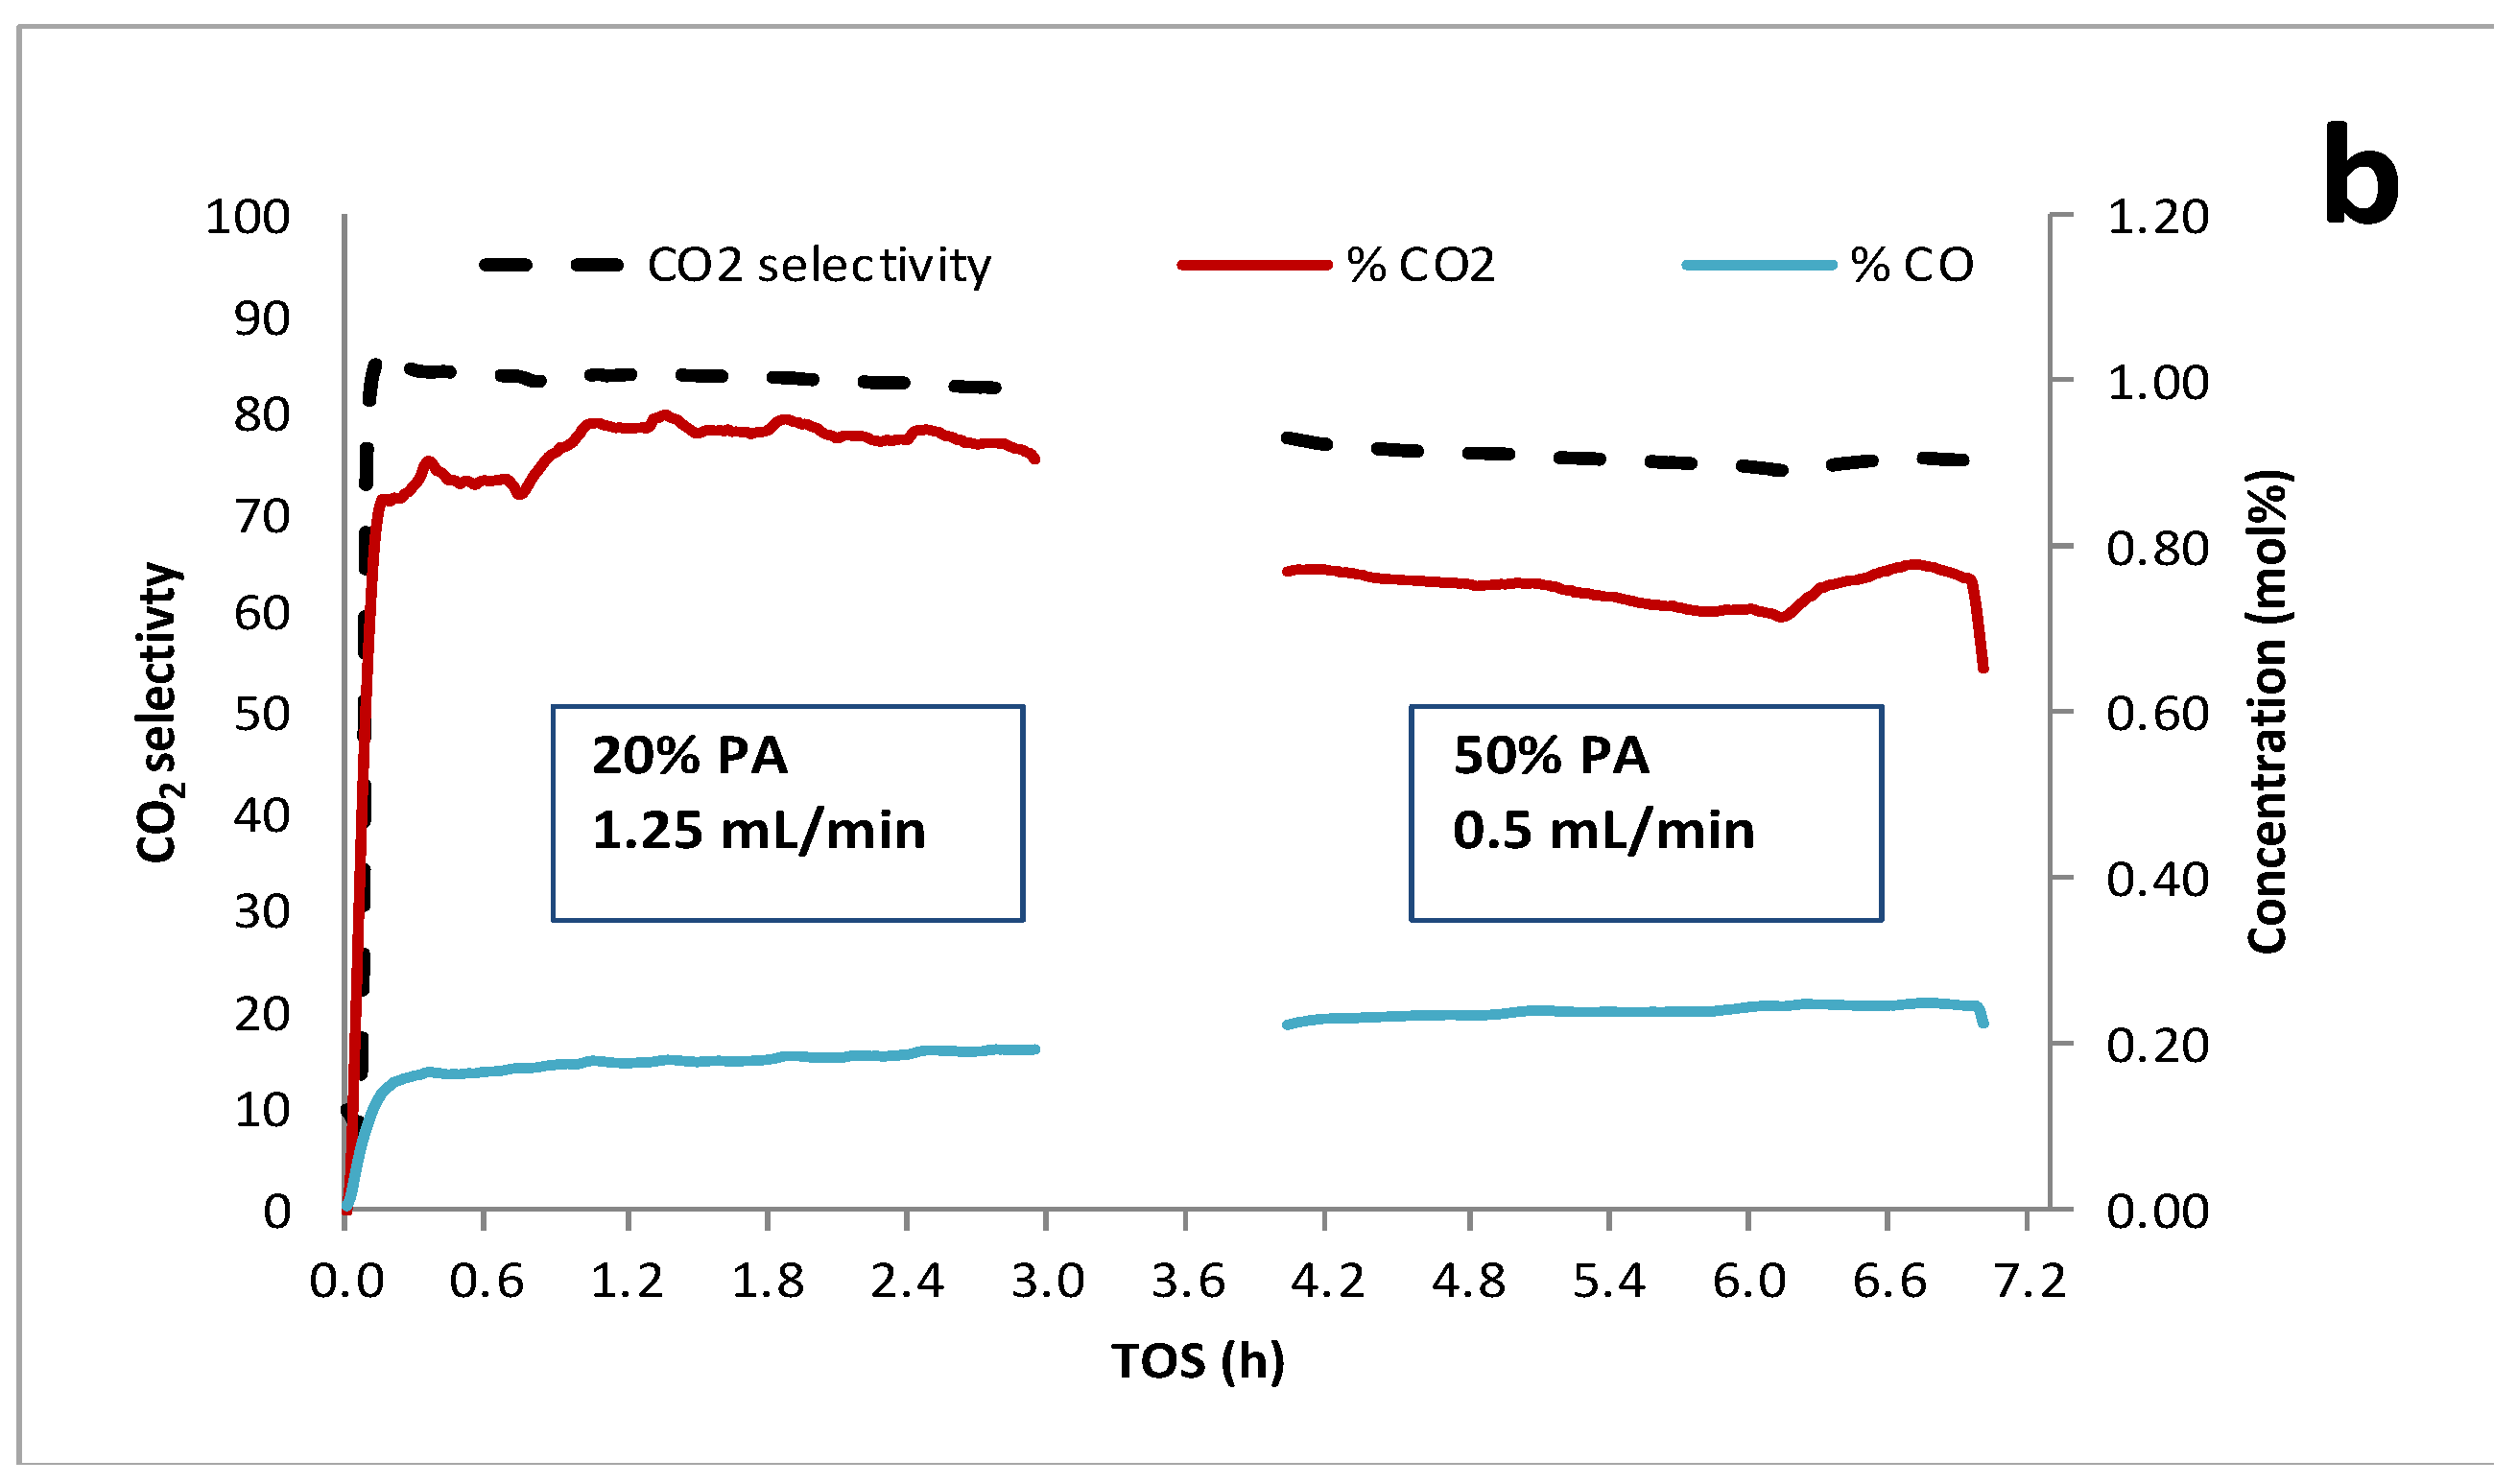
Figure 4.
Kinetics of semi-batch PA deoxygenation using a 5% Pd/C catalyst (Evonik E117) at 300°C and 15 bar in 5% H2/He [7].
Figure 4.
Kinetics of semi-batch PA deoxygenation using a 5% Pd/C catalyst (Evonik E117) at 300°C and 15 bar in 5% H2/He [7].
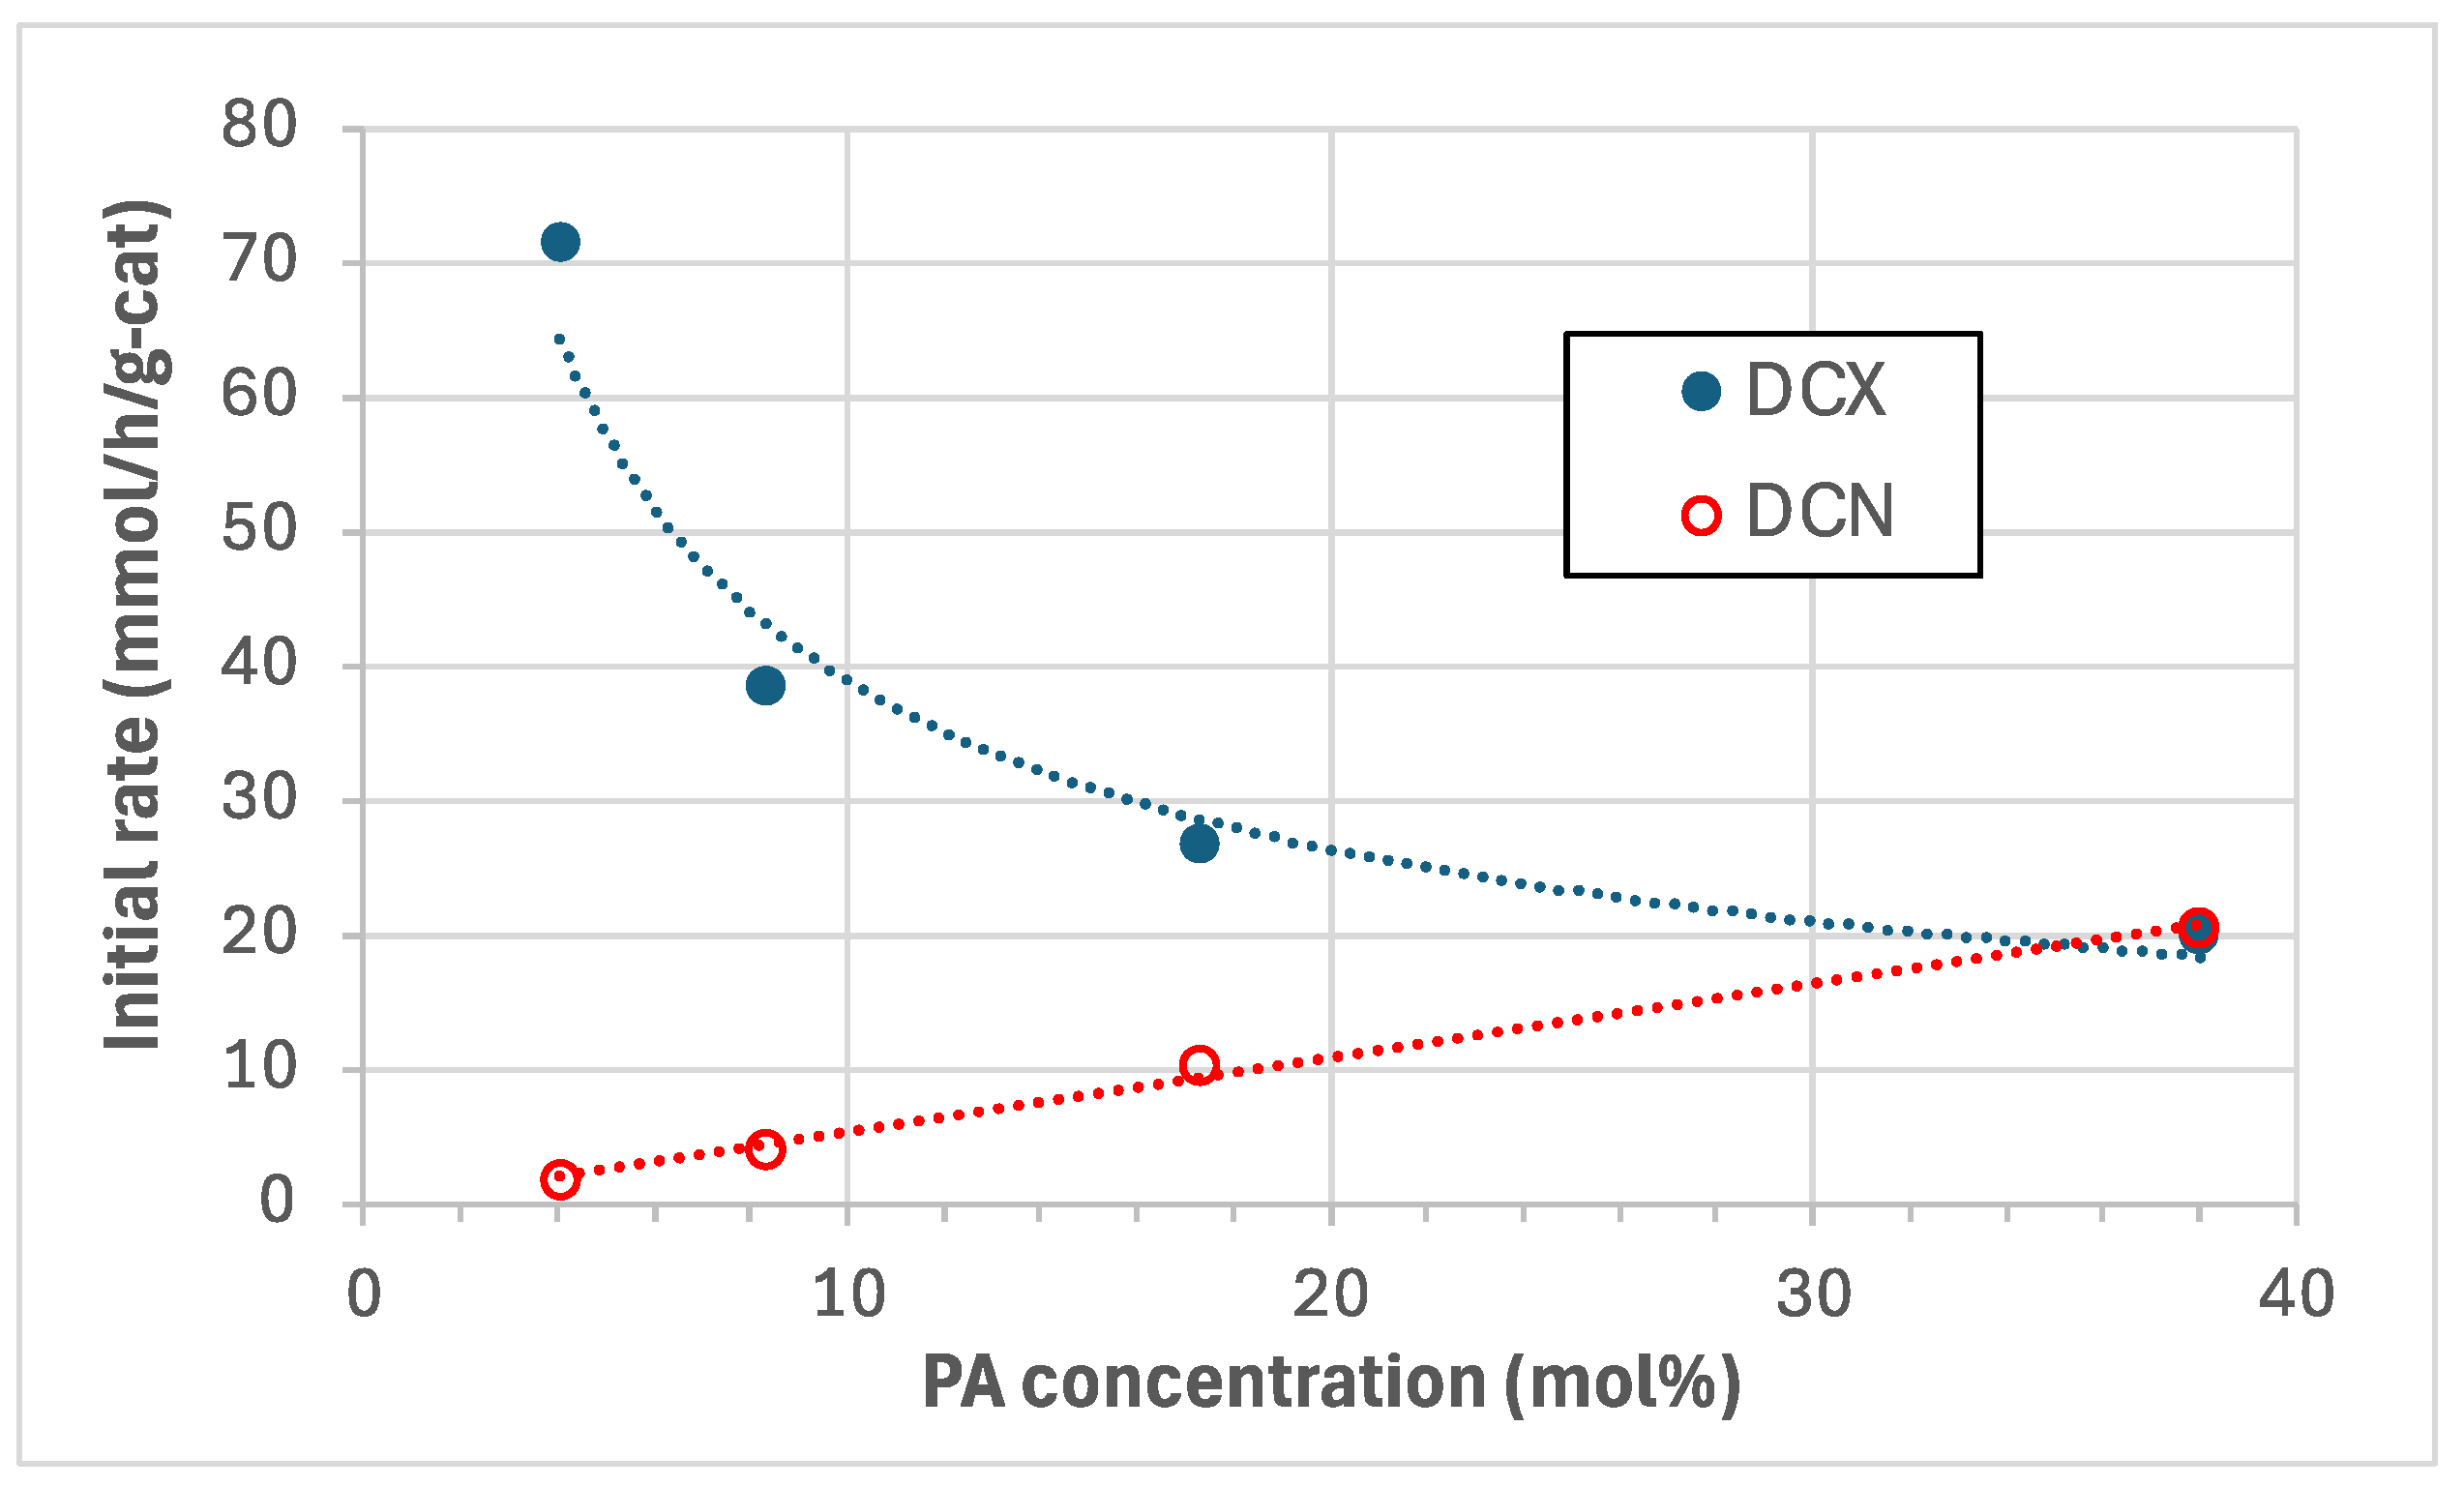
Figure 5.
Continuous catalytic deoxygenation of 10 wt.% MP over 1 wt.% Pd/C at 300°C and 15 bar in 5% H2/He.
Figure 5.
Continuous catalytic deoxygenation of 10 wt.% MP over 1 wt.% Pd/C at 300°C and 15 bar in 5% H2/He.
Scheme 1.
FAME deoxygenation reactions over supported Pd catalysts [3,16]. Initial methyoxy bond hydrogenolysis inferred to be the slow step.
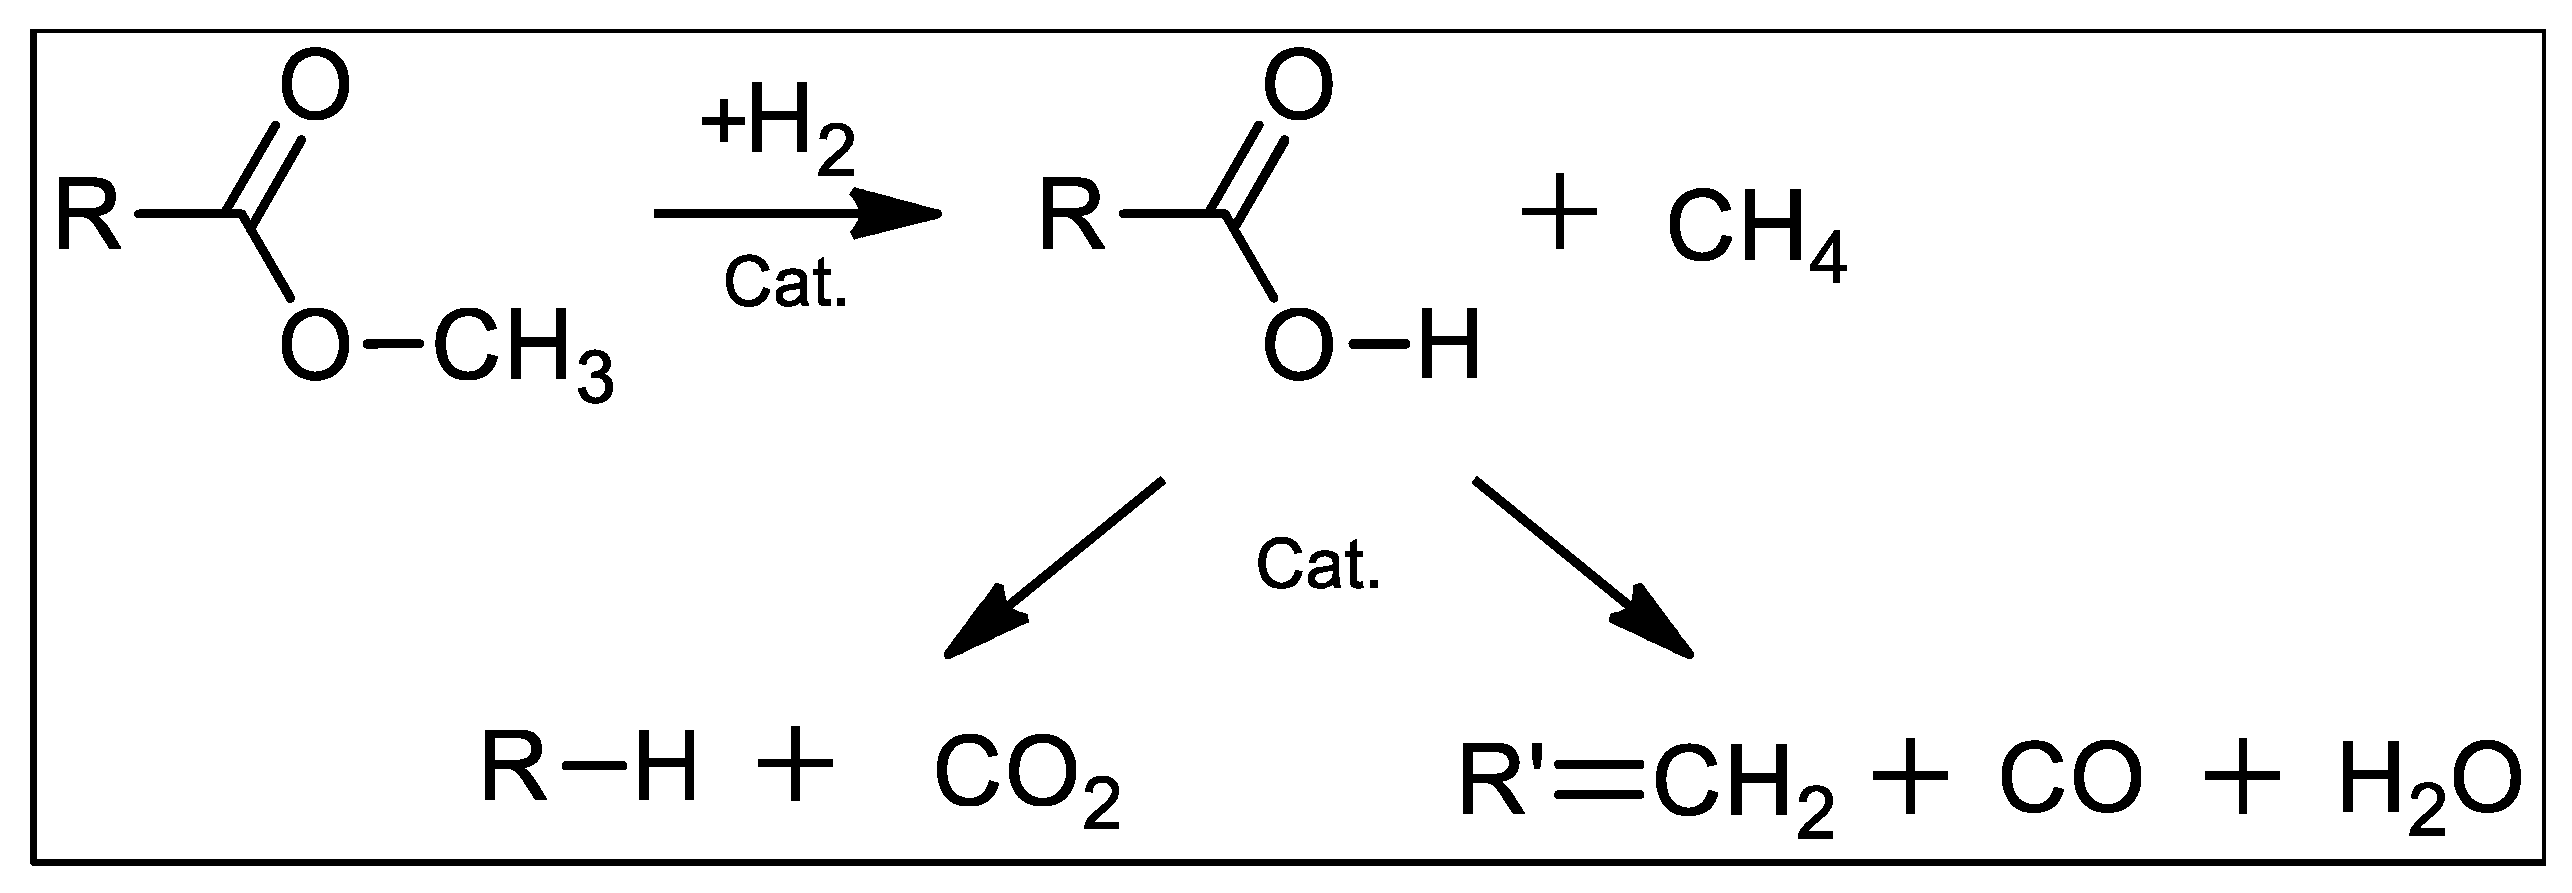
Figure 6.
Catalytic deoxygenation reaction of 10 wt.% MP over 5 wt.% Pd/C at 300°C and 15 bar in 5% H2/He.
Figure 6.
Catalytic deoxygenation reaction of 10 wt.% MP over 5 wt.% Pd/C at 300°C and 15 bar in 5% H2/He.
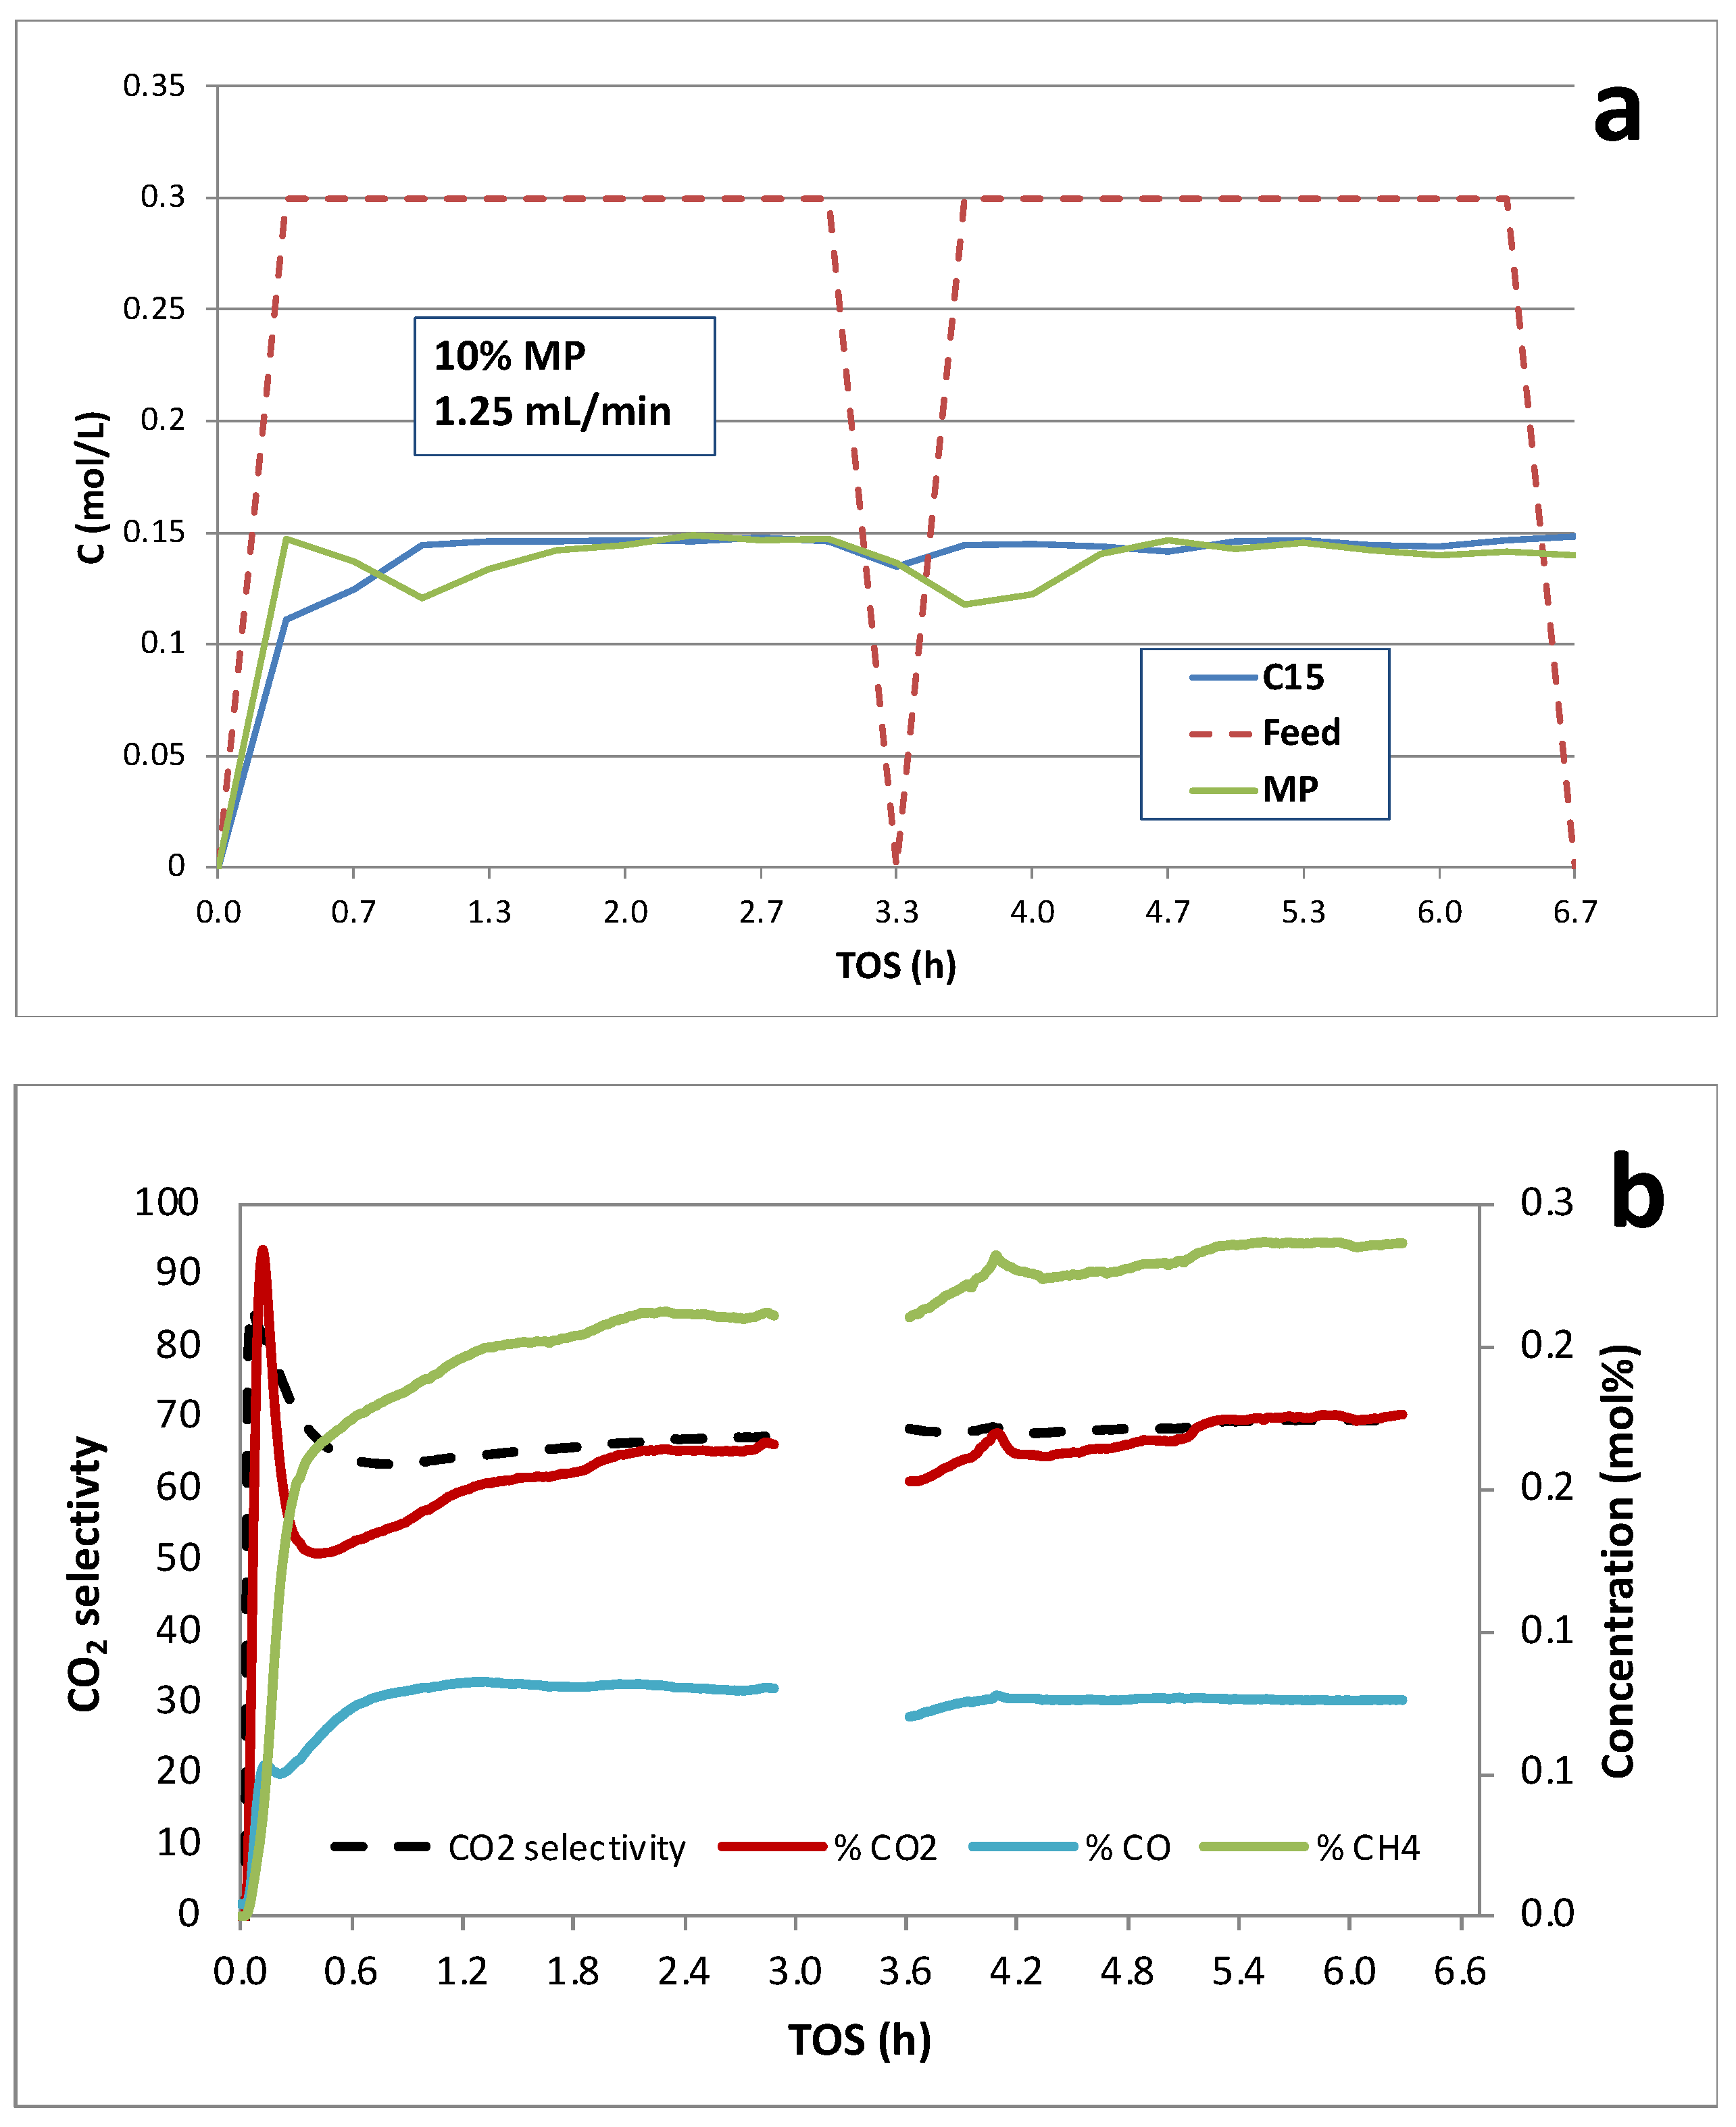
Figure 7.
Continuous catalytic deoxygenation of 10 wt.% licuri biodiesel over 1 wt.% Pd/C at 300°C and 15 bar in 5% H2/He.
Figure 7.
Continuous catalytic deoxygenation of 10 wt.% licuri biodiesel over 1 wt.% Pd/C at 300°C and 15 bar in 5% H2/He.
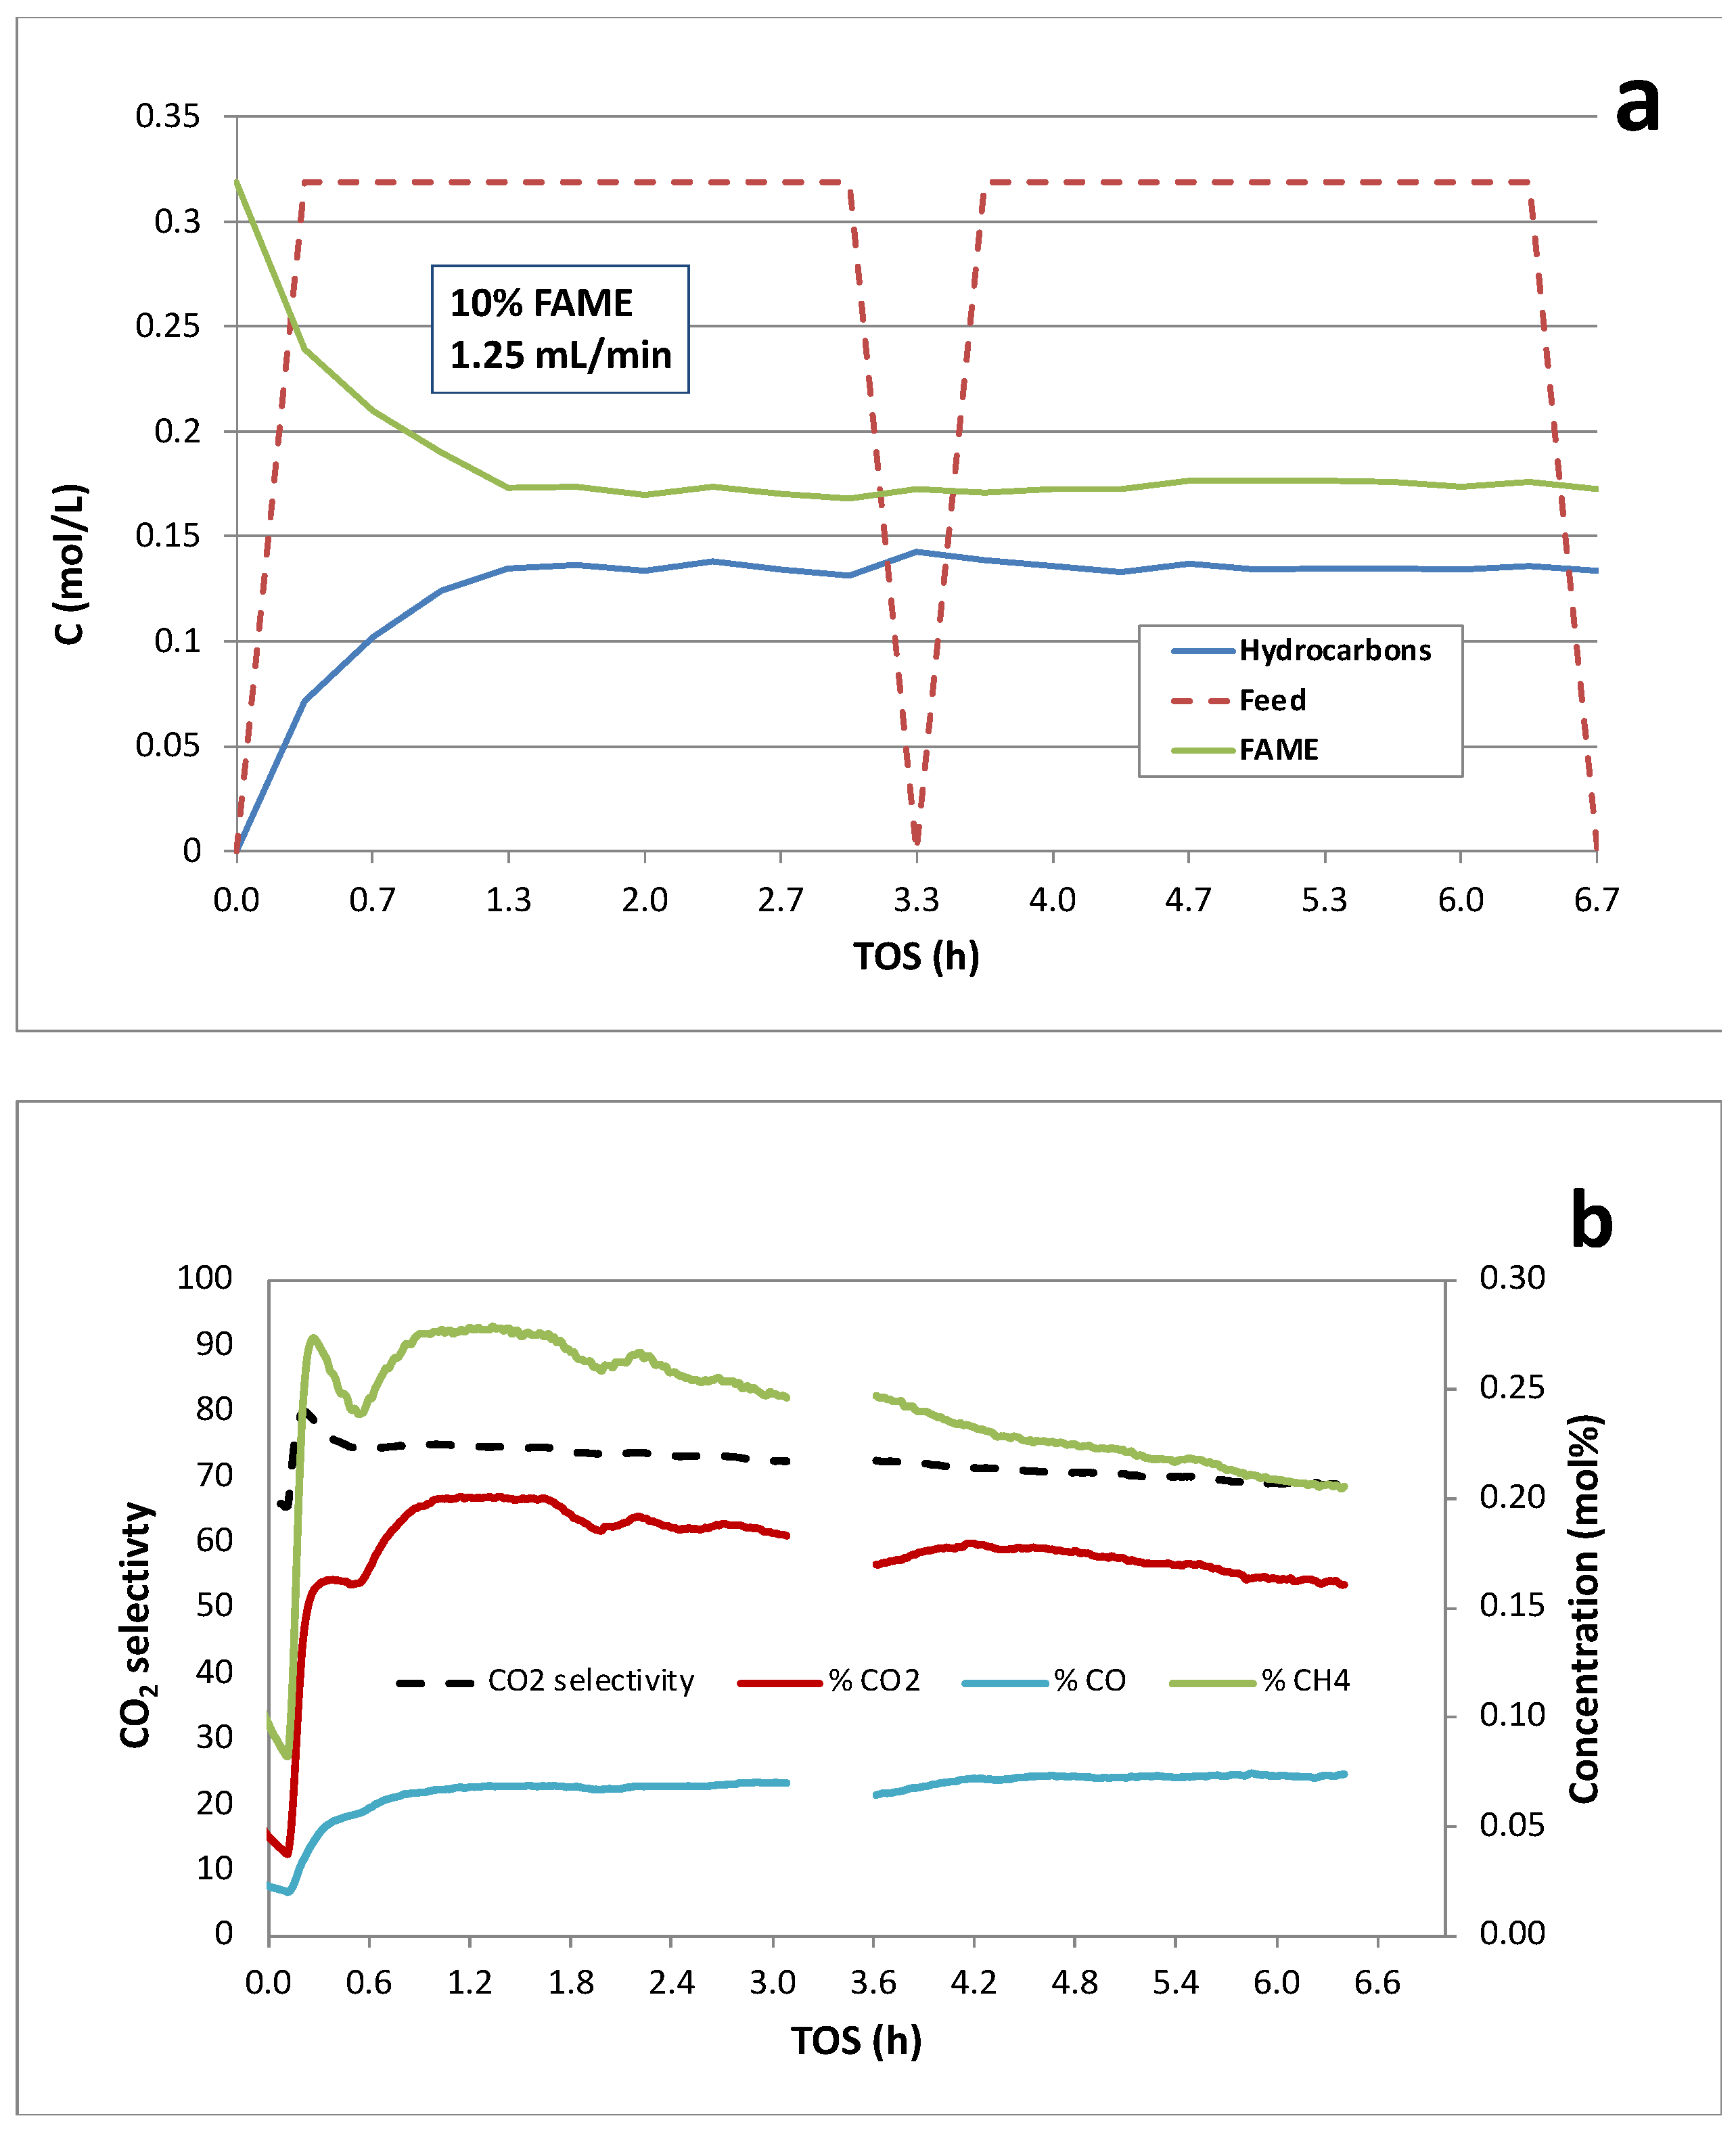
Figure 8.
Continuous catalytic deoxygenation of 10 wt.% licuri biodiesel over 5 wt.% Pd/C at 300°C and 15 bar in 5% H2/He.
Figure 8.
Continuous catalytic deoxygenation of 10 wt.% licuri biodiesel over 5 wt.% Pd/C at 300°C and 15 bar in 5% H2/He.
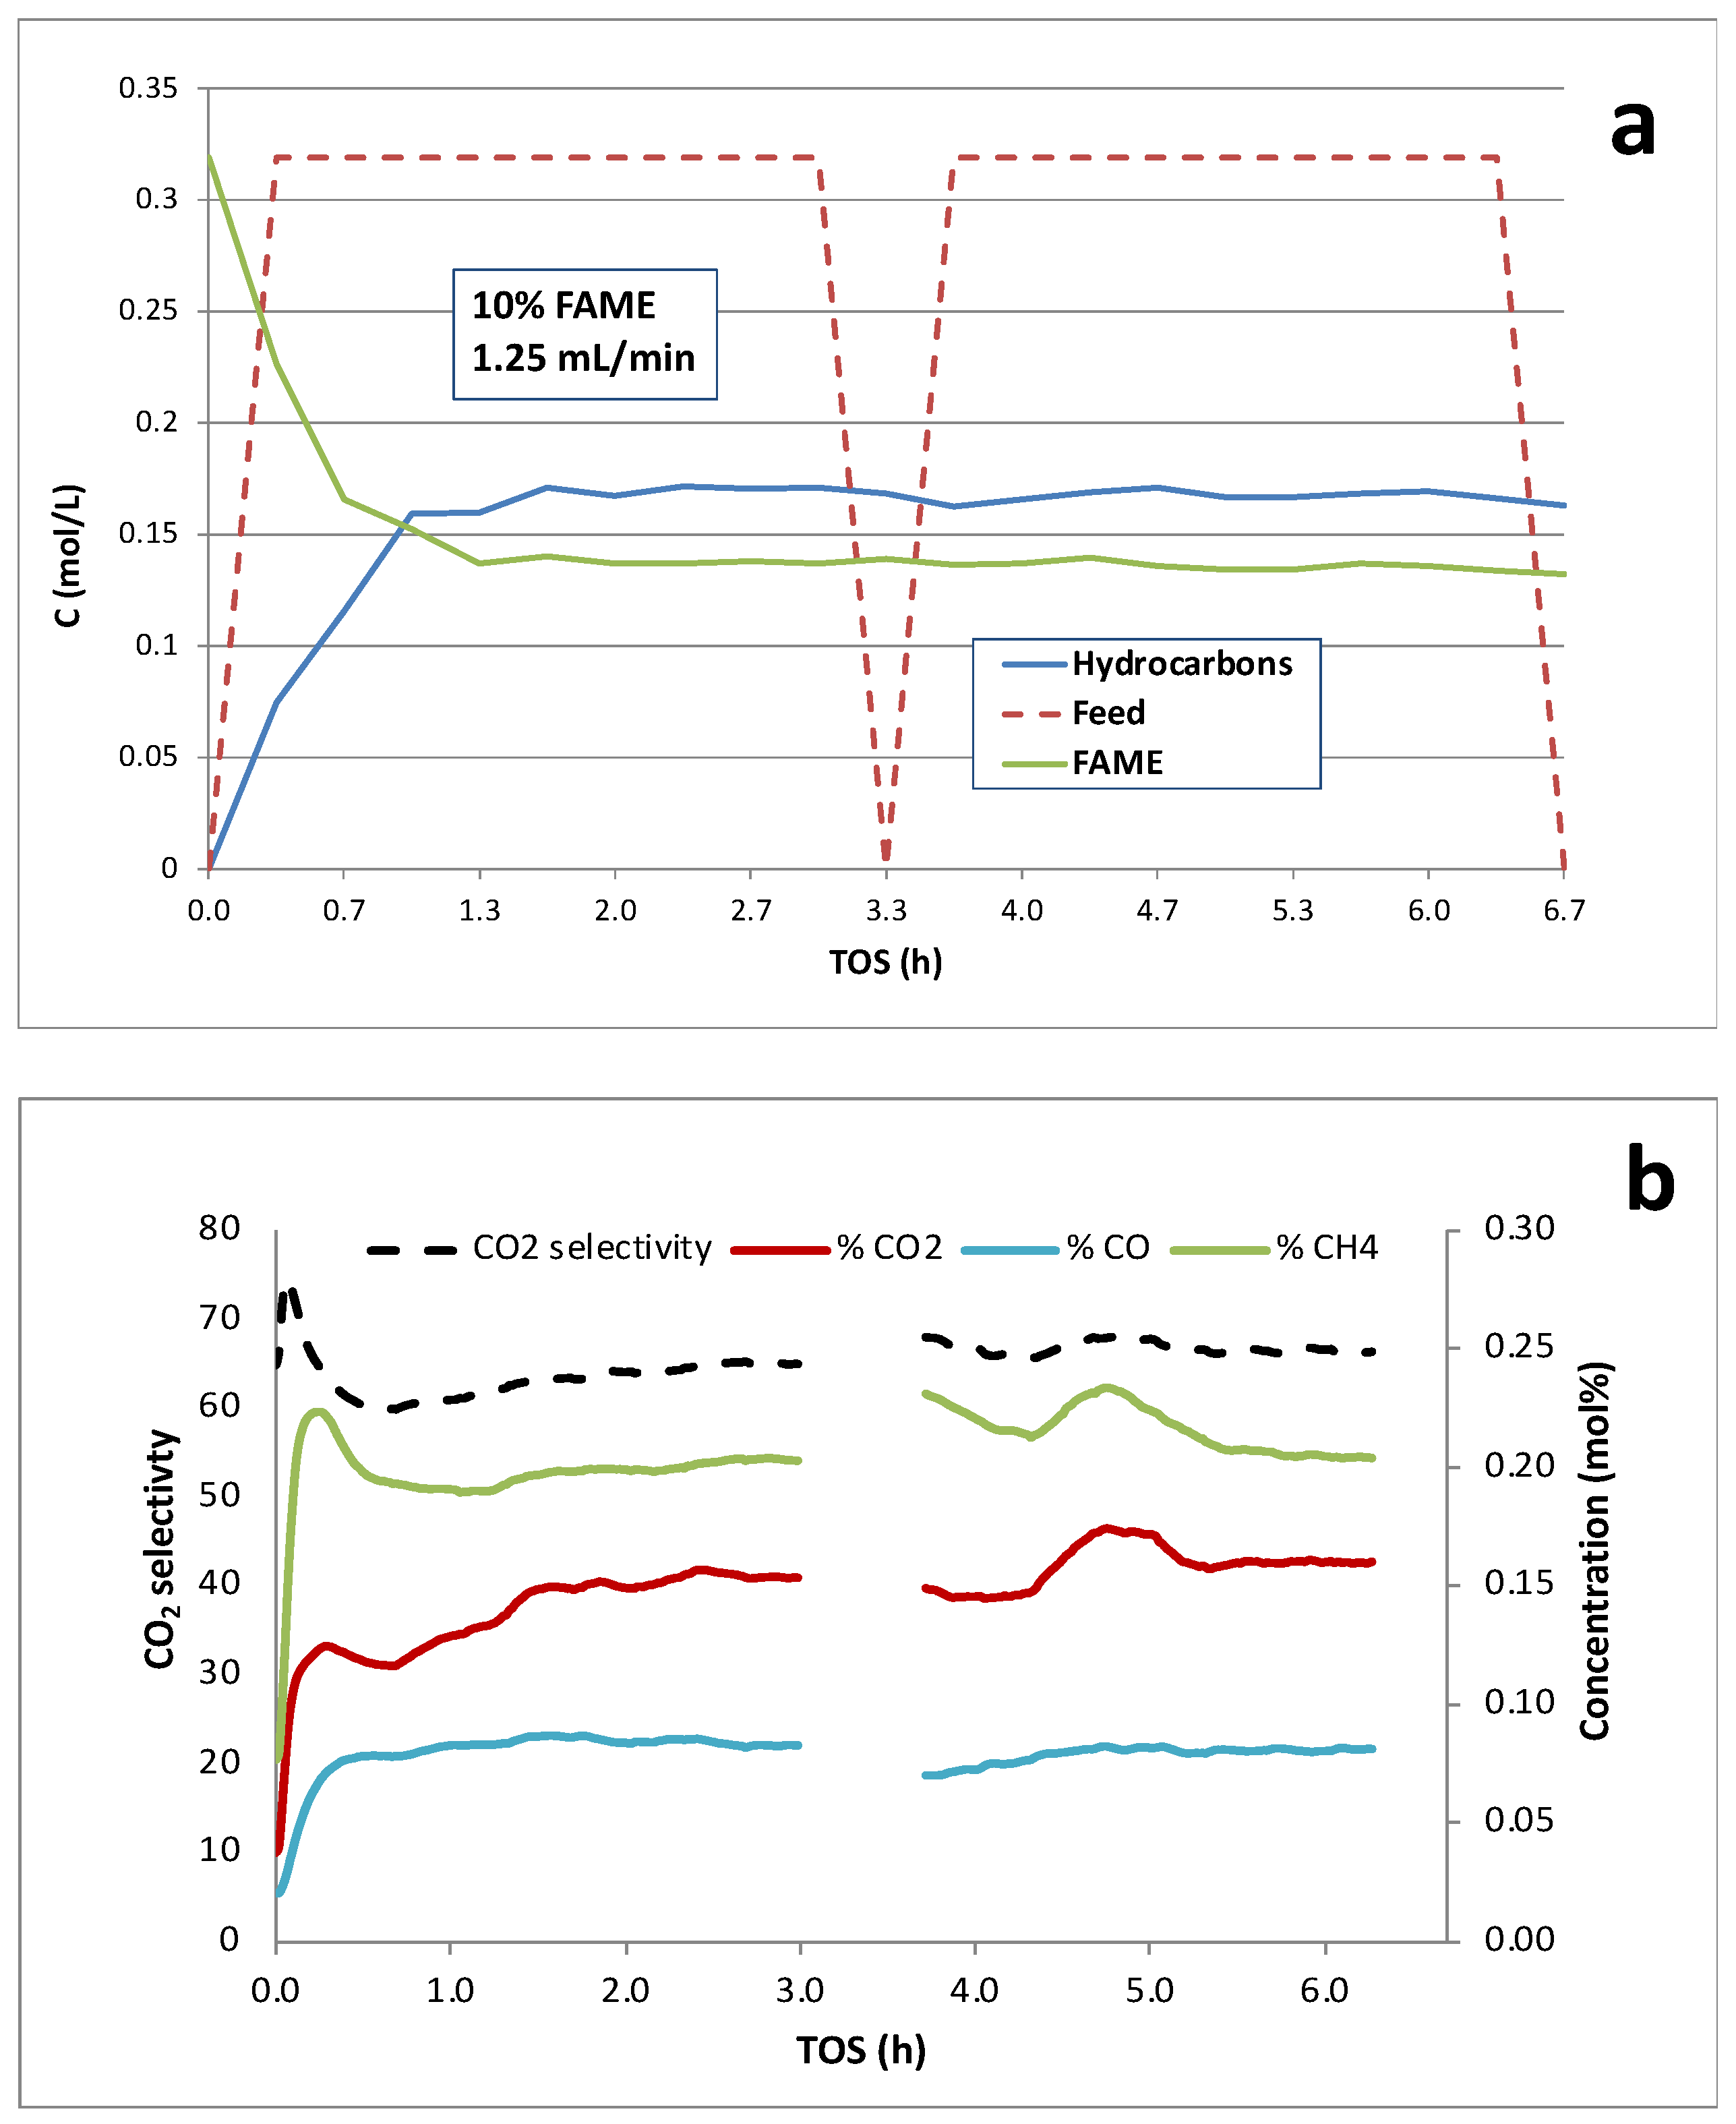

Table 1.
ICP-OES and CO pulse chemisorption results.
| Catalyst | Pd loading (wt. %) |
Dispersion (%) |
dp (nm) |
| 1 wt. % Pd/C | 0.783 | 17.2 | 6.4 |
| 5 wt. % Pd/C | 3.90 | 25.3 | 4.4 |
Table 2.
Catalytic deoxygenation of PA/C12 at 300°C, 15 bar, 5% H2/He; WHSV 0.8 h-1.
| Catalyst | PA feed concentration (wt.%) | PA conversion (%) |
C15 yield (%) |
C15 selectivity (%) | CO2 selectivity (%) |
| ACa | 10 | 5.4 | 5.1 | 91.6 | — |
| 1 wt.% Pd/C | 10 | 86.2 | 80.6 | 94.4 | 83.1 |
| 1 wt.% Pd/C | 20 | 95.1 | 86.7 | 91.3 | 81.6 |
| 1 wt.% Pd/C | 50 | 87.4 | 76.7 | 87.7 | 75.1 |
| 5 wt.% Pd/C | 20 | 96.6 | 87.4 | 90.5 | 81.5 |
aCalgon activated carbon (AC) after standard pretreatment. Inlet flow rate 0.5 mL/min.
Table 3.
Catalytic deoxygenation of MP and licuri biodiesel (FAME) at 10 wt.% in n-dodecane; 1.25 mL/min feed flow rate.
Table 3.
Catalytic deoxygenation of MP and licuri biodiesel (FAME) at 10 wt.% in n-dodecane; 1.25 mL/min feed flow rate.
| Catalyst | Feed | Conversion (%) | HC Yield (%) | HC selectivity (%) | CO2 selectivity (%) |
| 1 wt.% Pd/C | MP | 47.8 | 44.1 | 92.5 | 79.9 |
| 1 wt.% Pd/C | FAME | 45.4 | 42.3 | 93.1 | 73.7 |
| 5 wt.% Pd/C | MP | 55.7 | 51.0 | 91.8 | 70.6 |
| 5 wt.% Pd/C | FAME | 57.0 | 52.4 | 92.0 | 70.1 |
Table 4.
Licuri oil biodiesel composition [14].
Table 4.
Licuri oil biodiesel composition [14].
| FA chain length (n): double bonds (m) | mol % |
| C8:0 | 9.0 |
| C10:0 | 6.8 |
| C12:0 | 34.0 |
| C14:0 | 16.4 |
| C16:0 | 10.8 |
| C18:0 C18:1 C18:2 |
5.3 14.4 3.3 |
Table 5.
Hydrocarbon products from catalytic deoxygenation of licuri biodiesel.
| Catalyst | n-alkane products (mol %) | |||||
| C7 | C9 | C11 | C13 | C15 | C17 | |
| 1 wt.% Pd/C | 8.5 | 6.5 | 34.0 | 16.5 | 11.2 | 23.3 |
| 5 wt.% Pd/C | 8.4 | 6.5 | 33.9 | 16.6 | 11.1 | 23.5 |
Disclaimer/Publisher’s Note: The statements, opinions and data contained in all publications are solely those of the individual author(s) and contributor(s) and not of MDPI and/or the editor(s). MDPI and/or the editor(s) disclaim responsibility for any injury to people or property resulting from any ideas, methods, instructions or products referred to in the content. |
© 2025 by the authors. Licensee MDPI, Basel, Switzerland. This article is an open access article distributed under the terms and conditions of the Creative Commons Attribution (CC BY) license (http://creativecommons.org/licenses/by/4.0/).
Copyright: This open access article is published under a Creative Commons CC BY 4.0 license, which permit the free download, distribution, and reuse, provided that the author and preprint are cited in any reuse.


