
Submitted:
12 October 2025
Posted:
13 October 2025
You are already at the latest version
Abstract
Sex differences in stress response continue to be understudied in basic physiological and behavioral research. Current study aimed to investigate the sex-specific effects of chronic stress in wild-derived house mice subjected to chronic unpredictable stress (CUS). The use of mice from the wild enhanced ecological validity of our stress model. We applied CUS for 5 weeks based on protocols previously established in laboratory mice. Control mice were not subjected to stress. After the 5-week experiment, behavioral tests were performed, blood and hair samples were collected for corticosterone measurement, stress-sensitive organ weights were assessed. Stressed females, but not stressed males, gained significantly less body weight over the entire CUS period. After CUS, mice tended to have higher adrenal and thymus weights. In stressed females, we observed significantly prolonged grooming time in open field test and fewer immobility episodes in tail suspension test (TST). Stressed males displayed significantly shorter immobility time in TST. Stressed males, but not stressed females, had significantly higher levels of hair corticosterone, with a similar tendency in plasma. Our results indicate different CUS coping strategies in males and females and raise a question about development of different protocols for assessment stress response in males and females.
Keywords:
house mouse
; sex differences
; chronic unpredictable stress
; corticosterone
1. Introduction
The notion that females present a greater behavioral and physiological variation led to a bias in animal research favoring an inclusion of male rodents [1]. As a result, sex differences in basic research of behavior and physiology in general and in stress responses in particular still remain understudied [2,3,4]. Another problem lies in the practice of treating males as the standard. This has shaped the tests and parameters often applied, leaving the divergent results of females largely unexamined [1]. Thus, widely used protocols do not account for critical sex differences in physiological and behavioral responses. Notably, female rodents exhibit elevated glucocorticoid secretion with greater variability than males [5]. Human studies also confirm this narrative, showing that women are more prone to stress-related disorders, such as anxiety disorders and depression [6,7,8].
In order to survive and thrive in a constantly changing environment, whether physical or social, animals must adapt their morphology, physiology, and behavior to the new conditions. They must be able to deal with both predictable changes, like seasonal variations and light cycles, and unpredictable events, like storms, predators, and diseases [9]. The stress response system is essential for the natural adaptability of mammals. The hypothalamic-pituitary-adrenal (HPA) axis is a neuroendocrine pathway that releases hormones, mainly glucocorticoids, in response to stressors. These hormones play a crucial role in orchestrating the stress response. The characteristics of stress responses such as duration and intensity, vary both among and within populations and individuals [10,11,12]. This variation is influenced by parameters of external stressors, such as their type and temporal patterns, and internal factors, such as sex, health condition, and life stage [5,13,14].
When faced with acute stress, the organism rapidly activates a cascade of physiological changes designed to optimize survival—a primal reaction known as the “fight-or-flight” response. This adaptive mechanism sharpens focus, mobilizes energy, and prepares the individual to either confront the threat or escape it, thereby increasing their immediate chances of survival. However, prolonged exposure to chronic stress can lead to immunosuppression and increased disease risk. It may lead to a decrease in the reproductive success and survival of individuals [15,16,17,18,19], and ultimately negatively affects the dynamics of the population as a whole [20,21].
The Mus musculus (M. m.) musculus is a common species in both urban and rural areas of Russia. The area of M. m. musculus extends from Eastern Europe to Japan across Russia and northern China [22]. A number of researches refer the M. m. musculus subspecies to the rank of a separate species [23,24,25]. The majority of laboratory mouse strains are genetic mosaics of several subspecies of M. m. However, almost all of them are more closely related to another natural subspecies - M. m. domesticus [26]. Comparative studies reveal significant behavioral and neuroendocrine divergence between wild-derived mice and laboratory inbred strains, including distinct exploratory patterns, social interaction profiles, and stress hormone responses [27,28,29,30,31]. These fundamental differences challenge the ecological validity of translating laboratory-based stress response findings to natural populations.
In the present study, we applied a commonly used protocol of chronic unpredictable stress (CUS) to the synanthropic house mouse M. m. musculus of wild origin. CUS involves random, intermittent, and unpredictable exposure to different stressors over several weeks [32]. To assess the effects of CUS we chose to use non-invasive monitoring of hair corticosterone concentrations, which was adapted to the hair of wild derived M. m. musculus. Hair corticosterone concentrations in animals, whether kept in captivity or living in the wild, can be a useful indicator of both individual and population well-being. Degradation of natural habitats can lead to elevated hair glucocorticoid levels in local rodents [33]. In another study, corticosterone levels in males (M. m. domesticus) increased with the extent of visible injuries or scars when living in semi-natural conditions, and it may reflect the metabolic costs of fighting for reproduction [34,35]. In addition to its cost-effectiveness, this method also allows for easy sample collection and long-term storage at room temperature [20].
This study aimed to examine sex-specific responses to chronic stress in wild-derived synanthropic house mice, using CUS as an experimental paradigm.
2. Materials and Methods
2.1. Animals
A total of 52 M. m. musculus (26 males and 26 females), 9 months old were used in this study. The test subjects were second- and third-generation laboratory bred offspring of 11 parental pairs trapped from the wild in the Vladimir Oblast, Russia (coordinates: 56°21’N 41°21’E). Animals were housed individually under standard vivarium conditions with separate air ventilation. The room temperature was maintained at 21 ± 2 °C, and the lighting conditions were 14 hours of light and 10 hours of darkness with lights on at 8 am. Pelleted food, oat grains, sunflower seeds (Laboratorkorm, Moscow, Russia) and water were provided ad libitum. Experiments were conducted in compliance with the ARRIVE guidelines, the EU Directive 2010/63/EU and local regulations. All procedures were approved by the Bioethics committee of the Severtsov Institute of Ecology and Evolution. Every effort was made to minimize the number of animals used and their suffering.
2.2. Experimental Design
The animals were randomly assigned to two groups: a CUS group and a control group. The experimental schedule is shown in Table 1. Over 36 consecutive days (5 weeks), the CUS group mice were exposed to various stressors, while the control group mice remained unstressed, undergoing only body weight assessments. Body weights were measured once every 1-2 weeks. Animals were distributed into four balanced cohorts. After completion of the CUS procedures and one to four days of rest (duration varied systematically by cohort), behavioral tests were performed as listed in Table 1. Following this, hair samples were collected and terminal procedures were performed. Trunk blood was drawn and target organs were dissected for weighing after euthanasia.
2.3. Chronic Unpredictable Stress CUS
The procedures for CUS were adapted from protocols previously established in laboratory mice [36,37]. The following stressors were included in the protocol: restraint in 50 mL conical tubes for one hour, wet bedding for twelve hours, cage tilted at 45 degrees for one hour, lights on overnight, cold chamber at 4° С for one hour, water or food deprivation for sixteen hours, hot air stream for fifteen minutes, exposure to cat urine odor (100 μl) or exposure to rats (Rattus norvegicus) for one hour. Fresh cat urine was collected from an adult unneutered female cat and stored at −40 °C until use. For exposure to rats, cages with mice were moved to the room where the laboratory rat colony was maintained. One or two stimulation patterns were applied daily. Stress exposures started at different times between 8 am and 9 pm, and the sequence of stressors varied each day. The goal of the CUS approach is to reduce possible habituation to the stressor which can develop if the same stimulus is presented repeatedly.
2.4. Behavioral Tests
2.4.1. Open Field Test (OFT)
We used one of the modifications of a standard OFT - “hole board”. The hole-board apparatus comprised a non-transparent plastic cylinder measuring 150 cm in diameter. The walls were 120 cm high. The arena was raised three cm above the ground on a plastic stand. The floor was divided into three zones: the central zone, the buffer zone, and the wall zone. There were 8 cone-shaped holes (3 mm in diameter) in the floor, evenly spaced for each zone, and one hole in the center. At the start of the test, each mouse was placed in the wall zone of the arena.
During 60 min trial we simultaneously obtained behavioral annotations and digital video recordings using equipment mounted above the open arena (Sony 960H CCD Effio 700TVL Security Mini CCTV Camera, Tokyo, Japan). The following behavioral patterns were recorded: number of central zone entries, number of rearings, hole pokes, total duration of grooming, total duration of immobility, number of defecation boluses. Number of rearings (the mouse is stationary on its hindlimbs while raising its forelimbs off the ground and extending the body vertically) was considered as a measure of vertical investigatory activity. Number of holes investigated served as a characteristic of horizontal investigatory activity. Number of defecation boluses was used as a measure of emotionality. Total time of immobility (“freezing” behavior) was used as a correlate of passive avoidance behavior. Total time of grooming was used as an indicator of a conflict between tendency to exploration and passive-avoidance behavior [38,39]. The arena was cleaned with 70% ethanol after each animal to eliminate olfactory cues.
2.4.2. Tail Suspension Test (TST)
TST was conducted in accordance with methods described by Steru et al. [40] and Cryan et al. [41] with some minor modifications. Each mouse was suspended by attaching a piece of tape approximately 1 cm from the tip of its tail, ensuring that its forelimbs were at least 10 cm above the floor of the apparatus. To prevent the mouse from climbing the tail, the tail was passed through a small tube. The latency to the first immobile episode, duration of immobile episodes, and number of episodes were quantified using a digital video recording (Full HD Panasonic HC-V160 camera, Petaling Jaya, Selangor, Malaysia) and subsequent analysis. Testing time was extended to 10 min given the superior physical abilities of wild-derived mice compared to laboratory-bred mice.
2.5. Hair, Blood and Organ Samples Collection
Hair collection was performed after the completion of behavioral tests, and one day before the mice were sacrificed (Table 1). Hair from the lower back of the mouse (~25 mg) was shaved using an electric razor, as close to the skin as possible, without causing skin trauma. Shaved hair samples were then stored in aluminum foil bags at −4 °C, away from light, until steroid extraction and analysis.
Blood was collected from the trunk after decapitation and placed in micro-sample lithium heparin tubes (Sarstedt, Nümbrecht, Germany). Plasma samples were obtained after 10 min of centrifugation at 2000 g and stored at −40 °C until analysis.
The adrenal glands and thymus were removed and weighed immediately after euthanasia.
2.6. Corticosterone Measurement
The concentration of corticosterone, the main glucocorticoid in the house mouse, was measured using the enzyme-linked immunosorbent assay (ELISA) in both plasma and hair samples.
Hair corticosterone extraction and analysis were performed according to previously described protocols with minor modifications [42,43]. Hair samples were washed twice for 5 min with 3 mL of pure isopropanol (CAS 67-63-0, EKOS-1, Moscow, Russia) on a horizontal shaker to remove external contaminants that may contain steroids. After washing, excess isopropanol was removed and the samples were allowed to dry overnight under a fume hood at room temperature. The dried hair samples were homogenized into a fine powder using a TissureLyser II ball mill (Qiagen, Hilden, Germany) with stainless-steel grinding jars, for 5 min at 25 Hz. Subsequently, 20 mg of powdered hair sample was weighed. The duration and the frequency of grinding were selected empirically on the basis of the physical characteristics of the sample (fine grinding into powder, but not mush), as well as of the previous results of the corticosterone measurement. The powdered samples were incubated on a horizontal shaker for 24 hours with 1 mL of 80% methanol (HPLC grade from Component-reactiv LLC, Moscow, Russia). After centrifugation (2 min at 12 000 rpm), the supernatant was transferred to a clean microtube and diluted with distilled water to achieve a methanol concentration of 55%. Corticosterone concentrations in methanol extracts and blood plasma were measured using an ELISA kit (#K210R, Chema, Ltd., Moscow, Russia). The antibodies in the kit had cross-reactivity with other steroids of 1.6% with cortisol, 2.2% with progesterone, and less than 0.1% for all other steroid hormones tested. The sensitivity of the kit is < 5.0 nmol/L, and the coefficient of variation (CV) is < 8%. The absorbance was measured at a wavelength of 450 nm using a SpectraMax 340PC 384 spectrophotometer (Molecular Devices, Silicon Valley, CA, USA). Data analysis was performed using SoftMax Pro Software (http://www.moleculardevices.com/pages/software/softmax.html, accessed on 1 July 2024).
2.7. Statistical Analyses
All results are reported as mean ± standard deviation (SD). Prior to applying any analyses, the data were visually inspected using Q-Q plots and boxplots as well as were checked to fit in normal distribution (Shapiro–Wilk test, p > 0.05) and to be homoscedastic (Levene’s test, p > 0.05). Differences between groups were analyzed using two-way analysis of variance (ANOVA) with group (CUS or control) and sex as the between-subjects variables. Pairwise comparisons of group means were performed using t-test for a list of contrasts specified as follows: control males vs. control females, stressed males vs. stressed females, control males vs. stressed males, and control females vs. stressed females. If any severe violations of ANOVA assumptions were noticed, non-parametric Mann-Whitney tests were used to check the statistical significance of differences between the same group pairs as listed above. An alpha level of 0.05 was used as a significance criterion for all statistical tests. All statistical analyses were performed using rstatix package (https://CRAN.R-project.org/package=rstatix) in RStudio (version 2024.04.2+764).
3. Results
3.1. Body Weight Change
In our study, two-way ANOVA and t-test were performed to analyze the effects of CUS exposure and sex on body weight and body weight gain during the experiment. The results are shown in Figure 1 and Table 2.
At baseline (Day 1), female mice had a significantly lower body weight than males (0.9 fold; 15.26 ± 2.08 g vs. 16.72 ± 1.92 g; ANOVA, p < 0.01; effect size, η2 = 0.143; N = 26 and N = 26, respectively (full ANOVA results are shown in Table S1 of the Supplementary materials). This pattern remained unchanged throughout the experiment (Figure 1). The dynamics of body weight gain are shown in Table 2. For the entire period of experimental stress (Days 1-36), there were significant main effects of sex (ANOVA, p < 0.05; males > females; effect size, η2 = 0.135) and group (ANOVA, p < 0.01; stress < control; effect size, η2 = 0.123) on body weight gain, and interaction between the effects was not significant (ANOVA, p > 0.1; Table 2). Females exposed to CUS lost on average 0.13 g (-1%), while control females gained 0.93 g (+7%) of body weight during the entire study period. This difference was statistically significant (t-test, p < 0.01; effect size, Cohen’s d = 1.32; Table 2). In contrast, males showed no significant difference in body weight gain between the CUS and control groups over the entire study period (t-test, p > 0.1; Table 2). Both groups exhibited comparable weight gains: 0.99 g (+6%) and 1.40 g (+9%), respectively (Table 2). However, the impact of stress on body weight gain was not uniform across the experimental timeline. Over the first two weeks of the study (Days 1-15), CUS significantly suppressed body weight gain in both male and female mice (t-test, p < 0.01 and p < 0.001 respectively; effect size Cohen’s d = 1.38 and d = 2.79 respectively; Table 2). However, during the following two weeks (Days 15-29), there was no significant effect of stress on body weight gain (ANOVA, p > 0.1; Table 2). During the last week of exposure to stressors (Days 29-36), the body weight gain of stressed males did not differ significantly from that of the control males, whereas females exposed to CUS showed a significantly greater weight gain than their control counterparts (t-test, p > 0.1 and p < 0.05, respectively; effect size Cohen’s d = −0.985 in females; Table 2).
3.2. Post-Mortem Stress-Sensitive Organ Weights
Two-way ANOVAs were performed to determine the effects of CUS exposure and sex on adrenal glands and thymus weights (Table 3). CUS induced a marginally significant increase in adrenal glands weight (1.2 fold; ANOVA, p = 0.059; effect size, η2 = 0.072). The average weight of adrenal glands in females was significantly higher than in males (1.2 fold; ANOVA, p < 0.05; effect size, η2 = 0.106). Furthermore, there was a marginally significant main effect of the stress on thymus weight (ANOVA, p = 0.051; effect size, η2 = 0.077), with greater average organ weight in the CUS group compared to the control (1.2 fold). All the other tested effects and their interactions were not significant (ANOVA, all p values > 0.1, Table S3 of the Supplementary materials).
3.3. Behavioral Changes
3.3.1. OFT
The results of the OFT are shown in Figures 2 a-f. In males, no significant differences were found between the control and CUS groups for any of the measured parameters during 60 min of observations after the completion of the 5-week CUS protocol (Mann-Whitney test, all p values > 0.1; Figure 2 a-f). In females, the CUS group showed significantly longer grooming in the wall zone of the arena (Mann-Whitney test, p < 0.05, effect size = 0.417; Figure 2 c). CUS males tended to produce more fecal boluses and fewer rearings compared to CUS females, whereas control males tended to spend more time on grooming than control females (Figure 2 b-d).
3.3.2. TST
The results of TST results are shown in Figures 3 a-c. The data from 1 male control, 3 female controls, and 3 stressed females were excluded from the analysis of immobility time due to their tail-climbing behavior.
In females, CUS exposure caused a significant increase in the number of immobility episodes compared to the control group (Mann-Whitney test, p < 0.05; effect size = 0.508; Figure 3 c). However, the total immobility time and latency to the first immobility episode did not change significantly (Mann-Whitney test, all p values > 0.1; Figure 3 a-b).
In males, CUS exposure resulted in a significant reduction in the total time spent immobile (0.68-fold on average, Mann-Whitney test, p < 0.05 effect size = 0.408; Figure 3 b). However, the latency to the first episode of immobility was not significantly affected (Mann-Whitney test, p > 0.1, Figure 3 a).
CUS females had a significantly longer time of immobility and tended to have a higher number of immobility episodes compared to CUS males (Mann-Whitney test, p < 0.05 and p = 0.075 respectively; effect sizes, 0.471 and 0.387 respectively; Figure 3 b, c).
3.4. Hair and Plasma Corticosterone
Mann–Whitney test was used to analyze the effects of group (control or CUS) on corticosterone levels in blood plasma and hair samples from mice. Data from 3 male controls, 1 CUS male, and 2 female controls and 1 CUS female mice were excluded from the analysis of blood plasma corticosterone due to hemolysis or small sample volume. For blood plasma corticosterone levels (Figure 4 a), we found a significant difference between control females and males (p = 0.028, N = 11 per group, females > males). There was also a trend towards higher hormone levels in CUS males compared to control males (p = 0.088, N = 11 per group). No other statistically significant differences were found (Table S5 in the Supplementary Materials). For the combined groups of mice, there were no statistically significant differences between the CUS and the control groups (Mann-Whitney test, p = 0.264), but there was a tendency for higher corticosterone level in females compared to males (Mann-Whitney test, p = 0.0544, Table S5 in the Supplementary Materials).
For corticosterone concentrations in hair (Figure 4b), a Mann–Whitney test showed that CUS males had significantly higher levels of corticosterone than control males (p = 0.036, N = 12-14 per group). Besides, control males had lower hair corticosterone than control females (p = 0.022, N = 13-14 per group), while no other statistically significant differences were found (all p values > 0.1) (Table S5 of the Supplementary material). For the combined groups of mice, there were no statistically significant differences between the CUS and the control groups (Mann-Whitney test, p = 0.259), but females had higher corticosterone level as compared to males (Mann-Whitney test, p = 0.0406, Table S5 in the Supplementary Materials).
4. Discussion
To the best of our knowledge, we are the first to examine the effects of chronic stress exposure in house mice of wild origin under controlled laboratory conditions. We have used the CUS protocol, a well-established model for inducing behavioral, hormonal and immunological changes associated with chronic stress in laboratory strains of mice [37,44,45]. The CUS procedure lasted 5 weeks, and ten types of stressors were applied in alternating regime to reduce the process of habituation, which commonly develops with repeated exposure to homotypic stimuli [46]. To focus on the sex-specific effects of chronic stress in an ecologically relevant animal model, we used both male and female M. m. musculus of wild origin as test subjects. Sex-matched, undisturbed control groups were included for comparison. The major findings of our study were as follows. For the first two weeks of CUS, body weight gain was significantly lower in stressed mice as compared to controls, and this was evident in mice of both sexes. However, stressed females, but not stressed males, gained significantly less body weight than the same-sex control groups over the entire CUS period of 5 weeks (1). Compared to controls, stressed mice tended to have higher post-mortem adrenal and thymus weights (2). Behavioral testing after 5 weeks of CUS revealed several significant sex-specific effects of stress, such as prolonged grooming time in females in OFT, fewer immobility episodes in females in TST, and shorter immobility time in males in TST (3). Stressed males, but not stressed females, had significantly higher levels of corticosterone in hair, with a similar tendency in plasma, as compared to the same-sex controls (4).
Over the 5-week study duration, we monitored changes in body weight of mice in response to CUS application. Males weighed significantly more than females, and it is in line with the sexual size dimorphism (males larger than females) previously reported in M. m. musculus from different populations [47,48]. Chronic stress commonly leads to a reduction in body weight and/or slower weight gain in laboratory animal models [44,49,50], and similar outcomes were reported in wild rodents [51,52]. However, in some cases, stress can have the opposite effect, leading to increased food consumption and weight gain, e.g. depending on the social status and strain of the animal or its diet [53,54,55]. The results of our study show that chronically stressed mice of wild origin, both males and females, gained significantly less weight for the first two weeks than the controls, thereby proving the efficacy of the applied CUS procedure. Further development of the stress effect on body weight gain over time appeared to be sex-specific. The reduction in body weight gain under stress conditions was more pronounced in females than in males, as concluded from the gains for the entire period of CUS. Nonetheless, the significant reversal of the inhibitory effect of stress on body weight gain was observed on days 15-29 in males and days 29-36 in females. These changes may be attributed either to adaptation to stress or to dysregulation of feeding habits and metabolism caused by stress.
Prolonged exposure to stress can lead to hypertrophy or atrophy of the selected organ systems [56,57,58]. Among the most sensitive characteristics of chronic stress are adrenal and thymus weights. The expected stress-related changes in organ weights are an increase for the adrenal glands and a decrease for the thymus. Accordingly, we detected a tendency in the chronically stressed mice to have higher adrenal glands weights as compared to the controls. In addition, significantly greater adrenal gland weights were found in females compared to males, and that is consistent with many previous research observations on sexual dimorphism of adrenal gland development [59]. We also observed a tendency for elevated thymus weights in mice subjected to CUS, which is not in line with a classical stress-induced thymic involution [57]. The latter effect may be related to ongoing adaptation processes, and regenerative thymic hyperplasia has previously been reported in mice following a reduction in stress load [60].
Activation of the stress response system frequently promotes behavioral alterations involved in regulating homeostasis. In animal models, changes in emotion-related behaviors were previously reported in response to stress, such as induced anxiety, defensive reactions, decreased social interactions, and unusual sexual behavior [61]. We evaluated behavioral responses after completion of the CUS procedure and the subsequent short period of rest (1-4 days) to avoid measuring immediate reactions to the applied stressors. We utilized the OFT to investigate changes in anxiety/boldness, exploration and locomotion, since similar settings are commonly used to assess behavioral parameters of wild rodent species under semi-field or laboratory conditions [62,63]. Regarding the TST used in our study, to the best of our knowledge, this test has not been evaluated in animals of wild origin to date. TST is analogous to forced swim test (FST, also known as Porsolt’s test) [64]. Previously, we demonstrated that M. m. musculus of both sexes displayed episodes of immobility (‘behavioral despair’) in FST similar to laboratory mice [65]. The advantages of TST over FST include absence of test-induced hypothermia and no need for post-treatment [66]. Like FST, TST can be viewed as an inescapable stressor challenge situation in which the relationship between the two types of animal’s coping strategies, active and passive, can be assessed [67]. The magnitude of the stress load for the animals in this test is much greater than that experienced in the OFT.
In our study, under low levels of stress experienced during the OFT, no alterations in behavior of chronically stressed male mice were observed, while chronically stressed females exhibited significantly increased grooming time relative to control. Parameters of grooming behavior are considered to be sensitive to stress. The potential stress effects on the grooming behavior include a decrease or, conversely, an increase in this activity. The intensity of the stress is likely to be a determining factor in this regard [68]. The prolonged grooming time can be attributed to development of a conflict between active exploration nd passive avoidance behavior [38,68]. Consistently, in our previous study, wild-derived M. m. musculus exhibited significantly increased self-grooming during 10-min OFT following three daily 1-hour applications of restraint stress [65].
In our study, behavioral changes were observed in mice of both sexes under the high stress conditions of TST. Males exposed to CUS had significantly shorter total immobility time relative to the control group, which is indicative of induction of active coping strategy. Whether this result should be interpreted as an adaptation to CUS or a specific stress response remains a question, as effects of genetic background have been previously reported for this test in laboratory strains. For instance, in one study C57BL/6J males, unlike BALB/cJ males, had decreased immobility time in the TST after chronic unpredictable mild stress, whereas in the FST the expected increase in immobility was observed in both strains [69]. Stressed females in our study had significantly greater number of immobility episodes as compared to the control group. We assume that the latter parameter reflects ‘indecision’ in choosing between active and passive coping strategies, similar to grooming in the OFT.
Overall, based on our observations of morphophysiological and behavioral alterations, females appeared to be more affected by CUS exposure than males. We may suggest that CUS potentiates the manifestation of sex differences explained by sexual evolution theory, such as the enhancement of active coping in males but not in females. Duration of the effect is subject to further research, as the consequences of chronic stress can affect an animal’s behavior and physiological responses long after the stressor has ceased. Though the CUS procedure was introduced to overcome shortcomings of chronic stress models related to adjustment to treatment, adaptation may occur [70]. In our study, males seemed to adaptate to CUS faster than females.
In the present study, we have assessed corticosterone levels in plasma and hair of M. m. musculus after the end of CUS exposure. The content of glucocorticoids in various biological fluids (blood, urine, feces, hair) reflects the different periods of activity of the HPA axis. The concentration of glucocorticoids in blood rises within a few minutes in response to acute stressors. Stress-induced glucocorticoid changes in urine and feces are detected within a few days [20,71]. The concentration of glucocorticoids in hair is mainly determined by the overall activity of the HPA axis during the entire period of hair growth [20], and thus may serve as a better indicator for chronic stress than plasma corticosterone. Since it is almost impossible to avoid additional stress during blood sampling in wild animals, plasma corticosterone may be more related to acute stress response to the procedure itself rather than to CUS. In general, an increase in basal plasma corticosterone level and a greater accumulation of corticosterone in hair are expected after chronic stress in rodents [43,72,73,74]. However, over time chronically altered HPA axis function may lead to glucocorticoid deficiency [4,50].
In our study, the effect of stress on hair or plasma corticosterone levels was not detected for the entire study sample. However, higher hormone levels were detected in plasma and hair of stressed males as compared to controls (p = 0.088 and p = 0.036, respectively), but there was no similar tendency in females. As mentioned earlier, higher plasma corticosterone in CUS males as compared to male controls may be related not only to elevated basal levels of the hormone, but also to increased stress reactivity of test-subjects. No chаnge in corticosterone levels in stressed females as compared to female controls is an issue for further research, since from our behavioral and morphophysiological observations, females were definitely affected by CUS. Previously, sex-related differences in changes of corticosterone after CUS, such as absence of effect in female rodents, were reported by some researchers [50,75], though measurements in these studies were performed in plasma samples. Studies of chronic stress effects on hair corticosterone levels in female laboratory mice are scarce. Jarcho et al. [73] observed elevated hair corticosterone compared to baseline levels and controls in outbred female mice subjected to five weeks of social instability. Hohlbaum et al. [76] investigated long-term effects of housing conditions in female C57BL/6JRj mice and found no change in hair corticosterone levels; meanwhile the separated pair-housing conditions as compared to single housing led to some long-term behavioral changes that could be attributed to experienced stress.
Our study may serve for biological validation of the method of corticosterone measurement in hair of wild-derived mice. First, we observed a higher level of the hormone in chronically stressed males as compared to controls. Second, female M. m. musculus exhibited elevated corticosterone levels as compared to males. It was expected, as previous studies in rodents have shown that the level of glucocorticoid secretion is normally higher in females than in males, and that there are sex-differences in variability of measured values [5,77].
Regarding the lack of differences in hormone levels between female mouse groups in our study, we can suggest that during the first weeks of the CUS corticosterone levels were elevated in accordance with the acute phase of stress, which is consistent with the reduction in body weight gain during this period. Then this phase could be followed by a decrease in HPA activity, resulting in hair corticosterone concentration similar to that of the control group by the 5th week of stress exposure. In a recent study, Colding-Jørgensen et al. [78] proposed and experimentally confirmed that glucocorticoids not only accumulate, but also diffuse free along the hair shaft, so relatively quick elimination of corticosterone in case of hormone depot depletion in organism appears possible. Accordingly, Gáll et al. [79] observed reduced corticosterone accumulation in hair after 4 weeks of chronic unpredictable mild stress in male Wistar rats. Therefore, we suggest that the CUS protocol we have used should be modified in the type of stressors applied and/or their duration for females in order to better detect changes in HPA axis activity by measuring hair corticosterone. Including more ethologically relevant sex-specific social stressors may help to address this [4,50].
5. Conclusions
To the best of our knowledge, this study is the first to describe the effects of chronic stress exposure in house mice of wild origin under controlled laboratory conditions. Our findings may facilitate the interpretation of both field experiments and studies employing conventional laboratory mouse strains.
Our study confirms the importance of including females in research on chronic stress, as males and females of M. m. musculus showed different responses to the 5-week CUS. CUS affected physiology and behavior of M. m. musculus in a sex dependent manner. In males, our results may reflect an activation of the HPA axis in the first weeks of the experiment and subsequent adaptation to stress at least by the end of the protocol. In the case of females, after the acute phase of stress, we can argue a suppression of HPA activity in later weeks of the protocol. Thus, the study revealed a sex-based divergence in chronic stress coping strategies in M. m. musculus: males showed active strategy, whereas females rather followed a passive one.Taking the latter into consideration, future studies should address the need for optimized stress protocols in females.
Supplementary Materials
The following supporting information can be downloaded at the website of this paper posted on Preprints.org, Table S1: Body weights of mice during the experiment, 2-way ANOVA results; Table S2: Body weight gain during the experiment, 2-way ANOVA & t-test results; Table S3: Post mortem analysis of organ and body weights, 2-way ANOVA & t-test results; Table S4: Behavioral tests, Mann-Whitney test results & effect sizes; Table S5: Corticosterone levels after CUS exposure, Mann-Whitney test results & effect sizes.
Author Contributions
conceptualization, V.V.; methodology, M.K., T.L. and V.V.; formal analysis, M.K., T.L. and I.K.; investigation, I.K., M.K., O.L., T.L. and V.V..; resources, V.V.; data curation, T.L.; writing—original draft preparation, M.K., T.L. and V.V.; writing—review and editing, I.K., M.K., O.L., T.L., and V.V.; visualization, M.K. and T.L.; supervision, V.V.; project administration, V.V.; funding acquisition, V.V. All authors have read and agreed to the published version of the manuscript.
Funding
This research was funded by the RUSSIAN SCIENCE FOUNDATION, project number 23-24-00414, awarded to VV for “INVESTIGATION OF ADAPTATIONS TO CHRONIC STRESS IN WILD DERIVED HOUSE MOUSE IN FRAMEWORK OF EXPANDING THE RANGE OF BIOLOGICAL MONITORING METHODS”.
Institutional Review Board Statement
The study was approved by the Bioethics Committee at the A.N. SEVERTSOV INSTITUTE OF ECOLOGY & EVOLUTION OF RUSSIAN ACADEMY OF SCIENCES (protocol No.59 from 28.01.2022).
Informed Consent Statement
Not applicable.
Data Availability Statement
Dataset available on request from the corresponding author.
Conflicts of Interest
The authors declare no conflicts of interest. The funders had no role in the design of the study; in the collection, analyses, or interpretation of data; in the writing of the manuscript; or in the decision to publish the results.
Abbreviations
The following abbreviations are used in this manuscript:
| M. m. | Mus musculus |
| CUS | Chronic unpredictable stress |
| OFT | Open field test |
| TST | Tail suspension test |
| FST | Forced swim test |
| HPA | Hypothalamic-pituitary-adrenal |
| ELISA | Enzyme-linked immunosorbent assay |
| SD | Standard deviation |
| ANOVA | Analysis of variance |
References
- Becegato, M.; Silva, R.H. Female Rodents in Behavioral Neuroscience: Narrative Review on the Methodological Pitfalls. Physiol. Behav. 2024, 284, 114645. [Google Scholar] [CrossRef]
- Beery, A.K.; Zucker, I. Sex Bias in Neuroscience and Biomedical Research. Neurosci. Biobehav. Rev. 2011, 35, 565–572. [Google Scholar] [CrossRef]
- Woitowich, N.C.; Beery, A.; Woodruff, T. A 10-Year Follow-up Study of Sex Inclusion in the Biological Sciences. eLife 2020, 9, e56344. [Google Scholar] [CrossRef]
- Tran, I.; Gellner, A.-K. Long-Term Effects of Chronic Stress Models in Adult Mice. J. Neural. Transm. 2023, 130, 1133–1151. [Google Scholar] [CrossRef] [PubMed]
- Oyola, M.G.; Handa, R.J. Hypothalamic–Pituitary–Adrenal and Hypothalamic–Pituitary–Gonadal Axes: Sex Differences in Regulation of Stress Responsivity. Stress 2017, 20, 476–494. [Google Scholar] [CrossRef] [PubMed]
- Bekker, M.H.J.; Van Mens-Verhulst, J. Anxiety Disorders: Sex Differences in Prevalence, Degree, and Background, But Gender-Neutral Treatment. Gend. Med. 2007, 4, S178–S193. [Google Scholar] [CrossRef] [PubMed]
- Altemus, M.; Sarvaiya, N.; Neill Epperson, C. Sex Differences in Anxiety and Depression Clinical Perspectives. Front. Neuroendocrinol. 2014, 35, 320–330. [Google Scholar] [CrossRef]
- Bangasser, D.A.; Cuarenta, A. Sex Differences in Anxiety and Depression: Circuits and Mechanisms. Nat. Rev. Neurosci. 2021, 22, 674–684. [Google Scholar] [CrossRef] [PubMed]
- McEwen, B.S.; Wingfield, J.C. The Concept of Allostasis in Biology and Biomedicine. Horm. Behav. 2003, 43, 2–15. [Google Scholar] [CrossRef]
- Hau, M.; Casagrande, S.; Ouyang, J.Q.; Baugh, A.T. Glucocorticoid-Mediated Phenotypes in Vertebrates. In Advances in the Study of Behavior; Elsevier, 2016; Vol. 48, pp. 41–115 ISBN 9780128047873.
- Vitousek, M.N.; Johnson, M.A.; Downs, C.J.; Miller, E.T.; Martin, L.B.; Francis, C.D.; Donald, J.W.; Fuxjager, M.J.; Goymann, W.; Hau, M.; et al. Macroevolutionary Patterning in Glucocorticoids Suggests Different Selective Pressures Shape Baseline and Stress-Induced Levels. Am. Nat. 2019, 193, 866–880. [Google Scholar] [CrossRef]
- Guindre-Parker, S. Individual Variation in Glucocorticoid Plasticity: Considerations and Future Directions. Integr. Comp. Biol. 2020, 60, 79–88. [Google Scholar] [CrossRef]
- Kudielka, B.M.; Buske-Kirschbaum, A.; Hellhammer, D.H.; Kirschbaum, C. HPA Axis Responses to Laboratory Psychosocial Stress in Healthy Elderly Adults, Younger Adults, and Children: Impact of Age and Gender. Psychoneuroendocrinology 2004, 29, 83–98. [Google Scholar] [CrossRef]
- Silverman, M.N.; Pearce, B.D.; Biron, C.A.; Miller, A.H. Immune Modulation of the Hypothalamic-Pituitary-Adrenal (HPA) Axis during Viral Infection. Viral Immunol. 2005, 18, 41–78. [Google Scholar] [CrossRef]
- Cyr, N.E.; Michael Romero, L. Chronic Stress in Free-Living European Starlings Reduces Corticosterone Concentrations and Reproductive Success. Gen. Comp. Endocrinol. 2007, 151, 82–89. [Google Scholar] [CrossRef]
- Voznessenskaya, V.V.; Malanina, T.V. Effect of Chemical Signals from a Predator (Felis Catus) on the Reproduction of Mus Musculus. Dokl. Biol. Sci. 2013, 453, 362–364. [Google Scholar] [CrossRef] [PubMed]
- Voznessenskaya, V.V. Influence of Cat Odor on Reproductive Behavior and Physiology in the House Mouse: (Mus Musculus). In Neurobiology of Chemical Communication; Mucignat-Caretta, C., Ed.; Frontiers in Neuroscience; CRC Press/Taylor & Francis: Boca Raton (FL), 2014; pp. 389-405. ISBN 9781466553415.
- Kvasha, I.G.; Laktionova, T.K.; Voznessenskaya, V.V. The Presentation Rate of Chemical Signals of the Domestic Cat Felis Catus Affects the Reproductive Status of the House Mouse. Biol. Bull. Russ. Acad. Sci. 2018, 45, 278–283. [Google Scholar] [CrossRef]
- Valsamakis, G.; Chrousos, G.; Mastorakos, G. Stress, Female Reproduction and Pregnancy. Psychoneuroendocrinology 2019, 100, 48–57. [Google Scholar] [CrossRef] [PubMed]
- Sheriff, M.J.; Dantzer, B.; Delehanty, B.; Palme, R.; Boonstra, R. Measuring Stress in Wildlife: Techniques for Quantifying Glucocorticoids. Oecologia 2011, 166, 869–887. [Google Scholar] [CrossRef]
- Rogovin, K.A.; Moshkin, M.P. [Autoregulation in mammalian populations and stress: an old theme revisited]. Zh. Obshch. Biol. 2007, 68, 244–267. [Google Scholar] [PubMed]
- Bonhomme, F.; Gué, J.-L. Mouse Inbred Strains, Origins Of. In Encyclopedia of Immunology; Elsevier, 1998; pp. 1771–1774 ISBN 9780122267659.
- Sage, R.D.; Atchley, W.R.; Capanna, E. House Mice as Models in Systematic Biology. Syst. Biol. 1993, 42, 523–561. [Google Scholar] [CrossRef]
- Bonhomme, F.; Anand, R.; Darviche, D.; Din, W.; Boursot, P. The mouse as a ring species? In Genetics in Wild Mice. Its Application to Biomedical Research; Moriwaki, K., Shiroishi, T., Yonekawa, H., Eds.; Japan Scientific Societies Press: Tokyo, 1994; pp. 13–23.
- Kotenkova, E.V.; Mal’tsev, A.N.; Ambaryan, A.V. Experimental Analysis of the Reproductive Potential of House Mice (Mus Musculus Sensu Lato, Rodentia, Muridae) in Transcaucasia and Other Regions. Biol. Bull. Russ. Acad. Sci. 2018, 45, 884–897. [Google Scholar] [CrossRef]
- Yang, H.; Wang, J.R.; Didion, J.P.; Buus, R.J.; Bell, T.A.; Welsh, C.E.; Bonhomme, F.; Yu, A.H.-T.; Nachman, M.W.; Pialek, J.; et al. Subspecific Origin and Haplotype Diversity in the Laboratory Mouse. Nat. Genet. 2011, 43, 648–655. [Google Scholar] [CrossRef]
- Gregorová, S.; Forejt, J. PWD/Ph and PWK/Ph Inbred Mouse Strains of Mus m. Musculus Subspecies--a Valuable Resource of Phenotypic Variations and Genomic Polymorphisms. Folia Biol. (Praha) 2000, 46, 31–41. [Google Scholar]
- Fernandes, C.; Liu, L.; Paya-Cano, J.L.; Gregorová, S.; Forejt, J.; Schalkwyk, L.C. Behavioral Characterization of Wild Derived Male Mice (Mus Musculus Musculus) of the PWD/Ph Inbred Strain: High Exploration Compared to C57BL/6J. Behav. Genet. 2004, 34, 621–630. [Google Scholar] [CrossRef] [PubMed]
- Bímová, B.; Albrecht, T.; Macholán, M.; Piálek, J. Signalling Components of the House Mouse Mate Recognition System. Behav. Processes 2009, 80, 20–27. [Google Scholar] [CrossRef] [PubMed]
- Ambaryan, A.V.; Voznessenskaya, V.V.; Kotenkova, E.V. Mating Behavior Differences in Monogamous and Polygamous Sympatric Closely Related Species Mus Musculus and Mus Spicilegus and Their Role in Behavioral Precopulatory Isolation. Rus. J. Theriol. 2019, 18, 67–79. [Google Scholar] [CrossRef]
- Hiadlovská, Z.; Hamplová, P.; Berchová Bímová, K.; Macholán, M.; Vošlajerová Bímová, B. Ontogeny of Social Hierarchy in Two European House Mouse Subspecies and Difference in the Social Rank of Dispersing Males. Behav. Processes 2021, 183, 104316. [Google Scholar] [CrossRef]
- Willner, P. The Chronic Mild Stress (CMS) Model of Depression: History, Evaluation and Usage. Neurobiol. Stress 2017, 6, 78–93. [Google Scholar] [CrossRef] [PubMed]
- Boyle, S.A.; De La Sancha, N.U.; Pérez, P.; Kabelik, D. Small Mammal Glucocorticoid Concentrations Vary with Forest Fragment Size, Trap Type, and Mammal Taxa in the Interior Atlantic Forest. Sci. Rep. 2021, 11, 2111. [Google Scholar] [CrossRef]
- Carlitz, E.H.D.; Runge, J.-N.; König, B.; Winkler, L.; Kirschbaum, C.; Gao, W.; Lindholm, A.K. Steroid Hormones in Hair Reveal Sexual Maturity and Competition in Wild House Mice (Mus Musculus Domesticus). Sci. Rep. 2019, 9, 16925. [Google Scholar] [CrossRef]
- Carlitz, E.H.D.; Lindholm, A.K.; Gao, W.; Kirschbaum, C.; König, B. Steroid Hormones in Hair and Fresh Wounds Reveal Sex Specific Costs of Reproductive Engagement and Reproductive Success in Wild House Mice (Mus Musculus Domesticus). Horm. Behav. 2022, 138, 105102. [Google Scholar] [CrossRef] [PubMed]
- Surget, A.; Belzung, C. Unpredictable chronic mild stress in mice. In Experimental Animal Models in Neurobehavioral Research; Kalueff, A.V., LaPorte, J.L., Eds.; Nova Science: New York, NY, USA, 2008; pp. 79–112. ISBN 9781606920220. [Google Scholar]
- Monteiro, S.; Roque, S.; De Sá-Calçada, D.; Sousa, N.; Correia-Neves, M.; Cerqueira, J.J. An Efficient Chronic Unpredictable Stress Protocol to Induce Stress-Related Responses in C57BL/6 Mice. Front. Psychiatry 2015, 6. [Google Scholar] [CrossRef] [PubMed]
- Stone, E.A.; Manavalan, S.J.; Zhang, Y.; Quartermain, D. Beta Adrenoceptor Blockade Mimics Effects of Stress on Motor Activity in Mice. Neuropsychopharmacol. 1995, 12, 65–71. [Google Scholar] [CrossRef]
- Stanford, S.C. The Open Field Test: Reinventing the Wheel. J. Psychopharmacol. 2007, 21, 134–135. [Google Scholar] [CrossRef] [PubMed]
- Steru, L.; Chermat, R.; Thierry, B.; Simon, P. The Tail Suspension Test: A New Method for Screening Antidepressants in Mice. Psychopharmacology 1985, 85, 367–370. [Google Scholar] [CrossRef]
- Cryan, J.F.; Mombereau, C.; Vassout, A. The Tail Suspension Test as a Model for Assessing Antidepressant Activity: Review of Pharmacological and Genetic Studies in Mice. Neurosci. Biobehav. Rev. 2005, 29, 571–625. [Google Scholar] [CrossRef]
- Davenport, M.D.; Tiefenbacher, S.; Lutz, C.K.; Novak, M.A.; Meyer, J.S. Analysis of Endogenous Cortisol Concentrations in the Hair of Rhesus Macaques. Gen. Comp. Endocrinol. 2006, 147, 255–261. [Google Scholar] [CrossRef]
- Erickson, R.L.; Browne, C.A.; Lucki, I. Hair Corticosterone Measurement in Mouse Models of Type 1 and Type 2 Diabetes Mellitus. Physiol. Behav. 2017, 178, 166–171. [Google Scholar] [CrossRef]
- Willner, P. Validity, Reliability and Utility of the Chronic Mild Stress Model of Depression: A 10-Year Review and Evaluation. Psychopharmacology 1997, 134, 319–329. [Google Scholar] [CrossRef]
- Fang, X.; Jiang, S.; Wang, J.; Bai, Y.; Kim, C.S.; Blake, D.; Weintraub, N.L.; Lei, Y.; Lu, X.-Y. Chronic Unpredictable Stress Induces Depression-Related Behaviors by Suppressing AgRP Neuron Activity. Mol. Psychiatry 2021, 26, 2299–2315. [Google Scholar] [CrossRef]
- Grissom, N.; Bhatnagar, S. Habituation to Repeated Stress: Get Used to It. Neurobiol. Learn. Mem. 2009, 92, 215–224. [Google Scholar] [CrossRef]
- Dewsbury, D.A.; Baumgerdner, D.J.; Evans, R.L.; Webster, D.G. Sexual Dimorphism for Body Mass in 13 Taxa of Muroid Rodents under Laboratory Conditions. J. Mammal. 1980, 61, 146–149. [Google Scholar] [CrossRef]
- Haisová-Slábová, M.; Munclinger, P.; Frynta, D. Sexual Size Dimorphism in Free-living Populations of Mus Musculus: Are Male House Mice Bigger? Acta Zool. Hung. 2010, 56, 139–151. [Google Scholar]
- François, M.; Fernández-Gayol, O.; Zeltser, L.M. A Framework for Developing Translationally Relevant Animal Models of Stress-Induced Changes in Eating Behavior. Biol. Psychiatry 2022, 91, 888–897. [Google Scholar] [CrossRef]
- Furman, O.; Tsoory, M.; Chen, A. Differential Chronic Social Stress Models in Male and Female Mice. Eur. J. Neurosci. 2022, 55, 2777–2793. [Google Scholar] [CrossRef] [PubMed]
- Wallace, M.E. Effects of Stress Due to Deprivation and Transport in Different Genotypes of House Mouse. Lab. Anim. 1976, 10, 335–347. [Google Scholar] [CrossRef] [PubMed]
- Fischer, C.P.; Romero, L.M. Chronic Captivity Stress in Wild Animals Is Highly Species-Specific. Conserv. Physiol. 2019, 7, coz093. [Google Scholar] [CrossRef]
- Bartolomucci, A.; Cabassi, A.; Govoni, P.; Ceresini, G.; Cero, C.; Berra, D.; Dadomo, H.; Franceschini, P.; Dell’Omo, G.; Parmigiani, S.; et al. Metabolic Consequences and Vulnerability to Diet-Induced Obesity in Male Mice under Chronic Social Stress. PLoS ONE 2009, 4, e4331. [Google Scholar] [CrossRef]
- Razzoli, M.; Carboni, L.; Andreoli, M.; Ballottari, A.; Arban, R. Different Susceptibility to Social Defeat Stress of BalbC and C57BL6/J Mice. Behav. Brain. Res. 2011, 216, 100–108. [Google Scholar] [CrossRef]
- Sanghez, V.; Razzoli, M.; Carobbio, S.; Campbell, M.; McCallum, J.; Cero, C.; Ceresini, G.; Cabassi, A.; Govoni, P.; Franceschini, P.; et al. Psychosocial Stress Induces Hyperphagia and Exacerbates Diet-Induced Insulin Resistance and the Manifestations of the Metabolic Syndrome. Psychoneuroendocrinology 2013, 38, 2933–2942. [Google Scholar] [CrossRef]
- Ulrich-Lai, Y.M.; Figueiredo, H.F.; Ostrander, M.M.; Choi, D.C.; Engeland, W.C.; Herman, J.P. Chronic Stress Induces Adrenal Hyperplasia and Hypertrophy in a Subregion-Specific Manner. Am. J. Physiol. Endocrinol. Metab. 2006, 291, E965–E973. [Google Scholar] [CrossRef] [PubMed]
- Gruver, A.L.; Sempowski, G.D. Cytokines, Leptin, and Stress-Induced Thymic Atrophy. J. Leukoc. Biol. 2008, 84, 915–923. [Google Scholar] [CrossRef] [PubMed]
- Borrow, A.P.; Heck, A.L.; Miller, A.M.; Sheng, J.A.; Stover, S.A.; Daniels, R.M.; Bales, N.J.; Fleury, T.K.; Handa, R.J. Chronic Variable Stress Alters Hypothalamic-Pituitary-Adrenal Axis Function in the Female Mouse. Physiol. Behav. 2019, 209, 112613. [Google Scholar] [CrossRef]
- Bielohuby, M.; Herbach, N.; Wanke, R.; Maser-Gluth, C.; Beuschlein, F.; Wolf, E.; Hoeflich, A. Growth Analysis of the Mouse Adrenal Gland from Weaning to Adulthood: Time- and Gender-Dependent Alterations of Cell Size and Number in the Cortical Compartment. Am. J. Physiol. Endocrinol. Metab. 2007, 293, E139–E146. [Google Scholar] [CrossRef]
- Domínguez-Gerpe, L.; Rey-Méndez, M. Evolution of the Thymus Size in Response to Physiological and Random Events throughout Life. Microsc. Res. Tech. 2003, 62, 464–476. [Google Scholar] [CrossRef]
- Atrooz, F.; Alkadhi, K.A.; Salim, S. Understanding Stress: Insights from Rodent Models. Curr. Res. Neurobiol. 2021, 2, 100013. [Google Scholar] [CrossRef]
- Sokolov, V.E.; Zagoruĭko, N.V.; Meshkova, N.N.; Kotenkova, E.V. [Exploratory behavior of synantropic and outdoor forms of house mice of superspecies Mus musculus S. lato: a comparative analysis]. Dokl. Akad. Nauk. 1993, 332, 540–542. [Google Scholar]
- Vošlajerová Bímová, B.; Mikula, O.; Macholán, M.; Janotová, K.; Hiadlovská, Z. Female House Mice Do Not Differ in Their Exploratory Behaviour from Males. Ethology 2016, 122, 298–307. [Google Scholar] [CrossRef]
- Porsolt, R.D.; Bertin, A.; Jalfre, M. Behavioral Despair in Mice: A Primary Screening Test for Antidepressants. Arch. Int. Pharmacodyn. Ther. 1977, 229, 327–336. [Google Scholar]
- Klyuchnikova, M.A. Evaluation of Behavioral Responses to Restraint Stress in the House Mouse (Mus Musculus Musculus) of Wild Origin. Biosci. J. 2024, 40, e40043. [Google Scholar] [CrossRef]
- Castagné, V.; Moser, P.; Roux, S.; Porsolt, R.D. Rodent Models of Depression: Forced Swim and Tail Suspension Behavioral Despair Tests in Rats and Mice. Curr. Protoc. Neurosci. 2011, 55. [Google Scholar] [CrossRef]
- Molendijk, M.L.; De Kloet, E.R. Forced Swim Stressor: Trends in Usage and Mechanistic Consideration. Eur. J. Neurosci. 2022, 55, 2813–2831. [Google Scholar] [CrossRef]
- Kalueff, A.V.; Stewart, A.M.; Song, C.; Berridge, K.C.; Graybiel, A.M.; Fentress, J.C. Neurobiology of Rodent Self-Grooming and Its Value for Translational Neuroscience. Nat. Rev. Neurosci. 2016, 17, 45–59. [Google Scholar] [CrossRef] [PubMed]
- Mineur, Y.S.; Belzung, C.; Crusio, W.E. Effects of Unpredictable Chronic Mild Stress on Anxiety and Depression-like Behavior in Mice. Behav. Brain Res. 2006, 175, 43–50. [Google Scholar] [CrossRef] [PubMed]
- Pałucha-Poniewiera, A.; Podkowa, K.; Rafało-Ulińska, A.; Brański, P.; Burnat, G. The Influence of the Duration of Chronic Unpredictable Mild Stress on the Behavioural Responses of C57BL/6J Mice. Behav. Pharmacol. 2020, 31, 574–582. [Google Scholar] [CrossRef]
- Palme, R. Non-Invasive Measurement of Glucocorticoids: Advances and Problems. Physiol. Behav. 2019, 199, 229–243. [Google Scholar] [CrossRef] [PubMed]
- Scorrano, F.; Carrasco, J.; Pastor-Ciurana, J.; Belda, X.; Rami-Bastante, A.; Bacci, M.L.; Armario, A. Validation of the Long-term Assessment of Hypothalamic-pituitary-adrenal Activity in Rats Using Hair Corticosterone as a Biomarker. FASEB J. 2015, 29, 859–867. [Google Scholar] [CrossRef]
- Jarcho, M.R.; Massner, K.J.; Eggert, A.R.; Wichelt, E.L. Behavioral and Physiological Response to Onset and Termination of Social Instability in Female Mice. Horm. Behav. 2016, 78, 135–140. [Google Scholar] [CrossRef]
- Tsuchimine, S.; Matsuno, H.; O’Hashi, K.; Chiba, S.; Yoshimura, A.; Kunugi, H.; Sohya, K. Comparison of Physiological and Behavioral Responses to Chronic Restraint Stress between C57BL/6J and BALB/c Mice. Biochem. Biophys. Res. Commun. 2020, 525, 33–38. [Google Scholar] [CrossRef]
- Trainor, B.C.; Pride, M.C.; Villalon Landeros, R.; Knoblauch, N.W.; Takahashi, E.Y.; Silva, A.L.; Crean, K.K. Sex Differences in Social Interaction Behavior Following Social Defeat Stress in the Monogamous California Mouse (Peromyscus Californicus). PLoS ONE 2011, 6, e17405. [Google Scholar] [CrossRef]
- Hohlbaum, K.; Merle, R.; Frahm, S.; Rex, A.; Palme, R.; Thöne-Reineke, C.; Ullmann, K. Effects of Separated Pair Housing of Female C57BL/6JRj Mice on Well-Being. Sci. Rep. 2022, 12, 8819. [Google Scholar] [CrossRef]
- Veloso-Frías, J.; Soto-Gamboa, M.; Mastromonaco, G.; Acosta-Jamett, G. Seasonal Hair Glucocorticoid Fluctuations in Wild Mice (Phyllotis Darwini) within a Semi-Arid Landscape in North-Central Chile. Animals 2024, 14, 1260. [Google Scholar] [CrossRef] [PubMed]
- Colding-Jørgensen, P.; Hestehave, S.; Abelson, K.S.P.; Kalliokoski, O. Hair Glucocorticoids Are Not a Historical Marker of Stress – Exploring the Time-Scale of Corticosterone Incorporation into Hairs in a Rat Model. Gen. Comp. Endocrinol. 2023, 341, 114335. [Google Scholar] [CrossRef] [PubMed]
- Gáll, Z.; Farkas, S.; Albert, Á.; Ferencz, E.; Vancea, S.; Urkon, M.; Kolcsár, M. Effects of Chronic Cannabidiol Treatment in the Rat Chronic Unpredictable Mild Stress Model of Depression. Biomolecules 2020, 10, 801. [Google Scholar] [CrossRef] [PubMed]
Figure 1.
Body weight changes in mice. Asterisks indicate the significance level of sex differences in body weight of mice revealed by two-way ANOVA with sex and group as main effects, ** p < 0.01, *** p < 0.001. At Day 1 there was a significant effect of the group (p < 0.05). No other significant effects or their interactions were found. Full ANOVA results are available in Table S1 of the Supplementary materials. Data are expressed as mean ± SD. N = 12-14 per group.
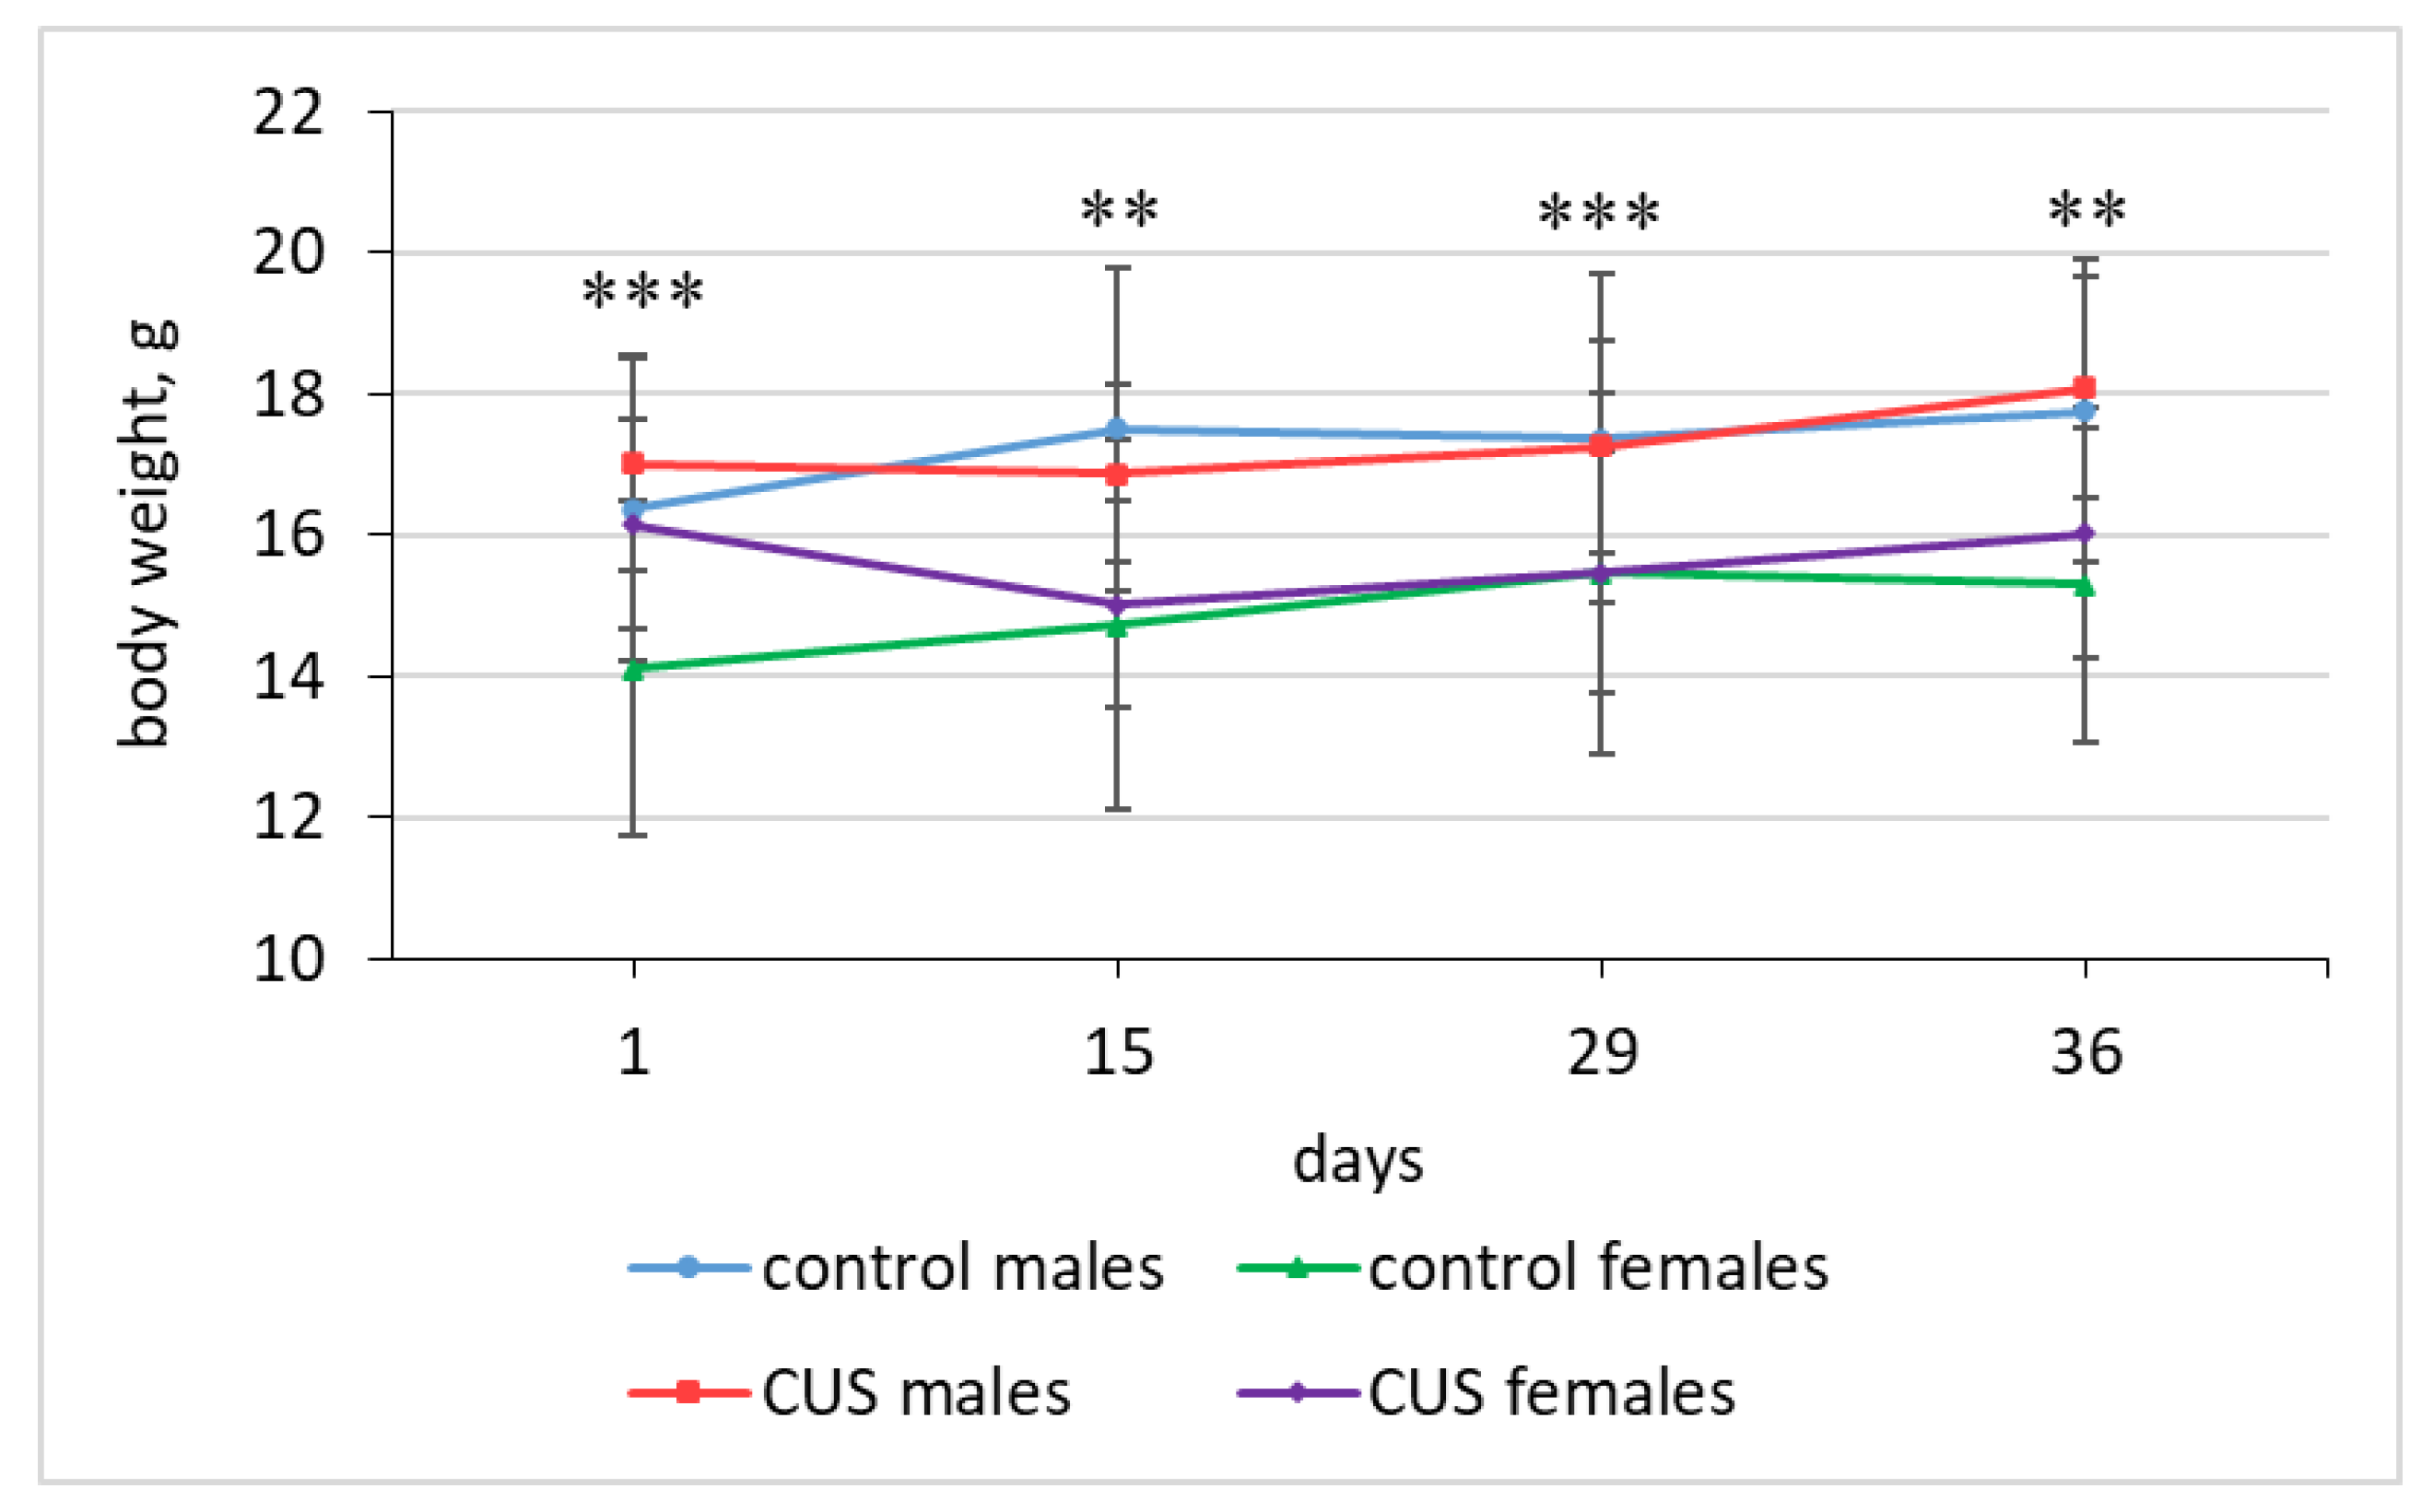
Figure 2.
OFT parameters after CUS exposure in M. m. musculus: (a) The number of entries to the central zone of the arena; (b) The number of defecation boluses; (c) Total grooming time; (d) The number of rearings; (e) The number of hole pokes; (f) Total immobility time. Bars are mean values, bar errors show SDs, * p < 0.05, Mann-Whitney test, N = 12-14 per group. Full Mann-Whitney test results are available in Table S4 of the Supplementary materials.
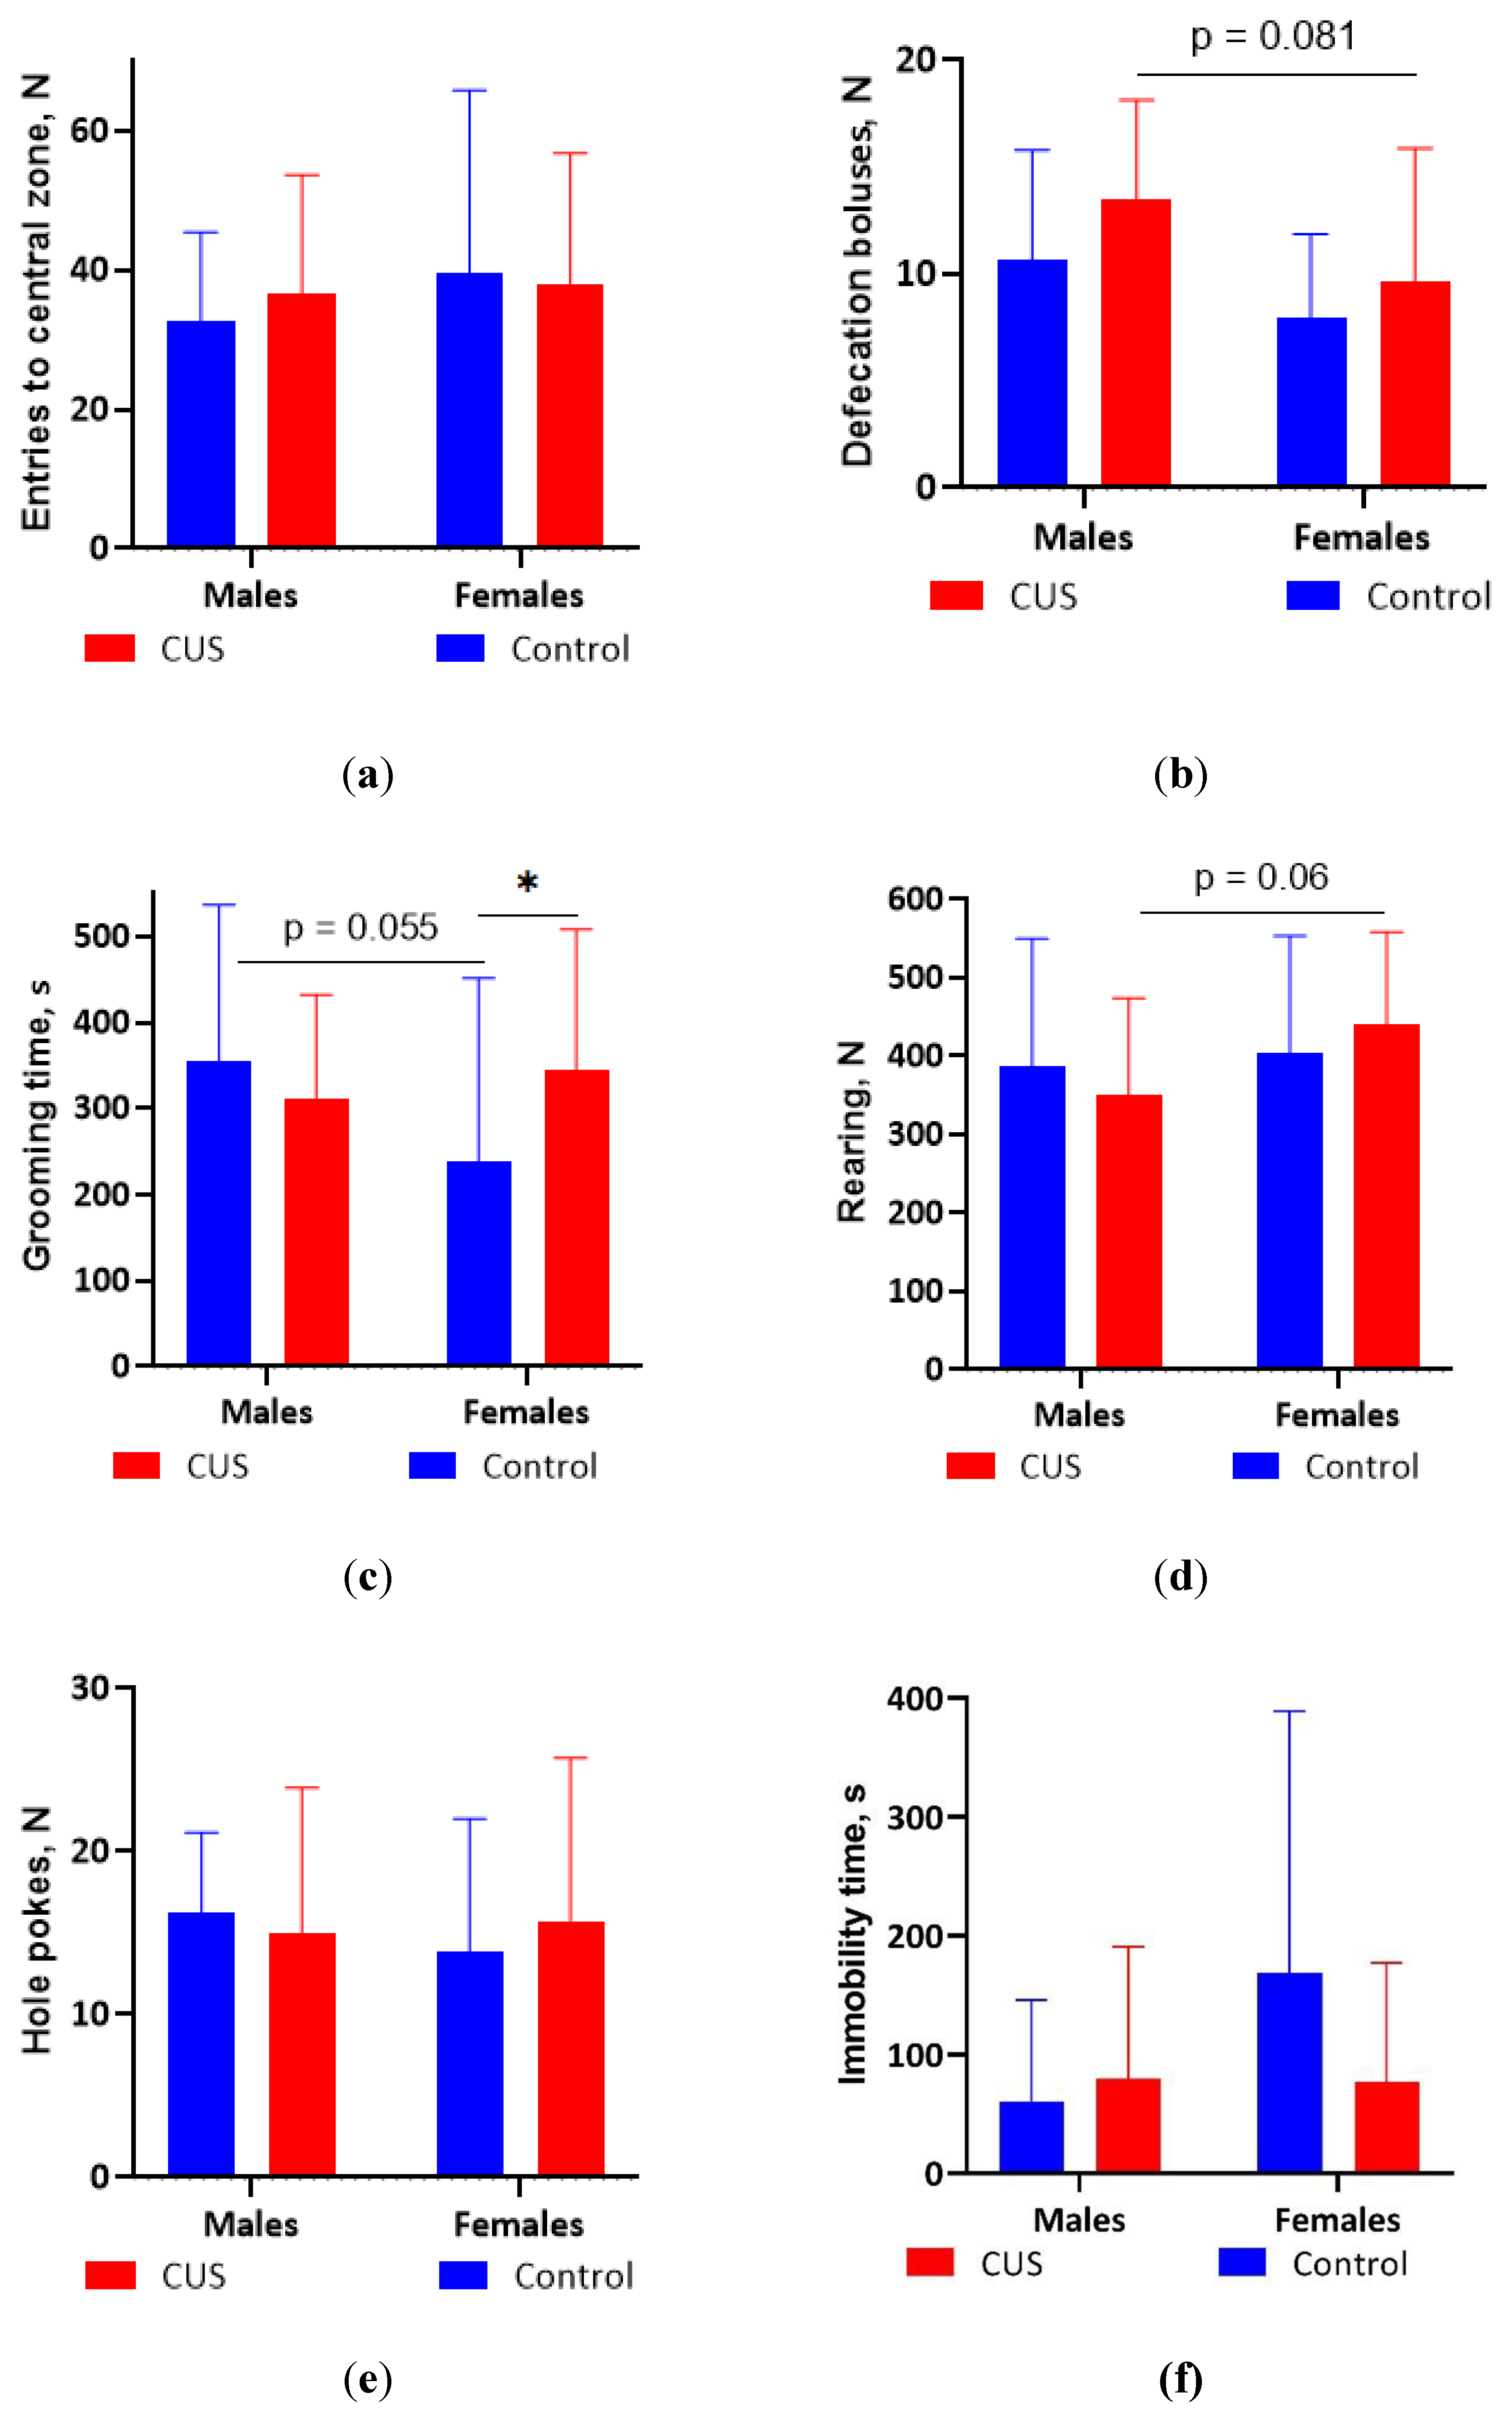
Figure 3.
TST parameters after CUS exposure in M. m. musculus: (a) Latency to the first immobility episode; (b) The total duration of immobility; (c) The number of immobility episodes. Bars are mean values, bar errors show SDs, * p < 0.05, Mann-Whitney tests, N = 9-14 per group. Full Mann-Whitney test results are available in Table S4 of the Supplementary materials.
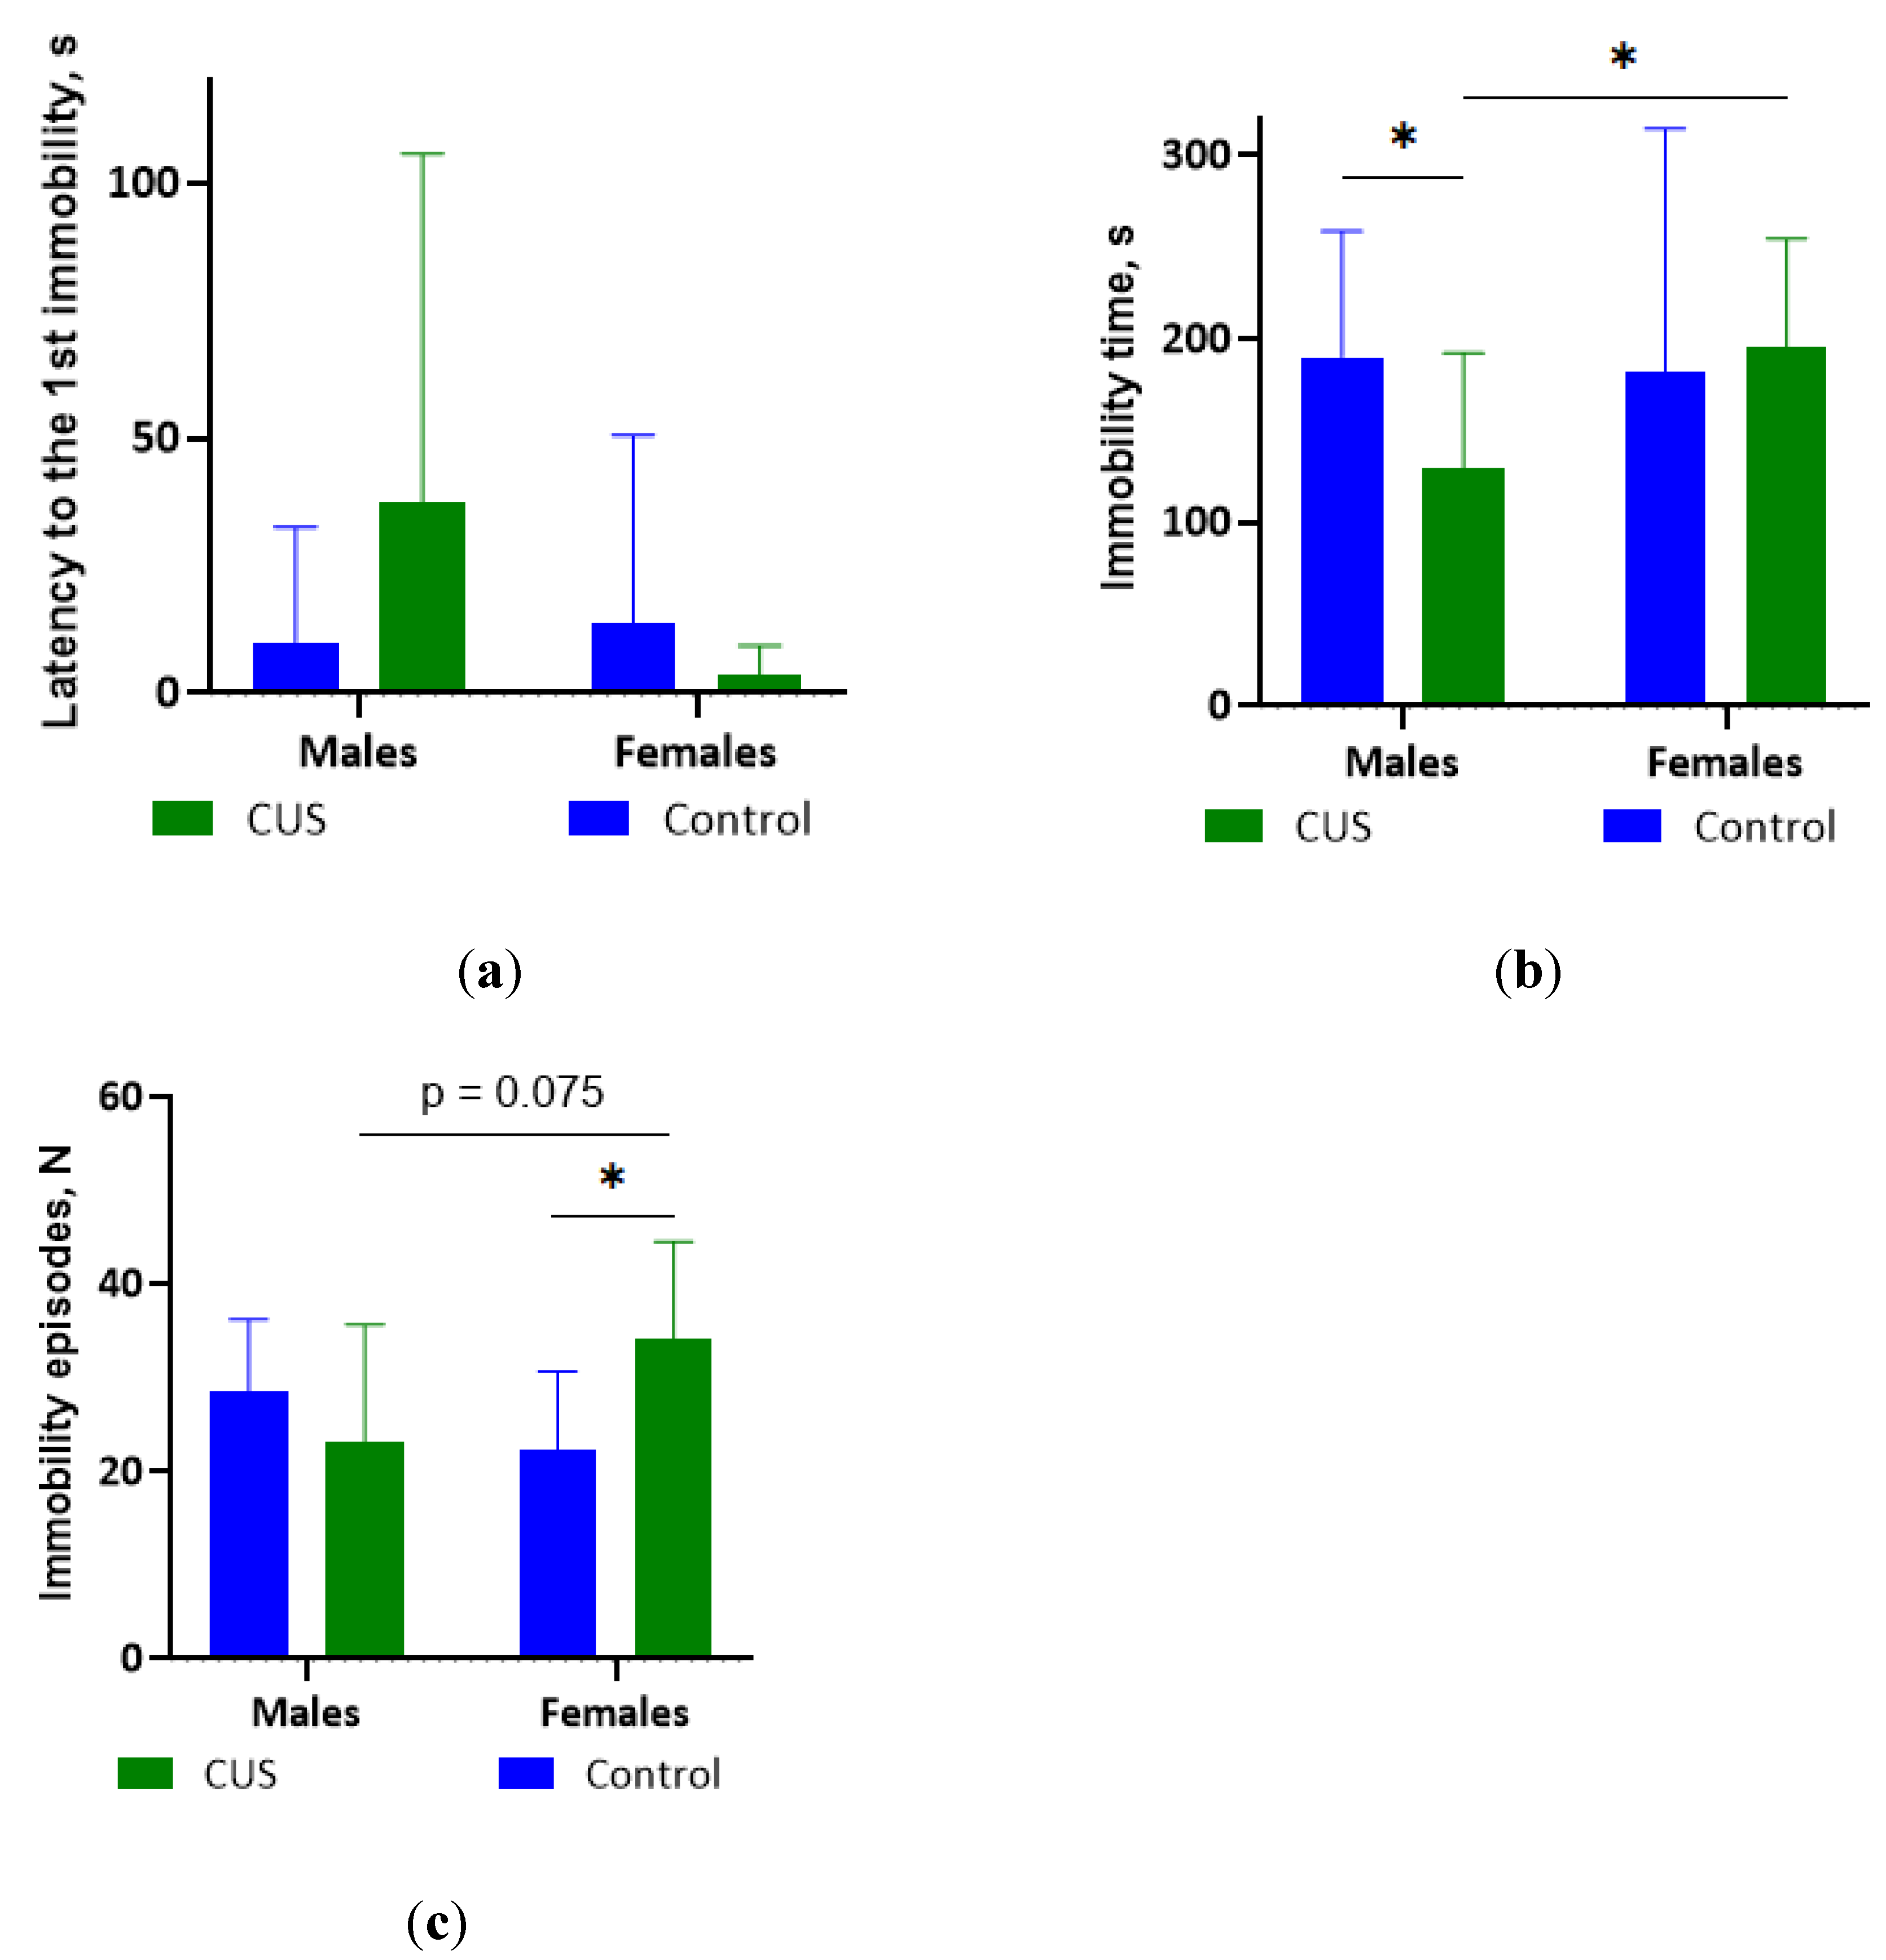
Figure 4.
Corticosterone levels after CUS exposure in M. m. musculus: (a) In blood plasma. N = 11-12 per group; (b) In hair. N = 12-14 per group. Bars are mean values, and bar errors show SDs. Solid lines indicate significant differences and tendencies: * - p < 0.05, Mann-Whitney test. Full results of the statistical analysis are available in Table S5 of the Supplementary material.
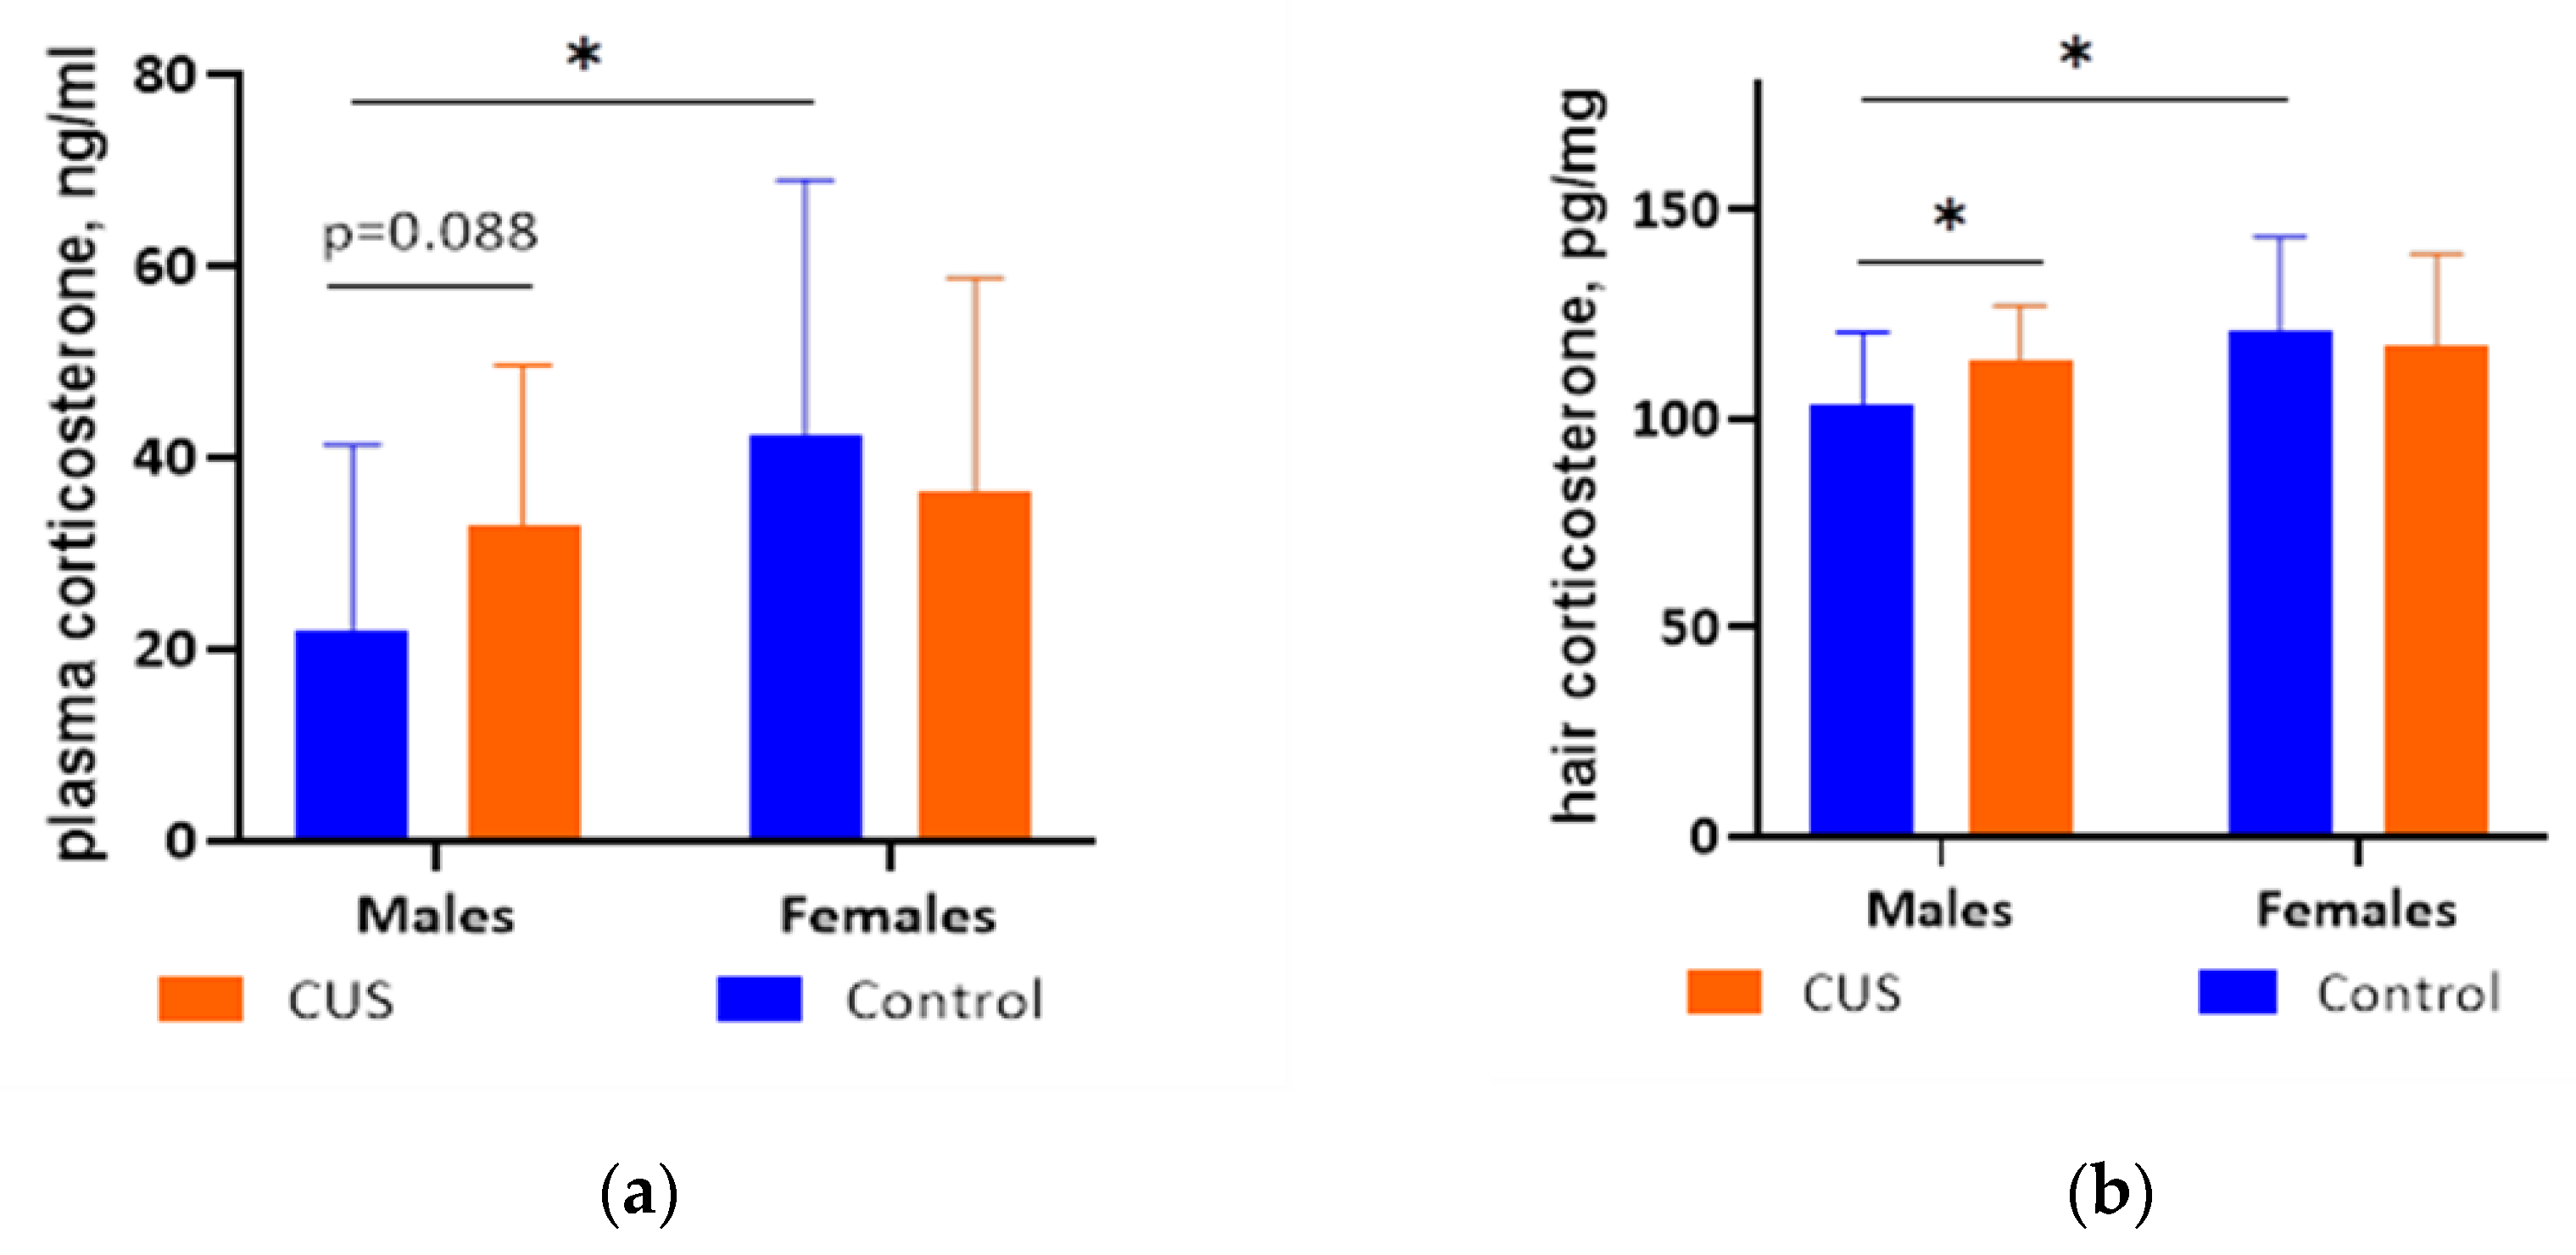

Table 1.
Experimental schedule.
| Stage | Timeline (41-44 days in total) | Procedures | |||
|
CUS group 12 males + 13 females |
Control group 14 males + 13 females |
||||
| experimental chronic stress | ↓ | 36 days | CUS protocol | undisturbed | |
| body weight on Days 1, 15, 29, and 36 | |||||
| rest | ↓ | 1–4 days | undisturbed | ||
| behavioral tests | ↓ | 2 days | open field test (OFT) (on the 1st day), tail suspension test (TST) (on the 2nd day) | ||
| hair collection | ↓ | 1 day | hair sampling | ||
| terminal | ↓ | 1 day | euthanasia, blood collection, organ weights | ||
CUS, chronic unpredictable stress.
Table 2.
Body weight gain.
| Days |
Control, males |
CUS, males |
Control, females |
CUS, females |
Two-way ANOVA, p-level |
t-test, p-level |
||
| N = 14 | N = 12 | N = 13 | N = 13 | sex | group | sex*group | ||
| 1-15 | 1.14 ± 1.23 (+7%) |
−0.25 ± 0.71 (−1%) |
0.70 ± 0.76 (+5%) |
−1.14 ± 0.55 (−7%) |
** m > f |
*** S < C |
n.s. | Sf < Cf*** Sm < Cm** Sm > Sf** Cm > Cf n.s. |
| 15-29 | −0.13 ± 0.71 (−1%) |
0.37 ± 0.48 (+3%) |
0.39 ± 0.77 (+3%) |
0.45 ± 0.45 (+2%) |
# m < f |
n.s. | n.s. | Sf > Cf n.s. Sm > Cm * Sm < Sf n.s. Cm < Cf # |
| 29-36 | 0.39 ± 0.48 (+2%) |
0.87± 0.98 (+4%) |
−0.16 ± 0.72 (−1%) |
0.56 ± 0.73 (+5%) |
* m > f |
** S > C |
n.s. | Sf > Cf * Sm > Cm n.s. Sm > Sf n.s. Cm > Cf* |
| 1-36 (Total) |
1.40 ± 1.39 (+9%) |
0.99 ± 0.94 (+6%) |
0.93 ± 0.83 (+7%) |
−0.13 ± 0.80 (−1%) |
** m > f |
* S < C |
n.s. |
Sf < Cf** Sm < Cm n.s. Sm > Sf** Cm > Cf n.s. |
Significance levels: *** p < 0.001, ** p < 0.01, * p < 0.05, # p < 0.1, n.s. - p > 0.1; m, males; f, females; S, CUS; C, control. Full statistical analyses results are available in Table S2 of the Supplementary materials. Data are expressed as mean ± SD, g.
Table 3.
Post-mortem organ and body weights.
| Control, males |
CUS, males |
Control, females |
CUS, females |
Two-way ANOVA, p-level |
t-test, p-level |
|||
| N = 14 | N = 12 | N = 13 | N = 13 | sex | group | sex*group | ||
| Thymus, mg (per 1 g of BW) |
14.92 ± 4.11 (0.92) |
16.83 ± 3.23 (0.99) |
15.42 ± 3.11 (1.06) |
17.88 ± 4.92 (1.17) |
n.s. m < f |
# S > C |
n.s. | Sf > Cf n.s. Sm > Cm n.s. Sm < Sf n.s. Cm < Cf n.s. |
| Adrenal glands, mg (per 1 g of BW) |
5.19 ± 1.26 (0.32) |
6.36 ± 2.01 (0.37) |
6.56 ± 1.25 (0.45) |
7.25 ± 2.20 (0.47) |
* m < f |
# S > C |
n.s. | Sf > Cf n.s. Sm > Cm # Sm < Sf n.s. Cm < Cf** |
| BW, g | 16.30 ± 2.20 | 16.97 ± 1.71 | 14.56 ± 2.08 | 15.34 ± 1.58 | ** m > f |
n.s. S > C |
n.s. | Sf > Cf n.s. Sm > Cm n.s. Sm > Sf * Cm > Cf* |
Significance levels: *** p < 0.001, ** p < 0.01, * p < 0.05, # p < 0.1, n.s. - p > 0.1; m, males; f, females; S, CUS; C, control; BW, body weight at sacrifice. Full ANOVA and t-test results are available in Table S3 of the Supplementary materials. Data are expressed as mean ± SD.
Disclaimer/Publisher’s Note: The statements, opinions and data contained in all publications are solely those of the individual author(s) and contributor(s) and not of MDPI and/or the editor(s). MDPI and/or the editor(s) disclaim responsibility for any injury to people or property resulting from any ideas, methods, instructions or products referred to in the content. |
© 2025 by the authors. Licensee MDPI, Basel, Switzerland. This article is an open access article distributed under the terms and conditions of the Creative Commons Attribution (CC BY) license (http://creativecommons.org/licenses/by/4.0/).
Copyright: This open access article is published under a Creative Commons CC BY 4.0 license, which permit the free download, distribution, and reuse, provided that the author and preprint are cited in any reuse.


