
Submitted:
13 October 2025
Posted:
14 October 2025
You are already at the latest version
Abstract
This study aimed at analyzing physical fitness in 9-11 years-old children, in relation to: sex, chronological and biological age (Peak Height Velocity, PHV), relative age effect (RAE), body mass index (BMI), levels of sport practice (SP), and sex and chronological age interacted sub-groups. One-thousand-one-hundred-forty-three Italian primary school children (50.7% males) performed anthropometric measurements (body mass, height, BMI) and physical tests for meas-uring coordination (Plate Tapping, PT), handgrip strength (HandGrip, HG), lower-limb power (standing long-jump, SLJ), low-back flexibility (sit-and-reach, SR) and sprint (20m sprint, 20m) skills. Non-parametric tests were applied for verifying fitness differences between subgroups. Higher male values for HG, SLJ, and 20m (p range=0.019-< 0.001), and higher female outcomes in SR (p< 0.001) emerged. For chronological age, effects resulted for each test (p range=0.011-< 0.001). Considering sex and chronological age interacted subgroups, sporadic differences emerged for PHV and RAE, whereas effects frequently resulted for BMI (especially for HG and SLJ tests) and SP (especially for SLJ and 20m tests). Physical fitness in 9-11 years-old Italian students resulted strongly discriminable by BMI and SP, thus highlighting how an adequate lifestyle and fitness should be regularly promoted. Conversely, biological ages and RAE seem to be factors not char-acterizing non-competitive pre-puberty subjects.
Keywords:
physical evaluation
; prepubescents
; motor competence
; body mass index
; sport participation
1. Introduction
The evaluation of physical fitness evaluation is a key component to better understand physical fitness (PF) and capacity in children, which are considered crucial for promoting health [1,2,3] and encouraging active leisure, including participation in recreational activities [4]. International guidelines recommended that children and adolescents aged 5–17 years engage in at least an average of 60 min per day of Moderate-to-Vigorous intensity Physical Activity (MVPA) [5]. Nevertheless, daily MVPA has tended to decrease among pubertal children over the last several decades, leading to a decline in PF and capacity [6]. For instance, in Italy, only one over three children aged 6–9 years achieves adequate levels of MVPA, whereas one child over four spend, daily, 4 h or more watching television [7]. According to literature [8], primary school years appears to be a particularly critical period for the development of PF and motor capacities, due both the influence of the somatic growth and functional maturation and the practice of several sport activities and disciplines on these two components [3].
However, from a wider perspective, many other factors influence physical fitness in children. These include chronological (e.g., chronological year age, and quartile distribution within a single year of birth for calculate an eventual relative age effect, RAE) and biological factors (e.g., body mass index, BMI; indices of maturation such as peak height velocity, PHV) aspects, and contextual factors (e.g., school environment and attendance, physical activity at school, and sport practice, SP). In fact, RAE (i.e., potential age differences within an annually age-grouped cohort, with their consequences) [9] phenomenon highlights an evident bias in many youth sport-specific contests [9,10,11,12] both in boys and girls, thus determining alteration in talent identification [13,14,15,16]. Moreover, biological factors (i.e.: BMI, PHV) are investigated in relation to physical capability development for different range ages (i.e.: prepubertal, pubertal, adolescent samples), sex (i.e.: females, males), socioeconomic factors and deficits in executive function [17], and school-related physical activity (PA) and sport practice (SP) can improve well-being and increase positive mental health in children and adolescents [7,18].
However, studies conducted by Drenowatz et al. [19] examined differences in various components of PF in Austrian primary school children, aged 6-11 years-old, analyzing possible correlations with BMI and RAE. In relation to BMI, overweight/obese children displayed lower PF and capacities, except for upper body strength. Further, the improvement in fitness test along increasing age was less pronounced in overweight/obese children compared to their normal weight peers [20]. Relative older primary school children displayed better performance for strength and power, speed, agility and object control, while differences in cardiorespiratory endurance were less pronounced, highlighting the need to consider individual differences in the evaluation of children’s fitness [21]. However, even regardless of potential RAEs, physical fitness differences have been commonly attributed to heterogenous biological maturations and cognitive, behavioral, motor, social and emotional development [21] occurring during prepubertal and pubertal ages [22,23]. In fact, RAE consequences are mostly evident over childhood; when children born in the first semester are also more likely to continue with their participation in sports and additional experiences useful to further improve their physical skills [24].
For SP, several studies investigated the relation between this factor and PF through questionnaire administration for assessing PA levels (i.e.: Physical Activity Questionnaire for older Children, PAQ-C), but not through fitness tests [7]. In particular, about Italian children's PA levels, Lupo et al. [7] evaluated the impact of PA level on PF by controlling for individual characteristics. The study was able to demonstrate the association between PA level and the scores of some fitness tests (i.e.: upper-limb strength, balance, low-back flexibility, cardiorespiratory fitness, lower-limb muscle power, sprint ability). In addition, children's BMI was positively associated with upper-limb strength and lower-limb muscle power whereas the opposite trend emerged for cardiorespiratory fitness, sprint ability, and balance. Finally, no absolute relationship emerged between PA and the considered fitness tests, since it depends on the test type and children’s characteristics [7].
Relation between physical fitness and chronological and biological factors is still unclear.
Thus, this study aimed to provide further evidence on the combined role of chronological, biological, and contextual factors on children’s physical fitness. Practically, physical fitness (assessed through fitness skills including Plate Tapping, PT, for hand-eye coordination; HandGrip, HG, for upper-limb strength, Standing Long Jump, SLJ, for lower-limb muscle power, Sit and Reach, SR, for low-back flexibility, and 20m sprint, 20m, for sprint ability) was analyzed in 9-11 years-old Italian children, in relation to different sex, chronological and biological age, birthdates of athletes for calculating RAE, BMI, levels of SP categories, and sex and chronological age crossed subgroups.
2. Materials and Methods
2.1. Participants
One-thousand-one-hundred-forty-three children (50.7% males, age 10.4±0.6 yrs, weight 39.4±10.0 kg, height 142.3±9.1 cm, BMI 19.2±3.7 kg/m2) aged 9-11 years-old, from 6 primary schools (i.e.: 18 school sections; 65 classes in total) in Vercelli city and its neighborhoods (i.e.: Piedmont, northwest Italy) participated in this study. All schools recruited for the study were part of the same institutional and regional district and received the same delivery of educational curricula. Before data collection, the institutional review board of the University of Turin approved the study (Protocol #0353400; 15 April 2025). A class session to provide preliminary information about the aim of the study was provided to participants. Absent participants on the days of data collection were excluded. The entire sample of participants was considered according with sex (male, female), age category (i.e.: 9, 10, 11 yrs), BMI (low, adequate, high BMI with respect to the specific age and sex national range) [20], PHV (>6 months before, 0-6 months before, 0-6 months after, >6 months after the sample average time to the PHV) [25], birthdates of athletes to calculate RAE (1st quartile: January-March; 2nd quartile: April-June; 3rd quartile: July-September; 4th quartile: October-December), SP (0, 1-2, >2 weekly practice) subgroups.
2.2. Methods
All measurements were conducted over two consecutive school years. Each class was test during 3 consecutive weekly Physical Education (PE) lessons, always at the same hour lesson. Lessons' hours were different for each class, according to weekly school hour planning (i.e.: 1st hour from 8.30 to 9.30, 2nd hour from 9.30 to 10.30, 3rd hour from 10.30 to 11. 30, 4th hour from 11.30 to 12.30). The first test session included the registration of birthday (to considered participants’ chronological age and quartile classification within single birth year to calculate RAE), SP (i.e.: number of individual weekly training sport sessions, recorded by individually interviewing each participant), and anthropometric parameters' evaluation (i.e.: body mass, stature, sitting height). The other two test sessions included the evaluation of physical fitness. In particular, hand-eye coordination, upper-limb strength and lower-limb muscle power (i.e.: PT, HG, SLJ) were performed in the second one, while low-back flexibility and sprint ability (i.e.: SR, 20m) in the third one. All physical tests were performed twice with 30 s (i.e.: PT, HG, SR) and 60 s (i.e.: SLJ, 20m) rest in between; the best score of each test was considered for statistical analysis. Test sessions were carried out in the school gyms with similar superficies and spaces in order to guarantee equal test circumstances and satisfactory safety measures. All measurements were performed by the same two qualified investigators following a standardized test protocol. During the test session, participants were encouraged to provide the best fitness in each trial. The experimental study design diagram has been reported in Figure 1.
2.3. Procedures
The following measurements and physical tests were applied for the study.
2.3.1. Anthropometric Parameters
The anthropometric evaluation was carried out in the same conditions (i.e., lesson day, time, wearing t-shirt and shorts, barefoot). Stature, body mass and sitting height were measured to assess anthropometric parameters. Stature and sitting height were evaluated using a portable stadiometer (MZ10042, ADE, Hamburg, Germany) with an accuracy of 0,01 cm. Body mass was measured using an electronic scale (876, Seca, Hamburg, Germany) with an accuracy of 0,1 kg. The BMI was calculated according to the formula: body mass (kg)/stature squared (m2) while the PHV was calculated with the Mirwald equations (specified for sex) to obtain the maturity offset value [25].
2.3.2. Hand-Eye Coordination
The Plate Tapping test was performed to assess hand-eye coordination. A table with adjustable height, yellow discs (diameter of 20 cm) and a blue rectangle (side x side, 20 x 30 cm), placed equidistant between both discs, were used to perform PT. The table height was adjusted so the subject stands comfortably in front of the rectangle and the discs. The non-preferred hand was placed on the rectangle, and the child moved the preferred hand as fast as possible back and forth between discs over with the not-preferred hand put in the middle. The action was repeated for 25 full cycles (i.e.: 50 taps) and the time of the trial (s) was recorded once the participant touched the yellow disc for the last tap; a timer (HS-30, Casio, Tokyo, Japan) was used to record the time, to the nearest 0.01 s.
2.3.3. Upper-Limb Strength
Handgrip strength was measured using a dynamometer (EH101, Gripx, Frankfurt am Main, Germany). During the test, participants stood with their dominant arms constantly vertical and close to the body. The palm did not flex on the wrist joint. The subjects were required to exert maximal strength on the dynamometer (i.e.: maximum voluntary contraction) using the dominant hand [7]. The dynamometer scale indicated handgrip strength in kg, with an accuracy of 0.1 kg.
2.3.4. Lower-Limb Muscle Power
The Standing Long Jump test was performed to assess lower-limb power. According to Lupo et al. [7], children jumped as far as possible off the stand, trying to land with both feet and maintaining equilibrium once they landed [7]. The test measured the distance jumped (cm) (i.e.: the distance between the last heel mark and the take-off line) using a measurement to the nearest 0.5 cm.
2.3.5. Low-Back Flexibility
Hip and low-back flexibility was ascertained with a sit and reach box (Standard flexibility, Baseline, New York, USA) to perform the Sit and Reach test. The child was instructed to place one hand on the other and slowly reach forward as far as possible while keeping the knees extended. The hands were kept aligned evenly as the subject reached forward along the box’s surface. The final position of the fingertips on the ruler was recorded (expressed in cm) [7] to the nearest 0.5 cm.
2.3.6. Sprint Ability
Sprint ability was measured with a dual infrared reflex photoelectric cell system (Chrono Time, Globus, Codognè, Treviso, Italy) to record the time to perform a 20 m linear sprint test, to the nearest 0.01 s. Subjects began the test from a standing start with their preferred foot forward, 0.5 m from the first timing gate and the front toe on the start line. Once ready, they sprinted as fast as possible until crossing the stop line. Thus, subjects decelerated after the photoelectric cell system, according to Lupo et al. [26]. The time taken when the subject passed the start and stop line was considered as the performance time (s).
2.4. Statistical Analysis
Descriptive data (means±SD) of the subjects’ characteristics (i.e.: age, anthropometric parameters) and physical tests (i.e.: PT, HG, SLJ, SR, 20m) were reported for the whole sample with consideration of sex. Due to the investigated variables violating the normal distribution (assessed using the Shapiro-Wilk normality test), all data were analyzed using a non-parametric approach. In particular, Kruskal-Wallis and Mann-Whitney tests were considered for evaluating main and paired differences between BMI, PHV, RAE, and SP subgroups, considering sex and age stratified subgroups (i.e.: female 9 yrs, F9; female 10 yrs, F10; female 11 yrs, F11; and male 9 yrs, M9; male 10 yrs, M10; male 11 yrs, M11). Effect sizes (ESs) [27]has been calculated to provide meaningful analysis for significant comparisons, considering ≤0.2, 0.6, 1.2, and >1.2 as trivial, small, moderate, and large ES, respectively [28]. All analyses were conducted using the statistical package SPSS (version 29, IBM SPSS Statistics for Windows, Armonk, USA). The criterion for significance was set at p≤0.05.
3. Results
Descriptive data (means ± SD) of the subjects' characteristics, sport practice, and PF tests were presented in Table 1, whereas Table 2 shows main effects in relation to sex and chronological age stratified subgroups. For sex, excepting for PT, higher male values were reported for HG (p=0.019), SLJ (p<0.001), and 20m (p<0.001), and higher female outcomes in SR (p<0.001). For chronological age, effects resulted for each test (p range=0.011-<0.001).
Considering sex and chronological age stratified subgroups, sporadic differences emerged for PHV (F9, F10, F11: HG, p<0.001; M9: HG, p<0.001; M10: HG, p=0.02) and RAE (F10: SLJ, p=0.029; F11: HG, p<0.001), whereas several effects resulted for BMI (F9: HG, SLJ, 20m, p range=0.028-0.006; F10: all tests excepting PT, p<0.001; F11: HG, p<0.001; SLJ, p=0.043; M9: HG, p<0.001; 20m, p=0.009; M10: all tests excepting PT, p range=0.01-<0.001; M11: all tests excepting PT, p range=0.016-<0.001) and SP (F9: PT, SLJ, 20m, p range=0.05-0.016; F10: SLJ, SR, 20m, p range=0.009-<0.001; F11: SR, p<0.001; M9: all tests excepting SR, p range=0.04-<0.001; M10: PT, SLJ, 20m, p range=0.007-<0.001; M11: SLJ, SR, 20m, p range=0.007-0.002). In particular, for F9 and PHV subgroups, effects emerged only for HG, reporting differences between: 0-6 months before PHV (M±SD: 16±3 kg) and 0-6 months after (M±SD: 14±2 kg; p=0.001, ES=0.4); >6 months after PHV (M±SD: 15±3 kg) and >6 months before (M±SD: 14±2 kg; p=0.042, ES=0.2); >6 months after PHV and 0-6 months before (p<0.001, ES=0.2); >6 months and 0-6 months before time to the PHV (p=0.041, ES=0.4). For F10 and RAE subgroups, effects emerged for SJL, reporting differences when the 1st quartile (M±SD: 111±23 cm) was compared to the 2nd (M±SD: 124±25 cm, p=0.004, ES=0.3), to the 3rd (M±SD: 119±24 cm, p=0.05, ES=0.2), and to the 4th quartile (M±SD: 122±22 cm, p=0.012, ES=0.2). Moreover, for F10 and PHV subgroups, effects emerged for HG, reporting differences between: >6 months after PHV (M±SD: 18±4 kg) and >6 months before (M±SD: 15±2 kg; p<0.001, ES=0.4); >6 months before PHV and 0-6 months after (M±SD: 18±3 kg; p<0.001, ES=0.5); 0-6 months before PHV (M±SD: 16±3 kg) and 0-6 months after (p<0.001, ES=0.3). For F11 and PHV subgroups, effects emerged for HG, reporting differences between: 0-6 months before PHV (M±SD: 15±2 kg) and 0-6 months after (M±SD: 17±2 kg; p=0.024, ES=0.4); 0-6 months before and >6 months after PHV (M±SD: 20±4 kg p<0.001, ES=0.6); >6 months after and 0-6 months after (p<0.001, ES=0.4).
Furthermore, for M9 and PHV subgroups, effects emerged only for HG, reporting differences when the >6 months before PHV (M±SD: 15±3 kg) was compared to 0-6 months before (M±SD: 17±3 kg, p=0.002, ES=0.3), to 0-6 months after (M±SD: 18±4 kg, p<0.001, ES=0.4). For M10 and PHV subgroups, effects emerged for HG, reporting differences between: 0-6 months before PHV (M±SD: 17±3 kg) and 0-6 months after (M±SD: 18±3 kg; p=0.044, ES=0.2); 0-6 months before and >6 months after PHV (M±SD: 18±3 kg p=0.017, ES=0.2); >6 months before (M±SD: 17±4 kg) and 0-6 months after (p=0.044, ES=0.1); >6 months after PHV and >6 months before (p=0.016, ES=0.1).
In relation to BMI (Figure 2), differences emerged for HG (F9: adequate vs high BMI, ES=0.2; F10: all comparisons, ES range=0.2-0.5, F11: all comparisons, ES range=0.3-0.6; M9: all comparisons, ES range=0.2-0.6; M10: all comparisons except adequate vs low BMI, ES range=0.2-0.4; M11: all comparisons, ES range=0.3-0.6), for SLJ (F9: adequate vs high BMI, ES=0.2; F10: adequate vs high BMI, ES=0.3; F11: adequate vs high BMI, ES=0.2; M10: adequate vs high BMI, ES=0.3; M11: adequate vs high BMI, ES=0.3) for SR (F10: adequate vs high BMI, ES=0.2; M10: adequate vs high BMI, ES=0.2; M11: all comparisons except adequate vs low BMI, ESs=0.2); for 20-m sprint (F9: all comparisons except low vs adequate BMI, ES range=0.3-0.5; F10: all comparisons except low vs adequate BMI, ESs=0.2; M9: adequate vs high BMI, ES=0.3; M10: all comparisons except adequate vs low BMI, ES range=0.2-0.5; M11: all comparisons except adequate vs low BMI, ES range=0.3-0.4).
Finally, for SP (Figure 2), differences emerged for PY(F9: all comparisons except 1-2 times per week vs 0 times per week, ESs=0.3; M9: all comparisons except 1-2 times per week vs ≥3 times per week, ESs=0.3; M10: all comparisons except 1-2 times per week vs 0 times per week, ESs=0.2), for HG (M9: all comparisons except 1-2 times per week vs ≥3 times per week, ES range=0.1-0.3) for SLJ (F9: 0 times per week vs ≥3 times per week practices, ES=0.2; F10: all comparisons, ES range=0.3-0.4; M9: all comparisons except 1-2 times per week vs ≥3 times per week, ESs=0.4; M10: all comparisons, ES range=0.2-0.4; M11: all comparisons except 1-2 times per week vs ≥3 times per week, ES range=0.3-0.4) for SR (F9: 0 times per week vs ≥3 times per week practices, ES=0.3; F10: all comparisons, ES range=0.2-0.4; F11: all comparisons except 0 times per week vs ≥3 times per week practices, ES range=0.3-0.4; M11: 0 times per week vs ≥3 times per week practices, ES=0.3) for 20-m sprint (F10: all comparisons except 1-2 times per week vs ≥3 times per week practices, ES range=0.2-0.3; M9: all comparisons except 1-2 times per week vs ≥3 times per week, ESs=0.3; M10: all comparisons, ES range=0.1-0.4; M9: all comparisons except 1-2 times per week vs 0 times per week, ES range=0.2-0.4).
4. Discussion
The present study aimed to analyze physical fitness in relation to chronological (i.e., year of birthday, and birthday quartiles) and biological factors (i.e., PHV, BMI), and levels of SP (weekly practices), by considering specific age and sex stratified categories in Italian children aged 9-11. The main finding was that physical fitness was strongly associated to BMI and levels of SP, while RAE and biological age are able to only weakly influence it, when considered for age and sex stratified subgroups. More generally, different relationships between fitness tests were found for sex. Statistically significant differences were observed: males outperformed females in upper-limb strength, lower-limb power, and sprint performance (shorter times), whereas females showed greater low-back flexibility. In contrast, physical fitness scores positively increased with chronological age, as expected. Therefore, this study highlights how the sex and chronological age stratified subgroups can alter the scenario described above when the two factors are considered separately.
Firstly, relative and biological ages showed results not completely consistent with literature. Unlike the chronological age, the RAE was poorly associated with physical tests. In particular, there was found only a significant relation in F10 with a single fitness test (F10: SLJ, p<0.025). Furthermore, significant differences were found between different birth quartiles, in particular between 1st and 4th quartile, as possible expected, and between 1st and 2nd quartile. These results seem to be in contrast with literature, where significant relations emerged between children born in different quartiles of the school year and fitness for similar range ages [29,30] and fitness tests [31]. In particular, according to Gadžić et al., significant RAEs exist in physical variables in both sexes, in five out of eight motor tests (i.e.: Eurofit test battery) with large effect sizes [31]. Likewise, Jarvis et al. [30] investigated similar age Welsh primary school children finding significant RAE differences for some Fundamental Movement Skills (FMS) tests (i.e.: catch, overhand throw, kick) in boys only [30]. Therefore, the results of the present study appear to partly contrast with those reported by Gadžić et al. [31], while being more consistent with the girls’ data from the recent study by Jarvis et al. [30].
Furtherly, also PHV reported weak associations with the children’s results in fitness tests. The biological age showed a specific significant relation only with HG in two different age categories for both sexes (F9: HG, p<0.001; F10: HG, p<0.001; M9: HG, p<0.001; M10: HG, p=0.02). As first consideration on that, the upper-limb strength represents the fitness test in this battery with the largest differences with all analyzed variables, thus involving also PHV, despite as unique case for this factor. In addition, considering a previous study applied on similar mean age children (despite with a larger age range) [32], HG resulted strongly associated to PHV, even controlling for other factors. Nevertheless, the same trend is not considered for the other physical tests, despite the association of the PHV with several fitness tests seem to be generally consistent [33]. However, the previous literature findings refer to a sport-specific sample, which could be alter a possible comparison with non-athlete individual, despite similar PHV trends can be verified into the two categories [33]. As consequence, the explanation of a specific trend for the association between PHV and physical fitness still remain open.
Regarding sex and age stratified subgroups, BMI resulted associated especially with upper-limb strength, lower-limb muscle power, and sprint ability tests for both sexes (Table 2). In particular, both in F10 and M10, all fitness tests were significantly discriminable for BMI, excepting for PT. In addition, the BMI relation strength was also observed in relation to age and sex national range (i.e.: low, adequate, high BMI), reporting significant differences between BMI subgroups, especially for HG and 20-m sprint test (Figure 2). The heterogenous relationships between BMI and physical tests emerging along the three observed children ages and sexes in the present study can be explained by a previous study [34], where motor competence, physical activity, perceived motor competence, physical fitness and BMI varied along childhood and pre-adolescence. However, considering the results of a previous study [7] on fitness levels in Italian primary school children, similarities emerge with negative relationships between BMI and lower-limb muscle power and sprint (despite arithmetically positive), and positive with respect to upper-limb strength [7], highlighting how an inadequate BMI (often over the upper threshold of the optimal range) can determine a limit for performing physical tests properly, as well as a high BMI can favorite higher strength. In contrast to the findings of the present study, previous works reported that low-back flexibility was not affected by BMI levels [7,20]
The fitness outcome in relation to the different levels of SP was also in line with the expected hypotheses. In fact, the SP was particularly discriminant between opposite categories (i.e.: 0 training session and >2 weekly sessions) and not with central subgroup (i.e.: 1-2 training sessions/week). The only test showing differences in all 3 categories was the 20m, with strong significances between 0 and 1-2 training sessions per week and between 1-2 and >2 weekly practices. Differently from BMI, the upper-limb strength test was related to SP only for a single age per sex interaction (M9), while the lower-limb muscle power was the fitness test with the largest number of relations (i.e., all interacted subgroup excepting F11). In contrast with BMI, the hand-eye coordination was highly and positively related to SP (F9, M9, M10), as well as for low-back flexibility (F9, F10, F11, M11). In a previous and similar study [35] on 8-11 years-old children from a socioeconomically deprived English region, findings resulted quite overlapping because they reported that SP was associated with better SLJ and 20m performances.
Finally, in terms of experimental limitations, potential biases could be emerged by different daytime regarding the anthropometric and physical fitness evaluations (i.e.: according to the PE hour planning lessons for each class). Additionally, the selected physical tests, although feasible in terms of space and time, were not representative of all physical capacities (e.g., the SR test can assess low-back flexibility but not overall flexibility, and the 20m linear sprint measures sprint ability but not agility). Moreover, some measurements relevant to fitness evaluation, such as balance, cardiorespiratory fitness, and endurance, were not included. For these reasons, future longitudinal research could be provided on a wider series of fitness tests, also evaluating other youth categories (i.e.: pubertal children), and simultaneously associating physical fitness with other growth factors (i.e.: in line with evidence-based guidelines).
5. Conclusions
The present study was able to highlight the association between physical fitness (assessed through plate tapping, handgrip, standing long jump, sit and reach, and 20m sprint) and BMI and the grade of SP in 9-11 years-old Italian children. These findings showed that, when considering data for age and sex stratified subgroups, BMI was strongly associated with handgrip strength (i.e.: upper-limb strength), long-jump (i.e.: lower-limb muscle power), and 20m linear sprint (i.e.: sprint ability) for both sexes, while the levels of SP resulted strongly discriminable for long-jump, sit and reach (i.e.: low-back flexibility), and 20m linear sprint. Conversely, few differences emerged between relative and biological ages with physical evaluation. The RAE appeared only related with lower-limb muscle power in one female subgroup (i.e.: F10), while the upper-limb strength was discriminated by the PHV in both sexes. Males showed higher values on handgrip strength, long-jump, and sprint tests than females. On the contrary, the opposite scenario emerged for coordination (i.e.: hand-eye coordination), and flexibility (i.e.: low-back flexibility). Finally, older children showed higher outcomes than younger ones in all the physical tests. Therefore, the take-home message of the present study is that physical fitness was strongly discriminated by BMI and SP, within sex and chronological age subgroups, thus highlighting how an adequate lifestyle and fitness (i.e.: adequate BMI, frequent sport practice) should be regularly promoted [36]. Conversely, weaker tendencies were verified for biological ages and RAE, suggesting how these factors do not substantially characterize non-athlete pre-puberty subjects.
Author Contributions
Conceptualization: MV, AC, NM, CL; Data curation: MV, AC, NM; Formal Analysis: MV, CL; Funding Acquisition: CL; Investigation: MV, AC; Methodology: MV, AC, NM, CL; Project Administration: CL; Resources: MV, AC; Software: CL; Supervision: CL; Validation: ANU, DLV, PRB, CL; Visualization: MV, CL; Writing – Original Draft Preparation: MV, AC, NM, CL; Writing – Review & Editing: MV, ANU, DLV, PRB, CL.
Funding
This research received no external funding.
Institutional Review Board Statement
The study was approved by the local ethics committee of the University of Turin (Protocol #0353400; 15 April 2025).
Informed Consent Statement
Informed consent was obtained from all children’s parents and teachers involved in the study.
Acknowledgments
The authors wish to thank all the following six schools where measurements have been applied: Istituto d’Istruzione Superiore “Amedeo Avogadro”, Vercelli; Istituto Comprensivo “Ferraris”, Vercelli; Istituto Comprensivo “Calvino”, Galliate (Novara); Istituto Comprensivo “Borgosesia”, Borgosesia (Vercelli); Istituto Comprensivo “Tanzio”, Varallo; Istituto Comprensivo “Gattinara”, Gattinara (Vercelli).
Conflicts of Interest
The authors declare no conflicts of interest.
References
- Hamer, M.; O’Donovan, G.; Batty, G.D.; Stamatakis, E. Estimated Cardiorespiratory Fitness in Childhood and Cardiometabolic Health in Adulthood: 1970 British Cohort Study. Scand J Med Sci Sports 2020, 30, 932–938. [CrossRef]
- Raghuveer, G.; Hartz, J.; Lubans, D.R.; Takken, T.; Wiltz, J.L.; Mietus-Snyder, M.; Perak, A.M.; Baker-Smith, C.; Pietris, N.; Edwards, N.M. Cardiorespiratory Fitness in Youth: An Important Marker of Health: A Scientific Statement from the American Heart Association. Circulation 2020, 142, e101–e118. [CrossRef]
- Robinson, L.E.; Stodden, D.F.; Barnett, L.M.; Lopes, V.P.; Logan, S.W.; Rodrigues, L.P.; D’Hondt, E. Motor Competence and Its Effect on Positive Developmental Trajectories of Health. Sports medicine 2015, 45, 1273–1284. [CrossRef]
- Malina, R.M.; Katzmarzyk, P.T. Physical Activity and Fitness in an International Growth Standard for Preadolescent and Adolescent Children. Food Nutr Bull 2006, 27, S295–S313. [CrossRef]
- Philippe Chaput, J.; Ortega Porcel, F.B. 2020 WHO Guidelines on Physical Activity and Sedentary Behaviour for Children and Adolescents Aged 5–17 Years: Summary of the Evidence.; Bmc, 2020.
- Tomkinson, G.R.; Lang, J.J.; Tremblay, M.S. Temporal Trends in the Cardiorespiratory Fitness of Children and Adolescents Representing 19 High-Income and Upper Middle-Income Countries between 1981 and 2014. Br J Sports Med 2019, 53, 478–486. [CrossRef]
- Lupo, C.; De Pasquale, P.; Boccia, G.; Ungureanu, A.N.; Moisè, P.; Mulasso, A.; Brustio, P.R. The Most Active Child Is Not Always the Fittest: Physical Activity and Fitness Are Weakly Correlated. Sports, 11 (1) 2023. [CrossRef]
- Augste, C.; Jaitner, D. In Der Grundschule Werden Die Weichen Gestellt. Sportwissenschaft 2010, 40, 244–253. [CrossRef]
- Barnsley, R.H.; Thompson, A.H.; Barnsley, P.E. Hockey Success and Birthdate: The Relative Age Effect. Canadian Association for Health, Physical Education, and Recreation... 1985, 51, 23–28.
- Herring, C.H.; Beyer, K.S.; Fukuda, D.H. Relative Age Effects as Evidence of Selection Bias in Major League Baseball Draftees (2013–2018). The Journal of Strength & Conditioning Research 2021, 35, 644–651. [CrossRef]
- Brustio, P.R.; Lupo, C.; Ungureanu, A.N.; Frati, R.; Rainoldi, A.; Boccia, G. The Relative Age Effect Is Larger in Italian Soccer Top-Level Youth Categories and Smaller in Serie A. PLoS One 2018, 13, e0196253. [CrossRef]
- Brustio, P.R.; Cardinale, M.; Lupo, C.; Varalda, M.; De Pasquale, P.; Boccia, G. Being a Top Swimmer during the Early Career Is Not a Prerequisite for Success: A Study on Sprinter Strokes. J Sci Med Sport 2021, 24, 1272–1277. [CrossRef]
- Tróznai, Z.; Utczás, K.; Pápai, J.; Négele, Z.; Juhász, I.; Szabó, T.; Petridis, L. Talent Selection Based on Sport-Specific Tasks Is Affected by the Relative Age Effects among Adolescent Handball Players. Int J Environ Res Public Health 2021, 18, 11418. [CrossRef]
- Brustio, P.R.; Boccia, G.; De Pasquale, P.; Lupo, C.; Ungureanu, A.N. Small Relative Age Effect Appears in Professional Female Italian Team Sports. Int J Environ Res Public Health 2021, 19, 385. [CrossRef]
- Brustio, P.R.; Modena, R.; Boccia, G.; Vogliazzo, M.; Kelly, A.L. Youth-to-Senior Transition in Women’s and Girls’ Football: Towards a Better Understanding of Relative Age Effects and Gender-Specific Considerations. PLoS One 2023, 18, e0283781. [CrossRef]
- Brustio, P.R.; Stival, M.; Boccia, G. Relative Age Effect Reversal on the Junior-to-Senior Transition in World-Class Athletics. J Sports Sci 2023, 41, 903–909. [CrossRef]
- Dennis, E.; Manza, P.; Volkow, N.D. Socioeconomic Status, BMI, and Brain Development in Children. Transl Psychiatry 2022, 12, 33. [CrossRef]
- Andermo, S.; Hallgren, M.; Nguyen, T.-T.-D.; Jonsson, S.; Petersen, S.; Friberg, M.; Romqvist, A.; Stubbs, B.; Elinder, L.S. School-Related Physical Activity Interventions and Mental Health among Children: A Systematic Review and Meta-Analysis. Sports medicine-open 2020, 6, 25. [CrossRef]
- Drenowatz, C.; Ferrari, G.; Greier, K.; Hinterkörner, F. Relative Age Effect in Physical Fitness during the Elementary School Years. Pediatr Rep 2021, 13, 322–333. [CrossRef]
- Drenowatz, C.; Hinterkörner, F.; Greier, K. Physical Fitness and Motor Competence in Upper Austrian Elementary School Children—Study Protocol and Preliminary Findings of a State-Wide Fitness Testing Program. Front Sports Act Living 2021, 3, 635478. [CrossRef]
- Veldhuizen, S.; Cairney, J.; Hay, J.; Faught, B. Relative Age Effects in Fitness Testing in a General School Sample: How Relative Are They? J Sports Sci 2015, 33, 109–115. [CrossRef]
- Hancock, D.J.; Adler, A.L.; Côté, J. A Proposed Theoretical Model to Explain Relative Age Effects in Sport. Eur J Sport Sci 2013, 13, 630–637. [CrossRef]
- Musch, J.; Grondin, S. Unequal Competition as an Impediment to Personal Development: A Review of the Relative Age Effect in Sport. Developmental review 2001, 21, 147–167. [CrossRef]
- Cobley, S.P.; Till, K. Participation Trends According to Relative Age across Youth UK Rugby League. Int J Sports Sci Coach 2017, 12, 339–343. [CrossRef]
- Mirwald, R.L.; Baxter-Jones, A.D.G.; Bailey, D.A.; Beunen, G.P. An Assessment of Maturity from Anthropometric Measurements. Med Sci Sports Exerc 2002, 34, 689–694.
- Lupo, C.; Ungureanu, A.N.; Varalda, M.; Brustio, P.R. Running Technique Is More Effective than Soccer-Specific Training for Improving the Sprint and Agility Performances with Ball Possession of Prepubescent Soccer Players. Biol Sport 2019, 36, 249–255. [CrossRef]
- Cohen, J. Statistical Power Analysis for the Behavioral Sciences; routledge, 2013; ISBN 0203771583.
- Hopkins, W.G. A New View of Statistics: A Scale of Magnitudes for Effect Statistics. Available online: Hopkins, W.G. (accessed on 12 November 2024).
- Birch, S.; Cummings, L.; Oxford, S.W.; Duncan, M.J. Examining Relative Age Effects in Fundamental Skill Proficiency in British Children Aged 6–11 Years. The Journal of Strength & Conditioning Research 2016, 30, 2809–2815. [CrossRef]
- Jarvis, S.; Rainer, P.; Ganesh, S. Fundamental Movement Proficiency of Welsh Primary School Children and the Influence of the Relative Age Effect on Skill Performance–Implications for Teaching. Educ 3 13 2023, 51, 907–918. [CrossRef]
- Gadžić, A.; Milojević, A.; Stanković, V.; Vučković, I. Relative Age Effects on Motor Performance of Seventh-Grade Pupils. Eur Phy Educ Rev 2017, 23, 534–542. [CrossRef]
- Saraiva, B.T.C.; Agostinete, R.R.; Freitas Júnior, I.F.; de Sousa, D.E.R.; Gobbo, L.A.; Tebar, W.R.; Christofaro, D.G.D. Association between Handgrip Strength and Bone Mineral Density of Brazilian Children and Adolescents Stratified by Sex: A Cross-Sectional Study. BMC Pediatr 2021, 21, 207. [CrossRef]
- Philippaerts, R.M.; Vaeyens, R.; Janssens, M.; Van Renterghem, B.; Matthys, D.; Craen, R.; Bourgois, J.; Vrijens, J.; Beunen, G.; Malina, R.M. The Relationship between Peak Height Velocity and Physical Performance in Youth Soccer Players. J Sports Sci 2006, 24, 221–230. [CrossRef]
- den Uil, A.R.; Janssen, M.; Busch, V.; Kat, I.T.; Scholte, R.H.J. The Relationships between Children’s Motor Competence, Physical Activity, Perceived Motor Competence, Physical Fitness and Weight Status in Relation to Age. PLoS One 2023, 18, e0278438. [CrossRef]
- Basterfield, L.; Burn, N.L.; Galna, B.; Karoblyte, G.; Weston, K.L. The Association between Physical Fitness, Sports Club Participation and Body Mass Index on Health-Related Quality of Life in Primary School Children from a Socioeconomically Deprived Area of England. Prev Med Rep 2021, 24, 101557. [CrossRef]
- Brustio, P.R.; Mulasso, A.; Lupo, C.; Massasso, A.; Rainoldi, A.; Boccia, G. The Daily Mile Is Able to Improve Cardiorespiratory Fitness When Practiced Three Times a Week. Int J Environ Res Public Health 2020, 17, 2095. [CrossRef]
Figure 1.
Experimental study design with subjects, evaluations, factors, and subgroups. Notes: PT, Plate Tapping; HG: HandGrip; SLJ: Standing Long Jump; SR: Sit and Reach; 20m: 20m sprint.
Figure 1.
Experimental study design with subjects, evaluations, factors, and subgroups. Notes: PT, Plate Tapping; HG: HandGrip; SLJ: Standing Long Jump; SR: Sit and Reach; 20m: 20m sprint.
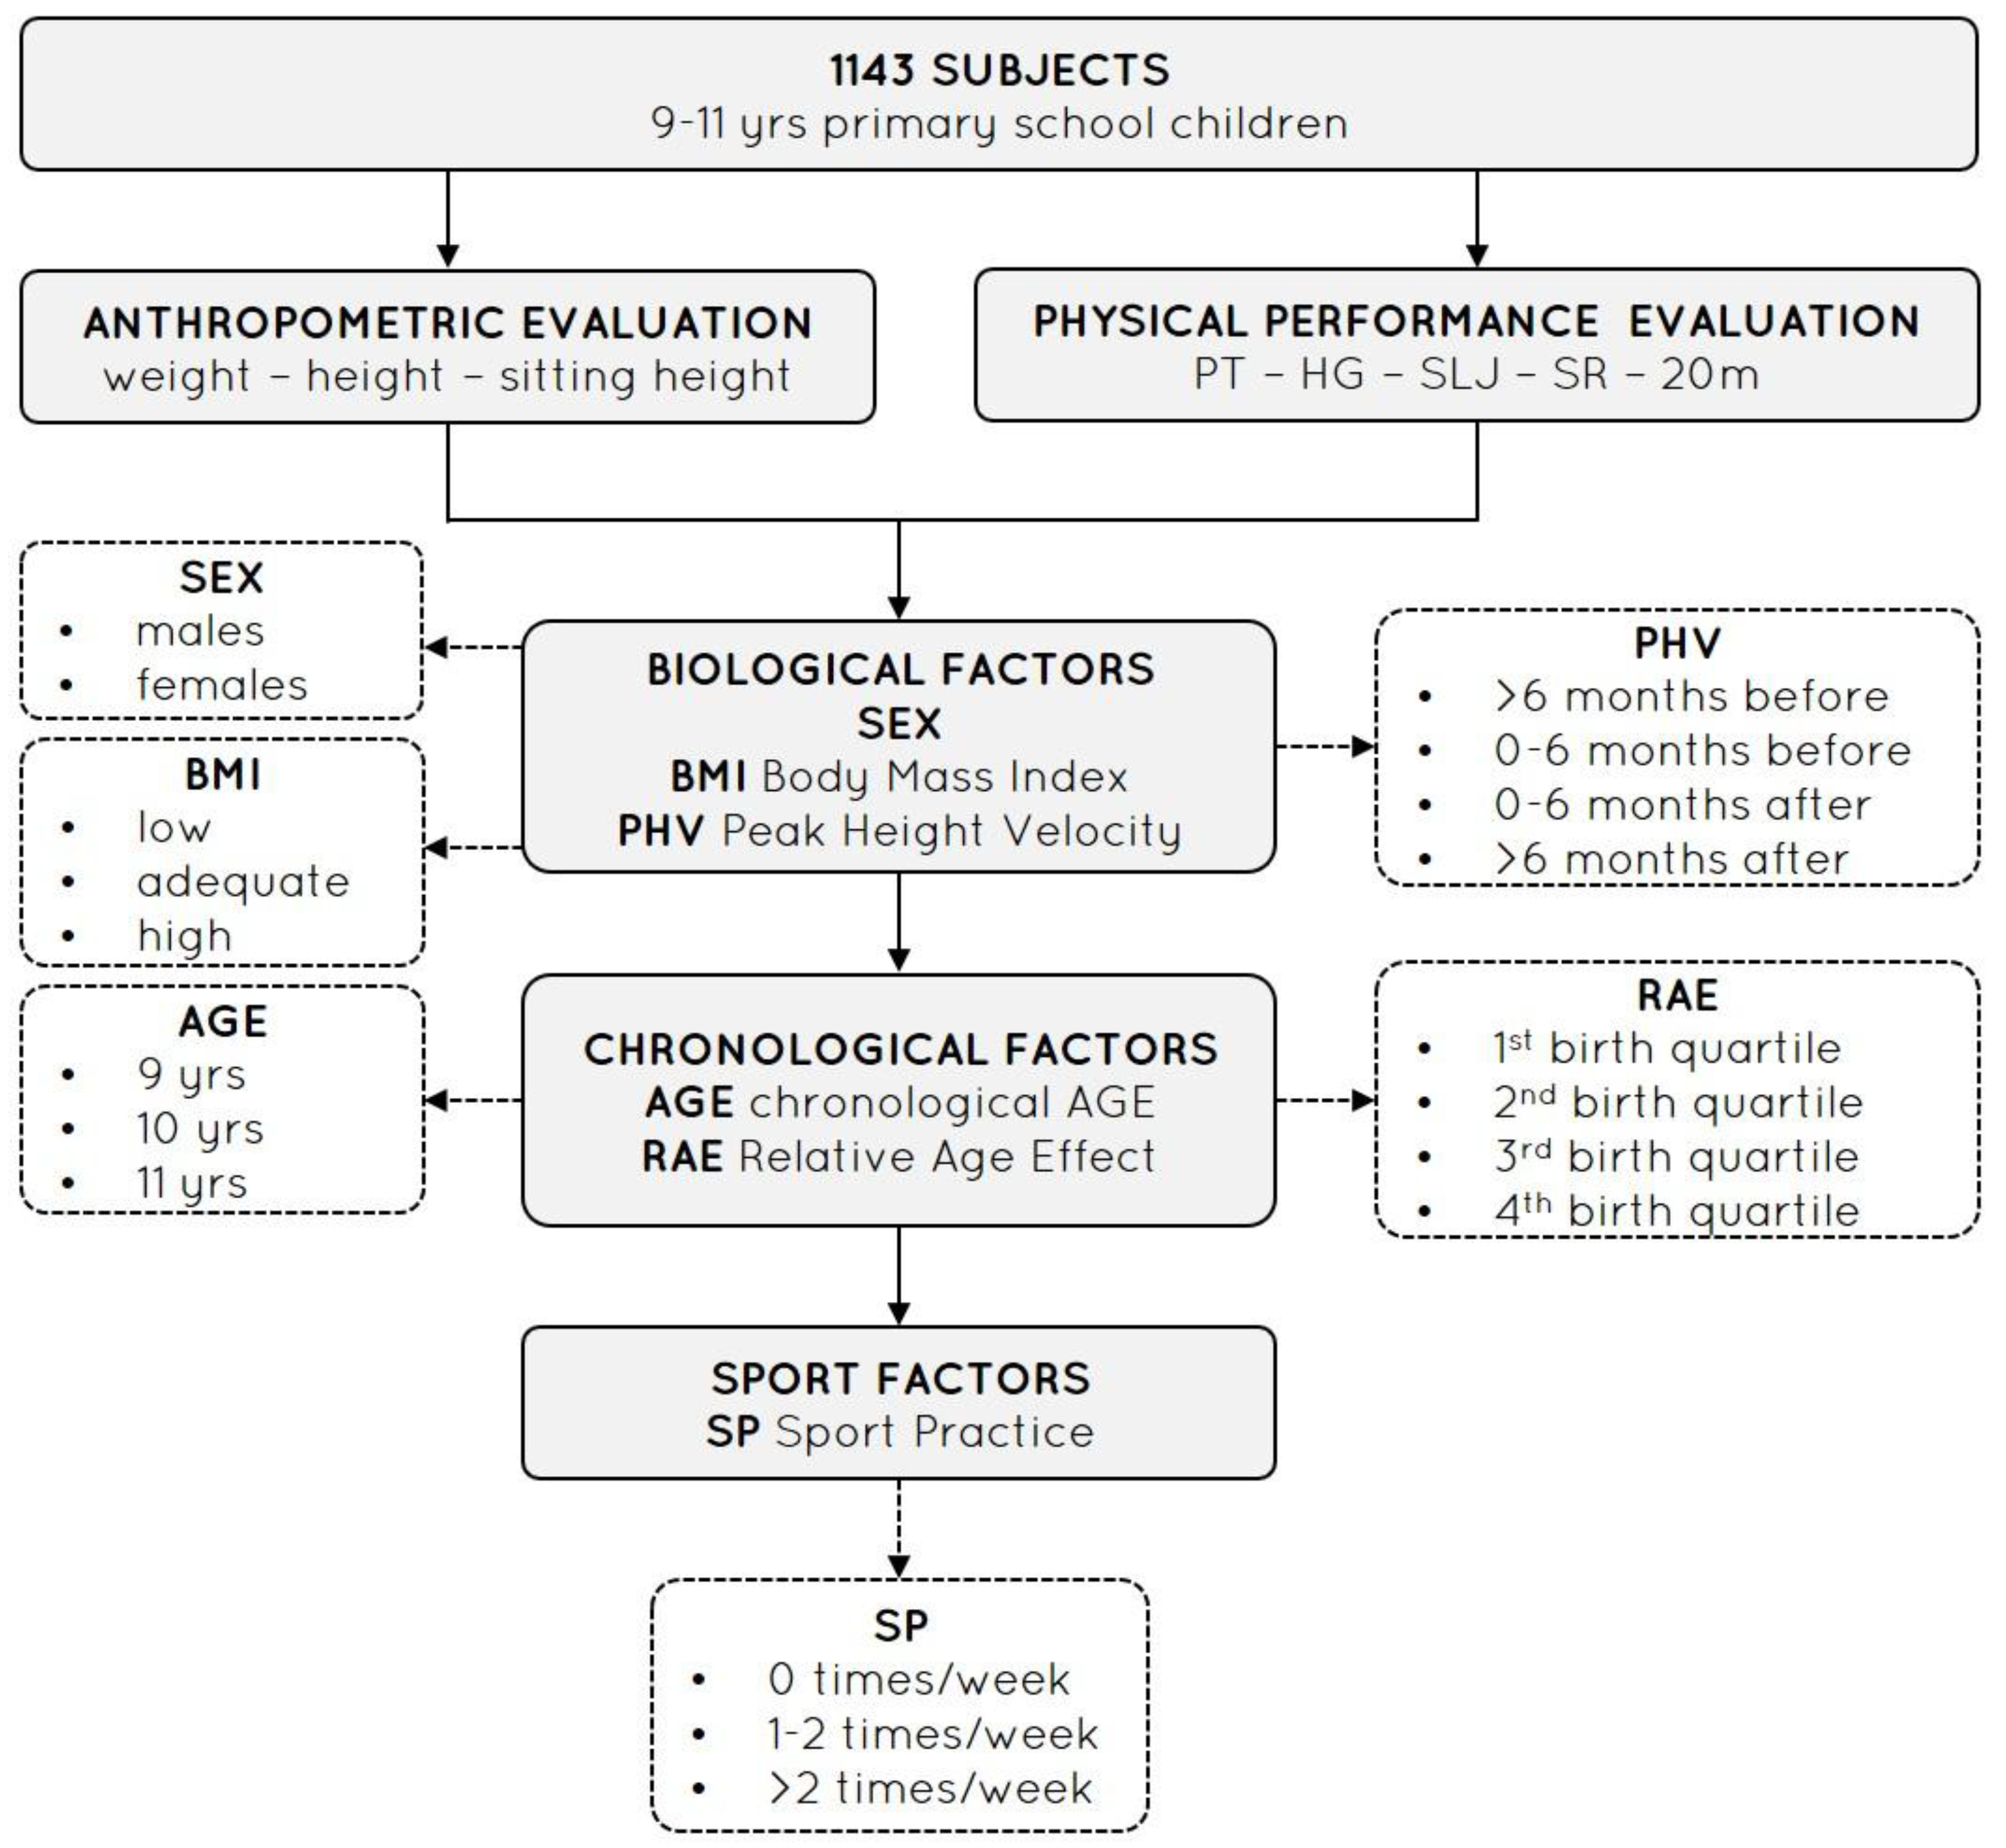
Figure 2.
BMI (low, adequate, high BMI) and SP (weekly practices, wp) pairwise comparisons. Notes: F9: Females 9 yrs; F10: Females 10 yrs; F11: Females 11 yrs; M9: Males 9 yrs; M10: Males 10 yrs; M11: Males 11 yrs; *: p<0.01; **: p<0.001; ***: p<0.0001.
Figure 2.
BMI (low, adequate, high BMI) and SP (weekly practices, wp) pairwise comparisons. Notes: F9: Females 9 yrs; F10: Females 10 yrs; F11: Females 11 yrs; M9: Males 9 yrs; M10: Males 10 yrs; M11: Males 11 yrs; *: p<0.01; **: p<0.001; ***: p<0.0001.
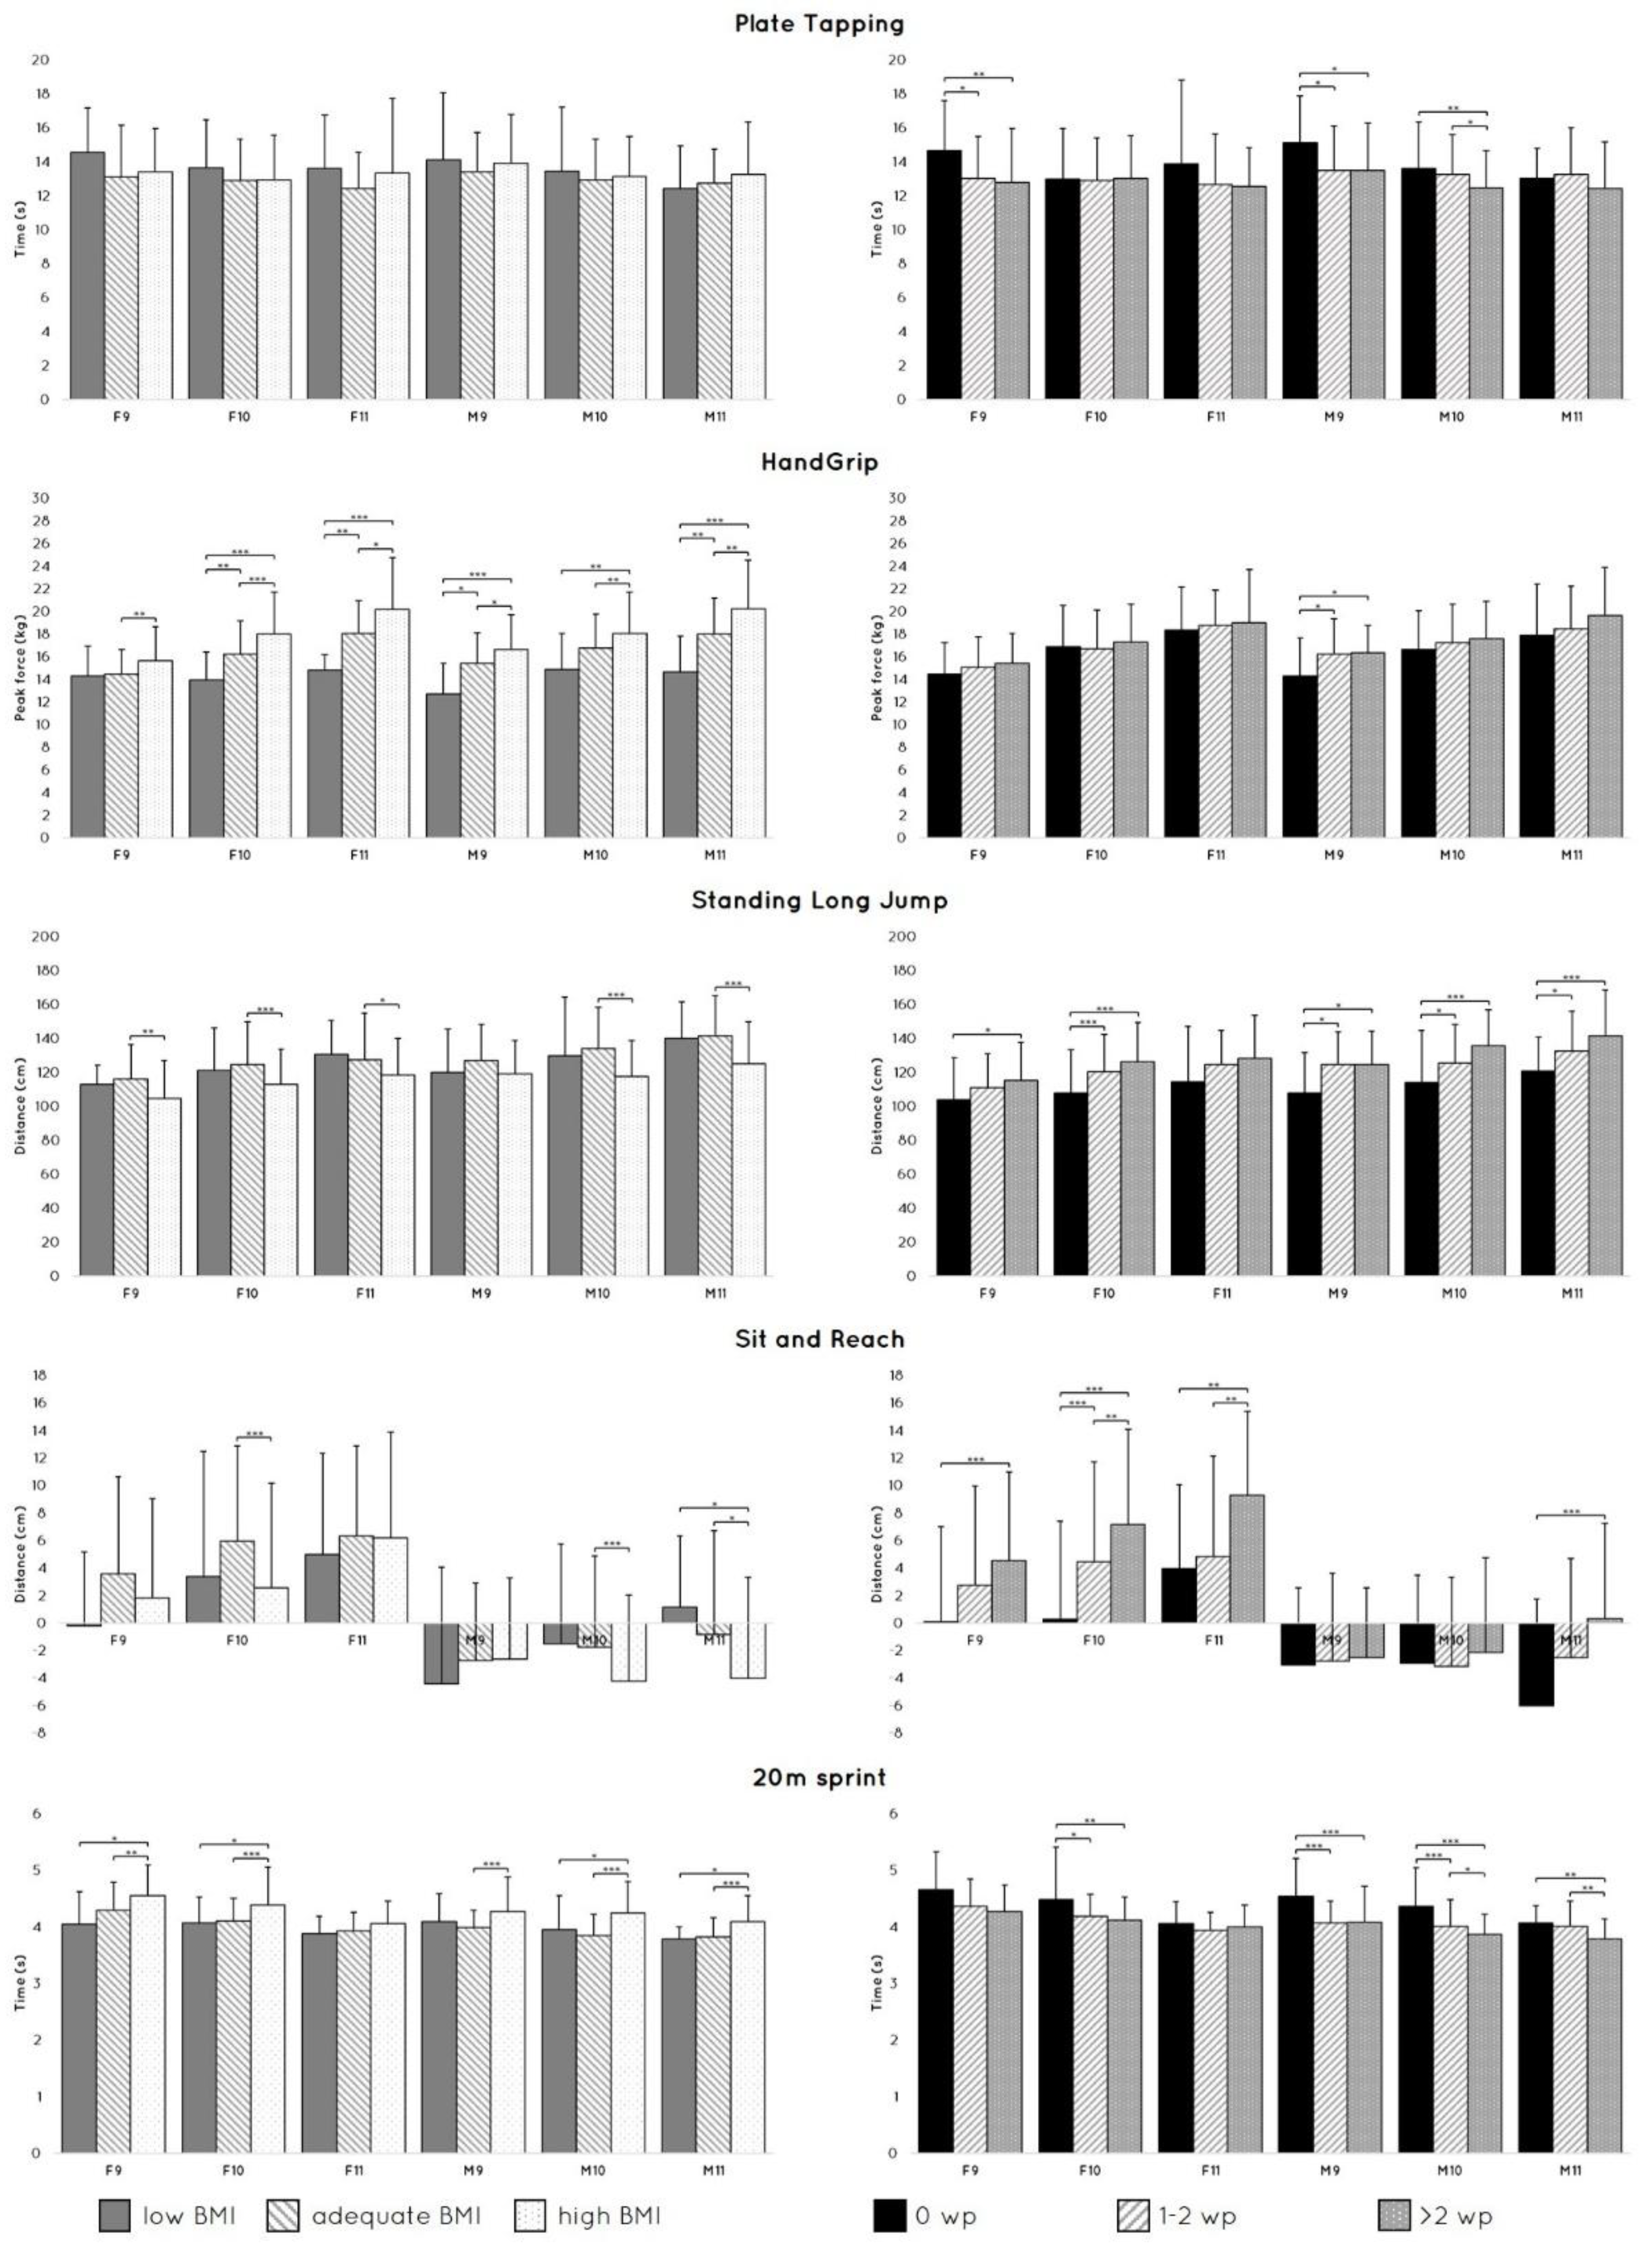

Table 1.
Descriptive data (means±SD) of the subjects' characteristics, sport practice (weekly practice, wp), and physical fitness tests.
Table 1.
Descriptive data (means±SD) of the subjects' characteristics, sport practice (weekly practice, wp), and physical fitness tests.
| Group | Subgroup | N subjects | Age (yrs) | Body mass (kg) | Stature (cm) | Sitting height (cm) | BMI (kg/m2) | PHV (yrs) | SP (wp) |
PT (s) |
HG (kg) |
SLJ (cm) |
SR (cm) |
20m (s) |
| Females | 9 yrs (n= 143) | 145 | 9,6±0,2 | 35,0±7,3 | 137,0±6,2 | 114,4±4,7 | 18,6±3,0 | 11,6±0,5 | 1,7±1,2 | 13,2±3,0 | 15,0±2,7 | 110,7±21,7 | 2,7±7,1 | 4,4±0,5 |
| 10 yrs (n=302) | 293 | 10,5±0,3 | 39,8±9,9 | 142,8±10,5 | 120,0±10,8 | 19,2±3,6 | 11,8±0,6 | 1,9±1,3 | 13,0±2,5 | 16,9±3,4 | 119,9±23,7 | 4,4±7,5 | 4,2±0,6 | |
| 11 yrs (n=119) | 125 | 11,1±0,2 | 43,4±9,8 | 148,3±7,3 | 125,1±9,8 | 19,6±3,6 | 11,8±0,5 | 2,0±1,5 | 12,8±3,2 | 18,7±3,9 | 123,3±25,4 | 6,1±7,1 | 4,0±0,4 | |
| All females (n=564) | 563 | 10,4±0,6 | 39,4±9,7 | 142,5±9,7 | 119,7±10,1 | 19,1±3,5 | 11,7±0,5 | 1,9±1,3 | 13,0±2,8 | 16,8±3,6 | 118,3±24,0 | 4,3±7,4 | 4,2±0,5 | |
| Males | 9 yrs (n=155) | 159 | 9,6±0,2 | 35,0±7,5 | 137,0±6,1 | 114,1±9,2 | 18,5±3,2 | 13,1±1,0 | 2,0±1,2 | 13,8±2,8 | 15,9±3,1 | 122,1±20,9 | -2,6±6,0 | 4,2±0,5 |
| 10 yrs (n=292) | 287 | 10,5±0,3 | 39,7±10,5 | 142,8±6,9 | 119,6±8,0 | 19,3±4,0 | 13,4±0,5 | 2,1±1,2 | 13,1±2,4 | 17,3±3,5 | 126,9±24,6 | -2,8±6,5 | 4,0±0,5 | |
| 11 yrs (n=132) | 134 | 11,2±0,2 | 43,1±10,9 | 146,0±11,3 | 122,2±9,0 | 21,1±14,9 | 13,5±0,6 | 2,0±1,3 | 12,9±2,6 | 18,6±4,0 | 134,1±25,0 | -2,1±7,5 | 4,0±0,4 | |
| All males (n=579) | 580 | 10,4±0,6 | 39,2±10,3 | 141,9±8,6 | 118,7±9,1 | 19,5±7,9 | 13,3±0,7 | 2,0±1,3 | 13,2±2,6 | 17,2±3,6 | 127,2±24,1 | -2,6±6,6 | 4,0±0,5 | |
| All subjects (n=1143) | 1143 | 10,4±0,6 | 39,3±10,0 | 142,2±9,2 | 119,2±9,6 | 19,3±6,1 | 12,5±1,0 | 1,9±1,3 | 13,1±2,7 | 17,0±3,6 | 122,8±24,4 | 0,9±7,8 | 4,1±0,5 | |
Notes: BMI: Body Mass Index; PHV: Peak Height Velocity; SP: Sport Practice; PT, Plate Tapping; HG: HandGrip; SLJ: Standing Long Jump; SR: Sit and Reach; 20m: 20m sprint.
Disclaimer/Publisher’s Note: The statements, opinions and data contained in all publications are solely those of the individual author(s) and contributor(s) and not of MDPI and/or the editor(s). MDPI and/or the editor(s) disclaim responsibility for any injury to people or property resulting from any ideas, methods, instructions or products referred to in the content. |
© 2025 by the authors. Licensee MDPI, Basel, Switzerland. This article is an open access article distributed under the terms and conditions of the Creative Commons Attribution (CC BY) license (http://creativecommons.org/licenses/by/4.0/).
Copyright: This open access article is published under a Creative Commons CC BY 4.0 license, which permit the free download, distribution, and reuse, provided that the author and preprint are cited in any reuse.


