1. Introduction
Vitamin B12 (cobalamin, B12), the largest known vitamin with a molecular weight of 1355 Da, is an essential micronutrient required for cellular metabolism, DNA synthesis, and red blood cell formation [
1]. Due to its inability to be synthesized endogenously, humans and mice must obtain Vitamin B12 from dietary sources, although the average daily requirement is less than 5 µg for humans [
2]. Vitamin B12 possesses antioxidant properties, particularly since its cobalt (Co
2+) center acting as a superoxide scavenger with a reactivity rate comparable to that of superoxide dismutase (SOD) [
3]. Oxidative stress is a key contributor to the pathogenesis of diabetic complications, particularly in diabetic nephropathy (DN) [
4]. Excessive production of reactive oxygen species (ROS) has been shown to exacerbate tissue damage and inflammation in diabetic nephropathy (DN) [
5,
6,
7].
The
Engulfment and Cell Motility 1 (
Elmo1) interact with Dock proteins (Dedicator of cytokinesis), activating Rac1-GTPase. This process is essential for phagocytosis and cell migration [
6]. Activated Rac1, as an obligatory subunit of NADPH oxidases, increases superoxide production, resulting in cellular oxidative stress [
6]. Single nucleotide polymorphisms (SNPs) in the
ELMO1 gene are associated with increased risk for DN in different populations [
8,
9]. We previously reported that mice overexpressing
Elmo1 at 200% of normal (
Elmo1H/H) had elevated ROS levels and developed worsened diabetic complications [
6]. Despite similar levels of plasma glucose, insulin, and systolic blood pressure across these lines, oxidative stress markers such as plasma level of lipid peroxides, erythrocyte levels of reduced glutathione (GSH) and plasma levels of transforming growth factor β1 (TGFβ1) progressively worsened with
Elmo1 overexpression [
6]. We further reported that treatment with B12 in diabetic
Elmo1H/H mice improved diabetic cardiomyopathy by modulating oxidative stress and the DNMT–SOCS1/3–IGF-1 signaling pathway [
10]. Additionally, high-dose Vitamin B12 administration significantly decreased ROS level and reduced ischemia/reperfusion-induced kidney injuries in mice [
1].
Although our team have previously demonstrated the beneficial effects of B12 on diabetic complications [
1,
10], the precise molecular mechanisms remain largely unknown. The current study was designed to gain a deeper understanding of how B12 supports kidney health under diabetic conditions, particularly during the early stages of DN in mice. Global gene expression was checked to clarify the novel pathways of B12’s protective effects, including modulation of solute carrier transporters, circadian clock genes, histone H1 variants, and immune signaling. By integrating these molecular changes, we propose that B12 not only improves metabolic stability but also reinforces chromatin structure and circadian regulation, thereby offering multi-level protection against DN.
2. Materials and Methods
2.1. Animal Study
All experiments were conducted using male
Elmo1H/H mice on an C57BL/6J genetic background.
Elmo1H/H mice were mated with
Ins2Akita/+ mice (Jackson laboratory, Strain: 003548) to enhance the severity of diabetic complications and recapitulate features of human type 1 diabetes [
6]. Mice were allocated into four groups: non-diabetic
Elmo1H/HIns2+/+ mice and diabetic
Elmo1H/HIns2Akita/+ mice supplemented with B12 starting at eight weeks of age for eight weeks at a dose of 10 mg/kg bw/day via drinking water, or vehicle (water) [
10]. Male littermates were housed together, and each cage received B12 or control water. All groups were provided with rodent chow (Select Rodent 50 IF/9F, 5V5M, PicoLab) ad-libitum throughout the experimental period. All mice were kept under husbandry conditions conforming to the National Institutes of Health Guideline for Use and Care of Experimental Animals.
2.2. Systolic Blood Pressure (SBP) Analysis
SBP was measured in eight weeks after B12 treatment, with a tail-cuff method [
11] using (BP-2000 SERIES II, Visitec Systems). Mean SBP are average of the mean values of five days each consisting of the mean of 30 trials/day [
6].
2.3. Sample Collection
Sixteen-week-old B12 treated and non-treated mice were fasted for 3–4 hours before being sacrificed. During isoflurane anesthesia, with toe pinch, blood was collected via the retro-orbital vein using heparinized capillary tubes and plasma obtained by centrifuging at 8000g for 15 minutes. Mice were euthanized by cervical dislocation for tissue collection. The collected tissues were preserved in RNA later (#Am7021, Invitrogen, Thermo Fisher Scientific) for RNA isolation and in 4% paraformaldehyde for histological analysis. Plasma and tissues stored in RNA later were kept frozen at -20 °C until further analysis.
2.4. Plasma Biological Parameters
Plasma glucose and triglycerides were measured with Wako Autokit Glucose (#997-03001, FUJIFILM) and Triglyceride Assay Kit (#MA-TG, RayBiotech), respectively. Spot urine samples were collected for the analysis of albumin and creatinine. Urinary albumin was measured by a Murine Microalbuminuria ELISA kit (#LS-F39493, LSBio). Urinary creatinine was measured by creatinine test kit (#80350, Crystal Chem).
2.5. Histology and Immunofluorescence
Renal tissues were fixed in 4% buffered formalin, paraffin-embedded, and sectioned at 5 µm, deparaffinized and dehydrated. Periodic Acid-Schiff (PAS) staining was performed using 0.5% periodic acid (#P7875, Sigma-Aldrich), Schiff’s reagent (#3952016, Sigma-Aldrich), and counterstaining with Harris Hematoxylin (#HHS32, Sigma-Aldrich). Masson’s Trichrome staining was carried out using standard protocol (Center for Musculoskeletal Research, University of Rochester Medical Center). For immunostaining, kidney sections were subjected to antigen retrieval in 10 mM citrate buffer (pH 6.0). Sections were blocked with 10% normal goat serum and 0.1% Bovine Serum Albumin (BSA) (#10035 for 1 h at room temperature, then incubated overnight at 4 °C with either mouse monoclonal anti-CD19 (#HIB19, 1:200; Invitrogen) or PE anti-mouse CD45RB (#A11029; 1:200; BioLegend) rat CD3 Monoclonal Antibody (17A2) (#14-0032-82, 1:200, Invitrogen ). After three PBS washes, sections of staining with CD19 and CD3 were incubated with Alexa Fluor 488-conjugated goat anti-mouse IgG (#A11037; 1:500; Invitrogen) and Alexa Fluor 594-conjugated goat anti-rat IgG (#A11007; 1:500; Invitrogen) for 1h for each at room temperature. Slides were mounted with 4′,6-diamidino-2-phenylindole (DAPI) Fluoromount G (#0100-20; Southern Biotech) and imaged on a fluorescent microscope (Olympus IX70, Japan).
RNA sequencing and data analysis: Total RNA was extracted using the RNeasy Mini Kit (74106, QIAGEN) according to the manufacturer’s instructions. The library preparation and total RNA sequencing analyses were carried out at the High Throughput Genomic Sequencing Facility, University of North Carolina, Chapel Hill, NC, USA. Raw paired-end 50-bp RNA-seq reads were aligned to the mouse reference genome GRCm39 with gene annotations from GENCODE vM35 using the STAR aligner. Alignments were carried out with 12 threads, producing coordinate-sorted BAM files, retaining splice junction information through the supplied GTF file, assigning strand information using intron motifs, and generating gene-level counts with the GeneCounts option. After alignment, transcript assembly and quantification were performed using StringTie, and count matrices were generated with the associated prepDE.py script. The gene-level count matrix was imported into R for downstream analysis with the DESeq2 package. Genes with fewer than 100 total counts across all samples were removed prior to normalization. Count data were normalized using the median-of-ratios method Genes with an absolute log2 fold change greater than or equal to one were considered differentially expressed and were visualized with volcano plots. Significantly altered genes were then compared in Heat Maps with whole set of mice using normalized counts. Gene expression data were deposited in the NCBI Gene Expression Omnibus (GEO) database (Accession: GSE306999).
Quantitative Reverse-transcription Polymerase Chain Reaction (qRT-PCR): Total RNA was extracted from the tissue with Trizol (15596026, Invitrogen, Thermo Fisher Scientific), and qRT-PCR was performed according to the previously published method [
11]. Expression levels were expressed as relative fold increases/decreases normalized to housekeeping gene Actb
, which was constant between groups. TaqMan universal PCR master mix (Applied Biosystems) and specific primers were used in a 7500 Real-Time PCR system (30 min at 48 °C, 10 min at 95 °C with 40 cycles of 15 s at 95 °C, and 1 min at 60 °C) for quantification purposes. List of primers and probes are in
Table S1.
Cell culture and synchronization: BU.MPT cells, a conditionally immortalized mouse proximal tubular epithelial cell line [
12], were cultured at 37 °C to confluence in Dulbecco’s Modified Eagle Medium (DMEM; 11995-065, Thermo Fisher Scientific) supplemented with 10% fetal bovine serum (FBS; S12450, Sigma-Aldrich), 100 U/mL penicillin-streptomycin (15140-122, Thermo Fisher Scientific), and 10 U/mL interferon-γ (14777, IFN-γ; Sigma-Aldrich) in 5% CO₂, with or without 0.3 μM cyanocobalamin (Vitamin B12; V2876, Sigma-Aldrich). Cells were passaged using 1 mL of 0.25% trypsin-EDTA (15050-065, Thermo Fisher Scientific) per 100 mm dish and seeded at 80,000 cells/well in 12-well plates with or without B12. After treatment with B12 plates were maintained under non-permissive conditions (39 °C, 5% CO₂, without IFN-γ). Circadian rhythms were synchronized by treatment with 100 nM dexamethasone (D4902, Sigma-Aldrich) for 2 h, followed by washes with Ca
2+ and Mg
2+ free Dulbecco’s phosphate-buffered saline (DPBS; 21-031-CV, Corning) and replacement with fresh medium. Total RNA was collected every 4 h from 12–60 h post-synchronization, and expression of genes was quantified by real-time PCR.
Statistics and reproducibility: All measurements were taken from biologically distinct samples. Data are expressed as means ± standard errors. Multifactorial ANOVA test was used with the program Pro JMP 17.2.0 (SAS Institute, Cary, NC). Post hoc analyses were done using the student t-test as described in figure legends. Effects of diabetes and of B12 treatment and their interactions were assessed using Generalized Linear Model. Reproducibility including biologically independent sample sizes is stated in each figure legend.
3. Results
3.1. B12 Treatment Improves Multiple Metabolic and Renal Parameters Decline in Diabetic Mice.
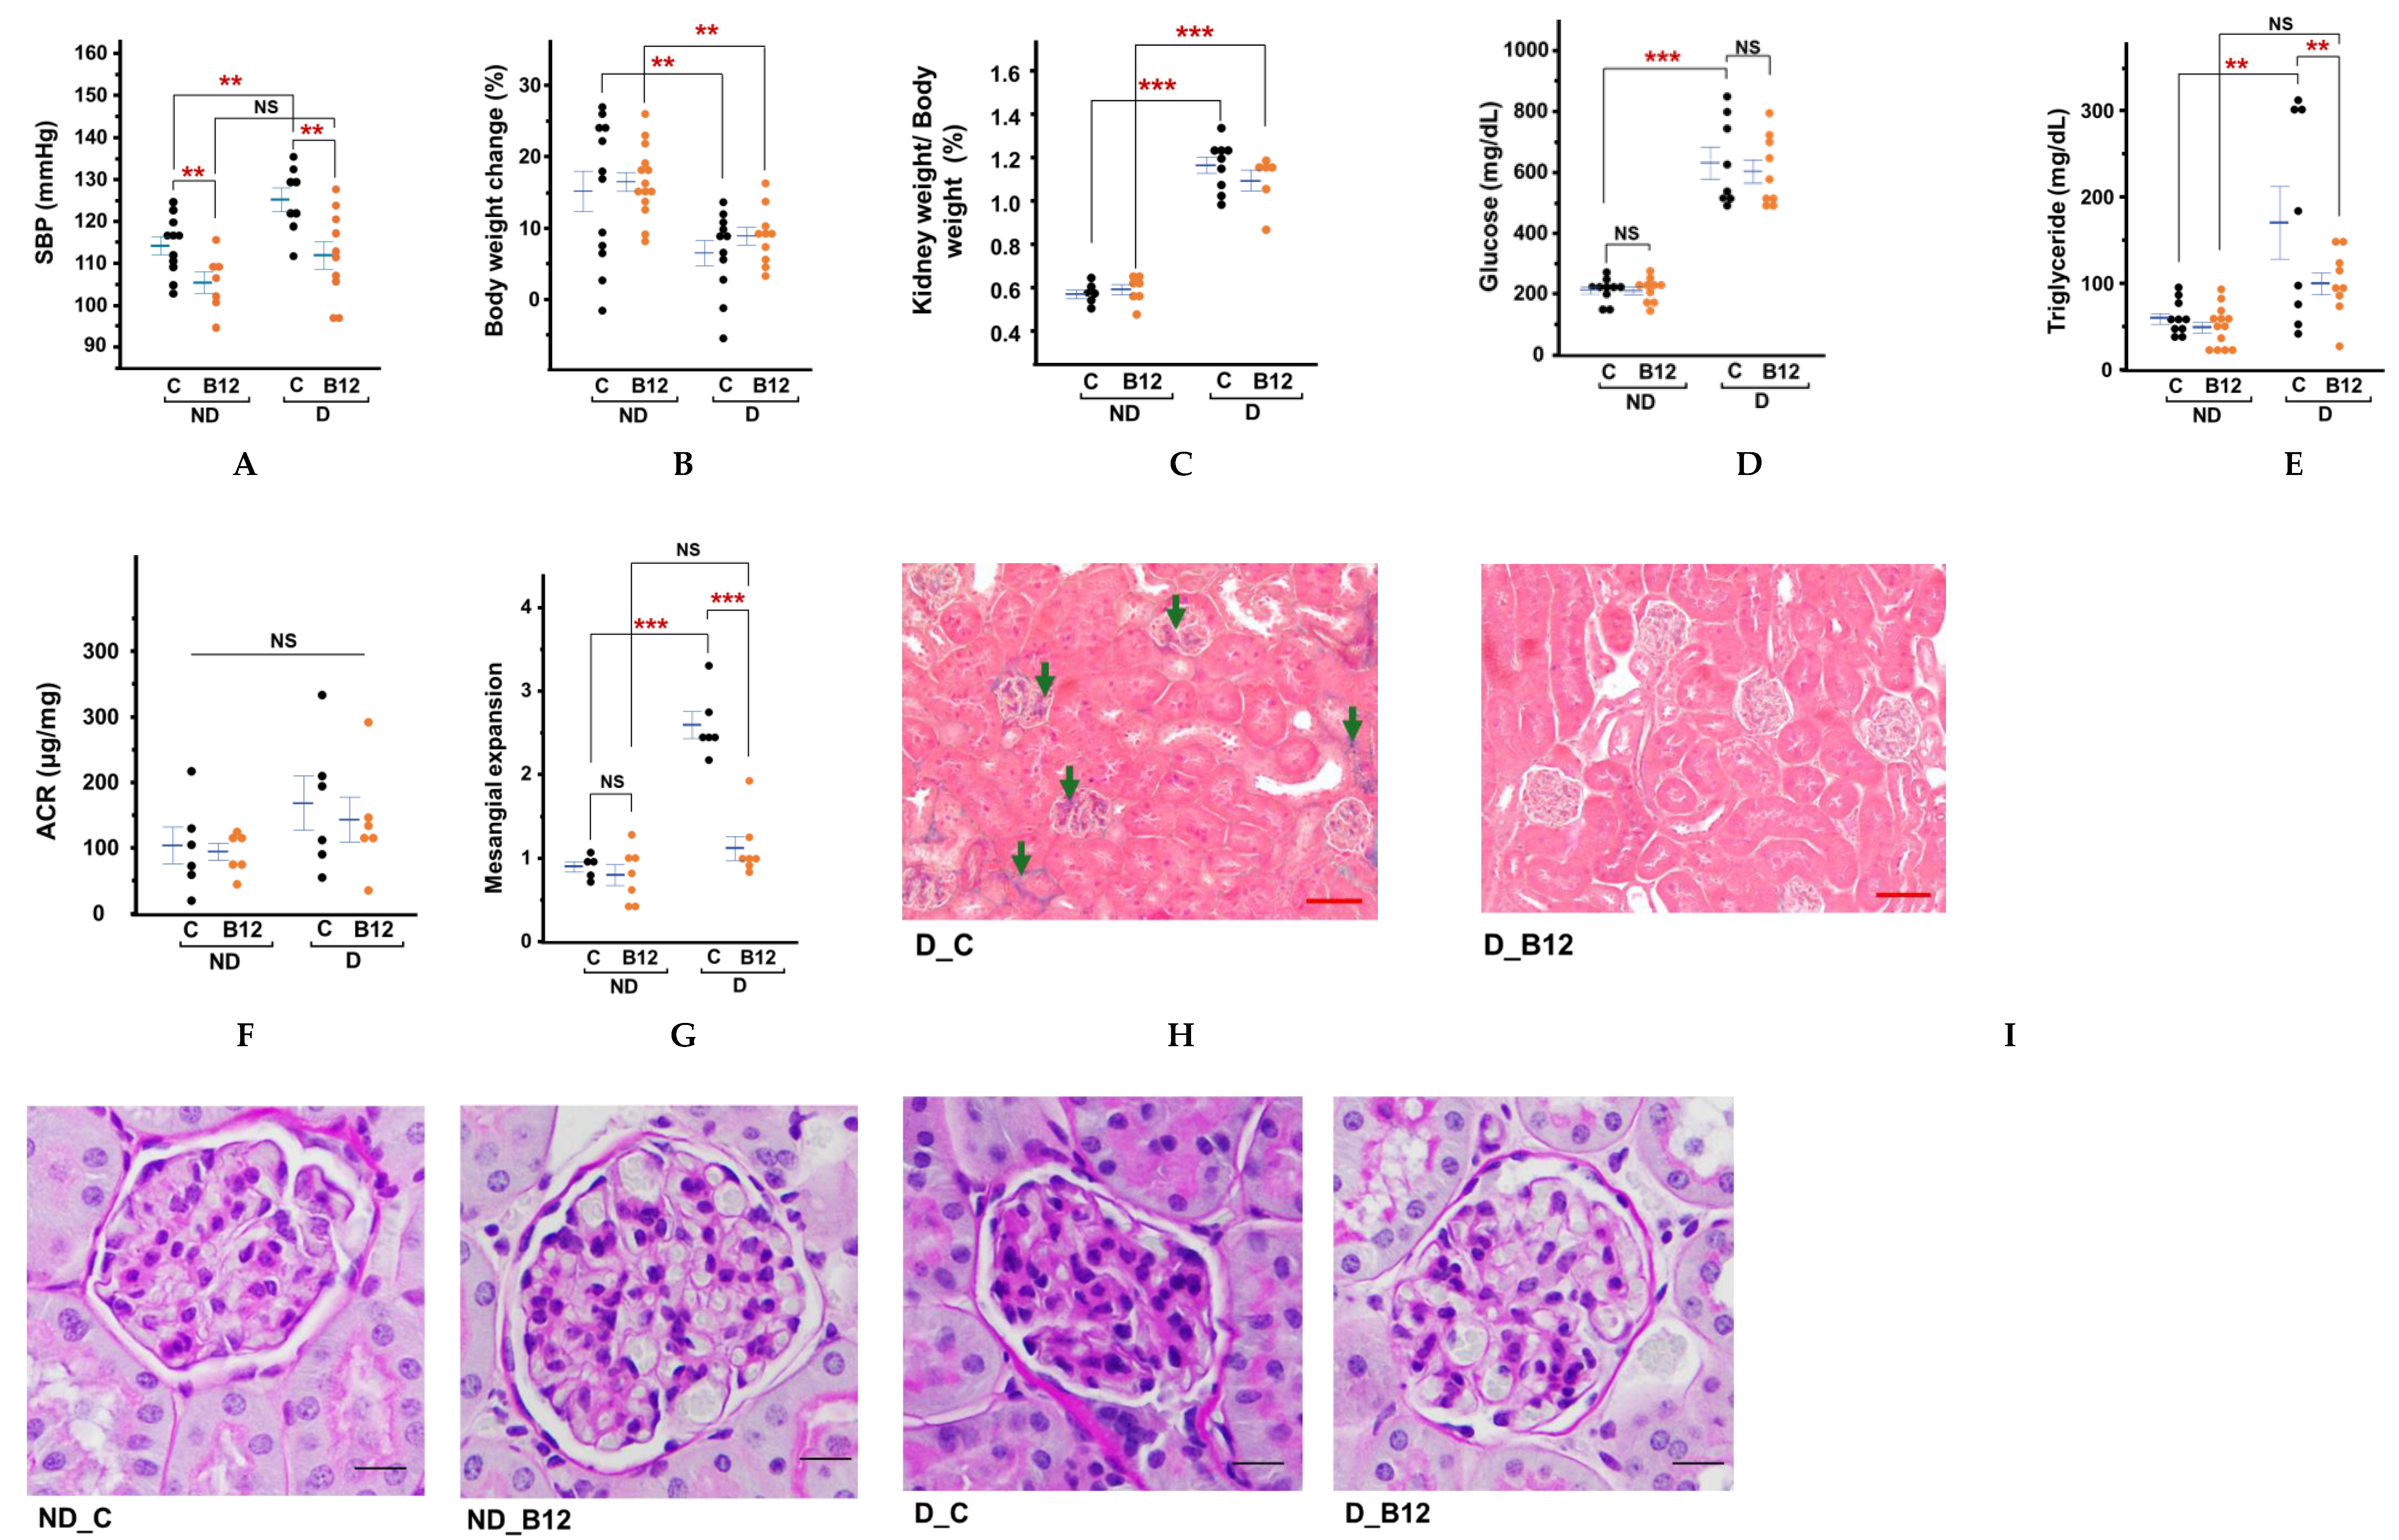
Systolic blood pressure was elevated in diabetic mice by approximately 10mmHg, while B12 treatment reduced to levels non-diabetic levels (
Figure 1A). Body weight gain during the two months of treatment with or without B12 differed markedly between diabetic and non-diabetic groups (
Figure 1B). Non-diabetic control mice gained average ~18% in body weights during the two-month treatment period, whereas non-diabetic mice treated with vitamin B12 gained ~13%, which is significantly lower increase. In contrast, untreated diabetic mice demonstrated significant body weight loss, consistent with their insulin-deficient phenotype. B12 treatment partially attenuated this catabolic effect, showing a ~2% weight gain compared to untreated diabetic mice. The C57BL/6-Ins2Akita/J model develops early, persistent hyperglycemia due to misfolded proinsulin causing ER stress and progressive β-cell loss [
13] limiting insulin output from a young age (∼3-4 weeks), resulting in weight loss (polydipsia/polyuria) independent of diet after 2 months of age. Enlargement of kidneys during the early stages of diabetes is driven by a combination of glomerular hyperfiltration, cellular hypertrophy, and metabolic stress [
14,
15], often appearing before measurable declines in renal function. Although B12 treatment did not lead to a statistically significant reduction in kidney size, a downward trend was observed (
Figure 1C), suggesting a potential role in mitigating early diabetic kidney remodeling.
Diabetic mice had higher plasma glucose levels compared to non-diabetic mice, but B12 had no significant effects in either group (Figure1D). Previous studies have reported similar outcomes, where B12 improved metabolic parameters without fully normalizing hyperglycemia in insulin-deficient models [
16]. Given that Akita mice carry a mutation in the insulin 2 (Ins2) gene leading to progressive β-cell apoptosis, the modest glucose-lowering effect observed here is likely secondary to improved peripheral metabolic resilience rather than direct preservation of β-cell mass. In contrast, a significant improvement in plasma triglyceride levels was observed with B12 treatment, suggesting a role for B12 in lipid metabolism (Figure1E). In diabetic conditions, triglyceride levels tended to vary widely, but B12 appeared to reduce this variability, indicating a stabilizing effect on lipid metabolism. Additionally, B12 reduced the urine albumin-to-creatinine ratios in both diabetic and non-diabetic mice, although not statistically significant (
Figure 1F).
By four months of age, kidneys of diabetic mice showed glomerular compression with some extracellular matrix accumulation and fibrosis (Figures 1H, 1I). Interstitial, peritubular fibrosis were minimal. In contrast, kidneys of the B12 treated animals showed normal glomerular morphology with open capillary spaces. They also exhibited a significantly reduced mesangial expansion score (by ~55%) compared to the untreated diabetic control group (
Figure 1 G&I). Masson’s trichrome staining also showed no discernable glomerular fibrosis or peritubular fibrosis following B12 treatment despite diabetic condition (
Figure 1H). Inflammatory cell infiltration was difficult to ascertain in histological sections at this stage. By immunostaining, presence of CD19-positive B cells were detected in the peritubular space of the diabetic kidneys from both with and without B12 treatment, while naïve T-cell presence appeared more substantial in the B12-supplemented group (
Figure S1). This section may be divided by subheadings. It should provide a concise and precise description of the experimental results, their interpretation, as well as the experimental conclusions that can be drawn.
3.2. Global Gene Expression Analyses Revealed Beneficial Pathways Through Which B12 Mitigates Diabetic Nephropathy Development.
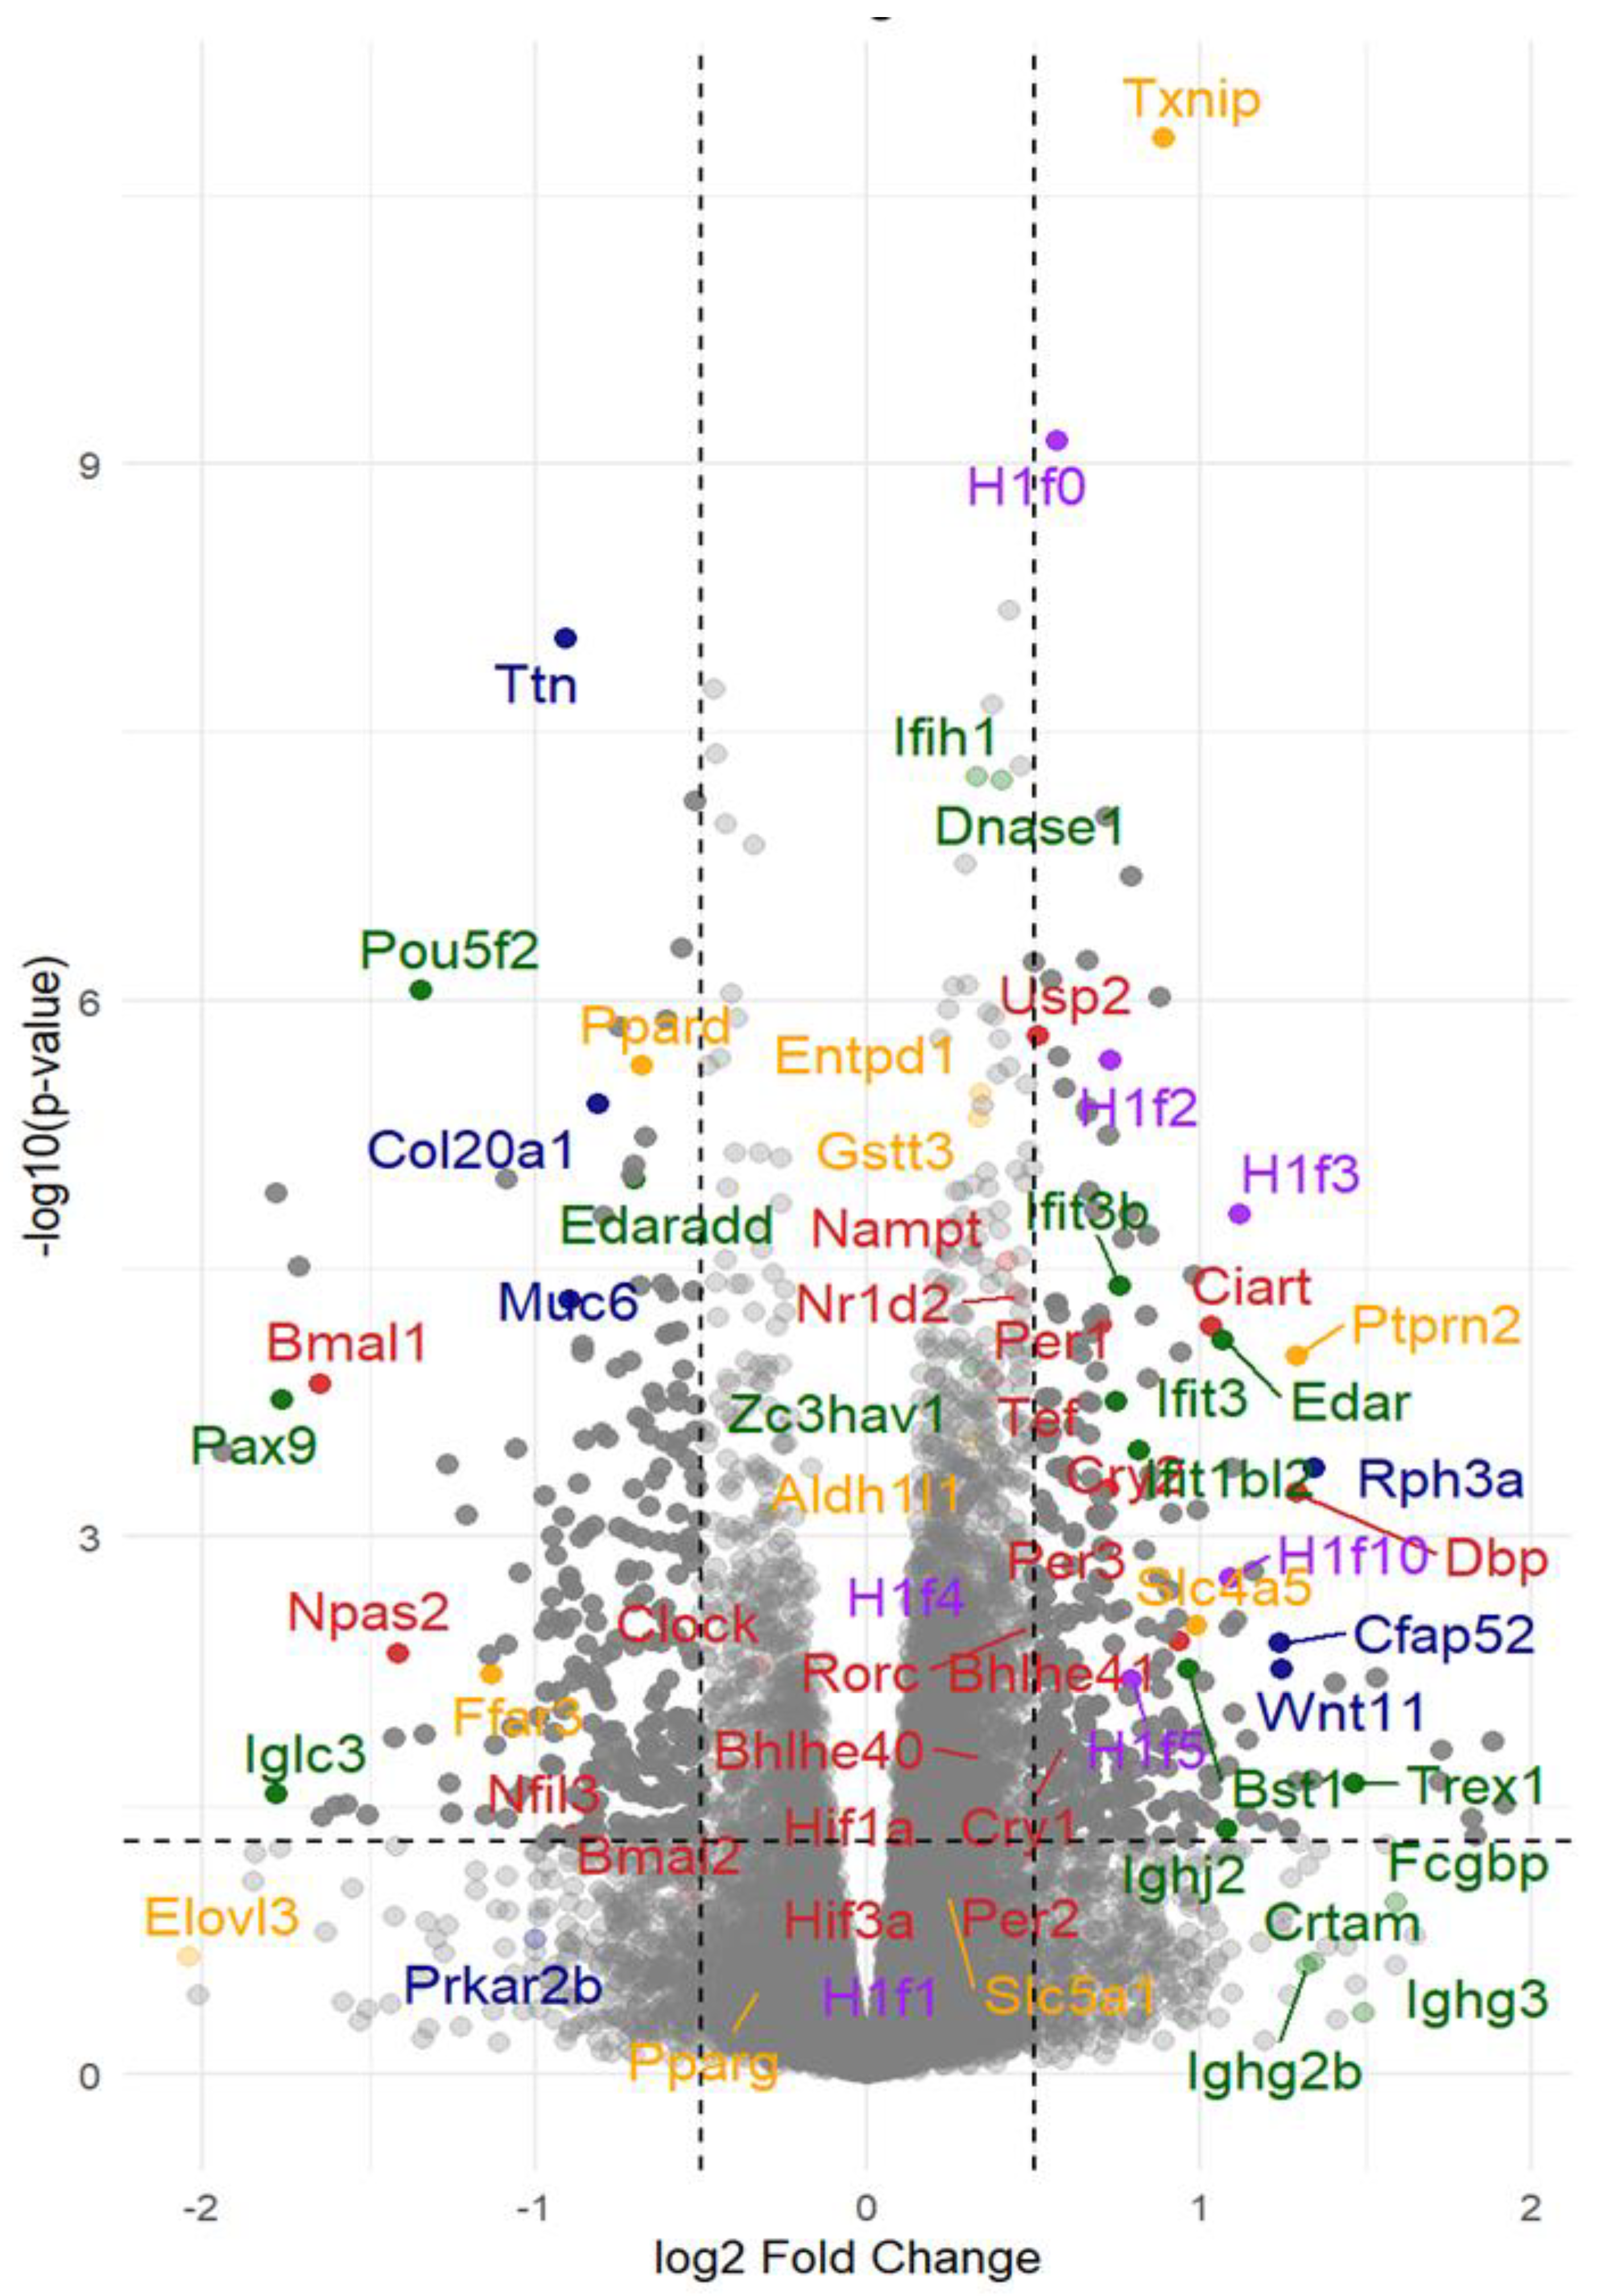
Physiological and histological characterizations described above confirmed that at four months of age is the adequate time point for our quest for the basis of protective effects of B12, since the diabetic nephropathy in the untreated diabetic mice were still at a very early stage such that the contribution to the global RNA expression pattern is likely due to the inflammatory cell infiltrating damaged kidneys and the secondary tissue responses. We, therefore, subjected four kidneys from each group to RNA seq analyses (n=4 each). The differential gene expression analyses revealed widespread transcriptional differences between the kidneys of diabetic mice with and without B12 supplementation, as illustrated in a Volcano plot (
Figure 2). The top significantly upregulated and downregulated genes within each functional category with their full names, effect of diabetes and B12, the corresponding log2 fold-change values and padj values are provided in
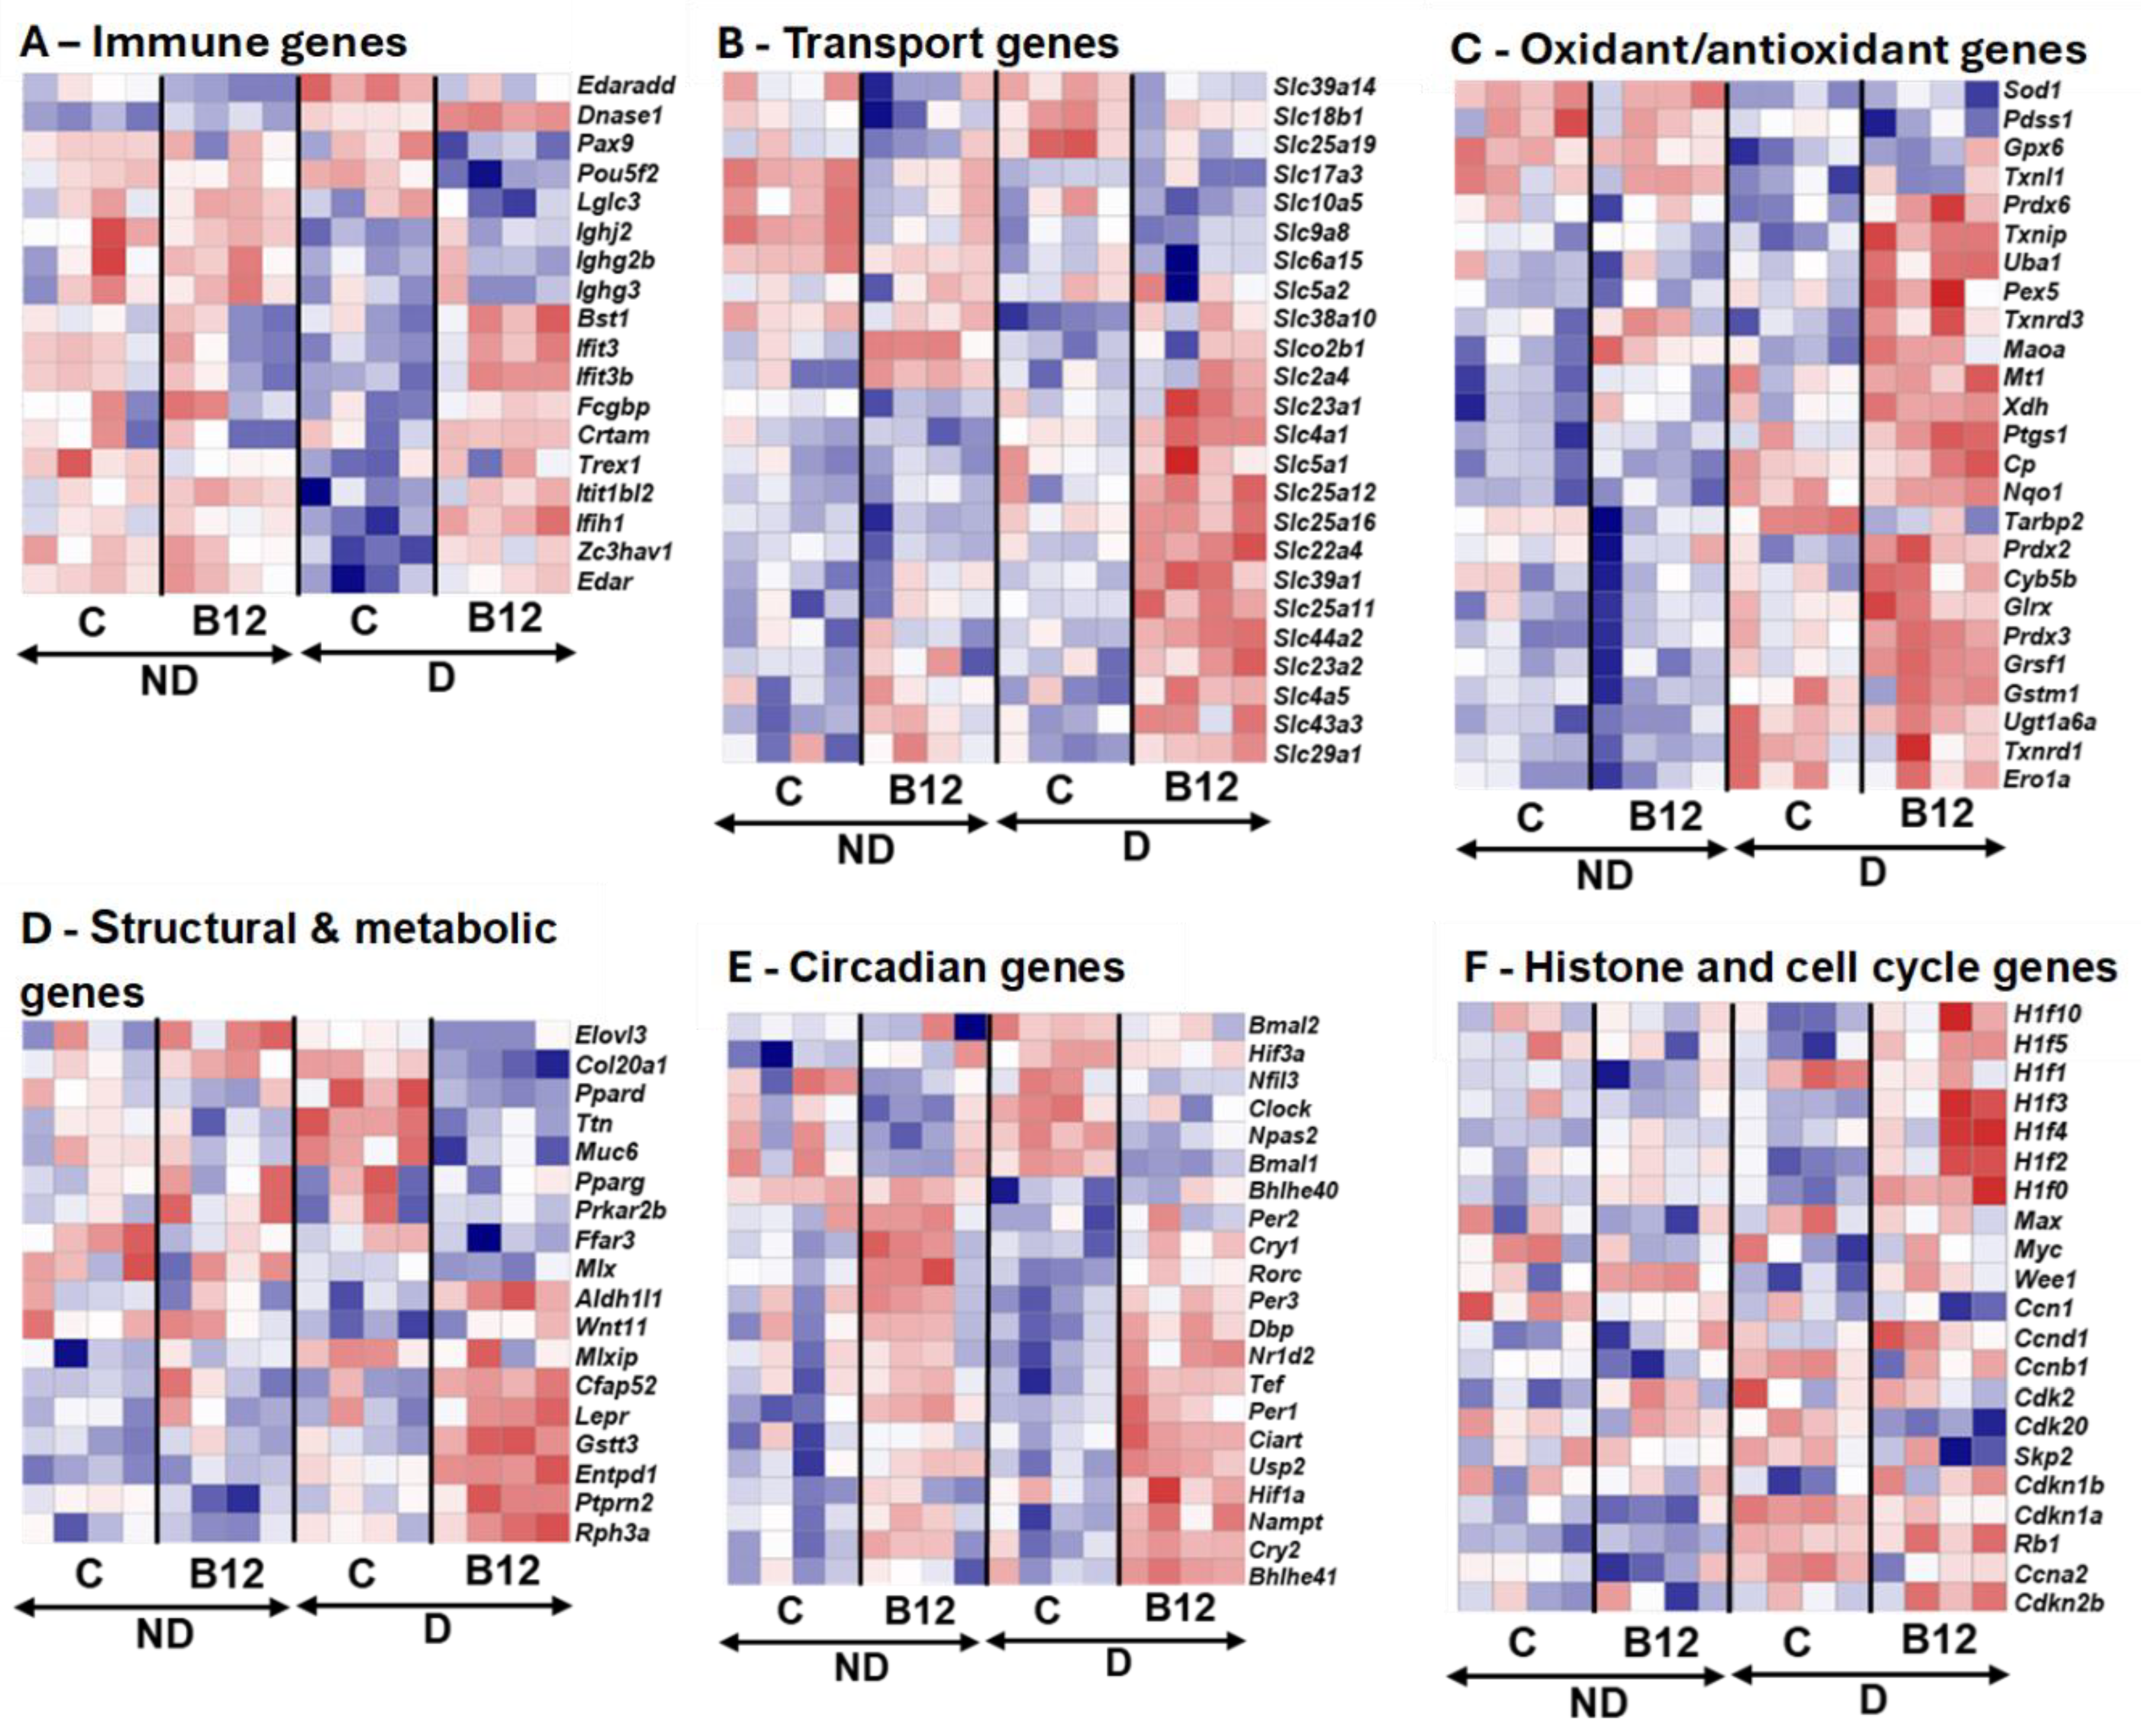
Table S2. The mean normalized counts (± standard error) for each gene in each group, along with the effects of diabetes, B12 treatment, and their interactions, were assessed using a Generalized Linear Model, as shown in table S3. The expression levels of these representative groups of genes were further analyzed together with the normalized counts of gene expression in each kidney of four groups and illustrated using heatmaps (
Figure 3). There are multiple genes that have been identified previously associated with diabetic nephropathy. General observation of these genes suggests that genes with significant alterations observed belong to in immune signaling, transport/metabolism, circadian rhythm regulation and epigenetic pathways.
3.2.1. Immune-Inflammatory Pathways
In B12 treated diabetic mice, Edar, a member of Tumor necrosis factor (TNF) receptor family that activate downstream signaling pathway, including NF-kB, which is important for inflammation and tissue development, was upregulated. Its adaptor Edaradd, is required to transmit signals from Edar to NF-κB, was downregulated, pointing to selective regulation in this signaling axis and NF-κB activation [
17]. This dual pattern suggests that B12 preserved baseline EDAR function while limiting EDARADD-driven amplification of NF-κB–mediated inflammatory stress. Because Edar can also activate alternative pathways such as JNK/Erk signaling, B12 may bias downstream signaling toward protective, non-inflammatory outcomes [
18]. Several interferon-stimulated genes (Bst1, Ifit1bl2, Ifih1) were also upregulated, indicating that B12 restored interferon responsiveness, which is often impaired under hyperglycemia.
In addition, many relatively small expression immunoglobulin genes suppressed in untreated diabetic kidneys (
Ighj2,
Ighg1,
Iglc3) were partially restored with B12, suggesting recovery of humoral defense mechanisms. While CD19⁺ B-cell infiltration was prominent in untreated diabetic kidneys, consistent with reports of their pathogenic role in nephropathy, B12 treatment appeared to attenuate this pathological infiltration while enhancing T-cell–associated regulatory signatures. These results align with clinical evidence showing that B12 supplementation restores lymphocyte counts and enhances regulatory T-cell function in B12-deficient individuals [
19]. Together, these findings support an immunomodulatory role of B12, as it alleviates renal inflammation by reducing pathogenic B-cell activity and promoting protective T-cell–mediated pathways (
Figure S2:A).
3.2.2. Solute Carrier Expression and Water Handling
Proximal tubular cells are metabolically most active cells in the kidney [
20], and genes encoding transporters that are essential for electrolyte, amino acid, and phosphate regulation (
Slc4a5,
Slc22a4,
Slc4a1, and
Slc44a3) were significantly upregulated, suggesting improved tubular homeostasis. Conversely, solute carriers such as
Slc10a5, and
Slc25a19 were suppressed, indicating selective downregulation of nutrient and ion transport.
Aqp6 expression was also induced, pointing to enhanced water reabsorption capacity (
Figure S2: B). Of note, B12 strongly upregulated
Slc4a5, may underline the observed improvement in blood pressure regulation in diabetic mice treated with B12 (
Figure 3B).
3.2.3. Redox Regulation
B12 is a SOD mimetic [
3] and reduced oxidative stress of cells [
1]. Current study did not show strong regulation of most of the antioxidant related genes. Some of them such as
Uba1,
Pex5,
Txnrd3, and
Maoa were slightly upregulated, while
Sod1,
Pdss1, and
Gpx6 were suppressed in untreated diabetic kidneys but preserved with B12 (
Table S2). Notably,
Txnip, responds to glucose-inducible inhibitor of TRX, was robustly induced with B12, which may appear maladaptive. This might seem harmful at first [
21] but, with B12
Txnip upregulation could be an adaptive response to manage oxidative stress and restore redox balance (
Figure 3C). This is consistent with B12’s broader role in promoting antioxidant defenses, possibly through methylation-dependent or metabolic regulation. Together, these findings demonstrate that B12 strengthens renal antioxidant capacity and reduces diabetes-driven oxidative stress (
Figure S2: C).
3.2.4. Metabolic and Structural Pathways
Fibrosis and extra cellular matrix (ECM) associated genes such as
Col20a1,
Muc6, and
Ttn were suppressed, while protective genes such as
Rph3a,
Ptprn2,
Aldoc, and
Wnt11 were upregulated. These changes suggest that B12 reduces maladaptive structural remodeling while enhancing repair pathways. Though the overall expression level was low, the upregulation of
Cfap52 was particularly notable; this gene is best known for its role in ciliary function in sperm [
22], its induction in kidney tissue suggests broader restoration of cilia-associated pathways. Because cilia serve as sensory and polarity hubs in podocytes and tubular epithelia,
Cfap52 upregulation may stabilize epithelial organization and enhance renal function. Restoration of
Wnt11 further supports this interpretation, as
Wnt11 plays a crucial role in kidney polarity and epithelial repair [
23] (
Figures S2: D). Together, these changes demonstrate that B12 rebalances multiple metabolic axes, including glucose handling, lipid metabolism, and mitochondrial function, in the diabetic kidney.
3.2.4. Vitamin B12 Reprograms Circadian Clock Networks and Chromatin Architecture in the Diabetic Kidney
B12 supplementation exerted pronounced effects on circadian regulation in the diabetic kidney (
Figure 3E). Core clock activators, including
Bmal1,
Clock, and
Npas2, were consistently suppressed, whereas negative feedback regulators (
Cry1-2,
Per1-3) and the NAD⁺-biosynthetic gene
Nampt were strongly induced. This coordinated shift indicates that B12 actively reprograms circadian transcriptional feedback loops, rather than just protecting against metabolic stress. The induction of
Nampt, a central regulator of NAD⁺ metabolism [
24], highlights a direct mechanistic link between B12 supplementation, redox cofactor availability, and circadian timing. These findings reveal for the first time that B12 mediate circadian–metabolic networks under diabetic conditions, suggesting a broader systemic role for B12 in synchronizing renal metabolism with whole-body clock regulation (
Figure S2: G). Multiple H1 variants exhibited dynamic responsiveness:
H1f0,
H1f2, and
H1f4 were upregulated, while
H1f3,
H1f5, and
H1f10 showed interaction effect (
Table S2). This pattern suggests that B12 reinforces chromatin compaction and nucleosome stability, potentially enhancing transcriptional control under diabetic stress. In parallel, upregulation of
Wee1, a key G2/M checkpoint kinase [
25], together with downregulation of
Cdk20, points to a coordinated role for B12 in restraining cell cycle progression and synchronizing it with circadian timing [
26] (
Figure 3F). Together, these changes indicate that B12 does not solely act as a metabolic cofactor but actively remodels nuclear architecture and checkpoint regulation in the diabetic kidney (Figures S: 2F–H). Furthermore, the transcriptomic evidence positions B12 as a multi-layered modulator of renal homeostasis, with effects spanning immune signaling, solute and water transport, oxidative balance, metabolic remodeling, circadian alignment, and chromatin regulation. Although histological changes remained modest at this early stage, RNA-seq revealed clear molecular reprogramming toward protective pathways.
3.3. Circadian Gene Expression in Cell Culture
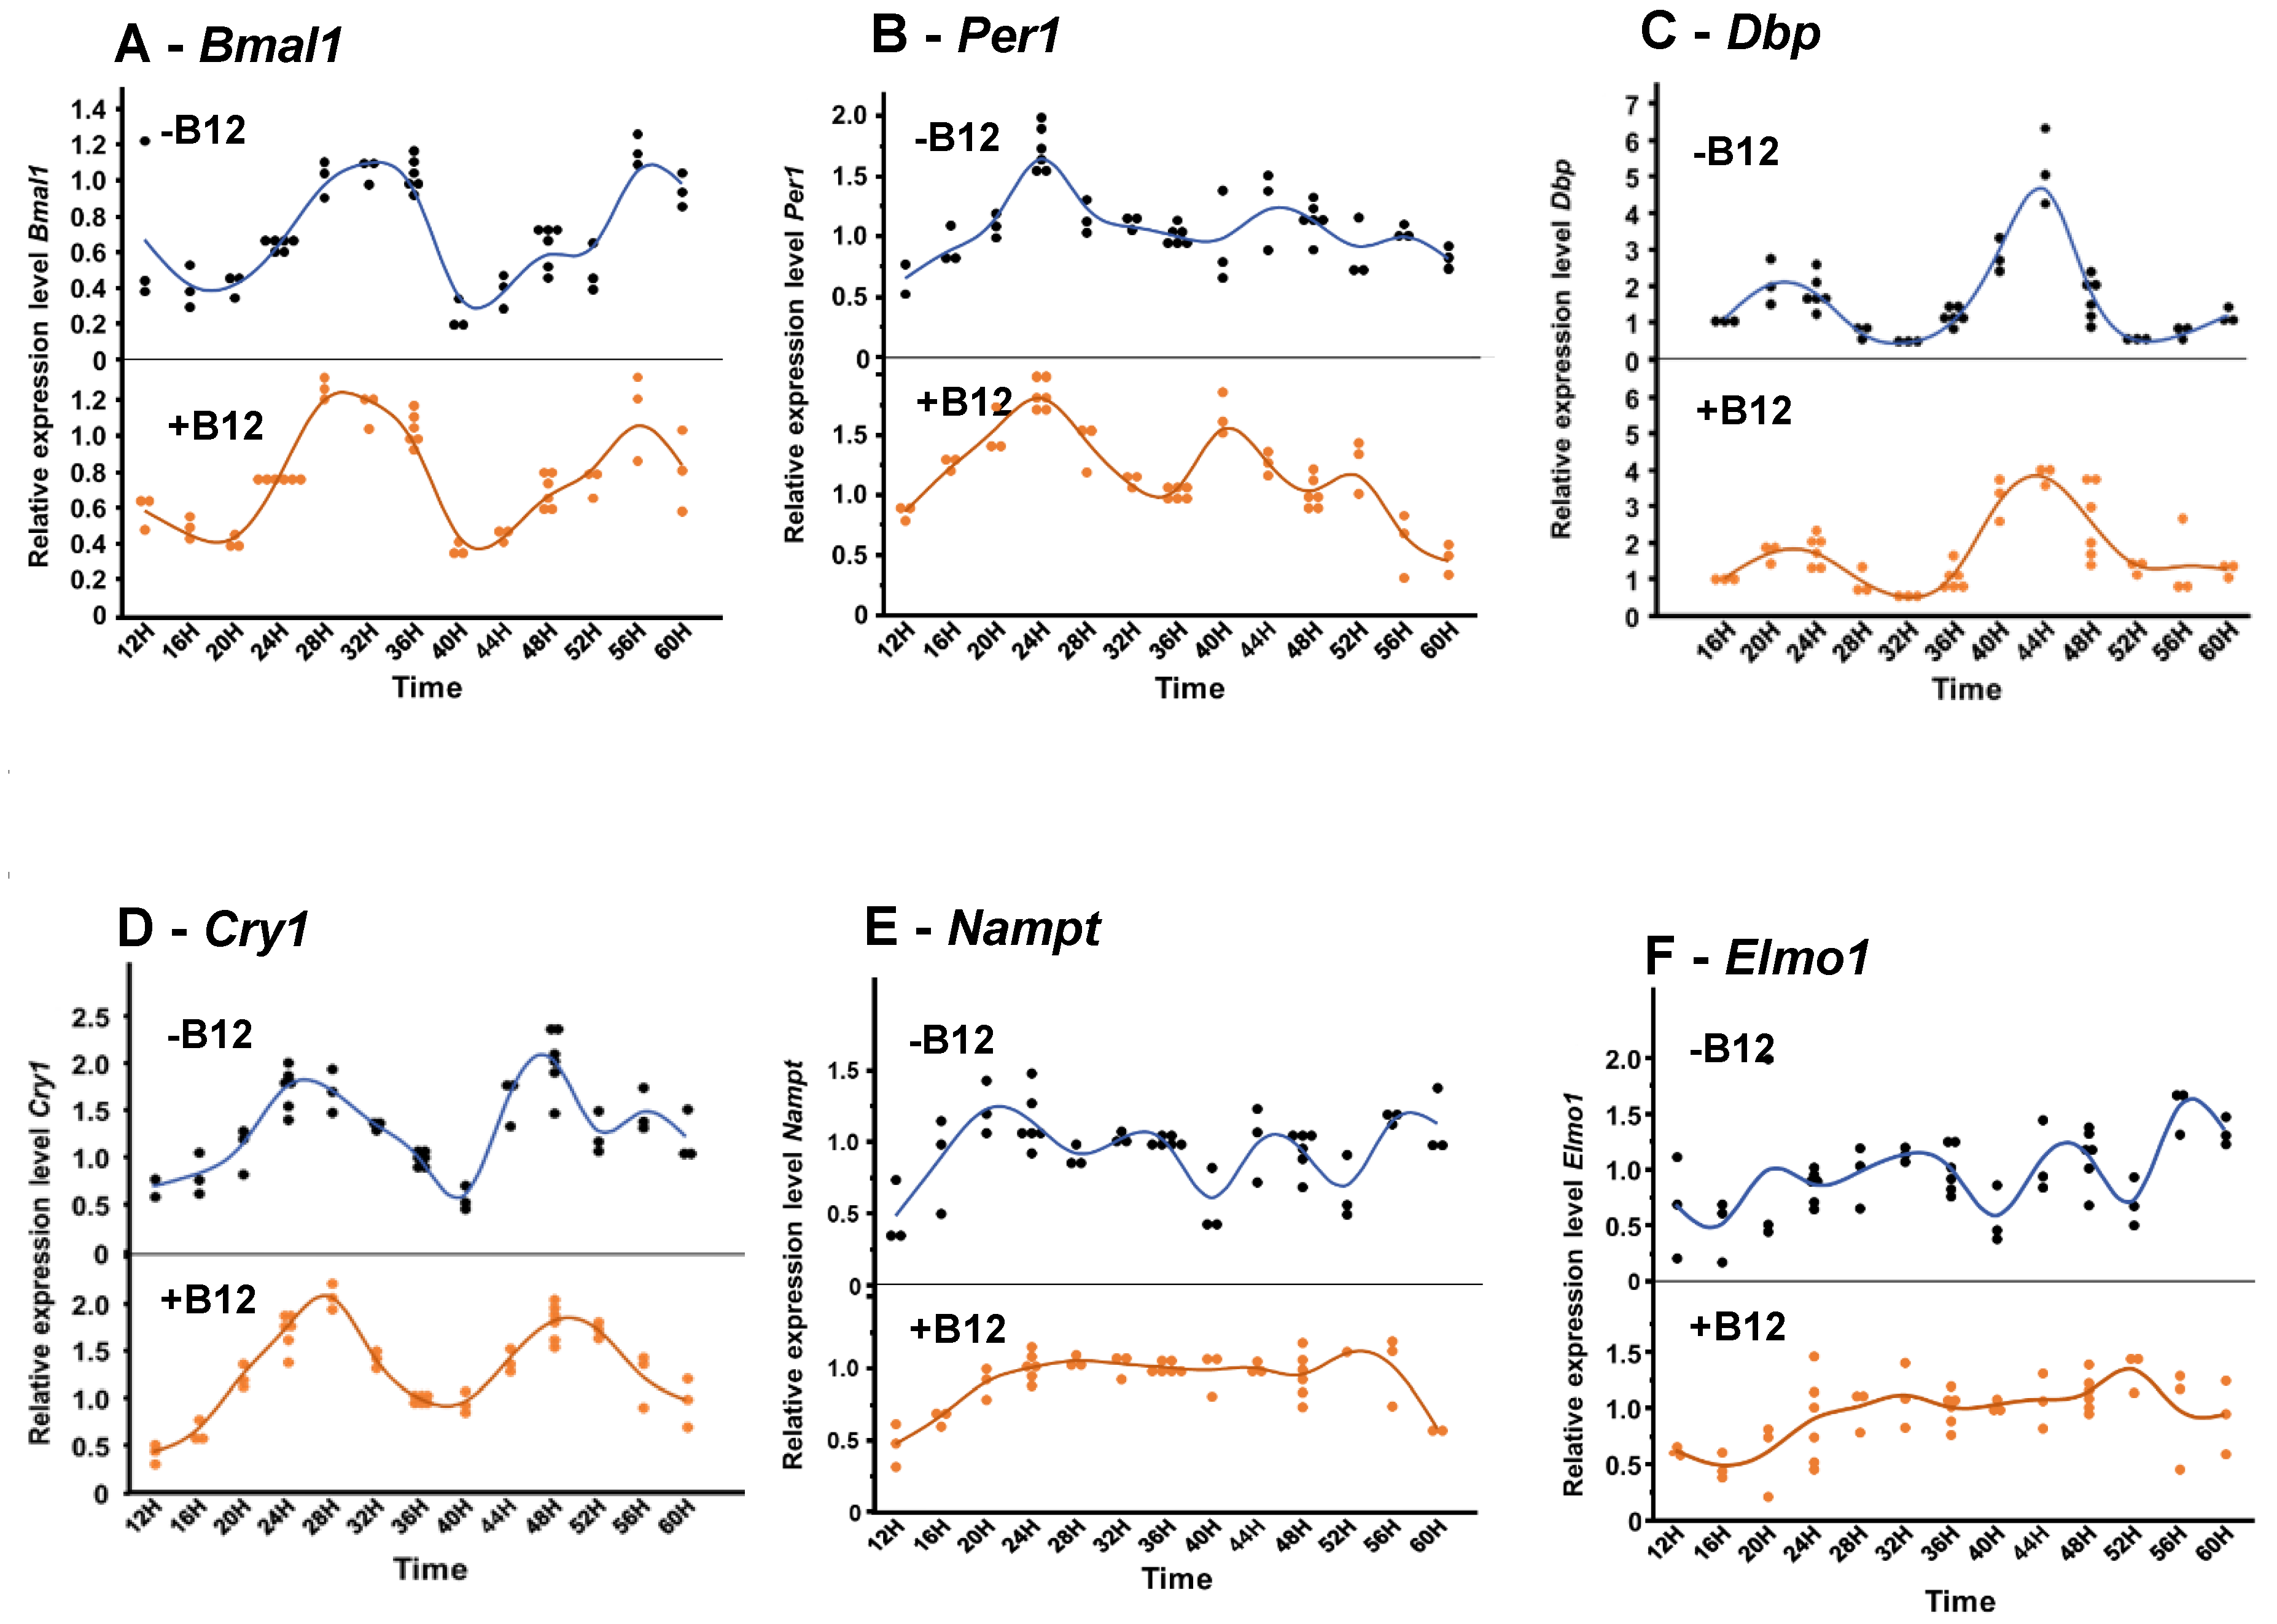
In BU.MPT cells, B12 treatment significantly modified the oscillatory rhythms of several circadian and metabolic genes, including
Bmal1,
Per1,
Dbp,
Cry1,
Nampt, and
Elmo1. Under control conditions (without B12), these genes displayed clear rhythmic patterns of relative expression with multiple distinct peaks across the time course (
Figure 4). For the core clock genes,
Bmal1,
Per1, and
Dbp were phase-advanced by approximately 2-4 hours, while
Cry1 was delayed by about 2 hours. Specifically, in control cells, the main two peaks of
Bmal1 were observed at ~34h and 58h respectively, whereas with B12 peaks were detected, at ~30h and ~56h, with the second peak being lower in amplitude than the first.
Per1 normally showed peaks at 26h, 46h, and 56h, but under B12 treatment the peaks shifted earlier, to 24h, 40h, and 52h, indicating a consistent phase advance.
Dbp showed only a slight phase shift: its early peak at ~22 h remained unchanged, but the later peak shifted from 44h (control) to 42h (B12). By contrast,
Cry1 displayed three peaks (two of them were major), under control conditions (24h, 47h, and 56h), but with B12 treatment only two peaks were observed, at ~28h and ~51h, reflecting both a delay and a dampening of rhythmicity. Interestingly, the metabolic regulators
Nampt and
Elmo1 lost their normal oscillatory behavior under B12 treatment. In controls, both genes showed four clear peaks across the monitoring period. With B12, however, their oscillations flattened, remaining at a consistently elevated level, particularly from 20h to 52h, suggesting a loss of rhythmic regulation and a shift toward sustained expression (
Figure 4).
4. Discussion
In this study we observed B12 exerts broad reno-protective effects in early diabetic nephropathy and our pathological observations are further supported by transcriptomic analysis. Several B12-regulated genes identified in our study, including
Col20a1,
Txnip, and
Ttn, have also been implicated in human studies where single nucleotide polymorphisms (SNPs) were associated with diabetic nephropathy [
27,
28]. However, no studies have to date examined the effects of B12 on these genes or on other B12 regulated genes which found in our study. In addition, B12-regulated genes described, and the precise mechanisms underlying its kidney-protective effects remain to be elucidated. These clinically observed patterns support the relevance of our experimental model and lead us to hypothesize that B12 may protect against diabetic kidney injury by modulating circadian clock genes and chromatin remodeling through histone H1.
The circadian clock is a built-in timing system that regulates physiological and behavioral functions in alignment with the light–dark cycle through transcriptional–translational feedback loops [
29]. In the current study, B12 independently suppressed positive feedback loop regulators,
Bmal1,
Clock and
Npas2, while increasing the negative feedback loop regulators
Per1-3 and
Cry1/2 regardless of diabetic status. This behavior may contribute to improving physiological parameters in the early stages of diabetic complications.[30,31
Notably, circadian regulation is tightly interconnected with blood pressure (BP) control and kidney disease. Mice lacking
Cry1/2 show elevated daytime BP and worsened renal injury, whereas kidney-specific
Bmal1 disruption alters BP rhythms [
30,
31]. The fact that our samples (collected at ZT7–ZT9) showed lower clock activators and higher
Cry1/2 repressor expression may therefore contribute to the SBP effects we observed with B12, even if not directly causal. In addition, contrary to reports that glutamine and methionine upregulate
Bmal1 in adipose tissue [
32], in our study, B12 downregulated
Bmal1 in the diabetic kidney, highlighting tissue-specific regulation of circadian genes. In addition, recent evidence supports a connection between solute carrier (SLC) gene expression and circadian clock regulation. For example,
Slc22a2, a renal organic cation transporter, exhibits rhythmic expression controlled by the core clock protein CLOCK via PPARα-mediated signaling [
33]. Similarly,
Slc5a1 (
Sglt1), a sodium-glucose co-transporter, has been shown to follow a circadian pattern of expression in intestinal and renal tissues, influenced by transcription factors such as
Hnf-1 and
Per1 [
34]. In our study, we observed modulation of several SLC, including
Slc5a1 and some genes in SLC22 family, in response to B12 treatment. While the precise mechanisms remain to be clarified, the coordinated changes in clock gene and SLC expression suggest that B12 may influence metabolic transport through circadian pathways.
The strong induction of
Nampt in B12-treated kidneys provides an additional mechanistic link between circadian control and metabolism.
Nampt encodes the rate-limiting enzyme of the NAD⁺ salvage pathway, a critical regulator of cellular energy metabolism [
24]. Its upregulation is consistent with activation of the CLOCK:BMAL1 → NAMPT → NAD⁺ → SIRT1 feedback loop, in which increased NAD⁺ drives SIRT1-mediated deacetylation of BMAL1/CLOCK, thereby restraining their transcriptional activity [
35,
36]. In this context, the observed profile of low
Bmal1/
Npas2/
Clock and high
Cry1-2 suggests that B12 enhances NAMPT–NAD⁺–SIRT1 signaling, rebalancing circadian outputs in the kidney. The upregulation of
Hif1a alongside circadian changes highlights a broader link between B12 and metabolic adaptation under stress.
Hif1a is a master regulator of hypoxia responses and has been implicated in obesity and metabolic dysfunction [
37,
38]. Thus, B12 may reset peripheral clocks and partially normalize hypoxia-related signaling, providing a protective mechanism in metabolic disease.
An additional noteworthy finding in our study was the regulation of H1 linker histones by B12 treatment in diabetic mice. Linker histones occupy the nucleosome entry–exit regions of DNA, facilitate higher-order chromatin folding, and suppress aberrant transcriptional activity [
39,
40,
41]. Our results suggest that B12 modulates the expression of histone linker genes and thereby influences epigenetic regulation, potentially reshaping chromatin structure and altering the transcriptional activity of genes related to metabolism, circadian rhythms, and renal function. Hyperglycemia, advanced glycation end-products (AGEs), and ROS remodel chromatin structure, in part by shifting the activity of histone-modifying enzymes. Glycation can directly damage H1 proteins and weaken H1–chromatin interactions, leading to chromatin relaxation and inappropriate activation of pro-inflammatory genes [
42,
43]. Such stress and dedifferentiation states are typically accompanied by reduced H1.0 levels, consistent with our observation in untreated diabetic mice.
Our in-vitro experiments with a BU.MPT cell line suggest that B12 may influence circadian gene oscillations. Although the precise underlying mechanisms remain to be fully elucidated, these findings provide an indication of B12’s potential regulatory role in circadian dynamics. B12 shifted oscillator timing in a non-uniform manner and this deviation between positive- and negative-limb genes suggests that B12 alters the internal balance of the feedback loops, temporarily reshaping expression of downstream clock-controlled genes. Several mechanisms may underlie this effect: First, Methylation control – B12 is a cofactor in one-carbon metabolism, potentially modifying DNA and histone methylation at clock gene promoters [
44]. Second, NAD⁺ availability – By influencing
Nampt and the NAD⁺ salvage pathway, B12 may alter SIRT1-mediated deacetylation of BMAL1/CLOCK [
45]. Third, Protein stability – B12 may affect PER/CRY stability or nuclear transport, explaining why
Per1 advanced while
Cry1 was delayed. However, the most striking result was the loss of rhythmicity in
Nampt. In controls,
Nampt followed oscillations; with B12, oscillations were lost, and expression remained at a high, constant level throughout the cycle. Because
Nampt is the rate-limiting enzyme for NAD⁺ biosynthesis, its rhythmicity is essential for NAD⁺ oscillations and SIRT1 activity [
24]. Constantly high
Nampt could flatten NAD⁺ rhythms, potentially dampening clock–metabolism feedback. This suppression of amplitude while maintaining high expression suggests metabolic or epigenetic regulation by B12. Our results are consistent with prior evidence that methyl donor availability alters clock phase and amplitude. In hepatocytes, methylation-dependent modification of BMAL1/CLOCK binding sites shifted circadian oscillations [
46]. In humans, B12 supplementation advanced melatonin and core body temperature rhythms, further supporting an entrainment role for B12 in peripheral clocks [
47].
5. Conclusions
Protective effects of Vitamin B12 from early diabetic kidney injuries highlight genes for redox balance, inflammation/immunity, solute transport and structural integrity. Our RNA seq analysis revealed the modulation of circadian rhythm controlling gene expression inducing phase shift of rhythmic expression of core clock genes. Increased transcription of linker histones suggests enhanced chromatin stability and cell cycle progression. These findings suggest a previously unrecognized epigenetic and circadian mechanism through which B12 mitigates diabetes-induced renal injury. To our knowledge, this is the first report linking circadian gene regulation and the upregulation of H1 variants with B12 in the diabetic kidney, highlighting a novel intersection between micronutrient status, circadian biology, and chromatin regulation in diabetic kidney disease.
While this study provides novel insights into the effects of B12 on circadian clock gene expression in male Elmo1-overexpressing diabetic and non-diabetic mice, several limitations should be acknowledged. Only male mice were included, which limits the generalizability of the findings. Sex-specific differences in metabolism, circadian rhythms, and response to B12 may exist, and future studies should include female mice to evaluate these potential effects. Tissue samples were collected at a single time point. Because circadian gene expression is inherently dynamic, analyzing only one-time point may not fully capture the oscillatory patterns or the complete influence of B12 on circadian regulation. Additionally, the unequal and random number of animals per cage may have introduced variability in behavior, stress, and metabolic activity, further influencing gene expression outcomes. The overexpression of Elmo1 itself may have amplified phenotypic differences, complicating the interpretation of B12-specific effects. Finally, this study focused only on gene expression levels. Protein abundance and downstream metabolic effects were not evaluated, and the molecular mechanisms remain incompletely understood. For instance, although in-vitro experiments suggested a role for Nampt in circadian regulation under B12 treatment, further mechanistic validation is needed.
To address these limitations, future investigations should: (i) separately house diabetic and non-diabetic mice to standardize water and B12 intake; (ii) collect tissues across multiple circadian time points to capture dynamic oscillatory patterns; and (iii) perform mechanistic studies, such as conditional Nampt knockdown or overexpression, as well as epigenetic analyses (e.g., ChIP assays or ATAC-seq) to explore whether B12 influences clock gene regulation through histone modifications or chromatin accessibility. Incorporating proteomic and metabolomic analyses alongside transcriptomics will also provide a more comprehensive understanding of how B12 modulates circadian rhythms and metabolic phenotypes.
Supplementary Materials
The following supporting information can be downloaded at: Preprints.org, Figure S1: B cell and T cell distribution in diabetic kidneys with and without Vitamin B12 treatment; Figure S2: Volcano plots of differentially expressed genes in B12-treated diabetic animals, categorized into functional groups; Figure S3: RT-PCR validation of selected genes. Table S1: Real-Time PCR primers used; Table S2: Top significantly altered genes within each functional category showing effects of diabetes and vitamin B12 treatment; Table S3: Mean normalized counts (± SE) for each gene and the effects of diabetes, vitamin B12 treatment, and their interaction assessed by a generalized linear model.
Author Contributions
Conceptualization and methodology, N.M.W.W.A and N. M.; software, formal analysis, data curation and visualization, N.M.W.W.A. and A.A.D.; validation, N.M.W.W.A., R.L.M., J.Z. and Q.M.; investigation, N.M.W.W.A., R.L.M., J.Z., Q.M and N. M.; resources and supervision, F.L., Y.K., and N. M.; writing-original draft preparation, N.M.W.W.A.; writing—review and editing, N.M.W.W.A, A.A.D., R.L.M., Q.M., J.Z., F.L., Y.K., and N. M.; project administration, N.M.W.W.A., F.L., and N. M.; funding acquisition, F.L., and N. M.
Funding
This research was funded by National Institutes of Health (NIH), grant numbers R01HL049277 and R01HD101485.
Institutional Review Board Statement
The animal study protocol was approved by the Institutional Review Board (or Ethics Committee) of University of North Carolina Institutional Animal Care and Use Committee (Protocol number: 22-229 and date of approval: 30 September 2023).
Informed Consent Statement
No applicable.
Data Availability Statement
RNA sequencing data are deposited to NCBI Gene Expression Omnibus (accession #: GSE306999).
Acknowledgments
We gratefully acknowledge the technical support from the UNC MRI ultrasound core facility and the UNC High Throughput Sequencing Facility (HTSF). We would like to thank Yuye Wang and Soleil Culley for their valuable support and technical assistance, and Yuki Kiyokawa for proofreading the manuscript. During the preparation of this manuscript/study, the author(s) used ChatGPT (model: GPT-5, OpenAI) for assistance with the interpretation of R code and for text editing. The authors have reviewed and edited the output and take full responsibility for the content of this publication.
Conflicts of Interest
The authors declare no conflicts of interest.
Abbreviations
The following abbreviations are used in this manuscript:
| B12 |
Vitamin B12 |
| SOD |
Superoxide dismutase |
| ROS |
Reactive oxygen species |
| Elmo1 |
Engulfment and Cell Motility 1 |
| SNPs |
Single nucleotide polymorphisms |
| GSH |
Glutathione |
| TGFβ1 |
Transforming growth factor β1 |
| SBP |
Systolic blood pressure |
| GEO |
NCBI Gene Expression Omnibus |
| qRT-PCR |
Quantitative Reverse-transcription Polymerase Chain Reaction |
| PAS |
Periodic Acid-Schiff |
| TNF |
Tumor necrosis factor |
| ECM |
extra cellular matrix |
| AGEs |
Advanced glycation end-products |
| BP |
Blood pressure |
| SLC |
Solute carrier |
References
- Li F: Bahnson EM, Wilder J, Siletzky R, Hagaman J, Nickekeit V, Hiller S, Ayesha A, Feng L, Levine JS et al.: Oral high dose vitamin B12 decreases renal superoxide and post-ischemia/reperfusion injury in mice. Redox Biol 2020, 32:101504. [CrossRef]
- Doets EL, van Wijngaarden JP, Szczecinska A, Dullemeijer C, Souverein OW, Dhonukshe-Rutten RA, Cavelaars AE, van ‘t Veer P, Brzozowska A, de Groot LC: Vitamin B12 intake and status and cognitive function in elderly people. Epidemiol Rev 2013, 35:2-21.
- Edward Suarez-Moreira JY, Catherine S. Birch, John H. H. Williams, Andrew McCaddon, and Nicola E. Brasch*: Vitamin B12 and Redox Homeostasis: Cob(II)alamin Reacts with Superoxide at Rates Approaching Superoxide Dismutase (SOD). J AM CHEM SOC 2009, 131:15078-15079. [CrossRef]
- Victor P, Umapathy D, George L, Juttada U, Ganesh GV, Amin KN, Viswanathan V, Ramkumar KM: Crosstalk between endoplasmic reticulum stress and oxidative stress in the progression of diabetic nephropathy. Cell Stress Chaperones 2021, 26(2):311-321. [CrossRef]
- Volpe CMO, Villar-Delfino PH, Dos Anjos PMF, Nogueira-Machado JA: Cellular death, reactive oxygen species (ROS) and diabetic complications. Cell Death Dis 2018, 9(2):119.
- Hathaway CK, Chang AS, Grant R, Kim HS, Madden VJ, Bagnell CR, Jr., Jennette JC, Smithies O, Kakoki M: High Elmo1 expression aggravates and low Elmo1 expression prevents diabetic nephropathy. Proc Natl Acad Sci U S A 2016, 113(8):2218-2222. [CrossRef]
- Kakoki M, Bahnson EM, Hagaman JR, Siletzky RM, Grant R, Kayashima Y, Li F, Lee EY, Sun MT, Taylor JM et al.: Engulfment and cell motility protein 1 potentiates diabetic cardiomyopathy via Rac-dependent and Rac-independent ROS production. JCI Insight 2019, 4(12).
- Bodhini D, Chidambaram M, Liju S, Revathi B, Laasya D, Sathish N, Kanthimathi S, Ghosh S, Anjana RM, Mohan V et al.: Association of rs11643718 SLC12A3 and rs741301 ELMO1 Variants with Diabetic Nephropathy in South Indian Population. Ann Hum Genet 2016, 80(6):336-341. [CrossRef]
- Leak TS, Perlegas PS, Smith SG, Keene KL, Hicks PJ, Langefeld CD, Mychaleckyj JC, Rich SS, Kirk JK, Freedman BI et al.: Variants in intron 13 of the ELMO1 gene are associated with diabetic nephropathy in African Americans. Ann Hum Genet 2009, 73(2):152-159. [CrossRef]
- Kakoki M, Ramanathan PV, Hagaman JR, Grant R, Wilder JC, Taylor JM, Charles Jennette J, Smithies O, Maeda-Smithies N: Cyanocobalamin prevents cardiomyopathy in type 1 diabetes by modulating oxidative stress and DNMT-SOCS1/3-IGF-1 signaling. Commun Biol 2021, 4(1):775.
- Maeda N, Taylor LS, Nassar-Guifarro M, Monawar MS, Dunn SM, Devanney NA, Li F, Johnson LA, Kayashima Y: Genomic and cellular context-dependent expression of the human ELMO1 gene transcript variants. Gene 2025, 954:149438. [CrossRef]
- ujicic S, Feng L, Antoni A, Rauch J, Levine JS: Identification of Intracellular Signaling Events Induced in Viable Cells by Interaction with Neighboring Cells Undergoing Apoptotic Cell Death. J Vis Exp 2016, 118.
- Izumi T, Yokota-Hashimoto, H., Zhao, S., Wang, J., Halban, P. H., and Takeuchi, T.: Dominant Negative Pathogenesis by Mutant Proinsulin in the Akita Diabetic Mouse. DIABETES 2003, 52. [CrossRef]
- Liu H, Feng J, Tang L: Early renal structural changes and potential biomarkers in diabetic nephropathy. Front Physiol 2022, 13:1020443. [CrossRef]
- Matsubara T, Abe H, Arai H, Nagai K, Mima A, Kanamori H, Sumi E, Takahashi T, Matsuura M, Iehara N et al.: Expression of Smad1 is directly associated with mesangial matrix expansion in rat diabetic nephropathy. Lab Invest 2006, 86(4):357-368. [CrossRef]
- Zhang Y, Chu L, Zhou X, Xu T, Shen Q, Li T, Wu Y: Vitamin B12-Induced Autophagy Alleviates High Glucose-Mediated Apoptosis of Islet beta Cells. Int J Mol Sci 2023, 24(20). [CrossRef]
- Qiu S, Sun G, Zhang Y, Li X, Wang R: Involvement of the NF-kappaB signaling pathway in the renoprotective effects of isorhamnetin in a type 2 diabetic rat model. Biomed Rep 2016, 4(5):628-634. [CrossRef]
- Cai Z, Deng X, Jia J, Wang D, Yuan G: Ectodysplasin A/Ectodysplasin A Receptor System and Their Roles in Multiple Diseases. Front Physiol 2021, 12:788411. [CrossRef]
- Tamura J, Kubota, K., Murakam, H., Sawamura, M., Matsushima, T., Tamura, T., Saitoh, T., Kurabayshi, H. and Naruse, T.: Immunomodulation by vitamin B12: augmentation of CD8þ T lymphocytes and natural killer (NK) cell activity in vitamin B12-deficient patients by methyl-B12 treatment. Clin Exp Immunol 1999, 116:28. [CrossRef]
- Hoenig MP, Brooks CR, Hoorn EJ, Hall AM: Biology of the proximal tubule in body homeostasis and kidney disease. Nephrol Dial Transplant 2025, 40(2):234-243. [CrossRef]
- Thielen L, Shalev A: Diabetes pathogenic mechanisms and potential new therapies based upon a novel target called TXNIP. Curr Opin Endocrinol Diabetes Obes 2018, 25(2):75-80. [CrossRef]
- Cassandra BC-F, Bryan GH-H, Gemma Murguía H, Edgar OR-M, Juan JS-C, Brissia L: The impact of diabetes on spermatogenesis. GSC Advanced Research and Reviews 2024, 21(3):040-046.
- Nagy, II, Xu Q, Naillat F, Ali N, Miinalainen I, Samoylenko A, Vainio SJ: Impairment of Wnt11 function leads to kidney tubular abnormalities and secondary glomerular cystogenesis. BMC Dev Biol 2016, 16(1):30. [CrossRef]
- Ramsey KM, Yoshino, J., Brace, C.s., Abrassart, D., Kobayashi, Y., Marcheva, B., Hong, H. k., Chong, J. L., Buhr, E. D., Lee, C., Takahashi, J. S., Imai, S., Bass, J.: Circadian Clock Feedback Cycle Through NAMPT-Mediated NAD+ Biosynthesis. SCIENCE 2009, 324. [CrossRef]
- Feng J, Xie L, Lu W, Yu X, Dong H, Ma Y, Kong R: Hyperactivation of p53 contributes to mitotic catastrophe in podocytes through regulation of the Wee1/CDK1/cyclin B1 axis. Ren Fail 2024, 46(2):2365408. [CrossRef]
- Farshadi E, van der Horst GTJ, Chaves I: Molecular Links between the Circadian Clock and the Cell Cycle. J Mol Biol 2020, 432(12):3515-3524.
- Sandholm N, Cole JB, Nair V, Sheng X, Liu H, Ahlqvist E, van Zuydam N, Dahlstrom EH, Fermin D, Smyth LJ et al.: Genome-wide meta-analysis and omics integration identifies novel genes associated with diabetic kidney disease. Diabetologia 2022, 65(9):1495-1509. [CrossRef]
- Letonja J, Nussdorfer P, Petrovic D: Single-Nucleotide Polymorphisms in the Thioredoxin Antioxidant System and Their Association with Diabetic Nephropathy in Slovenian Patients with Type 2 Diabetes-A Preliminary Study. Int J Mol Sci 2025, 26(5). [CrossRef]
- Stow LR, Gumz ML: The circadian clock in the kidney. J Am Soc Nephrol 2011, 22(4):598-604.
- Richards J, Diaz AN, Gumz ML: Clock genes in hypertension: novel insights from rodent models. Blood Press Monit 2014, 19(5):249-254.
- Crislip GR, Costello HM, Juffre A, Cheng KY, Lynch IJ, Johnston JG, Drucker CB, Bratanatawira P, Agarwal A, Mendez VM et al.: Male kidney-specific BMAL1 knockout mice are protected from K(+)-deficient, high-salt diet-induced blood pressure increases. Am J Physiol Renal Physiol 2023, 325(5):F656-F668. [CrossRef]
- Wang S, Lin Y, Gao L, Yang Z, Lin J, Ren S, Li F, Chen J, Wang Z, Dong Z et al.: PPAR-gamma integrates obesity and adipocyte clock through epigenetic regulation of Bmal1. Theranostics 2022, 12(4):1589-1606. [CrossRef]
- Oda M, Koyanagi S, Tsurudome Y, Kanemitsu T, Matsunaga N, Ohdo S: Renal circadian clock regulates the dosing-time dependency of cisplatin-induced nephrotoxicity in mice. Mol Pharmacol 2014, 85(5):715-722. [CrossRef]
- Rhoads DB, Rosenbaum DH, Unsal H, Isselbacher KJ, Levitsky LL: Circadian periodicity of intestinal Na+/glucose cotransporter 1 mRNA levels is transcriptionally regulated. J Biol Chem 1998, 273(16):9510-9516. [CrossRef]
- Ramsey KM, Yoshino J, Brace CS, Abrassart D, Kobayashi Y, Marcheva B, Hong HK, Chong JL, Buhr ED, Lee C et al.: Circadian clock feedback cycle through NAMPT-mediated NAD+ biosynthesis. Science 2009, 324(5927):651-654. [CrossRef]
- Nakahata Y, Sahar S, Astarita G, Kaluzova M, Sassone-Corsi P: Circadian control of the NAD+ salvage pathway by CLOCK-SIRT1. Science 2009, 324(5927):654-657. [CrossRef]
- Zhang Y, Chen Y, Qu H, Wang Y: Methylation of HIF3A promoter CpG islands contributes to insulin resistance in gestational diabetes mellitus. Mol Genet Genomic Med 2019, 7(4):e00583. [CrossRef]
- Pfeiffer S, Kruger J, Maierhofer A, Bottcher Y, Kloting N, El Hajj N, Schleinitz D, Schon MR, Dietrich A, Fasshauer M et al.: Hypoxia-inducible factor 3A gene expression and methylation in adipose tissue is related to adipose tissue dysfunction. Sci Rep 2016, 6:27969. [CrossRef]
- Pan C, Fan Y: Role of H1 linker histones in mammalian development and stem cell differentiation. Biochim Biophys Acta 2016, 1859(3):496-509. [CrossRef]
- Prendergast L, Reinberg D: The missing linker: emerging trends for H1 variant-specific functions. Genes Dev 2021, 35(1-2):40-58. [CrossRef]
- Salinas-Pena M, Rebollo E, Jordan A: Imaging analysis of six human histone H1 variants reveals universal enrichment of H1.2, H1.3, and H1.5 at the nuclear periphery and nucleolar H1X presence. Elife 2024, 12.
- Lu Y, Zhang Y, Yao J, Bai W, Li K: Histone Modifications: Potential Therapeutic Targets for Diabetic Retinopathy. Biomolecules 2025, 15(4). [CrossRef]
- Li D, Zhang L, He Y, Zhou T, Cheng X, Huang W, Xu Y: Novel histone post-translational modifications in diabetes and complications of diabetes: The underlying mechanisms and implications. Biomed Pharmacother 2022, 156:113984. [CrossRef]
- Anderson OS, Sant KE, Dolinoy DC: Nutrition and epigenetics: an interplay of dietary methyl donors, one-carbon metabolism and DNA methylation. J Nutr Biochem 2012, 23(8):853-859. [CrossRef]
- Chang HC, Guarente L: SIRT1 mediates central circadian control in the SCN by a mechanism that decays with aging. Cell 2013, 153(7):1448-1460. [CrossRef]
- Bellet MM, Sassone-Corsi P: Mammalian circadian clock and metabolism - the epigenetic link. J Cell Sci 2010, 123(Pt 22):3837-3848. [CrossRef]
- Mayer G, Kroger, M., and Meier-Ewert, K: Effects of Vitamin B12 on Performance and Circadian Rhythm in Normal Subjects. Neuropsychopharmacology 1996, 15 (5). [CrossRef]
|
Disclaimer/Publisher’s Note: The statements, opinions and data contained in all publications are solely those of the individual author(s) and contributor(s) and not of MDPI and/or the editor(s). MDPI and/or the editor(s) disclaim responsibility for any injury to people or property resulting from any ideas, methods, instructions or products referred to in the content. |
© 2025 by the authors. Licensee MDPI, Basel, Switzerland. This article is an open access article distributed under the terms and conditions of the Creative Commons Attribution (CC BY) license (http://creativecommons.org/licenses/by/4.0/).