Submitted:
11 October 2025
Posted:
14 October 2025
You are already at the latest version
Abstract
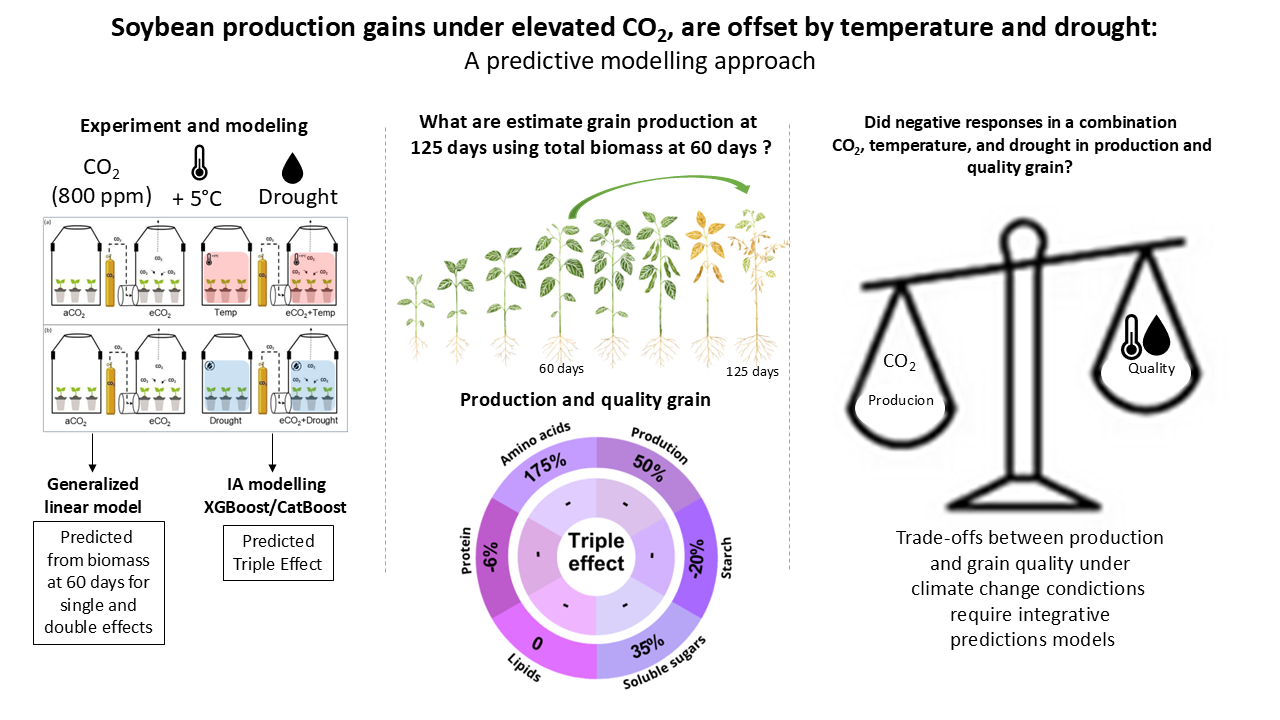
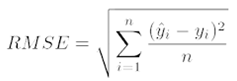
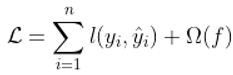
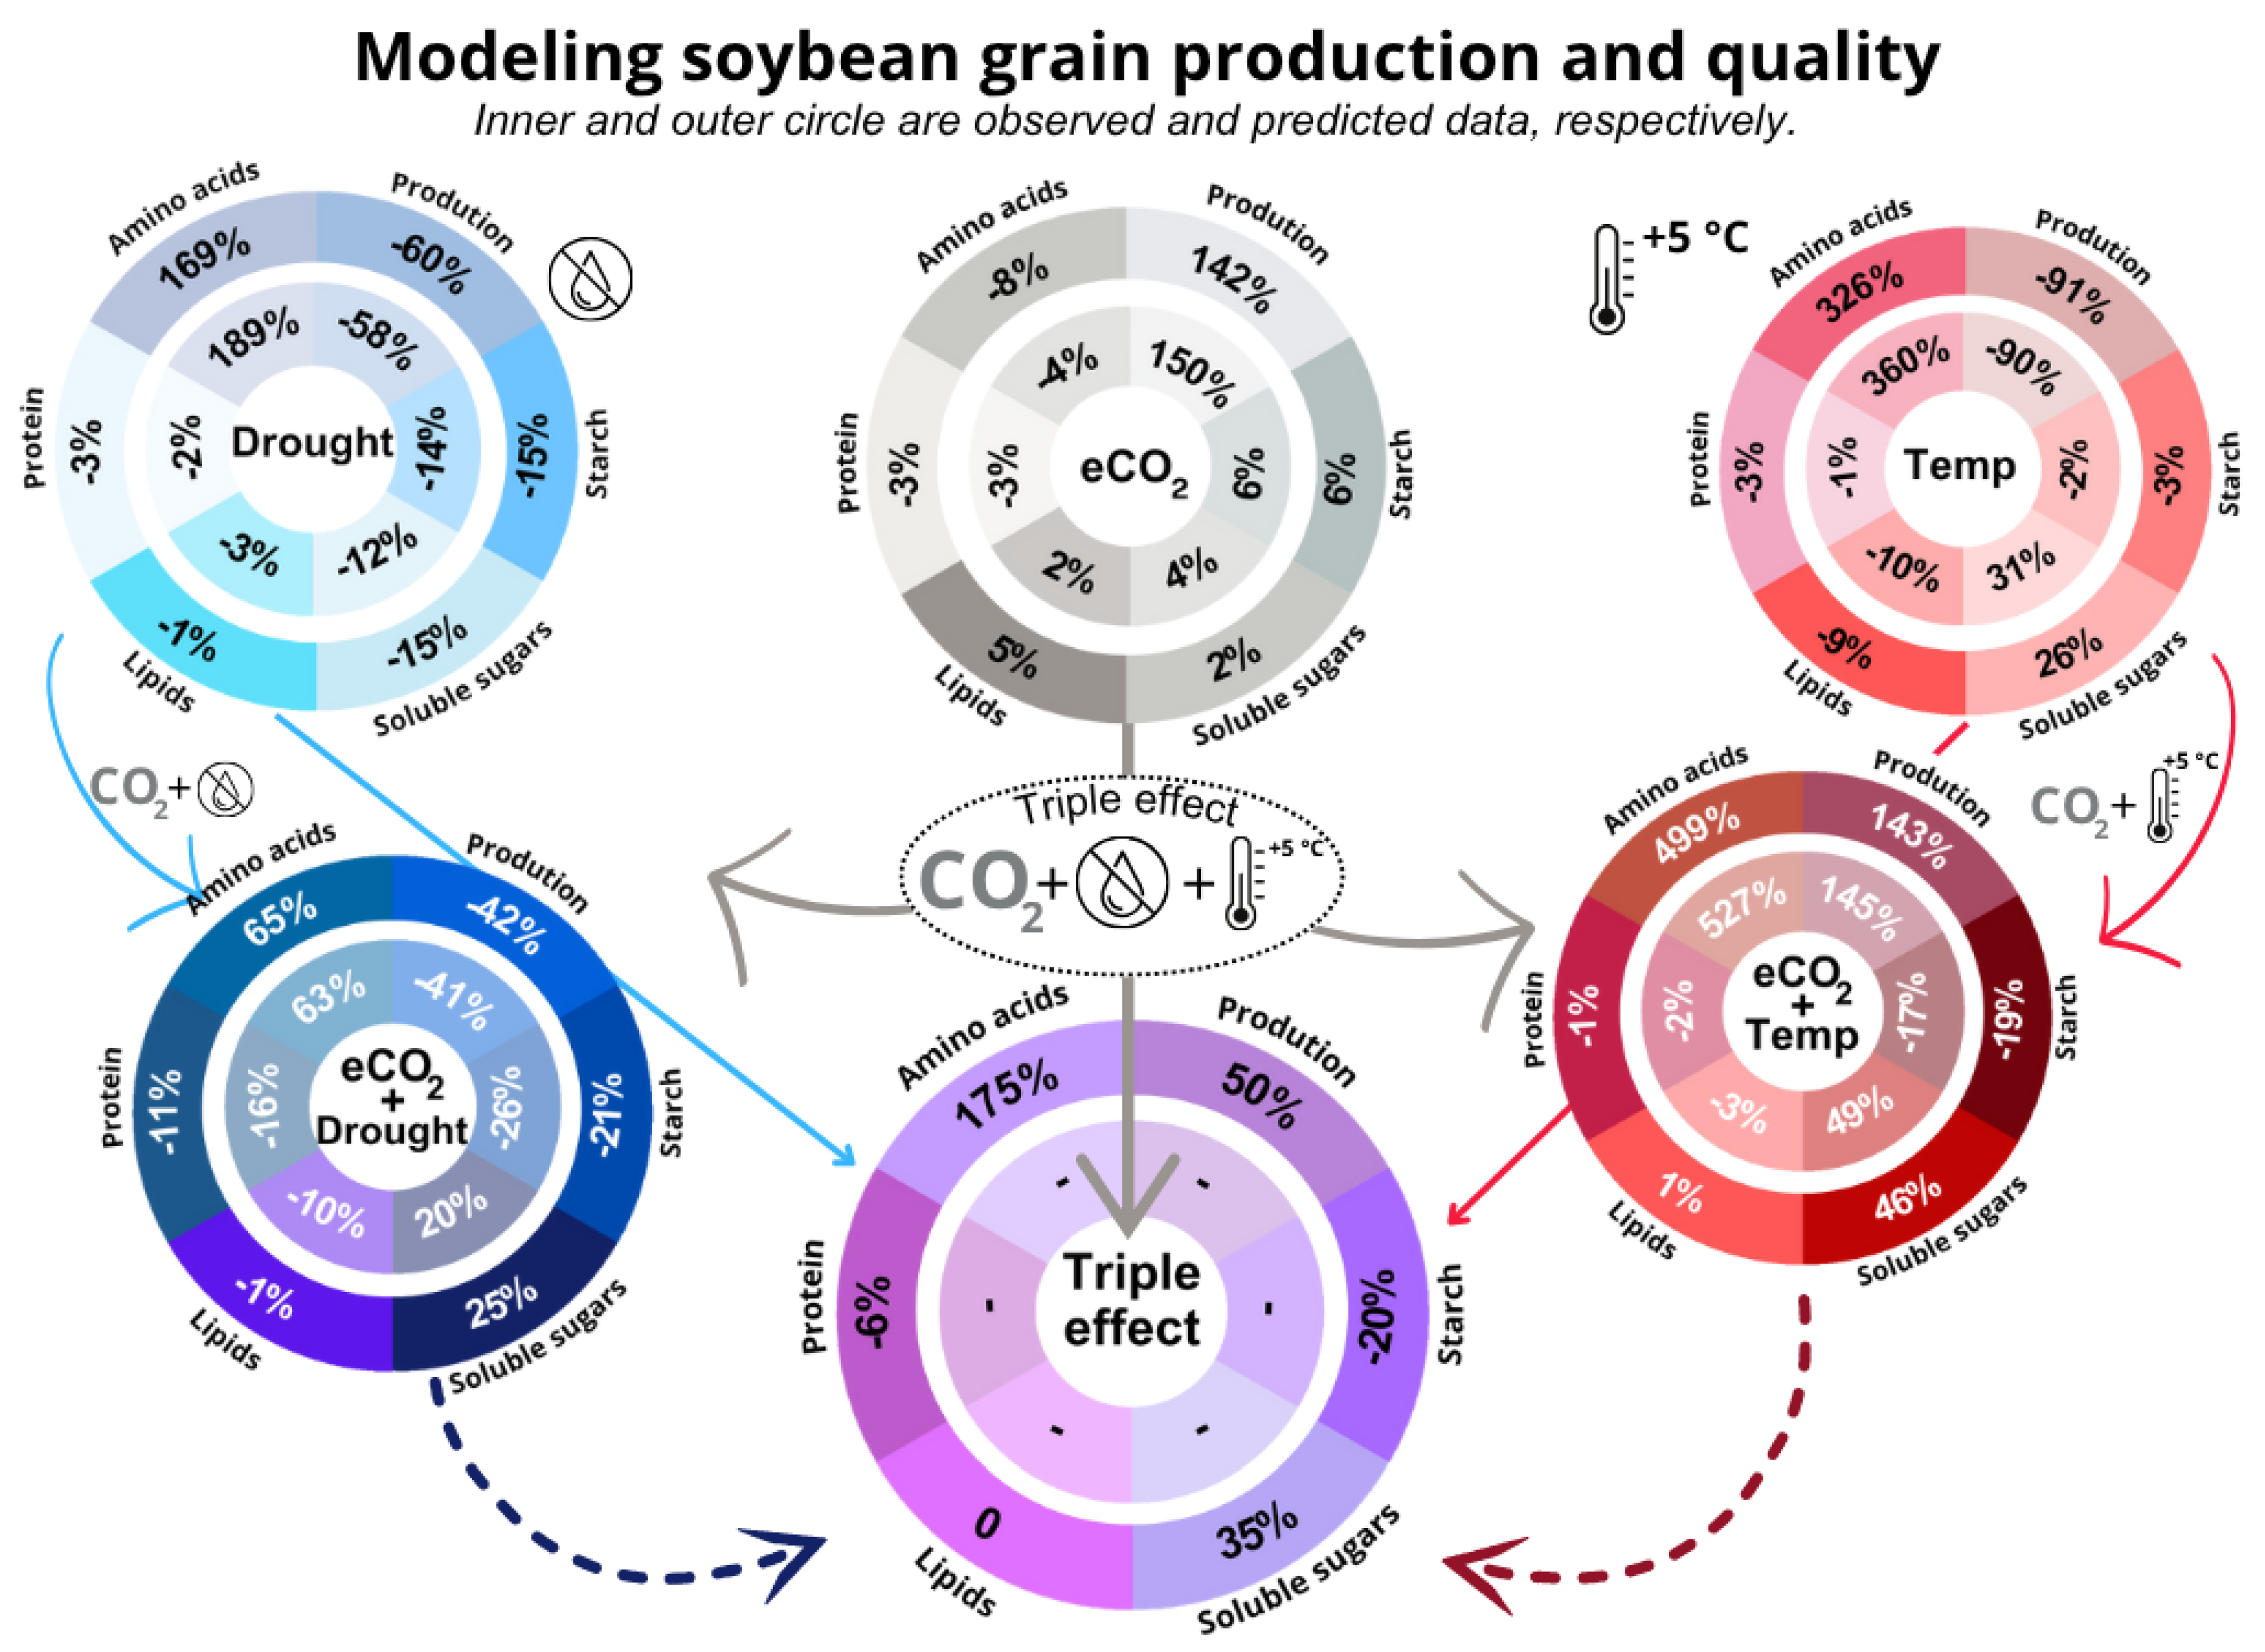
Soybean (Glycine max) is a major crop for food, feed, and bioenergy, yet its productivity and nutritional quality are threatened by climate change factors such as elevated CO₂ (eCO₂), high temperature, and drought. Here, we integrate experimental data with predictive modeling to evaluate the individual and combined impacts of these stressors—the “Triple Effect”—on soybean yield and seed composition. Generalized linear models (GLMs) were used to estimate grain production and quality traits from biomass at 60 days, while machine learning models (XGBoost, CatBoost) predicted responses under multifactorial stress. Model accuracy was assessed using root mean square error (RMSE). eCO₂ increased grain production by 142%, whereas high temperature reduced yield by 91%. In combination, eCO₂ and high temperature enhanced yield by 143%, but drought mitigated these benefits, leading to a 60% reduction. Triple Effect predictions revealed increases in grain production (50%), soluble sugars (35%), and amino acids (175%), accompanied by decreases in starch (20%) and protein (6%). These shifts indicate a metabolic reallocation that boosts productivity at the expense of nutritional quality. Our findings highlight the need for breeding climate-resilient soybean cultivars that balance yield and quality under multifactorial stress.
Keywords:
1. Introduction
2. Materials and Methods
2.1. Plant Materials and Experimental Design
2.2. Non-Structural Carbohydrates in Grain
2.3. Lipids and Fatty Acids in Grain
2.4. Carbon, Nitrogen, C/N Ratio, and Total Proteins in Grain
2.5. Experimental Data Analysis
2.6. Experimental Data Used in Models and Data Pre-Processing
2.7. Generalized Linear Model (GLM)
2.8. Machine Learning Modeling with XGBoost and CatBoost
3. Results
3.1. Microclimatic Data
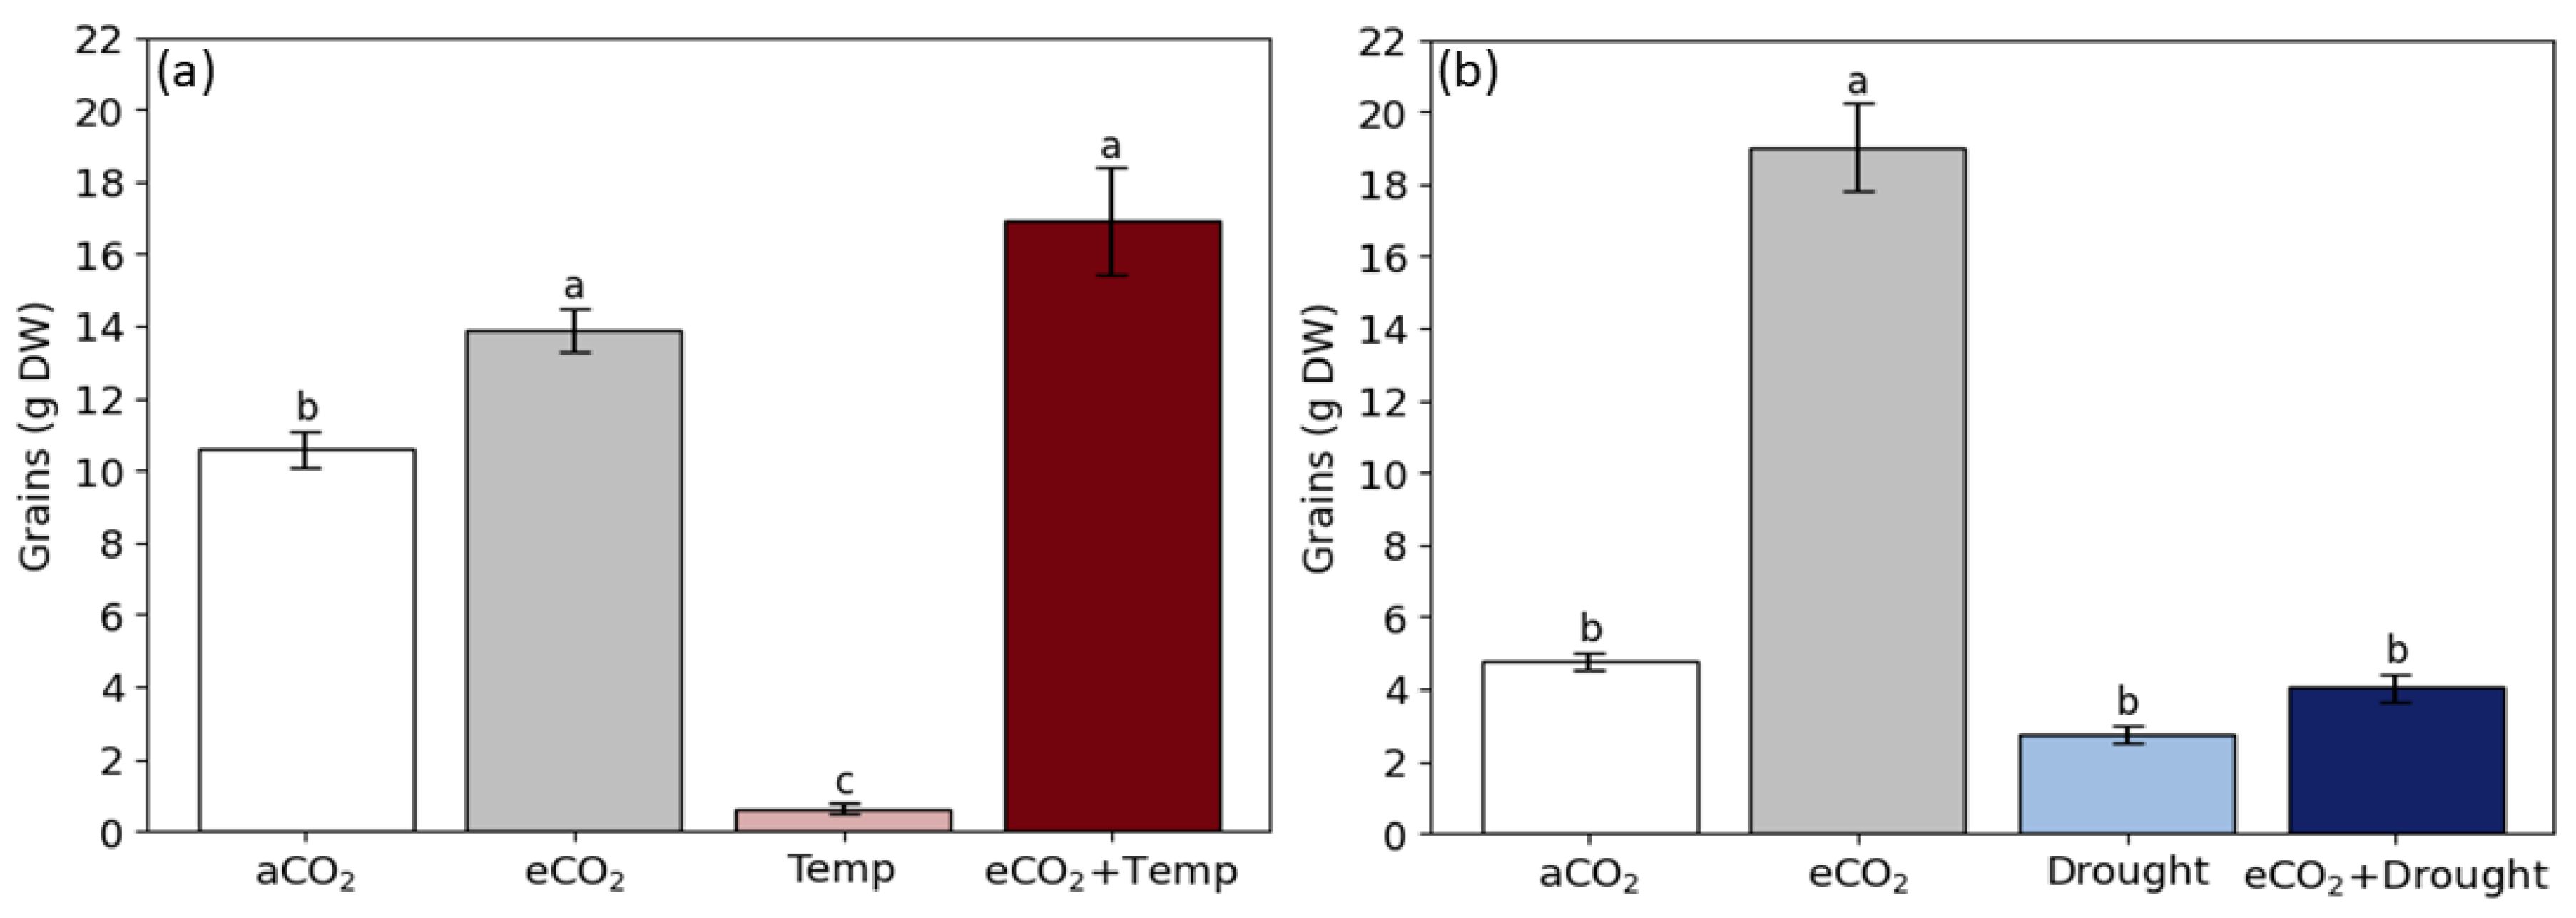
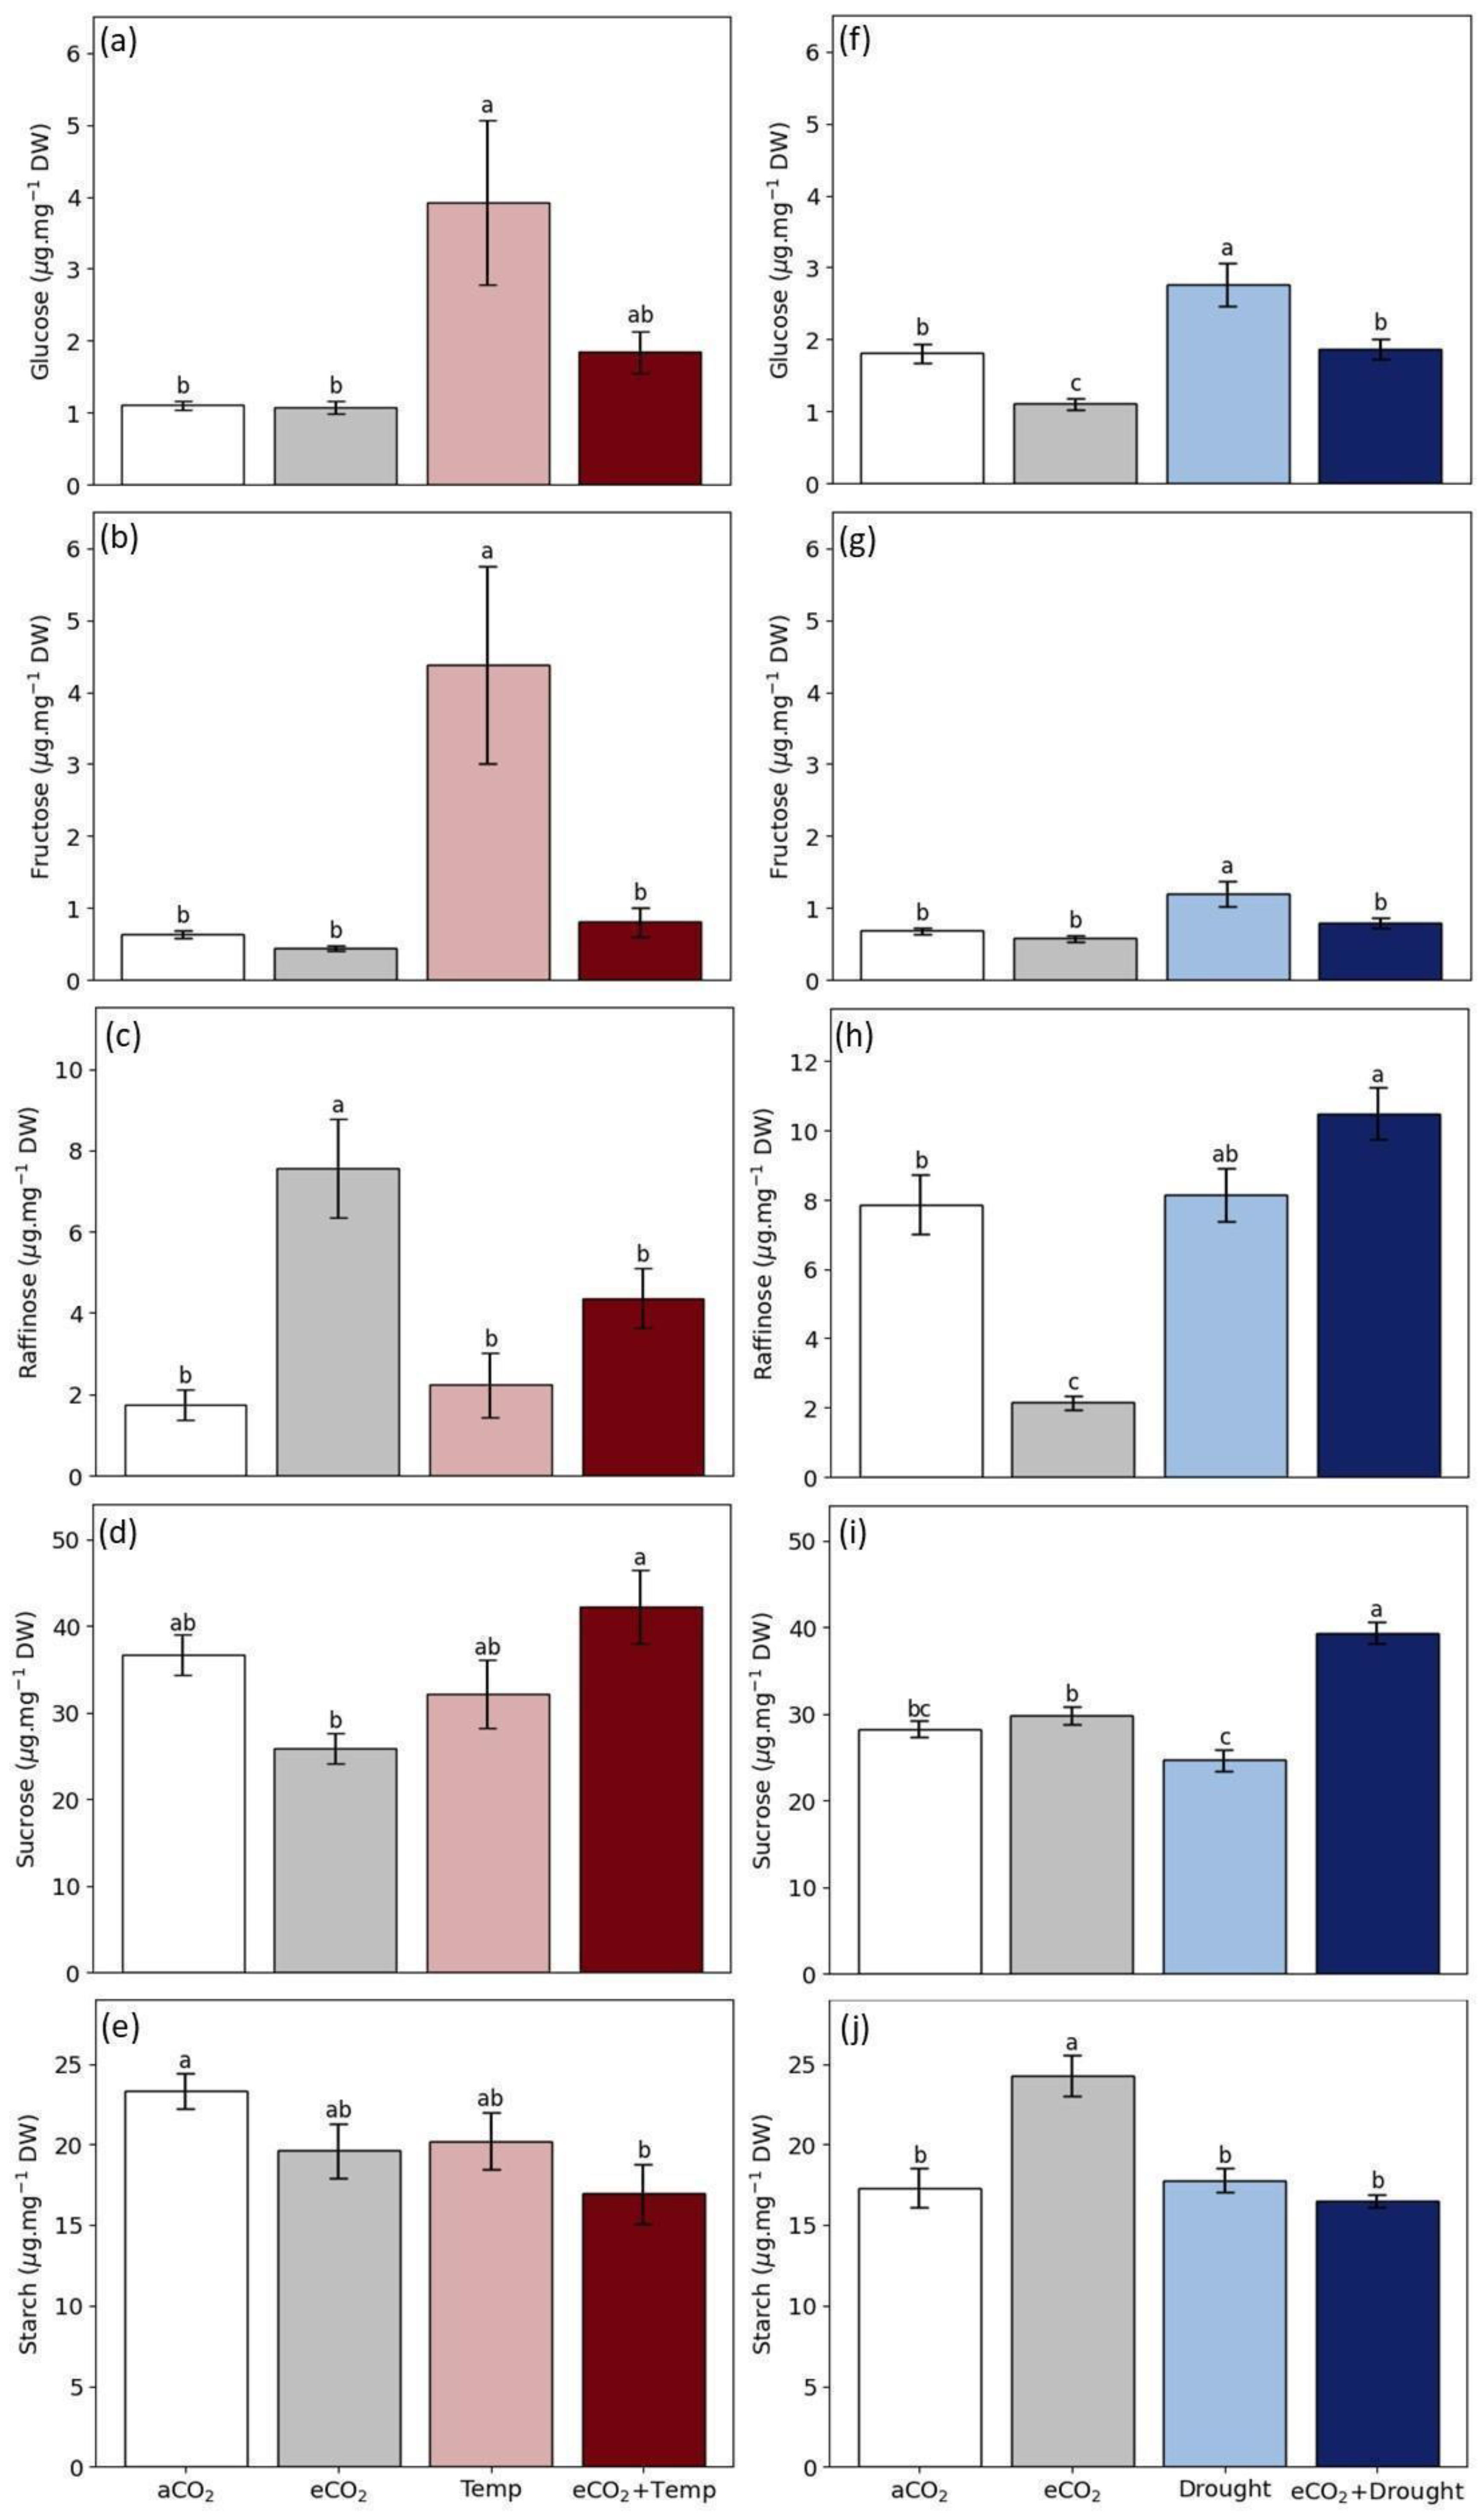
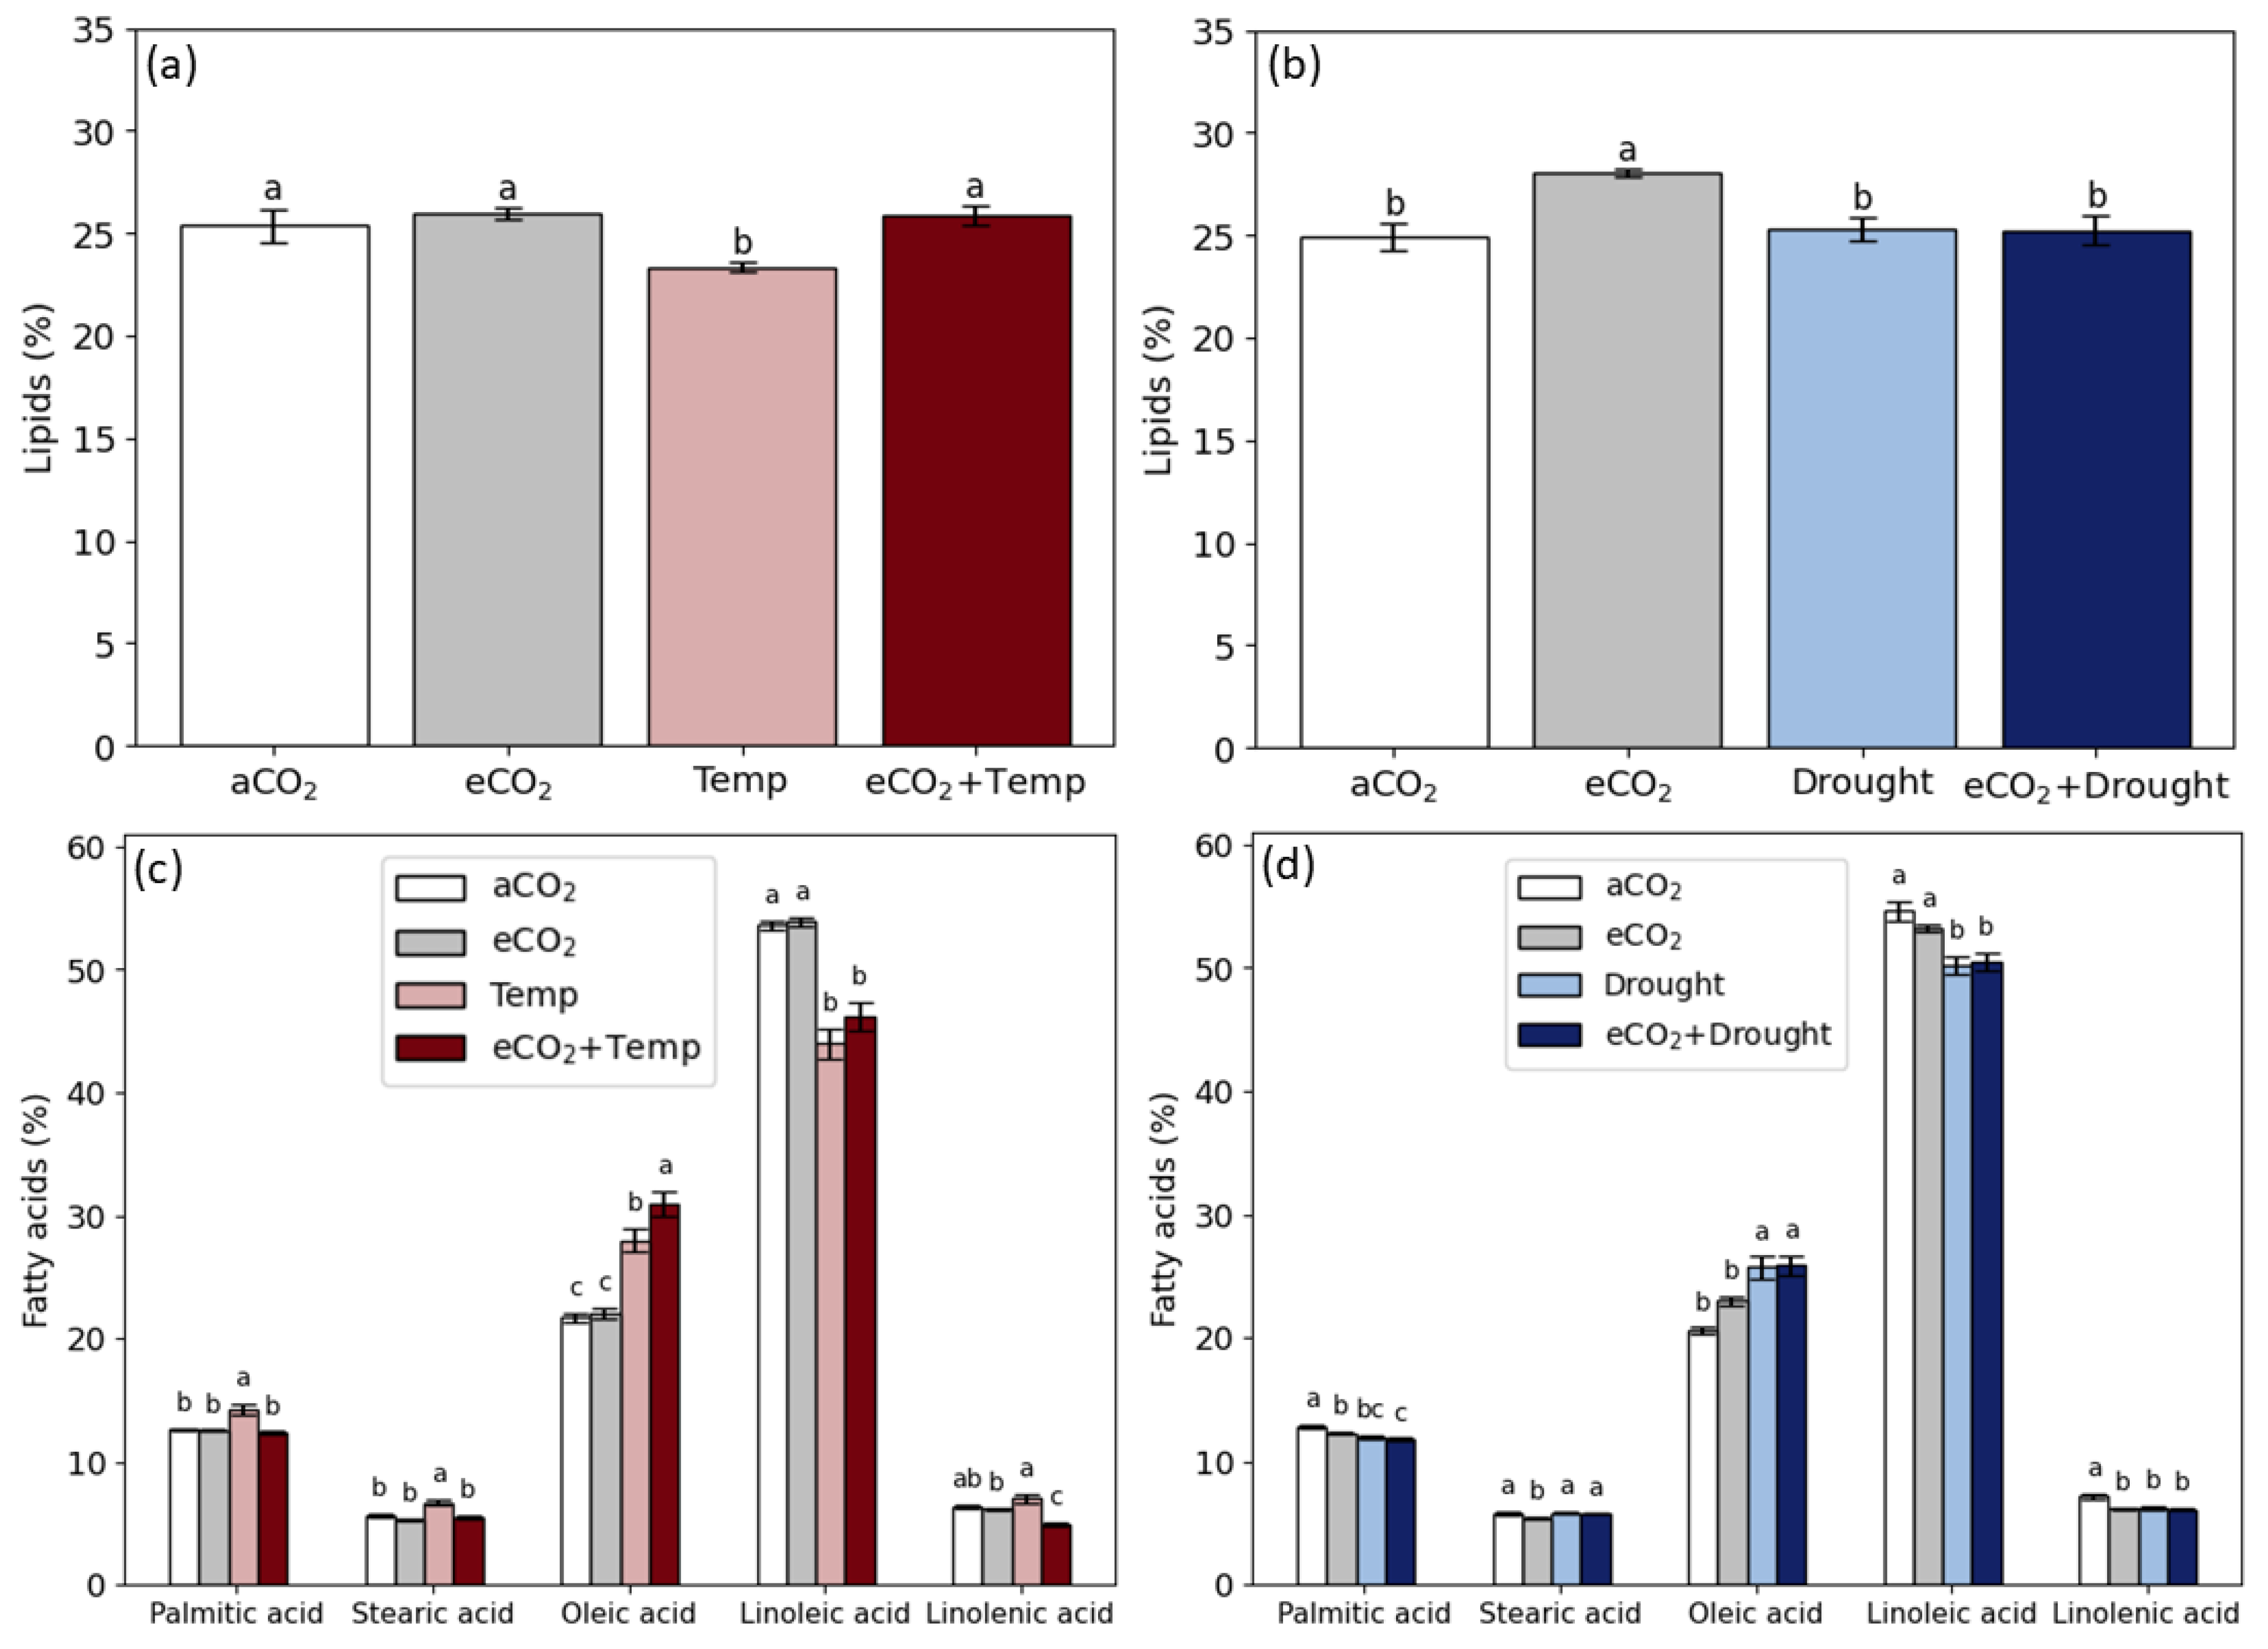
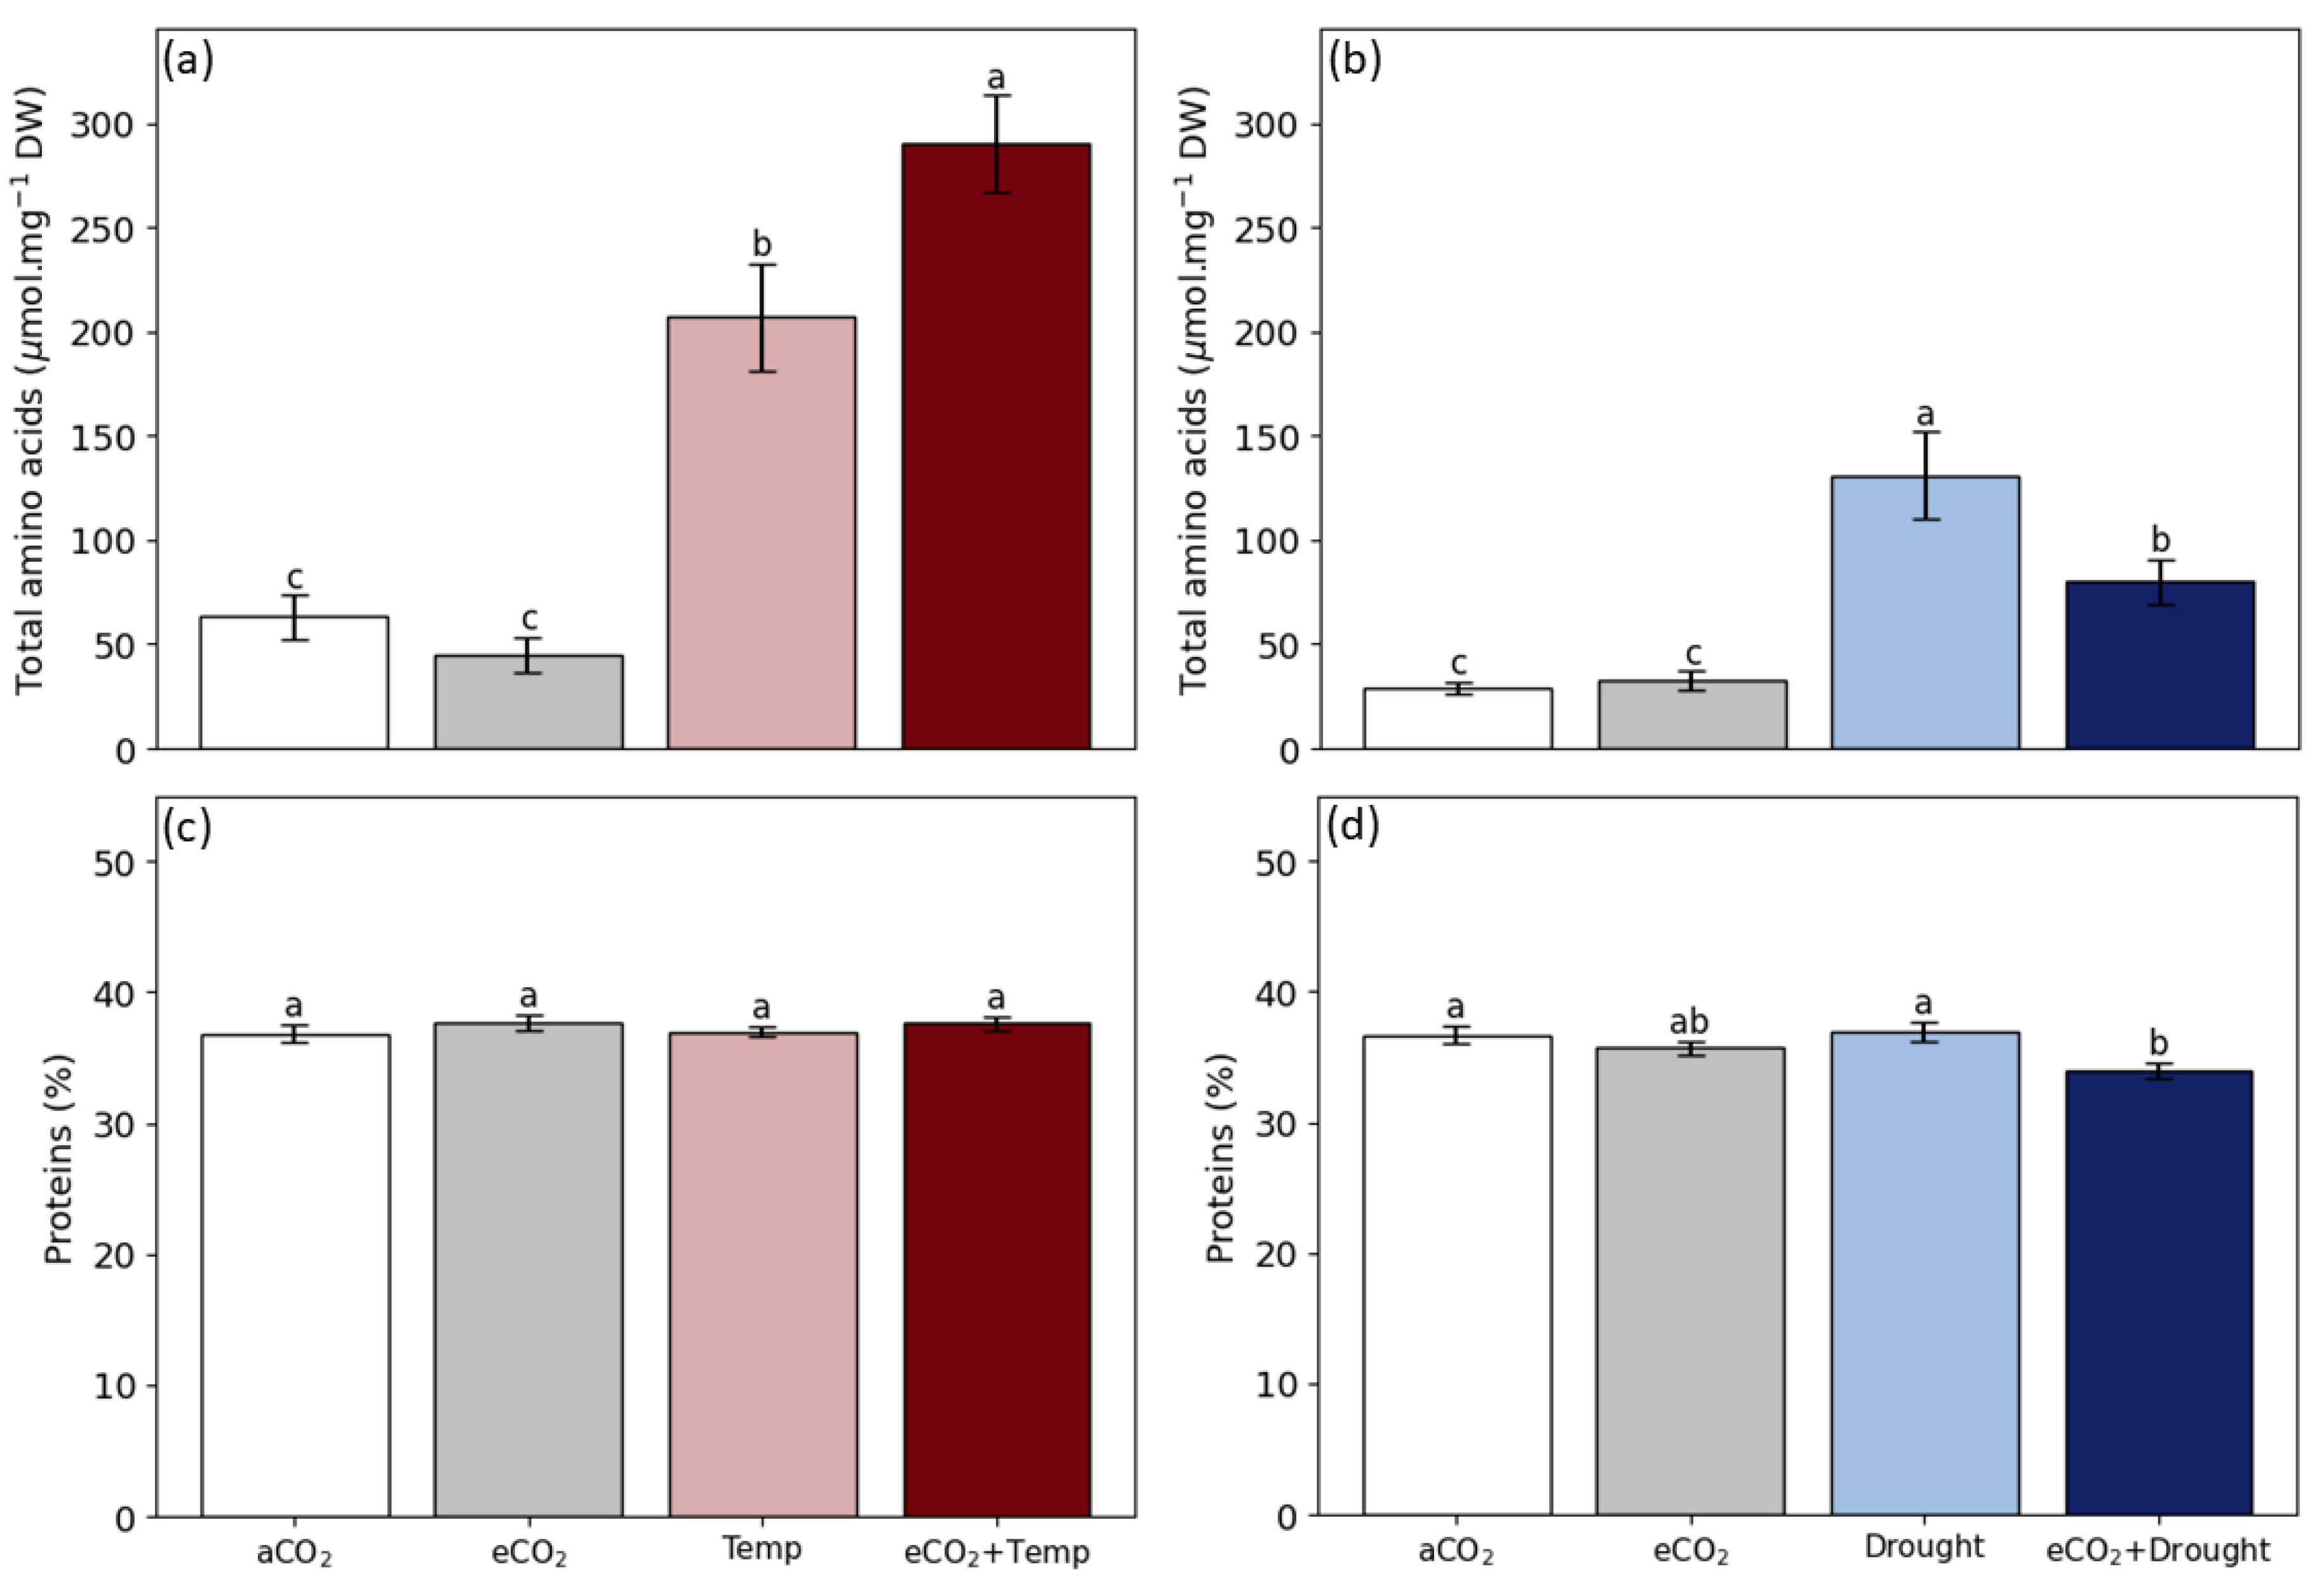
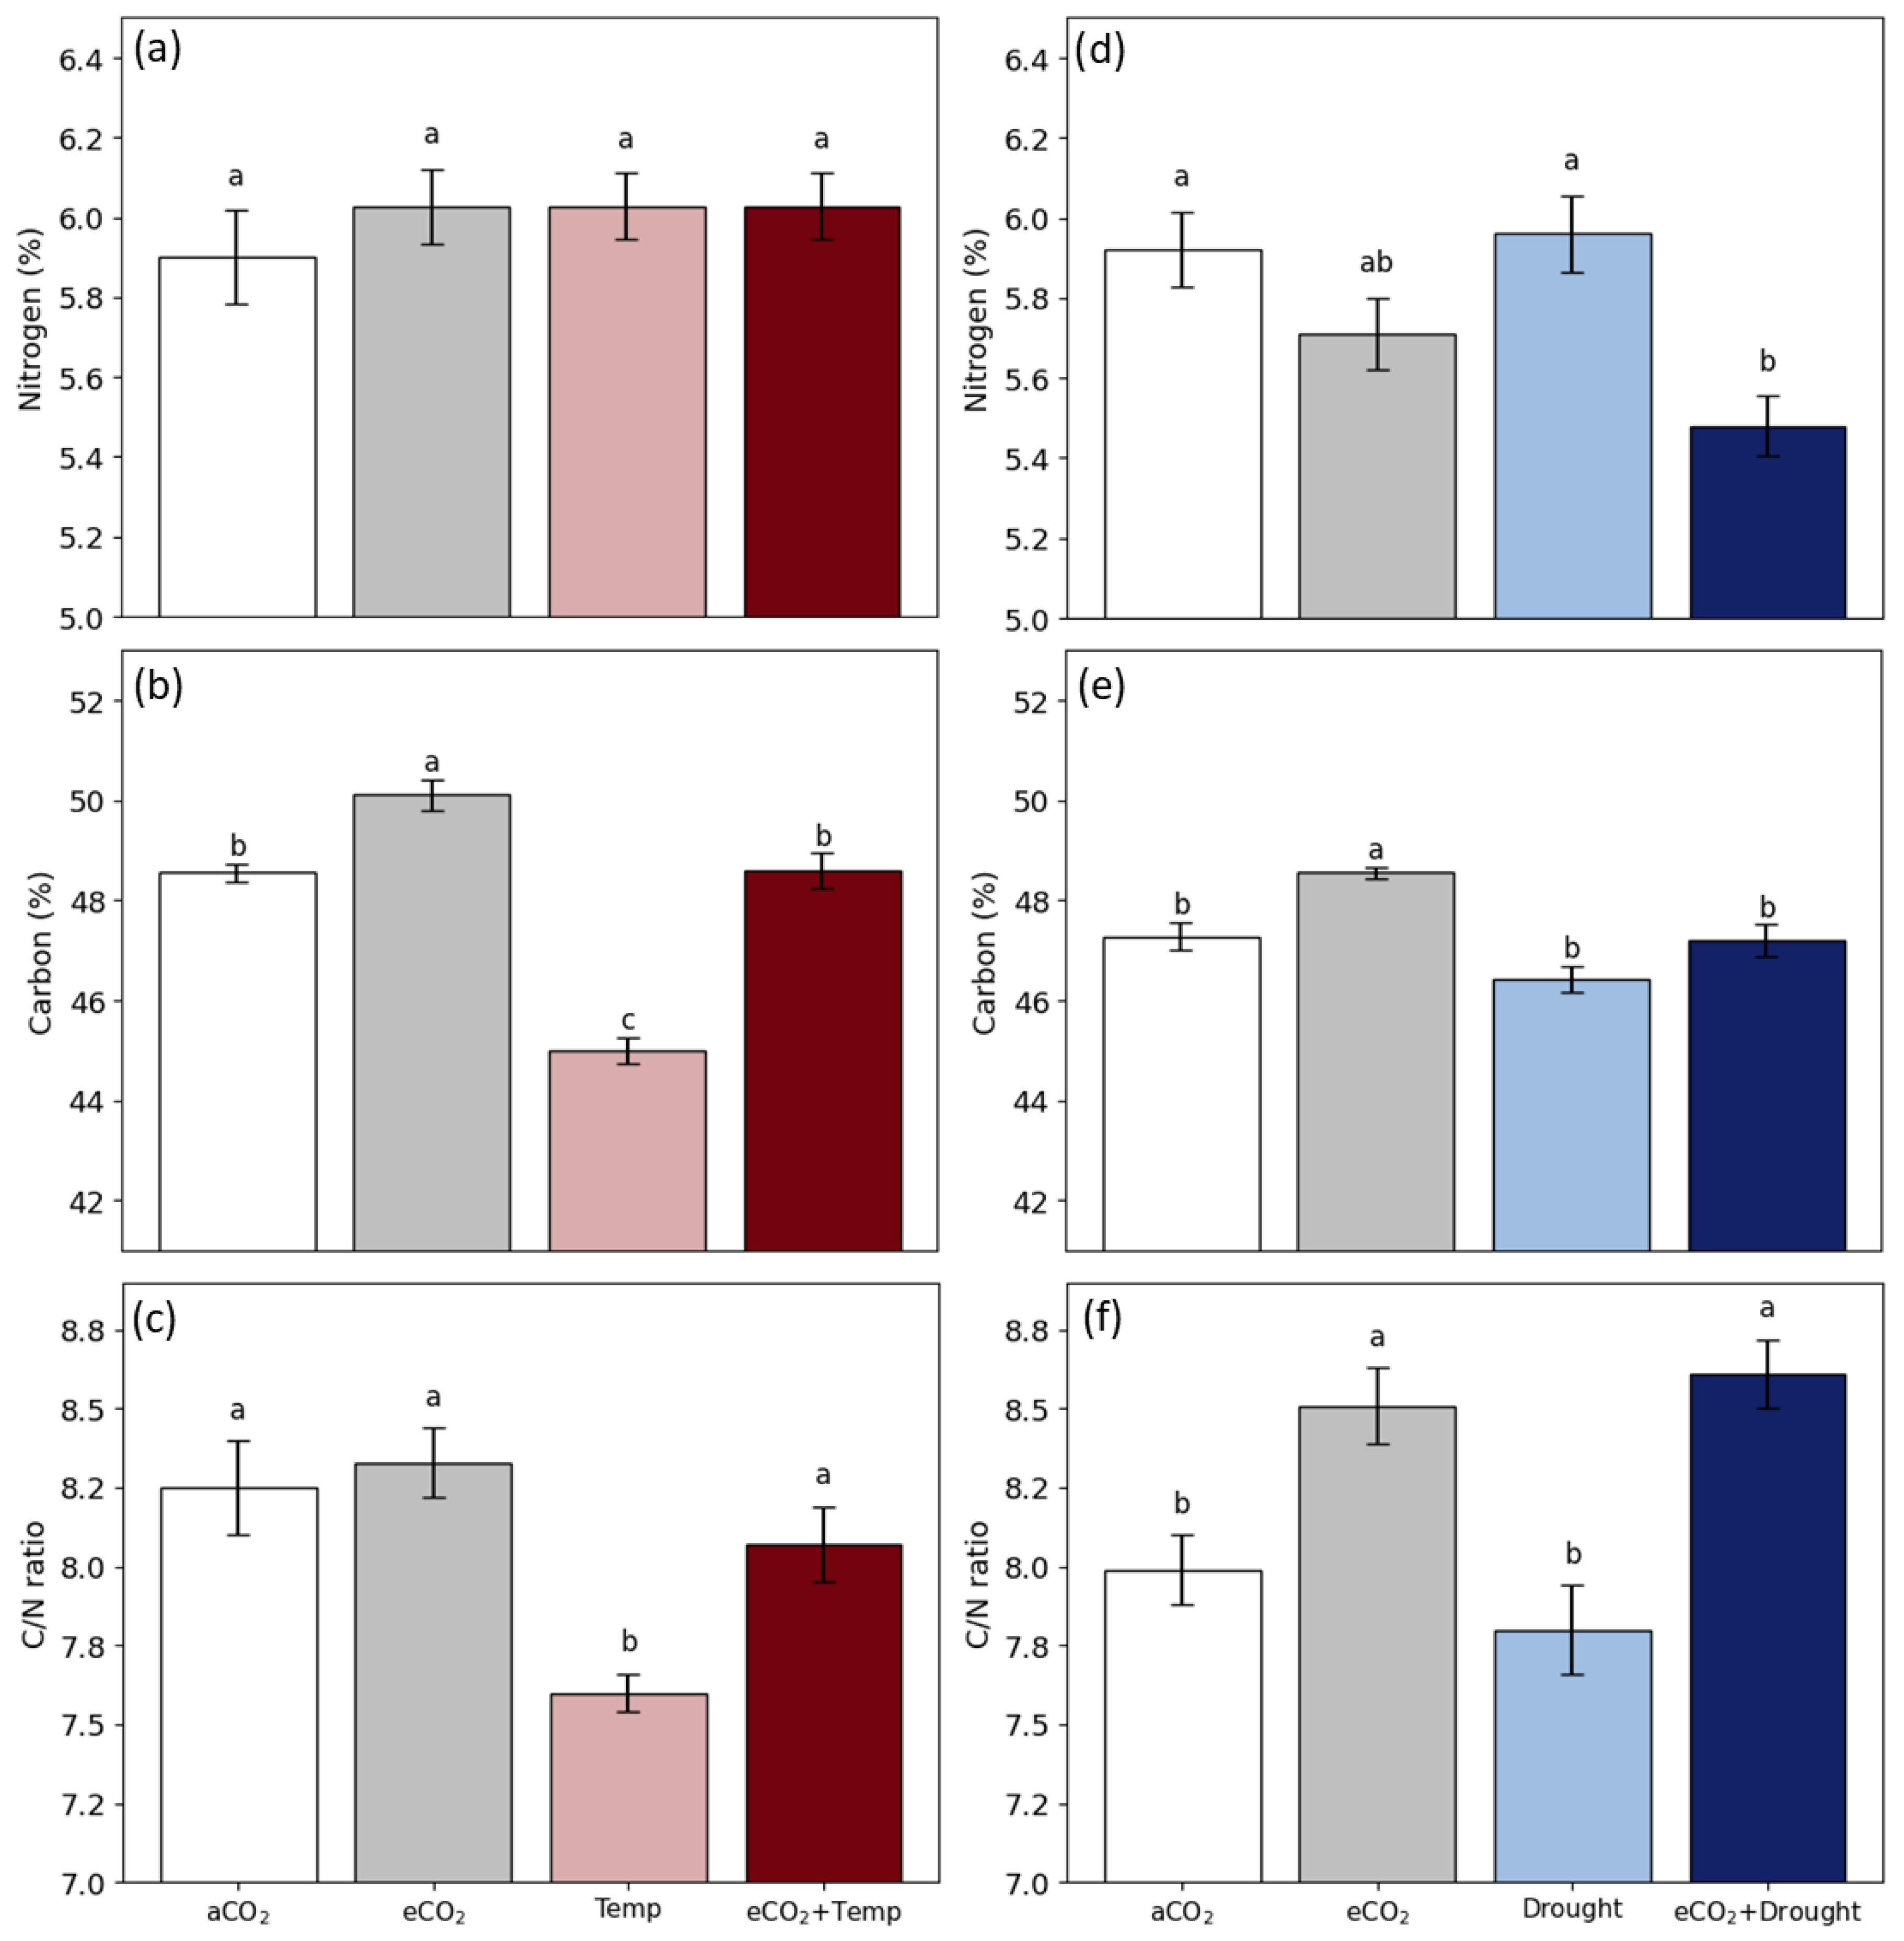
3.2. Soybean Grain Production and Quality in Isolated and Combined Factors: Elevated CO2, Temperature, and Drought
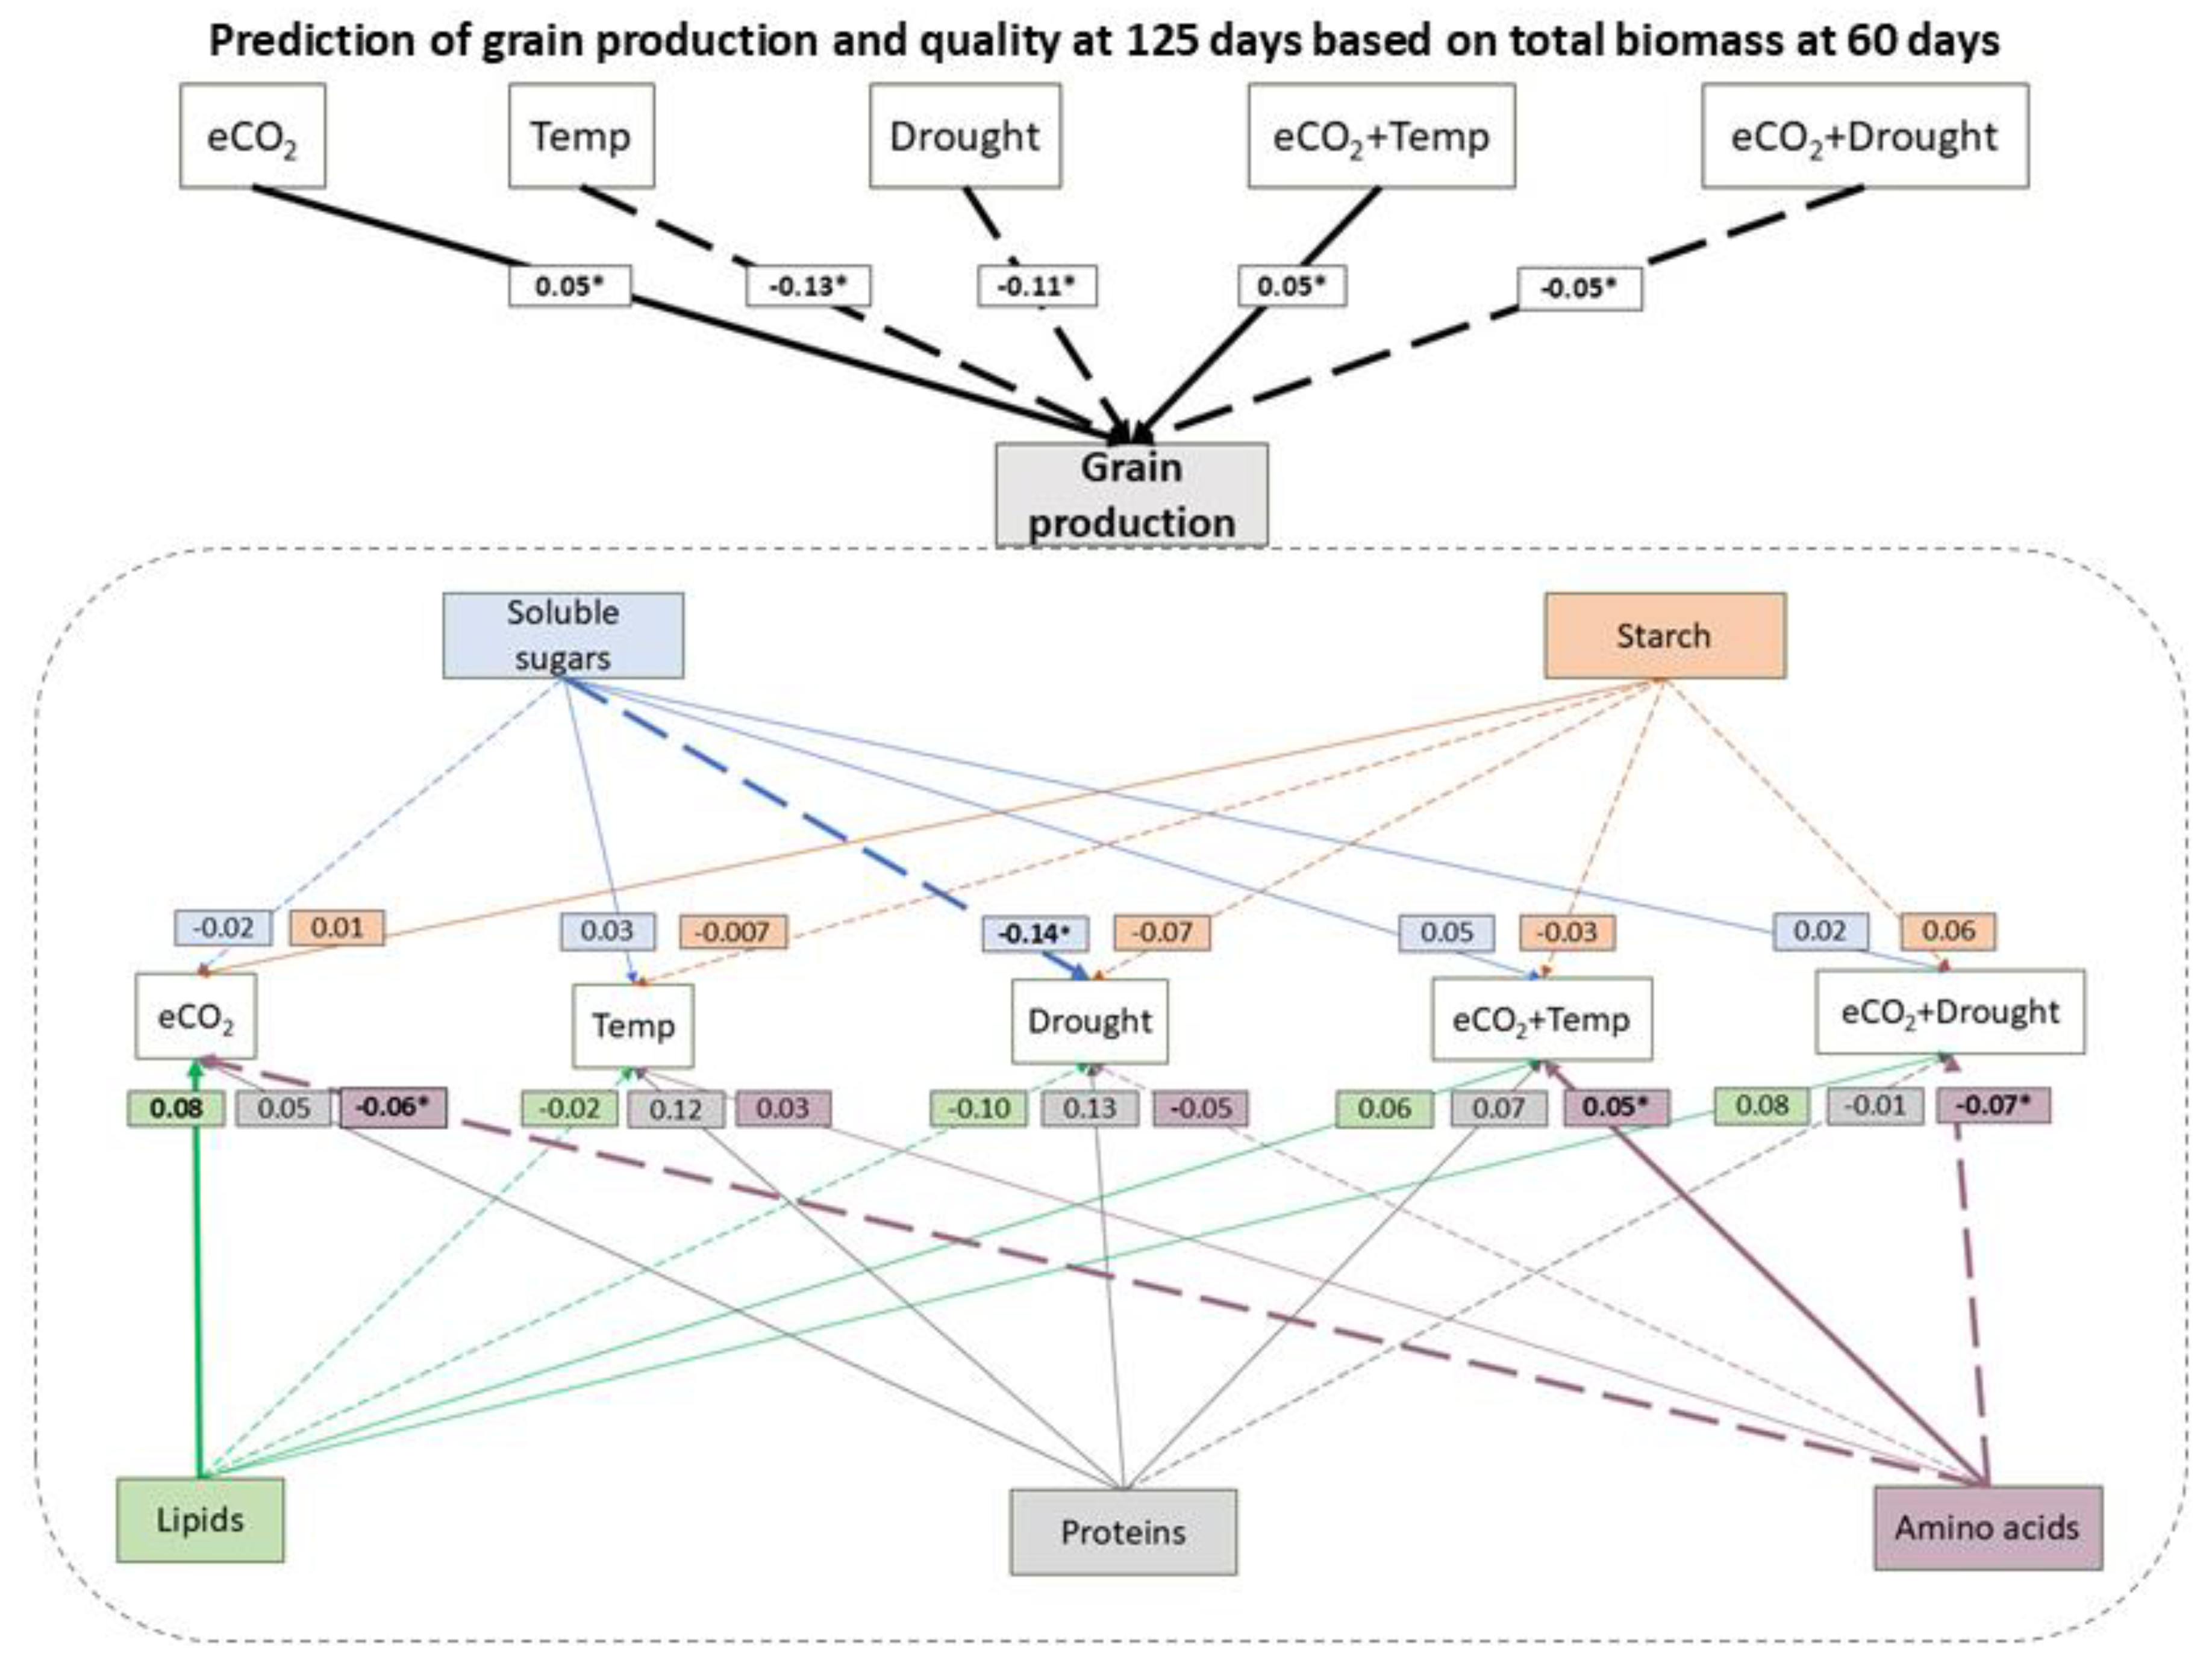
3.3. Modeling Using Experimental Data at 60 Days to Predict Grain Production and Quality at 125 Days
3.4. Machine Learning to Predict Grain Production in Climate Change Triple Effect
4. Discussion
4.1. Anticipating Crop Responses Under Climate Change
4.2. Validation Model with Out-of-Data Experiment
4.3. Elevated CO2 Promotes the Benefits of Grain Production and Changes Grain Quality
4.4. Temperature and Drought Reduce Grain Production
4.5. Temperature Coupled to Elevated CO2, Promotes Grain Biomass
4.6. Triple Effect May Increase Grain Production, but Decrease Quality
5. Conclusions
Supplementary Materials
Author Contributions
Funding
Institutional Review Board Statement
Informed Consent Statement
Data Availability Statement
Acknowledgments
Conflicts of Interest
References
- Ainsworth, E. A. , & Lemonnier, P. (2018). Phloem function: A key to understanding and manipulating plant responses to rising atmospheric [CO2]? Current Opinion in Plant Biology, 43, 50–56. [CrossRef]
- Ainsworth, E. A. , & Long, S. P. (2021). 30 years of free-air carbon dioxide enrichment (FACE): What have we learned about future crop productivity and its potential for adaptation? Global Change Biology, 27(1), 27–49.
- Altman, E. I. (1983). Why businesses fail. Journal of Business Strategy, 3(4), 15–21.
- Amaral, L. I. V. do, Gaspar, M., Costa, P. M. F., Aidar, M. P. M., & Buckeridge, M. S. (2007). Novo método enzimático rápido e sensível de extração e dosagem de amido em materiais vegetais. Hoehnea, 34, 425–431.
- ANEC. (2022). Associação Nacional dos Exportadores de Cereais. In Https://anec.com.br/.
- Arenque, B. C., Grandis, A., Pocius, O., de Souza, A. P., & Buckeridge, M. S. (2014). Responses of Senna reticulata, a legume tree from the Amazonian floodplains, to elevated atmospheric CO 2 concentration and waterlogging. Trees, 28, 1021–1034.
- Assad, E. D. , Oliveira, A. F. de, Nakai, A. M., Pavão, E., Pellegrino, G. Q., & Monteiro, J. (2016). Impactos e vulnerabilidades da agricultura brasileira às mudanças climáticas. In Modelagem Climática e Vulnerabilidades Setoriais à Mudança do Clima no Brasil (pp. 127–188). Ministério da Ciência, Tecnologia e Inovação.
- Banga, S. S. , & Kang, M. S. (2014). Developing climate-resilient crops. Journal of Crop Improvement, 28(1), 57–87.
- Beck, J. (2013). Predicting climate change effects on agriculture from ecological niche modeling: Who profits, who loses? Climatic Change, 116(2), 177–189.
- Beniston, M. , Stephenson, D. B., Christensen, O. B., Ferro, C. A. T., Frei, C., Goyette, S., Halsnaes, K., Holt, T., Jylhä, K., Koffi, B., Palutikof, J., Schöll, R., Semmler, T., & Woth, K. (2007). Future extreme events in European climate: An exploration of regional climate model projections. Climatic Change, 81(S1), 71–95. [CrossRef]
- Bhat, S. A. , Qadri, S. A. A., Dubbey, V., Sofi, I. B., & Huang, N.-F. (2024). Impact of crop management practices on maize yield: Insights from farming in tropical regions and predictive modeling using machine learning. Journal of Agriculture and Food Research, 18, 101392.
- Boote, K. , Pickering, N., & Allen Jr, L. (1997). Plant modeling: Advances and gaps in our capability to predict future crop growth and yield in response to global climate change. Advances in Carbon Dioxide Effects Research, 179–228.
- Bui, Q.-T., Pham, Q.-T., Pham, V.-M., Tran, V.-T., Nguyen, D.-H., Nguyen, Q.-H., Nguyen, H.-D., Do, N. T., & Vu, V.-M. (2024). Hybrid machine learning models for aboveground biomass estimations. Ecological Informatics, 79, 102421.
- Cai, Y. , Chen, L., Zhang, Y., Yuan, S., Su, Q., Sun, S., Wu, C., Yao, W., Han, T., & Hou, W. (2020). Target base editing in soybean using a modified CRISPR/Cas9 system. Plant Biotechnology Journal, 18(10), 1996.
- Chen, T. , & Guestrin, C. (2016). Xgboost: A scalable tree boosting system. Proceedings of the 22nd Acm Sigkdd International Conference on Knowledge Discovery and Data Mining, 785–794.
- Chenu, K., Porter, J. R., Martre, P., Basso, B., Chapman, S. C., Ewert, F., Bindi, M., & Asseng, S. (2017). Contribution of crop models to adaptation in wheat. Trends in Plant Science, 22(6), 472–490.
- Christie, W. W., & Hutton, J. (1993). Preparation of ester derivatives of fatty acids for chromatographic analysis. Advances in Lipid Methodology, 2(69), e111.
- CONAB. (2021). Companhia Nacional de Abastecimento.
- DaMatta, F. M., Grandis, A., Arenque, B. C., & Buckeridge, M. S. (2010). Impacts of climate changes on crop physiology and food quality. Food Research International, 43(7), 1814–1823.
- De Winter, J. C. , Gosling, S. D., & Potter, J. (2016). Comparing the Pearson and Spearman correlation coefficients across distributions and sample sizes: A tutorial using simulations and empirical data. Psychological Methods, 21(3), 273.
- Digrado, A., Montes, C. M., Baxter, I., & Ainsworth, E. A. (2024). Seed quality under elevated CO2 differs in soybean cultivars with contrasting yield responses. Global Change Biology, 30(2), e17170.
- FAO. (2023). Food and Agriculture Organization of the United Nations Crops. In Http://www.fao.org/faostat/en/#data/QC/visualize.
- Ferris, R., Wheeler, T., Ellis, R., & Hadley, P. (1999). Seed yield after environmental stress in soybean grown under elevated CO2. Crop Science, 39(3), 710–718.
- Fortirer, J. da S., Grandis, A., Pagliuso, D., Castanho, C. de T., & Buckeridge, M. S. (2023). Meta-analysis of the responses of tree and herb to elevated CO2 in Brazil. Scientific Reports, 13(1). [CrossRef]
- Fu, Z. , Niu, S., & Dukes, J. S. (2015). What have we learned from global change manipulative experiments in China? A meta-analysis. Scientific Reports, 5(19), 1–11. [CrossRef]
- Gourdji, S. M. , Sibley, A. M., & Lobell, D. B. (2013). Global crop exposure to critical high temperatures in the reproductive period: Historical trends and future projections. Environmental Research Letters, 8(2), 024041. [CrossRef]
- Gray, S. B., Dermody, O., Klein, S. P., Locke, A. M., Mcgrath, J. M., Paul, R. E., Rosenthal, D. M., Ruiz-Vera, U. M., Siebers, M. H., Strellner, R., & others. (2016). Intensifying drought eliminates the expected benefits of elevated carbon dioxide for soybean. Nature Plants, 2(9), 1–8.
- Habermann, E. , Dias de Oliveira, E. A., Contin, D. R., San Martin, J. A., Curtarelli, L., Gonzalez-Meler, M. A., & Martinez, C. A. (2019). Stomatal development and conductance of a tropical forage legume are regulated by elevated [CO2] under moderate warming. Frontiers in Plant Science, 10, 609.
- Hallgren, K. A. , McCabe, C. J., King, K. M., & Atkins, D. C. (2019). Beyond path diagrams: Enhancing applied structural equation modeling research through data visualization. Addictive Behaviors, 94, 74–82.
- Hancock, J. , & Khoshgoftaar, T. (2020). CatBoost for big data: An interdisciplinary review. J Big Data 7 (1): 94.
- Haworth, M. , Marino, G., Loreto, F., & Centritto, M. (2021). Integrating stomatal physiology and morphology: Evolution of stomatal control and development of future crops. Oecologia, 197(4), 867–883.
- Heinemann, B. , & Hildebrandt, T. M. (2021). The role of amino acid metabolism in signaling and metabolic adaptation to stress-induced energy deficiency in plants. Journal of Experimental Botany, 72(13), 4634–4645.
- Hoagland, K. D. , Rosowski, J. R., Gretz, M. R., & Roemer, S. C. (1993). Diatom extracellular polymeric substances: Function, fine structure, chemistry, and physiology. Journal of Phycology, 29(5), 537–566.
- Huber, F., Yushchenko, A., Stratmann, B., & Steinhage, V. (2022). Extreme Gradient Boosting for yield estimation compared with Deep Learning approaches. Computers and Electronics in Agriculture, 202, 107346.
- Jardim Amorim, D. , Pereira dos Santos, A. R., Nunes da Piedade, G., Quelvia de Faria, R., Amaral da Silva, E. A., & Pereira Sartori, M. M. (2021). The use of the generalized linear model to assess the speed and uniformity of germination of corn and soybean seeds. Agronomy, 11(3), 588.
- Jin, Z., Ainsworth, E. A., Leakey, A. D., & Lobell, D. B. (2018). Increasing drought and diminishing benefits of elevated carbon dioxide for soybean yields across the US Midwest. Global Change Biology, 24(2), e522–e533.
- Jin, Z. , Zhuang, Q., Wang, J., Archontoulis, S. V., Zobel, Z., & Kotamarthi, V. R. (2017). The combined and separate impacts of climate extremes on the current and future US rainfed maize and soybean production under elevated CO2. Global Change Biology, 23(7), 2687–2704. [CrossRef]
- Khan, M. H. U. , Wang, S., Wang, J., Ahmar, S., Saeed, S., Khan, S. U., Xu, X., Chen, H., Bhat, J. A., & Feng, X. (2022). Applications of artificial intelligence in climate-resilient smart-crop breeding. International Journal of Molecular Sciences, 23(19), 11156.
- Kohavi, R. & others. (1995). A study of cross-validation and bootstrap for accuracy estimation and model selection. Ijcai, 14(2), 1137–1145.
- Li, D., Liu, H., Qiao, Y., Wang, Y., Cai, Z., Dong, B., Shi, C., Liu, Y., Li, X., & Liu, M. (2013). Effects of elevated CO2 on the growth, seed yield, and water use efficiency of soybean (Glycine max (L.) Merr.) under drought stress. Agricultural Water Management, 129, 105–112.
- Li, Y. , Zeng, H., Zhang, M., Wu, B., Zhao, Y., Yao, X., Cheng, T., Qin, X., & Wu, F. (2023). A county-level soybean yield prediction framework coupled with XGBoost and multidimensional feature engineering. International Journal of Applied Earth Observation and Geoinformation, 118, 103269.
- Loague, K. , & Green, R. E. (1991). Statistical and graphical methods for evaluating solute transport models: Overview and application. Journal of Contaminant Hydrology, 7(1–2), 51–73.
- Long, S. P. (2025). Needs and opportunities to future-proof crops and the use of crop systems to mitigate atmospheric change. Philosophical Transactions B, 380(1927), 20240229.
- Manavalan, L. P. , Guttikonda, S. K., Tran, L.-S. P., & Nguyen, H. T. (2009). Physiological and Molecular Approaches to Improve Drought Resistance in Soybean. Plant and Cell Physiology, 50(7), 1260–1276. [CrossRef]
- Marengo, J. A. , Torres, R. R., & Alves, L. M. (2017). Drought in Northeast Brazil—Past, present, and future. Theoretical and Applied Climatology, 129(3–4), 1189–1200. [CrossRef]
- Mariotti, F. , Tomé, D., & Mirand, P. P. (2008). Converting nitrogen into protein—Beyond 6.25 and Jones’ factors. Critical Reviews in Food Science and Nutrition, 48(2), 177–184.
- M’hamdi, O., Takács, S., Palotás, G., Ilahy, R., Helyes, L., & Pék, Z. (2024). A comparative analysis of XGBoost and neural network models for predicting some tomato fruit quality traits from environmental and meteorological data. Plants, 13(5), 746.
- Monteiro, L. A. , Ramos, R. M., Battisti, R., Soares, J. R., Oliveira, J. C., Figueiredo, G. K., Lamparelli, R. A., Nendel, C., & Lana, M. A. (2022). Potential use of data-driven models to estimate and predict soybean yields at national scale in Brazil. International Journal of Plant Production, 16(4), 691–703.
- Mourtzinis, S. , Specht, J. E., Lindsey, L. E., Wiebold, W. J., Ross, J., Nafziger, E. D., Kandel, H. J., Mueller, N., Devillez, P. L., Arriaga, F. J., & others. (2015). Climate-induced reduction in US-wide soybean yields underpinned by region-and in-season-specific responses. Nature Plants, 1(2), 1–4.
- Müller, F., & Rieu, I. (2016). Acclimation to high temperature during pollen development. Plant Reproduction, 29, 107–118.
- Nelder, J. A. , & Wedderburn, R. W. (1972). Generalized linear models. Journal of the Royal Statistical Society Series A: Statistics in Society, 135(3), 370–384.
- Nendel, C., Reckling, M., Debaeke, P., Schulz, S., Berg-Mohnicke, M., Constantin, J., Fronzek, S., Hoffmann, M., Jakšić, S., Kersebaum, K.-C., & others. (2023). Future area expansion outweighs increasing drought risk for soybean in Europe. Global Change Biology, 29(5), 1340–1358.
- Nishat, M. H. , Khan, M. H. R. B., Ahmed, T., Hossain, S. N., Ahsan, A., El-Sergany, M., Shafiquzzaman, M., Imteaz, M. A., & Alresheedi, M. T. (2025). Comparative analysis of machine learning models for predicting water quality index in Dhaka’s rivers of Bangladesh. Environmental Sciences Europe, 37(1), 31.
- Onat, B. , Bakal, H., Gulluoglu, L., & Arıoglu, H. (2017). The effects of high temperature at the growing period on yield and yield components of soybean [Glycine max (L.) Merr] varieties. Turkish Journal of Field Crops, 22(2), 178–186.
- Ortiz-Bobea, A., Ault, T. R., Carrillo, C. M., Chambers, R. G., & Lobell, D. B. (2021). Anthropogenic climate change has slowed global agricultural productivity growth. Nature Climate Change, 11(4), 306–312. [CrossRef]
- Pagliuso, D. , Grandis, A., Fortirer, J. S., Camargo, P., Floh, E. I. S., & Buckeridge, M. S. (2022). Duckweeds as Promising Food Feedstocks Globally. Agronomy, 12(4). [CrossRef]
- Palacios, C. , Grandis, A., Carvalho, V., Salatino, A., & Buckeridge, M. (2019). Isolated and combined effects of elevated CO2 and high temperature on the whole-plant biomass and the chemical composition of soybean seeds. Food Chemistry, 275, 610–617.
- Pasquel, D., Roux, S., Richetti, J., Cammarano, D., Tisseyre, B., & Taylor, J. A. (2022). A review of methods to evaluate crop model performance at multiple and changing spatial scales. Precision Agriculture, 23(4), 1489–1513.
- Poudel, S. , Vennam, R. R., Shrestha, A., Reddy, K. R., Wijewardane, N. K., Reddy, K. N., & Bheemanahalli, R. (2023). Resilience of soybean cultivars to drought stress during flowering and early-seed setting stages. Scientific Reports, 13(1), 1277.
- Prechelt, L. (2002). Early stopping-but when? In Neural Networks: Tricks of the trade (pp. 55–69). Springer.
- Prokhorenkova, L. , Gusev, G., Vorobev, A., Dorogush, A. V., & Gulin, A. (2018). CatBoost: Unbiased boosting with categorical features. Advances in Neural Information Processing Systems, 31.
- Qiao, Y., Miao, S., Li, Q., Jin, J., Luo, X., & Tang, C. (2019). Elevated CO2 and temperature increase grain oil concentration but their impacts on grain yield differ between soybean and maize grown in a temperate region. Science of the Total Environment, 666, 405–413.
- Rezaei, E. E. , Webber, H., Gaiser, T., Naab, J., & Ewert, F. (2015, March). Heat stress in cereals: Mechanisms and modelling. In European Journal of Agronomy (Vol. 64, pp. 98–113). Elsevier B.V. [CrossRef]
- Sentelhas, P. C. , Battisti, R., Câmara, G. M. de S., Farias, J., Hampf, A., & Nendel, C. (2015). The soybean yield gap in Brazil–magnitude, causes and possible solutions for sustainable production. The Journal of Agricultural Science, 153(8), 1394–1411.
- Shanker, A. K. , Gunnapaneni, D., Bhanu, D., Vanaja, M., Lakshmi, N. J., Yadav, S. K., Prabhakar, M., & Singh, V. K. (2022). Elevated CO2 and water stress in combination in plants: Brothers in arms or partners in crime? Biology, 11(9), 1330.
- Shastry, A., Sanjay, H., & Bhanusree, E. (2017). Prediction of crop yield using regression techniques. International Journal of Soft Computing, 12(2), 96–102.
- Singh, S. K., Reddy, V. R., Devi, M. J., & Timlin, D. J. (2021). Impact of water stress under ambient and elevated carbon dioxide across three temperature regimes on soybean canopy gas exchange and productivity. Scientific Reports, 11(1), 16511.
- Song, Y. , John Martin, J. J., Liu, X., Li, X., Hou, M., Zhang, R., Xu, W., Li, W., & Cao, H. (2025). Unraveling the response of secondary metabolites to cold tolerance in oil palm by integration of physiology and metabolomic analyses. BMC Plant Biology, 25(1), 279.
- SoyStats. (2023). 2018 Soy Highlights. http://soystats.com.
- Streck, N. A. (2005). Mudança climática e agroecossistemas: Efeito do aumento de CO2 atmosférico e temperatura sobre o crescimento, desenvolvimento e rendimento das culturas. Ciência Rural, 35, 730–740.
- Streiner, D. L. (2005). Finding our way: An introduction to path analysis. The Canadian Journal of Psychiatry, 50(2), 115–122.
- Taniushkina, D., Lukashevich, A., Shevchenko, V., Belalov, I. S., Sotiriadi, N., Narozhnaia, V., Kovalev, K., Krenke, A., Lazarichev, N., Bulkin, A., & others. (2024). Case study on climate change effects and food security in Southeast Asia. Scientific Reports, 14(1), 16150.
- Team, R. C. (2024). R: A language and environment for statistical computing (Version 4.4. 0). 4.3. Vienna, Austria: R Foundation for Statistical Computing.
- Thomey, M. L. , Slattery, R. A., Köhler, I. H., Bernacchi, C. J., & Ort, D. R. (2019). Yield response of field-grown soybean exposed to heat waves under current and elevated [CO2]. Global Change Biology, 25(12), 4352–4368.
- USDA. (2024). Cropexplorer [Dataset]. https://ipad.fas.usda.gov/cropexplorer/cropview/commodityView.aspx?cropid=2222000.
- Van Eeuwijk, F. A., Bustos-Korts, D., Millet, E. J., Boer, M. P., Kruijer, W., Thompson, A., Malosetti, M., Iwata, H., Quiroz, R., Kuppe, C., & others. (2019). Modelling strategies for assessing and increasing the effectiveness of new phenotyping techniques in plant breeding. Plant Science, 282, 23–39.
- Wang, A. , Lam, S. K., Hao, X., Li, F. Y., Zong, Y., Wang, H., & Li, P. (2018). Elevated CO2 reduces the adverse effects of drought stress on a high-yielding soybean (Glycine max (L.) Merr.) cultivar by increasing water use efficiency. Plant Physiology and Biochemistry, 132, 660–665.
- Wang, N., Wang, E., Wang, J., Zhang, J., Zheng, B., Huang, Y., & Tan, M. (2018). Modelling maize phenology, biomass growth and yield under contrasting temperature conditions. Agricultural and Forest Meteorology, 250, 319–329.
- Wang, Y. , Zhang, Q., Yu, F., Zhang, N., Zhang, X., Li, Y., Wang, M., & Zhang, J. (2024). Progress in Research on Deep Learning-Based Crop Yield Prediction. Agronomy, 14(10), 2264.
- Wickham, H. (2025). A personal history of the tidyverse.
- Wu, X., Liu, H., Li, X., Ciais, P., Babst, F., Guo, W., Zhang, C., Magliulo, V., Pavelka, M., Liu, S., Huang, Y., Wang, P., Shi, C., & Ma, Y. (2018). Differentiating drought legacy effects on vegetation growth over the temperate Northern Hemisphere. GLOBAL CHANGE BIOLOGY, 24(1), 504–516. [CrossRef]
- Wu, Y. , Wang, E., He, D., Liu, X., Archontoulis, S. V., Huth, N. I., Zhao, Z., Gong, W., & Yang, W. (2019). Combine observational data and modelling to quantify cultivar differences of soybean. European Journal of Agronomy, 111, 125940.
- Yang, L., Song, W., Xu, C., Sapey, E., Jiang, D., & Wu, C. (2023). Effects of high night temperature on soybean yield and compositions. Frontiers in Plant Science, 14, 1065604.
- Zandalinas, S. I., & Mittler, R. (2022). Plant responses to multifactorial stress combination. New Phytologist, 234(4), 1161–1167. [CrossRef]
- Zhao, N., Meng, P., He, Y., & Yu, X. (2017). Interaction of CO2 concentrations and water stress in semiarid plants causes diverging response in instantaneous water use efficiency and carbon isotope composition. BIOGEOSCIENCES, 14(14), 3431–3444. [CrossRef]
- Zheng, G., Chen, J., & Li, W. (2020). Impacts of CO2 elevation on the physiology and seed quality of soybean. Plant Diversity, 42(1), 44–51.
- Zinta, G., AbdElgawad, H., Peshev, D., Weedon, J. T., Van den Ende, W., Nijs, I., Janssens, I. A., Beemster, G. T., & Asard, H. (2018). Dynamics of metabolic responses to periods of combined heat and drought in Arabidopsis thaliana under ambient and elevated atmospheric CO2. Journal of Experimental Botany, 69(8), 2159–2170.
- Zipper, S. C. , Qiu, J., & Kucharik, C. J. (2016). Drought effects on US maize and soybean production: Spatiotemporal patterns and historical changes. Environmental Research Letters, 11(9), 094021.

| Grain | Observed | Predicted | RMSE | Model (y = α+ βx +ϵ) |
| Production (g DW) | α = 1.67 | |||
| aCO2 | 6.97 ± 0.78 | 6.62 ± 0.33 | 3.04 | y = 0.638x + 0.172 |
| eCO2 | 16.9 ± 1.01 | 16.56 ± 0.79 | 3.85 | y = 0.809x + 0.142 |
| Temp | 0.63 ± 0.15 | 0.65 ± 0.02 | 0.47 | y = -0.116x + 0.118 |
| Drought | 2.78 ± 0.24 | 2.76 ± 0.09 | 0.74 | y = -0.138x + 0.141 |
| eCO2+Temp | 16.93 ± 1.48 | 16.24 ± 0.90 | 5.92 | y = 0.879x + 0.154 |
| eCO2+Drought | 4.04 ± 0.41 | 3.90 ± 0.39 | 1.39 | y = 0.208x + 0.107 |
| Soluble sugars (µg.mg. DW-1) | α = 40.28 | |||
| aCO2 | 33.73 ± 1.78 | 32.32 ± 1.61 | 9.91 | y = -0.838x + 0.569 |
| eCO2 | 34.26 ± 1.33 | 33.66 ± 1.61 | 5.76 | y = -0.300x + 0.260 |
| Temp | 42.66 ± 2.23 | 42.32 ± 1.23 | 7.73 | y = 0.268x + 0.599 |
| Drought | 28.59 ± 1.35 | 28.29 ± 0.98 | 5.01 | y = -1.434x + 0.617 |
| eCO2+Temp | 49.23 ± 3.77 | 48.05 ± 2.68 | 13.32 | y = 0.495x + 0.297 |
| eCO2+Drought | 42.00 ± 1.26 | 38.73 ± 0.21 | 11.41 | y = 0.175x + 0.426 |
| Starch (µg.mg. DW-1) | α = 18.96 | |||
| aCO2 | 20.95 ± 1.52 | 20.25 ± 1.01 | 6.36 | y = 0.201x + 0.400 |
| eCO2 | 22.18 ± 1.57 | 21.48 ± 1.03 | 6.59 | y = 0.155x + 0.184 |
| Temp | 20.22 ± 1.78 | 19.92 ± 0.58 | 6.16 | y = 0.126x + 0.399 |
| Drought | 17.77 ± 0.73 | 17.46 ± 0.60 | 3.55 | y = -0.164x + 0.425 |
| eCO2+Temp | 16.94 ± 1.86 | 16.87 ± 0.94 | 5.06 | y = -0.83x + 0.185 |
| eCO2+Drought | 16.51 ± 0.40 | 14.97 ± 1.56 | 5.25 | y = -0.195x + 0.265 |
| Lipids (%) | α = 23.77 | |||
| aCO2 | 25.51 ± 0.48 | 25.85 ± 1.24 | 4.63 | y = 0.186x + 0.144 |
| eCO2 | 26.87 ± 0.35 | 26.33 ± 1.26 | 3.86 | y = 0.159x + 0.066 |
| Temp | 23.34 ± 0.25 | 23.18 ± 0.67 | 1.87 | y = -0.046x + 0.142 |
| Drought | 25.29 ± 0.58 | 25.01 ± 0.86 | 3.22 | y = 0.186x + 0.158 |
| eCO2+Temp | 25.88 ± 0.48 | 25.19 ± 1.40 | 4.41 | y = 0.115x + 0.069 |
| eCO2+Drought | 25.26 ± 0.68 | 23.34 ± 2.44 | 6.58 | y = 0.145x + 0.103 |
| Proteins (%) | α = 34.31 | |||
| aCO2 | 38.01 ± 0.61 | 37.19 ± 1.85 | 5.79 | y = 0.421x + 0.171 |
| eCO2 | 37.00 ± 0.60 | 36.25 ± 1.74 | 5.50 | y = 0.138x + 0.077 |
| Temp | 37.02 ± 0.39 | 36.70 ± 1.07 | 3.80 | y = 0.304x + 0.170 |
| Drought | 36.91 ± 0.71 | 36.59 ± 1.26 | 3.63 | y = 0.331x + 0.186 |
| eCO2+Temp | 37.67 ± 0.51 | 36.56 ± 2.04 | 6.88 | y = 0.179x + 0.082 |
| eCO2+Drought | 33.95 ± 0.57 | 31.10 ± 3.25 | 9.63 | y = -0.010x + 0.118 |
| Amino acids (%) | α = 115.85 | |||
| aCO2 | 48.51 ± 8.56 | 44.35 ± 2.21 | 18.37 | y = -8.17x + 2.403 |
| eCO2 | 44.84 ± 6.30 | 42.76 ± 2.05 | 17.17 | y = -3.63x + 1.078 |
| Temp | 206.84 ± 25.82 | 204.04 ± 5.95 | 79.29 | y = 10.356x + 3.970 |
| Drought | 130.72 ± 20.97 | 128.07 ± 4.44 | 63.23 | y = 1.713x + 3.444 |
| eCO2+Temp | 290.42 ± 23.23 | 278.09 ± 15.54 | 85.59 | y = 9.826x + 2.462 |
| eCO2+Drought | 79.97 ± 10.69 | 72.41 ± 7.58 | 33.56 | y = -2.655x + 1.802 |
Disclaimer/Publisher’s Note: The statements, opinions and data contained in all publications are solely those of the individual author(s) and contributor(s) and not of MDPI and/or the editor(s). MDPI and/or the editor(s) disclaim responsibility for any injury to people or property resulting from any ideas, methods, instructions or products referred to in the content. |
© 2025 by the authors. Licensee MDPI, Basel, Switzerland. This article is an open access article distributed under the terms and conditions of the Creative Commons Attribution (CC BY) license (http://creativecommons.org/licenses/by/4.0/).


