
Submitted:
09 October 2025
Posted:
14 October 2025
You are already at the latest version
Abstract
European forests have been providing a persisting carbon (C) sink of a magnitude of ca. 10% of current carbon emissions over recent decades. While this sink is often viewed as natural, the dynamic conditions of its existence have remained unexplored, questioning its steadiness or transiency over the longer term. The cumulated intensity of this sink since the onset of C emissions also remains critically undocumented, in the absence of a historical monitoring of forest growing stock (GS) course since European forest transitions. Both questions were addressed for the temperate forests of France that underwent the forest transition in the mid-19th century. We developed a forest densification model, guided by a contemporary 40-year time series of forest GS established from the national forest inventory (NFI), and recurrent century-old areal statistics. Simulations identified a singular convex GS densification model over 150 years, and an initial GS density of 25 m3/ha, supporting historical forest depletion reports. GS as estimated for three historical statistics required plausible low-density (15-30%) contemporary forest analogues to match simulated trajectories and figured out a 5-fold centennial GS increase, and a minimum 10-fold since 1850. The roles of continuous forest extension, management extensification and environmental growth changes in this dramatic biomass increase were inquired. Rescaled to aerial wood carbon, this in situ accumulation represented 10.5% of the cumulated historical country C emissions, questioning the viability of the forest dynamic to be maintained, were forests to remain a prioritized option for climate change mitigation in the future.
Keywords:
forest transition
; forest density
; growing stock
; carbon sink
; simulation
1. Introduction
World forests have been favoring a persisting net C sink of ca. 15% of global emissions over at least 30 years (1). A sink of comparable magnitude (10%) has been reported for the past 50 years over forests of Europe, though managed and exploited (2). The multidecadal steadiness of this forest sink has promoted forests as a natural climate solution (3, 4). This overreliance on a natural sink has however let some implications of its maintenance largely uncovered, including the land economy and afforestation requested to achieve this goal (5, 6, 7), or the role of forest management practices (8, 9).
European forests have been especially subjected to dynamical changes able to foster the forest C sink since the forest transition (10, 11), a process occurring along nations’ development (12) whereby forests re-expand following use of alternate sources of energy and material, land abandonment resulting from the agricultural revolution, or forest protection. This forest transition has been observed in most developed countries (13, 14) and occurred earliest in the 19th century, with long-lasting consequences on forest extension. Hence, the European forest area has steadily increased by ca. +0.4%/year between 1990 and 2015 (15, 16). While much less popularized (13), forest densification has also been observed in Europe (17). Over the same period, the volume of forest growing stock (GS) has been found to increase at a much faster pace than forest area (+1.6%/year, (16)).
Such long-term processes have two implications. First, the magnitude of forest C sinks – substantial but insufficient per se to mitigate climate warming (18, 4) – may hide transitional forest changes of a much larger magnitude than suspected, questioning their sustainability. Second and conversely, the onset of these transitions may have fostered a longer-lasting than expected C sink, with overlook of its cumulated contribution to sequestration of the total historical emissions of countries. In both cases, gaining knowledge of long-term forest trajectories forms a prerequisite.
Aerial C stocks and their changes, however, remain far less documented than forest areal dynamic, as forest monitoring facilities (19, 20) emerged much more recently than the processes under scrutiny, with initiation in the 1920s in Europe and Northern America. Chronologies of forest growing stock (GS) of a pluri-decennial significance have hence been released in an anecdotal number of countries like France (21), Finland (22), or Switzerland (23). Among European countries, French forests have shown the fastest recent increases in both area and GS (24). A steady increase in GS of a magnitude of +60% over the past 40 years has hence been evidenced from the national forest inventory (21), initiated in the 1960s (19). The magnitude and steadiness of this increase suggest that GS accumulation is ancient, in accordance with seminal work on forest transition in France (25), dated around the 1830s.
The first aim of the study was to estimate a plausible trajectory of the aerial forest stock since the forest transition and quantify forest GS at remote dates in time to measure the magnitude of the associated change over different time horizons. This was attempted by combining ancient areal statistics on forests, pluri-decennial contemporary data on forest GS, and an average forest densification model for which contrasted alternatives were tested. The subsequent aim was to quantify the associated sequestration of fossil C emissions in the aerial forest compartment since their historical onset, and balance these changes to get an outlook on the sustainability of this sink.
Available historical data show fair stability in the forest area over 1820-1860 (26), suggesting that 1850 could serve as an operative baseline for measuring forest changes. In addition, total CO2 emissions from France remained marginal between 1800 and 1850 (shifting from 2 to 19 Mt per year, against 540 Mt at the peak in 1973, https://ourworldindata.org/co2-and-greenhouse-gas-emissions), making this reference date also relevant for assessing the cumulated forest sequestration of the country’s carbon debt. This temporal alignment permitted to fix the time horizon of the study to 1850.
2. Results
Convex forest densification assumption over time required for the simulation of GS course over 150 years
The course of GS was simulated from 1850 to 2010, assuming a unique average area-dependent forest densification model (growing stock density, GSD, m3/ha) applying all across the territory. A broad range of densification assumptions over time were tested (Materials and methods, SI appendix, section 1 and Figures S1 and S2), including a classical concave asymptotic trajectory (M1), a linear trajectory (M2), an exponential trajectory simulating an accelerated densification (M3) and an intermediate sigmoid asymptotic densification trajectory (M4). A time series for the total forest area since 1850 was established based on historical statistics and modern NFI data, featuring a convex positive change of a magnitude of +50 to +67% since 1850 (Materials and Methods, SI appendix, section 2 and Figure 1). This series served to both initialize the model and provide annualized net fluxes of forest area all along the period, making the model prediction the cumulative spatial sum of a densification process over time (see Materials and Methods, Eq. 1). The model was fitted to a contemporary time series of total forest GS covering the period 1976-2010 (21). This fitting process was encapsulated within an uncertainty analysis scheme (SI appendix, section 3) that included forest area estimates from statistics prior to contemporary NFI statistics, also tested with a uniform +1 million ha (SI appendix, section 2) and the initial GSD conditions for forests present in 1850 and for new forests extending after this date.
The fitting process (Table 1) rapidly demonstrated the inadequacy of the standard asymptotic assumption (M1), found much too slow to track the observed GS increase (Figure 2a). The occurrence of saturation was rejected at a remote time horizon, to the extent where it led to a behavior similar with the linear assumption model (M2, Figure 2b). Strikingly, the exponential GS densification assumption (M3) led to a 2-to-threefold reduction in the prediction error, and showed a much better accordance with data (Figure 2c). Typical of this model, the trajectory however demonstrated an excessive steepness against contemporary data. Best fits were obtained with the sigmoid densification assumption (M4, Figure 2e). The time of occurrence of the sigmoid inversion was estimated between 150 and 250 years, depending on initial conditions (Table 1) i.e., at the limit or outside the observation period. This indicated that only the accelerated accumulation phase of this model was operative for simulating the GS trajectory, with the advantage of a slower and linear accumulation around the inflection point, as compared with the exponential model.
Of note, all best fits were obtained with a singularly low initial GSD in 1850 (10 to 25 m3/ha), indicating a state of major depletion of these forests at the forest minimum. In comparison, coppice forests as the least dense existing forest structure over the territory had a mean GSD of 66 m3/ha in 2010, thus almost three times as dense as forests of 1850. These fits also led to favor a large initial GSD for new forest areas (20 m3/ha), suggesting that forest inclusion in ancient official statistics was more restrictive than permitted by the modern and inclusive international forest definition (SI appendix, section 2). In addition, best fits of models M3 and M4 were obtained with a correction of ancient forest areas by +1 million ha (M3-2 and M4-2 in Table 1), better fitting the GS time series (Figure 2d and 2f) and found compatible with this negative bias affecting the corresponding statistics.
Under the sigmoid assumption, contemporary GSD changes would be close to their maximum. Also, the estimated asymptotic GSD (580 m3/ha; Table 1) was found far above current GSD levels of French forests, and realistic when compared to highest GSD levels commonly found in Europe (around 350 m3/ha in Romania, Slovenia or Switzerland, and 400 m3/ha in Lichtenstein, (27)).
Under the two best modelling assumptions (M3-2 and M4-2), ratios of 2010-to-1850 GS were x9.8 and x24.5, respectively. They reached x9.9 for both models when initial forest areas were not corrected. That forest GS may have increased by 10 to 25 folds over a period of 150 years after a forest transition forms an unexpected singular outcome of this study. These two models were retained for GS estimation over centenary forest statistics.
Estimations of forest growing stocks onto ancient forest areal statistics require contemporary forest analogues of a singularly low forest density
Historical forest statistics (28) of 1892, 1908 and 1929 (S1 to S3) considered in the study partitioned forest area across space, ownership categories and forest vertical structure, both of influence on GSD. This partitioning set permitted to define forest types and transport forest GSD estimates from their associated forest analogues in contemporary inventory statistics (Materials and Methods, SI appendix, section 4). In view of ongoing forest densification, present-day GSD means and lower GSD quantiles of forest analogues were tested, together with two reference periods from the forest inventory (1980s or NFI#1, and 2010s or NFI#2).
Estimations of past volumes based on GSD means depended strongly on the NFI period of reference. They were increased by 150 to 300 million m3 (around 10 to 20%) when shifting from NF1#1 to NFI#2 reference, reflecting the intensity of contemporary increases in GSD (+40 m3/ha over 35 years (21)). Whereas the NFI-based estimate of mean GSD in 1976 reached 121 m3/ha, estimates obtained for these historical statistics (1892-1929) based on the means reached around 125 m3/ha (NFI#1) and 140 m3/ha (NFI#2), respectively, confirming both the unreasonable use of conditional mean imputation, and the absence of a realistic continuity over time with the NFI#2 reference. These results indicated that mean GSD at these ancient dates was much below that of current forest analogues.
Among forest partitioning factors, vertical forest structure was also found to be that mostly impacting the GSD of forest analogues and total GS estimation, in a positive sense when discarded, with estimates based on the NFI#1 reference increasing to 130-135 m3/ha. This again stressed the discrepancy with contemporary GSD estimates, and indicated the greater prevalence of low vertical forest structures at ancient dates, privileged for the delivery of energy wood. This finding was found in accordance with previous analyses of changes in forest structure from the same ancient statistics (28), evidencing a halving of coppice forest area and a doubling of high forest area over one century, and reflecting a coppice conversion process initiated in the 19th century (SI appendix, section 5). Consequently, the NFI#1 reference, and the finest forest partitioning option including geographical units, forest ownership and vertical structure were retained.
Estimates of GSD for statistics S1 to S3 using GSD quantile ranges in forest analogues were superimposed onto the two best fits of models M3 and M4 (Figure 3). Quantiles in best accordance with the models and their impact for GSD, total GS and GS changes over the different periods are reported in Table 2.
Closest matches between best GS fit (M4-2) and GS reconstitutions were obtained with GSD-quantiles of 15, 20 and 30% of contemporary analogues, for statistics of 1892 to 1929 (S1 to S3), respectively, hereby confirming and quantifying the singularly low density of French forests at these dates. GS ratios between 2010 and these ancient dates were found >5 and >4, for 1892 and 1908, corresponding to changes in GS of +400 and +300%, respectively (Table 2). By comparison to this centennial increase in GS, changes in forest area over the same period amounted to +49% and +36%, respectively, when measured relative to S2 area, or its offset by +1 million ha (Figure 1). These figures agreed those reported for Switzerland (23), where forest area and GS may have increased by +63% and +292%, respectively, between 1860 and 2006, as estimated from broad GSD trend assumptions (29).
Associated carbon sink cumulated over 150 years reaching 10% of the country carbon debt
Both the simulated time series of forest GS since 1850 (using model M4-2, extrapolated to 2020, Table 1) and the reconstituted GS over historical statistics S1 to S3 were converted into aerial woody forest carbon and aligned with historical emissions of the country since 1850 (Materials and Methods, SI appendix, section 6). Profit was made from a previous analysis of the same data (28) showing that the areal fractions of broadleaf and conifer tree species remained constant over one century, and enabling conversions into total tree volume by botanical class (SI appendix, section 6). Aerial biomass was further obtained from of a new massive wood density data record established from the French NFI (30), and reflecting the proportion of botanical classes in current GS (SI appendix, section 6).
Initial forest GS in 1850 as based on the initial modelling condition amounted to 102 million m3 of stem wood, corresponding to 154.4 million m3 of aerial volume, and to 0.042 Pg C in the aerial forest C stock (Table 3). Quickly increasing GS along the 20th century translated into aerial C stocks around 0.15, 0.4 and 1.0 Pg C, in 1900, 1950 and 2020, respectively, mirroring the 25-fold increase in GS since 1850. Fossil emissions of the country (31) have grown in an accelerated way from a marginal level of 0.0006 Pg C.year–1 in 1800 to their peak in 1973 (0.147 Pg C.year–1), then moving down to 0.076 Pg C in 2020 (Figure 4a). Cumulated emissions hence amounted to 1.0 Pg, 3.2 Pg and 10.6 Pg C in 1900, 1950 and 2020, respectively (Figure 4b). Emissions over 1800-1850 represented a marginal 0.9% of that total.
When aligned, cumulated C emissions and C stored in aerial woody biomass showed a remarkably parallel trajectory over 150 years (Figure 4b), highlighting the uncoupling between the growing energetic demand and the use of energy wood, and suggesting a steady cumulated in situ forest sink over the study period. When expressed as a fraction of total C emissions since 1800 (and after a conventional transient regime arising from sink onset since 1850, Material and Methods, Eq. 2), the sink steadiness was confirmed and reached in less than 20 years, evolving at a level of around 10-12% of cumulated emissions (Figure 4c). A same remarkable stability was also observed at the turn of the 20th century, whereby the aerial forest stock more than doubled over 40 years (statistics S1 and S3, Table 3). A decrease by 2% was also observed in the period 1960-80, a time where C emissions rapidly increased before peaking. The sink showed an average cumulated magnitude of 10.8% over 1850-2020, and 11.2% over 1900-2000 (Table 3). Therefore, the temporal significance of a 10% fraction of emissions sequestered in the forests can be extended to much earlier horizons than recent decades only. With this cumulated C sink being permitted by a +400% centennial change in GS (Table 2), a strong discrepancy between these figures, and thus between the intensity of anthropic and natural processes is therefore stressed, were the latter fostered by active forest policies.
3. Discussion
Causes for accelerated GS densification over 150 years
As a singular outcome, the modelling assumption of an average accelerated forest densification over 150 years was required to simulate recent decennial changes in the total forest volume (Table 1, Figure 2), which does not match the classical forest view of a decelerated forest GSD accumulation over time (32). In addition, this pattern was simulated in the context of a spatially-extending forest, driven by natural and active afforestation processes (33, 21), which should induce a reduction in the average GSD through continuous adjunction of forest areas of negligible density (at the forest transition, GSD is typically found to decrease (13)). Therefore, two series of hypotheses can be put forward to account for this major finding: (i) effects of the forest extension process itself, inducing growth stimulation by introduction of planted and fast-growing exotic tree species, often on past agricultural lands, (ii) environmental and management changes, stimulating volume accumulation through a progressive drift in forest GS balance (growth minus felling) per hectare.
Forest extension
GS of returning forests after 1850 with the two best models (M3-2 and M4-2, Table 1) was found to represent 273.7 and 418.2 million m3 in 2010, respectively, suggesting a contribution to volume expansion of 10.8 % and 16.2 % (Figure 5). Yet, these estimations remained conditional to an average densification model, and were prone to be underestimated. To inquire this aspect further, we identified forests asserted to have been gained from afforestation after 1850, identified by region, period, and associated to exotic tree species (SI appendix, section 7 and Table S2). Their total volume in current NFI estimates reached 514 million m3, of which 87% stemmed from conifer forests. This estimate is thus of a comparable order of magnitude with the simulations, and in noticeable accordance with the best simulation (M4-2), but exceeds it by 23%, and attributes 20.4% of volume accumulation to returning forests. Further, this statistic (Table S2) only accounts for known afforestation programs, and not for forests returning naturally. By contrast, the dominance of private broadleaved forests in recent GS increase (66% since 1975, (21)) has confirmed the importance of broadleaf tree species in GS expansion. Therefore, the previous estimation (Table S2) provided a clear indication that forests gained after the forest minimum of 1850 have had a greater impact on total GS than that suggested by an average model, contributing to the convexity of the GS densification pattern. The continuous rejuvenation of forest area from new forests was also clearly identified in the simulations, with the GSD of ancient forests (present before 1850) and of returning forests reaching 92.3 and 59.9 m3/ha, respectively, in 1950, and 205.8 and 80.3 m3/ha, respectively, in 2010, with an average final GSD of 164.3 m3/ha.
Environmental changes.
Since the 1980s (34, 35), long-term positive changes in forest growth in Europe (36) and worldwide (37) have been reported, that can have contributed to feature the convex pattern of forest densification identified. Growth changes of an order of magnitude of +100% over the 20th century have been identified in France (38, 39, 40, 41, 42). Appropriate detection methods (43, 44) have led to consensus as to their exogenous environmental attribution, including global atmospheric CO2 enrichment (45), global climate warming (46), and regional increases in nitrogen addition to forest ecosystems (47), in Europe (48), and in France (49). Their stimulating effects on forest growth in Europe has been demonstrated by modelling (50, 51) and observation approaches (51, 52, 40). While remaining critically undocumented, management-driven recovery of forest site fertility after forest overexploitation, excessive grazing or litter raking before the forest minimum of forest transition (53) may have contributed to forest growth changes. The hypothesis is supported by the very low initial average GSD in 1850 identified by simulation (Table 1 and Table 2).
In order to evaluate whether this positive environmental forcing may displace the time/level of the inflection point and the asymptote of the trajectory (model M4, Table 1), we performed additional simulations increasing the intrinsic average rate of GS densification over time, assuming two environmental scenarios (E1/E2) reflecting the previous findings (a linear +100% densification rate over 1900-2000/accelerated +200% over 1850-2000, SI appendix, section 8). The outcome was found inequal in terms of model performance (Table S3). In both cases however, the GSD trajectory infection time by 15 to 65 years, and GSD at the equilibrium (GSDmax) decreased down to 490 and 185 m3/ha, causing a more linear GSD path that better fitted contemporary NFI-based observations of GS (Figure S3). Thus, evidence-based environmental scenarios of densification stimulation were able to strongly modify the intrinsic trajectory of GSD, with more realistic parameter levels. They however did not offset the convexity of GSD trajectory per hectare over 150 years, especially with the best scenario, suggesting that the average densification pattern has multiple historical causes (Figure S3).
Forest management changes
Forest exploitation remains poorly documented over time, a main reason why only a synthetic GS accumulation model was implemented (29). Available qualitative information leads to hypothesize a progressive reduction of felling rates in time, able to accelerate forest densification over the period. This is supported by: (i) the adoption of a forestry code with a police function to restrict forest overexploitation in 1927 (54), (ii) the development of education programs for forestry training all across Europe and in France (1824), in order to rationalize forest production (11), (iii) the conversion of intensive coppice production systems into high forests (SI appendix, section 5), (iv) the progressive wood substitution for other sources of energy and material (25). The parallel status of anthropogenic emissions and GS accumulation (Figure 4b) strongly supports this view.
While ancient forest statistics do not include GS statistics, they however reported commercialized wood volumes for different uses, which were explored across the study period to test the hypothesis of management extensification over time. Contemporary estimates of wood fluxes were also established from recent statistics and NFI data (SI appendix, section 9), to be compared with caution, as felled trees below 7.5 cm in diameter, and branches are not accounted for in NFI statistics. They nevertheless provided qualitative information about trends in average felling rates. Felling volumes and felling rates expressed both per ha and as a fraction of the GS were produced (Table 4).
Ancient statistics highlighted a clear decrease in absolute wood felling volumes, by around –50% over 1892 – 1929. This translated into an average felling rate shifting from 3.00 to 1.35 m3/ha/year over the period, due to concomitant increases in forest area. This decrease appeared even sharper when felling volumes were expressed as rates of forest GS (Table 4) in expansion over the period, with respective estimations of 8.5, 5.0 and 1.9% GS/year, for years 1892, 1908 and 1929. Hence, felling rates as estimated at the turn of the 19th and 20th centuries suggest especially dramatic levels of exploitation at the beginning of this period, and a reduction by around 3/4th in this pressure, as such able to form a decisive contributor to wood accumulation after the forest minimum. By contrast, recent statistics (as of 1962) showed greater and increasing absolute felling volumes along the 20th century that translated into also increasing areal felling rates, but stable – if not slightly decreasing – felling rates of GS, around 1.7% and 2% (Table 4). GS-related felling rates therefore suggested a slowing decrease over the whole period. In spite of substantial data differences, the analysis therefore gives support to the hypothesis of a strongly decreasing pressure on wood resources over more than a century. It also showed the importance of expressing felling rates relative to GS when not stationary, rather than relative to forest area.
Past reconstitution of growing stocks and intensity of their changes
Centennial changes in forest density and their variability
Under the two best modelling assumptions (M3-2 and M4-2, Table 1), simulated GS trajectories were found aligned with GS reconstitutions using quantiles 0.15 to 0.30 of current GSD in forest analogues (Table 2 and SI appendix, section 4), stressing the magnitude of forest densification over one century. Under the sigmoid assumption (M4) in particular, corresponding average GSD in 1892, 1908 and 1929 ranged between 32 and 66 m3/ha, i.e., at most the lowest average GSD encountered across all forest vertical structures from the first countrywide NFI estimates in 1983 (60 m3/ha for coppice forests, see alsoSI appendix, section 5), and also one-half to one-third only of GSD encountered in other structures (coppice-with-standard forests and high forests).
We used a same uniform quantile of GSD across all forest analogues defined by geographic, ownership and structure factors, allowing to quantify an average densification process over the period. Nevertheless, the magnitude of densification is bound to have been strongly contrasted across forest strata, as evidenced by current densifications, e. g. across categories of forest structure. In particular, ancient coppice forests are those that have more strongly densified than others, due to the historical forest conversion processes at play to obtain high forests (SI appendix, section 5), whose density reached around 150 m3/ha in the 1980s (SI appendix, section 4). By comparison, there is little difference, if any, between average GSD in 1929 and current coppice forests (around 60 m3/ha). Forest densification may as well vary strongly across space, with e. g. physical limitation in access to forests of mountain ranges being reducing the felling intensity (55). In France, highest stock densities have hence been encountered above 800 m asl (56), with GS in stands of Norway spruce/silver fir and their mixtures currently exceeding 370 m3/ha, followed by mixtures of common beech with silver fir/Norway spruce (325 m3/ha). Mountain ranges of the French territory have also been shown to represent one fourth of total forest densification over more than three decades (33).
Trends of a singular magnitude over one century
With a GS of 2.5 billion m3 in 2010, total forest GS would thus have undergone a 5-fold increase over one century (statistics S2, 1908), and an 8-fold increase over 120 years (S1, 1892; Table 2) under the sigmoid densification assumption (M4-2). This trend estimate remains subjected to the modelling uncertainty (resp. 4- and 5-fold increases over the same periods with M3-1 and M3-2). In view of the fairly linear rate current of GS accumulation (Figure 2), the intrinsically rapid growth rate of the exponential model implies some straightening of the trajectory to fit these observations, leading to greater and probably overestimated GSD estimates at ancient dates (Table 2). This uncertainty however gives more robustness to, rather than it may contradict, the spectacular rate of GS inflation over the period. Forest areal extension has also contributed to the magnitude and path of this GS increase (Figure 5, Table S2), as trends in GSD (per unit area), over one century and 120 years, reached more moderate factors of 3.4- and 5.1-folds, respectively. Causes for these densification rates have been explored and discussed, including the strong decline in felling rates along the period 1892-1929 (Table 4).
In this respect, the initial condition (1850) also deserves particular attention. For any initial area scenario simulated (SI appendix, section 2), the fitting process led to privilege singularly low initial GSD levels (10 and 25 m3/ha). With densification model M4-1, this corresponded to total GS estimates of respectively 230 million m3 (forest area before 1850 unchanged, 25 m3/ha) and 102 million m3 (area +1 million ha, 10 m3/ha in M4-2; Table 1, Figure 1). These initial conditions imply major increases in GS over 150 years (x10.8 and x24.4, respectively). One original finding here is that inflation in GS after a forest transition is highlighted to be by far greater in magnitude than that concerning forest area extension, and actually hardly comparable to it.
Associated cumulated aerial forest carbon sink
Intensity of the sink and forest dynamic conditions at play
One major aim of this study was to uncover the conditions of forest development underpinning the existence of a forest C sink, with growing awareness of these drivers, at least regarding forest land-use (3, 6). Profit was also made from the coincidence of the forest minimum (25, Figure 1) and of the rising of CO2 emissions in France (31, Figure 4a) resulting from the second industrial revolution (57), to estimate a cumulated total – instead of a current – sink of the C debt, with a study period therefore extended to 1850 back in time. This cumulated sink was estimated to reach around 11% of the total emissions, and showing stability over the long term (Figure 4c). It thus coincided with standard orders of magnitude reported for recent periods on global and European forests (1, 2), supporting the accepted the idea of a natural and constant – but relative – forest sink.
The dynamics of C emissions over 150 years in France (a 250-fold increase between 1800 and the year of their maximum in 1973) and across the globe (>1100-fold to 2023) has indeed been accelerating in such a way that the absolute forest C sink can instead only arise from singular and transient conditions on forest dynamics, far from a permanent regime. Two empirical findings from the study strongly support this view, including: (i) the convexity of the average forest densification pathway required over 150 years to fit contemporary NFI statistics (Figure 2, Table 1, and Figure S1), (ii) the magnitude of GS change over 100 years (+400%, S3, Table 2), 120 years (+580%, S1, Table 2) and 150 years (+880 to +2350%, based on the initial modelling condition, see Results). Under model M4, the absolute aerial forest C sink is hence showed to have doubled every 50 years, with 0.12 Pg C over 1851-1900, 0.28 Pg over 1901-1950, and 0.50 Pg C over 1951-2000 (Figure 4b), a view not widely acknowledged.
In support of these findings, different causal processes were investigated that reflected dramatic changes in forests across the study period. First, forest lands have been extending at an average magnitude of +50 to + 67% since 1850 (Figure 1). While their contribution appears moderate as inferred from an average densification model (16.2%, Figure 5), GS only associated to fast growing exotic tree species – mostly conifers – introduced over the period (Table S2) represented 20.4% of the total growing stock in 2020 (NFI statistics). Second, felling rates as reconstituted from historical statistics (S1 to S3) showed a sharp decrease, by 3-fold/4-fold, when expressed per hectare or per unit of GS (Table 4). The active conversion of intensive coppice forests into high forests has contributed to decrease the felling intensity, as well as it has increased GSD, at least by 3-fold (SI appendix, section 5), constituting a third driver of this increase. Fourth, environmental growth changes evidenced in France and Europe have reached a magnitude of +100% over one century. While their intensity made them initially strongly debated (58), they have also early been put forward as a driver of increasing European C sink (59). The simulation conducted in this study revealed that it was able to dramatically curb down the asymptote of the sigmoid densification assumption that best fitted the data (SI appendix, section 8, Table S3, Figure S3).
The largely comparable context of long-term forest dynamics across the continent, including forest transitions (11, 14), environmental growth changes (36, 59), conversion of forest systems dedicated to energy wood (60) and development of plantation-based forestry (61), is an obvious support to why the forest C sinks of European and French forests show comparable relative magnitudes. These processes are well documented to date, but little considered together for assessing their cumulated effects on forest C sinks. While environmental growth stimulation and decrease in the felling rate form passive drivers of C accumulation in forests, the substantial forestry efforts embodied in coppice conversion, active afforestation programs, or forest planning aiming at more sustainable felling rates are no natural causes, but have been instead actively supported by forest policies and their funding. This aspect cannot be neglected.
The reported intensity of the forest C sink also does not account for the forest soil sink that remains neglected in mitigation strategies (8). Existing estimates for soils of French forests have been obtained by modelling (62) and observational approaches (63), leading to fairly comparable estimates (4.4 Tg/year in 1990 in (62), against 0.35 Mg/ha/year over 1993-2012 in (63), translating into 5.13 Tg/year using the average forest area of the period). Assuming these fluxes can be extrapolated to the period 1950-1990 with appropriate rescaling to a moving forest area, they would amount to 0.161/0.178 Pg, and to fractions of 0.44 to 0.49 of the estimated aerial forest C sink, i.e. around one third of the total sink. The potential importance of this sink draws attention onto its drivers, with management causes being again put forward, including the conversion of coppice to high forests, conifer afforestation on former agricultural soils (64), or the abandonment of litter extraction (17). These potential causes echo those of the aerial sink.
Future of the forest C sink
In view of the forest dynamic highlighted over 150 years, whether the aerial C sink may persist in future decades forms a critical issue. A first support to this hypothesis is related to C sink potential, as some regions of Europe show an average GSD around 300-400 m3/ha (see Results), far above average GSD in France (162 m3/ha in 2010) and in Europe (192 m3/ha in 2015, (24)). In a rare record obtained with NFI data and of regional significance (65), the density equilibrium was shown to be reached in a range of up to 500-600 m3/ha, in natural temperate forests of New-Zealand (16). A second supportive empirical indication is that GS has still been undergoing substantial positive trends after 2010, in France (+1.3%/year), with an increase from 2,5 to 2,9 billion m3 in only 12 years (+15% over 2010-2022 from NFI statistics). GS increase also remains pervasive in Europe, with +300 billion m3 over 2010-2020 (27). From a policy perspective, increasing the in-situ forest C sink is also strongly advocated for in the European forest strategy (66). Likewise, the France 2030 national plan aims at supporting the plantation of one billion trees until 2032 for favouring the C sink and adapting forests to climatic change. New forest areas accumulating at a yearly pace of ca. +0.4 %/year in Europe will also foster GS trends over the longer term (16).
However, climate change and associated impacts on forests constitute the most worrisome and unprecedented alarm of forest sink’s alteration in the future, whether driven by severe disturbance regimes (67), drought- (68) or insect-induced (69) increases in tree mortality, or now confirmed erosion of forest growth across countries of Europe, in Switzerland (70), Sweden (71), or France (72). Drought may also be of significant impact to future plantation efforts, with success reduction by up to 60% over recent dry years (73). Early support to this claim lies in the first reported evidence of a turning point in the forest C sink in France (74), with tree mortality strongly increasing since the 2010s. As an outcome, the abiotic environment that has stimulated GS accumulation since the forest transition may no longer foster that sink.
Modest as it may seem face the global climate challenge (4), the past aerial forest C sink has been permitted by a singular open regime ensuring a stable fraction of the emissions, fostered by the coincidence of excessively favourable conditions in forest management and dynamics, and stimulating environmental conditions. With their maintenance now being all but certain or over, the stock of forest biomass will likely turn a venture instead of a guaranteed capital. Therefore, the conclusion that forests constitute neither a natural nor a sustainable C sink for the future decades urgently needs be reaffirmed.
4. Materials and Methods
The section gives essential information and principles on which the study has been performed and largely refers to SI appendix material.
Densification model. The four tested models of GS densification over time were: the monomolecular model (M1) figuring out a concave asymptotic GSD trajectory, the linear model (M2), the exponential model (M3) and the Hossfeld model (75) simulating a sigmoid asymptotic densification trajectory intended to capture a more complex accelerated-decelerated pattern (SI appendix, section 1). The model was applied to unit areas including: (i) the initial forest area of 1850 and (ii) each new yearly unit of forest area resulting from forest extension (see Forest area below). Volume of the growing stock as recorded in NFI data is a stemwood volume with a countable diameter of 7.5 cm at breast height. Since forests in ancient statistics were appraised in a restricted way (SI appendix, section 2), each unit of forest area was initialized with a non-zero growing stock density, allowed to differ between forests of 1850 and new forest units. By denoting y the running year, S1850 the forest area at the origin, S(yi) units of new forest area at any year yi > 1850 (SI appendix, section 2), GSD1850 and GSDini the initial GSD of preexisting and new forests respectively, GSDM (GSDini, t) the modelled GSD over forest developmental age (years) from a unit area of density GSDini, and GSM (y) as total forest GS from year y, the model writes as the spatial sum of an accumulation process over time:
GSM (y) = S1850 × GSDM (GSD1850, y – 1850 + y0) + Σyi ∈ [1851, y] S(yi) × GSDM (GSDini, y – yi)
with 1850 < yi ≤ y ≤ 2010, as defined from the available GS time series. The constant y0 was computed to rescale the apparent age of forests of 1850 when GSD1850 differed from GSDini (SI appendix, section 1), with y0 > 0 (< 0) if GSD1850 > GSDini (GSD1850 < GSDini).
In view of the tractability of Eq. (1), models were fitted by systematic and dichotomic exploration of the parameter space to minimize an error of prediction, computed from contemporary GS data (21) covering the period 1976-2010 (SI appendix, section 3 and Dataset S1).
Forest area. Forest area is documented since the late 18th century (25), and has turned more reliable from establishment of the imperial land register in 1830 (26, 76). Combined with modern inventory statistics, historical forest area data made it possible to reconstitute and smooth the historical course of forest area since this date using polynomial regression. Concern about conservative historical approaches to the definition of forests led to consider an additional scenario whereby total area from early statistics was increased identically by 1 million hectares. The smoothed chronologies provided annual forest fluxes since 1850 (SI appendix, section 2, Dataset S1 for time series of area and Supporting datasets for the 3 historical statistics).
Relative forest density at historical dates. Forest GS is not documented in ancient forest statistics, at times where no massive mensuration techniques of wood stocks were available (SI appendix, section 4). These statistics nevertheless partition forest area at a fine grain across space (NUTS-3 units of the EU classification system), ownership categories, and forest vertical structure, so many factors that influence the growing stock density and its temporal course (21). Estimates of historical GS were thus elaborated by using imputation from modern NFI estimates of GSD, based on these conditional partitioning factors, i. e. by transporting the estimated GSD of contemporary forest analogues to these past statistics. Three forest statistics surrounding the early 20th century, and dated 1892, 1908, and 1929 (S1 to S3) were selected for past GS estimation, after their digitization, analysis, and inter-comparison (28, SI appendix, section 2, Supporting datasets). Because of forest densification over time, the imputation of a mean was likely to produce biased estimates of past GSD. Quantile imputation was therefore implemented over a wide range of lower quantiles (0.1 to 0.6 with a step of 0.05). In view of GS increases, the sensitivity of conditional imputation to subperiods of the contemporary NFI survey period was also tested (NFI#1 and NFI#2, SI appendix, section 4).
Conversion of forest aerial GS into carbon mass and computation of the historical C sink. Aerial GS routinely measured by the NFI as a stemwood volume at a final diameter section of 7 cm was converted into total aerial tree volume using volume expansion factors at tree botanical class scale (broadleaf and conifer), and established from NFI data (78) for the French forests (SI appendix, section 6). Biomass conversion was based on a recent basic wood density dataset (dry mass over fresh volume) obtained by X-ray tomography over 156 tree species from the French NFI (30, Supporting datasets), and providing wood density averages representative of tree species in botanical classes over the territory (SI appendix, section 6). Profit was here made from areal/GS conifer-to-broadleaf ratios being both remarkably constant over one century (statistics S2, (28))/25 years (21), respectively, leading to the working assumption of a constant GS botanical class mix over the study period, taken from NFI statistics 2010 (GS broadleaf fraction 0.641). A fraction of 0.5 for carbon-to-biomass mass was used. Total annual CO2 emission data from 1800 to 2020 for France were extracted from (31) (Supporting datasets), converted into Pg C using the C molar fraction of CO2 (12/44), and used for computing cumulated emissions at any date t in time since 1800 (cumulated emissions of carbon, CEC(t)), termed as the country carbon debt. The cumulated in situ aerial forest C sink since 1850 (excluding carbon stored in roots and forest soils) at time t was computed as the difference between aerial forest C stock (aFCS) between t and 1850, and expressed as a fraction of cumulated emissions as:
Supplementary Materials
The following supporting information can be downloaded at the website of this paper posted on Preprints.org.
References
- Y. Pan et al., The enduring world forest carbon sink. Nature 631, 563–569 (2024). 1. P. Ciais et al., Carbon accumulation in European forests. Nature Geoscience 1, 425–429 (2008).
- L. Cooper, D. MacFarlane, Climate-smart forestry: promise and risks for forests, society, and climate. Plos Climate 2, e0000212 (2023).
- C. M. Anderson et al., Natural climate solutions are not enough. Science 363, 933–934 (2019).
- R. A. Houghton, J. L. Hackler, K. T. Lawrence, The U.S. carbon budget: contributions from land-use change. Science 285, 574–578 (1999).
- K. Dooley, K. L. Christiansen, J. F. Lund, W. Carton, A. Self, Over-reliance on land for carbon dioxide removal in net-zero climate pledges. Nat Commun 15, 9118 (2024).
- X. Tian, B. Sohngen, J. Baker, S. Ohrel, A. A. Fawcett, Will U.S. forests continue to be a carbon sink? Land Econ 94, 97–113 (2018).
- L. Kaarakka, M. Cornett, G. Domke, T. Ontl, L. E. Dee, Improved forest management as a natural climate solution: A review. Ecological Solutions and Evidence 2, e12090 (2021).
- P. Li et al., The relative contributions of forest growth and areal expansion to forest biomass carbon. Biogeosciences 13, 375–388 (2016).
- A. S. Mather, The Forest Transition. Area 24, 367–379 (1992).
- A. S. Mather, “The transition from deforestation to reforestation in Europe” in Agricultural Technologies and Tropical Deforestation, CABI Books., (2001), pp. 35–52.
- P. E. Kauppi, V. Sandström, A. Lipponen, Forest resources of nations in relation to human well-being. PLOS ONE 13, e0196248 (2018).
- P. E. Kauppi et al., Returning forests analyzed with the forest identity. Proc Natl Acad Sci U S A 103, 17574–17579 (2006).
- P. Meyfroidt, E. F. Lambin, Global forest transition: prospects for an end to deforestation. Annual Review of Environment and Resources 36, 343–371 (2011).
- FAO, Global forest resources assessment 2015 (UN/FAO, 2015).
- J.-D. Bontemps, Inflation of wood resources in European forests: The footprints of a big-bang. PLOS ONE 16, e0259795 (2021).
- A. Rautiainen, I. Wernick, P. E. Waggoner, J. H. Ausubel, P. E. Kauppi, A national and international analysis of changing forest density. PLoS ONE 6, e19577 (2011).
- V. K. Arora, A. Montenegro, Small temperature benefits provided by realistic afforestation efforts. Nature Geosci 4, 514–518 (2011).
- Tomppo, E., Gschwantner, T., Lawrence, M., McRoberts, R. E., National Forest Inventories: Pathways for Common Reporting (Springer Dordrecht, 2010).
- R. E. McRoberts, E. O. Tomppo, E. Næsset, Advances and emerging issues in national forest inventories. Scandinavian Journal of Forest Research 25, 368–381 (2010).
- J.-D. Bontemps, A. Denardou, J.-C. Hervé, J. Bir, J.-L. Dupouey, Unprecedented pluri-decennial increase in the growing stock of French forests is persistent and dominated by private broadleaved forests. Annals of Forest Science 77, 98 (2020).
- H. M. Henttonen, P. Nöjd, H. Mäkinen, Environment-induced growth changes in the Finnish forests during 1971–2010 – An analysis based on National Forest Inventory. Forest Ecology and Management 386, 22–36 (2017).
- T. Usbeck et al., Increasing storm damage to forests in Switzerland from 1858 to 2007. Agricultural and Forest Meteorology 150, 47–55 (2010).
- Forest Europe, “State of Europe’s forests 2015” (Forest Europe, 2015).
- A. S. Mather, J. Fairbairn, C. L. Needle, The course and drivers of the forest transition: the case of France. Journal of Rural Studies 15, 65–90 (1999).
- B. Cinotti, Évolution des surfaces boisées en France : proposition de reconstitution depuis le début du XIXe siècle. Revue forestière française 48, 547–562 (1996).
- Forest Europe, “State of Europe’s forests 2020” (2020).
- T. Audinot, H. Wernsdörfer, J.-D. Bontemps, Ancient forest statistics provide centennial perspective over the status and dynamics of forest area in France. Annals of Forest Science 77, 77 (2020).
- Kurz, D., Alveteg, M., Sverdrup, H., “Acidification of Swiss forest soils. Development of a regional dynamic assessment” (Swiss Agency for the Environment, Forests and Landscape (SAEFL), 1998).
- H. Cuny et al., XyloDensMap: a georeferenced dataset for the wood density of 110,000 trees from 156 European species in France. Sci Data 12, 380 (2025).
- P. Friedlingstein et al., Global Carbon Budget 2023. Earth System Science Data 15, 5301–5369 (2023).
- Pretzsch, H., Forest dynamics, growth and yield (Springer Berlin, Heidelberg, 2009). 2. A. Denardou “Changements du stock de bois sur pied des forêts françaises : description, analyse et simulation sur des horizons temporels pluri-décennal (1975 - 2015) et séculaire à partir des données de l’inventaire forestier national et de statistiques anciennes”, PhD dissertation (Université de Lorraine, 2019).
- V. C. Lamarche, D. A. Graybill, H. C. Fritts, M. R. Rose, Increasing atmospheric carbon dioxide: tree ring evidence for growth enhancement in natural vegetation. Science 225, 1019–1021 (1984).
- Arovaara, H., Hari, P., Kuusela, K., Possible effect of changes in atmospheric composition and acid rain on tree growth. An analysis based on the results of Finnish National Forest Inventories. Communicationes Instituti Forestalis Fenniae 122: 1–16. Comm. Instit. Forest. Fenn. 122, 1–16 (1984).
- Spiecker, H., Mielikäinen, K., Köhl, M., Growth Trends in European Forests (EFI, 1996).
- C. Boisvenue, S. W. Running, Impacts of climate change on natural forest productivity – evidence since the middle of the 20th century. Global Change Biology 12, 862–882 (2006).
- Badeau, V. et al., “Long-term growth trends of trees: ten years of dendrochronological studies in France” in Growth Trends in European Forests, (Springer Berlin, Heidelberg, 1996), pp. 167–181.
- C. Rathgeber, J. Guiot, P. Roche, L. Tessier, Augmentation de productivité du chêne pubescent en région méditerranéenne française. Ann. For. Sci. 56, 211–219 (1999).
- J.-D. Bontemps, J.-C. Hervé, J.-M. Leban, J.-F. Dhôte, Nitrogen footprint in a long-term observation of forest growth over the twentieth century. Trees 25, 237–251 (2011).
- J.-D. Bontemps, J.-C. Herve, P. Duplat, J.-F. Dhôte, Shifts in the height-related competitiveness of tree species following recent climate warming and implications for tree community composition: the case of common beech and sessile oak as predominant broadleaved species in Europe. Oikos 121, 1287–1299 (2012).
- M. Charru, I. Seynave, J.-C. Hervé, R. Bertrand, J.-D. Bontemps, Recent growth changes in Western European forests are driven by climate warming and structured across tree species climatic habitats. Annals of Forest Science 74, 1–34 (2017).
- J.-D. Bontemps, J.-C. Hervé, J.-F. Dhôte, Long-term changes in forest productivity: a consistent assessment in even-aged stands. for sci 55, 549–564 (2009).
- D. M. J. S. Bowman, R. J. W. Brienen, E. Gloor, O. L. Phillips, L. D. Prior, Detecting trends in tree growth: not so simple. Trends in Plant Science 18, 11–17 (2013).
- L. Machta, Mauna Loa and global trends in air quality. Bull. Am. Met. Soc. 53, 402–420 (1972).
- P. D. Jones, A. Moberg, Hemispheric and large-scale surface air temperature variations: an extensive revision and an update to 2001. Journal of Climate 16, 206–223 (2003).
- M. G. Hastings, J. C. Jarvis, E. J. Steig, Anthropogenic impacts on nitrogen isotopes of ice-core nitrate. Science 324, 1288–1288 (2009).
- J. W. Erisman, W. de Vries, Nitrogen deposition and effects on European forests. Environ. Rev. 8, 65–93 (2000).
- L. Croisé, E. Ulrich, P. Duplat, O. Jaquet, Two independent methods for mapping bulk deposition in France. Atmospheric Environment 39, 3923–3941 (2005).
- D. Loustau et al., Modeling climate change effects on the potential production of French plains forests at the sub-regional level. Tree Physiol 25, 813–823 (2005).
- Kahle, H. P. et al., Causes and consequences of forest growth trends in Europe - results of the Recognition project (Brill Leiden, Boston, Köln, 2008).
- C. Nellemann, M. G. Thomsen, Long-term changes in forest growth: potential effects of nitrogen deposition and acidification. Water, Air, & Soil Pollution 128, 197–205 (2001).
- Glatzel, G., “Historic forest use and its possible implications to recently accelerated tree growth in central Europe” in Causes and Consequences of Accelerating Tree Growth in Europe, EFI proceedings 27., (EFI, Joensuu, 1999), pp. 65–74.
- Hüffel, G., Les méthodes de l’aménagement forestier en France (Berger Levrault, 1926).
- C. Levers et al., Drivers of forest harvesting intensity patterns in Europe. Forest Ecology and Management 315, 160–172 (2014).
- J.-D. Bontemps, J.-C. Hervé, A. Denardou, Partition idéalisée et régionalisée de la composition en espèces ligneuses des forêts françaises. Écoscience 26, 291–308 (2019).
- N. F. R. Crafts, Industrial Revolution in England and France: Some thoughts on the question, “Why was England first?” The Economic History Review 30, 429–441 (1977).
- Makkonen-Spiecker, K., “Analysis of media reactions on the EFI research report ‘Growth trends in European forests – studies from 12 countries’” (EFI, 1999).
- P. E. Kauppi, K. Mielikäinen, K. Kuusela, Biomass and carbon budget of European forests, 1971 to 1990. Science 256, 70–74 (1992).
- Unrau A. et al., Coppice Forests in Europe (University of Feiburg, 2018).
- R. A. Sedjo, The role of forest plantations in the world’s future timber supply. The Forestry Chronicle 77, 221–225 (2001).
- J. Liski, D. Perruchoud, T. Karjalainen, Increasing carbon stocks in the forest soils of western Europe. Forest Ecology and Management 169, 159–175 (2002). 3. M. Jonard et al., Forest soils in France are sequestering substantial amounts of carbon. Science of The Total Environment 574, 616–628 (2017).
- S. Luyssaert et al., The European carbon balance. Part 3: forests. Global Change Biology 16, 1429–1450 (2010).
- T. Paul, M. O. Kimberley, P. N. Beets, Natural forests in New Zealand – a large terrestrial carbon pool in a national state of equilibrium. Forest Ecosystems 8, 34 (2021).
- European Commission, New EU Forest Strategy for 2030 (2021).
- R. Seidl et al., Forest disturbances under climate change. Nature Clim Change 7, 395–402 (2017).
- C. Senf, A. Buras, C. S. Zang, A. Rammig, R. Seidl, Excess forest mortality is consistently linked to drought across Europe. Nat Commun 11, 6200 (2020).
- T. Hlásny et al., Bark Beetle Outbreaks in Europe: State of Knowledge and Ways Forward for Management. Curr Forestry Rep 7, 138–165 (2021).
- M. Vanoni, H. Bugmann, M. Nötzli, C. Bigler, Quantifying the effects of drought on abrupt growth decreases of major tree species in Switzerland. Ecology and Evolution 6, 3555–3570 (2016).
- H. Laudon, A. A. Mensah, J. Fridman, T. Näsholm, S. Jämtgård, Perspectives: Swedish forest growth decline: A consequence of climate warming? Forest Ecology and Management 565, 122052 (2024).
- L. R. Hertzog, C. Piedallu, F. Lebourgeois, O. Bouriaud, J.-D. Bontemps, Turning point in the productivity of western European forests associated with a climate change footprint. Science of The Total Environment 967, 178843 (2025).
- S. Brèteau-Amores, M. Brunette, P. Andrés-Domenech, A Cost Assessment of Tree Plantation Failure under Extreme Drought Events in France: What Role for Insurance? Forests 14, 308 (2023).
- P. Ciais et al., An outlook on the rapid decline of carbon sequestration in French forests and associated reporting needs. [Preprint] (2025). Available at: http://arxiv.org/abs/2505.11512 [Accessed 16 September 2025].
- B. Zeide, Analysis of Growth Equations. For Sci 39, 594–616 (1993).
- Oberlé, Y., Les statistiques forestières. Catalogue des sources de données anciennes, ONF (ONF, 2000).
- Dupouey, J.-L., Pignard, G., Hamza, N., Dhôte, J.-F., “Estimating carbon stocks and fluxes in forest biomass: 2. Application to the French case based upon National Forest Inventory data” in Forests, Carbon Cycle and Climate Change, (Quae, France, 2010), pp. 101–129.
Figure 1.
Reconstitution of the historical course of forest area over 1850-2010. Recent continuous areal data (black) from the national forest inventory (NFI) statistics, with origin in 1976 (21). Ancient point statistics (black) comprise four state agricultural statistics (1862, 1882, 1892 and 1929), two state forest statistics (1878 and 1908) and a reference estimate for 1850 (SI appendix, section 2, (26)). a: initial estimates of ancient statistics, b: estimates increased by + 1 million ha before smoothing. Area smoothed by polynomial OLS regression (grey).
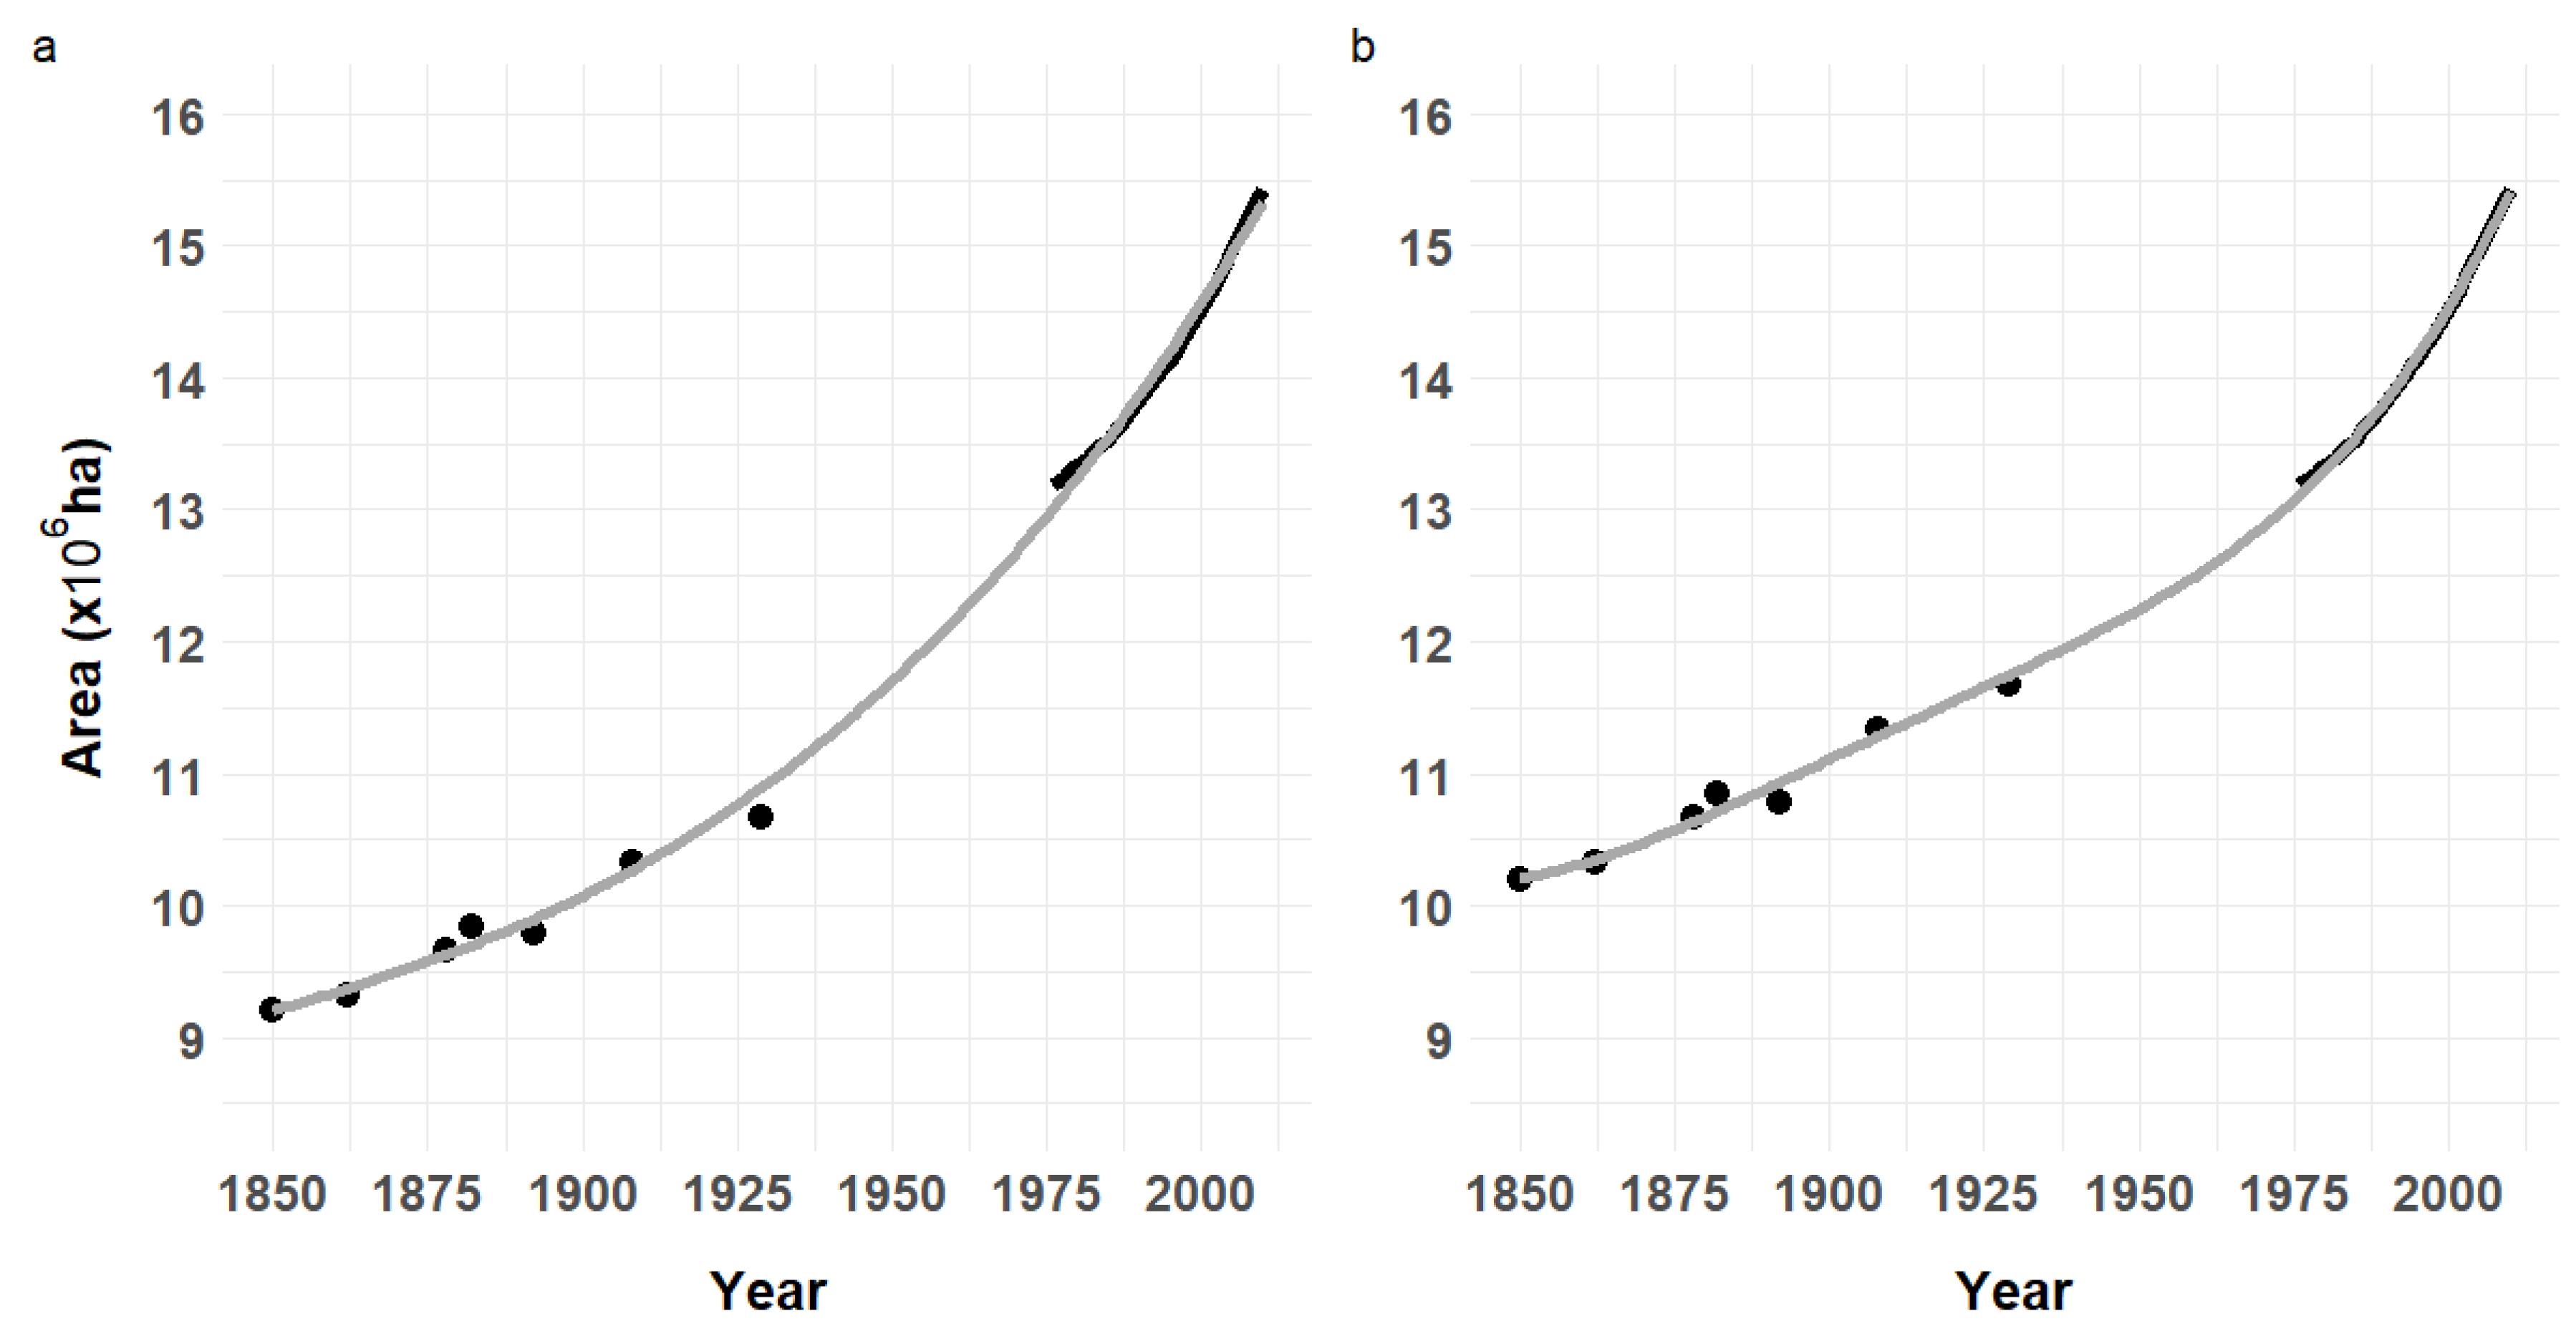
Figure 2.
Simulation of growing stock (GS) trajectory over 1850-2010 from different GS densification modelling equations (SI appendix, section 1 and section 3). a: Monomolecular (M1), b: linear (M2), c: exponential (M3-1), d: exponential, including +1 million ha initial area (Figure 1, M3-2), e: sigmoid Hossfeld (M4-1), f: sigmoid Hossfeld, including +1 million ha initial area (M4-2). Bold grey: contemporary NFI estimates of GS. Black: simulated trajectory.
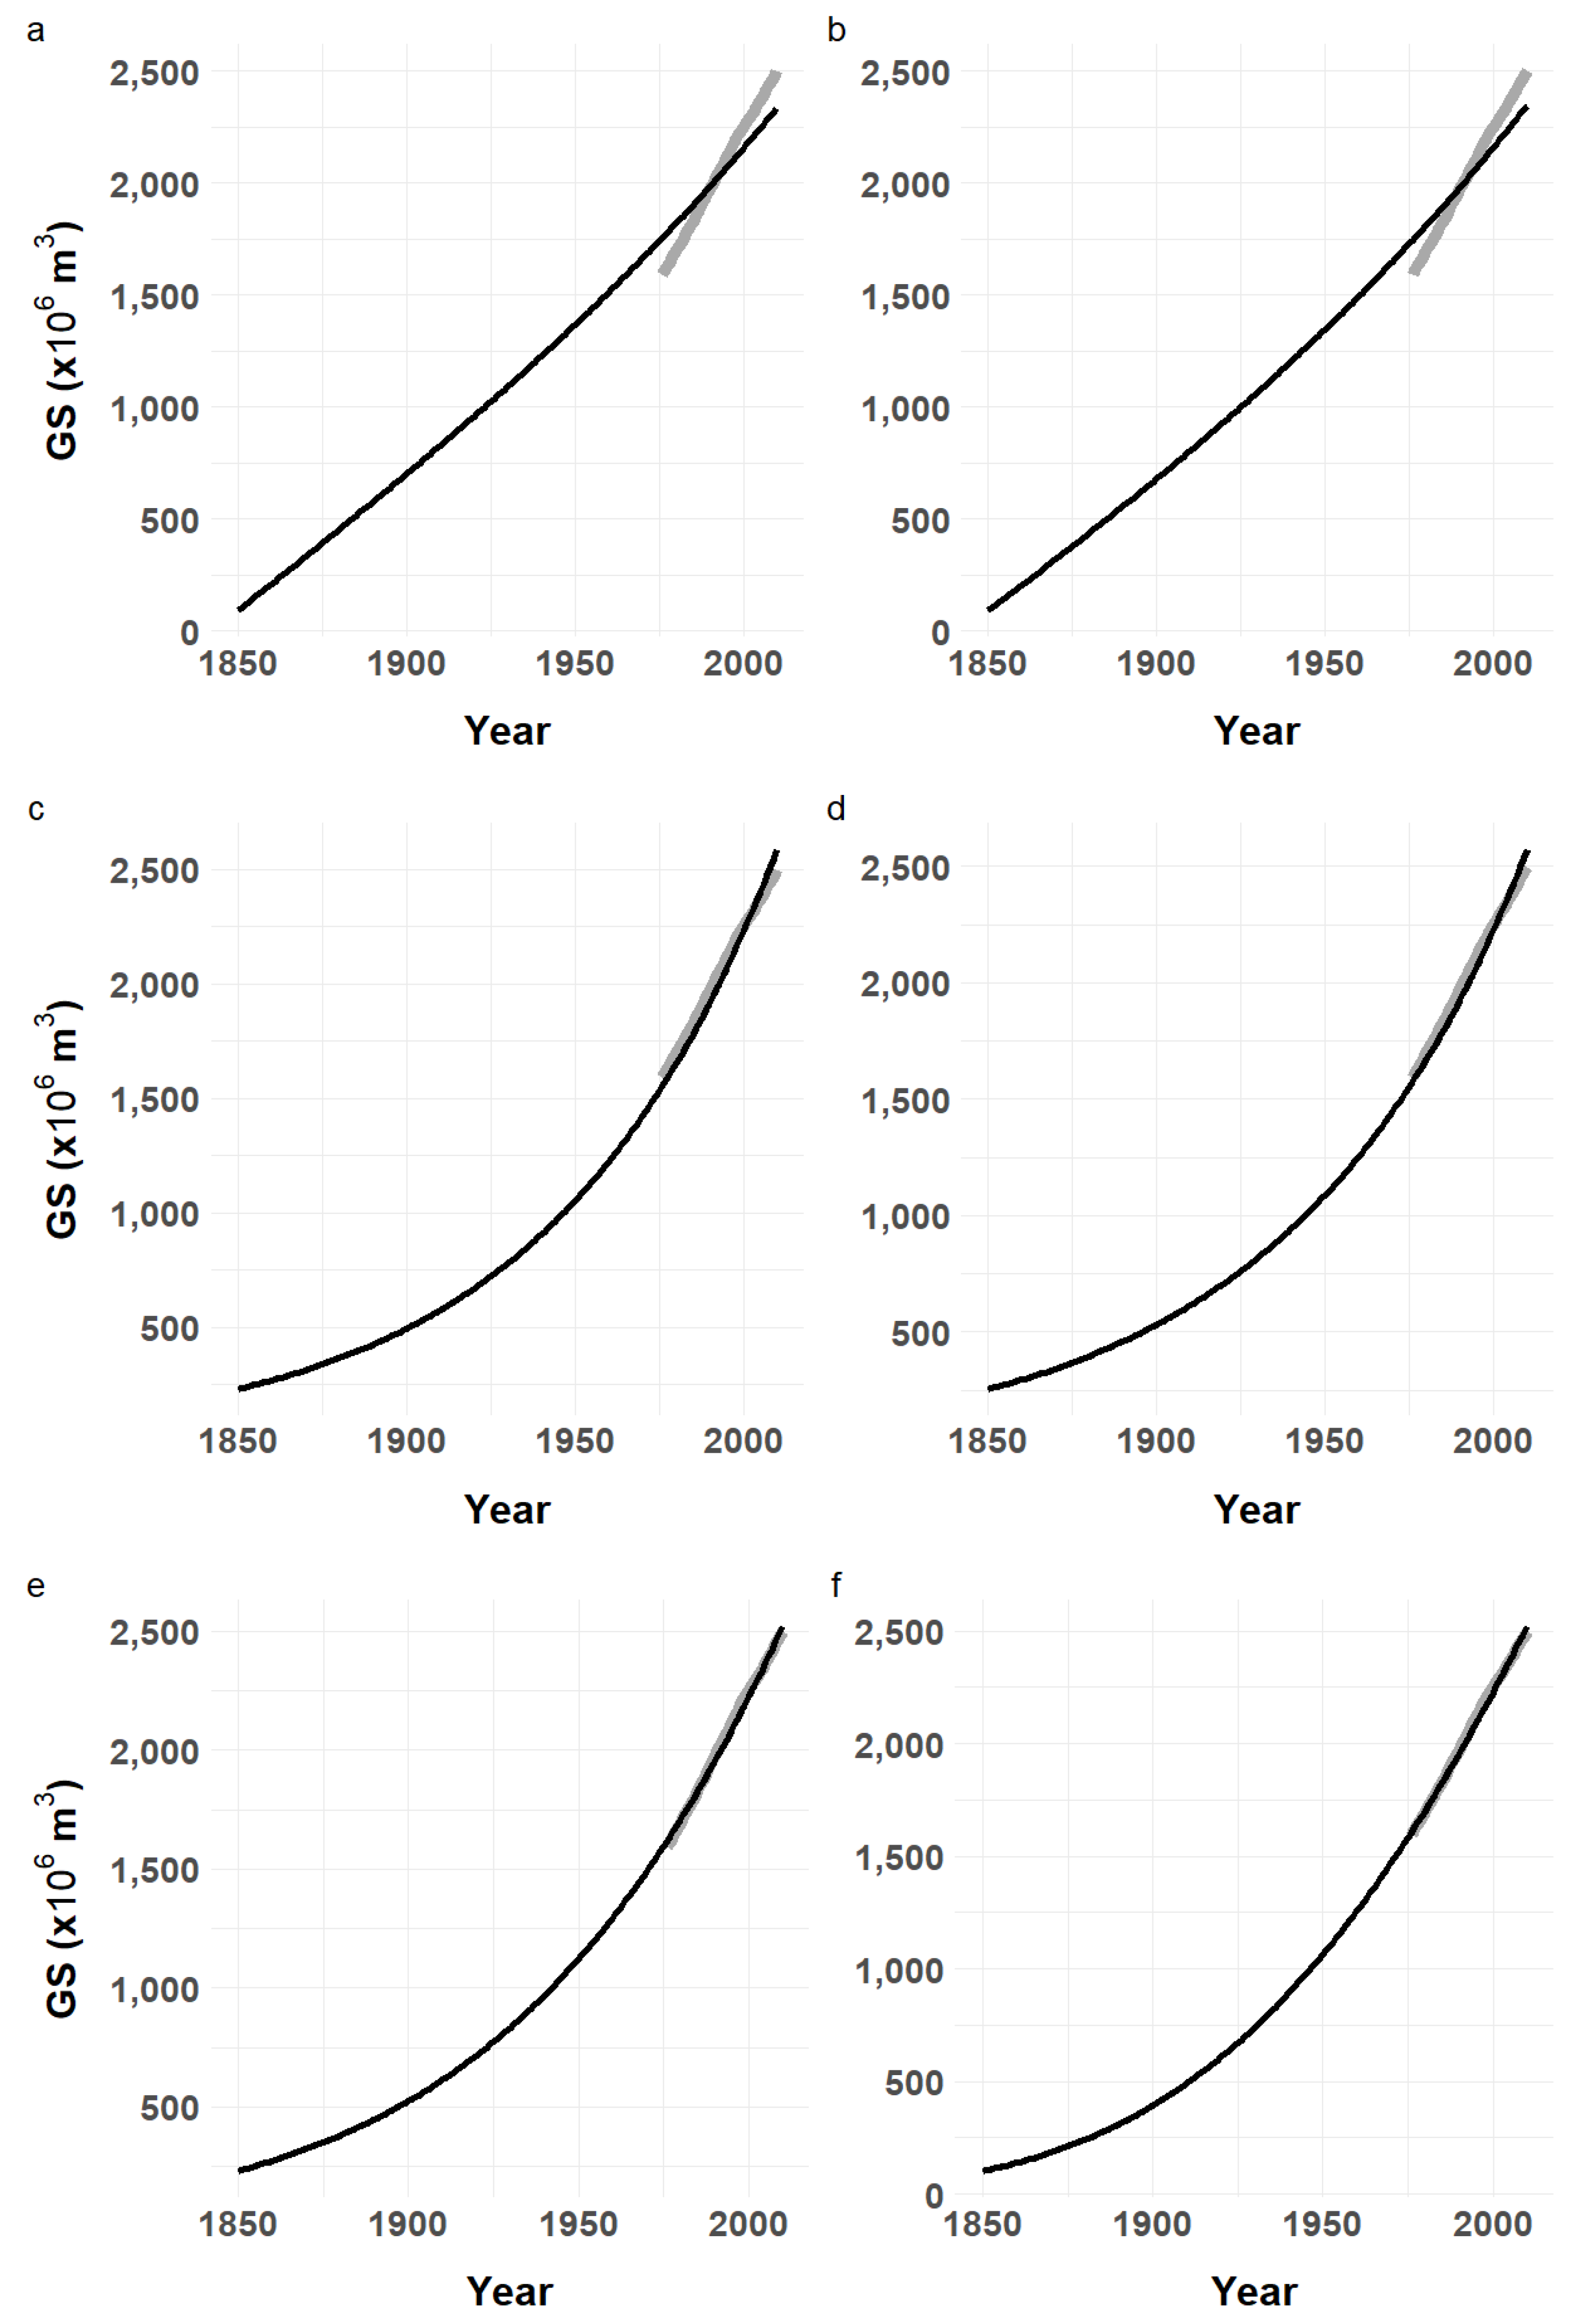
Figure 3.
GS estimations at three historical dates (1892, 1908, 1929) obtained from a quantile-based imputation of GSD from contemporary forest analogues on three historical statistics (S1 to S3) superimposed onto GS trajectories simulated by the two best densification models. See SI appendix, section 4. a: exponential densification model, b: sigmoid densification model. NFI#1 period for defining forest analogues (mean year 1983).
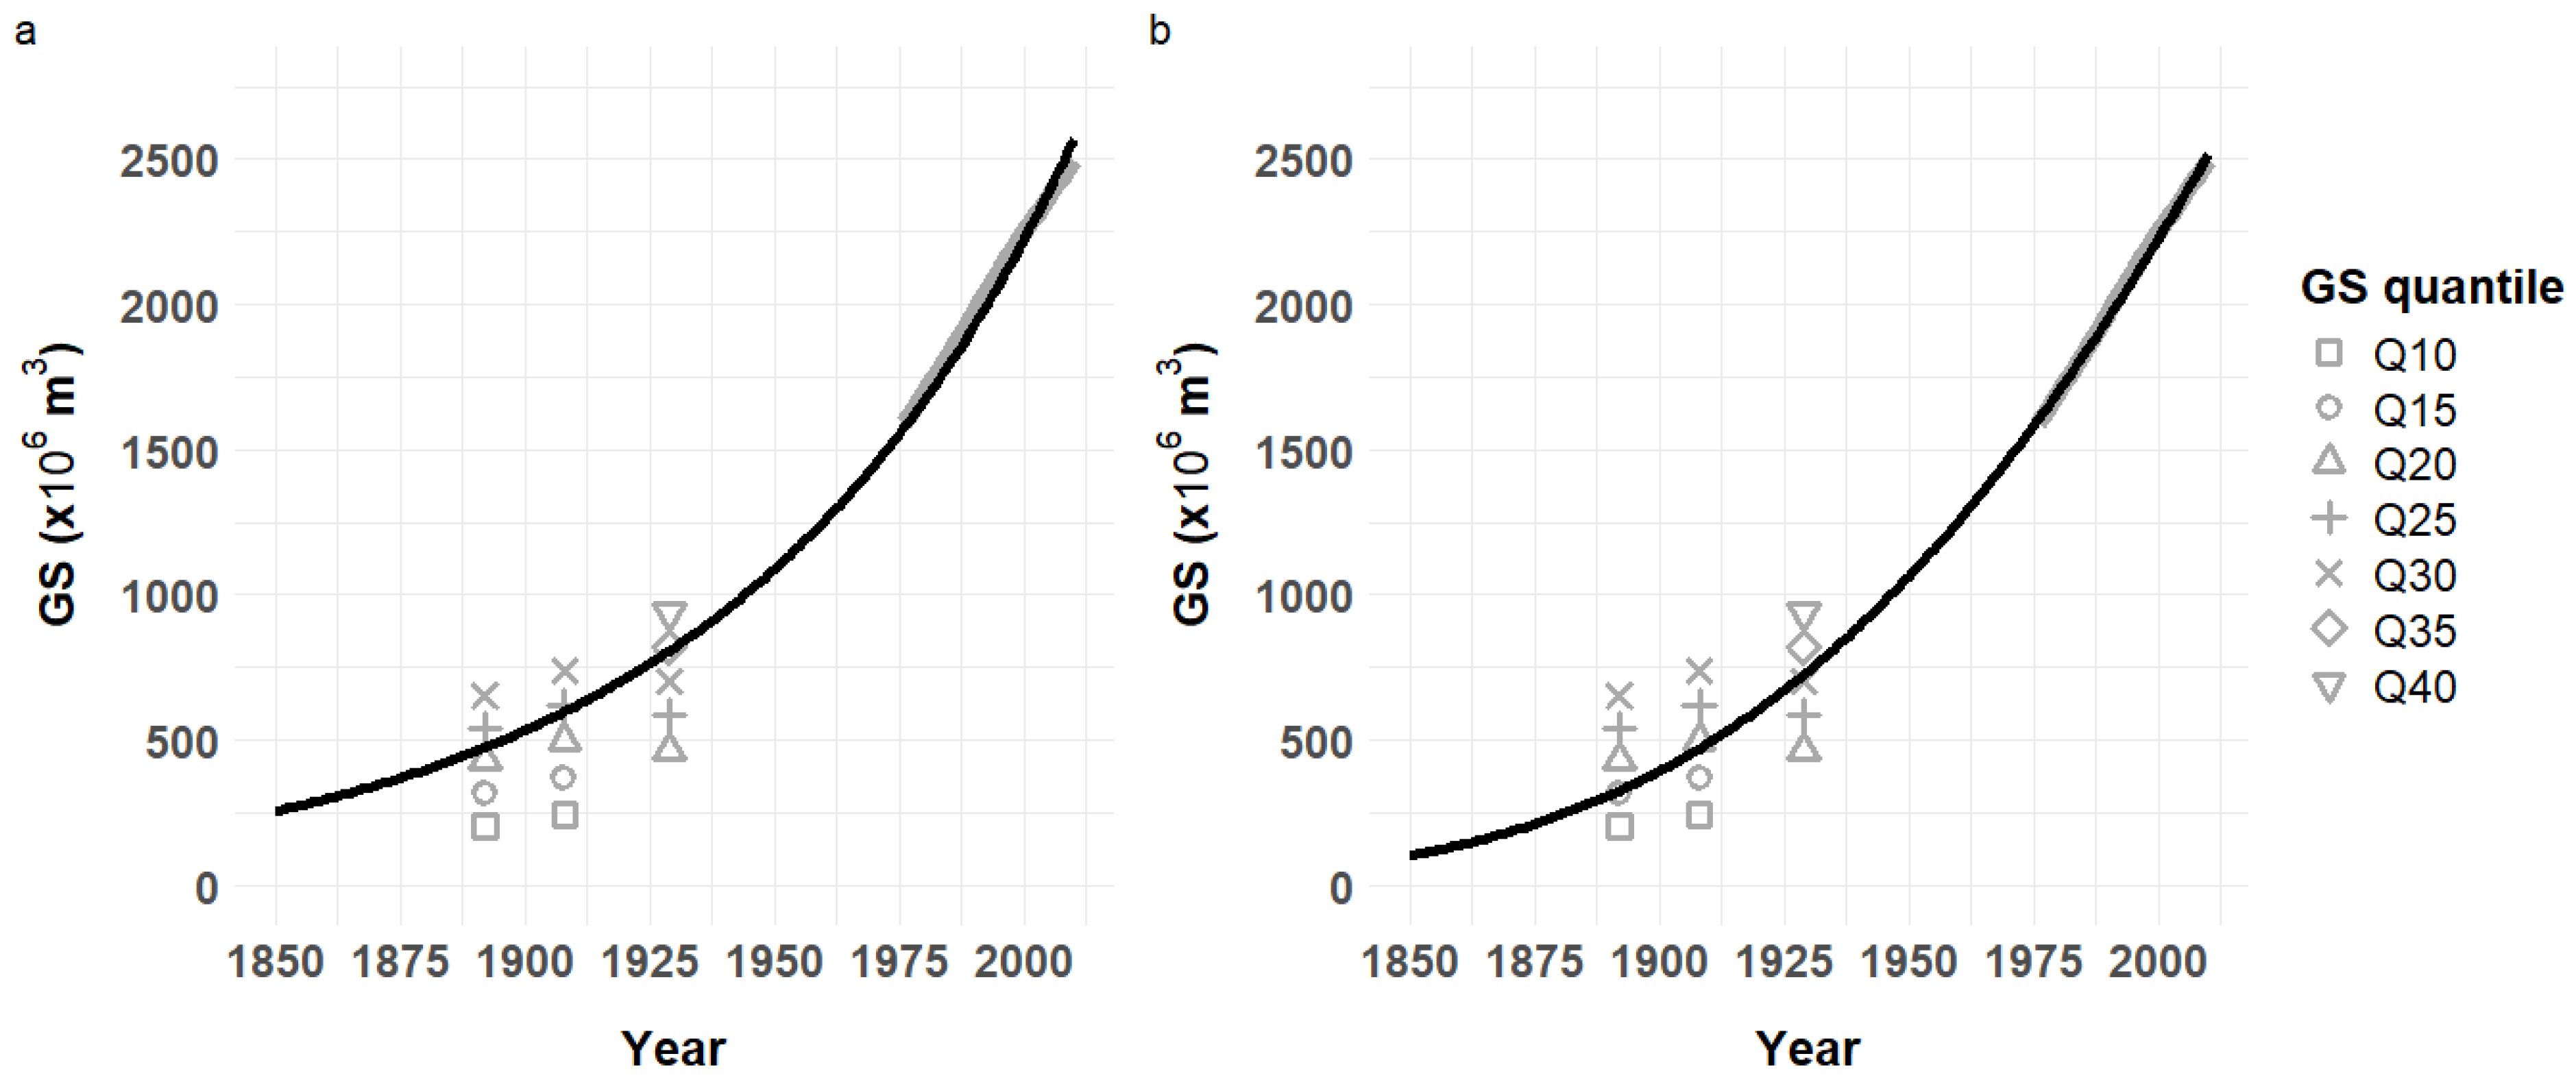
Figure 4.
Cumulated French carbon emissions since 1800 and associated net in-situ aerial forest carbon sink since 1850. a: annual carbon emissions since 1800, b: cumulated carbon emissions as aligned with the in-situ aerial mass of forest C stock (M4-2 in Table 1, SI appendix, section 6), c: cumulated sink in percent of cumulated emissions at year t, with 1850 as the reference year (null sink, see Materials and Methods, Eq. 2). The transient initial increase in the cumulated sink is associated to this convention.

Figure 5.
Contribution of new forest areas accumulated since 1850 to total GS. a: exponential densification model (M3-2), b: sigmoid densification model (M4-2, Table 1).
Figure 5.
Contribution of new forest areas accumulated since 1850 to total GS. a: exponential densification model (M3-2), b: sigmoid densification model (M4-2, Table 1).
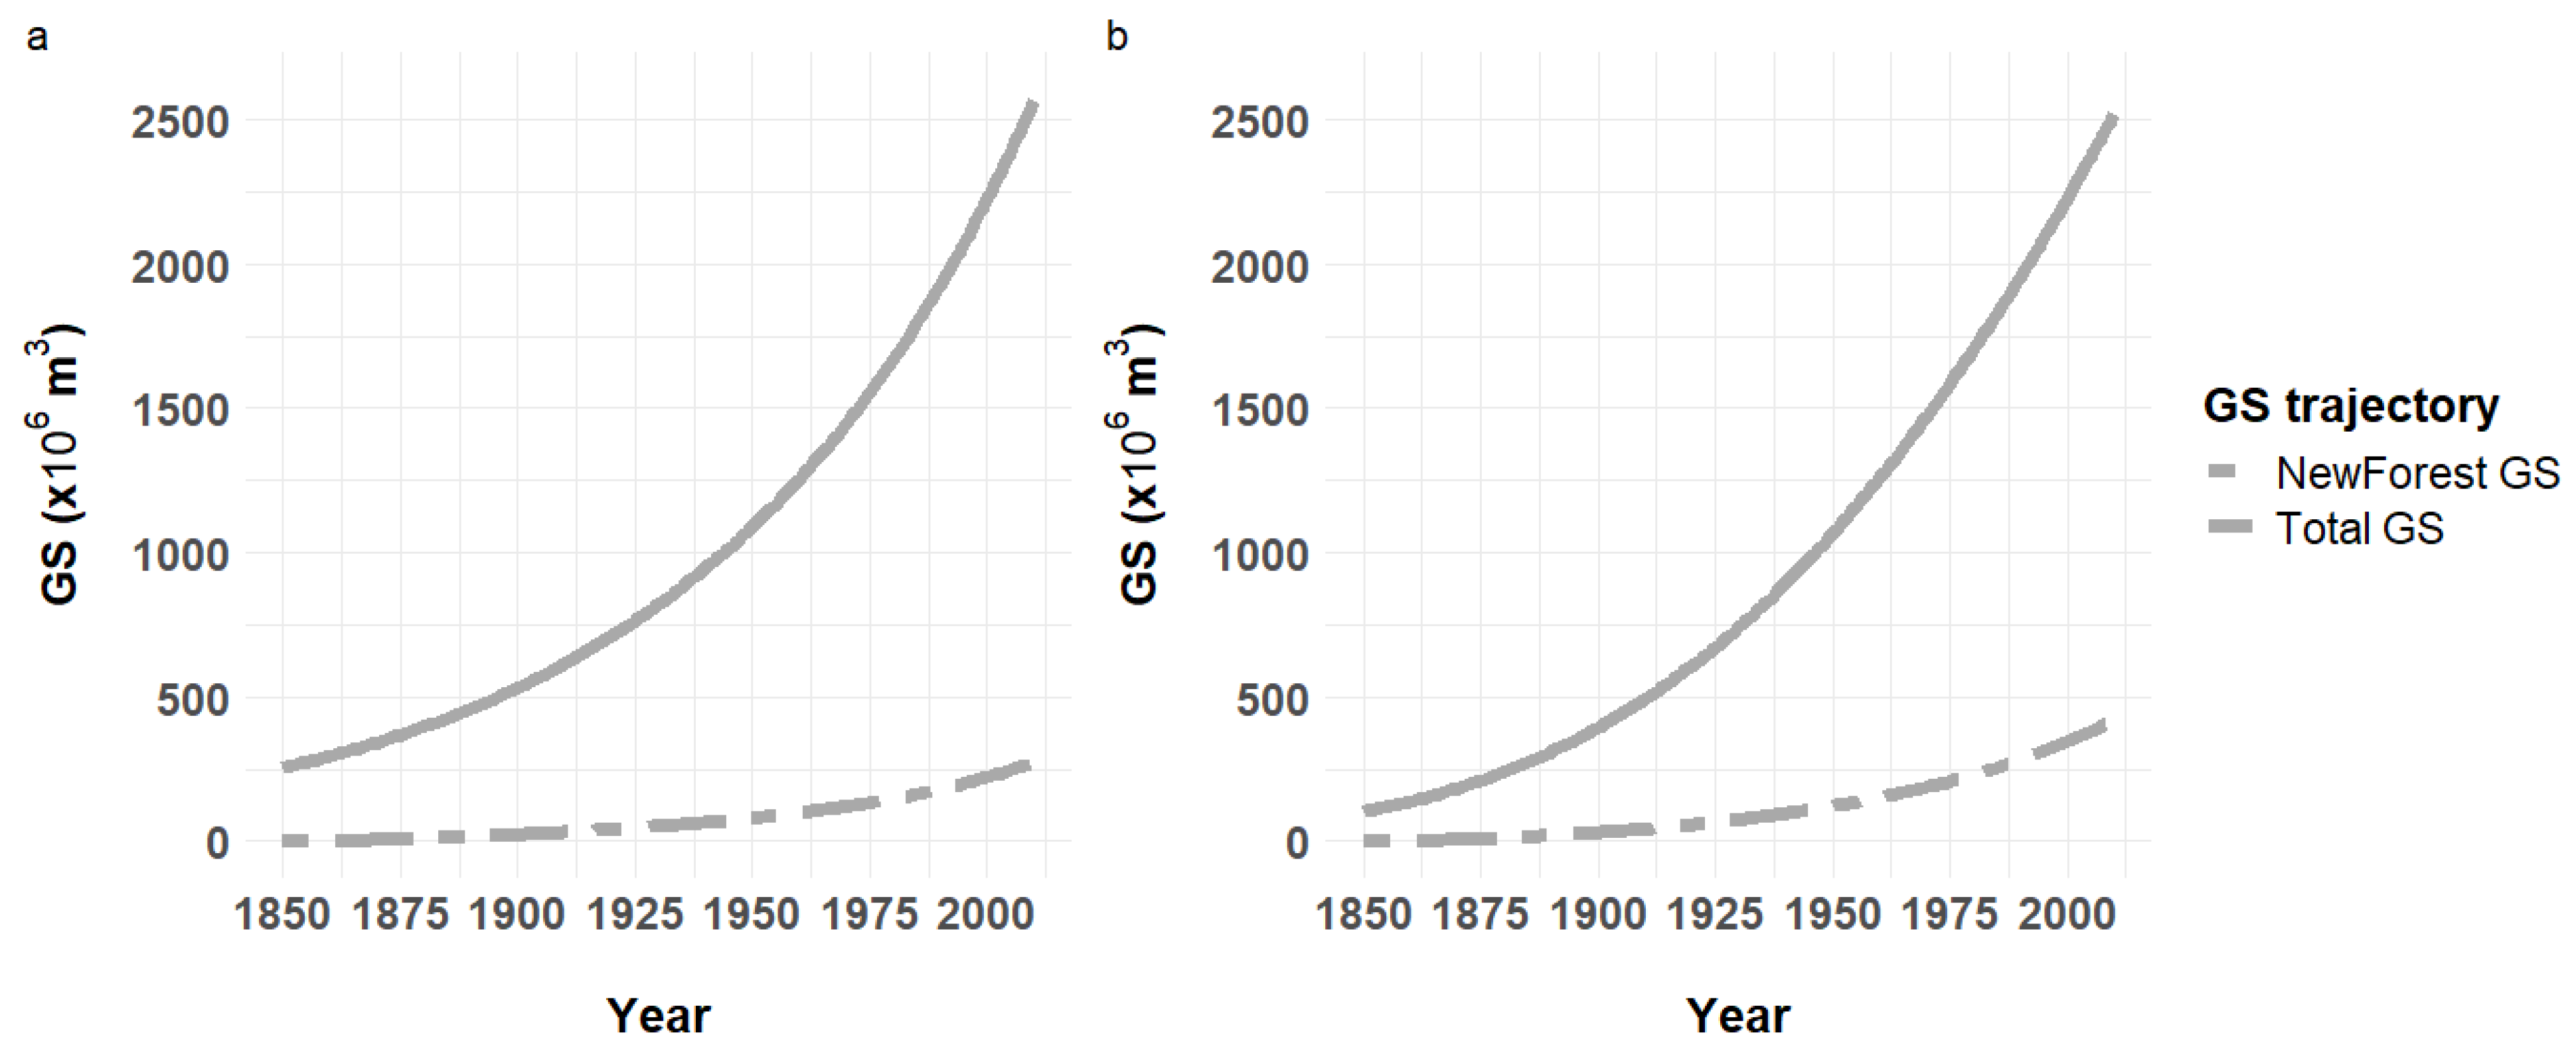

Table 1.
Summary statistics and parameter estimates for the best fits obtained with each forest densification assumption. Best fits provided for two forest area scenarios for models M3 and M4. See SI appendix, sections S1, S2, S3 for details. (Simulation results associated to environmental change scenarios are presented in SI appendix, section S8, Table S3 and Figure S3).
|
Densification assumption |
M1 (asymptotic) |
M2 (linear) |
M3 (exponential) |
M4 (sigmoid) |
||
|---|---|---|---|---|---|---|
|
Uncertainty analysis |
M3-1 |
M3-2 |
M4-1 |
M4-2 |
||
| Forest area (before 1850) | Initial | Initial | Initial | +1000 kha | Initial | +1000 kha |
| GSDini (m3/ha) | 10 | 10 | 20 | 20 | 20 | 20 |
| GSD1850 (m3/ha) Environmental scenario |
10 - |
10 - |
25 - |
25 - |
25 - |
10 - |
|
Parameter estimates | ||||||
| tinf (year) | - | - | - | - | 250 | 150 |
| GSDinf (m3/ha) | - | - | - | - | 480 | 240 |
| agemax (years) | 5000 | 150 | 300 | 300 | - | - |
| GSDmax (m3/ha) | 1400 | 190 | 1440 | 1230 | 1000 | 580 |
|
Summary statistics | ||||||
| RMSEP (hm3) | 125.9 | 117.7 | 52.7 | 42.6 | 23.5 | 18.0 |
| Relative RMSEP (%) | 6.8 | 6.4 | 2.5 | 1.9 | 1.3 | 0.9 |
| Bias (hm3) | –0.3 | –1.5 | –12.2 | –10.0 | 2.0 | –0.7 |
| Relative bias (%) | 1.1 | 0.9 | –0.9 | –0.6 | 0.2 | 0.0 |
| R2 | 0.891 | 0.905 | 0.981 | 0.988 | 0.996 | 0.998 |
Table 2.
Estimations of historical forest GSD and total GS for three historical forest statistics and associated changes in forest GS. GSD quantiles for forest analogues are those best fitting the modelled trajectories under the exponential (M3) and the sigmoid (M4) forest densification models (Table 1, Figure 3) and using a 0.05 quantile resolution for GSD. Magnitudes for centennial GS changes (1908 – 2010) are highlighted in bold black (statistics S2/Daubrée).
| Model | Date | GSD quantile (Forest analogues) |
GSD (m3/ha) |
Total GS (x106 m3) |
GS ratio (2010/year) |
GS rate of change (%/year) |
|---|---|---|---|---|---|---|
| M3 | 1892 | 0.20 – 0.25 | 43.8 – 55.3 | 429 – 541 | 4.60 – 5.80 | 3.9 – 4.9 |
| 1908 | 0.25 | 59.9 | 619 | 4.05 | 4.0 | |
| 1929 | 0.35 | 76.8 | 819 | 3.05 | 3.8 | |
| M4 | 1892 | 0.15 | 31.9 | 313 | 8.00 | 6.8 |
| 1908 | 0.20 | 48.0 | 496 | 5.05 | 4.9 | |
| 1929 | 0.30 | 65.8 | 702 | 3.55 | 4.4 |
Table 3.
Total aerial tree C stock at different dates over 1850-2020 and magnitude of the C sink since 1850 (of total country emissions since 1800). For 1850, the initial condition of M4-2 in Table 1 is used.
Table 3.
Total aerial tree C stock at different dates over 1850-2020 and magnitude of the C sink since 1850 (of total country emissions since 1800). For 1850, the initial condition of M4-2 in Table 1 is used.
| Date | Origin | Total GS (stemwood) (106 m3) |
Total aerial C stock (Pg C) |
Cumulated C sink (1850) (of emissions since 1800, %) |
|---|---|---|---|---|
| 1850 | Initial condition (GSDini) of M4-2 | 102.0 | 0.042 | 0 |
| 1892 | Forest statistics | 312.5 | 0.128 | 11.2 |
| 1900 | Model simulation | 392.5 | 0.160 | 11.7 |
| 1908 | Forest statistics | 496.3 | 0.203 | 12.4 |
| 1929 | Forest statistics | 702.0 | 0.287 | 11.0 |
| 1950 | Model simulation | 1064.1 | 0.435 | 12.1 |
| 2000 | Model simulation | 2226.4 | 0.910 | 10.1 |
| 2020 | Model simulation | 2805.6 | 1.147 | 10.4 |
Table 4.
Estimation of wood felling volumes and felling intensity along the study period as relative to the forest area or GS. a: this volume was documented by two different methods over the period, namely total commercialized volumes, regardless of tree size or compartment (1), and volume extraction in situ as measured by the NFI, that accounts only for the main tree stem with a threshold diameter of 7.5 cm (2). b: in the three ancient statistics, the total area was corrected for areas known as non-productive, recently planted, or planned for afforestation. See SI appendix, section S2 and (28) for additional information, c: from M4-2 of Table 1 (3), and NFI data as of 1990 (4).
| Year | Felling volumea | Source | Areab | GSc | Felling volume rate | |
|---|---|---|---|---|---|---|
| (x1000 m3) | (x1000 ha) | (x106 m3) | (m3/ha/year) | (% GS/year) | ||
| 1892 | 27 5851 | Statistics (S1) | 9 255 | 324.73 | 2.98 | 8.50 |
| 1908 | 23 5041 | Statistics (S2) | 9 887 | 470.23 | 2.37 | 5.00 |
| 1929 | 13 4961 | Statistics (S3) | 9 940 | 725.83 | 1.36 | 1.86 |
| 1962 | 27 1091 | Agricultural statistics | 11 566 | 1297.03 | 2.34 | 2.09 |
| 1990 | 35 3812 | NFI estimate | 14 308 | 1973.14 | 2.57 | 1.79 |
| 2007 | 40 9232 | NFI estimate | 15 208 | 2420.14 | 2.69 | 1.69 |
Disclaimer/Publisher’s Note: The statements, opinions and data contained in all publications are solely those of the individual author(s) and contributor(s) and not of MDPI and/or the editor(s). MDPI and/or the editor(s) disclaim responsibility for any injury to people or property resulting from any ideas, methods, instructions or products referred to in the content. |
© 2025 by the authors. Licensee MDPI, Basel, Switzerland. This article is an open access article distributed under the terms and conditions of the Creative Commons Attribution (CC BY) license (http://creativecommons.org/licenses/by/4.0/).
Copyright: This open access article is published under a Creative Commons CC BY 4.0 license, which permit the free download, distribution, and reuse, provided that the author and preprint are cited in any reuse.


